Embed Size (px)
Citation preview

Business Intelligence at Maine Medical Center J. Peter Chingos & Rocket Wong, Maine Medical Center, Portland, ME
ABSTRACT
Maine Medical Center (MMC) is leveraging the power of SAS' data warehousing capabilities and SAS/ACCESS to integrate data from multiple sources into one location for analysis. This paper reviews the Business Intelligence (BI) infrastructure MMC has created to deliver information throughout the organization. Examples are presented of the SAS Information Delivery Portal; SAS Strategic Performance Management; Automated reporting using SAS Enterprise Guide and SAS Add-in for Microsoft Office.
INTRODUCTION Maine Medical Center (MMC) is using SAS BI to build an infrastructure for information delivery. Our goal is to have the best information delivery system for health care in the United States. This paper will review how MMC integrates data from disparate sources and what SAS tools are used to analyze and report performance measures. Real examples will demonstrate how these tools efficiently deliver feedback to those responsible for performance.
ABOUT MAINE MEDICAL CENTER – THE NEED FOR A BI INFRASTRUCTURE
Maine Medical Center is Maine’s largest tertiary care hospital with 600 beds. The volume of data generated treating patients over the course of a year is staggering. MMC treats 30K inpatients in 152K patient days and has 262K outpatient visits. These patients have 817K ICD9 diagnoses codes and 1.1M ICD9 procedure codes. 3.9M orders are entered into our computerized order entry system by 4,300 providers. 6.2M lab and diagnostic results and 12.6M charges items are generated. Each system in the hospital involved in the pa-tient’s care is a source of data that can be leveraged to monitor performance.
Every level of the organization from the Board of Trustees through senior management, service line and op-erations managers needs feedback on their performance. In addition, external stakeholders are demanding data at an increasing rate. This includes federal and state regulators, insurers, The Joint Commission, The Leapfrog Group and others.
Serving all these stakeholders with all the data that is now generated at MMC is impossible without a BI Plat-form. SAS Business Intelligence allows MMC to access and integrate data sources in one place and offers a variety of tools for analyzing and delivering data efficiently.
1
Applications Big & SmallNESUG 2008

BI INFRASTRUCTURE
MMC’s BI infrastructure is comprised of a metadata warehouse and different information delivery options. Figure 1.0 depicts this infrastructure. The metadata warehouse is built and maintained using SAS Manage-ment Console. Using SAS ACCESS/OLEDB we access data from a variety of databases (mySQL, DB2, CACHE, MS Access/Excel) and data sets. We currently utilize four solutions for information delivery with a fifth, use of information maps and SAS Web Report Studio, under development. Each will be reviewed in de-tail.
Figure. 1.0: BI Infrastructure
mySQL
Microsoft AccessExcel
DB2-AS400
MetadataWarehouse
Monthly Data Publishing
Add in for MS Office
Scheduled Data Sets
Information Delivery Portal:
SPM Scorecards
Scheduled EG Reports Emailed Reports
Ad-Hoc EG
Report Documents
Information Maps
Information Delivery Portal:
Web Report Studio
External Data extracts
Orders, Lab Results, Charting, OR system,
Incidents, Patient Relations, Claims
Demographics, Financial, Utilization
Access to any library
Satisfaction
CORE Measures, Patient Focus Studies CACHE
2
Applications Big & SmallNESUG 2008

DATA INTEGRATION
SAS Management Console creates the connection to our databases. Figure 2.0 shows the libraries we have created. Figure 2.1. shows the properties of the metadata. Figure 2.2 show these how the libraries created in SAS management console are accessible in SAS Enterprise Guide.
Figure 2.0: Listing of data libraries using the SAS Management Console.
Figure 2.1: Example of Metadata within a library
3
Applications Big & SmallNESUG 2008

Figure 2.2: SAS Enterprise Guide listing of data libraries.
INFORMATION DELIVERY
Delivering information to each of our stakeholders has different requirements.
Monthly data publishing:
Reaching all staff at all hours and days of the week with a standard, easy to interpret format is satisfied by publishing monthly “Balanced Scorecard” reports using SAS Strategic Performance Management. SPM is accessible via the intranet and surfaced through the SAS Information Delivery Portal. MMC currently pub-lishes 40 of these scorecards which contain 750 measures and associated graphics and drill down reports. The following screen prints show how these scorecards are accessed and the templates used for displaying information:
- Figure 3.0 shows the “Public Kiosk” which offers access to the scorecards and additional resources.
- Figure 3.1 shows the security required to access the scorecards. A monthly program updates access rights from MMC’s LDAP (Lightweight Directory Access Protocol).
- Figure 3.2 show an example scorecard. Each scorecard displays measures aligned with a strategic focus and objective. Reading left to right by measure: The date of the most recent data is displayed. This is followed by the current months value; a fiscal year-to-date value; a target; an signal light indi-cating whether the fiscal year-to-date value is meeting the target; and, finally, a link to reports.
- Figure 3.3 shows a statistical process control chart.
- Figure 3.4 shows a table of raw data and monthly calculations.
- Figure 3.5 shows an alternative run chart of the fiscal year data.
4
Applications Big & SmallNESUG 2008

- Figure 3.6 shows a table of further drill down information.
- Figure 3.7 shows an externally created report surfaced in the reporting section.
Figure 3.0: “Public Kiosk” (available available on MMC intranet)
Figure 3.1 MMC Login screen to SAS Information Portal (available on the intranet/internet)
5
Applications Big & SmallNESUG 2008

Figure 3.2: Performance Improvement Scorecard (using SAS Information Portal and SAS Strategic Perform-ance Management)
Figure 3.3: Statistical Process Control Charts (created in SAS Enterprise Guide)
6
Applications Big & SmallNESUG 2008

Figure 3.4: Table for measure values by month and fiscal year-to-date (or 12 month).
Figure 3.5: Trend charts for measures with fiscal year-to-date or 12 month cumulative averages.
7
Applications Big & SmallNESUG 2008

Figure 3.6: Drill down results by group
Figure 3.7: Publishing preexisting reports from other sources (pdf, power point)
8
Applications Big & SmallNESUG 2008

Scheduled data sets:
Some users need more concurrent data and want to analyze the data themselves. We have set up a sched-uled stored process that downloads radiology incidents from our incident reporting system daily at 5am. The resulting data is made accessible to radiology via SAS Add-in for Microsoft Office. The following screen prints show how the radiology user accesses and uses the data:
- Figure 4.0 shows Microsoft Excel with SAS Add-in for Microsoft Office in menu bar.
- Figure 4.1 shows the security login screen required to access the data.
- Figure 4.2 shows all the libraries and the error message received if security is not permitted.
- Figure 4.3 shows how the user selects the scheduled data set.
- Figure 4.4 shows the selection, filter and sort window for querying the selected data set.
- Figure 4.5 shows the results in Microsoft Excel.
Figure 4.0: SAS Microsoft Add-in
9
Applications Big & SmallNESUG 2008

Figure 4.1: Login for security
Figure 4.2: Listing of tables within the MMC data library and what happens when you try to access a table without access rights.
10
Applications Big & SmallNESUG 2008

Figure 4.3: User selects table (Pemenic Radiology)
Figure 4.4: Open table. View available fields for report selection (note filter/ sorting).
11
Applications Big & SmallNESUG 2008

Figure 4.5: Output to Microsoft Excel
Scheduled SAS Enterprise Guide (EG) reports:
Some customers need a routine report sent to a small number of recipients. For this we have automated EG reports to run and send emails to specified recipients. The following screen shots review the process:
- Figure 5.0 shows a project designer view of an EG project ending in a email distribution.
- Figure 5.1 shows how to choose a file to send vial email.
- Figure 5.2 shows the three step process for setting the email parameters
- Figure 5.3 shows how to schedule a project
12
Applications Big & SmallNESUG 2008

Figure 5.0 Enterprise Guide project showing data sources, query, output, export and email.
Figure 5.1 Right Click on the file you would like to email and choose Send To. In the sub-menu choose Email Recipient as a Step in Project.
13
Applications Big & SmallNESUG 2008

Figure 5.21: This initiates a three-step process. First, select the file(s) to send.
Figure 5.22: Secondly, tell SAS to whom the report goes, who gets copied, and and you may compose an accompanying message:
14
Applications Big & SmallNESUG 2008

Figure 5.23: Third, review the setup you have just completed. If you click on the “Send Email Immediately” before you click “Finish” then as SAS adds the auto-email step to your Process Flow, it will also immediately send the email. Otherwise, the email is sent the next time that the process node, branch, process flow, or en-tire project is run.
Figure 5.31 Go to the SAS menu and select Tools | Schedule Project.
15
Applications Big & SmallNESUG 2008
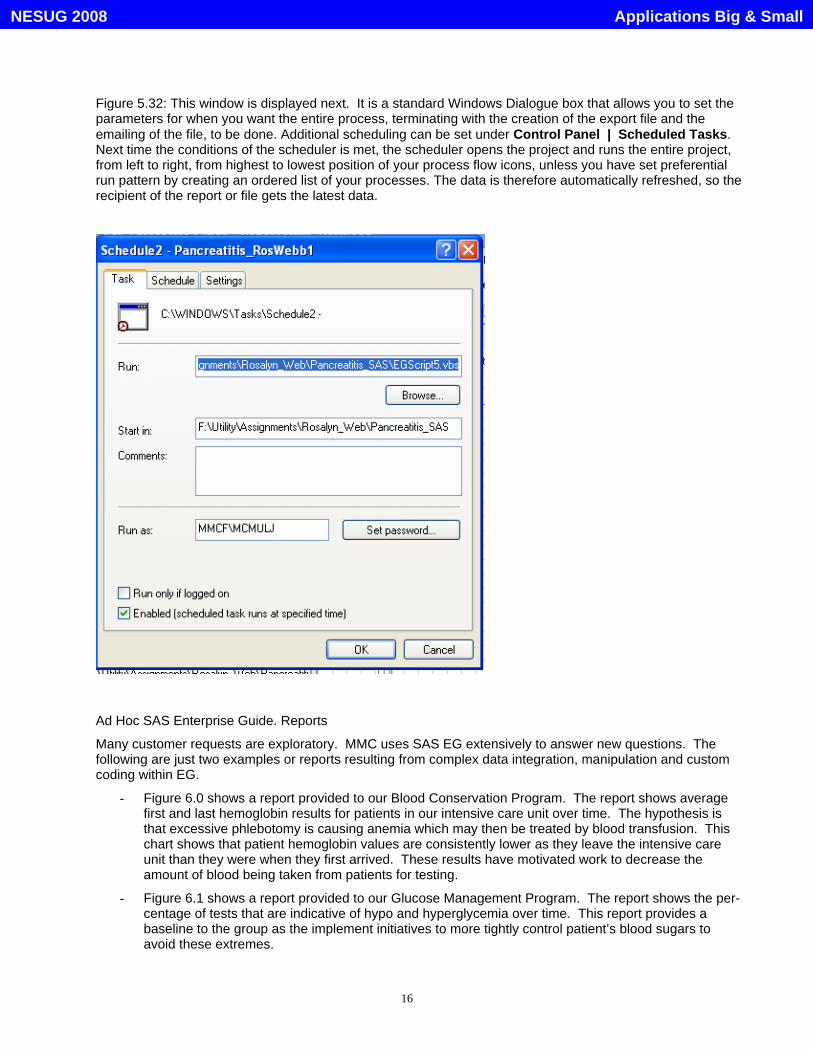
Figure 5.32: This window is displayed next. It is a standard Windows Dialogue box that allows you to set the parameters for when you want the entire process, terminating with the creation of the export file and the emailing of the file, to be done. Additional scheduling can be set under Control Panel | Scheduled Tasks. Next time the conditions of the scheduler is met, the scheduler opens the project and runs the entire project, from left to right, from highest to lowest position of your process flow icons, unless you have set preferential run pattern by creating an ordered list of your processes. The data is therefore automatically refreshed, so the recipient of the report or file gets the latest data.
Ad Hoc SAS Enterprise Guide. Reports
Many customer requests are exploratory. MMC uses SAS EG extensively to answer new questions. The following are just two examples or reports resulting from complex data integration, manipulation and custom coding within EG.
- Figure 6.0 shows a report provided to our Blood Conservation Program. The report shows average first and last hemoglobin results for patients in our intensive care unit over time. The hypothesis is that excessive phlebotomy is causing anemia which may then be treated by blood transfusion. This chart shows that patient hemoglobin values are consistently lower as they leave the intensive care unit than they were when they first arrived. These results have motivated work to decrease the amount of blood being taken from patients for testing.
- Figure 6.1 shows a report provided to our Glucose Management Program. The report shows the per-centage of tests that are indicative of hypo and hyperglycemia over time. This report provides a baseline to the group as the implement initiatives to more tightly control patient’s blood sugars to avoid these extremes.
16
Applications Big & SmallNESUG 2008

Figure 6.0
17
Applications Big & SmallNESUG 2008

Figure 6.1
CONCLUSIONS
The proliferation of data generating processes in healthcare and the growing necessity for measuring per-formance at all levels of the organization and externally require a BI infrastructure. SAS Business Intelligence allows MMC to access and integrate data sources in one place and offers a variety of tools for analyzing and delivering data efficiently. Instead of drowning in data, MMC is able to leverage the efficiency and analytics of SAS tools to use the data to improve performance.
18
Applications Big & SmallNESUG 2008

19
ACKNOWLEDGMENTS
SAS is a Registered Trademark of the SAS Institute, Inc. of Cary, North Carolina.
“Balanced Scorecard” Kaplan, R.S., Norton, D.P.
MMC’s Center for Performance Improvement Team:
Top left to right: Charlotte Bailey-McPherson, Mark Chasse, Rocket Wong, Joyce Mendoza, Eileen Dockendorf, Valerie Jackson, Sue Curtis, Jeff Gregory. Bottom left to right: Joel McMullin, Chuck Frolio, Julia Hanrahan, Jim Lyden. Not shown: Andrea Andrus, Nicole Boutet, Joanne Cederna, J. Peter Chingos,
CONTACT INFORMATION Your comments and questions are valued and encouraged. Contact the authors at:
J. Peter Chingos Maine Medical Center 131 Chadwick St. Portland Maine 04102-3175 Work Phone: 207-662-4212 Fax: 207-662-1481 Email: [email protected] Web: www.mmc.org
Rocket Wong Maine Medical Center 131 Chadwick St. Portland Maine 04102-3175 Work Phone: 207-662-6288 Fax: 207-662-1481 Email: [email protected] Web: www.mmc.org
* * * * * * * * * * * * * * * * * * * * * * * * * * * * * * * * * * * * * * * * * * * * * * * *
Applications Big & SmallNESUG 2008