Embed Size (px)
Citation preview
Business intelligence
and analytics
fundamentals
Helena Schwenk
www.ovum.com

Ovum provides clients with independent and objective analysis that enables them to
make better business and technology decisions.
Our value to our clients
With access to Ovum’s research and support from best-in-class analyst and consulting
teams, companies can turn analysis and insight into action. Our aim is to make our clients’
planning more effective, and to help them identify and assess relevant business
opportunities. We don’t just advise our clients: we collaborate with them to help them
exploit these opportunities and to turn them into business results. At the heart of our
approach is our mission to help, to be approachable, responsive and focused on your
business issues and to provide pragmatic and actionable advice and recommendations.
Why you can rely on and trust Ovum
Ovum research is based on independently audited methodologies that ensure that our clients
can base decisions on rigorous and fact-based research, rather than on unqualified and
unjustified opinions. The research draws upon over 400,000 interviews a year with business
and technology, telecoms and sourcing decision-makers, giving Ovum and our clients
unparalleled insight not only into business requirements but also the technology that
organisations must support.
Business intelligence and
analytics fundamentals SUMMARY Impact Business intelligence (BI) and analytic technologies are seeing rapid growth in today’s tight economy, driven by fierce competitive pressures. Also fueling growth is the technologies’ ability to improve decision-making, identify new business opportunities, maximize cost savings, and detect inefficient business processes.
Ovum view In order to survive and thrive in this competitive situation, organizations increasingly need to shift the basis of differentiation to focus on the smarter and more efficient use of information, thereby improving decision-making and creating sustainable competitive advantage. Hence, the
ability to extract, integrate, analyze, and interpret business information in a timely, proactive way makes BI an increasingly important, influencing factor for organizations. We believe defining a BI strategy will help shape and govern the success of a BI project by bringing greater business and IT alignment and allow organizations to specify how timely, accurate, and relevant information can support and drive core business initiatives. At the same time a BI strategy may also prompt adoption of new BI suite technologies, lead to
new styles of deployment, and even create a process change that allows an organization to become more flexible and agile and increase business performance at both strategic and organizational levels. In short, a BI suite can increase the impact of employees in an organization and the industries and sectors they represent.
Key messages
• BI is much more than a set of software tools. It describes a set of processes and technologies for
simplifying and enhancing the use of information within an organization. In particular, BI provides a data foundation together with an associated analytic environment that can support, underpin, and improve decision-making capabilities in organizations. For example, it allows organizations to improve customer interactions, retain the best customers, maximize customer satisfaction, improve customer profitability, provide business insights for strategic and
operational decision-making, negotiate more skillfully with suppliers, support greater transparency into compliance efforts, and pinpoint operational inefficiencies crying out for cost cutting. Hence, the ability to extract, integrate, analyze, and interpret business information in a timely and proactive way makes BI more of an imperative than a luxury for organizations in today’s tight markets and economy.
• Technology efforts must be underpinned by a BI strategy. A BI initiative provides little strategic
use unless it is driven by the objectives of the organization. Before embarking on any type of BI initiative, organizations must invest in defining a BI strategy that outlines how BI will help the
organization meet its strategic and operational business goals. In particular, a BI strategy needs to provide a framework for the organization that enables it to obtain buy-in from key stakeholders, offers an enterprise-wide perspective, outlines the expected benefits, establishes governance and oversight, and defines a roadmap for how the BI and analytic technology components of the BI program fit together to meet the needs of the business. However, defining a BI strategy should not be a one-off exercise; rather, it should be a constantly evolving
strategy and a vision that seeks to align an organization’s operations and direction with its strategic business goals.

• A multitude of factors influence the BI suite selection process. As part of the selection process,
organizations need to acknowledge that tools and organizational needs are typically diverse. Therefore, the chosen architecture and components of a BI suite will depend on an array of factors that influence its choice, such as scale of the business, types of users, volume of data,
levels of IT maturity, interoperability with existing tools and infrastructure, and commitment to a BI strategy. One consequence of this diversity is that several tools will be required to meet the full spectrum of back-end data integration and front-end analysis requirements. Moreover, the BI suite must be adaptable to the changing needs of users so it can cope with changes to new data sources and business requirements.
• A BI suite comprises tools and infrastructure designed to bring actionable information to a broad
range of users. A BI suite consists of four key layers: a data management layer for sourcing,
integrating, and cleansing data; an analysis layer for deriving insight from that data; an
application layer for applying domain expertise and business logic to a particular business problem; and a presentation layer for delivering actionable information and insight to users regardless of context or location. To be effective, a BI suite needs to leverage components across all layers and provide a flexible architecture that allows each component to be integrated with the existing IT infrastructure to take advantage of existing investments and facilitate faster deployment.
• Implementation best practice will impact the success of a BI initiative.
Although the concept of BI is well understood, its apparent simplicity belies the complexity of successfully implementing it. We believe organizations can significantly improve the chances of
success by taking into account a best practice approach to BI implementation. In summary, this involves making a business case for BI, securing executive sponsorship, ensuring closer alignment of IT and business, delivering quickly on projects that always contribute to the strategic aims of the organization, ensuring a sound data foundation, and considering a business intelligence competency center to help lower total cost of ownership.
• Newer software deployment models are gaining traction. We are seeing significant changes in the
way BI and data warehousing systems are built and deployed. Most notable is the emergence of alternative BI deployment options such as SaaS, purpose-built appliances, cloud computing, pre-built analytic applications, and open source, which are starting to disrupt the traditionally
lengthy, expensive way data warehousing and BI systems were deployed in the past. Organizations that want to increase speed to value and lower the cost of building and maintaining their IT infrastructure should consider these alternative deployment modes. However, they should be aware that these are still in the early stages of development and implementation best practices have yet to mature.
Definition BI and analytics are terms that refer to a variety of tools and technologies used to gather, store, and analyze detailed transactional business data to support and aid organizational decision-
making. To understand the full scope and remit of BI, we believe its definition needs to cover both processes and technology. In particular, BI includes:
• technology-related processes, such as leveraging or extracting data from a company’s
operational systems and databases, and cleansing and/or integrating that data into a format that makes it suitable for analysis • business-related processes, such as determining the appropriate forms of analysis required to
support decision-making, interpreting the results of analysis, and determining how best to embed or feed back the results into an organization’s operations to enable fact-based decision-making. BI may also be referred to as “business analytics,” a newer moniker that aims to emphasize the
proactive, forward-looking, and optimization elements of decision making.

We believe this new naming trend reflects the ongoing consolidation in the market where the
larger players have acquired or developed both BI and analytics technologies. We believe the
there are five key business trends driving the adoption and uptake of BIgrowth in the use and adoption of analytic elements such as predictive modeling and data mining will help propel the next phase of growth in the BI and analytics market as organizations attempt to model their organizational data in a much deeper and more predictive sense.
BUSINESS IMPACT Overview The demands of business, competitive, and regulatory pressure in today’s economically challenging environment are forcing organizations to become smarter and more efficient about
the use of their information. In particular, we believe technologies and solutions.
Rationalizing and reducing operational costs BI query, reporting, analysis, and dashboards provide a set of foundational technologies to help organizations identify important areas of the business – finance, sales, customer management, procurement, supply chain – that are running inefficiently. This is so the organizations can analyze the root causes of those inefficiencies and communicate appropriate actions to key stakeholders. Additionally, the use of more advanced analytically focused performance management
applications such as budgeting, planning, and forecasting, as well as predictive and data mining tools, can take a more proactive, forward-looking approach to planning and implementing cost-cutting strategies in the future.
Improving the customer management process BI tools and analytic applications are key to improving an enterprise’s internal- and external-facing customer management process. For example, analytic tools such as data mining can be used to create customer profiles and segmentations based on a customer’s purchasing patterns,
past activity, and profitability to the organization. This can help drive decisions about which areas they want to target and determine how many resources to invest in each segment. Meanwhile, customer intelligence solutions that package up predefined analytic data models, metrics, reports, and processes gleaned from industry-proven practices can be used to support key customer management processes such as campaign management, customer service tracking, and customer loyalty measurement. Organizations can
also use past BI results and data mining and predictive projections to analyze behavioral factors associated with customer churn and retention – such as dissatisfaction with service or support, billing disputes, or a disagreement over customer service. They can use the results of these analyses to assess their propensity of risk to churn and create effective customer retention marketing programs.
Maximizing operational agility In order to respond to constantly shifting market conditions, organizations need to be agile, forward-looking, and capable of making faster decisions – which, in certain circumstances,
means realtime. By embedding BI into the operational layer, organizations can understand and optimize operational decisions at the point of impact, an approach that involves applying BI and analytics at a granular level, where events happen one at a time. For example, credit card companies can use predictive modeling and realtime analysis to intelligently decline credit applications and purchases at the point of transaction. The promise of BI analysis at realtime speeds is being made possible through several sophisticated and advanced technologies such as in-memory BI for on-the-fly analysis, columnar databases for boosting response times, and
event stream processing for continuous analysis of realtime data streams.

Enhancing business performance alignment across the enterprise Organizations are now looking to push BI systems that have traditionally been implemented in a tactical, piecemeal fashion across various departments in the enterprise into a more strategic context by integrating them with enterprise performance management (EPM) frameworks. The goal is to ensure that the company is aligned to operate towards meeting its stated performance objectives. That means continuously monitoring and measuring strategic goals (or plans) formulated in the boardroom against their execution at the operational level. Key performance indicators (KPIs)
distilled into BI-driven metrics and monitored within scorecards or dashboards, or both, are the technological key.
Avoiding unnecessary risk exposure and ensuring adherence to regulatory compliance Today organizations are faced with a complex and growing array of both internal and external risk factors; one of the most widespread is the risk of non-compliance to industry regulation. All risk and compliance efforts can benefit from BI as it provides capabilities to identify and manage risks, track compliance, enhance the quality of decision-making, and improve the quality of internal and external reporting.
SELECTION CRITERIA BI strategy comes before technology selection Selecting the right BI software tool or analytic application requires planning and careful consideration. However, before any detailed planning or IT conversation gets under way,
organizations need to devise and agree on a BI strategy that outlines a vision for how BI will meet the needs and objectives of the organization. They also need to define a roadmap for how the BI technology components of the BI program will fit together to meet these needs. However, more often than not, organizations overlook this point and put the data and IT architecture, rather than the needs of the business, at the top of the BI agenda.
We believe the best BI solutions are those that are closely aligned to the specific and unique needs of the organization and use a BI strategy to meet this aim. Primarily, a BI initiative needs to be a business-led engagement that is inclusive and encourages broad participation from across the organization. Only when an organization has a clear
agreement of the business requirements can it start to plan and select its architecture and BI suite components. Technology should be seen as an enabler of the overall business objectives by providing relevant, accurate, and timely analysis of information that can help drive decisions.
A range of factors impact the BI suite selection decision The choice of BI suite needs to take into account a range of factors, such as number and analysis needs of users, volume of data, levels of IT maturity, and desired interoperability with
existing tools and infrastructure. In addition, factors such as openness to information sharing and organizational structure (such as whether a company is top-down or decentralized) will impact the success, design, and architecture of a BI suite and, ultimately, its cost. However, organizations should remember that building a profile of BI requirements is neither simple nor a one-off exercise, and requirements change often. The BI suite needs to be flexible enough to accommodate these changes. Choosing a BI suite is a multifaceted decision and needs to take into account the diverse needs
of the organization or groups of potential users, or both. One consequence of this diversity is that you may require several BI tools to meet the decision support requirements of the organization; likewise, an organization may also require several tools if they adopt a best-of-breed approach to creating a BI system. As a starting point, there are five key questions, outlined in Figure 1, that need to be addressed when establishing the BI suite requirements of

the organization. This is not an exhaustive list, but provides examples of key
make before shortlisting or selecting a BI suit
What type of analysis is required?The BI suite must address a variety of analysis needs according to the complexityrequirements and the level of insight needed.
business questions that can be satisfied by each type of
as reporting and OLAP require a user tocars did we sell in France in the last four quarters compared to plan?” Such questions alldecision-makers to verify their hypotheses and identify factors affecting performance. Advanced and predictive analytics enable a higher plane of analysis, which gives users the abilityexplore and find patterns. It also gives them a more unstructureto probe deeper into the “why” and “what
more forward-looking.
organization. This is not an exhaustive list, but provides examples of key considerations to
make before shortlisting or selecting a BI suite.
What type of analysis is required? The BI suite must address a variety of analysis needs according to the complexity requirements and the level of insight needed. Table 1 provides an overview of the different
be satisfied by each type of analysis tool. Foundational BI tools such
as reporting and OLAP require a user to formulate a specific question – for example, “how many in the last four quarters compared to plan?” Such questions all
to verify their hypotheses and identify factors affecting performance. Advanced predictive analytics enable a higher plane of analysis, which gives users the ability
explore and find patterns. It also gives them a more unstructured hypothesis, which allows them to probe deeper into the “why” and “what-if” considerations about performance and become
considerations to
o f business overview of the different
analysis tool. Foundational BI tools such
for example, “how many in the last four quarters compared to plan?” Such questions allow
to verify their hypotheses and identify factors affecting performance. Advanced predictive analytics enable a higher plane of analysis, which gives users the ability to
which allows them about performance and become
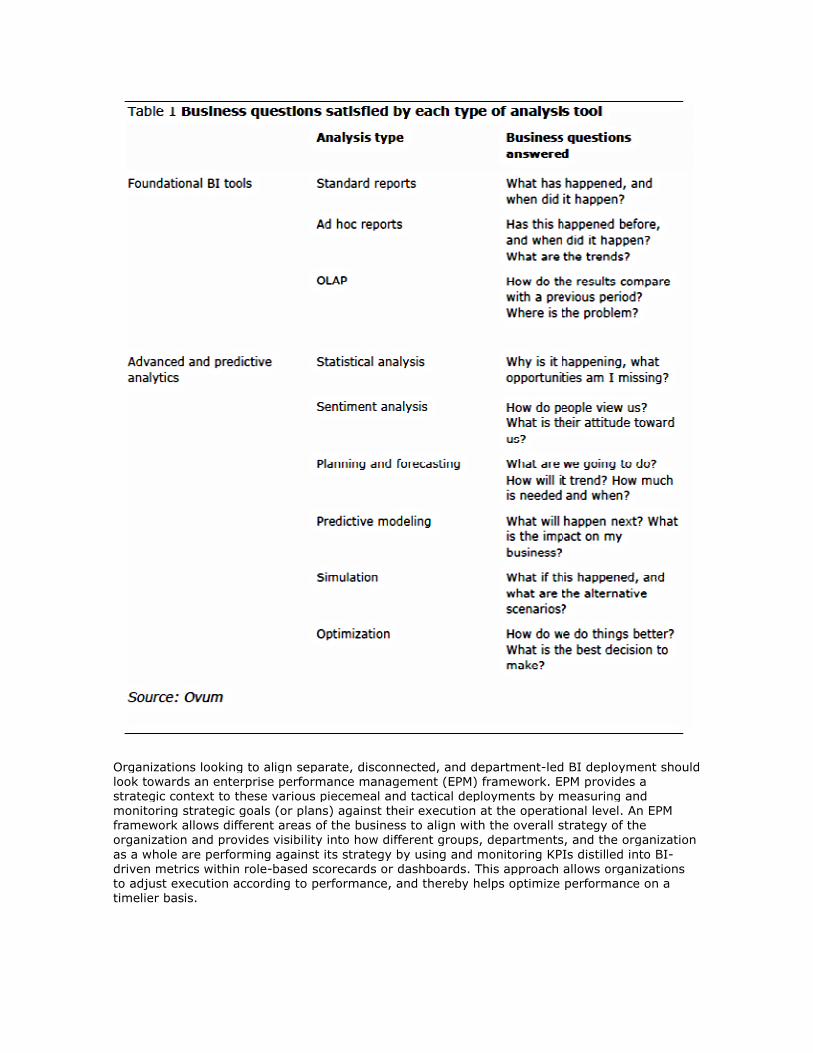
Organizations looking to align separate, disconnected, and departmentlook towards an enterprise performance management (EPM)strategic context to these various piecemeal andmonitoring strategic goals (or plans)framework allows different areas of the business to align with the overall strategy of the organization and provides visibility into how different groups, departments, and the organization
as a whole are performing against its strategy by using and monitoring KPIdriven metrics within role-based scorecards or dashboards. This approachto adjust execution according to performance, and therebytimelier basis.
Organizations looking to align separate, disconnected, and department-led BI deployment should enterprise performance management (EPM) framework. EPM provides a
strategic context to these various piecemeal and tactical deployments by measuring and monitoring strategic goals (or plans) against their execution at the operational level. An EPM
areas of the business to align with the overall strategy of the provides visibility into how different groups, departments, and the organization
a whole are performing against its strategy by using and monitoring KPIs distilledbased scorecards or dashboards. This approach allows organizations
to adjust execution according to performance, and thereby helps optimize performance on a
deployment should framework. EPM provides a
tactical deployments by measuring and against their execution at the operational level. An EPM
areas of the business to align with the overall strategy of the provides visibility into how different groups, departments, and the organization
s distilled into BI-allows organizations
helps optimize performance on a

What number and type of users needBI is increasingly being deployed to a broader range of information consumers at
organization. To meet the needs of any number of users, a BI suitereliable, responsive, and scalable. In other words, performance while delivering highnumber of users and workloads. This is particularly important as BI applications grow in scope and sophistication and demand for them grows across an organization. In cases ofdeployments will need to scale to thousands and tens of thousandsgeographies, and the architecture must be able to
of these users. When assessing the suitability of BI components, an organization also needs tointended users of the BI system and their roles. A BI suite needs toof types and roles of users – the key ones are d
However, there is another (complementary) way of categorizing BI end users for strategic purposes versus those who use it at an operational
characterized by historical analysis desilooking at trends and patterns in thethe location or cause of a major problem. Operational BI is designed to support daybusiness decisions where BI is embedded in operational systems and processes. It works atmore granular level by taking triggers from key business events and serving upinformation in role-based dashboards or interfaces. A moreaspects of operational and strategic use is
concentrated on strategic application, the rapid pace of business means organizations increasingly need to provide support for decision
What number and type of users need supporting? BI is increasingly being deployed to a broader range of information consumers at all levels of the
organization. To meet the needs of any number of users, a BI suite and architecture must be reliable, responsive, and scalable. In other words, the architecture must ensure high levels of performance while delivering high availability with minimal downtime, and support a growing
workloads. This is particularly important as BI applications grow in scope mand for them grows across an organization. In cases of
deployments will need to scale to thousands and tens of thousands of users across a range of geographies, and the architecture must be able to withstand the volume, location, and worklo
When assessing the suitability of BI components, an organization also needs to consider the intended users of the BI system and their roles. A BI suite needs to provide support for a range
the key ones are detailed in Table 2.
However, there is another (complementary) way of categorizing BI end users – those who use BI for strategic purposes versus those who use it at an operational level. Strategic BI is typically
characterized by historical analysis designed to support long-term organizational goals by looking at trends and patterns in the data and/or using multidimensional analysis to determine
major problem. Operational BI is designed to support dayhere BI is embedded in operational systems and processes. It works at
more granular level by taking triggers from key business events and serving up contextbased dashboards or interfaces. A more detailed breakdown of the dif
aspects of operational and strategic use is shown in Table 3. Although BI usage thus far has
application, the rapid pace of business means organizations provide support for decision-making within daily operations. An important
all levels of the
and architecture must be architecture must ensure high levels of
availability with minimal downtime, and support a growing workloads. This is particularly important as BI applications grow in scope
mand for them grows across an organization. In cases of enterprise BI, of users across a range of
withstand the volume, location, and workload
consider the provide support for a range
those who use BI
level. Strategic BI is typically
term organizational goals by data and/or using multidimensional analysis to determine
major problem. Operational BI is designed to support day-to-day here BI is embedded in operational systems and processes. It works at a
context-relevant detailed breakdown of the different . Although BI usage thus far has
application, the rapid pace of business means organizations operations. An important

consideration should be whether a BI suite supports all types of users and usage.
How should BI be deployed?One of the key considerations facing organizationsdeployed. The lower cost and risk and faster implementationhardware/software data warehousing appliances,solutions continue to appeal to a
computing BI solutions can offer opportunities to push down infrastructure capex costs by passing the burden on to hosted providers. The cloud also offers a riskand engage in analytical data warehousing and datamarts without having to investinfrastructure. Appliances, on the other hand, can take away the pain and expenseassembling and configuring the component pieces of a BI solution.With a continued drive to lower the price point of implementing BI, we believe a BIoffer a range of options that allow organizations to mix and match
to need and budget. A BI suite should provide the organization with a choice between building andmade” analytic application. Analytic appre-built data integration jobs, standardized reports,improve the development and implementation speed for IT and timeTheir benefit comes from being able to “speak the language” of the business and understand
users’ specific domain and role, and the analytic insights they require. Examples are those that address specific horizontal business functions or processes such asanalysis, and customer segmentation, or supportanalysis for financial services or
consideration should be whether a BI suite supports all types of users and usage.
How should BI be deployed? One of the key considerations facing organizations is how a BI suite should be implemented and
and risk and faster implementation times afforded by preconfigured hardware/software data warehousing appliances, software-as-a-service (SaaS), and cloud BI solutions continue to appeal to a number of organizations. In particular, SaaS and cloud
offer opportunities to push down infrastructure capex costs by on to hosted providers. The cloud also offers a risk-free way to prototype
engage in analytical data warehousing and datamarts without having to investinfrastructure. Appliances, on the other hand, can take away the pain and expenseassembling and configuring the component pieces of a BI solution. With a continued drive to lower the price point of implementing BI, we believe a BIoffer a range of options that allow organizations to mix and match deployment models according
A BI suite should provide the organization with a choice between building and buying a “readymade” analytic application. Analytic applications package relevant, best-practice data models,
built data integration jobs, standardized reports, and high-end predictive analytics that can implementation speed for IT and time-to-value for the business.
comes from being able to “speak the language” of the business and understand
users’ specific domain and role, and the analytic insights they require. Examples are those that address specific horizontal business functions or processes such as financial consolidation, sales analysis, and customer segmentation, or support vertical industry sectors such as risk and fraud analysis for financial services or customer churn analysis for telecoms.
implemented and times afforded by preconfigured
service (SaaS), and cloud BI number of organizations. In particular, SaaS and cloud
offer opportunities to push down infrastructure capex costs by free way to prototype
engage in analytical data warehousing and datamarts without having to invest in IT infrastructure. Appliances, on the other hand, can take away the pain and expense of separately
With a continued drive to lower the price point of implementing BI, we believe a BI suite must deployment models according
buying a “ready-practice data models,
end predictive analytics that can value for the business.
comes from being able to “speak the language” of the business and understand
users’ specific domain and role, and the analytic insights they require. Examples are those that consolidation, sales
vertical industry sectors such as risk and fraud

What data storage, integration, and latency requirements are needed? Understanding the volume, latency, context of use, and quality of data to be analyzed within a
BI suite has a fundamental influence on the chosen BI architecture and suite. The BI suite must be able to provide access to a commonly agreed, timely, and trustworthy view of an organization’s critical data that meets and addresses the business requirements of users. This, in turn, may entail storage requirements of multiple terabytes or of data that can impact the design and architecture of the BI system. However, this view of an organization’s data must take into account the quality of the data to ensure that it is fit for purpose. To be usable, the data consumed within the BI system must be timely, clean, consistent,
accurate, and relevant. The four pillars of data competency that a BI organization should look to acquire are ETL, data quality, master data management (MDM), and metadata management. However, these technologies should be wrapped up as part of a formalized data governance process framework for controlling how data is moved, integrated, accessed, and used. Furthermore, the data architecture must be adaptable to the changing needs of users so it can cope with changes to new data sources and business requirements.
One of the important aids to ensuring ease of adaptability as requirements change is comprehensive and well-managed metadata – that is, information about data. Ideally, the BI suite should contain rich contextual metadata available within a controlled repository so access and visibility can be managed from within the BI suite.
What level of integration with existing IT infrastructure is needed? A modern BI architecture needs to integrate with the existing IT infrastructure to take advantage of existing investments and facilitate faster deployment. There are a number of levels on which this integration is required. In the first instance a BI suite should support industry standards for
openness – such as such as web services, XML, SOAP, and WSDL – to provide a flexible BI architecture that allows an organization to introduce and easily adapt to new elements in the IT infrastructure. The modularity, agility, flexibility, and reuse of an SOA framework naturally lends itself this integration and standardization – something that is needed in a time of broad, loosely coupled, integrated BI suites. Similarly, BI suites should be able to integrate as part of a best-of-breed offering that mixes and matches tools and products from competing vendors. Hence, organizations should be able to
decide on the most appropriate product and deployment options for their requirements. Likewise, a BI suite should make its services available and consumable to other technologies so BI data can be embedded in external applications and technologies. Examples of this include placing a dashboard tab on a corporate portal, embedding reports within a business application, or using a BI service to deliver context-sensitive information within a business processes. Above all, a BI suite should have a modular nature that allows organizations to start small and add functionality as users become more proficient.
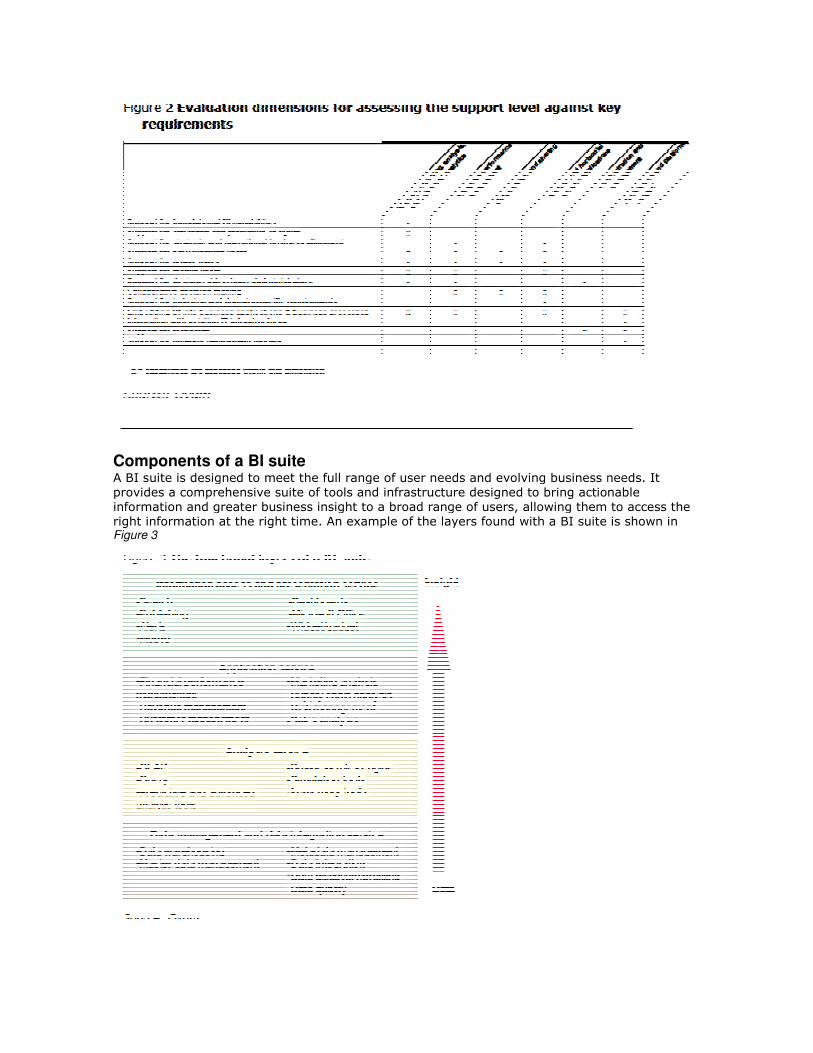
Ovum’s BI suite evaluation framework We have devised an evaluation model framework to provide a comprehensive means of understanding and describing different BI components. The framework covers the full range of functionality to expect from a BI suite in particular. We describe the components of the suite, the features and functions supported, and the intended use of each component. The six evaluation dimensions we use are: • query, reporting, analysis, and advanced analytics • enterprise performance management
• collaboration and sharing
• vertical and horizontal analytic applications
• administration and management
• architecture and platform support.
Figure 2 shows which evaluation dimensions to use when assessing the level of support provided
against an organization’s key requirements.
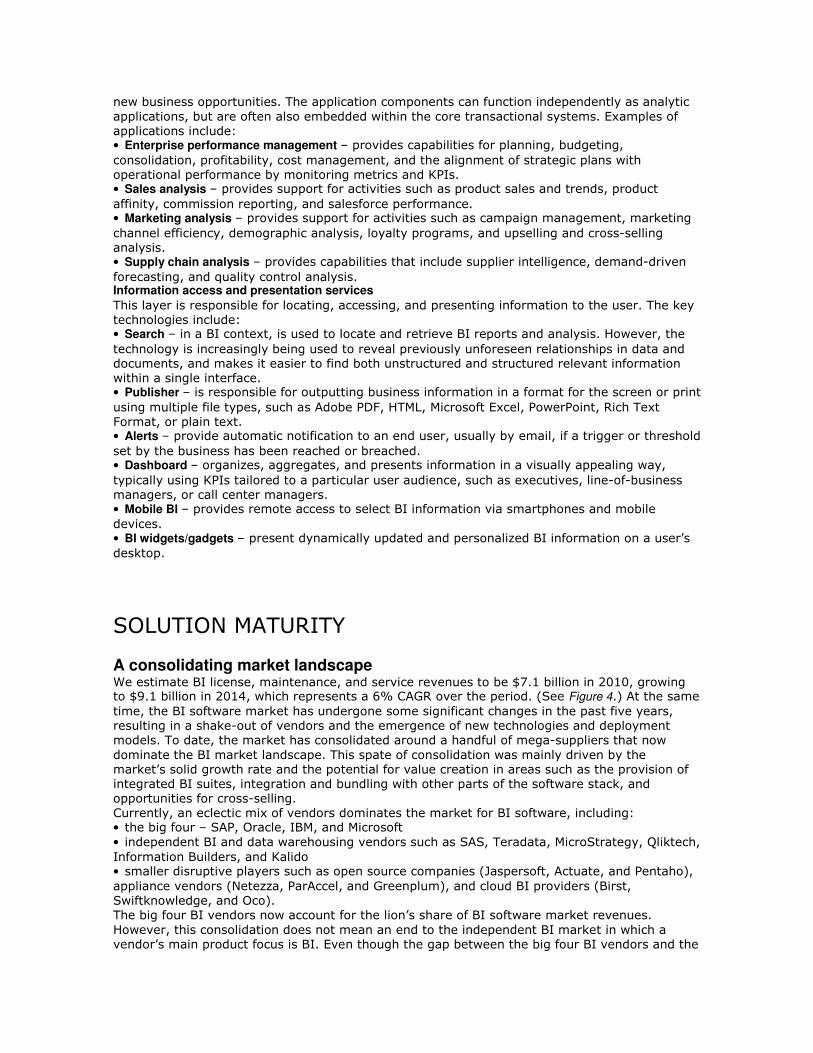
Components of a BI suiteA BI suite is designed to meet the full range of user needs and evolving businessprovides a comprehensive suite of tools and infrastructure designed toinformation and greater business insight to a broad range ofright information at the right time. An exampleFigure 3
Components of a BI suite A BI suite is designed to meet the full range of user needs and evolving business needs. It
a comprehensive suite of tools and infrastructure designed to bring actionable information and greater business insight to a broad range of users, allowing them to access the right information at the right time. An example of the layers found with a BI suite is shown in
needs. It bring actionable
users, allowing them to access the te is shown in

Data management and data integration service
The data management layer is responsible for structuring and integrating the datain a format that is accessible for analysis. The layer has two main functions. Firstly, it handles the management and storage of data, metadata, and master data to ensure
that it is in a form that is optimized for information retrieval and analysis. In a BI suite, this is often a data warehouse, although it can be a data store located closer to the operational data sources (called an operational data store). Secondly, the data integration platform provides a set of tools and services for profiling, accessing, transforming, cleansing, and bringing together data, regardless of format, structure, latency, or location. The following tools are used as part of the data management and data integration
service layer:
• Data warehousing is a repository for storing relevant, consolidated, and cleansed data and
metadata that is optimized for the analysis and reporting needs of an organization or group of
users. • Master data management (MDM) is responsible for ensuring the consistency, accuracy, control,
and synchronization of master data between operational and analytic systems. • Metadata management provides a repository and associated tools for storing, integrating, and
analyzing metadata for the purposes of data governance, impact analysis, and data lineage. • Data integration is responsible for the lifecycle and integration of data, whether it is integrated
by physically being moved from a source to a target data warehouse system, or whether it is consolidated virtually within a federated single view. • Data discovery/profiling is a process for discovering and examining the data available in a data
source and collecting statistics and information about that data to understand the location, content, quality, and structure of source data. • Data quality is used to standardize, validate, match, and cleanse data so it is fit for business
purposes. Analysis service
This layer provides the analytical environment and exposes a range of services for processing and analyzing information according to analysis needs and level of sophistication. The tools provide both foundational BI capabilities, coupled with the deeper business analytics to help organizations understand what is happening, why things are happening, and what needs to
happen in order to meet the needs of the business. • Online analytic processing (OLAP) is a tool for analyzing key metrics interactively along multiple
dimensions for comparative reporting and analysis. • Query tools extract and analyze business information for ad hoc reporting purposes.
• Predictive and advanced analytic tools use sophisticated data mining
algorithms, statistical models, and combinations of mathematical calculations to analyze current and historical facts and make predictions about future events. • Rule engines can be used to decide how data is processed and whether data is within an
acceptable range or has exceeded a threshold. • In-memory BI tools enable faster processing and analysis of data sets by loading data into
memory rather than processing on disk. In some cases they eliminate the need to resort to summarized data, pre-built OLAP cubes, or IT intensive database tuning. • Simulation tools provide an environment for modeling and testing new ideas or for modeling
uncertainty. The tool supports a framework for comparing possible outcomes and helps clarify the potential risks and rewards of pursuing actions. Application service
This layer leverages the previous two layers to source and process the data, but also combines its domain expertise, business logic, and predefined content (such as models, templates, and reports) to address a particular business pain point, streamline a business process, or look for
new business opportunities. The application components can function independently as analytic
applications, but are often also embedded within the core transactional systems. Examples of applications include: • Enterprise performance management – provides capabilities for planning, budgeting,
consolidation, profitability, cost management, and the alignment of strategic plans with operational performance by monitoring metrics and KPIs. • Sales analysis – provides support for activities such as product sales and trends, product
affinity, commission reporting, and salesforce performance. • Marketing analysis – provides support for activities such as campaign management, marketing
channel efficiency, demographic analysis, loyalty programs, and upselling and cross-selling analysis. • Supply chain analysis – provides capabilities that include supplier intelligence, demand-driven
forecasting, and quality control analysis. Information access and presentation services
This layer is responsible for locating, accessing, and presenting information to the user. The key technologies include: • Search – in a BI context, is used to locate and retrieve BI reports and analysis. However, the
technology is increasingly being used to reveal previously unforeseen relationships in data and documents, and makes it easier to find both unstructured and structured relevant information within a single interface. • Publisher – is responsible for outputting business information in a format for the screen or print
using multiple file types, such as Adobe PDF, HTML, Microsoft Excel, PowerPoint, Rich Text Format, or plain text. • Alerts – provide automatic notification to an end user, usually by email, if a trigger or threshold
set by the business has been reached or breached. • Dashboard – organizes, aggregates, and presents information in a visually appealing way,
typically using KPIs tailored to a particular user audience, such as executives, line-of-business managers, or call center managers. • Mobile BI – provides remote access to select BI information via smartphones and mobile
devices. • BI widgets/gadgets – present dynamically updated and personalized BI information on a user’s
desktop.
SOLUTION MATURITY A consolidating market landscape We estimate BI license, maintenance, and service revenues to be $7.1 billion in 2010, growing to $9.1 billion in 2014, which represents a 6% CAGR over the period. (See Figure 4.) At the same
time, the BI software market has undergone some significant changes in the past five years, resulting in a shake-out of vendors and the emergence of new technologies and deployment models. To date, the market has consolidated around a handful of mega-suppliers that now
dominate the BI market landscape. This spate of consolidation was mainly driven by the market’s solid growth rate and the potential for value creation in areas such as the provision of integrated BI suites, integration and bundling with other parts of the software stack, and opportunities for cross-selling. Currently, an eclectic mix of vendors dominates the market for BI software, including: • the big four – SAP, Oracle, IBM, and Microsoft
• independent BI and data warehousing vendors such as SAS, Teradata, MicroStrategy, Qliktech,
Information Builders, and Kalido • smaller disruptive players such as open source companies (Jaspersoft, Actuate, and Pentaho),
appliance vendors (Netezza, ParAccel, and Greenplum), and cloud BI providers (Birst, Swiftknowledge, and Oco). The big four BI vendors now account for the lion’s share of BI software market revenues.
However, this consolidation does not mean an end to the independent BI market in which a vendor’s main product focus is BI. Even though the gap between the big four BI vendors and the

other providers is widening, opportunities remain
focusing on specialist and vertical niches.For example, SAS, Teradata, and MicroStrategy have built up vertical expertiseof sectors, such as retail, telecommunications, and manufacturingpartnering with one another – to offer tincreasing consolidation within the BI marketprovided opportunities for smallerand appliance vendors.
Open source BI is seeing real tractionIn the last 12–18 months, the open source BI (OSBI) software market has seen a
healthy rate of adoption across large enterprises and small and(SMEs). There are signs that the market is catching upJasperSoft, Actuate BIRT, Pentaho, and Talendplayers – continue to add regularfunctionality offered. All these players report increased interest, acceptance, and uptake in OSBItools. While cost has been a big determining factor driving uptake, it is not the only
OSBI’s success. Openness, flexibility, and ease of integration have aorganizations the ability to pull together a BI application
The SaaS BI market is small but growingSoftware-as-a-service (SaaS) BI is a small, nascent market in which most earlybeen among cost-conscious SMEs or departments of largeprofile vendors’ failures in the SaaS BI marketproposition holds true. This is especiallyexamine the business value aspects of BI at relatively low risk or kick
without the pain and infrastructure cost of conventional BI deployment approaches.However, despite its obvious potential the market remains relatiwith other areas of the SaaS market and security, issues over data quality, and
other providers is widening, opportunities remain for the latter to shine and differentiate by
cialist and vertical niches. For example, SAS, Teradata, and MicroStrategy have built up vertical expertise across a number of sectors, such as retail, telecommunications, and manufacturing – which sometimes entails
to offer tailored and industry-specific BI suites. Similarly, increasing consolidation within the BI market and hardware and software commodization have provided opportunities for smaller niche and specialist BI providers, such as open source, cloud,
Open source BI is seeing real traction 18 months, the open source BI (OSBI) software market has seen a
healthy rate of adoption across large enterprises and small and medium-sized enterprises t the market is catching up with its proprietary counterparts;
JasperSoft, Actuate BIRT, Pentaho, and Talend (data integration) – all major open source continue to add regular enhancements to their platforms that broaden and deepen the
offered. All these players report increased interest, acceptance, and uptake in OSBItools. While cost has been a big determining factor driving uptake, it is not the only
OSBI’s success. Openness, flexibility, and ease of integration have all played a part, offering organizations the ability to pull together a BI application quickly and relatively inexpensively.
The SaaS BI market is small but growing service (SaaS) BI is a small, nascent market in which most early adoption ha
conscious SMEs or departments of large organizations. Despite some highprofile vendors’ failures in the SaaS BI market (such as Lucidera), we believe its value proposition holds true. This is especially true for organizations that want to evaluate and
aspects of BI at relatively low risk or kick-start a BI deployment
and infrastructure cost of conventional BI deployment approaches.However, despite its obvious potential the market remains relatively small, especially compared with other areas of the SaaS market – specifically CRM. A general hesitancy over data sensitivity and security, issues over data quality, and data integration with on-premise applications and
for the latter to shine and differentiate by
across a number which sometimes entails
specific BI suites. Similarly, and hardware and software commodization have
niche and specialist BI providers, such as open source, cloud,
steady and
sized enterprises with its proprietary counterparts;
all major open source enhancements to their platforms that broaden and deepen the
offered. All these players report increased interest, acceptance, and uptake in OSBI tools. While cost has been a big determining factor driving uptake, it is not the only reason for
played a part, offering quickly and relatively inexpensively.
adoption has organizations. Despite some high-
(such as Lucidera), we believe its value o evaluate and
start a BI deployment
and infrastructure cost of conventional BI deployment approaches. especially compared
general hesitancy over data sensitivity premise applications and

systems are some of the reasons cited for this lag and slower adoption. We believe the need for
SaaS BI will become clearer as deployments of SaaS enterprise applications mature. By then database, data-integration, and data quality technologies for the cloud will also be better established. Other factors, such as economic pressures on budgets and the budding demand from the mid-market, will also contribute to SaaS BI uptake. To date, the SaaS BI market landscape is somewhat polarized, comprising a few large on-premise vendors that are moving into SaaS. Examples of these include SAP BusinessObjects, SAS, and a raft of smaller start-up vendors such as Birst, Oco, Adaptive Planning, and Host
Analytics, which focus on specific niches and SaaS analytic applications.
Appliance form factor momentum continues The appliance form factor – which gives companies the operational ability to plug and play BI technology without wasting time and money on assembling the hardware and software infrastructure – has seen steady adoption in the last two years. Appliances promise shorter implementation times and require less tuning and configuration than traditional approaches. Pairing massive parallel processing databases (sometimes with inbuilt analytics) with commodity hardware allows SMEs and departmental users to engage in larger-scale and high-end BI at a
fraction of the cost and time of traditional enterprise data warehousing. High-end enterprise data warehousing has typically been the sweet spot of larger conventional data warehousing vendors such as Teradata, Oracle, and IBM. However, the combination of technological enhancements around parallel processing architectures, in-memory processing, and columnar databases with cheaper commodity hardware means appliance vendors are now giving the larger vendors a run for their money,
especially at the low end of the enterprise data warehousing market.
Consultants and systems integrators have an important role to play In situations in which resources and skills are scarce, system integrators (SI), business consultancy firms, and specialized IT providers can play a significant role in helping organizations realize the benefits from their BI solutions. Due to their implementation experience and global and regional presence, they bring skills in areas such as business process expertise, best practices, vertical domain knowledge, end-to-end integration, bespoke application development, and customization. Similarly, as the breadth and sophistication of the BI suite
continues to evolve, SIs can offer a range of skills in adjacent or emerging technology areas such as process management, web services, SOA, Web 2.0 skills, mobile platforms, and supplying outsourcing consulting expertise. All of these can contribute to the successful development and deployment of BI solutions. The role of service providers in the development and deployment of BI has been underlined by some recent market developments. Firstly, IBM set up its Business Analytics and Optimization (BAO) service division in April 2009 – this aims to deliver solutions dedicated to advanced
analytics and optimization. It is primarily a consulting initiative backed by 5,000 consultants who work with IBM’s software group and research labs to deliver industry-specific solutions. Secondly, early in 2010 SAS and Accenture announced a joint $30–$50 million investment to build, market, sell, and manage predictive analytics software solutions in six industries and offer three cross-industry solutions. Both announcements demonstrate that SIs (and global IT consultancies) are increasingly looking
at opportunities to cash in on the lack of expertise and skills in predictive modeling within organizations and tool vendors. The main issues they face are low availability of costly skills in predictive modeling and being able to build and maintain the models quickly enough to keep up with business change.
DEPLOYMENT AND MANAGEMENT CONSIDERATIONS BI projects can be high risk, but also high reward BI projects can deliver significant benefits to an organization. Industry research indicates that
the return on investment on successful BI and data warehouse projects can exceed four times the initial investment. However, it is also believed that BI projects have a failure rate of anything from 50–75%. These statistics highlight the fact that BI is a high-risk but high-return undertaking. Several key considerations will help organizations reduce the risk and increase the reward of a BI project. Considerations such as the level of business involvement, business and IT alignment, total cost of ownership, getting the data foundation right, and requirements for realtime BI all stand to impact how BI is deployed and managed.
Common barriers and pitfalls Although the concept of BI is well understood, its apparent simplicity belies the complexity of successful implementation. Some of the most common pitfalls to successful BI projects include the following: • Data quality remains a costly problem. Data quality is a common, costly, but often overlooked
problem for many organizations embarking on a BI project. However, ignoring or underestimating the cost, impact, and extent of any data quality problem can seriously affect the success of any BI initiative. Successful BI implementation depends on an organization’s ability to identify which data is
important, determine how clean it is, and establish a datacleansing initiative (preferably in conjunction with a data governance program) to avoid or resolve data quality issues on a one-off or continuous basis. • Usability issues remain. Another potential pitfall is BI tools themselves.
Though the tools are more scalable and user-friendly than they used to be, they have still failed to penetrate the mainstream user base – many of whom still find it hard to use and navigate them and to find the information they need. Many organizations centralize their BI efforts around core reporting capabilities instead of focusing on optimizing or improving business processes, although that is slowly beginning to change under the guise of operational BI.
The addition of Web 2.0 technologies such as Ajax, blogs, wikis, and social networking and the ability to leverage the search paradigm within a BI interface opens up many opportunities. With these, vendors can provide modern, interactive interfaces and greater user reach, and support information sharing and collaboration within community-driven networks. • Business process domain knowledge is a key stumbling block. Another barrier to using BI to
transform business processes is that most organizations do not understand their business processes well enough to determine how to improve them. Understanding which processes take priority and need improving is essential to a BI effort. For example, if the process does not have
a direct impact on revenues or the business is not behind standardizing the process across the company, the entire BI effort could fail. Organizations need to understand the constituent parts of a particular business process, how information and data flow across various processes, and how data is passed between business users. This level of understanding is key to recognizing how BI can help improve the running of a company. • KPI over- or underkill. One of the most common mistakes made by organizations when
implementing BI is to create too many KPIs, limit the range of KPIs, or even monitor the wrong type of KPI. In the case of the first, organizations make the mistake of cluttering a performance dashboard with KPIs. Not only is this distracting for the users as it impacts the visual
effectiveness of the dashboard, but it also dilutes the focus of a particular user, as many KPIs are not directly relevant to the outcomes being monitored. In other scenarios, organizations struggle with measuring performance across the business as they often have little knowledge of their performance indicators beyond finance or sales. This over-reliance on certain KPIs can lead to short-termism and mask important business trends.
Running a BI initiative – best practice A number of key factors play an important part in running a successful BI project. These factors must be addressed as part of a best-practice approach towards BI that encourages broad participation from IT and business stakeholders in the pursuit of a common goal.
Building a business case
The development of a business case for BI upfront can help the organization with defining requirements and setting out the objectives and the expected benefits. A clearly articulated set of objectives can be referenced throughout the deployment period to ensure that the program remains on track. However, it should not straightjacket the company and stop it from addressing
new and evolving requirements. Securing executive sponsorship
Clarity and alignment of aims and objectives at the start of a BI initiative is vital. A strategic approach driven by senior management can help bring together the different parts of the organization to work towards a common goal. It can also help ensure continued investment,
foster the right information-led culture, and help identify key stakeholders in the business and IT. Ensuring closer alignment of IT and business
BI has traditionally been an IT discipline run by IT project managers with little or minimal
business knowledge. It is therefore not surprising that many of these projects fail to deliver expected business benefits. For successful BI, it is vital that business and technical representatives work in unison to establish business drivers and user requirements and ensure that the BI system delivers on its promised goal and objectives. Deliver quickly, but keep the big picture in mind
BI projects are rarely finished. Instead, they are part of a rolling set of requirements that evolve as the business evolves. It is therefore important that organizations do not try to deliver the perfect BI system at once. Instead, they should aim to deliver quickly on projects that provide the most business value and build other parts of the BI system as they go along. However, it is important that each project maintains an understanding and contributes to the overall strategic aims and objectives of the organization to avoid building separate, siloed or overlapping
developments. EPM is one of the most common methods of achieving this aim. Train users effectively
User resistance is one the biggest barriers to BI success. BI will not yield a successful return if users feel threatened by or are skeptical of the technology. Continual training and education needs to remain a critical part of the user engagement process.
RECOMMENDATIONS Recommendations for enterprises In addition to best practice, enterprises are encouraged to take into account the following technology considerations. Look towards EPM for greater organizational alignment
Enterprise performance management (EPM) supports greater alignment of the business by
providing an environment in which the most important metrics can be devised, discussed, communicated, and understood throughout the organization. The goal is to ensure that the entire company is aligned to operate towards meeting its stated performance objectives. That means measuring and continuously monitoring strategic goals (or plans) against their execution at the operational level, via KPIs and BI-driven metrics monitored within scorecards and/or dashboards.
However, organizations should take care to select and monitor the right type and number of KPIs to ensure that they get a balanced and full picture of performance. In other words, KPIs should be simple to understand, measure, and monitor. Analytics brings a higher yield of analysis
Companies should look to data mining, predictive analytics, and text analytics tools to provide
higher value and smarter insights from their data. Analytics differs from conventional BI analysis methods such as reporting and OLAP because it is oriented towards knowledge discovery in which the relationships and patterns between different data points are unknown or not understood and the focus is on producing a solution that can generate useful insights or predictions that were not previously known. Analytics provides great potential for organizations looking for deeper insights that can direct or inform decision-making. However, companies should be aware that these technologies are often complex and require a
significant investment in skills resource and knowledge transfer. Before embarking on this route, companies should look to grow their analytic expertise in-house. This can be done by training and grooming BI experts and power users on staff, hiring consultants, or employing pre-built analytic models, applications, and infrastructure that can easily be understood and managed by IT staff. Consider the implications of moving to operational BI
Operational BI often requires moving BI from a batch mode of operation to one in which BI insights and information are delivered in realtime. In many cases, this will involve a different architectural approach by moving BI closer to the point of interaction and decision-making. To benefit from realtime operational BI, organizations should consider technologies such as specialist columnar databases, in-memory-based analytic engines, and event stream processing
technologies to increase the speed to insight. However, be aware that these technologies are complex, hard to implement and maintain, and require companies to upgrade to higher-performance hardware. Organizations are advised to look to vendors, consultants, and SIs to fill the “knowledge gaps” and provide guidance over best practice and technological standards. Get the data foundation right
One of the keys to accurate insights from BI systems is complete, consistent, and trustworthy data. Data is the most fundamental component of any BI endeavor. It provides the building blocks and foundation for analysis and actionable insight. Organizations have to get their data in good working order before they can begin extracting and acting on insights. The old adage of “garbage in, garbage out” still holds true. A data governance program provides a framework by which organizations can address issues around data wnership,
data quality, and data definitions. A business intelligence competency center can lower TCO
A business intelligence competency center (BICC) is designed to consolidate expert decision-making and BI resources in an effort to better manage and support implementations across
divisions, regional offices, and functional groups. A BICC can also help organizations develop skills in-house to capture knowledge and reuse it in response to increasing requirements. The provision of centralized best-practice functions and services can help to lower total cost of ownership and reduce implementation risk. Consider alternative deployment models
Investigate alternative BI deployment models – SaaS, BI appliances, cloud computing, and open source – each of which offer a way for companies to lower software license, maintenance, and service costs. However, while the lure of faster implementation times and lower total cost of ownership may provide instant appeal, organizations should be aware that these modes of deployment are still at a relatively early stage. They should be expected to replace more conventional implementation models any time soon.
Recommendations for suppliers Increase user interface usability efforts
BI tool adoption and usage is increasing. Consequently, this means a change to BI’s traditional focus on power users as it becomes more relevant and critical to a broader mass of operational BI users. BI vendors therefore need to pay more attention to non-expert business users, focus

on improving the usability and interactivity of the user interface, and increase the self-
serviceability of the tool. Continue on the path of integration and interoperability
BI vendors need to focus on providing tight integration and interoperability between the various components of their BI suites, which have now broadened to include data warehousing, EPM,
and data integration tools and applications. Suite integration, rather than functionality, will be the primary decision focus for many enterprises. Verticalize BI product offerings
As an increasing number of BI customers expect their BI systems to be more aligned to their
specific business needs and environment, vendors should target business and industry issues with line-of-business and vertically aligned solutions and services. Consider alternative pricing and licensing models
Vendors should be prepared to bend to price pressures as a result of aggressive customer
bargaining and offer attractive and flexible licensing and pricing options (including those for on-premise, on-demand, and mobile) to make their software affordable in today’s soft economy.
APPENDIX Glossary • Analytics. Often used interchangeably with BI, analytics refers to a higher plane of analysis,
typically forward-looking, driven by statistical trending/forecasting, predictive analysis, and data-mining techniques. • Analytic application. A software application designed to facilitate faster deployment by providing
prebuilt content such as extraction routines, models, templates, and reports to address a particular business pain point, streamline a business process, or look for new business opportunities. • Appliance. An integrated, preconfigured set of servers, storage, operating system, database
system, and application software that is purpose built for a specific function – such as BI
analysis or data warehousing. • Business intelligence (BI). Includes a set of tools, processes, and applications that gather,
integrate, query, analyze, and report on information to help organizations make better business decisions. • Cloud computing. A computing model for delivering commercial IT hardware or software
services to companies over the Internet. • Data warehousing. A centrally held and integrated repository of standardized, clean, consistent
information sourced from various operational systems, which is structured in a way to make it readily amenable to BI query, analysis, and reporting. • Event stream processing (ESP). Uses techniques such as complex pattern detection, event
correlation, abstraction, and hierarchies to identifying meaningful events within multiple streams of event data. ESP enables applications such as algorithmic trading, fraud detection and location based services. • Enterprise performance management (EPM). Consists of a set of processes and applications to
help organizations optimize their performance by linking business strategy to operational execution using a methodology and framework for linking and analyzing key performance
indicators against business processes. • Latency. A time delay, such as between recording an event or transaction and acting upon it.
• Master data management (MDM). A combination of tools, processes, and people to establish an
ongoing competency in delivering a single source of truth for key data used within an organization. • Metadata. Information that describes or defines another piece of data. An XML schema is an
example of metadata, as it describes the structure of an XML document.

• Open source. An approach to the design, development, and distribution of software that offers
developers access to the software’s source code. • Online analytical processing (OLAP). Provides multidimensional views of segments of enterprise
data and supports drill-down from summary level to detail. • Software-as-a-service (SaaS). A model of software deployment whereby a provider licenses an
application to customers for use as service on demand over the Internet. SaaS software
providers either host the application on their own web servers or download the application to a consumer device. • Web services. An architecture in which software is delivered as a set of webbased services,
which can be called from any application, without regard to the underlying platform or operating system.