Embed Size (px)
Citation preview
Business Forecasting
• Used to try to predict the future• Uses two main methods:• Qualitative – seeking opinions on which
to base decision making– Consumer panels, focus groups, etc
• Quantitative – using statistical data to help inform decision making– Identifying trends– Moving averages – seasonal, cyclical, random– Extrapolation - simple
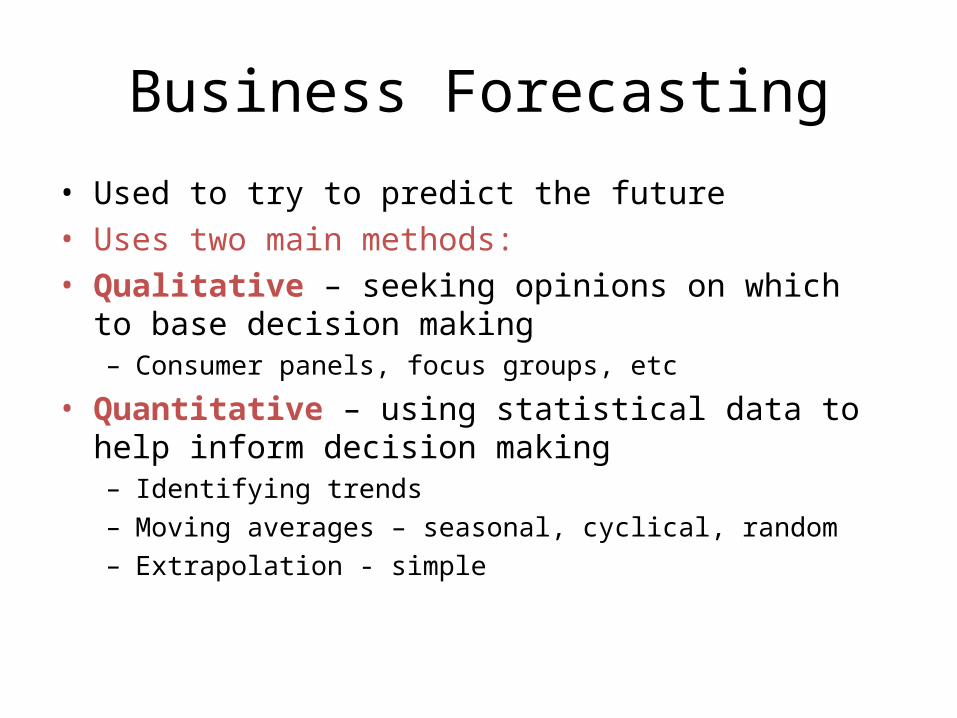
Types of Forecasts
• Qualitative (Judgmental)
• Quantitative– Time Series Analysis– Causal Relationships– Simulation
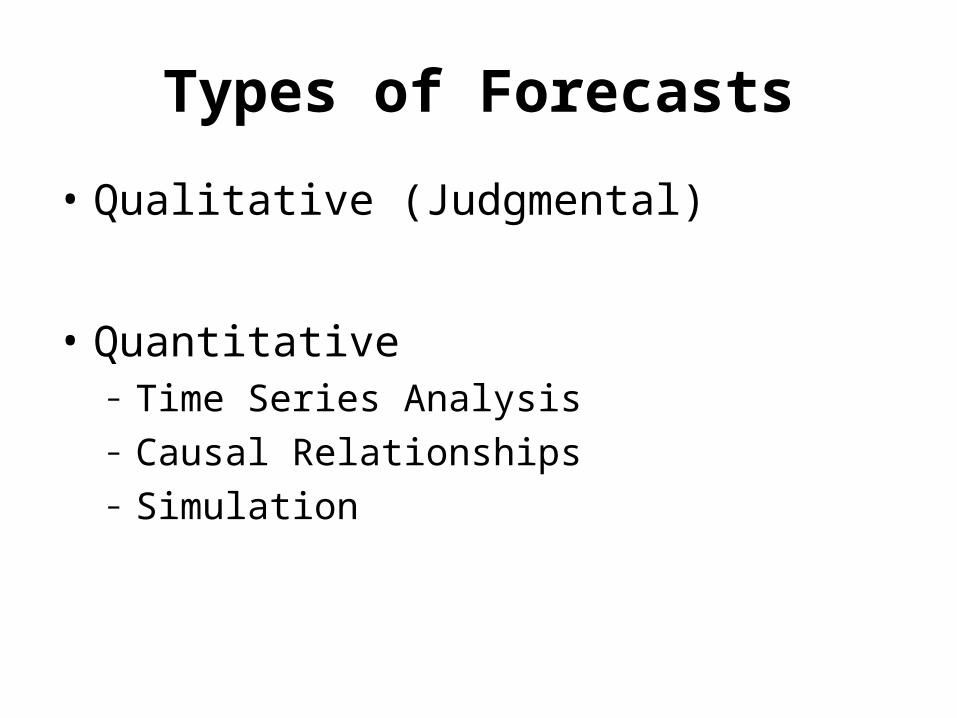
Forecasting HorizonsLong Term
5+ years into the futureR&D, plant location, product planningPrincipally judgement-based
Medium Term1 season to 2 yearsAggregate planning, capacity planning, sales forecastsMixture of quantitative methods and judgement
Short Term1 day to 1 year, less than 1 seasonDemand forecasting, staffing levels, purchasing, inventory
levelsQuantitative methods
Types of Forecasting Models
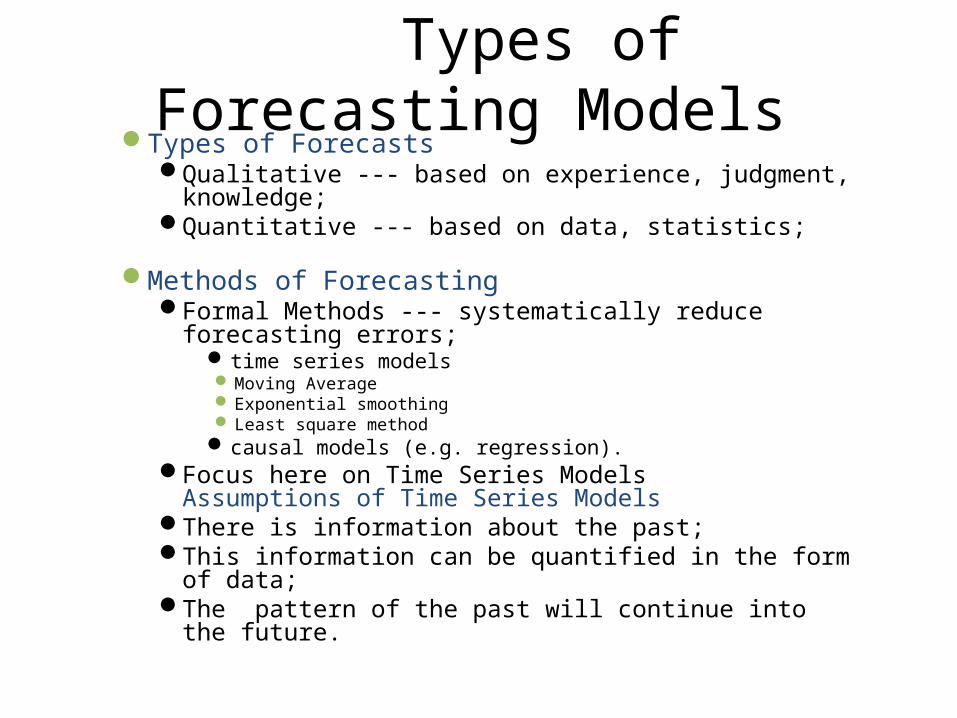
Types of ForecastsQualitative --- based on experience, judgment, knowledge;Quantitative --- based on data, statistics;
Methods of ForecastingFormal Methods --- systematically reduce forecasting errors;
time series models Moving Average Exponential smoothing Least square method
causal models (e.g. regression).Focus here on Time Series Models
Assumptions of Time Series ModelsThere is information about the past;This information can be quantified in the form of data;The pattern of the past will continue into the future.
Forecasting Examples
Examples from student projects: Demand for tellers in a bank;Traffic on major communication switch;Demand for liquor in bar;Demand for frozen foods in local grocery
warehouse.Example from Industry:
ProductionSalesProfitLoss
Analysis of time series
• Time Series Data: Data collected on the same element for the same variable at different points in time or for different periods of time are called time-series data. E.g. daily stock price
• A data arranged in chronological order is called a time series.
• A set of observation of a variable collected at regular interval of time is called Time series.
Time series
• Time Series: A time series process is an ordered sequence of values of a variable at equally spaced time intervals, and usually represented by { } e.g. daily, weekly, monthly, or annually) and can take the form of, say, Gross Domestic Product each quarter; monthly profits;annual rainfall; or daily Stock Market Index.
Objective of time series
• Analyze the past & present behaviour of the series and predict for future.
• i.e Identify the pattern and isolate the influencing factors for prediction purposes as well as for future planning and control.
• Evaluation of progress made on the basis of a are done on the basis of time series data.Ex-The progress of our five year plans is judged
by the annual growth rate.
Goal of Time series• 1. Describe the data using summary statistics
or graph methods. A time series plot is particularly valuable.
• 2. Modeling to find a suitable statistical model to describe the data.
• 3. Forecasting that is to predict the future values of the time series variable.
• 4. Control that is to control a given process. Note good forecast enable the analyst to take action.
Specification of a Forecasting Model
• The process of specifying a forecasting model involves;• 1. selecting the variable to be included,• 2. selecting the form of the equation of
relationship, • 3. estimating the values of the parameters in that
equation,• 4. verifying its performance characteristics by
comparison of its• forecast with historical data.•
The Need to Forecast
• When the result of an action is of consequences but cannot be known in advance with precision, forecasting may reduce decision risk by supplying additional information about the possible outcome. The potential benefits of forecasting lies in the realm of decision making to exert control over someprocess.
Applications of Time Series Analysis
• Economic forecasting• Sales forecasting• Budgetary analysis• Stock market analysis• Census analysis

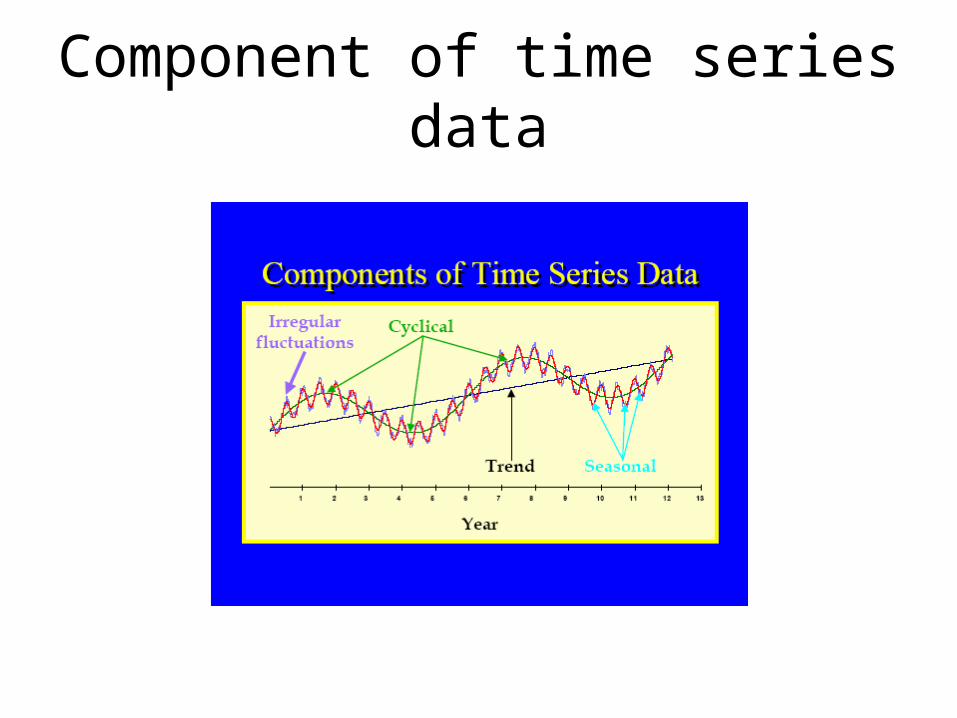
Component of time series
• Trend• Cyclic• Seasonal• Irregular
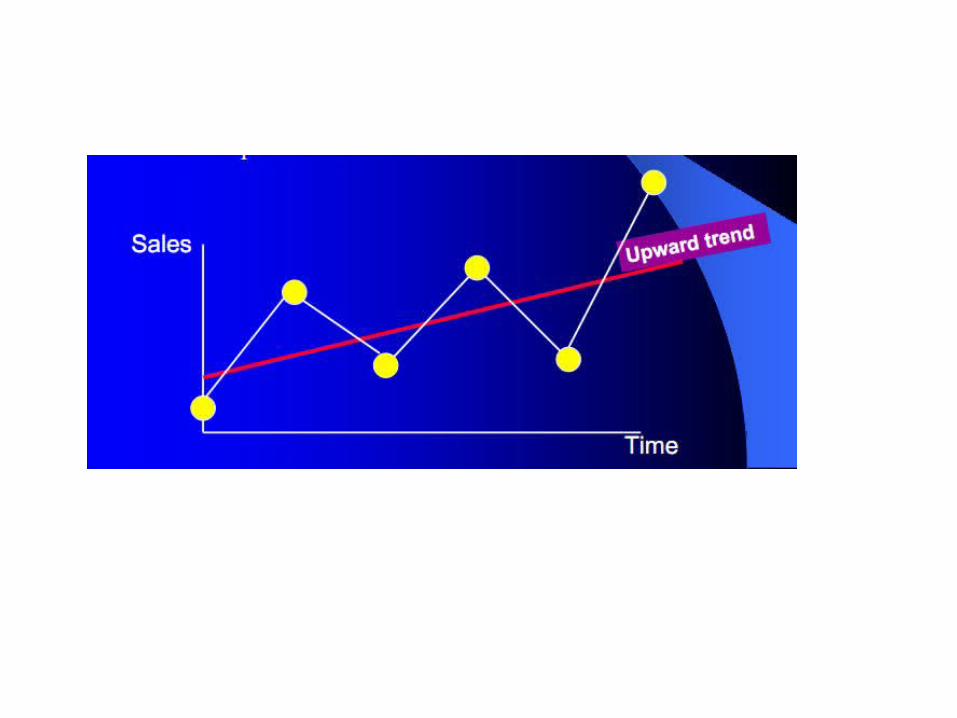
Trend
• Trend is a long term movement in a time series. It is the underlying direction(an upward or downward tendency) and rate of change in a time series, when allowance has been made for the other components. A simple way of detecting trend in seasonal data is to take averages over a certain period and if these averages change with time we can say that there is evidence of a trend in the series, indicating that the population mean is time dependent.
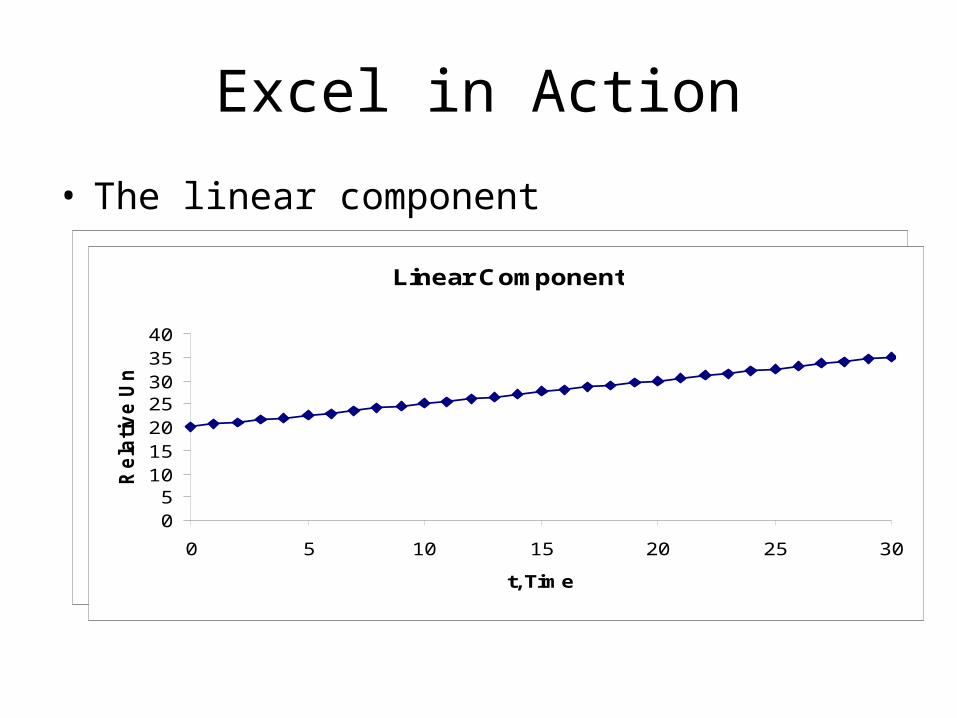
Excel in Action
• The linear componentLinear Component
0510152025303540
0 5 10 15 20 25 30
t, Time
Re
lati
ve
Un
its
Linear Component
0510152025303540
0 5 10 15 20 25 30
t, Time
Re
lati
ve
Un
its
Seasonality
• Seasonality is the component of variation in a time series which is dependent on the time of year. It describes any regular fluctuations with a period of less than one year. For example, the costs of various types of fruits and vegetables, unemployment figures and average daily rainfall, all show marked seasonal variation.
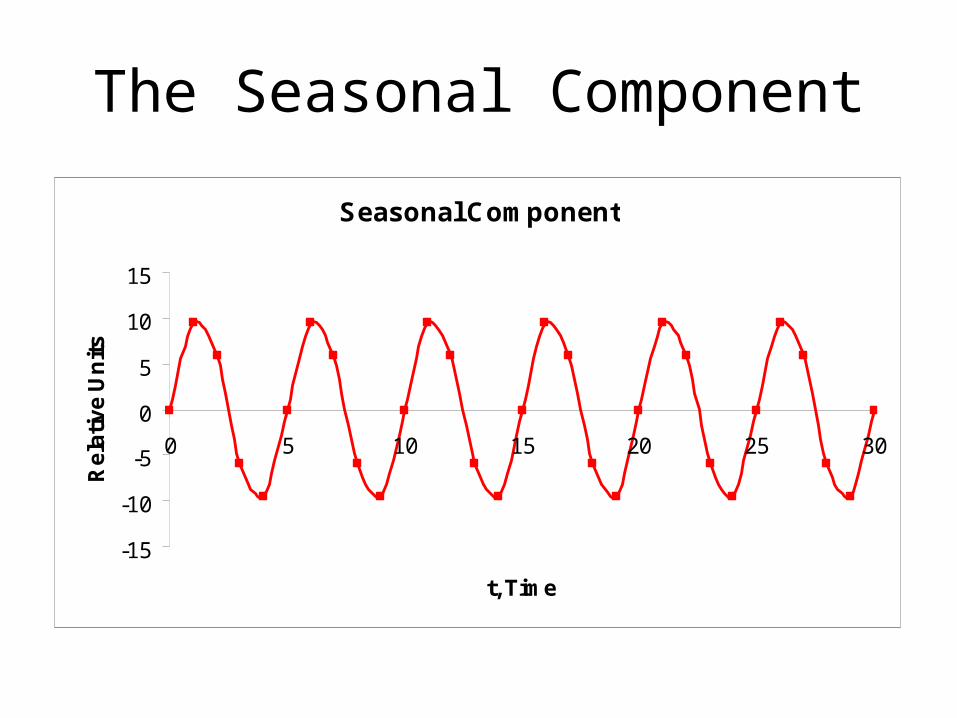
The Seasonal Component
Seasonal Component
-15
-10
-5
0
5
10
15
0 5 10 15 20 25 30
t, Time
Re
lati
ve
Un
its
Other irregular/Random Noise
• After trend and cycle variations have been removed from a data set, we are left with a series of residuals (error). Random variation usually makes the pattern difficult to identify in a series. Most time series techniques involve removing noise in order to make the pattern clearer.
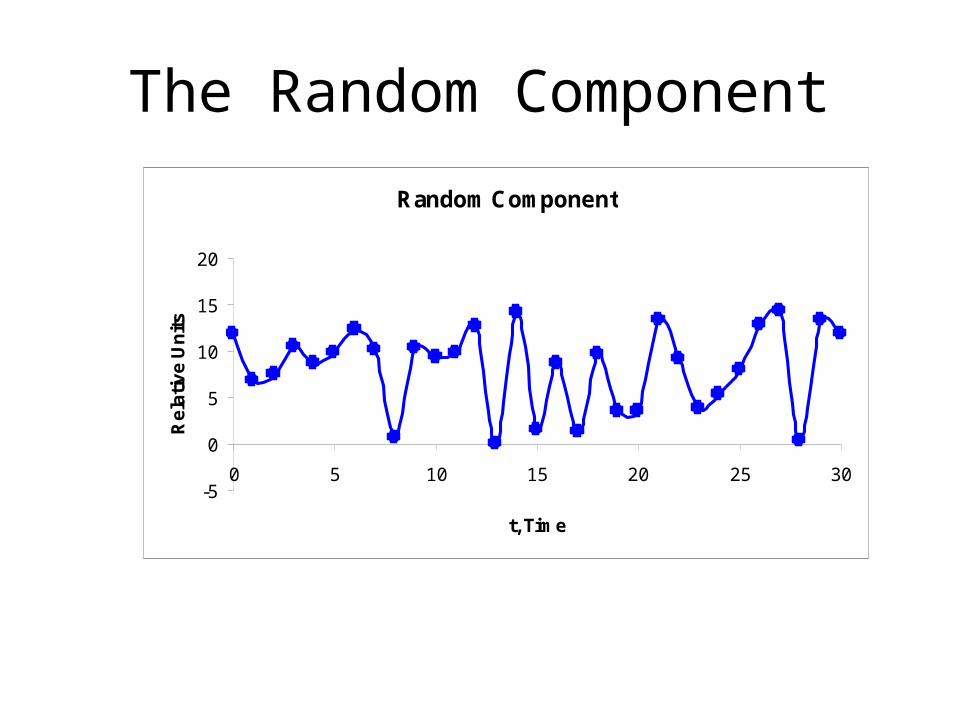
The Random Component
Random Component
-5
0
5
10
15
20
0 5 10 15 20 25 30
t, Time
Re
lati
ve
Un
its
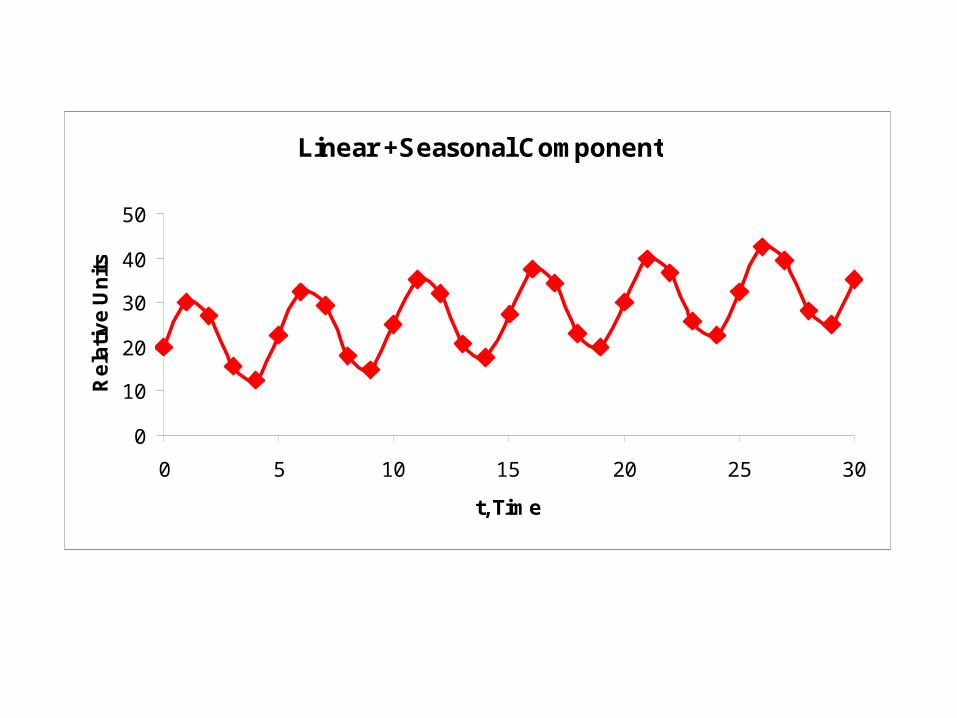
Linear +Seasonal Component
0
10
20
30
40
50
0 5 10 15 20 25 30
t, Time
Re
lati
ve
Un
its
Cycle
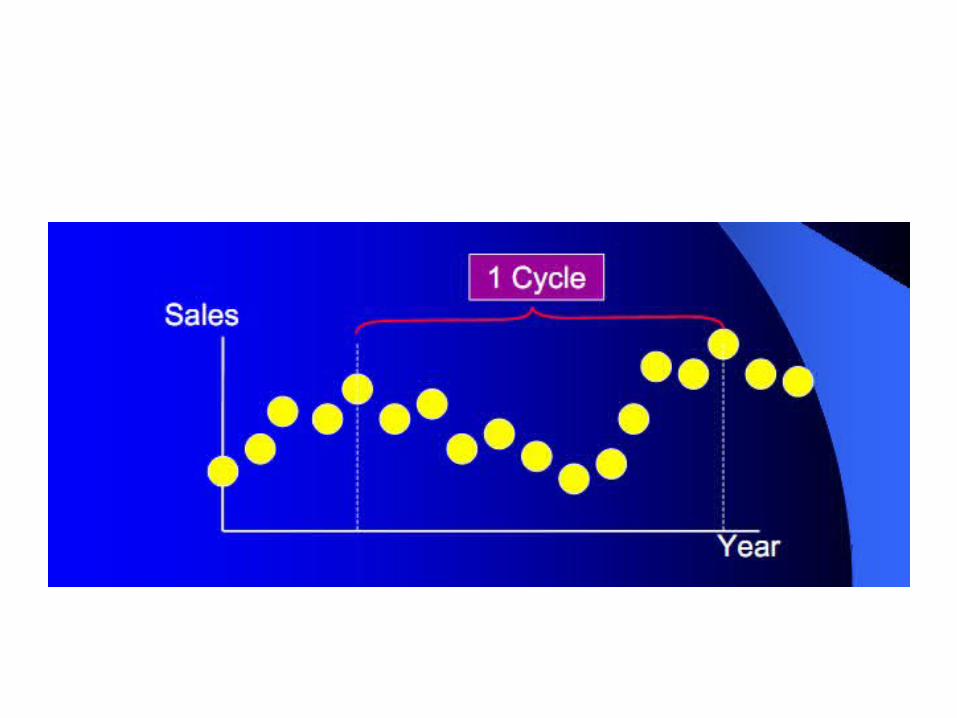
• Cycle refers to patterns, or waves, in the data that are repeated after approximately equal intervals with approximately equal intensity. For e.g. some economists believe that “business cycle” repeat themselves every four
or five years. In weekly or monthly data, the cyclical component describes any regular fluctuations.
Multiplicative Model
• The actual value of a time series, represented by Y can be found by multiplying four component at a particular time period. The effect of four components on the time series is independent. The multiplicative time series model is defined as:y = T X C X S X I
Additive model
• It is assumed that the effect of various components can be estimated by adding the various components of a time series
Y = T + C + S + I
Component of time series data
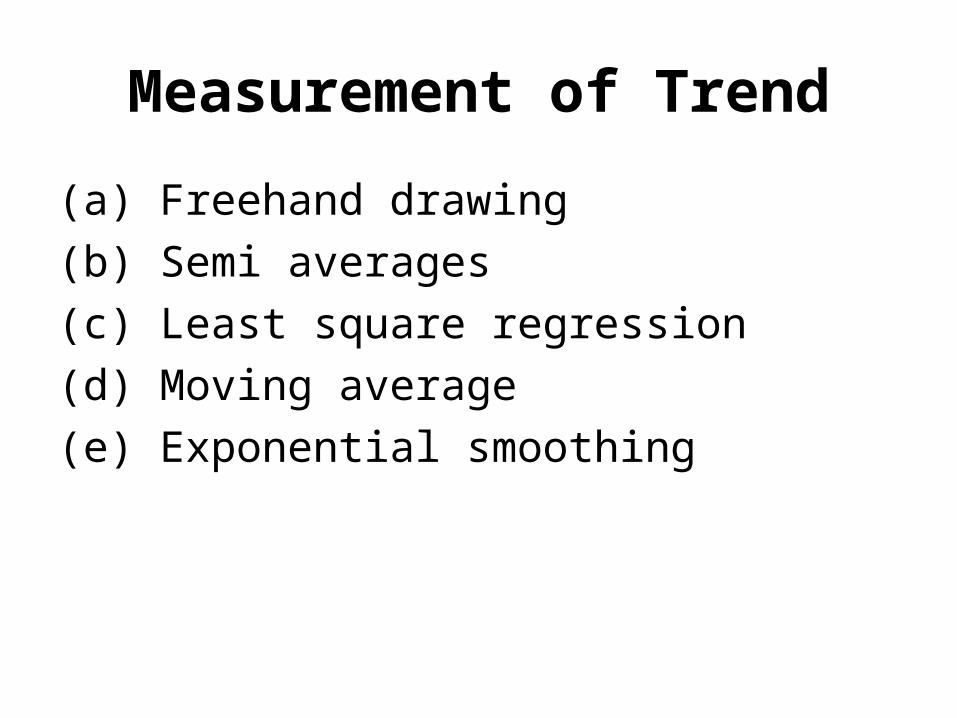
Measurement of Trend
(a) Freehand drawing(b) Semi averages(c) Least square regression(d) Moving average(e) Exponential smoothing

Freehand Drawing
• Freehand drawing is a quick and simple method to measure trend. It involves first plotting the data and joining the successive points withsmooth curve. Looking at the graph closely will enable you to get a feel for the direction of trend and thereby drawing a line that best reflects thistrend. There is also no reason why the freehand drawing should be a straight line, although it may be easier to achieve.
Method of least square
When n= odd number i.e. we shift the origin to the middle time period.When n= even number i.e. we shift the origin to the mean of two middle timePeriods.
0 1i iY b b X
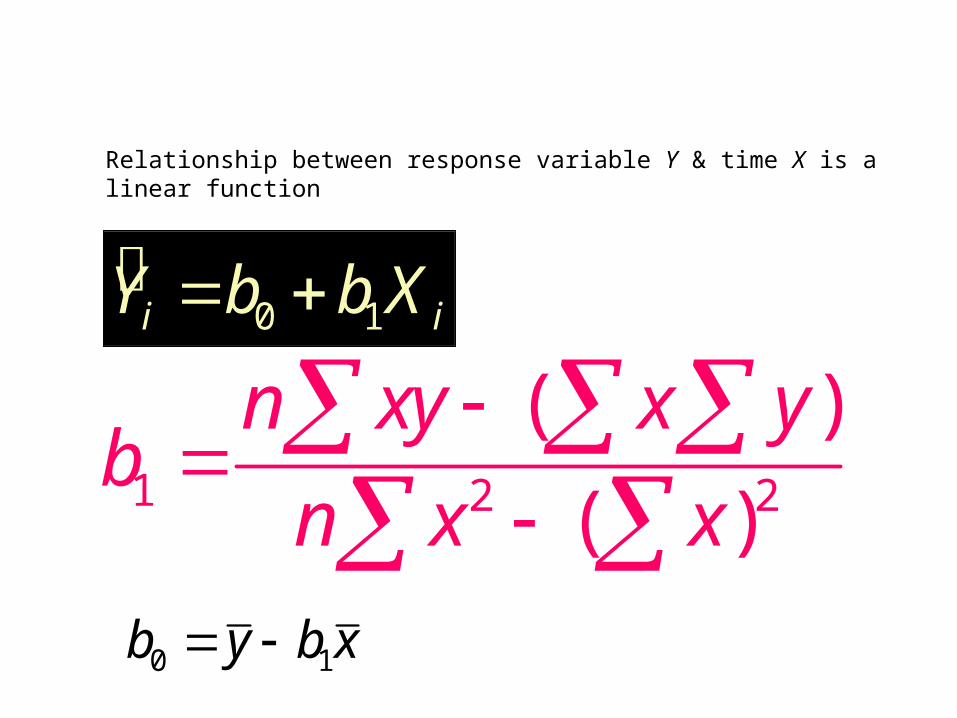
Linear Time-Series Forecasting Model
Relationship between response variable Y & time X is a linear function
1 2 2
( )
( )
n xy x yb
n x x
xbyb 10
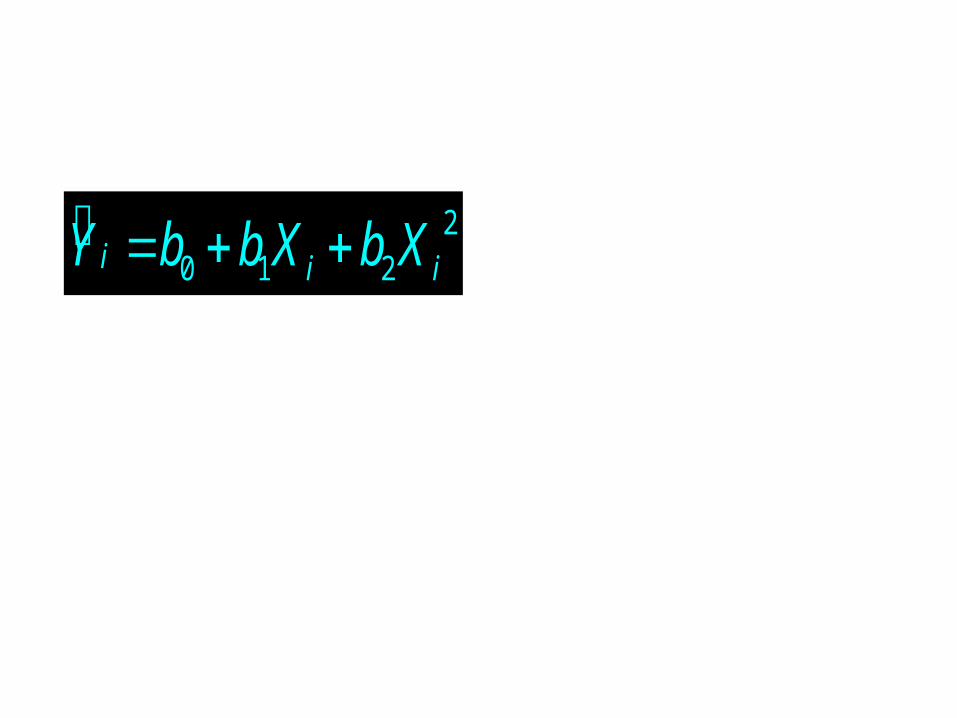
The Quadratic Trend Model
20 1 2i i iY b b X b X
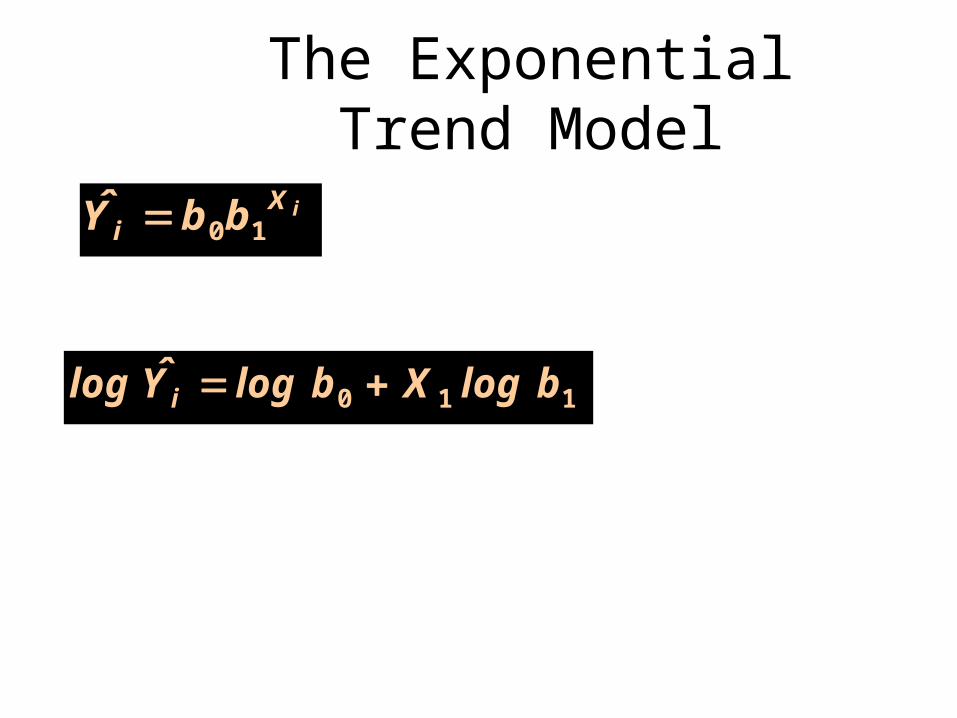
The Exponential Trend Model
iXi bbY 10
110 blogXblogYlog i


![Keynote infrastructures for health Brit (1)[1]€¦ · (Klijn!&!Koppenjan!2016:!42)! Wickedproblems$ “involvea!largenumber!of!variables,!conElicting!opinions,! uncertainties,!and!dynamics,!thus!making!it!hard!to!predict!](https://img.pdfslide.us/doc/110x75/5f63cd247d07e339e914fec0/keynote-infrastructures-for-health-brit-11-klijnkoppenjan201642.jpg)