Embed Size (px)
Citation preview

Business Failures and Macroeconomic Factors in the UK
Jia Liua and Dong Pangb
a The University of Salford, b The University of Manchester, UK
Correspondence Address: Dr Jia Liu School of Accounting, Economics and Management Science The University of Salford Greater Manchester UK M5 4WT Tel : +44 (0)161 2952981 Fax: +44 (0)161 2952130
Email: [email protected]

Business Failures and Macroeconomic Factors in the UK
Abstract This paper investigates whether macroeconomic factors can account for the observed
fluctuations of UK business failures in the period of 1966–2003, using vector error-
correction model. The main finding is that macroeconomic variables, i.e. credit,
profits, inflation and company births, appear to be important factors influencing
business failures. In particular, the interest rate, informative about future movements
of failure rates, can be used as a feasible policy instrument to reduce the incidence of
failures. Corporate failures have been identified to play an important role in
macroeconomic fluctuations. The findings also indicate that the deregulation policy
adopted by the Thatcher government altered the relationships between failure rates
and macroeconomic activities over the sample period.
JEL classifications: G33, E42 and C32 Key words: business failures, macroeconomy, monetary policy, financial deregulation and vector error-correction model

Business Failures and Macroeconomic Factors in the UK
1. Introduction
The economic literature contains studies focused on explaining the relationship between
business failures and fluctuations in aggregate measures of economic activities. Increasing
attention has been devoted in recent work to time-series analyses, ranging from forecasting
single relationships between business failures and macroeconomic factors to examining the
correlations of economic behaviour in a dynamic framework. These empirical studies
consistently find that cyclical variations in business failures and macroeconomic aggregates
are correlated. For example, Altman (1983) uses ADLs (augmented distributed lags) to
demonstrate that GNP, gross corporate profits and the money supply may impact on a
marginal firm’s ability to survive. Wadhwani (1986) builds up a theory of inflation and tests
it in an ADL format, which quantifies the impact of nominal interest rates on failure rates.
Young (1995) in an extended version of the model argues that the changes in interest rate
above the expected level are the main causes of bankruptcy, especially in the period of rising
debt level. Utilising PDLs (polynomial distributed lags), the study by Turner et al. (1992)
gives a prominent role to the level of company profitability, bank credit and the growth in
money supply. Cuthbertson and Hudson (1996), in their ADL model, demonstrate that the
interest rate, profits and income-gearing variables are the key variables influencing
compulsory liquidations. Vlieghe (2001) examines UK aggregated corporate liquidations
within the ADL framework and finds that the real interest rate and debt-to-GDP ratio are the
long-run determinants of the liquidation rate, while the birth rate, property prices and
nominal interest rates have significant short-term effects. Following a different, though
related, line of research, Liu and Wilson (2002) have attempted to construct measures of the
effects of the macroeconomy using error-correction information, and their results show that
1
interest rate and insolvency legislation are important variables in determining business
failures in the long run.
Overall, these researchers recognise that the links between the corporate failures and the
macroeconomy are two-way. Firstly, macroeconomic conditions can affect the health of the
corporate sector. Tight monetary policy and an increase in the effective interest rate can
sharply alter the cost of borrowing for companies, worsen the corporate sector's financial
situation, and hence destabilize the corporate sector (Gordon, 1991). Changes in the level of
inflation can affect the volatility of cash flows and reduce the firm’s ability to pay interests
on its debt in the case of higher inflation, thus increasing the risk of financial distress, and
even threatening the viability of many firms (Wadhwani, 1986). A squeeze on credit to
companies arising from credit rationing can cause valuable investment opportunities to be
missed (Stiglitz and Weiss, 1981). Especially when firms are in financial difficulties, they
are experiencing a more difficult time raising external financing for working capital to
maintain the ongoing operations (Whited, 1992). Even though these firms are economically
viable in the long run, they may not escape going bankrupt in the short run, leading to a
higher probability of corporate failures (Hunter and Isachenkova, 2003). The general
economic fluctuations can also be directly related to the company’s survival. Economic
recession creates financial distress by narrowing the margin between cash flow and debt
services in general. The onset of recession strains the system by reducing the flow of income
available to meet current obligations and by increasing uncertainty about future liquidity
needs (Bernanke, 1983). If a firm is highly responsive to the ups and downs in the economy,
shareholders and lenders may perceive a greater risk of liquidation and/or distress and
demand a higher return in compensation for gearing. This increase in the investment costs
inevitably reduces net cash flows, which becomes critical to the firm’s continuance,
particularly for the firms that have to service high levels of debt finance. Secondly, the
financial status of the corporate sector may affect the macroeconomy through the following
2

links. It’s been well-documented that corporate financial structure plays an important role in
macroeconomic fluctuations (Fazzari et al, 1988; Carpenter et al, 1994; Gilchrist and
Himmelberg, 1995). When firms are experiencing financial difficulties, they are often forced
to dispose of assets at fire-sale prices (Pulvino, 1998), which result in falling asset values
and reduction in the firms' net worth, and as a consequence, the firms bear the risk of being
excluded entirely from access to credit, with an accompanying collapse in investment
demand (Bernanke and Gertler, 1995). Corporate balance sheets become even weakened
when the company incurs high direct costs to stay float financially, which offsets the value
of tax relief of increasing debt level, hence exerting a negative effect on firm value. These
two mechanisms lead the firms to curtail their investments and promote output contraction,
thus exacerbating sharper economic downturns (Myers, 1993). The lower level of
investment activities and the prolonged period needed for corporate restructuring can
significantly impair economic growth (Vlieghe, 2001). Furthermore, in the presence of
financial distress, the problem of informational asymmetries in credit markets is likely to be
worsening (Stiglitz and Weiss, 1981). On the one hand, debt is enforced under threat of
liquidation, and viable projects may be liquidated as a result of agency problem between
creditor and borrower (Hart and Moore, 1998); on the other hand, the firms likely has little
equity value against a relatively large amount of debt—a situation that is ideal for the
expropriation of creditors. High liquidation rates can, by gradually eroding bank capital,
weaken the banking system and trigger a financial crisis. Evidence has been shown that the
corporate financial structure played a key role in the Great Depression (Mishkin, 1978;
Bernanke, 1983) and Asian financial crisis (Gray and Stone, 1999). Given important
implications for social welfares and macroeconomic consequences of corporate failures, it is
important to understand what drives corporate liquidations, and how business failures are
associated with macroeconomic fluctuations. The objective of the present study is to extend
existing work by analysing the possible links between business failures and macroeconomic
3
aggregates using vector error-correction model (VECM), which features the dynamic
responses of business failures to the innovations to macroeconomic aggregates, accounting
for the interactions between business failures and real/financial variables in the economy and
assessing the short-run intertemporal co-movements between the variables and their long-
run equilibrium relationship. The VARs with cointegration analysis allows the simultaneous
estimation of the speed with which the variables adjust in order to re-establish any
equilibrium in the system, and such a procedure can uncover long-run equilibrium
relationships among a set of non-stationary data, and, thus, should prove particularly useful
as a guide to macroeconomic policy in relation to business failures (Kenny, 1999).
The remainder of the study is organised as follows. In Section 2 the VECM model is
introduced and specification issues are discussed. In Section 3 a six-variable dynamic
system is estimated using VECM, and the results of the VECM analysis, i.e., impulse
response functions and variance decomposition, are reported and discussed. Section 4
contains a summary and policy implications.
2. VECM model and model specification
This section sets out a simple VECM framework, and discusses the specification issues for
the analysis of macroeconomic shocks on business failures in the system, with particular
attention to parameter stability and the cointegrating relationship between the variables.
2.1. The VECM model
The vector autoregression model is used to analyse the dynamics of business failures in the
aftermath of a policy shock and to examine the interactions between systems of
macroeconomic variables of interest and business failures. A general VAR model is
∑ +∆Γ+Π=∆ −= −−
111
pj tjtjtt yyy ε (1)
4

in which y is an n -element vector of business failures and macroeconomic time series, Π
and Γ are nn× matrices of unknown constants, and εt , the serially uncorrelated
disturbance, has the multivariate distribution )I,0(N 2σ .
As it is well known that most economic series are non-stationary, although in the long run
they tend to be cointegrated, a VAR that has a cointegration specification restricts the long-
run convergence of the endogenous variables to their cointegrating relationships while
allowing a wide range of short-run dynamics. We can think of each of the cointegrating
vectors as characterising a long-run equilibrium involving y, with the convention that its
numerical value is the ‘equilibrium error’ or ‘disequilibrium’, if we let 11 ' −− ≡ tt yz β denote
the n-vector of the last period’s equilibrium errors. Thus, equation (1) can be rewritten in the
form
∑ +∆Γ+=∆ −= −−
111
pj tjtjtt yzy εα (2)
where the parameters α and Γ can be estimated using ordinary least squares. Equation (2)
is what is known as a vector error-correction model. It states that the total change in y can be
decomposed into a response to the last period’s disequilibrium, a moving average of past
changes and a white noise. On condition that the error-correction term is non-zero, the
deviation from the long-run equilibrium is corrected gradually through a series of partial
short-run adjustments until 0' 1 =−tyβ (see Cochrane, 1998, for technical details).
Since a shock to one variable directly affects the variable itself, and is also transmitted to all
of the endogenous variables, VECM can be readily transformed to interpret the evolution of
business failures as a function of orthogonalised ‘innovations’ in the macroeconomic
variables, and break down the dynamics of business failures in terms of the relative
contribution of underlying endogenous shocks and their transmission effects (Cooley and
Dwyer, 1998). We’ll examine two different methods of depicting these system dynamics—
5
the impulse response function and variance decomposition (see Hamilton, 1994)—to detect
the important shocks in the business failure fluctuations over time.
2.2. Data
In investigating the information content of macroeconomic variables in relation to business
failures and the interactions between policy operations and the real economy, we are
interested in the impacts on business failures rates (FRATE) of a vector of macroeconomic
endogenous variables, including real commercial banks’ base rate (BSR), real credit (NSL),
real profits (IP), the inflation rate (INFL), and business birth rates (BR) over the sample
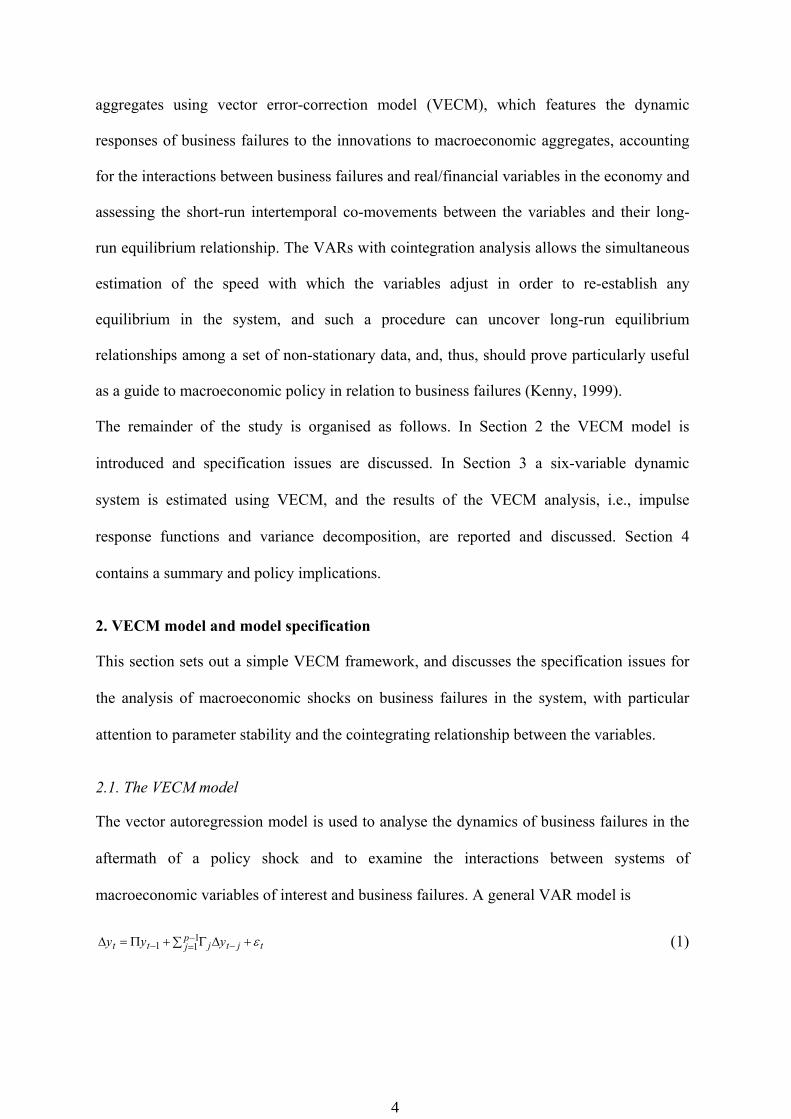
period, 1966:1-2003:4. Among these, the base rate is used as the policy variable. The co-
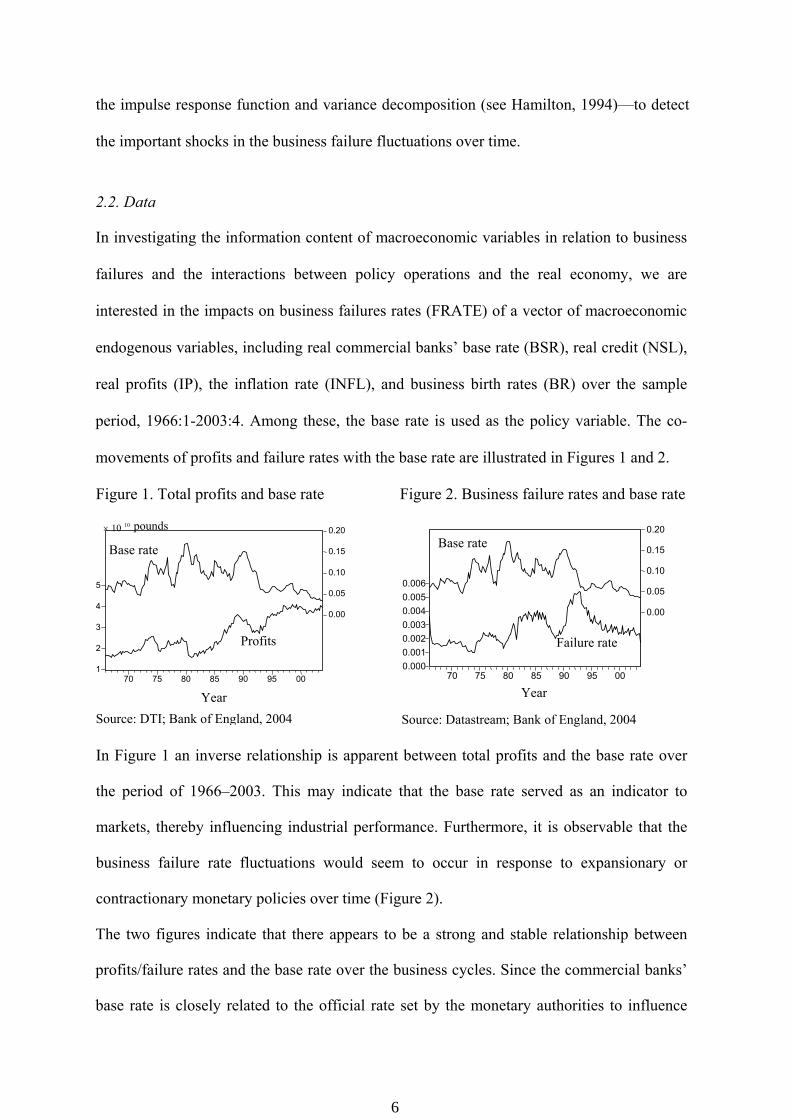
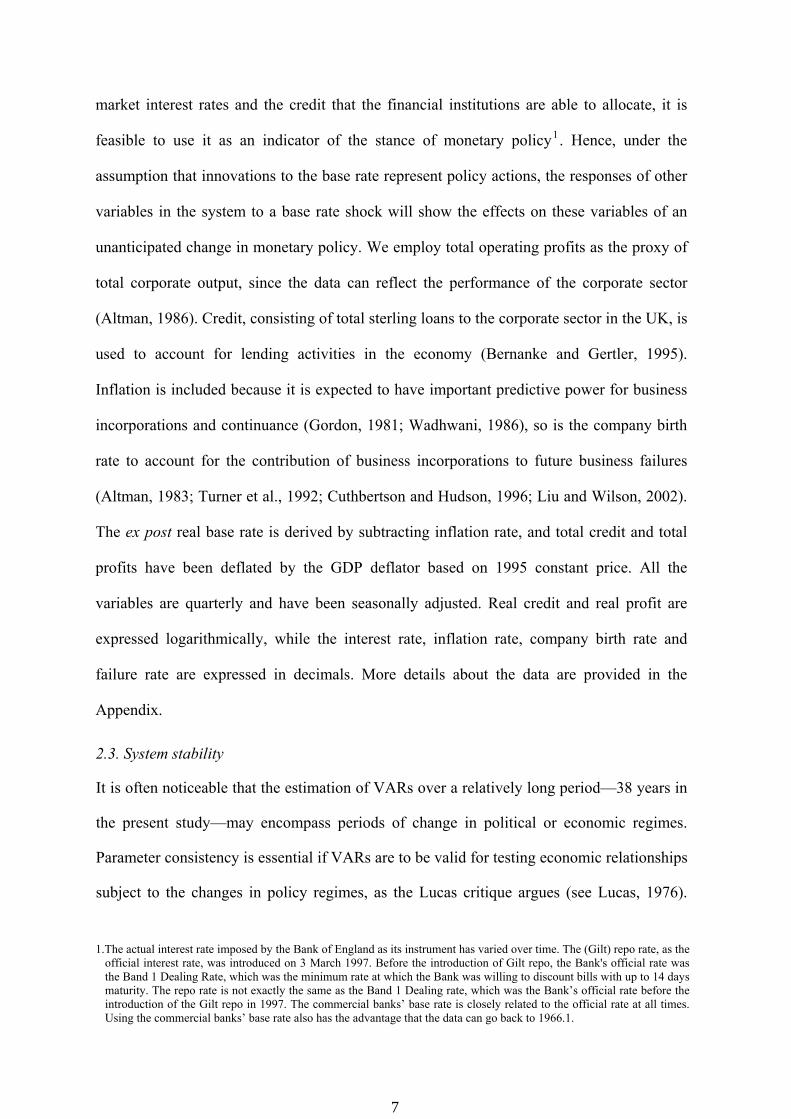
movements of profits and failure rates with the base rate are illustrated in Figures 1 and 2.
Figure 1. Total profits and base rate Figure 2. Business failure rates and base rate
In Figure 1 an inverse relationship is apparent between total profits and the base rate over
the period of 1966–2003. This may indicate that the base rate served as an indicator to
markets, thereby influencing industrial performance. Furthermore, it is observable that the
business failure rate fluctuations would seem to occur in response to expansionary or
contractionary monetary policies over time (Figure 2).
The two figures indicate that there appears to be a strong and stable relationship between
profits/failure rates and the base rate over the business cycles. Since the commercial banks’
base rate is closely related to the official rate set by the monetary authorities to influence
1 2 3 4 5
0.00
0.05
0.10
0.15
0.20
70 75 80 85 90 95 00 Year
Base rate
Profits
0.0000.0010.0020.0030.0040.0050.006
0.00
0.05
0.10
0.15
0.20
70 75 80 85 90 95 00
Base rate
Failure rate
Year
Source: DTI; Bank of England, 2004 Source: Datastream; Bank of England, 2004
1010× pounds
6
market interest rates and the credit that the financial institutions are able to allocate, it is
feasible to use it as an indicator of the stance of monetary policy1. Hence, under the
assumption that innovations to the base rate represent policy actions, the responses of other
variables in the system to a base rate shock will show the effects on these variables of an
unanticipated change in monetary policy. We employ total operating profits as the proxy of
total corporate output, since the data can reflect the performance of the corporate sector
(Altman, 1986). Credit, consisting of total sterling loans to the corporate sector in the UK, is
used to account for lending activities in the economy (Bernanke and Gertler, 1995).
Inflation is included because it is expected to have important predictive power for business
incorporations and continuance (Gordon, 1981; Wadhwani, 1986), so is the company birth
rate to account for the contribution of business incorporations to future business failures
(Altman, 1983; Turner et al., 1992; Cuthbertson and Hudson, 1996; Liu and Wilson, 2002).
The ex post real base rate is derived by subtracting inflation rate, and total credit and total
profits have been deflated by the GDP deflator based on 1995 constant price. All the
variables are quarterly and have been seasonally adjusted. Real credit and real profit are
expressed logarithmically, while the interest rate, inflation rate, company birth rate and
failure rate are expressed in decimals. More details about the data are provided in the
Appendix.
2.3. System stability
It is often noticeable that the estimation of VARs over a relatively long period—38 years in
the present study—may encompass periods of change in political or economic regimes.
Parameter consistency is essential if VARs are to be valid for testing economic relationships
subject to the changes in policy regimes, as the Lucas critique argues (see Lucas, 1976).
1.The actual interest rate imposed by the Bank of England as its instrument has varied over time. The (Gilt) repo rate, as the
official interest rate, was introduced on 3 March 1997. Before the introduction of Gilt repo, the Bank's official rate was the Band 1 Dealing Rate, which was the minimum rate at which the Bank was willing to discount bills with up to 14 days maturity. The repo rate is not exactly the same as the Band 1 Dealing rate, which was the Bank’s official rate before the introduction of the Gilt repo in 1997. The commercial banks’ base rate is closely related to the official rate at all times. Using the commercial banks’ base rate also has the advantage that the data can go back to 1966.1.
7
Accordingly, tests were run to determine the parameter stability of the system, starting with
a recursive one-step Chow test, and proceeding to an N-down forecast test based on the full
variance matrix of all forecast errors in the estimation (Hendry and Doornick, 1999).
Neither test rejected stability for most of the possible sample splits from the beginning of
the sample after initialisation, but there are a few significant structural breaks that occur
mostly between 1977 and 1979 (Table 1). To take account of the interactions between the
variables, vector Chow tests were further employed on the whole system for all the sample
dates. The period of 1980.1 comes to the fore, as F-statistic is statistically significant in all
the three tests (Table 1). This break-point can also ensure that there is a sufficient number of
observations on either side of the break for the estimation to reveal the underlying changes
in performance of the UK economy.
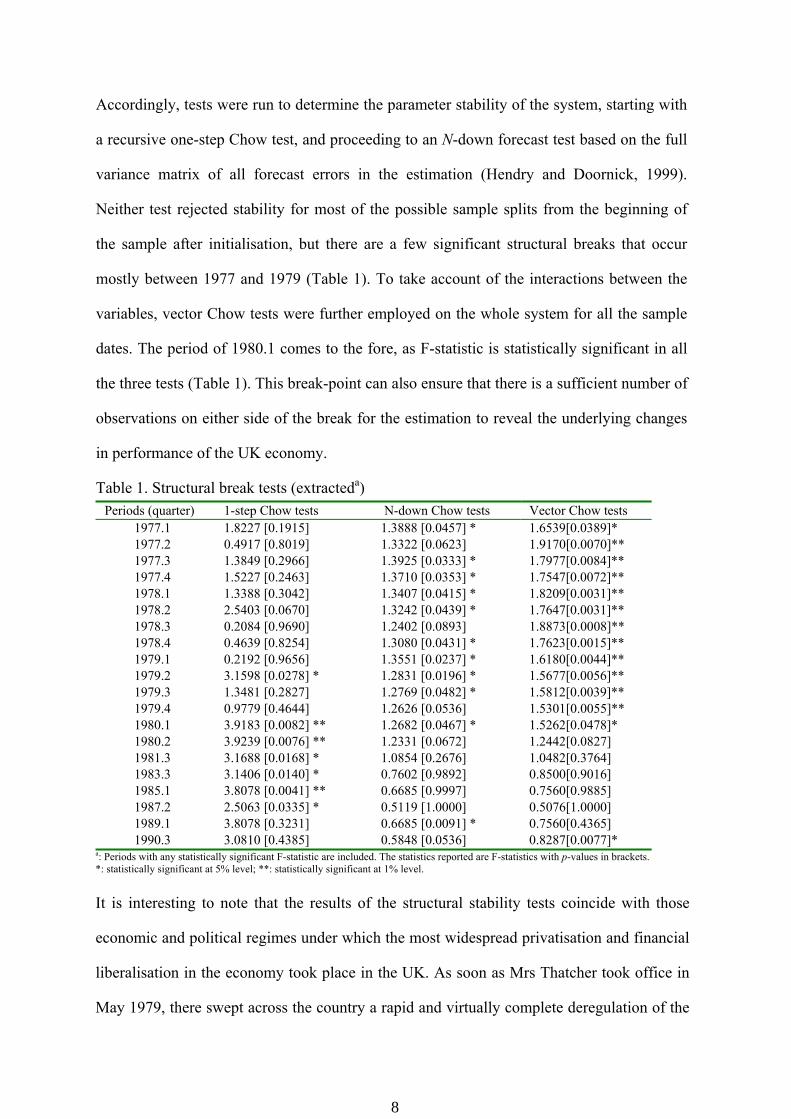
Table 1. Structural break tests (extracteda) Periods (quarter) 1-step Chow tests N-down Chow tests Vector Chow tests
1977.1 1.8227 [0.1915] 1.3888 [0.0457] * 1.6539[0.0389]* 1977.2 0.4917 [0.8019] 1.3322 [0.0623] 1.9170[0.0070]** 1977.3 1.3849 [0.2966] 1.3925 [0.0333] * 1.7977[0.0084]** 1977.4 1.5227 [0.2463] 1.3710 [0.0353] * 1.7547[0.0072]** 1978.1 1.3388 [0.3042] 1.3407 [0.0415] * 1.8209[0.0031]** 1978.2 2.5403 [0.0670] 1.3242 [0.0439] * 1.7647[0.0031]** 1978.3 0.2084 [0.9690] 1.2402 [0.0893] 1.8873[0.0008]** 1978.4 0.4639 [0.8254] 1.3080 [0.0431] * 1.7623[0.0015]** 1979.1 0.2192 [0.9656] 1.3551 [0.0237] * 1.6180[0.0044]** 1979.2 3.1598 [0.0278] * 1.2831 [0.0196] * 1.5677[0.0056]** 1979.3 1.3481 [0.2827] 1.2769 [0.0482] * 1.5812[0.0039]** 1979.4 0.9779 [0.4644] 1.2626 [0.0536] 1.5301[0.0055]** 1980.1 3.9183 [0.0082] ** 1.2682 [0.0467] * 1.5262[0.0478]* 1980.2 3.9239 [0.0076] ** 1.2331 [0.0672] 1.2442[0.0827] 1981.3 3.1688 [0.0168] * 1.0854 [0.2676] 1.0482[0.3764] 1983.3 3.1406 [0.0140] * 0.7602 [0.9892] 0.8500[0.9016] 1985.1 3.8078 [0.0041] ** 0.6685 [0.9997] 0.7560[0.9885] 1987.2 2.5063 [0.0335] * 0.5119 [1.0000] 0.5076[1.0000] 1989.1 3.8078 [0.3231] 0.6685 [0.0091] * 0.7560[0.4365] 1990.3 3.0810 [0.4385] 0.5848 [0.0536] 0.8287[0.0077]*
a: Periods with any statistically significant F-statistic are included. The statistics reported are F-statistics with p-values in brackets. *: statistically significant at 5% level; **: statistically significant at 1% level. It is interesting to note that the results of the structural stability tests coincide with those
economic and political regimes under which the most widespread privatisation and financial
liberalisation in the economy took place in the UK. As soon as Mrs Thatcher took office in
May 1979, there swept across the country a rapid and virtually complete deregulation of the
8

UK economy, which inevitably wrought fundamental changes in the real and financial
sectors of the economy. British economy in the 1970s was seen as over-planned and
stagnating in terms of real growth and productivity growth, but high in unemployment level
and inflation rate. The period in 1980s has witnessed a complete turnaround in its economic
performance. This change in performance coincides with a shift in macroeconomic policy
away from the short-term demand management polices largely conducted through fiscal
policy to control unemployment in the 1960s and 1970s, “which has produced a series of
‘stop-go’ cycles in activities but had done nothing to reverse the process of long-run decline,
to much greater emphasis on longer-term supply-side policies” (Curwen, 1990).
Specifically, the post-1980 period saw the UK seeking to embrace a market-related policy
with interest rates implemented as a principle tool in regulating the demand for and supply
of money. Monetary policy prior to 1979 was in effect credit policy and was conducted
through direct controls in the form of a ceiling on overall lending and interest rate (minimum
lending rate, i.e. MLR), a ceiling on interest-bearing eligible liabilities ("Corset”), and
restrictions imposed with the Bank of England periodically setting guidelines on lending to
certain categories of borrowers (consumer credit controls and hire purchase controls),
accompanied by an aggressive debt management policy and manipulation of the public
sector borrowing requirements (PSBR) for monetary purposes. The election of a new
Conservative government in 1979, headed by Margaret Thatcher, led to a reappraisal of
monetary policy to target inflation. Monetary policy was thus the dominant weapon in the
government's array of macroeconomic policy instruments. The 'Corset' was removed in 1980
and replaced by a plethora of new instruments, such as a reiteration of the interest rate
weapon as a tool to control bank lending; hire purchase controls were abolished in 1981, and
the PSBR and debt management instruments of monetary policy were finally abandoned in
1985. The exchange controls was also abolished in November 1979 to influence overseas
flows. In addition, the minimum lending rate was replaced by the flexible ‘intervention rate’
as a means of controlling the short-term rate of interest so as to reinforce their impact
9
through changing expectations (Curwen, 1990). Since then, the monetary policy has relied
solely on indirect controls, namely interest rates.
1980 represents a major shift in macroeconomic policy following the change of government
in the previous year and the start of the Thatcher’s market-oriented economic and financial
reform. The effect on the corporate sector has been investigated only recently by Turner et
al. (1992), using the ADL method, and they conclude that the reforms adopted by the
Thatcher government tended to lead to the major structural break in real activity seen in the
1980s. None the less, it remains possible that such a break reflects the long-term effects of
the 1970s oil crisis on the macroeconomy. Hence we may relate the structural break to
Thatcher’s reform and its resulting macroeconomic policies, as well as to the impact of the
oil crisis, which were occurring in parallel during the two sub-periods under examination.
Further checks using the Granger-causality test confirm that the splitting of the whole
period into two parts seems better able to capture the changes in the real economy and the
financial sector under different regimes (see Appendix). Both the stability tests and the facts
indicate that these two time spans, i.e. pre-1979.4 and post-1980.1, provide a suitable
division for the present study of the impact of policy-induced changes in the real economy
on business failures. Hence, in reporting the results of the estimation, we shall compare the
different responses between these two periods from an analysis of impulse response
functions and variance decomposition, in order to encompass the possibility of structural
changes consistent with the major events that have influenced the performance of the
corporate sector during this time span.
2.4. Long-run relationship and co-integration test
Cointegration implies that the linear combination of some nonstationary time series is
stationary. The plots of the time series of interest rates, failure rates and profits in Figures 1
and 2 show that the aggregates are drifting together, suggesting that the series might be
cointegrated. To establish cointegration, we first test whether each series contains a unit root
10

and is integrated in each sub-period, using the augmented Dickey-Fuller test (ADF) and
Phillips-Perron test (PP).
Table 2. Unit root tests a Level First difference Variables Pre-1980 period Post-1980 period Pre-1980 period Post-1980 period ADFb PPc ADF PP ADF PP ADF PP FRATE -1.48 -2.01 -1.84 -1.66 -3.63 -7.43 -3.96 -7.35 BSR -2.53 -2.43 -2.68 -2.35 -4.22 -6.11 -4.76 -6.87 BR -1.81 -2.99 -2.31 -1.42 -5.07 -4.58 -3.54 -5.31 NSL -1.79 -1.13 -1.26 -1.12 -3.17 -3.40 -3.43 -4.86 INFL -1.86 -1.75 -2.73 -2.19 -4.75 -3.69 -4.35 -6.36 IP -2.67 -2.61 -2.62 -2.58 -4.92 -7.12 -4.26 -7.21
a: MacKinnon critical values for rejection of the hypothesis of a unit root. Unit root tests include constant and trend; the optimal lag length is chosen by AIC criterion.
b: ADF test statistic. c: PP test statistic. Variable description: FRATE: business failure rate; BSR: base rate; BR: company birth; NSL: national lending to corporate sector; INFL: inflation rate; IP: corporate gross profits.
Table 2 shows that in no case can one reject a unit root in levels at the usual level (5%) of
significance. First differences are found to be stationary, and hence all the series are of
integrated order one I(1). As individual series are non-stationary in levels, there may exist a
cointegration relationship between them. We used the Johansen (1988) likelihood method to
determine the number of cointegrating vectors. This is based on the maximal eigenvalues,
testing for the null hypothesis that at most r cointegrating vectors exist against the
alternative of a 1+r vector.
Table 3. Cointegration test a Eigenvalue Likelihood ratio b 5 % critical value 1 % critical value Numbers of cointegration c
Pre-1980 period
0.672123 158.0473 82.49 90.45 None ** 0.582223 100.0611 59.46 66.52 At most 1 ** 0.355295 54.67511 39.89 45.58 At most 2 ** 0.329557 31.84906 24.31 29.75 At most 3 ** 0.159648 11.05858 12.53 16.31 At most 4 0.037990 2.014002 3.84 6.51 At most 5
Post-1980 period
0.551284 148.1678 82.49 90.45 None ** 0.371828 89.66805 59.46 66.52 At most 1 ** 0.298531 55.72730 39.89 45.58 At most 2 ** 0.237181 29.84305 24.31 29.75 At most 3 ** 0.125706 10.07944 12.53 16.31 At most 4 0.003729 0.272761 3.84 6.51 At most 5
a: All tests were computed with three lagged differences, allowing for no deterministic trend in the cointegrating relation of both periods.
b: L.R. test indicates the number of cointegrating equation(s) at 5% significance level. c: *(**) denotes rejection of the hypothesis at 5%(1%) significance level.
11

The results reported in Table 3 indicate that there are up to four cointegrating vectors
between the variables in each sub-period. Since the cointegration tests confirm the existence
of long-term relationships between economic activities and business failures, we therefore
estimate the systems in a vector error-correction format allowing for four cointegrating
relationships. To ensure a suitable specification of the VECM, the choice of lag length is
determined by the use of the Akaike’s Information Criterion. The results indicate that three
lags are optimal in each variable for the two separate periods of data.
3. Empirical results
3.1. Impulse-response functions
Impulse response functions are used to trace the effect of an unanticipated shock to one
variable on the time path of all the endogenous variables in the systems. The time paths of
each variable in response to the shocks in the two sub-sample periods are shown in Figures
3–4. The vertical axes refer to the changes of the variables in response to one standard
deviation of the shocks, while the horizontal axes denote elapsed time in quarters. Each
figure gives both point estimates and one-standard deviation bands obtained by Monte Carlo
simulations. We focus on the responses of business failures to the innovations to
macroeconomic aggregates, including a discussion on the responses of company births, and
also the responses of other variables to the business failure innovations.
Figures 3-4 here.
Policy shocks Figures 3 displays the estimated impulse response functions of business
births and business failures to one standard error monetary shocks in the two regimes. In the
pre-1980 period, tight money, i.e. a positive innovation in the base rate, generates an initial
short-lived rise in the company birth rate followed by a fall, which peaks after about 18
quarters, to reflect the impact of high interest rate; we then see the birth rate settling back to
12
its initial level. In response to the monetary shock, the business failure rate increases in the
short run and then tends to converge. In the long run, the pattern of the responses suggests
that the monetary shock does not account to any considerable extent for the variability of
business failures. The evidence that the signal of the policy shock does not affect business
incorporations and failures in the long run indicates that monetary tightening is not as
effective as we would have been led to expect from the first sample period. The relatively
low correlation between the policy shock and the real economy may imply that at least
business births and business failures contain a degree of variability that is not due to
unexpected monetary actions in the long run. The responses to the monetary shock take a
different pattern after 1980 from those seen in the years leading up to 1980. Tight money
causes the birth rate to decline, in anticipation of a shrinkage in credit and an increase in the
cost of borrowing, slowly reverting to the starting level. The failure rate shows a negative
response to monetary tightening at the early stage, a fact that may be accounted for by the
‘credit-rationing effect’ that holds when funds are channelled to small firms in distress in
monetary tightening and business failures fall as a consequence. Afterwards, the positive
responses gradually accumulate, reaching a peak after about a year, and persist above the
level with tendency to converge in the end, showing that the unexpected monetary shock
has a long-term negative impact on business survival—the real effect. This evidence is in
favour of the Gordon’s theoretical conclusion that the interest rate lead to the rise in
bankruptcy. In terms of the size of these effects, the implied impact on the failure rate
reaches a maximum that is roughly ten times that of the pre-1980 for a given change in the
base rate. We could say, therefore, that monetary tightening produces more severe and
longer-lasting effects in the post-1980 period than in the pre-1980 period.
Other shocks To extend the interpretation of the movements in the business failure rate,
Figure 3 further shows the effects of non-policy shocks on company failure rates and birth
13
rates in the pre- and post-1980 periods, respectively. In both periods, we find an inverse
relationship between the credit shock and the business failure rate in the immediately
succeeding years, but a direct relationship between them in more distant years. The
mechanism is associated with a rise in credit availability, which results in an increase in
production, and hence a fall in business failures, in the short run; however, the debt cost
burdens eventually lead to an increase in the cost of input and a consequent reduction in
profits, pushing up business failures in the long run. We also find that in both periods the
positive credit shock causes the company birth rate to rise in the short run and then
converge, with the stronger effect seen in the first period. This upward response of business
births to an increase in credit suggests that credit is crucial for business set-up.
The effect of the profit shock on increasing business incorporations and reducing business
failures seems permanent in the two periods. The patterns are consistent with our
expectation that business failures are negatively related to the corporate performance. The
deteriorating corporate performance may adversely affect its liquidity position and capacity
to meet interest payments, triggering debt default in the short run, and in the long run, firms
with low or negative profits are bound to go into bankruptcy. The significance of the profit
shock in predicting future birth rates suggests that positive profits over time drive up
business formations, reflecting the company births’ endogenous response to the real
activities.
As regards the effects of the inflation shock, in the pre-1980 period the company birth rate
decreases immediately in response to an unexpected rise in the inflation rate, and then
shows a path back towards equilibrium. However, its positive effect on the business failure
rate appears to be permanent, suggesting that inflation is directly associated with business
failures. In the post-1980 period the inflation shock exerts a lengthy, negative impact on the
birth rate. Furthermore, the positive shock causes the failure rate to decline initially but to
14
rise afterwards and remain at a high level persistently, indicating that the adverse effect of
an unanticipated shock to inflation ultimately falls on the rate of business failures. The
findings from the two periods lend supports to the claims of Wadhwani (1986) that inflation
raises the bankruptcy rate.
The patterns of the responses of the business failure rate to the company birth rate shock
appear to be similar in both periods. Business failures fall before rising above the original
level. Here we see the significant, but opposite, role of business incorporations in business
failures over the time horizon. In the short run the increase in new company incorporations
results in a decrease in failure rates within the first few periods of establishment, which
confirms the ‘honeymoon’ effects reported by Altman (1983) and Hudson (1986). However,
in the medium term and long run they are positively correlated. This is because some of the
new companies, which have a competitive disadvantage and are less able to withstand
financial and economic problems, begin to encounter difficulties a few years later after their
incorporations. This positive relationship implies that business failures are partially supply-
determined because new firms are more prone to bankruptcy (Hudson, 1987; Platt and Platt,
1994).
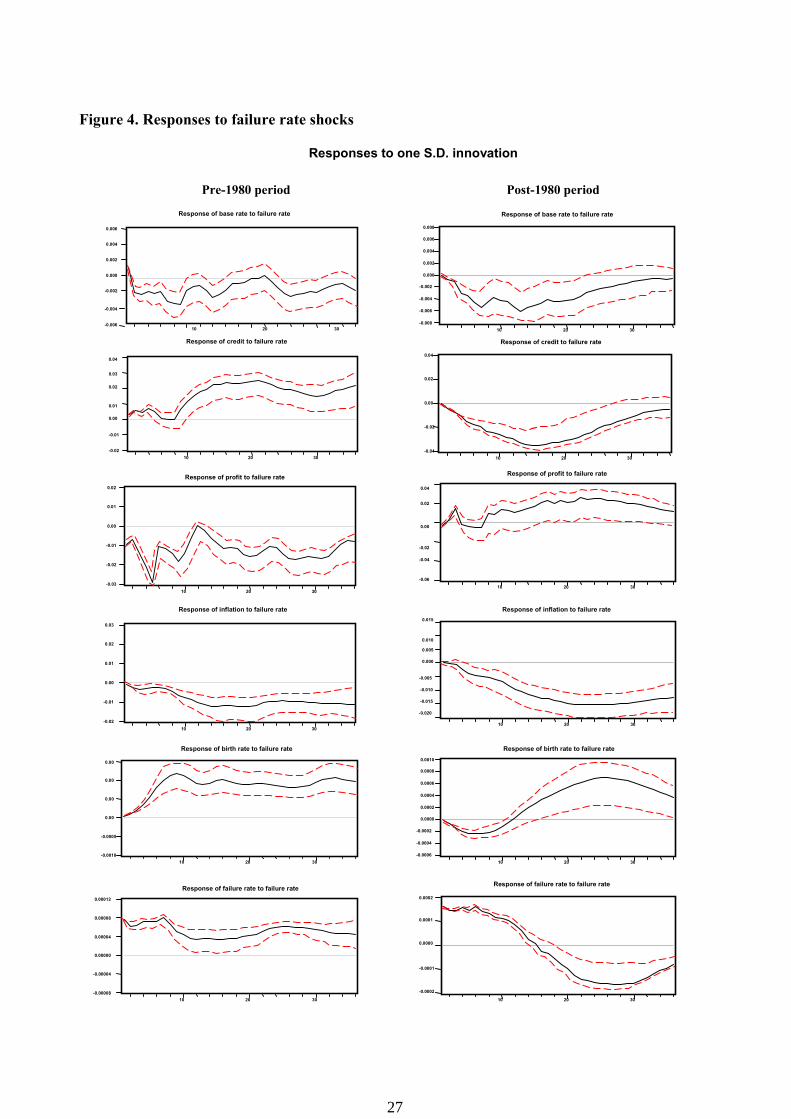
The responses of economic aggregates to the failure rate shock are depicted in Figure 4. In
the first sub-period the failure rate shock raises credit and the birth rate in the long run, and
the contractions of the interest rate, profits and the inflation rate seem relatively persistent.
In the second sub-period profits and the birth rate increase in the long run following an
initial fall, while the interest rate and credit experience a long period of depression and their
convergence takes a good deal of time. Moreover, the negative effect of the failure rate
shock on the inflation rate seems to be permanent, with no apparent tendency to converge.
The results from the two periods confirm the importance of corporate financial distress to
15
the national economy. This may indicate that financial distress should play an important role
in the macroeconomic analysis of business cycles.
Overall, the patterns of the responses in the two sub-samples are differing in terms of timing
and magnitude. The results from the impulse response functions seem to be consistent with
the course of political and economic events in the UK, particularly in the cases of interest
rate, credit and inflation shocks. Essentially, the 1970s saw a serious break in which
economic performance along every dimension deteriorated following the effects of the first
oil crisis on the UK economy: higher inflation accompanied by low real GDP growth,
quantitative controls on credit supply and an inadequacy of macroeconomic policies. Many
inefficiencies inherited from the old economic system were bound to be reformed. The
upshot was a shift to a new regime since 1979, as financial liberalisation accelerated in the
1980s and qualitative and quantitative restrictions on bank lending were removed. The
exchange rate was devalued, and inflation was on the wane. In the late 1980s the
intermediate targeting of monetary aggregates was phased out in favour of interest rate
control, in order to hit first exchange rate targets and then inflation targets. Hence the
aggregate macroeconomic shocks relating to interest rates, credit and inflation rates produce
a differential joint effect on the corporate sector across these two periods. In particular, the
monetary policy shocks generate more significant and longer-term impacts on the non-
policy variables, and the responses of the endogenous variables are somewhat stronger and
faster in the post-1980 period. This is to reflect the effect of moving away from non-market
direct controls of monetary policy prior to the Thatcher regime to market-based interest rate
instrument as the mainstream of monetary policy ever since. The dynamics of both the short
run and the long run in the systems seem plausible for the two different political and
economic regimes.
16

3.2. Variance decomposition
Further insights into the relationships between business failures and macroeconomic
activities can be gained by analysing the variance decomposition of business failure rates
resulting from innovations to the macroeconomic variables. Table 4 reports the percentage
of the 36-step-ahead forecast error variance in business failure rates that is accounted for by
the policy shock and non-policy shocks in the two sub-systems, providing us with
information about the relative importance of these random innovations in the business
failure fluctuations. In general in the pre-1980 regime, the inflation shock and the profit
shock are the main short-run sources of failure rate fluctuations, whereas in the long run the
credit shock and the birth rate shock also contribute to the variability in failure rates. The
results are consistent with conditions of the inflationary economy in the 1970s, when the
overall economic performance deteriorated accompanied by the adverse effects of global oil
price shocks as expected. The interest rate shock shows a short-run effect, accounting for 30
percent of business failure fluctuations in the first four periods, but its importance
diminishes rapidly over time. In the post-1980 regime, the short-run variability of failure
rates is mostly explained by its own shock and the interest rate shock, indicating that
monetary policy is more predictive for the real sector in the deregulated market; whereas in
the long run, with the dominant role of the interest rate shock, the contributions of other
shocks do not differ from each other by much. These results seem to provide some
favourable evidence for our conjecture that no single shock plays an influential role in
explaining business failure fluctuations at all the horizons: rather, they result from the policy
shock accompanied by the other macroeconomic shocks, which influence the corporate
activities at different intervals in the two regimes.
17
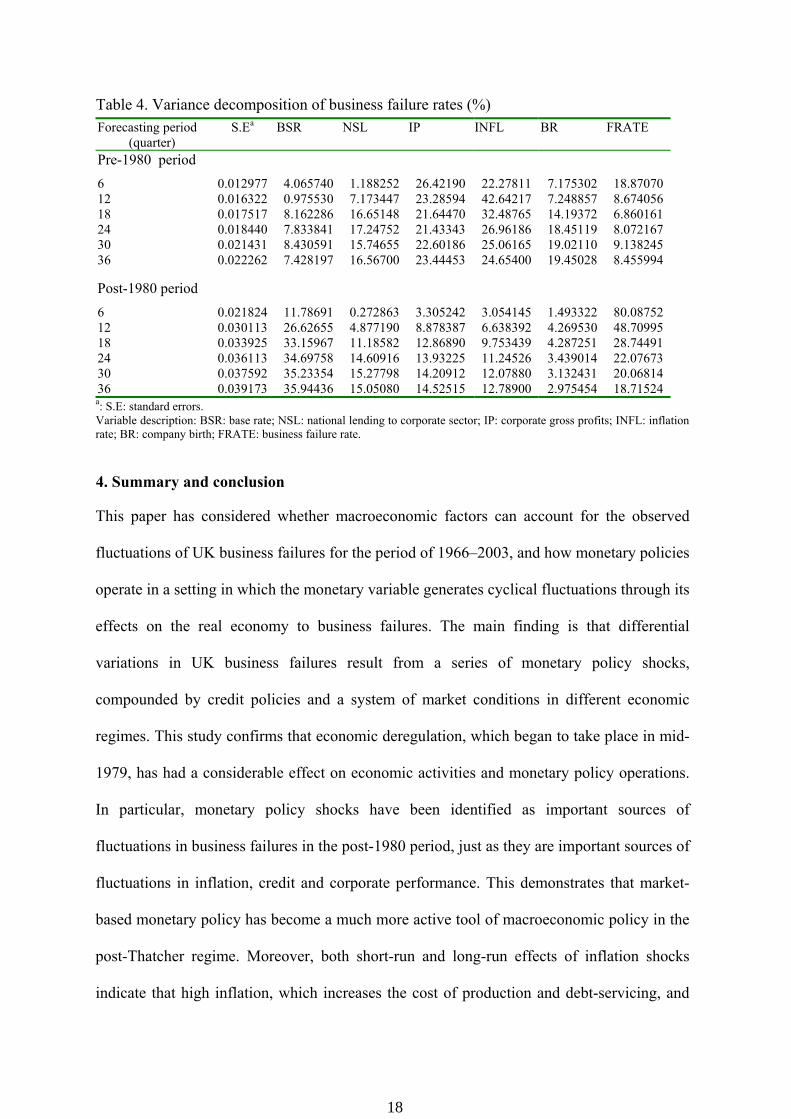
Table 4. Variance decomposition of business failure rates (%) Forecasting period
(quarter) S.Ea BSR NSL IP INFL BR FRATE
Pre-1980 period
6 0.012977 4.065740 1.188252 26.42190 22.27811 7.175302 18.87070 12 0.016322 0.975530 7.173447 23.28594 42.64217 7.248857 8.674056 18 0.017517 8.162286 16.65148 21.64470 32.48765 14.19372 6.860161 24 0.018440 7.833841 17.24752 21.43343 26.96186 18.45119 8.072167 30 0.021431 8.430591 15.74655 22.60186 25.06165 19.02110 9.138245 36 0.022262 7.428197 16.56700 23.44453 24.65400 19.45028 8.455994 Post-1980 period
6 0.021824 11.78691 0.272863 3.305242 3.054145 1.493322 80.08752 12 0.030113 26.62655 4.877190 8.878387 6.638392 4.269530 48.70995 18 0.033925 33.15967 11.18582 12.86890 9.753439 4.287251 28.74491 24 0.036113 34.69758 14.60916 13.93225 11.24526 3.439014 22.07673 30 0.037592 35.23354 15.27798 14.20912 12.07880 3.132431 20.06814 36 0.039173 35.94436 15.05080 14.52515 12.78900 2.975454 18.71524 a: S.E: standard errors. Variable description: BSR: base rate; NSL: national lending to corporate sector; IP: corporate gross profits; INFL: inflation rate; BR: company birth; FRATE: business failure rate.
4. Summary and conclusion
This paper has considered whether macroeconomic factors can account for the observed
fluctuations of UK business failures for the period of 1966–2003, and how monetary policies
operate in a setting in which the monetary variable generates cyclical fluctuations through its
effects on the real economy to business failures. The main finding is that differential
variations in UK business failures result from a series of monetary policy shocks,
compounded by credit policies and a system of market conditions in different economic
regimes. This study confirms that economic deregulation, which began to take place in mid-
1979, has had a considerable effect on economic activities and monetary policy operations.
In particular, monetary policy shocks have been identified as important sources of
fluctuations in business failures in the post-1980 period, just as they are important sources of
fluctuations in inflation, credit and corporate performance. This demonstrates that market-
based monetary policy has become a much more active tool of macroeconomic policy in the
post-Thatcher regime. Moreover, both short-run and long-run effects of inflation shocks
indicate that high inflation, which increases the cost of production and debt-servicing, and
18

hence reduce the company cash flows, will result in a rise in failure rates. This association
between business failures and inflation provides evidence for the argument that inflation is
costly. Unlike some previous studies (Hudson, 1987; Platt and Platt, 1994; Vlieghe, 2001),
which did not examine the dynamic impact of business incorporations on business failures,
this study has separated the short-run effect of the birth rate shock from its medium-term and
long-term effects on failure rates, showing that the birth rate shock produces the
‘honeymoon effect’ within the first few periods of business establishments, while in the
medium and long run business failures increase as a consequence of a rise in new business
incorporations. Importantly, the results clearly show that the shocks to business failures can
generate large fluctuations in interest rates, credit, inflation and profits, suggesting the
potential severity of economic and social consequences of sharp rises in company failures,
and the inexorable link of corporate distress and failures with financial stability and
economic growth.
The paper’s findings carry important policy implications that are related to the efficient
conduct of monetary policy in the course of financial deregulation, the survival of firms in
distress and financial-driven business cycles. Direct controls were rejected by the Thatcher
regime on the grounds of their distortionary impact on the banking sector: they reduced the
efficiency of and competition among the financial institutions and produced
disintermediation. The reform measures, with focus on the reduction in government
regulation and increase in reliance on market determined outcomes, the enhanced role of
monetary policy in adjusting the real economy, the rise of the “independent” central bank,
and, more importantly, well-functioning social and political institutions, in which financial
markets deliver socially desirable market outcomes, led to the monetary policy
manipulations based on market rules with rational reactions to the symbols of policy
adjustments produced by the policy-makers. Following the Thatcher doctrine, many other
19
nations, such as in Asia, experienced the similar financial reform in 1980s and 1990s, but
the reform process was severely hampered by the outbreak of the financial crisis in 1997.
The financial crisis has revealed tensions between the growth and the domestic policy-
making processes and market-based mechanism and malfunctions of institutions (Gray and
Stone, 1999). The nature of the continuing tendency of government regulations and
protections throughout the region to guide capital flows, especially in Korea and Thailand,
is not compatible with the fundamental characteristics of the competitive financial markets.
The situations are even deteriorating in China, India and Korea with highly regulated
financial systems, as the value destruction is caused by many poor investment decisions,
and a huge amount of bad debts has been accumulated ex post, which is threatening the
banking system (Beim, 2002). Monetary policy operations in these countries faced with not
only the problems of aggregates, but also the conflicts between the marketisation reform of
macro-control mechanism of monetary policy and the traditional economic system. This
suggests that they need not only to perfect market-based instruments of monetary policy, but
also to create the institutional conditions and the microeconomic foundations gradually so
that these instruments can function effectively in predicting future fluctuations in real sector
and maintaining macroeconomic stability.
The paper documents the central role that monetary policy has played in the business
establishment and continuance. Most of the firms in distress are small and medium-sized
firms (SMEs) (Altman, 1983; Hudson, 1987). When monetary policy is contractionary, the
quantity of loans supplied to firms will shrink. The SMEs, who are bank-dependent, cut their
production more than their less bank-dependent counterparts. This situation can be
aggravated by informational asymmetries (as in Stiglitz and Weiss, 1981) and can be made
even worse by the imperfect substitutes for bank credit in financial markets (Bernanke and
Blinder, 1992; Gertler and Gilchrist, 1993; Bernanke et al, 1996). Therefore, to the extent
20

that these borrowers are bank-dependent, the reduced supply of loans can result in an
increase in business failures, thereby depress the economy. Since macroeconomic conditions
are critical to the existence of marginal firms, this study suggests that the policy reaction to
the ‘credit rationing’ problem should be accommodating. For instance, some special loan
guarantee schemes activated during the recessive periods may be necessary to redress the
perceived flaw in the credit market, which would otherwise amplify the effects of a given
policy shift on business failures. In addition, the results indicate that new business
incorporations would lead to an increase in future business failures. Some previous studies
(Altman, 1983; Hudson, 1987; Dun and Bradstreet, 1994) have also noted that firms are
most likely to fail within three to five years of incorporation. An examination of national
policies is advised to focus on improving the business climate in the economy, in which the
new firms are encouraged to start and develop. Furthermore, this study reveals the links
between corporate balance sheets and the macroeconomy, providing a potential suggestion
that the financial fragility of corporate sector in the worsening economic environment may
play a role in triggering the financial and monetary instability as well as deepening and
prolonging recessions. The recent Asian crisis has illustrated the contribution of the
corporate financial structure and credit market imperfections to the depth and duration of the
economic recessions (Hussain and Wihlborg, 1999). It is suggested that the important role of
financial distress in the economic fluctuations and in the propagation of recessions deserves
further attention. Specifically, what are the mechanisms of financial distress under market
imperfections over the actual business cycle? Future researches on financial-driven business
cycle modelling are much sought for.
21
Appendices
1. Granger-causality tests
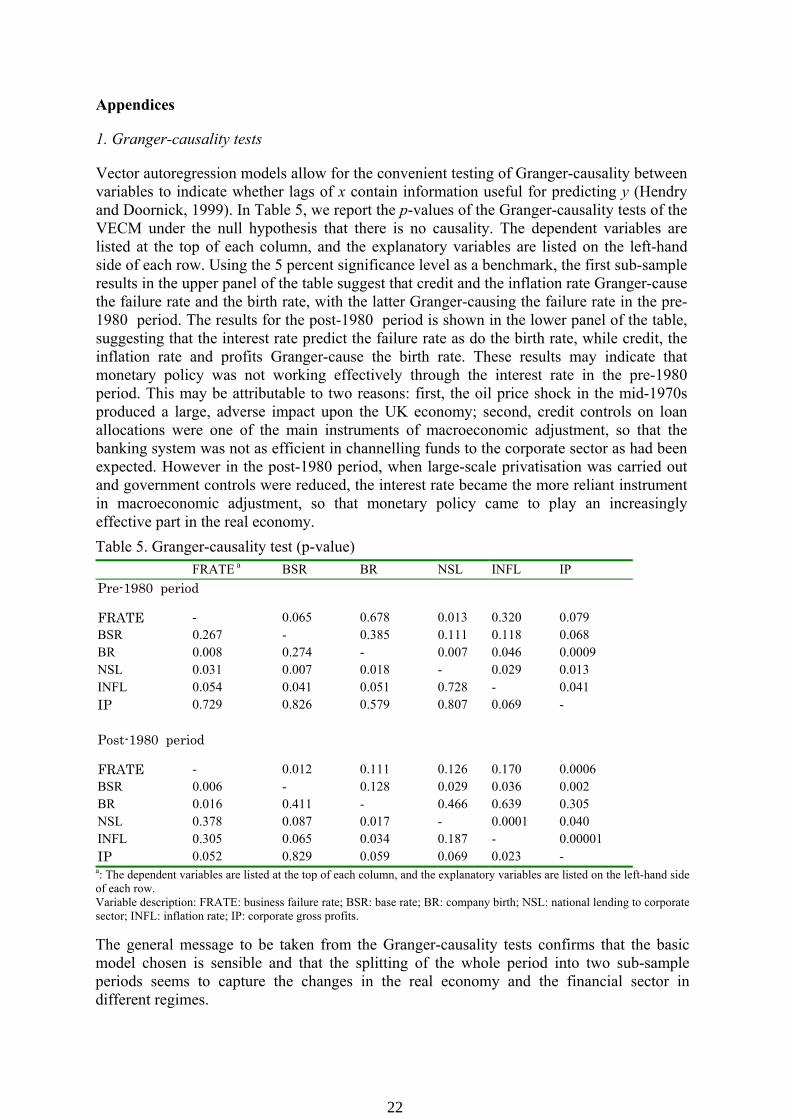
Vector autoregression models allow for the convenient testing of Granger-causality between variables to indicate whether lags of x contain information useful for predicting y (Hendry and Doornick, 1999). In Table 5, we report the p-values of the Granger-causality tests of the VECM under the null hypothesis that there is no causality. The dependent variables are listed at the top of each column, and the explanatory variables are listed on the left-hand side of each row. Using the 5 percent significance level as a benchmark, the first sub-sample results in the upper panel of the table suggest that credit and the inflation rate Granger-cause the failure rate and the birth rate, with the latter Granger-causing the failure rate in the pre-1980 period. The results for the post-1980 period is shown in the lower panel of the table, suggesting that the interest rate predict the failure rate as do the birth rate, while credit, the inflation rate and profits Granger-cause the birth rate. These results may indicate that monetary policy was not working effectively through the interest rate in the pre-1980 period. This may be attributable to two reasons: first, the oil price shock in the mid-1970s produced a large, adverse impact upon the UK economy; second, credit controls on loan allocations were one of the main instruments of macroeconomic adjustment, so that the banking system was not as efficient in channelling funds to the corporate sector as had been expected. However in the post-1980 period, when large-scale privatisation was carried out and government controls were reduced, the interest rate became the more reliant instrument in macroeconomic adjustment, so that monetary policy came to play an increasingly effective part in the real economy. Table 5. Granger-causality test (p-value) FRATE a BSR BR NSL INFL IP Pre-1980 period
FRATE - 0.065 0.678 0.013 0.320 0.079 BSR 0.267 - 0.385 0.111 0.118 0.068 BR 0.008 0.274 - 0.007 0.046 0.0009 NSL 0.031 0.007 0.018 - 0.029 0.013 INFL 0.054 0.041 0.051 0.728 - 0.041 IP 0.729 0.826 0.579 0.807 0.069 - Post-1980 period
FRATE - 0.012 0.111 0.126 0.170 0.0006 BSR 0.006 - 0.128 0.029 0.036 0.002 BR 0.016 0.411 - 0.466 0.639 0.305 NSL 0.378 0.087 0.017 - 0.0001 0.040 INFL 0.305 0.065 0.034 0.187 - 0.00001 IP 0.052 0.829 0.059 0.069 0.023 -
a: The dependent variables are listed at the top of each column, and the explanatory variables are listed on the left-hand side of each row. Variable description: FRATE: business failure rate; BSR: base rate; BR: company birth; NSL: national lending to corporate sector; INFL: inflation rate; IP: corporate gross profits. The general message to be taken from the Granger-causality tests confirms that the basic model chosen is sensible and that the splitting of the whole period into two sub-sample periods seems to capture the changes in the real economy and the financial sector in different regimes.
22

2. Data definitions and sources
FRATE* : business failure rate = total number of liquidations/total number of registrations in the UK (Source: Companies House, DTI)
BR : company birth rate = total number of new registrations/total number of registrations in the UK (Source: Companies House, DTI)
BSR : commercial banks’ base rate (Source: Bank of England) NSL : national sterling lending to corporate sector (Source: Bank of England) IP : corporate gross profits used as a proxy for output, as the corporate output data is
not available. (Source: Datastream) INFL : inflation rate (Source: Datastream)
All the data have been seasonally adjusted using X12ARIMA. BSR, NSL and IP have been deflated by the GDP deflator based on 1995 constant price. * Business failures analysed in this study are compulsory liquidation winding-up orders made by the courts, and creditors’ voluntary liquidations registered at Companies House in England, Wales and Scotland. Business failures are here used with a narrow definition in the following two aspects. ‘Liquidation’ is an insolvency procedure, which applies to companies and partnerships. However, ‘business’ can refer to a sole trader (as opposed to company). Liquidation is a formal process carried out either as a compulsory winding-up by the court or creditors’/creditors’ voluntary liquidations. However, companies can fail without going into liquidation. They can cease trading and then apply to be dissolved. Normally if a company is in the process of either compulsory liquidation winding-up orders or creditors’ voluntary liquidations, the liquidation process cannot be stopped in the normal case; any employees will be dismissed and the assets and premises secured, and the manager will lose control of the company’s business, assets and property. When the winding-up (the legal proceedings) is complete, the company will usually be dissolved 3 months later. It then ceases to exist. We, therefore, refer to ‘liquidations’ as business failures in a more strict sense in this paper.
23

References
Altman, E. I. (1983). Corporate Financial Distress. New York: John Wiley & Son.
Beaver, W. (1967). Financial ratios as predictors of failures. In Empirical Research in Accounting, Selected Studies, 1966 in supplement to the Journal of Accounting Research, January.
Beim, D. O. and Calomiris, C. W. (2001). Emerging Financial Markets. New York: McGraw-Hill Irwin, 86-149.
Bernanke, B. S. (1983). Nonmonetary effects of the financial crisis in the propagation of the great depression. American Economic Review, 73(3), 257-76.
Bernanke, B. S. and Blinder, A. S. (1992). The federal funds rate and the channels of monetary transmission. The American Economic Review, 82, 901-921.
Bernanke, B. S. and Gertler, M. (1990). Financial fragility and economic performance. Quarterly Journal of Economics, 105.
Bernanke, B. S. and Gertler, M. (1995). Inside the black box: credit channel of monetary transmission mechanism. Journal of Economic Perspective, 27-48.
Bernanke, B. S., Gertler M. and Gilchrist, S. (1996). The financial accelerator and the flight to quality. Review of Economics and Statistics, 1-15.
Carpenter R, Fazzari, S., and Petersen, B. (1994). Inventory investment, internal finance fluctuation, and the business cycles. Brookings Papers in Economic Activity, 2, 75-122. Cochrane, J. (1994). Shocks. Carnegie-Rochester Conference Series on Public Policy 41. Amsterdam: North Holland.
Companies In Report, Company House, DTI, various issues.
Cooley, T. F. and Dwyer, M. (1998). Business cycle analysis without much theory: A look at structural VARs. Journal of Econometrics, 83 (1-2), 57-88.
Curwen, P. (1990). Understanding the UK Economy. Hampshire and London: Macmillan Education Ltd, pp.306-345.
Cuthbertson, K. and Hudson, J. (1996). The determinants of compulsory liquidations in the UK. The Manchester School of Economic and Social Studies, 64 (3), 298-308.
Dale, S. and Haldane, H. (1995). Interest rates and the channel of monetary transmission: Some sectoral estimates. European Economic Review, 39, 1611-25.
Desai, M. and Montes, A. (1982). A macroeconomic model of bankruptcies in the British economy. British Review of Economic Issues, 4, 1-14.
Dun and Bradstreet (1984). Quarterly Failure Report. New York: the Dun & Bradstreet Corporation.
Dun and Bradstreet (1994). Business Failure Record. 1992 Final, 1993 Preliminary. New York: the Dun & Bradstreet Corporation.
Engle, R. F. and Granger, C. W. J. (1987). Cointegration and error correction: Representation, estimation and testing. Econometrica, 55 (2), 251-276.
Fazzari, S. R., Hubbard, G. and Peterson, B. (1988). Financing Constraints and Corporate Investment. Brookings Papers on Economic activity, 1, 141-195. Gertler, M. and Gilchrist, S. (1993). The role of credit market imperfections in the monetary transmission mechanism: Arguments and evidence. Scandinavian Journal of Economics, 95, 43-64.
24

Gilchrist, S., and Himmelberg, C. P. (1995). Evidence on the role of cash flow in reduced-form investment equations. Journal of Monetary Economics, 36, 541-572. Goudie, A. W. and Meeks, G. (1991). The exchange rate and company failure in a macro-micro model of the UK company sector. The Economic Journal, 101, 444-457.
Gray, D. F. and Stone. M. R. (1999). Corporate Balance Sheets and Macroeconomic Policy. Finance and Development, IMF, 36 (3).
Hamilton, J. (1994). Time Series Analysis. Princeton, Connecticut: Princeton University Press.
Hendry, D. F. and Doornick, J. A. (1999). PcGive, second edition. Kent: Timberlake Consultants Ltd.
Hudson, J. (1987). The age, regional, and industrial structure of company liquidations. Journal of Business Finance and Accounting, 14 (2), 199-213.
Hudson, J. (1986). An analysis of company liquidations. Applied Economics, 18 (2), 219-235.
Hunter, J. and Isachenkova, N. (2003). Aggregate economy risk and company failure: An examination of UK quoted firms in the early 1990s. mimo.
Hussain, Q. and Wihlborg, C. (1999). Corporate insolvency procedures and bank behaviour: a study of selected Asian economies. IMF Working Paper, No. WP/99/135.
Johansen, S. (1988). Statistical analysis of cointegration vectors. Journal of Economic Dynamics and Control, 12 (2-3), 231-254.
Kenny, G. (1999). Modelling the demand and supply sides of the housing market: evidence from Ireland. Economic Modelling, 16, 389-409.
Liu, J. and Wilson, N. (2002). Corporate failure rates and the impact of the 1986 Insolvency Act: An econometric analysis. Managerial Finance, 28 (6), 61-71.
Lucas Jr, R. E. (1976). Economic policy evaluations: a critique. Carnegie-Rochester Conference Series on Public Policy, 1, 19-46.
Mishkin, F. (1978). The household balance sheet and the Great Depression. Journal of Economic History, 38.
Myers, S. (1993). The search for optimal capital structure, in Chew, D H (ed), The new corporate finance, McGraw-Hill, New York.
Platt, H. D. and Platt, M. B. (1994). Business cycle effects on state corporate failure rates. Journal of Economics and Business, 46, 113-127.
Pulvino, T. (1998). Do asset re-sales exist?: An empirical investigation of commercial aircraft transactions. Journal of Finance, 53, 939-978.
Stiglitz, J. E. and Weiss, A. (1981). Credit rationing in markets with imperfect information. The American Economic Review, 74, 194-199.
Turner, P., Cotts, A. and Bowden, S. (1992). The effect of the Thatcher government on company liquidation: An econometric study. Applied Economics, 24 (7), 935-943.
Vlieghe, G. W. (2001). Indicators of fragility in the UK corporate sector, Bank of England Working Paper.
Wadhwani, S. B. (1986). Inflation, bankruptcy, default premia and the stock market. The Economic Journal, 96 (381), 120-138. Whited, T. (1992). Debt, liquidity constraints and corporate investment evidence from panel data. Journal of Finance, 47:1425-60.
25

Figure 3. Responses of failure rates and birth rates to monetary and non-policy shocks
Pre-1980 period Post-1980 period
-0.0010
-0.0005
0.0000
0.0005
0.0010
0.0015
10 20
30
Response of birth rate to failure rate
Impulse responses of failure rates Impulse responses of birth rates Responses to one S.D. innovation
-0.0010
-0.0005
0.0000
0.0005
0.0010
0.0015
10 20 30
Response of birth rate to credit
-0.0010
-0.0005
0.0000
0.0005
0.0010
0.0015
10 20 30
Response of birth rate to profit
-0.0006
-0.0004
-0.0002
0.0000
0.0002
0.0004
0.0006
0.0008
0.0010
10 20 30
Response of birth rate to credit
-0.0006
-0.0004
-0.0002
0.0000
0.0002
0.0004
0.0006
0.0008
0.0010
-0.0006
-0.0004
-0.0002
0.0000
0.0002
0.0004
0.0006
0.0008
0.0010
10 20 30
Response of birth rate to failure rate
-0.0005
-0.0004
-0.0003
-0.0002
-0.0001
0.0000
0.0001
10 20 30
Response of birth rate to inflation
-0.0004
-0.0003
-0.0002
-0.0001
0.0000
0.0001
-0.00008
-0.00004
0.00000
0.00004
0.00008
0.00012
10 20 30
Response of failure rate to birth rate
Pre-1980 period Post-1980 period
-0.00008
-0.00004
0.00000
0.00004
0.00008
0.00012
10 20 30
Response of failure rate to credit
-0.00008
-0.00004
0.00000
0.00004
0.00008
0.00012
Response of failure rate to profit -0.0002
-0.0001
0.0000
0.0001
0.0002
10 20 30
Response of failure rate to credit
-0.0002
-0.0001
0.0000
0.0001
0.0002
10 20 30
Response of failure rate to profit
-0.0002
-0.0001
0.0000
0.0001
0.0002
10 20 30
Response of failure rate to birth rate
0.00001 0.00002 0.00003 0.00004 0.00005 0.00006
10 20 30
Response of failure rate to inflation
-0.00002
0.00000
0.00002
0.00004
0.00006
0.00008
0.00010
0.00012
10 20 30
Response of failure rate to inflation
-0.0006
-0.0004
-0.0002
0.0000
0.0002
0.0004
0.0006
0.0008
0.0010
10 20 30
Response of birth rate to base rate
-0.0002
-0.0001
0.0000
0.0001
0.0002
10 20 30
Response of failure rate to base rate Response of failure rate to base rate
-0.000012
-0.00006
0.00000
0.00006
0.000012
0.000118
10 20 30 -0.0010
-0.0005
0.0000
0.0005
0.0010
0.0015
10
20 30
Response of birth rate to base rate
Response of birth rate to profit
10 20 30
10 20 30
Response of birth rate to inflation
10 20 30
26
10 20 30
Response of base rate to failure rate
Response of credit to failure rate
-0.03
-0.02
-0.01
0.00
0.01
0.02
10 20 30
Response of profit to failure rate
-0.02
-0.01
0.00
0.01
0.02
0.03
10 20 30
Response of inflation to failure rate
-0.00008
-0.00004
0.00000
0.00004
0.00008
0.00012
Pre-1980 period
Response of base rate to failure rate
-0.008
-0.006
-0.004
-0.002
0.000
0.002
0.004
0.006
0.008
10 20 30
Response of credit to failure rate
-0.04
-0.02
0.00
0.02
0.04
10 20 30
Response of profit to failure rate
-0.06
-0.04
-0.02
0.00
0.02
0.04
10 20 30
-0.020
-0.015
-0.010
-0.005
0.000
0.005
0.010
0.015
-0.0006
-0.0004
-0.0002
0.0000
0.0002
0.0004
0.0006
0.0008
0.0010
Post-1980 period
Figure 4. Responses to failure rate shocks
Responses to one S.D. innovation
-0.0002
-0.0001
0.0000
0.0001
0.0002
-0.006
-0.004
-0.002
0.000
0.002
0.004
0.006
-0.02
-0.01
0.00
0.01
0.02
0.03
0.04
10 20 30
-0.0010
-0.0005
0.00
0.00
0.00
0.00
Response of birth rate to failure rate
10 20 30
10 20 30
Response of failure rate to failure rate
Response of inflation to failure rate
10 20 30
Response of birth rate to failure rate
10 20 30
10 20 30
Response of failure rate to failure rate
27