Embed Size (px)
Citation preview

Updated February 23,2012
© 2010 SAP AG Page 1
Topic: Tyson Foods Inc Business Case and Metadata
Background
Tyson Foods, Inc. [NYSE: TSN], founded in 1935 with headquarters in Springdale, Arkansas, is
the world's largest processor and marketer of chicken, beef, and pork, the second-largest food
company in the Fortune 500 and a member of the S&P 500. The company produces a wide
variety of protein-based and prepared food products, which are marketed under the "Powered by
Tyson™" strategy. Tyson is the recognized market leader in the retail and foodservice markets it
serves, providing products and service to customers throughout the United States and more than
80 countries. (Tyson Annual Report)
Tyson Foods was founded in the 1935 by John Tyson, who invested his life savings in a
truckload of 500 chickens and drove his battered truck north to Chicago to sell them. He made
$235 on his first venture and founded Tyson Foods with the proceeds. Over the succeeding 60
years the company has grown to a market leader. The company is also quite vertically
Business Case: Tyson Foods, Inc
Scenario The following Business Case describes the Tyson Foods company and their operations.
Metadata for the SAP datasources is also presented.
Objectives This business case has been developed to use with the
University of Arkansas SAP Business Intelligence Modules. This case
provides background information which will help students understand the
data used in the Advanced Analytics, Portal and BI Integration and
Building Datasources exercises.

Updated February 23,2012
© 2010 SAP AG Page 2
integrated, its operations encompassing the entire range of the food process from hatchery to
packaging and selling of individual retail proccessed foods.
Tyson operates throughout the United States, and also has a number of International locations.
There are more than 300 production facilities and sales offices throughout the United States.
Tyson employs over 105,000 people world-wide.
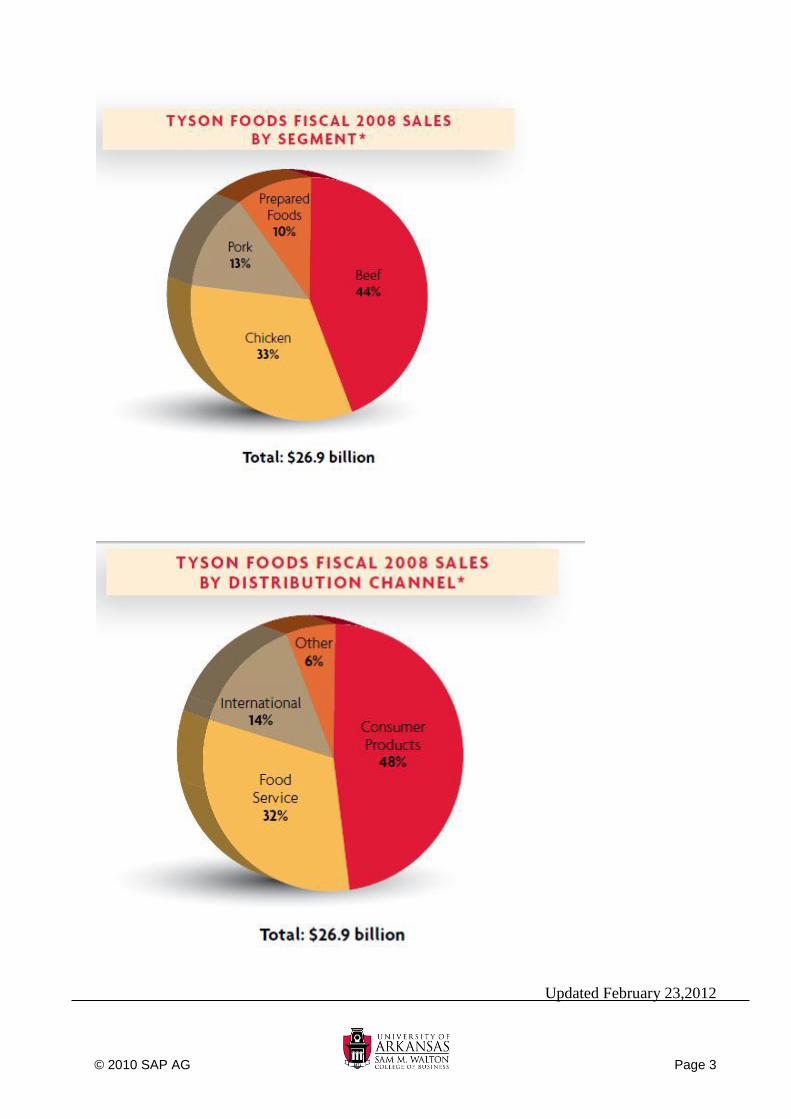
Revenues in recent years have topped $26 billion per years, and reflect a mix of different protien
groups and processed foods. Sales of beef and chicken comprise the majority of the company’s
sales, but Tyson also sells a variety of processed prepared foods and sauces sold under their own
or a number of diffeent customer brand names.
Tyson products are used primarily in two segments: Consumer Products (retail grocery) and
Food Service (restuarants, hospitals, etc).
Updated February 23,2012
© 2010 SAP AG Page 3

Updated February 23,2012
© 2010 SAP AG Page 4
Competitors of Tyson include Cargill, Swift Foods and National Beef, as well as a number of
smaller food processors.
A more detailed document explaining Tyson’s operations and strategies can be found at:
http://media.corporate-ir.net/media_files/irol/65/65476/FY08_Fact_Book_FINAL.pdf
Tyson DataSources
The University of Arkansas SAP Business Intelligence hub contains serveral InfoSources which
have been created from data donated to the University of Arkansas by Tyson Foods. The data
covers the period from 2004 to 2005.
TYSNFFDS
Tyson Frozen Foods InfoCube is a general purpose cube creates from SAP COPA data. It
contains data on company operations, revenues and other operations cost key figures. This
InfoSource can be used for accounting or revenue analysis or more specific analysis such as
transportation or other logistical costing. It can also be used to create product-line or other
product related analysis or to analyze customers, distribution channels or profitability by
organizational unit.

Updated February 23,2012
© 2010 SAP AG Page 5
The central fact table of the TYSNFFDS cube contains 40 key figures representing details of
sales transactions and costs from January 2004 to December 2005.
This cube also contain 6 dimensions: Customer, Product, Distribution, COPA Time, Time, and
Organizational. The time and COPA Time dimensions contain the various time characteristics,
so the data can be displayed by week, week ended, year, month, quarter, etc. The Distribution
Dimension shows us the channels by which the product is taken to market, its salesperson,
broker, and sales district. The organizational dimension includes its profit center, pricing
segment (which is the set of pricing rules applied to this sale) and its business division. Attribute
data is also available for each of these characteristics.
This SAP cube is built using an extended star schema design with many of the characteristics
containing master data attributes and texts.
The customer dimension is displayed below.
Central Fact
PK DIMID_PRODUCT
PK DIMID_CUSTOMER
PK DIMID_TIME
PK DIMID_COPATIME
PK DIMID_ORGANIZATION
PK DIMID_DISTRIBUTION
VV100-CASES
VV101-UNIT OF MEASURE
VV102-GROSS SALES
VV105-PRODUCT MFG
VV301-GEN DIV ADMIN COST
VV403-ADVERTISING
VV407-GUARANTEED LOANS
VV409-INTERCO COGS
VV412-INTERCO COST ADJ
VV424-PRODUCT RELAT EXP
VV426-SALES RELATED EXP
VV433-PRICING PROMO
VVA01-SURCHARGE
VVA02-OFF INVOICE DISC
VVA04-BILLBACK
VVA06-SALES ADJUST
VVA07-PRIMARY BROKERAGE
VVA10-SGML EXPENSE
VVA11-SHUTTLE FRT
VVA13-OUTSIDE FREEZR COST
VVA14-TYSN FREEZR CHARGE
VVA15-DIRECT MAILING
VVA16-SALES & MKT EXP
VVA18-GEN AND ADMIN
VVA19-G AND a
VVB01--ACCRUED ADVERTISING
VVB02-ACCRUED MKT
VVB09-INTERCO SALES
VVB10-STEVEDORING
VVB12--SALES ACCRUAL
VVB19--FREIGHT FWD
VVB20-INCENTIVE BROKERAGE
VVB32-GENERAL
VVB34-R AND D ACCRUAL
VVB35-REGULAR COOP
VVB39-SAMS UPCHARGE
VVB41-SPECIAL COOP CHARGES
VVB42-SLOTTING
VVB47-AD HOC PROGRAMS
VVJ13-INVENTORY ADJUSTMENT
VVJ17-CONTRACT COST DISCOUNT
Central FactCol1
PRODUCT DIMENSION
PK DIMID_PRODUCT
SID_PRODUCT
WWML3-MINOR PRODUCT LINE
*NOTE-- SEE DRAWING A
CUSTOMER DIMENSION
PK DIMID_CUSTOMER
SID_CUSTOMER
**NOTE-- SEE DRAWING B
COPATIME
PK DIMID_COPATIME
SID_COPATIME
WWFWK-FISC WK
WWFWE-FISC WK END
ORGANIZATION DIMENSION
PK DIMID_ORGANIZATION
SID_ORGANIZATION
PRCTR- PROFIT CENTER
WWPRS-PRICING SEGMENT
WWMLG-BUSINESS DIVISION
TIME DIMENSION
PK DIMID_TIME
SID_TIME
0CALMONTH
0CALQUART1
0CALYEAR
0FISCPER
0FISCVARNT
0CALWEEK
DISTRIBUTION DIMENSION
PK DIMID_DISTRIBUTION
SID_DISTRIBUTION
VKBUR-SALES PERSON
ZZSBK- SECONDARY BROKER
ZZPBK- PRIMARY BROKER
BZIRK- SALES DISTRICT
TYSON FROZEN FOODS
CENTRAL FACT AND DIMENSIONS
AB

Updated February 23,2012
© 2010 SAP AG Page 6
The customer dimension contains, in addition to the customer number, the sales person
associated with the customer and its pricing segment. The customer master data contains the
customer name (text), and attributes representing its physical location, sales organization sales
group, and business group. Each of these master data items contain texts describing their
meaning.
In order to protect confidential information of employees and Tyson partners and customers,
several characteristic‘s text or attribute data have been scrubbed: the customer’s actual name
the sales persons name, name of the primary and secondary broker, names of brands which are
the property of the customer and not Tyson Foods . They have been substituted with a
reasonable facsimile. No other data has been changed, however, in some cases reasonable
guesses had to be made for some master data items which were longer been maintained.
Industry TEXT
PK IND_CODE
INDUSTRY_DESCRIPTION
SIC_CODE TEXT
PK SIC_CODE
SIC_DESCRIPTION
CUSTOMER ATTRIBUTES
PK KUNWE
0ALTITUDE
0PARTNER
0CITY
0COUNTRY
SIC_CODE
IND_CODE1
0LATITUDE
0LONGITUDE
0NAME
0PRECISID
0REGION
0STREET
VTWEG
WWBUS
POBOX
POBOX_LOC
POSTAL_CD
POSTCD_BOX
POSTCD_GIX
SRCID
VKORG
CUSTOMER DIMENSION SPECIFICATIONSAP BI 7 FOR ACADEMIC ALLIANCE HUB
CUSTOMER TEXT
PK KUNWE
CUSTOMER NAME
SID TABLE
PK KUNWE
SID_CUSTOMER
SALES_ORGANIZATION TEXT
PK VKORG
FFDESC25 (SALES ORG DESC)
CUSTOMER DIMENSION TABLE
PK DIM_ID_CUSTOMER
SID_CUSTOMER
SALES PERSON
PRICING SEGMENT
SELLING GROUP TEXT
PK VTWEG
FFDESC8 (SELL GROUP DESC)
BUSINESS GROUP TEXT
PK WWBUS
FFDESC22(BUS GRP DESC)

Updated February 23,2012
© 2010 SAP AG Page 7
The product dimension is also created in the star schema format with similar text and attributes
maintained.
EXAMPLE MASTER DATA ATTRIBUTES/TEXTS
Brand Code
Brand name under which the final product is sold at retail
WWPH2 FFDESC6
75 YALLENS
84 KINGS
96 JOHN PAULS
114 GLORY FOODS
115 FRANKS SAUSAGE
121 ABB Extreme Body
157 PICK FRESH
PRODUCT ATTRIBUTES
PK ARTNR-PRODUCT NO
WWPH1-PROTIEN GRP
WWPH2-BRAND CODE
WWBRS-BRAND
WWPRT-PART
FFDESC1-PRODUCT DES
WWPRC-ProcessPRODUCT DIMENSION
PK DIM_ID_PRODUCT
SID_PRODUCT
WWPRS-PRC SEG
WWML3-MINOR PRD LINE
SID TABLE
PK ARTNR
SID_PRODUCT
PRODUCT TEXT
PK ARTNR
PRODUCT DESCRIPTION
BUSINESS_SEGMENT TEXT
PK WWBRS
FFDESC3
PART TEXT
PK WWPRT
FFDESC4
PROCESS TEXT
PK WWPRC
FFDESC4
PROTIEN_GROUP TEXT
PK WWPH1
FFDESC5
BRAND_CODE TEXT
PK WWPH2
FFDESC
PRODUCT DIMENSION
SPECIFICATIONSAP BI 7 FOR ACADEMIC ALLIANCE HUB
Updated February 23,2012
© 2010 SAP AG Page 8
159 Abbelen
171 Aaramark
178 CHI CHIS
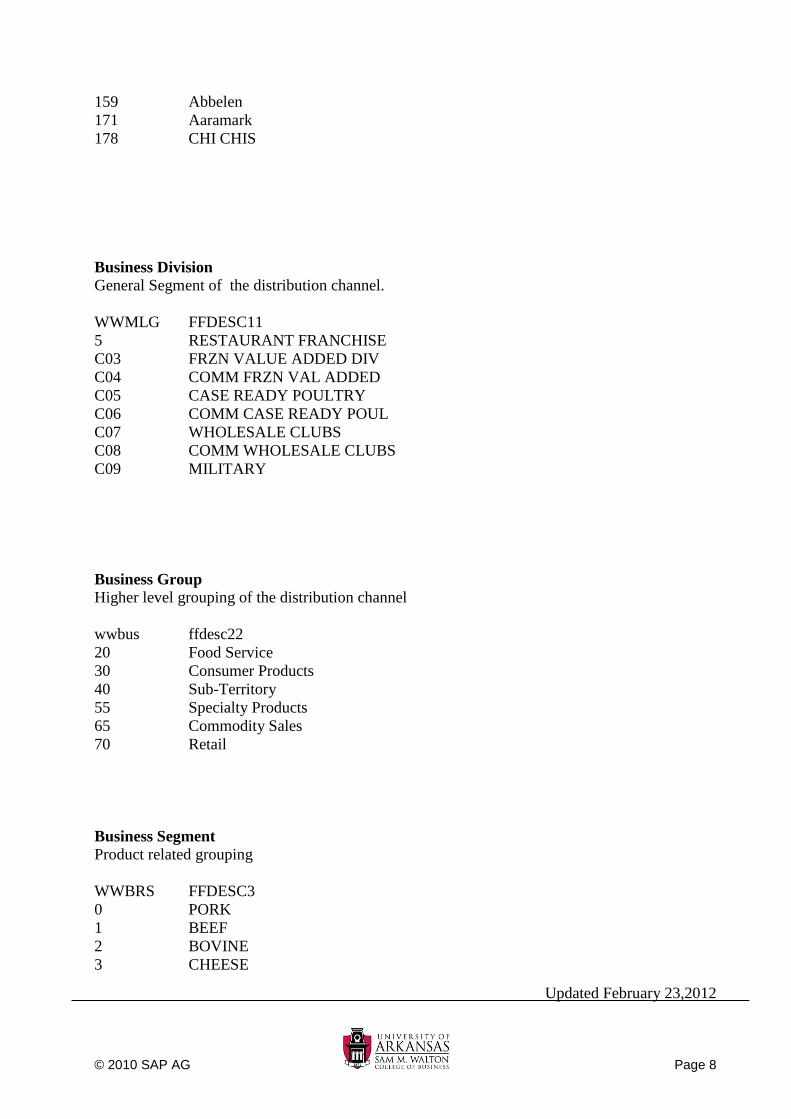
Business Division
General Segment of the distribution channel.
WWMLG FFDESC11
5 RESTAURANT FRANCHISE
C03 FRZN VALUE ADDED DIV
C04 COMM FRZN VAL ADDED
C05 CASE READY POULTRY
C06 COMM CASE READY POUL
C07 WHOLESALE CLUBS
C08 COMM WHOLESALE CLUBS
C09 MILITARY
Business Group
Higher level grouping of the distribution channel
wwbus ffdesc22
20 Food Service
30 Consumer Products
40 Sub-Territory
55 Specialty Products
65 Commodity Sales
70 Retail
Business Segment
Product related grouping
WWBRS FFDESC3
0 PORK
1 BEEF
2 BOVINE
3 CHEESE

Updated February 23,2012
© 2010 SAP AG Page 9
4 CHICKEN
5 MIXED
6 OTHER
9 SEAFOOD
Industry Code
Customer’s Industry category
Ind_code1 Industry_Description
10 Restaurant
20 Retail
30 Food Service
40 Distribution
50 Brokerage and Commodity
60 Bakery
70 Catering
Part
The part of the animal from which this product is made
WWPRT FFDESC4
1 LEG QTRS
2 WHOLE LEG
3 DRUM
4 THIGH- BACK IN
5 THIGH-BACK OUT
6 DEBONED THIGH
7 DEBONED LEG
8 FRONT HALF
Pricing Segment
How is this product price calculated
WWPRS FFDESC16
0 UNASSIGNED
1 MARKET/SPOT
2 NEGOTIATED/FORWARD
3 PRICE LIST
4 FIXED PRICE
5 COST PLUS
Sales Organization
Higest division of the sales channel

Updated February 23,2012
© 2010 SAP AG Page 10
VKORG FFDESC25
DFG Employee Sales
TPW Plant Transfers
TYSN Tyson Foods
Sales Person
**Note: Names changed to protect personal information
VKBUR FFDESC9
1 JACOB SMITH
100 CHARLES COOPER
101 JUAN RICHARDSON
103 BRAYDEN COX
Primary/Secondary Broker
Manufacturers representative responsible for distribution of product
ZZPBK FFDESC12
3 PARKS FOODS
5 DAWSON DISTRIBUTING
6 SANTIAGO SALES
8 NORRIS COMPANY
9 HARDY INC.
10 LOVE & SONS
Process
Final process the product is subjected to before shipping
WWPRC FFDESC5
0 MISC
1 ASSEMBLY
2 BAGGED
3 BLAST
4 BUBBLE PACK
5 CVP
6 DEBONED
7 EDIBLE BY PRODUCTS
Protien Group
WWPH1 FFDESC2
1 CHICKEN

Updated February 23,2012
© 2010 SAP AG Page 11
21 BEEF
31 PORK
61 PREPARED FOOD
91 OTHER
Selling Group
Higher level of industry code.
VTWEG FFDEAC8 SIC_Code
11 Food Service Distributor 5499
12 Independent Food Distributor 4222
13 Direct Broker 4222
14 Retail Fresh 4144
15 Bakery Fresh 5145
16 Bakery Other 5145
17 Independent Grocer 5411
18 Club Stores 5411
Other Tyson DataSources
In order to facilitate some of the advanced analytic exercises, which can be quite
computationally intense, smaller datasources were built to address specific Business problems.
These smaller datasources make use of the same characteristics and master data as the general
purpose cube described above, so explanations will not be repeated.
FREEZR
This DataStore Object is used in the Regression Analysis in the Advanced Analytic module. It
contains information about Freezer costs, inside and Tyson freezer costs, as the product moves
through the distribution channel. The student uses the data of this source to create an estimate of
the freezer costs of the sale, depending on its shipping location, product characteristics,
manufacturing process.
TYSNWHSE
This DataStore object is a transaction identified InfoSource built as a warehouse instead of in
the star schema format. It can be used as an example to compare the difference between a DSO
and a InfoCube. Its behavior can be compared to that of TYSNFFDS.

Updated February 23,2012
© 2010 SAP AG Page 12
**Note: All Tyson company information contained herein published by Tyson
(www.tyson.com) and is used by their kind permission.

Updated February 23,2012
© 2010 SAP AG Page 13
Using SAP’s Business Explorer
For demonstration purposes, a smaller (less populated) cube with the same specifications as on
page 5 was created. The following will illustrate using the BEx Query Designer and Analyzer.
Logon to our remote terminal server ts-sap.waltoncollege.uark.edu. See the link below for
details.
http://enterprise.waltoncollege.uark.edu/
SAP.asp
Click Start All Programs, click Business Explorer and then click Query Designer. Note that
one can get to Query Designer via the Analyzer as well.

Updated February 23,2012
© 2010 SAP AG Page 14
The SAP Logon dialog opens. Ensure you select the BI7 z10 WBI entry and double click it.
You are then prompted for your logon credentials—enter your credentials and click the OK
button
The Query designer opens with no query loaded. Move you mouse as shown to the New Query
icon and click to create a new query.

Updated February 23,2012
© 2010 SAP AG Page 15
The New Query dialog opens as shown below. Click InfoAreas on the left and then click the
Tyson Frozen Foods entry—you may have to scroll down. Click the Open button.
Select the Tyson Demonstration Cube and then click the Open button.

Updated February 23,2012
© 2010 SAP AG Page 16
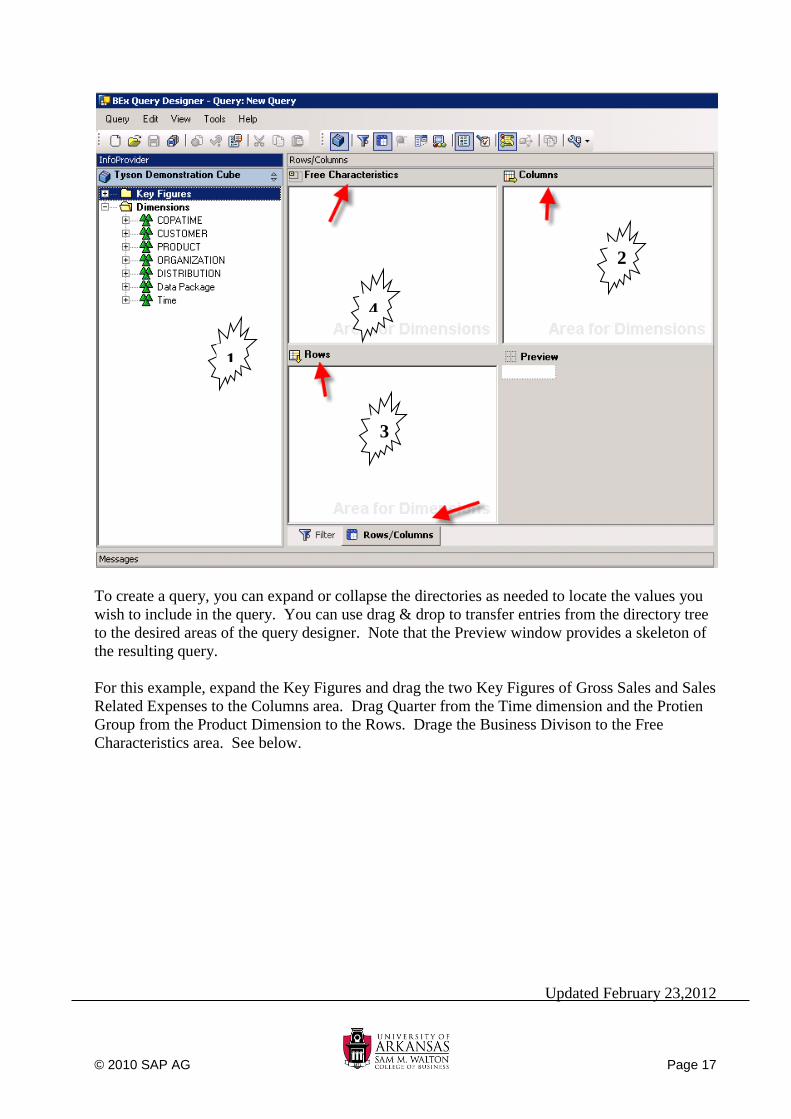
The Query Designer is divided into six sub areas:
1. Directory tree of the selected InfoCube
All available objects (key figures and dimensions) of the infocube display in the directory tree in
the left screen area of the Query Designer.
2. Columns
You define the columns of your report in this area.
3. Rows
You define the rows of your report in this area.
4. Free Characteristics
You transfer those characteristics into the free characteristics area that do not display in the initial
view of the results when you execute the query in the BEx Analyzer or on the Web. You can
then integrate these characteristics into the results through the navigation steps. You can also use
free characteristics for selecting filter values in the report.
5. Filter – see filter tab
The characteristics displayed in the filter appear neither in the drilldown nor as free
characteristics in the query analysis. These characteristics are only used as global filters on the
infocube data—requires clicking the filter tab.
6. Preview
This area provides preview of the query results.
Note the Filter and Rows/Columns tab toward the middle bottom. Ensure that the
Rows/Columns tab is selected.
Updated February 23,2012
© 2010 SAP AG Page 17
To create a query, you can expand or collapse the directories as needed to locate the values you
wish to include in the query. You can use drag & drop to transfer entries from the directory tree
to the desired areas of the query designer. Note that the Preview window provides a skeleton of
the resulting query.
For this example, expand the Key Figures and drag the two Key Figures of Gross Sales and Sales
Related Expenses to the Columns area. Drag Quarter from the Time dimension and the Protien
Group from the Product Dimension to the Rows. Drage the Business Divison to the Free
Characteristics area. See below.
4
2
1
3
1

Updated February 23,2012
© 2010 SAP AG Page 18
To save the query, click the disk on the menu bar. A Save As dialog box opens with provided
name for the Description and Technical name. These names are not meaningful so it is
recommended that you provide a meaningful description and Technical name. For this example,
AMCIS1 is used for both the description and technical name. Click the Save Button after
entering desired descrption and name.
To analysze the results of the query, open the Analyzer (StartAll ProgramsBusiness
ExplorerAnalyzer) which is an Excel spreadsheet with an Add-Ins tool bar. Click Add-Ins on
the main menu. You should have a spreadsheet similar to the following.
Updated February 23,2012
© 2010 SAP AG Page 19
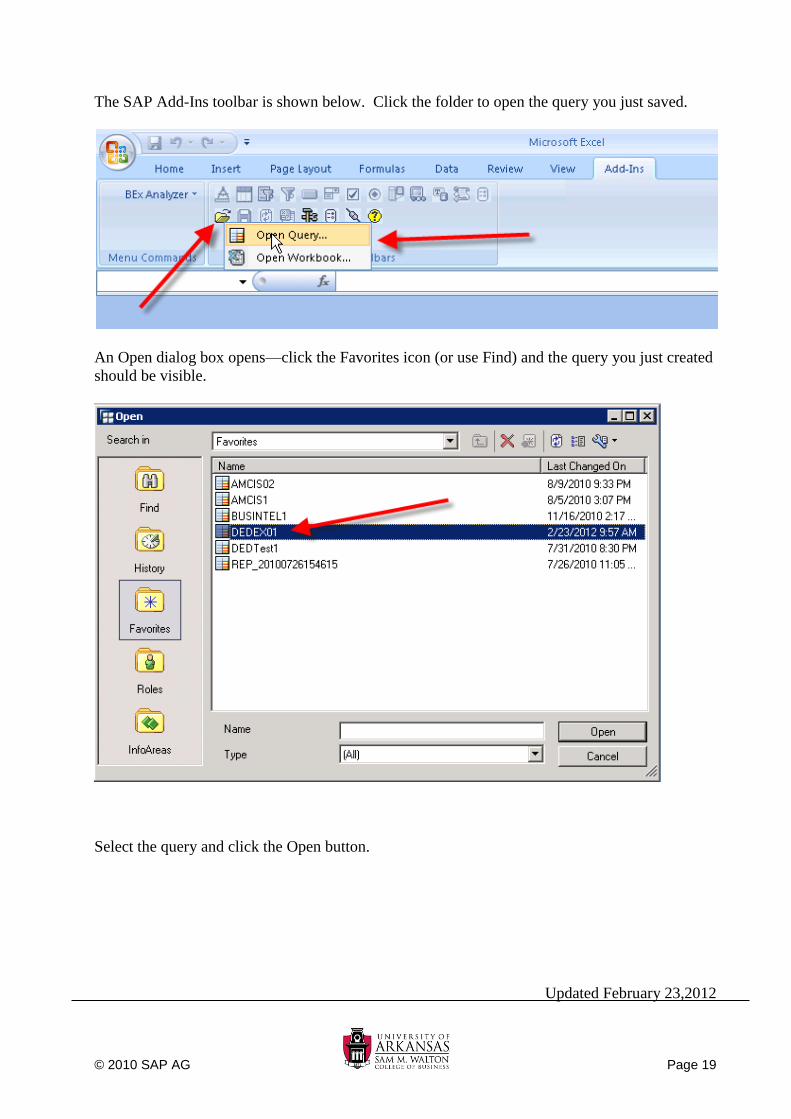
The SAP Add-Ins toolbar is shown below. Click the folder to open the query you just saved.
An Open dialog box opens—click the Favorites icon (or use Find) and the query you just created
should be visible.
Select the query and click the Open button.

Updated February 23,2012
© 2010 SAP AG Page 20
The query is then run with results shown below.
Click the filter button. A filter panel is populated to the left; right-click Business Division and
select the drill down option shown.
A portion of the resulting output is shown below.

Updated February 23,2012
© 2010 SAP AG Page 21
To remove the Drilldown, right-click Business Divsion in the Filter and select Remove
Drilldown. Note that this is an Excel spreadsheet so you can manipulate the data as desired—for
example, you could add a column that subtracts the SALES RELATED EXPENSES from
GROSS SALES.
Final notes:
To change a query, simply go to the Query Designer and open the Query you wish to alter
To analyze the altered query, simply open the named query in the Analyzer