Embed Size (px)
Citation preview
This information is confidential and was prepared by Bain & Company solely for the use of our client; it is not to be relied on by any 3rd party without Bain's prior written consent
Business Case 02

This information is confidential and was prepared by Bain & Company solely for the use of our client; it is not to be relied on by any 3rd party without Bain's prior written consent
2Graficos_Business Case02SAO
Case 1
ChemicalCo
Version A

This information is confidential and was prepared by Bain & Company solely for the use of our client; it is not to be relied on by any 3rd party without Bain's prior written consent
3Graficos_Business Case02SAO
ChemicalCo case overview (1/2)
Version A
Situation overview
• ChemicalCo is the leading producer of Chemical_A in Brazil and its only competitor, EveryChemCo, has less than half the capacity of ChemicalCo
• Since the prices and margin of Chemical_A are shrinking, ChemicalCo is looking for opportunities to grow in adjacencies of the core business
• ChemicalCo’s executives found three interesting opportunities:
1. Consolidate Chemical_1 market
2. Build a Chemical_2 plant
3. Produce Chemical_3
• However there is no consensus among the executives about the viability of these project and their right prioritization
• ChemicalCo executives asked Bain to help them evaluate these opportunities and design a new strategic plan with clear priorities

This information is confidential and was prepared by Bain & Company solely for the use of our client; it is not to be relied on by any 3rd party without Bain's prior written consent
4Graficos_Business Case02SAO
Project 1OtherOther
+
R. Materials
Chemical_1
Current scope of ChemicalCo
Note: Every chemical product in this case is hypotetical
ChemicalCo case overview (2/2)
Version A
+
RMaterial_1
RMaterial_2
Chemical_A
Project 2
+
RMaterial_3
Chemical_2
Project 3
+
RMaterial_4
RMaterial_5
Chemical_3
ILLUSTRATIVE

This information is confidential and was prepared by Bain & Company solely for the use of our client; it is not to be relied on by any 3rd party without Bain's prior written consent
5Graficos_Business Case02SAO
Graph 1 – Chemical_1 producers’ EBITDA X Relative Market Share
EBITDA = Earnings before interest, taxes. depreciation and amortizationRMS = relative market share
If company is market leader RMS = company’s market share / second player’s market shareIf company isn’t market leader RMS = company’s market share / leader’s market share
PROJECT 1

This information is confidential and was prepared by Bain & Company solely for the use of our client; it is not to be relied on by any 3rd party without Bain's prior written consent
6Graficos_Business Case02SAO
Graph 2 – Consumption of Chemical_A by Chemical_1 producers
kty = 1000 ton per year
PROJECT 1

This information is confidential and was prepared by Bain & Company solely for the use of our client; it is not to be relied on by any 3rd party without Bain's prior written consent
7Graficos_Business Case02SAO
Graph 3 – Project of a new Chemical_2 plant
kty = 1000 ton per yearNote: All other variable costs are negligible compared to raw material
+
Local price:$1.5k/ton
Local price:$1.0k/ton
Fixed costs = US$14M/year
Chemical_A(18 kty)
RMaterial_3(14 kty)
Chemical_2(28 kty)
PROJECT 2
Raw Material Production

This information is confidential and was prepared by Bain & Company solely for the use of our client; it is not to be relied on by any 3rd party without Bain's prior written consent
8Graficos_Business Case02SAO
Graph 3 – Chemical_2 import/export parity prices
Brazil
Most important Chemical_2
producer
International price$2.0k/t
Import parityprice
$____k/t
Export parityprice
$1.5k/t
• Import Parity Price (IPP): the value of a unit of product bought from a foreign country, valued at a geographic location of interest in the importing country (i.e. IPP = International_Price plus shipping plus taxes plus insurance)
• Export Parity Price (XPP): the value of a product sold at a specific location in a foreign country, but valued from a specific location in the exporting country (i.e. International_Price = XPP plus shipping plus taxes plus insurance)
$0.5k/t
$0.4k/t
10%
6.66%
Note 1: Insurance costs can be ignoredNote 2: Taxes apply only over good’s price, not over shipping costs
PROJECT 2

This information is confidential and was prepared by Bain & Company solely for the use of our client; it is not to be relied on by any 3rd party without Bain's prior written consent
9Graficos_Business Case02SAO
Graph 5 –Interviews about Chemical_3 market
• Chemical_3 consumes most of EveryChemCo’s Chemical_A production. This only happens because we cannot be competitive in Chemical_3 without a local sourcing of RMaterial_5
• We already tried a few times to get this sourcing agreement, but we never had success in this negotiation
• I think we should buy EveryChemCo. This is the easiest way to access the sourcing agreement of RMaterial_5
ChemicalCoexecutive
Marketspecialist
• The local market is not able to consume the total Chemical_A production of ChemicalCoand EveryChemCo, so both companies have to export part of their production, which pressures local prices
• The only reason why ChemicalCo exports more than EveryChemCo is the competitive disadvantage in Chemical_3
• I’m pretty sure that this sourcing agreement is a short term contract and must be renewed every year
PROJECT 3

This information is confidential and was prepared by Bain & Company solely for the use of our client; it is not to be relied on by any 3rd party without Bain's prior written consent
10Graficos_Business Case02SAO
Graph 6 – Viable production of Chemical_3 in ChemicalCo current facilities
Note: All other costs are negligible
+1,0
0,6
0,3
0,3
Local price:$1.0k/ton
IPP:$2.0k/ton
Local price:$2.0k/ton
Local price:$3.0k/ton
PROJECT 3
Chemical_A
RMaterial_4
RMaterial_5
Chemical_3

This information is confidential and was prepared by Bain & Company solely for the use of our client; it is not to be relied on by any 3rd party without Bain's prior written consent
11Graficos_Business Case02SAO
Graph 7 – Prioritization matrix
Return on Capital
EBITDA = Earnings before interest, taxes. depreciation and amortization
This information is confidential and was prepared by Bain & Company solely for the use of our client; it is not to be relied on by any 3rd party without Bain's prior written consent
12Graficos_Business Case02SAO
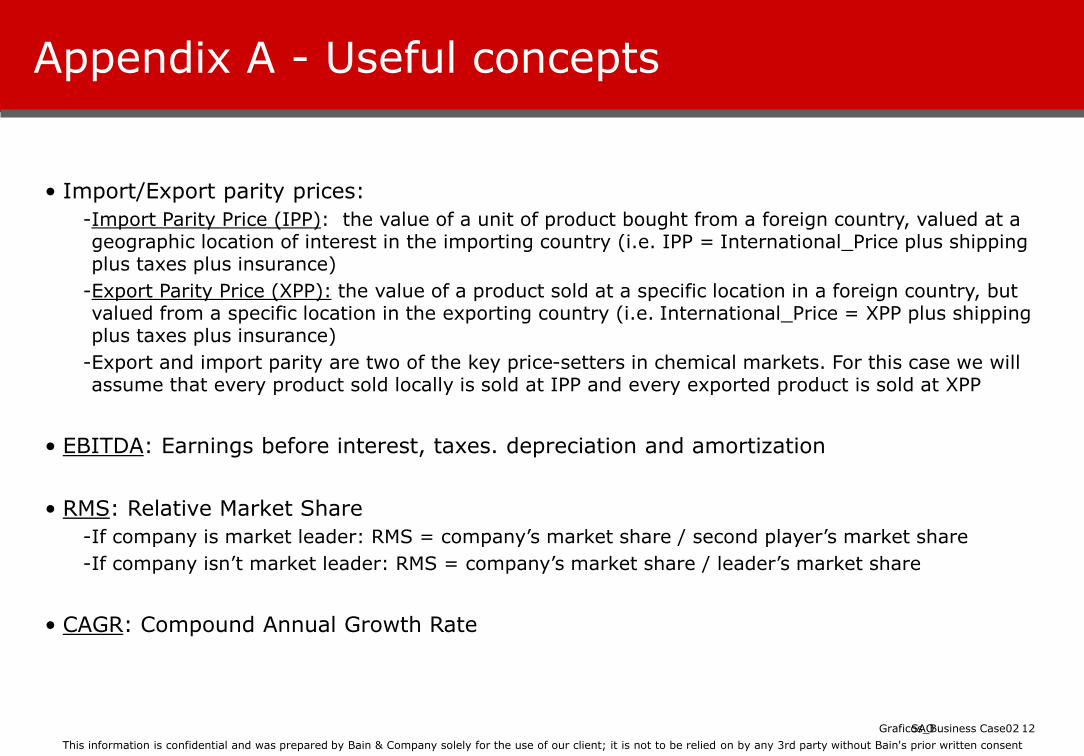
Appendix A - Useful concepts
• Import/Export parity prices:
-Import Parity Price (IPP): the value of a unit of product bought from a foreign country, valued at a geographic location of interest in the importing country (i.e. IPP = International_Price plus shipping plus taxes plus insurance)
-Export Parity Price (XPP): the value of a product sold at a specific location in a foreign country, but valued from a specific location in the exporting country (i.e. International_Price = XPP plus shipping plus taxes plus insurance)
-Export and import parity are two of the key price-setters in chemical markets. For this case we will assume that every product sold locally is sold at IPP and every exported product is sold at XPP
• EBITDA: Earnings before interest, taxes. depreciation and amortization
• RMS: Relative Market Share
-If company is market leader: RMS = company’s market share / second player’s market share
-If company isn’t market leader: RMS = company’s market share / leader’s market share
• CAGR: Compound Annual Growth Rate

This information is confidential and was prepared by Bain & Company solely for the use of our client; it is not to be relied on by any 3rd party without Bain's prior written consent
13Graficos_Business Case02SAO
Case 2
RetailCo
Version A

This information is confidential and was prepared by Bain & Company solely for the use of our client; it is not to be relied on by any 3rd party without Bain's prior written consent
14Graficos_Business Case02SAO
Situation overview
• The retail market for furniture and home appliances showed strong growth in the last years, accompanied by consolidation driven by major players
• RetailCo is a regional retail company with operations in four states of Brazil
• RetailCo holds a strong position in the markets it serves, however, it does not have the same scale as the major national players, which seek to expand their markets
• Moreover, in recent years, RetailCo presented weak results on important operating metrics, such as EBITDA and sales/m2
• RetailCo hired Bain to help them improve operating metrics and define its long term strategy
RetailCo case overview

This information is confidential and was prepared by Bain & Company solely for the use of our client; it is not to be relied on by any 3rd party without Bain's prior written consent
15Graficos_Business Case02SAO
Graph 1 – Retail market over time and market breakdown by players over time

This information is confidential and was prepared by Bain & Company solely for the use of our client; it is not to be relied on by any 3rd party without Bain's prior written consent
16Graficos_Business Case02SAO
Graph 2 – Sales over time for RetailCo and competitors

This information is confidential and was prepared by Bain & Company solely for the use of our client; it is not to be relied on by any 3rd party without Bain's prior written consent
17Graficos_Business Case02SAO
* RMS = relative market share• If company is market leader RMS = company’s market share / second player’s market share• If company isn’t market leader RMS = company’s market share / leader’s market share
Graph 3 – Retail market breakdown, by player and by state

This information is confidential and was prepared by Bain & Company solely for the use of our client; it is not to be relied on by any 3rd party without Bain's prior written consent
18Graficos_Business Case02SAOObs.: sales area does not include back-office and inventory areas
Graph 4 – Sales per square meter
m2/store
Sales area/Total area

This information is confidential and was prepared by Bain & Company solely for the use of our client; it is not to be relied on by any 3rd party without Bain's prior written consent
19Graficos_Business Case02SAO
COGS = Cost Of Goods SoldOperating expenses = Selling, General and Administrative Expenses (SG&A)EBITDA = Earning Before Interest, Taxes, Depreciation and Amortization
Graph 5 – Sales breakdown by player

This information is confidential and was prepared by Bain & Company solely for the use of our client; it is not to be relied on by any 3rd party without Bain's prior written consent
20Graficos_Business Case02SAO
Graph 6 – Brazilian market: EBITDA X Relative Market Share (RMS)
2009
EBITDA = Earning Before Interest, Taxes, Depreciation and AmortizationRMS = relative market share
• If company is market leader RMS = company’s market share / second player’s market share• If company isn’t market leader RMS = company’s market share / leader’s market share
This information is confidential and was prepared by Bain & Company solely for the use of our client; it is not to be relied on by any 3rd party without Bain's prior written consent
21Graficos_Business Case02SAO
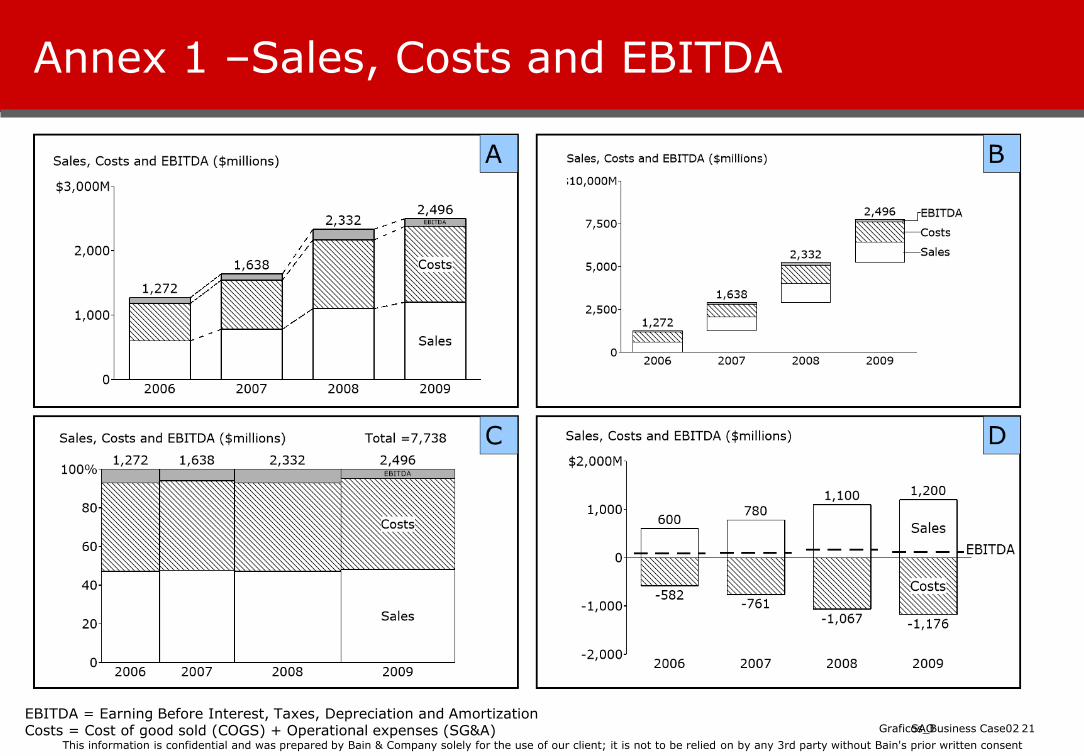
Annex 1 –Sales, Costs and EBITDA
EBITDA = Earning Before Interest, Taxes, Depreciation and AmortizationCosts = Cost of good sold (COGS) + Operational expenses (SG&A)