Embed Size (px)
Citation preview

0
FACULTY OF TECHNOLOGY
BUSINESS CASE SALES PLANNING CONCEPT
FOR NEW PRODUCTS AND PRODUCT
PORTFOLIO
Tatu Kokkonen
INDUSTRIAL ENGINEERING AND MANAGEMENT
Master’s Thesis
September 2017

1
FACULTY OF TECHNOLOGY
BUSINESS CASE SALES PLANNING CONCEPT
FOR NEW PRODUCTS AND PRODUCT
PORTFOLIO
Tatu Kokkonen
Supervisors: Arto Tolonen, Harri Haapasalo
INDUSTRIAL ENGINEERING AND MANAGEMENT
Master’s Thesis
September 2017

2
ABSTRACT
FOR THESIS University of Oulu Faculty of Technology Degree Programme (Bachelor's Thesis, Master’s Thesis) Major Subject (Licentiate Thesis)
Industrial engineering and management
Author Thesis Supervisor
Kokkonen, Tatu Petteri Haapasalo H, professor
Tolonen A, D. Sc. (Tech)
Title of Thesis
Business case sales planning concept for new products and product portfolio
Major Subject Type of Thesis Submission Date Number of Pages
Product management Master’s Thesis September 2017 81 + 7
Abstract
Companies are demanded to introduce new products to market in order to satisfy diverse customer needs and be
competent in relation to competitors. In addition to traditional, full-scale new product development (NPD), lighter
development models have recently been researched. Rapid product development (RaDe) is a new agile product
development model aiming to aid companies to adjust quickly to changing customer needs. Whether new products
are introduced by lengthy NPD or quick and agile RaDe, it should be ensured that development activities are aligned
with company strategy and that new products enhance the overall profitability of the company.
Business case analysis investigates the business value of a new product initiative. Generally, market assessment
inputs estimations of market potential and attractiveness into the business case analysis and thus functions as the
basis for anticipated sales volumes and sales prices. Expected revenues are compared with life cycle cost predictions
in order to conduct financial analysis presenting the attractiveness of the new product initiative in chosen financial
metrics. However, there is a lack of business case analysis methodology on product portfolio level, and this study
seeks to address this research gap.
This research is an explorative and qualitative case study using constructive approach. The results of this study
include a concept for calculating financial metrics for new sales item so that product portfolio level changes in sales
are taken into account. The developed concept seeks to be eligible for NPD- and RaDe-contexts alike. The essence
of the concept is comparison of the anticipated net cash flows for the sales items that are affected by the new item’s
introduction in two scenarios. In first scenario, it is assumed that the new item is not introduced at all and the
anticipated net cash flows are calculated based on that assumption over the new item’s life cycle. The second scenario
calculates the net cash flows for the affected items taking into account the likely impact the new item has on the sales
of those items. The differences of net cash flows between these two scenarios are taken into account as a cash outflow
or inflow for corresponding time period when calculating net cash flow based financial metrics for the new sales
item.
In addition, this study introduces a proposition of a concept for product portfolio level sales planning and follow-up.
In this concept, the sales plan consists of the planned sales volumes and the planned sales prices for individual sales
items. Both target setting and follow-up of actual execution should be implemented on the level of volume and price
so that the unit of planning is revenue (volume * price). Targeted and actual sales figures for individual sales items
are further rolled up to upper commercial product portfolio levels. This enables analysis and comparison of targeted
and actual sales performance on each product portfolio level.
Additional Information

3
TIIVISTELMÄ
OPINNÄYTETYÖSTÄ Oulun yliopisto Teknillinen tiedekunta Koulutusohjelma (kandidaatintyö, diplomityö) Pääaineopintojen ala (lisensiaatintyö)
Tuotantotalous
Tekijä Työn ohjaaja yliopistolla
Kokkonen, Tatu Petteri
Ta
Haapasalo H, professori
Tolonen A, TkT
Ha
,
Työn nimi
Business casen myyntisuunnittelukonsepti uusille tuotteille ja tuoteportfoliolle
Opintosuunta Työn laji Aika Sivumäärä
Tuotehallinta Diplomityö Syyskuu 2017 81 + 7
Tiivistelmä
Yritykset joutuvat esittelemään uusia tuotteita markkinoille tyydyttääkseen moninaiset asiakastarpeet ja pitääkseen
itsensä kilpailukykyisenä suhteessa kilpailijoihin. Perinteisen, täyden mittakaavan tuotekehityksen (New Product
Development – NPD) lisäksi hiljattain on tutkittu kevyempiä ja nopeampia tuotekehitysmalleja. Nopea tuotekehitys
(Rapid Product Development – RaDe) on yksi tällaisista ketteristä tuotekehitysmalleista. Se pyrkii auttamaan
yrityksiä vastaamaan uusiin asiakasvaatimuksiin nopeasti. Riippumatta siitä, kehitetäänkö uusi tuote täysimittaisella
tuotekehityksellä vaiko nopealla tuotekehityksellä, tärkeää on varmistaa että kehitettävä tuote on yrityksen strategian
mukainen ja todennäköisesti parantaa yrityksen kokonaistuottavuutta.
Business case analyysi arvioi uuden tuoteidean liiketoiminnallista arvoa. Markkina-analyysi tuottaa yleisen
markkinapotentiaaliarvion business case analyysiin ja toimii näin pohjana odotetuille myyntivolyymeille ja -
hinnoille. Uuden tuotteen arvioitua liikevaihto verrataan tuotteen oletettuihin elinkaarikustannuksiin, ja tämän
pohjalta koostetaan taloudellinen analyysi, joka havainnollistaa uuden tuoteidean attraktiivisuutta valituin
taloudellisin tunnusluvuin. Tuoteportfolio tason business case metodologiaa ei kuitenkaan ole saatavilla, ja tämä
tutkimus pyrkii täydentämään tätä puutetta.
Tämä diplomityö on eksploratiivinen ja kvalitatiivinen case-tutkimus, jossa on konstruktiivinen ote.
Tutkimustulokset sisältävät konseptin taloudellisten tunnuslukujen laskemiselle uudelle tuotenimikkeelle siten, että
portfoliotason muutokset myynnissä otetaan huomioon. Kehitetty konsepti pyrkii olemaan hyödynnettävissä niin
NPD- kuin RaDe-kontekstissa. Konseptin ydin on uuden myyntinimikkeen vaikutuksenalaisena olevien nimikkeiden
nettokassavirtojen vertailu kahden skenaarion välillä. Ensimmäisessä skenaariossa vaikutuksenalaisille nimikkeille
lasketaan nettokassavirrat uuden nimikkeen elinkaaren yli oletuksella, ettei uutta nimikettä tuoda ollenkaan
portfolioon. Toisessa skenaariossa vaikutuksenalaisille myyntinimikkeille lasketaan nettokassavirrat huomioiden
uuden tuotteen todennäköinen vaikutus näiden nimikkeiden myyntiin. Nettokassavirtojen erot näiden skenaarioiden
välillä vähennetään tai lisätään kassavirtana vastaavalle ajanjaksolle, kun lasketaan nettokassavirtoihin perustuvia
tunnuslukuja uudelle nimikkeelle.
Lisäksi tutkimus tarjoaa ehdotuksen menetelmästä tuoteportfoliotason myyntisuunnitteluun ja myynnin seurantaan.
Tässä menetelmässä myyntisuunnitelma koostuu myyntivolyymeistä ja -hinnoista yksittäisille myyntinimikkeille.
Sekä tavoitteenasettelu että tapahtuneen myynnin seuranta tulisi tehdä volyymin ja hinnan tasolla siten että
suunnittelun yksikkö on myyntitulo (volyymi * hinta). Tavoitellut ja toteutuneet myyntiluvut vieritetään edelleen
ylemmille kaupallisen tuoteportfolion tasoille. Tämä mahdollistaa tavoitellun ja toteutuneen myynnin analysoinnin
ja keskinäisen vertailun kullakin tuoteportfoliotasolla.
Muita tietoja

4
ACKNOWLEDGEMENTS
This Master’s Thesis is written as a part of Rapid Development II research project in
Industrial Engineering and Management research unit, University of Oulu. The thesis
project lasted six months, from the beginning of March 2017 to end of August 2017.
I started my Industrial Engineering and Management studies in Fall 2012. Now, five years
have passed and the greatest endeavor of the studies, Master’s Thesis, has been
completed. I want to thank my IEM peers for the fun times we have had at more and less
serious events in and out of studies. IEM students have probably the best team spirit in
the University of Oulu. I have had the privilege to study with motivated, talented and
most of all kind people; for that Optiem has a special place in my heart. My gratitude
belongs also to IEM teaching staff, your contribution from the beginning of my studies
to this very day made the thesis project a lot of easier. Special thanks are directed to Dr.
Arto Tolonen, the primary supervisor of this thesis. Your lectures were motivating,
inspiring and clarified the topics on which I would like to work in future. You provided
knowledge, support and feedback that were essential for this project. Professor Harri
Haapasalo, I want to thank you for choosing me to be the person conducting this study.
Naturally, the greatest gratitude goes to my Family. Mother and father, thank you for your
support in every occasion and for always highlighting the significance of education.
In Oulu, 17.8.2017 Tatu Kokkonen

5
TABLE OF CONTENTS
ABSTRACT
TIIVISTELMÄ
ACKNOWLEDGEMENTS
TABLE OF CONTENTS
ABBREVIATIONS
1 INTRODUCTION ......................................................................................................... 8
1.1 Background ............................................................................................................. 8
1.2 Research scope and objectives ................................................................................ 9
1.3 Research process ..................................................................................................... 9
2 LITERATURE REVIEW............................................................................................. 11
2.1 Product portfolio management .............................................................................. 11
2.2 Product management over life cycle ..................................................................... 12
2.3 New product development .................................................................................... 14
2.4 Rapid product development .................................................................................. 20
2.5 Rapid productization ............................................................................................. 21
2.6 Business cases ....................................................................................................... 22
2.6.1 Definition of a business case ....................................................................... 22
2.6.2 Contents of a business case .......................................................................... 23
2.6.3 Business case analysis in NPD .................................................................... 27
2.6.4 Business case analysis in rapid productization ............................................ 30
2.6.5 Business case analysis for product portfolio ............................................... 32
2.7 Market assessment ................................................................................................ 33
2.7.1 Target market and market segments ............................................................ 33
2.7.2 Market size ................................................................................................... 34
2.8 Sales planning and forecasting .............................................................................. 35
2.8.1 Time horizons and levels of forecast ........................................................... 35
2.8.2 Qualitative forecasting methods .................................................................. 37
2.8.3 Quantitative forecasting methods ................................................................ 39
2.8.4 Rolling forecast ............................................................................................ 42
2.9 Financial analysis .................................................................................................. 42
2.9.1 Net Present Value ........................................................................................ 42
2.9.2 Internal Rate of Return ................................................................................ 43
2.9.3 Comparison of NPV and IRR ...................................................................... 44
2.9.4 Profitability index ........................................................................................ 45

6
2.9.5 Payback method ........................................................................................... 46
2.9.6 Cash flow calculations in NPV context ....................................................... 46
2.10 Life Cycle Costing .............................................................................................. 48
2.10.1 Life cycle costing techniques ..................................................................... 49
2.10.2 Product cost-breakdown structure ............................................................. 51
2.11 Theory synthesis.................................................................................................. 52
3 CURRENT STATE ANALYSES ON CASE COMPANIES ...................................... 55
3.1 Case companies ..................................................................................................... 55
3.2 Current sales planning in case company A ........................................................... 55
3.2.1 Current sales planning practices for existing individual products ............... 56
3.2.2 Current market assessment and sales planning practices for new products 57
3.2.3 Current sales planning practices on product portfolio level ........................ 58
3.3 Current sales planning in case company B ........................................................... 58
3.3.1 Current sales planning practices for existing individual products ............... 59
3.3.2 Current sales planning practices for new products ...................................... 60
3.3.3 Current sales planning practices on product portfolio level ........................ 60
3.4 Empirical synthesis ............................................................................................... 61
4 BUSINESS CASE SALES PLANNING CONCEPT FOR NEW PRODUCTS AND
PRODUCT PORTFOLIO ........................................................................................... 63
4.1 Defining portfolio effects of new sales item ......................................................... 63
4.2 Base-Case Scenario analysis for affected sales items ........................................... 64
4.3 Base-Case scenario analysis and new sales item related business case ................ 65
4.4 Product portfolio level sales planning and follow-up concept .............................. 67
5 CONCLUSION ............................................................................................................ 71
5.1 Research results ..................................................................................................... 71
5.2 Theoretical contribution ........................................................................................ 73
5.3 Managerial implications ........................................................................................ 73
5.4 Validity and reliability .......................................................................................... 74
5.5 Future research ...................................................................................................... 75
REFERENCES ................................................................................................................ 76
APPENDIXES:
Appendix 1. Interview questionnaire
Appendix 2. Excel template for product portfolio level sales planning and follow-up

7
ABBREVIATIONS
BCA Business Case Analysis
CRM Customer Relations Management
CTO Chief Technical Officer
IRR Internal Rate of Return
ISACA Information Systems Audit and Control Association
LCC Life Cycle Costing
NPD New Product Development
NPV Net Present Value
PLPM Post-Launch Product Management
PPM Product Portfolio Management
RaDe Rapid Development
R&D Research and Development
SAM Served Available Market
SCM Supply Chain Management
SOM Share of Market
TAM Total Available Market

8
1 INTRODUCTION
1.1 Background
Companies are demanded to develop new products in order to satisfy diverse customer
needs and maintain strong market positions (Ulrich & Eppinger, 2008). New product
development (NPD) is meant to address this demand (Cooper, 2001; Ulrich & Eppinger,
2008). Traditional NPD, however, may be too consuming in terms of time and resources
considering that sales should be able to quickly adjust to changing customer needs and
upcoming business possibilities. Rapid development concept (RaDe) addresses this
challenge. According to Vigna et al. (2015), RaDe is defined to be a customer request -
originated, unexpected and incremental product development project constrained by the
critical time limit. The objective of a rapid development is to inexpensively and quickly
redesign or upgrade existing products in order to correspond to market demands or cost
reduction objectives (Vigna et al., 2015).
Cooper (2001) presents product portfolio management targets to be value maximization,
strategic fit and portfolio balance. Tolonen et al. (2015) furthermore state that companies
should ensure the strategic fit and profitability of their development activities. This should
be the case regardless of the magnitude of the development project. According to Otto
and Wood (2001), a business case is conducted in the early stages of a development
project to analyze whether or not certain new product initiative is a feasible target of
investment or not. Kinnunen et al. (2014) specify that business case analysis’ target is to
evaluate the business value of a considered investment.
Among others, Kinnunen et al. (2011) and Ulrich and Eppinger (2008) mention taking
into account product portfolio level effects when doing business case calculations in NPD
context. However, there is research gap on product portfolio level business case analysis
and sales planning methodology. Clear practices are not available. This study proposes a
concept for calculating key financial metrics for new sales item so that portfolio level
effects are taken into consideration. In addition, it is proposed how sales planning should
be executed on product portfolio level.

9
1.2 Research scope and objectives
This research analyzes the business case calculation methods focusing on related sales
planning. Basic business case methods, tools and processes will be introduced by a
literature review. Case companies’ sales planning procedures in NPD and RaDe projects
and on commercial product portfolio level will be investigated by interviews. Based on
existing research and case company interviews, a concept for product portfolio level sales
planning is developed along with a concept for business case calculations for individual
new sales item taking into account product portfolio level effects.
The objective of the study is to answer to following research questions:
RQ1: What are the main methods and principles for business case calculations for new
product development, rapid development, and product portfolio according to earlier
research?
RQ2: How is business case related sales planning currently executed in case companies
for individual new products and product portfolio?
RQ3: How should the business case calculations be done for individual new products and
product portfolio?
In this study, the cost modeling part of the business case analysis is left for less attention.
Research scope is more on the side of sales planning, especially in the empirical and
results part of the study.
1.3 Research process
This study is a qualitative case study. The research approach is explorative and
constructive in nature. In the first phase of the research, a theoretical understanding of
business case calculations is built based on literature review. In addition, the study
included conducting a semi-structured interview questionnaire, which was sent in
advance to interviewees in order to support their preparation. Interviews were performed
in co-operation with another student conducting a study on NPD and RaDe related
performance management. In total, four business managers were interviewed in two
companies. The interviews were recorded to ensure accuracy and thorough analysis when

10
concluding results. Interview analysis seeks to provide a general understanding of NPD
and RaDe related sales planning practices in case companies on the level of individual
sales items and product portfolio.
Figure 1. The research process.
11
2 LITERATURE REVIEW
2.1 Product portfolio management
A product portfolio of a company consists of company’s all products which can be
categorized based on different viewpoints such as technology generations, customer
segments, product families or product types (Kropsu-Vehkaperä & Haapasalo, 2011).
Sääksvuori and Immonen (2008) categorize products as follows: tangible products and
goods, service products and intangible products. Cooper et al. (1999) define product
portfolio management as a dynamic decision process in which an organization’s list of
ongoing projects is continuously revised and updated. In this process evaluation, selection
and prioritization of new projects take place and existing projects may be killed, advanced
or reprioritized. Cooper et al. (1999) emphasize that portfolio management is about
making decisions of strategic importance. Such decisions are, for example, which types
of markets, products and technologies the company should focus on. Weerd et al. (2006)
summarize product portfolio management as an approach in which new product
development (NPD) strategies and product life cycle management take place at the
portfolio level.
The three main targets for product portfolio management (PPM) are portfolio value
maximization, strategic fit and portfolio balance. Value maximization addresses the
profitability of portfolio in monetary terms. Existing products and new products
introduced to the portfolio should thereby be feasible in terms of chosen KPIs such as
expected commercial value, sales turnover, gross margin and net present value (NPV). In
strategic fit viewpoint, existing products and new product development activities should
be aligned with business strategy. Portfolio balance can be assessed, among others, in
terms of percentages of high and low-risk projects and products, the balance of long term
and short term products and -development projects, and portfolio size. (Cooper et al.,
1997)
Tolonen et al. (2014) divide product portfolio to commercial and technical product
portfolios. Basically, commercial product portfolio represents the offering a certain
company has for its customers. The commercial portfolio can be structured hierarchically
into levels such as solution-, product family-, configuration- and sales item –level
(Tolonen et al., 2014). Figure 2 illustrates this structure. Depending on the company’s

12
product portfolio, a commercial product portfolio can include different numbers of
portfolio levels. The lowest, sales item –level connects commercial product portfolio to
technical product portfolio. The whole technical portfolio of a company includes all the
components, platforms, modules, subassemblies and assemblies which a company utilizes
to implement the whole offering of the commercial product portfolio. (Tolonen et al.,
2014).
Figure 2. Illustration of commercial and technical product portfolio structure (modified from
Tolonen et al., 2014).
2.2 Product management over life cycle
Product management can be seen as “holistic business management of the product” taking
place from the conceiving of the product idea to the withdrawal of the product from the
market (Haines, 2014). Tolonen (2016) defines product management as an organizational
function focusing on forecasting, planning and marketing of a product or products that
takes place at all product life cycles. The target of product management is to maximize
value creation of a product over its life cycle (Haines, 2014). Tolonen (2016) brings out

13
product management objectives such as sales revenue-, market share- and profit margin
maximization.
Product life cycles can be categorized differently depending on the standpoint. In
marketing viewpoint, the four staged market-oriented life cycle of product introduction,
growth, maturity and decline is commonly used. Users of a product, on the other hand,
can see a product’s life cycle as follows: imagination, definition, realization, use and
disposal. For a manufacturer of a product, last two phases in the life cycle are
corresponding “support” and “retirement”. (Stark, 2015)
Tolonen et al. (2014) suggest a four-phase classification of product life cycles on product
portfolio level. This life cycle classification consists of “NPD, maintain, warranty and
archive”. Warranty phase contains spare part and service operations, and archive stage is
about maintaining product data of removed products based on legal requirements
(Tolonen et al., 2014).
Haines (2014) presents a product management life cycle model including four main areas
of work (Figure 3). As a summary, a product flows from discovery and innovation to
post-launch management, and this process includes phases and gates that are illustrated
below the four areas of work in figure 3. Since NPD-related areas of work will be
discussed in detail in chapter 2.3, only post-launch product management is further
explained here.
Figure 3. Product management life cycle model and areas of work (modified from Haines, 2014).
Post-launch product management (PLPM) is about monitoring and optimizing the
performance of the products within overall company strategy. PLPM is characterized by
the strategic management of services and products. For example changes to marketing
mix (product, price, promotion, channels) can be executed in order to enhance

14
performance. Information collection and activities based on that information are a vital
part of PLPM. (Haines, 2014)
2.3 New product development
Ulrich and Eppinger (2008) state that the financial success of most companies is
dependent on the firm’s capability to identify needs and desires of customers and to
answer accordingly by developing and manufacturing products matching these needs.
Härkönen et al. (2015) state that a product is “a suitable combination of tangible and
intangible elements that constitute an offering that can be sold to customers to satisfy
their needs”. Kropsu-Vehkaperä (2012) views a product as software, hardware or a
combination of both. Product development is a set of activities that originate from the
perception of a market opportunity and end up with production, sales and delivery of a
product (Ulrich & Eppinger, 2008). Chapter 2.3 introduces the concept of NPD and
processes included. This is a basis for later sections discussing business cases; NPD is a
common context for conducting a business case.
Ulrich and Eppinger (2008) have conducted a widely accepted NPD tool called “Generic
Development Process”. This tool can be viewed as a sequence of activities which are
performed to conceive, design and commercialize a product. A well-defined, structured
NPD process is important for quality assurance, coordination, planning and management
of a development project. Moreover, thorough documentation of an NPD process builds
the capability to identify improvement opportunities for later projects (Ulrich & Eppinger,
2008). General development process consists of six phases as follows:
0) Planning
1) Concept development
2) System-level design
3) Detail design
4) Testing and refinement
5) Production ramp
The focus in Ulrich and Eppinger’s (2008) generic development process is in tangible,
physical products. However, with certain reservations, it can be used generally. Table 1

15
summarizes the activities for different business functions in each of six development
process phases. In this Master’s Thesis, especially marketing and financial aspects in
phases 0 – 2 are relevant.
Table 1. General development process and related activities by business functions (Ulrich &
Eppinger, 2008).
Another well-known NPD framework is Stage-Gate by Cooper (2001). Stage-Gate is an
operational and conceptual model for transferring product ideas to launch. As such, it is
a blueprint improving effectiveness and efficiency of a product innovation process
(Cooper, 2008).
Stage-Gate makes an innovation process more tangible by dividing it into stages and
gates. Stages consist of predetermined, cross-functional activities that take place within
the stage. Each stage is entered to through a gate which functions as a quality control of
the process. (Cooper, 2001). Gates ensure the selection of right projects and that they are
carried out in a right way (Cooper & Edgett, 2012). Based on predefined, documented
criteria (Cooper & Edgett, 2008), a go/kill/hold/recycle -decision defines if some certain
project is advanced further in the development process, killed, returned to the previous

16
stage, or hold at the gate (Cooper, 2001). The Stage-Gate process is illustrated in figure
4.
Figure 4. Stage-Gate process with discovery and post-launch review (modified from Cooper,
2001).
Discovery: This stage is the pre-work intended to identify new product ideas and market
opportunities. In many companies, ideation is considered so important that it is treated as
a formal stage in the NPD process. Accordingly, defined idea generation and –capture
systems might be in place. Related activities are for example technical research, lead user
co-operation in order to identify unarticulated needs and market examinations to identify
opportunities.
Gate 1: Idea Screen: This gate is where a certain project is born. First decision to address
resources to a project takes place at idea screen. Criteria based on for instance strategic
fit, market attractiveness and technical feasibility decide whether a project initiative
passes the gate.
Stage 1: Scoping: The objective of this stage is to determine technical and marketplace
merits of a project. Preliminary market assessment is carried through. It consists of a few
inexpensive activities such as Internet search, contacts with key users and focus groups
and perhaps a quick concept test with few potential users. A preliminary technical
assessment is executed concurrently. The objective is to estimate feasibility in
manufacturing and operations point of view, evaluate possible costs and preconditions for
realizing a new product and to map technical, legal and regulatory risks and obstacles.

17
Normally efforts in Stage 1 are limited, and scoping is performed by a team of just several
persons depending on the size of the project.
Gate 2: Second Screen: Gate 2 is more restrictive than the previous one, and re-evaluation
based on new information obtained in Stage 1 takes place. The project is reflected in
predetermined must-meet and should-meet criteria. More criteria based on data gathered
in Stage 1 might be added. The possible financial return is shortly estimated in Gate 2. If
the project passes Gate 2, it proceeds to a phase of heavier spending.
Stage 2: Building the Business Case: In this stage, the business case is conducted. As a
stage of the detailed investigation, Stage 2 should clearly define the product and the
attractiveness of the project before even pricier development activities are initiated.
Target markets, product positioning strategy, exact benefits of the product and a value
proposition are defined. Market investigations and research are performed to identify
customer’s needs and preferences. Competitive analysis is also performed. A detailed
technical appraisal takes into consideration the ability to realize the product. Customer
needs are transformed into a solution that is feasible technically and economically.
Manufacturability, sources of supply and related costs are investigated. In order to
eliminate risks, assessment of legal, regulatory and patent issues are undertaken if needed.
A detailed business- and financial analysis is a crucial part of Stage 2. The project is
justified among others by estimated discounted cash flows and performing sensitivity
analysis. Stage 2 is remarkably more laborious than Stage 1, and inputs from multiple
sources are needed. Thus a team of cross-functional professionals is recommendable to
execute the stage.
Gate 3: Go to Development: Gate 3 is the last point in which project can be withdrawn
before substantial spending. Activities carried out in Stage 2 are reviewed and it is ensured
that a business case takes into account all required standpoints and the justification for a
project is robust. Predetermined must-meet and should-meet criteria are once again used
to judge the project. As a go-decision in Gate 3 leads to a commitment to heavy spending,
the reviewing of financial analysis is a vital part of the gate. Additionally, development
plan and preliminary operations- and marketing plans are to be reviewed and approved.
Commitment to product definition must also be obtained before advancing to the
following stage. Furthermore, the full empowered cross-functional project team headed
by a competent leader is assigned.

18
Stage 3: Development: This stage includes the implementation of the development plan
and the physical product development. The focus at Stage 3 is on technical work, but
marketing and operations activities are still performed concurrently. For instance, market
launch plans, production plans and manufacturing equipment requirements are defined.
In long projects, various development milestones and reviews in checkpoints are included
in the development plan, yet go/kill decisions take no place. Different tests assure that the
product under development meets requirements. Financial analysis is updated and
regulatory issues, legal constraints and patent matters are further resolved. The
deliverable output from Stage 3 is a laboratory tested prototype.
Gate 4: Go to Testing: The progress of the project and continued attractiveness of the
product is ensured along with verifying that the development has been done in agreed
quality fashion. The product is reflected to the originally specified definition in Gate 3
and it is confirmed that consistency exists between agreed initial definition and the work
performed. Economic feasibility is further assured by revising financial analysis with
updated, more accurate data. Testing and validation plans for the following stage are
approved for immediate implementation. Detailed operations and marketing plans should
be reviewed for likely upcoming execution.
Stage 4: Testing and Validation: The viability of the NPD project is tested in all relevant
standpoints. The product itself, manufacturing process, customer acceptance and overall
economics of the project are examined. Testing and validation include activities such as
in-house product tests to check product performance and quality in a laboratory
environment and field trials in order to observe product’s performance and functions in
intended use and to survey potential customer’s reactions and behavior when using the
product. Furthermore, the production process is tested, improved and debugged.
Production costs and production equipment’s throughput performance can also be further
monitored. Different kind of market tests and trial sales activities are advisable to
measure. Stage 4 produces more accurate information of production economics and
market acceptance, which enables revising of business- and financial analysis to ensure
that the project has remained viable in an economic sense. In the case of unsatisfactory
results in Stage 4, the project must be returned to Stage 3 for further development efforts.
Gate 5: Go to Launch: This is the final gate that blocks the project from full-scale
commercialization and production- and operations ramp-up. The project can not be killed

19
at this point. Gate evaluates the quality of testing and validation activities and the results
achieved. Gate criteria concentrate on expected financial return and the adequateness of
operations ramp-up and launch plans. Required plans are reviewed and approved making
them eligible to be implemented in Stage 5.
Stage 5: Launch: In the final stage the marketing launch plan and operations plan are
implemented.
Post-Launch Review: In certain point after commercialization, the NPD project must be
terminated. The product becomes so called “regular product” in company’s product
portfolio, and the development team is disassembled. The success of the project and
product must be reviewed. For the product, the realized costs, revenues, profits and timing
need to be reflected to the initially planned level of performance. Finally, a post-audit is
carried out. It includes assessment of project’s strengths and weaknesses, learning points
from the NPD project and improvement for new NPD-activities to come. Post-audit
review signals the closing of the project. The project team and project leader remain
responsible for the project and product success through the post-launch period, including
the Post-Launch Review.
Cooper (2008) points out that the five-stage Stage-Gate was first used as “one size fits
all” –type of solution for projects of different magnitude. However, minor projects such
as small product modifications and line extensions demand few resources and represent
the majority of projects in terms of quantity. A significant number of projects thus do not
completely fit the full-scale Stage-Gate, but still include risks, require resources, have
constraints and thereby need to be managed. Cooper (2008) presents Stage-Gate
modifications for projects of different size. Stage-Gate must be adjusted to support
business needs and to advance the project lead-times. Figure 5 illustrates the different
scale Stage-Gate processes: Five-stage Stage-Gate for complex and lengthy NPD
projects, Stage-Gate Xpress for moderate risk level projects such as modifications,
improvements and extensions. Finally, Stage-Gate Lite is targeted for noticeably minor
projects like simple customer requests.

20
Figure 5. Different versions of Stage-Gate –model (modified from Cooper, 2008).
2.4 Rapid product development
The full-scale NPD process, as presented among others by Cooper (2001) and Ulrich and
Eppinger (2008), might not be suitable for all kind of NPD needs. Thereby existence of
different approaches targeted to differing product development contexts is crucial. Rapid
product development model (RaDe) strives to be a product development type of
incremental nature. RaDe can be used when it is targeted to do minor NPD activities such
as cost reduction and redesigning or upgrading existing products inexpensively and
quickly. RaDe is an alternative development framework supplementing larger scale NPD
and allows the agile creation of new sales items. (Vigna et al., 2015; Hänninen et al.,
2014).
Vigna et al. (2015) define RaDe projects as unexpected, incremental NPD projects of
critical time frame originating from a customer request. Moreover, Hänninen et al. (2014)
and Vigna et al. (2015) bring out that by main characteristics, RaDe can be summarized
to be a sales driven process including detailed demand from a customer that requires
minimal engineering effort, quick development and a fixed time of delivery.

21
Lohikoski et al. (2014) state that “RaDe type of NPD activities are a common industry
practice even though the concept as such is newly researched by the Product Management
research team of Industrial Engineering and Management Research Unit in University of
Oulu”. Figure 6 demonstrates the scope of RaDe in product portfolio framework.
Figure 6. The scope of rapid development (modified from Tolonen et al., 2014).
2.5 Rapid productization
Hänninen et al. (2012) present one definition of productization to be “the act of modifying
something to become a commercial product”. Furthermore, Hänninen et al. (2012) state
that rapid productization can be seen as a predictable process consisting of preplanned
and well–organized steps that aim to shorten the time used in productization process. In
rapid productization, part of the solution to be sold is created in sales whereas it still
mainly relies on existing product portfolio. The difference between rapid productization

22
and rapid development is that rapid productization generates new product configurations
by combining existing sales items in a new way, thus not affecting the technical portfolio.
Figure 7 illustrates the scope of rapid productization in product portfolio framework. Both
rapid product development and rapid productization are triggered by a customer request
and are critical in time, which makes them similar in business case point of view.
Figure 7. The scope of rapid productization (modified from Hänninen et al., 2012; Tolonen et al.,
2014).
2.6 Business cases
2.6.1 Definition of a business case
Reifner (2001) states that a business case is materials prepared for decision makers in
order to indicate that considered idea is a good one and that it is sensible in financial
viewpoint. This definition declares that business cases are used as means to justify
investments in a certain course of action. In new product development, a business case is

23
conducted in the early stages of the development project to aid decision-making on
whether the project is feasible to invest in or not (Otto & Wood, 2001). Cooper (2011)
views building a business case as a critical homework that has a significant effect on
whether the initiated project will be denied or accepted. According to Kinnunen et al.
(2014), business case analysis’ main target is to demonstrate the true business value of
considered investments in a rational way. Furthermore, Information Systems Audit and
Control Association (ISACA) (2010) highlights that a business case should be capable of
offering a complete, shared understanding of the anticipated business outcomes of an
investment. Assumptions taken should be described, means to measure the validity of
assumptions and expected business outcomes should be offered and steps required in
achieving expected outcomes should be defined (ISACA, 2010). Keen and Digrius (2011)
further specify that a business case is a document written to executive decision makers
presenting the current and future business value and risks related to a certain investment
opportunity.
ISACA (2010) highlights that business cases are frequently treated as one-time
documents which are more or less forgotten once wanted resources have been achieved.
A business case should be considered as an operational tool and as such, it should be
regularly updated in order to evaluate the state of a certain investment through its full
economical life cycle (ISACA, 2010). Sääksvuori and Immonen (2008) also emphasize
the life cycle aspects of a business case. According to them, a product business case is a
tool helping business leaders to make informed life cycle decisions. In this definition, the
life cycle aspect takes into consideration the decisions derived from the relation of a
designed life cycle scenario and the performance of the product in a certain point of the
life cycle.
Based on descriptions of business cases in the literature, it can be stated that a business
case is a document presenting the reasoning for a certain course of action with expected
business outcomes, which is updated and monitored over the whole life cycle of the action.
2.6.2 Contents of a business case
The details considering contents of a business case vary slightly between different authors
but the basic essence is the same. In this chapter, fundamental contents of a business case
are covered.

24
According to Cooper (2001), in NPD framework a business case consists of product
definition, project justification and project plan. Product definition describes what the
developed product will be and for whom it is targeted. The benefits, design requirements
and features of the product and the targeted customer segments should be known and
described. A clear definition of a product needs to be obtained before proceeding further
in the development work. Project justification answers why a company should invest in
some certain project. Part of justification needs to rely on monetary terms such as
financial metrics. However, financial analysis in early phases of consideration is likely to
be inaccurate which is why qualitative matters such as market attractiveness, strategic
questions and competitive advantage must also be taken into account in justification. The
project plan is a component describing by which resources, how and in which timeframe
a new product development project is executed.
ISACA (2010) brings out three fundamental aspects of the full life cycle of a business
case. First, an accurate and comprehensive information at the adequate level of detail
should be achieved. At a minimum, following contents should be included in order to
address this target:
1) The reason for the investment
o The problem or opportunity the investment matches
2) The recommended solution/approach
o Including different considered alternatives and preliminary planned
timetable
3) The business benefits targeted
o How the proposed investment aligns with organization’s strategy, how it
can be measured and which business functions will be responsible for
ensuring strategical alignment and metrics
4) The initial investment and ongoing costs
o Which costs are included in executing a certain investment and costs
further associated with the investment
5) The business changes
o How the proposed investment changes the business and what changes are
needed to implement the investment in a way that secures the targeted
benefits
6) The risks inherent in the approach

25
o Including the risk assessment of not being able to deliver required
capabilities and the risk of not obtaining the targeted business benefits
7) The governance approach for the investment
o How the investment and related matters will be monitored over the
economic life cycle, which metrics are used and who is accountable for
the investment’s value creation
Moreover, ISACA (2010) states that high-level summaries of the detailed program plan,
the resourcing- and financial plan, benefits realization-, change management- and risk
management plans should be included.
Second, ISACA (2010) emphasize the importance of updating the business case as
external or internal events with possible influence on the business occurs. Accordingly,
the business case should be updated in case of changes occurring to projected benefits
and costs of the investment. Third, after the approval of an investment, the related
business case should be used as a primary tool in monitoring the inputs and outputs of the
investment over the full economic life cycle. Adequate decisions should be made by
reflecting the investment’s success to initial plan (ISACA, 2010). Keen and Digrius
(2011) point out that the continuous monitoring of business cases is usually somewhat
insufficient; once the investment is approved, needed resources obtained and the project
completed, the follow-up is neglected.
Schmidt (2009) displays that a business case document should consist of five building
blocks: a) introduction b) methods and assumptions c) business impacts d) sensitivity,
risks and contingencies and e) conclusions and recommendations. Table 2 further
specifies contents within each building block.

26
Table 2. Building blocks of a business case (modified from Schmidt, 2009).
Sääksvuori and Immonen (2008) present that a product business case is a good tool to be
used in estimating and communicating the product’s performance in relation to planned
life cycle performance. Correspondingly, they also state that it should be used to follow-
up and steer the product throughout its life cycle. Figure 8 illustrates scenarios of different
product life cycle performance. This demonstrates the importance of monitoring the status
of a certain business case over its life cycle in order to enable adequate decision-making
and thus either maximize profits or minimize losses.
Figure 8. An illustration of possible life cycle performance scenarios and related actions to take
(modified from Sääksvuori & Immonen, 2008).
As a synthesis, it can be stated that descriptions of business case contents by different
authors include elements that define the proposed project or product, justifies it by
analysis of financial and other matters and presents a plan of some level for implementing
the investment. In addition, ISACA (2010), Keen and Digrius (2011) and Sääksvuori and

27
Immonen (2008) emphasize the use of a business case as a tool to manage investment’s
performance over the life cycle.
2.6.3 Business case analysis in NPD
Cooper (1993, 2001 & 2011) indicates that in NPD context the business case is conducted
in Stage 2: Building the Business Case. Kinnunen et al. (2011) point out that in addition
to Cooper’s (2001) description of business case analysis (BCA) in NPD, there are really
few studies of business cases in new product development context.
According to Cooper (2001), components of a business case are product definition,
project justification and project plan, as described in chapter 2.6.2. Cooper (2001) further
suggests that certain Stage 2 activities function as key blocks from which the final
business plan is conducted. These blocks are user needs-and-wants study, competitive
analysis, market analysis, detailed technical assessment, concept testing,
financial/business analysis and plans of action. Figure 9 clarifies the dependencies of
different key blocks in business case building process.
Figure 9. Key Blocks in Stage 2: Building the Business Case (modified from Cooper, 2001).
Kinnunen et al. (2011) contribute to NPD related business case studies by conducting a
specific procedure for business case analysis in NPD. In their study (2011), decision gate
criteria from the literature are extracted and business case attributes are established based
on that criteria. Attributes are further classified to elements of market assessment,
technical assessment, financial analysis and strategic fit.
28
According to Kinnunen et al. (2011), the target of market assessment is to gain valuable
information and knowledge of aimed markets. First, it must be defined what is the new
product’s value to customers. Ulrich and Eppinger (2008) divide value to the customer
into three phases. Customer needs describe why a customer in the first place would be
attracted to a certain product (Lilien et al. 2002; Ulrich & Eppinger, 2008). Furthermore,
customer benefits (Cooper, 2008) represent what a customer gains after the acquisition of
the known product. Customer needs and customer benefits define the source of customer
value, but the amount of value must be defined in monetary terms (Cooper, 2008)
addressing how much customers are willing to pay for the product. Opportunity window,
on the other hand, takes into consideration how long customers see the product valuable
(Carbonell-Foulquié et al., 2004).
In addition to constituting an understanding of customer needs, benefits and value, the
market potential of the product idea must be researched (Kinnunen et al., 2011). By
identifying a target market, a basis for financial estimates and more detailed product
design requirements can be obtained (Cooper, 2001). Target market, according to Capon
and Hulbert (2007), is the set of market segments for whom the products are primarily
offered. Cravens (1994) supports that by stating that target marketing is selecting the
people or organizations to serve with the certain offering. When expanded to cover all
potential customers in addition to primary customers, the total market size can be assessed
(Lilien et al. 2002; Ulrich & Eppinger, 2008) and thus the total market potential of the
product can be estimated (Cooper, 2008). The most profitable innovations are introduced
to growing markets where even an increase of customer value is possible (Kinnunen et
al., 2011) and thereby the rate of market growth should be evaluated. Finally, in market
assessment, the state of competition in the certain field is a major issue that must be taken
into consideration in business case analysis since tense competition decreases profit
margins and makes customer acquisition more difficult (Cooper, 2001 & 2008; Ulrich &
Eppinger, 2008).
Kinnunen et al. (2011) list technical assessment as the second element in NPD business
case analysis. The availability of competences (Lilien et al., 2002) must be reflected to
the technical requirements of the product in question (Cooper, 2008). Technical
uncertainties (Loutfy & Belkhir., 2001) must be evaluated to build an understanding of
risks related to technical feasibility. To construct information for cost estimates, the

29
needed work effort to develop the product should be approximated based on technical
assessment (Loytfy & Belkhir, 2001).
Cooper et al. (1997) present that the product portfolio management targets are value
maximization, strategic fit and portfolio balance. In NPD business case analysis it should
be considered how the product in question fits the company strategy (Cooper, 2008; Lilien
et al. 2002; Ulrich & Eppinger, 2008). Kinnunen et al. (2011) further point out that
strategic fit considerations should take into account both product and technology aspects.
Based on the market assessment, technical assessment and strategic fit considerations,
financial analysis solidifies into monetary terms the information achieved via previous
assessments (Kinnunen et al., 2011). Fundamentally, the market assessment provides
information for sales estimates and technical assessment constructs the basis for cost
estimates (Kinnunen et al., 2011). Lilien et al. (2002) highlight that the impact on
portfolio sales should be estimated in addition to direct sales of the product in question.
A new product can decrease or increase the sales of existing products, and sometimes the
additional sales, such as after-sale service sales, may be even higher than the direct sales
of the product itself (Kinnunen et al., 2011). The opposite side of financial analysis is cost
estimations (Carbonell-Foulquié et al., 2004). Kinnunen et al. (2011) categorize
considered costs to development and production costs. Additionally, life cycle costs such
as costs related to deliveries, maintenance and recycling responsibilities are to be taken
into account in some cases (Kinnunen et al., 2011). Cooper (2001, 2008) states that the
financial analysis should be summarized with informative figures such as net present
value (NPV), internal rate of return (IRR) and payback level.
Figure 10 demonstrates steps to be taken when conducting a business case analysis in
NPD context (Kinnunen et al., 2011). Table 3 summarizes different business case
attributes categorized by business case elements; market and technical assessment,
strategic fit and financial analysis.

30
Figure 10. Business case analysis in NPD (modified from Kinnunen et al., 2011).
Table 3. Business case attributes in NPD context (modified from Kinnunen et al., 2011).
2.6.4 Business case analysis in rapid productization
Kinnunen et al. (2014) state that the full scope business case analysis conducted in NPD
might be too laborious and time-consuming in lighter projects such as rapid
productization. All the information acquired and used in NPD business case analysis

31
might be either irrelevant considering decision making or unavailable (Kinnunen et al.,
2014).
Rapid productization is a sales driven process, and the initiator for BCA in this context is
the need to quickly offer certain specific customers information about company’s ability
to provide the wanted solution and the projected delivery time and price. In addition,
business case analysis must provide the information of financial potential and estimated
profitability for the company in case. (Kinnunen et al., 2014)
Kinnunen et al. (2014) define a procedure framework for business case analysis in rapid
productization. The procedure starts with roughly analyzing the potential rapid
productization case in order to figure out related engineering and development costs.
Based on the preliminary cost-revenue comparison, the case can be declined or advanced
to further analysis taking place in product portfolio point of view. It will be analyzed if
the case aligns with company strategy and if the item will be aimed to the product
portfolio globally or is it restricted to certain customers or market areas. In the second
phase of the analysis, the case is evaluated from the market potential point of view by
estimating the sales window, probable sales price, sales volume, the time of development
and effect on portfolio level sales. Correspondingly, the item’s cost structure must be
assessed and calculated from viewpoints of operations and product life cycle. The
financial analysis consists of calculating and synthesizing monetary terms into financial
key performance indicators such as ROI, NPV and net profit. Finally, the generated
figures at first two phases are synthesized into a business case document, which assists
decision makers to decide whether or not to implement a rapid productization case. Figure
11 illustrates the proposed procedure to follow in rapid productization business case
analysis. Kinnunen et al. (2014) point out that relevant question is how much to address
effort to rapid productization business case analysis. The target is to quickly offer the
information of capability of delivery and price level to the customer and still be able to
do well informed, reasoned decisions.

32
Figure 11. Business case analysis in rapid productization (modified from Kinnunen et al., 2014).
2.6.5 Business case analysis for product portfolio
Business case analysis on product portfolio level analyses all products over the life cycle
phases on the side of commercial product portfolio consisting of market segments,
customers, solutions, product families, sub-product families, product configurations and
sales items.
Value maximization addresses the profitability of portfolio in monetary terms. Existing
products and new products introduced to the portfolio should thereby be feasible in terms
of chosen product portfolio management KPIs such as expected commercial value, sales
turnover, gross margin and net present values (NPV). (Cooper et al., 1997). Of Cooper’s
three product portfolio management targets (value maximization, strategic fit and
portfolio balance), value maximization is most important in BCA point of view.
33
Tolonen (2016) presents that renewal of product portfolio happens by introducing new
products by new product development, by enhancing and modifying the existing products
(Tolonen et al., 2015) and by ramping down existing products. Ramp-down can happen
as a pre-planned activity when the product reaches the end of its predefined life cycle, the
older product is replaced by new product or as an unprofitability triggered kill decision
in earlier life cycle phases. Tolonen et al. (2014) emphasize that the primary role of
product portfolio management should be profitability-driven active assessment and
management of product portfolio over the life cycle instead of focusing narrowly on NPD.
Considering statements of Tolonen et al. (2014) and Cooper et al. (1997) about product
portfolio management, business case analysis for product portfolio should analyze
profitability for each commercial product portfolio level such as sales items, product
configurations, sub-product families, main-product families, solutions, customers and
market segments in order to be conscious of most and least profitable products and thus
ensure value maximization by trying to transfer the focus of sales to profitable ones.
2.7 Market assessment
2.7.1 Target market and market segments
Mariotti and Glackin (2012) define target market as the groups of people or organizations
that are the primary interests of certain business. Cahill (1997) state that basically a target
market is a market or a sub-market for which the marketing messages of a firm are aimed.
Capon and Hulbert (2007) view target market as the primary market segments for which
a company’s products and services are offered.
On the other hand, according to Mariotti and Glackin (2012), the market segment is a
group of consumers that are believed to have a similar response to certain types of
products and services. Capon and Hulbert (2007) state that a market segment is a set of
customers with similar needs appreciating similar benefits and having aligning levels of
priority. Cravens (1994) presents segmentation as a process of analyzing and identifying
the product market’s customers that have similar characteristics of response. As such,
segmentation investigates the differences between buyers at the product market, and
market segments describe subgroups of potential buyers within the total market.
Segmentation can be done by many bases, but among others, Blythe (2012) and Mariotti
and Glackin (2012) introduce geographic-, demographic-, psychographic and behavioral

34
segmentation as the main ones. Geographic segmentation is based on where the customers
live and what are the circumstances in that environment. Psychographic segmentation
takes place based on the personality types of individuals. In behavioral segmentation, the
scope is on behavioral patterns of customers. Demographic segmentation classifies
market in terms of buyers’ lifestyles, ages and economical statuses. (Mariotti & Glackin,
2012; Blythe, 2012).
2.7.2 Market size
Combined revenues of all the companies in a certain market are referred as a total
addressable market or total available market (TAM). Served available market (SAM)
stands for the percentage of TAM that the companies offering specific products and
services can reach. The share of market (SOM), on the other hand is the part of SAM
currently served by the certain company. The relations of TAM, SAM and SOM are
demonstrated in figure 12. (Blank & Dorf, 2012)
Figure 12. Relations of TAM, SAM and SOM (modified from Blank and Dorf, 2012).
The size and structure of the market can be analyzed through desk research, in which
secondary sources of data are analyzed. That is to say for example questionnaires and
other elements generating new data are not harnessed. The sources of data in desk
research are the internet, industry experts, online market reports, the press, various
company data, government statistics, trade and industry associations, directories and lists.
For investigations considering market structure and size, government statistics sites offer
for example time series data which can be used as a basis for trend analysis. It is usual

35
that different sources do not offer estimates of market size for a specific category in
question, but by top-down analysis or bottom-up estimates, reasonable approximations
can be generated. (Hague et al., 2013)
2.8 Sales planning and forecasting
Jobber and Lancaster (2012) define sales planning as a six stage process, and actions in
each stage are described in figure 13. Jobber and Lancaster (2012) further present that
sales planning generates from sales forecasting, and the objective of planning is to
allocate resources within a company in order to achieve the anticipated sales.
Figure 13. Sales planning process (modified from Jobber & Lancaster, 2012).
2.8.1 Time horizons and levels of forecast
Forecasts can be classified by time horizon to short-, medium-, and long-term forecasts
(Heizer & Render, 2014; Jobber & Lancaster, 2012; Gore & Panizzolo, 2012). Jobber and
Lancaster (2012) define the time spawn of short-term forecasts to be up to three months
ahead, and as such short-term forecasts are used in tactical matters such as production
planning. Heizer and Render (2012) support this viewpoint by stating the time horizon of
the short-term forecast to be up to one year, but usually less than three months. In addition
to mentioned production planning, uses for forecasts of this range are purchasing planning
and workforce level planning. Gore and Panizzolo (2012) mention that simple statistical
methods are used to conduct short-term forecasts. Also, general sales trend is less
essential than short term fluctuations in case of short-term forecasts (Jobber & Lancaster,
2012).

36
According to Gore and Panizzolo (2012), medium–, or intermediate-term forecasts reach
from three months to one year ahead. However, Heizer and Render (2014) and Jobber
and Lancaster (2012) view the corresponding time frame to be from three months up to
three years. Medium-term forecasts have significant importance for business budgeting
since sales forecasts are a starting point for budgeting (Jobber & Lancaster 2012). Heizer
and Render (2014) also bring out the usefulness of medium-term forecasts for sales
planning, cash budgeting, production planning and –budgeting and various operation plan
analysis.
Jobber and Lancaster (2012) and Heizer and Render (2014) view the time horizon of long-
term forecasts to be generally three years or more. This depends on the industry (Jobber
& Lancaster, 2012). Long-term forecasts are dependent on macro-environmental factors
such as economic trends and government policies et cetera (Jobber & Lancaster, 2012).
Heizer and Render (2014) list the uses of long-term forecasts to be for example planning
for capital expenditures, new products, facility locations and expansions and research and
development. Gore and Panizzolo (2012) also present the use of such forecasts in the
planning of major capital expenditures and new products.
Heizer and Render (2014) specify fundamental aspects of how short-term forecasts differ
from medium- and long-term forecasts. First, medium- and long-term forecasts have
focus on more comprehensive issues such as making product– and facility decisions.
Second, the methods used are different. Mathematical methods are more suitable for
shorter horizon predictions. Vice versa, methods of qualitative essence fit better long-
term contexts where for example issues such as decision-making whether or not to
introduce certain new product occur. Finally, short-term forecasts are naturally more
accurate.
In addition to different times horizons, forecasts can be produced based on different
levels. For example, top-down approach can be used to conduct product-by-product
forecasts based on company-, national- and international level forecasts for some certain
industry. These product-by-product forecasts are further divided seasonally over the
period of forecast, and geographically to individual areas of sales responsibility.
However, companies do not usually need to conduct national or international level
forecasts, but information is normally collected from recognized national and

37
international sources and thus company-level forecasters can adjust product-by-product
forecasts considering the macro-level estimates. (Jobber & Lancaster, 2012)
2.8.2 Qualitative forecasting methods
Qualitative forecasting methods can be described as methods harnessing factors such as
personal experiences, intuition, emotions and judgment of decision makers and experts
(Heizer & Render, 2014; Slack et al., 2016). Jobber and Lancaster (2012) state that
qualitative methods rely less on mathematics and more on opinion. Krajewski et al. (2012)
refer to qualitative methods as “judgement methods”. Table 4 lists different qualitative
methods presented by four different authors.
Table 4. Qualitative forecasting methods mentioned by different authors.
Panels of executive opinion (Jobber & Lancaster, 2012), panel approach (Slack et al.,
2016), jury of executive opinion (Heizer & Render, 2014) or executive opinion
(Krajewski et al., 2012) is a forecasting method in which experts and specialists with
knowledge of some certain industry are consulted to conduct a forecast (Jobber &
Lancaster, 2012). Such experts can come from inside or outside a company (Krajewski et
al., 2012). For example, external people can include management consultants and
customers giving an insight of buying company’s viewpoint (Jobber & Lancaster, 2012).
Jobber and Lancaster (2012) further describe panels of executive opinion as a top-down
method in which the focus of the forecast is on a level of certain industry, and the
company in question further approximates what its share of the overall forecast will be.
Because of the top-down approach, there lies a difficulty in allocating forecast to
individual sales territories and products and thus the generated forecast is aggregate and
general in nature. Heizer and Render (2014) bring out the use of statistical methods in

38
order to supplement the jury of executive opinion. Mathematical aggregation might be
necessary for example in the case of disagreement between experts (Jobber & Lancaster
2012).
In salesforce composite (Jobber & Lancaster, 2012; Heizer & Render, 2014) or salesforce
estimates (Krajewski et al., 2012), individual salespersons conduct product-by-product
forecast for the sales territory they are responsible for (Jobber & Lancaster, 2012). This
is a bottom-up approach, and forecasts by individual salespersons can easily be compiled
to regional and national estimates (Krajewski et al., 2012). The problem of the method is
that biases to forecast can occur due to personalities of salespersons; some tend to set
over-optimistic predictions and vice versa some pessimistic ones (Krajewski et al., 2012;
Jobber & Lancaster, 2012).
Delphi method is useful in cases of inexistent historical data or when management has no
experience on which foundation to base an estimate. Delphi method bears resemblance
to jury of executive opinion, but here the examined experts remain anonymous. This has
the benefit of avoiding the majority opinion and thus forecast might be more objective.
The process of Delphi method starts by sending a questionnaire to chosen experts, and
since answers are received, a summary of responses in compiled and sent further to
participants, who can reconsider their answers based on what other experts have stated.
This process is iteratively repeated until consensus, or at least narrower scale of results is
achieved. (Jobber & Lancaster, 2012; Krajewski et al., 2012; Slack et al., 2016)
Slack et al. (2016) present scenario planning as a mean to address situations of major
uncertainty, usually in a long-term context. Similarly to an executive opinion, a panel is
used. Panel members are asked to generate a range of possible future scenarios, which are
later discussed and risks related to each scenario are assessed. Conversely to Delphi
method, scenario planning does not necessary aim to consensus but the target is to scope
possible options and to avoid the unfavorable ones.
Heizer and Render (2014) and Krajewski et al. (2012) introduce market survey/market
research as a forecasting method. Market survey inquires existing and potential customers
for future purchasing intents (Heizer & Render, 2014). Krajewski et al. (2012) describe
market research as a systematic approach to gain insight on consumer interests on certain
products and services. Heizer and Render (2014) mention market survey to possess same
shortcomings as salesforce composite; interviewed customers can offer overly optimistic

39
forecasts. Jobber and Lancaster (2012) specify that consumer/user survey is most useful
for industrial products with few buyers. In that case, a survey can be executed on a face-
to-face basis. For consumer products, a broader market research with a questionnaire,
representative samples and means to administer results is needed (Jobber & Lancaster,
2012; Krajewski et al., 2012). In addition, Jobber and Lancaster (2012) emphasize that in
the case of broader surveys for consumer products, the intention to buy does not necessary
solidify to actual purchase.
Jobber and Lancaster (2012) exhibit product testing and test marketing as a valuable
technique for products with inexistent sales figures. This applies to new or modified
products for which estimates of likely demand are challenging to conduct. There is
applicability for both existing market and markets that are yet to be entered. In product
testing, a pre-production model of a product is given to sample of potential users and
feedback of flaws and merits of the product is collected. However, product testing
typically yields only a “go”- or “no go” –decision. Thus test marketing is more valuable
in forecasting point of view. Test marketing executes a limited launch of a product in a
restricted market area. For example, a limited launch in a chosen geographical area can
simulate the national launch with a fraction of the costs. This enables a company to utilize
a bottom-up approach to approximate the full market demand. However, there are certain
drawbacks. First, during test launch the product enjoys a novelty factor which is likely to
diminish over time. Second, test marketing gives competitors time to react and even
sabotage the test launch by their own marketing campaigns. Third, there are known cases
in which test marketing was unsupportive for the product, but on the contrary, the actual
launch was a great success.
2.8.3 Quantitative forecasting methods
Heizer and Render (2014) categorize quantitative forecasting methods to time-series
models and associative model. In Heizer and Render’s (2014) classification, time-series
models are the naïve approach, moving averages, exponential smoothing and trend
projection. Linear regression is seen as an associative model. Krajewski et al. (2012) view
linear regression as a causal model. Otherwise, Krajewski’s et al. (2012) classification of
quantitative methods is aligned with Heizer and Render’s (2014). Krajewski et al. (2012)
further describe trend projection as “trend projection with regression”. However, the
content of the model is described similarly to Heizer and Render (2014).

40
Naïve approach is a method which simply assumes the demand of the next period to be
equal to the actualized demand in preceding period (Krajewski et al., 2012; Heizer &
Render, 2014).The naïve forecast is simple and can perform well despite its name
(Krajewski et al., 2012). Heizer and Render (2014) point out the use of naïve forecast as
a starting point for the use of more sophisticated methods.
Simple moving average –method calculates the forecast for period t to be an average of n
previous periods (Heizer & Render, 2014; Krajewski et al., 2014). Heizer and Render
(2014) formulate the forecast mathematically as follows:
𝐹𝑡+1 = ∑ demand in 𝑛 previous periods
𝑛
According to Heizer and Render (2014), moving average is a useful method if steady
market demand can be assumed. Krajewski et al. (2012) recommend the use of large n in
cases of stable past demand, whereas use of small n value is advisable when demand is
more susceptible to change.
Weighted moving averages –method addresses the factor that simple moving average puts
similar weight to all demands used in the calculation. In weighted moving average, each
used demand can be given individual weight so that the sum of weights is 1. Doing this,
later demands can be highlighted and thus the generated forecast is more responsive. For
example, when three actualized demands are used, weighting can be following:
(Krajewski et al., 2012).
𝐹𝑡+1 = 0,50𝐷𝑡 + 0,30𝐷𝑡−1 + 0,2𝐷𝑡−2
Exponential smoothing is the most commonly used formal forecasting method. This is
due to the simplicity and the small amount of data the method needs. As weighted moving
average require n periods of existing data and a corresponding number of weight-
coefficients, exponential smoothing demands only three elements: the last period’s
forecast for period t, actualized demand for this period and a smoothing parameter α of
value 0 – 1. The extent to which the most recent demand levels are emphasized can be
adjusted by varying the smoothing parameter. When large α value is used, the emphasis
is given to the recent level of demand and thus forecast is more responsive to changes.
Small values of α provide a more stable forecast with more weight to demand in the past.

41
For time period t + 1, the formula for exponentially smoothed forecast is calculated as
follows: (Krajewski et al., 2012)
𝐹𝑡+1 = 𝛼𝐷𝑡 + (1 − 𝛼)𝐹𝑡
In simple exponential smoothing presented above, the forecast can lag behind if there is
a trend in demand levels. Use of large α value can decrease forecasting errors in described
scenarios, but still, the forecast tends to lag behind in case of a systematic change in
underlying average. (Krajewski et al., 2012). Nahmias and Olsen (2015) present Holt’s
method and Winters’ method as more sophisticated exponential smoothing methods.
Holt’s method is a double exponential smoothing method addressing the trend in time-
series. Winter’s method furthermore uses triple exponential smoothing to address both
trend and seasonality in demand levels.
A simpler way to address the trend in data is to use trend projection (Heizer & Render,
2014) alias trend projection with regression (Krajewski et al., 2012). In this method,
simple regression analysis is used to address the trend (Krajewski et al., 2012). When the
trend is linear, by least squares method an equation for the trend line can be calculated.
Heizer and Render (2014) present the equation for trend line:
𝐹𝑡 = 𝑎 + 𝑏𝑥
Where a is the y-axis intercept, b the slope of the regression line and in this case,
independent variable x is time.
Differing from time-series forecasting, associative forecasting models take into
consideration several variables related to the demand levels under prediction. The most
usual associative method is linear-regression analysis. This is similar to trend projection,
but here the independent variable does not need to be time. Multiple-regression analysis
inputs more than one independent variable. In case of n variables, the equation would be
following: (Heizer & Render, 2014)
𝐹𝑡 = 𝑎 + 𝑏1𝑥1 + ⋯ + 𝑏𝑛𝑥𝑛
Where:
42
a = the y-axis intercept
bn = coefficient for independent variable n
xn = value for independent variable n
Here, the formulation of coefficients a and bn are mathematically complex and software
for solving is needed (Heizer & Render, 2014).
2.8.4 Rolling forecast
According to Zeller and Metzger (2013), companies should use rolling forecast to steer
the business in changing conditions. Fundamentally, the objective of rolling forecasts is
to provide continuous and ongoing planning horizon (Zeller & Metzger, 2013). In their
study, O’Connor et al. (2000) indicates that the use of temporal information as a rolling
forecast manner seems to improve forecasting accuracy especially if the case is related to
trended data.
2.9 Financial analysis
2.9.1 Net Present Value
Net present value –method is a discounted cash flow method that can be used to evaluate
the expected profitability of an investment (Van Horne, 1992). Net present value (NPV)
measures the degree to which cash inflows are greater than cash outflows (Ulrich &
Eppinger, 2008). Keen and Digrius (2011) and Garrison et al. (2015) state that a dollar
today is generally worth more than a dollar in future, and NPV transforms the value of
future cash flows to present time. In NPV-method, all the cash flows generated by certain
investment are discounted to present value by using the rate of return required (Van
Horne, 1992).
Garrison et al. (2015) summarize the most common cash flows in business investment
projects. The major cash outflows typically are an initial investment, increased working
capital needs, repairs and maintenance, and incremental operating costs. The majority of
cash inflows usually consist of incremental revenues, reduction in costs, salvage value
and release of working capital.

43
In NPV-method, all the cash flows generated by certain investment are discounted to
present value by using the rate of return required (Van Horne, 1992). According to Ulrich
and Eppinger (2008), the discount rate to be used in calculations is so called opportunity
cost of capital, which is the financial return lost when investing to the project in case
rather than to some other possible investment. Garrison et al. (2015) specify that firm’s
weighted-average cost of capital (WACC) is commonly used as this opportunity cost of
capital, or required rate of return. WACC is the average rate of a return a firm must pay
for the use of long-term creditors’ and shareholders’ funds. Moreover, as such, Garrison
et al. (2015) state that it is the most suitable choice to be used as a discount rate. When
project’s NPV is greater than zero, it earns more than the opportunity cost of capital
(Ulrich & Eppinger, 2008). In some cases, it is advisable to use a discount rate differing
from WACC. For example in riskier cases the used discount rate should be higher than
that since riskier the investment, the higher the returns should be (Garrison et al., 2015).
The NPV of an investment can be calculated by following formula: (Drury, 2012;
Garrison et al., 2015)
𝑁𝑃𝑉 = ∑𝐹𝑡
(1 + 𝑟)𝑡
𝑛
𝑡=0
In which:
Ft = Net cash flow at year t
r = discount rate used
n = last year a cash flow is expected
2.9.2 Internal Rate of Return
The internal rate of return (IRR) is the second approach using discounted cash flows (Van
Horne, 1992; Garrison et al., 2015). Garrison et al. (2015) present IRR as the return
investment yields during its life cycle. Van Horne (1992) state that IRR for an investment
is the discount rate that equates the expected cash inflows and outflows. Garrison et al.
(2015) accentuate that IRR is the discount rate r resulting to NPV of zero. Figure 14
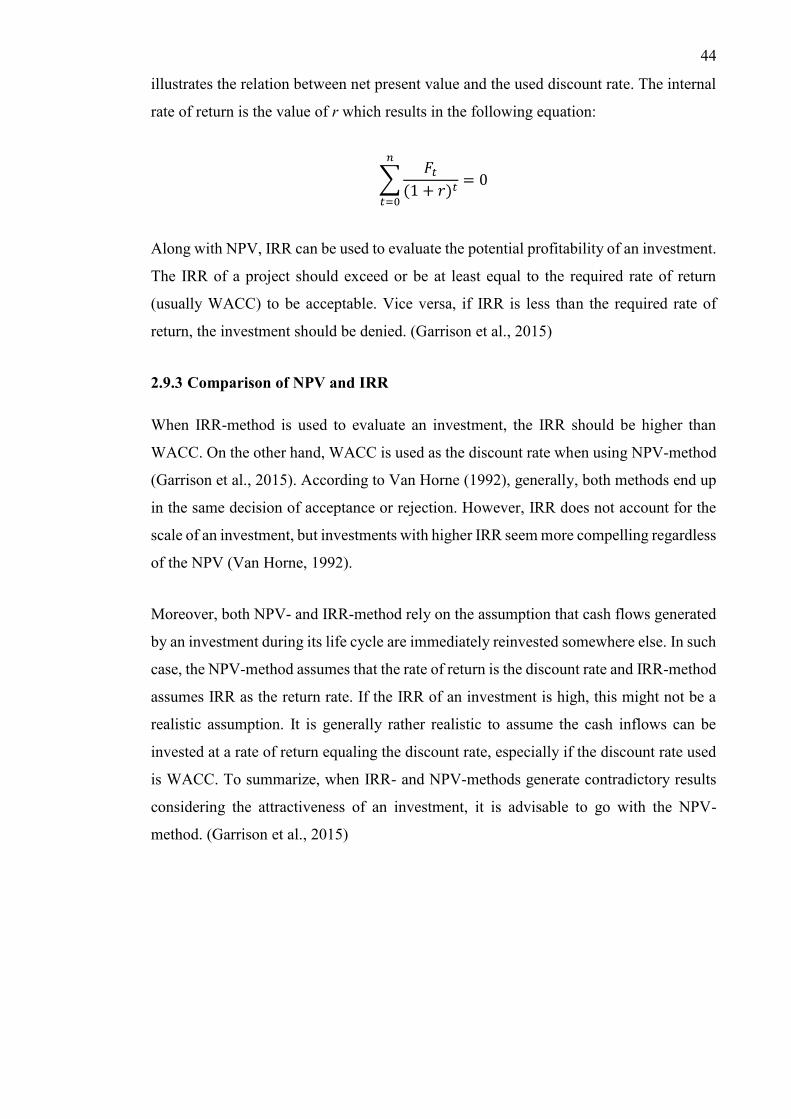
44
illustrates the relation between net present value and the used discount rate. The internal
rate of return is the value of r which results in the following equation:
∑𝐹𝑡
(1 + 𝑟)𝑡
𝑛
𝑡=0
= 0
Along with NPV, IRR can be used to evaluate the potential profitability of an investment.
The IRR of a project should exceed or be at least equal to the required rate of return
(usually WACC) to be acceptable. Vice versa, if IRR is less than the required rate of
return, the investment should be denied. (Garrison et al., 2015)
2.9.3 Comparison of NPV and IRR
When IRR-method is used to evaluate an investment, the IRR should be higher than
WACC. On the other hand, WACC is used as the discount rate when using NPV-method
(Garrison et al., 2015). According to Van Horne (1992), generally, both methods end up
in the same decision of acceptance or rejection. However, IRR does not account for the
scale of an investment, but investments with higher IRR seem more compelling regardless
of the NPV (Van Horne, 1992).
Moreover, both NPV- and IRR-method rely on the assumption that cash flows generated
by an investment during its life cycle are immediately reinvested somewhere else. In such
case, the NPV-method assumes that the rate of return is the discount rate and IRR-method
assumes IRR as the return rate. If the IRR of an investment is high, this might not be a
realistic assumption. It is generally rather realistic to assume the cash inflows can be
invested at a rate of return equaling the discount rate, especially if the discount rate used
is WACC. To summarize, when IRR- and NPV-methods generate contradictory results
considering the attractiveness of an investment, it is advisable to go with the NPV-
method. (Garrison et al., 2015)

45
Figure 14. The relation between discount rate and NPV.
2.9.4 Profitability index
NPV- and IRR-methods do not fully take into consideration the scale of an investment.
As mentioned, when analyzing IRR, an investment can seem more desirable than other
investment with a lower internal rate of return. However, the NPV of latter can be higher.
Still, the initial investment for the higher NPV investment can be considerably more
expensive. (Garrison et al., 2015; Van Horne, 1992)
To validly compare investments of different scale, the net present value of cash inflows
must be compared to the initial investment required. Profitability index is additional
method to evaluate investment options and it is calculated as follows: (Garrison et al.
2015)
𝑃𝑟𝑜𝑓𝑖𝑡𝑎𝑏𝑖𝑙𝑖𝑡𝑦 𝑖𝑛𝑑𝑒𝑥 =𝑁𝑒𝑡 𝑃𝑟𝑒𝑠𝑒𝑛𝑡 𝑉𝑎𝑙𝑢𝑒 𝑜𝑓 𝑐𝑎𝑠ℎ 𝑖𝑛𝑓𝑙𝑜𝑤𝑠
𝐼𝑛𝑣𝑒𝑠𝑡𝑚𝑒𝑛𝑡 𝑟𝑒𝑞𝑢𝑖𝑟𝑒𝑑
Garrison et al. (2015) emphasize that the investment required in the formula refers to
initial investment in the beginning of an investment reduced by the salvage value left at
the end of the investment life cycle.

46
2.9.5 Payback method
Payback method is frequently used to complement more sophisticated investment
evaluation methods, and mainly it is treated more as a constraint to be fulfilled than as a
maximized profitability measure (Van Horne, 1992). In the case of equivalent yearly net
cash inflows, payback period is calculated from formula: (Garrison et al., 2015)
𝑃𝑎𝑦𝑏𝑎𝑐𝑘 𝑝𝑒𝑟𝑖𝑜𝑑 = 𝐼𝑛𝑣𝑒𝑠𝑡𝑚𝑒𝑛𝑡 𝑟𝑒𝑞𝑢𝑖𝑟𝑒𝑑
𝑁𝑒𝑡 𝑎𝑛𝑛𝑢𝑎𝑙 𝑐𝑎𝑠ℎ 𝑖𝑛𝑓𝑙𝑜𝑤
In the formula “net annual cash inflow” is incremental in cases when new equipment
replaces old equipment. Generally, payback method is criticized for its inability to take
into account time value of money. Another shortcoming is that it does not address for
cash inflows after the initial investment has been recovered. Under certain conditions,
however, the payback method can prove very useful. For example as a screening tool it
can provide help to the decision whether or not the certain proposal should even be further
considered. Furthermore, the payback period can be a valuable decision-making tool for
firms with limited financial resources. (Garrison et al., 2015)
2.9.6 Cash flow calculations in NPV context
Ulrich and Eppinger (2008) present typical cash inflows and outflows related to an NPD
project. According to them, the most common cash flow categories are development cost
including all design, testing and refinement costs until ramp-up, ramp-up costs, marketing
and support costs, production costs and sales revenues. Figure 15 illustrates how these
cash flows typically relate to each other on a timeline.
Depending on the context of decision making the cash flow calculations are aimed to
support, a greater level of detail might be needed. Presented five cash flow categories can
be addressed in a more detailed way, or other types of cash flows can be taken into
consideration. Most common refinements are production cost breakdown to direct and
indirect costs, marketing and support cost breakdown to launch-, promotion-, direct sales-
and service costs. Tax effects including tax credits for depreciations and investments are
typically addressed even in simple models. In addition, miscellaneous outflows and
inflows can be included. Such cash flows are for example working capital requirements,
impact on existing product sales alias cannibalization, opportunity costs and salvage
costs. (Ulrich & Eppinger, 2008)
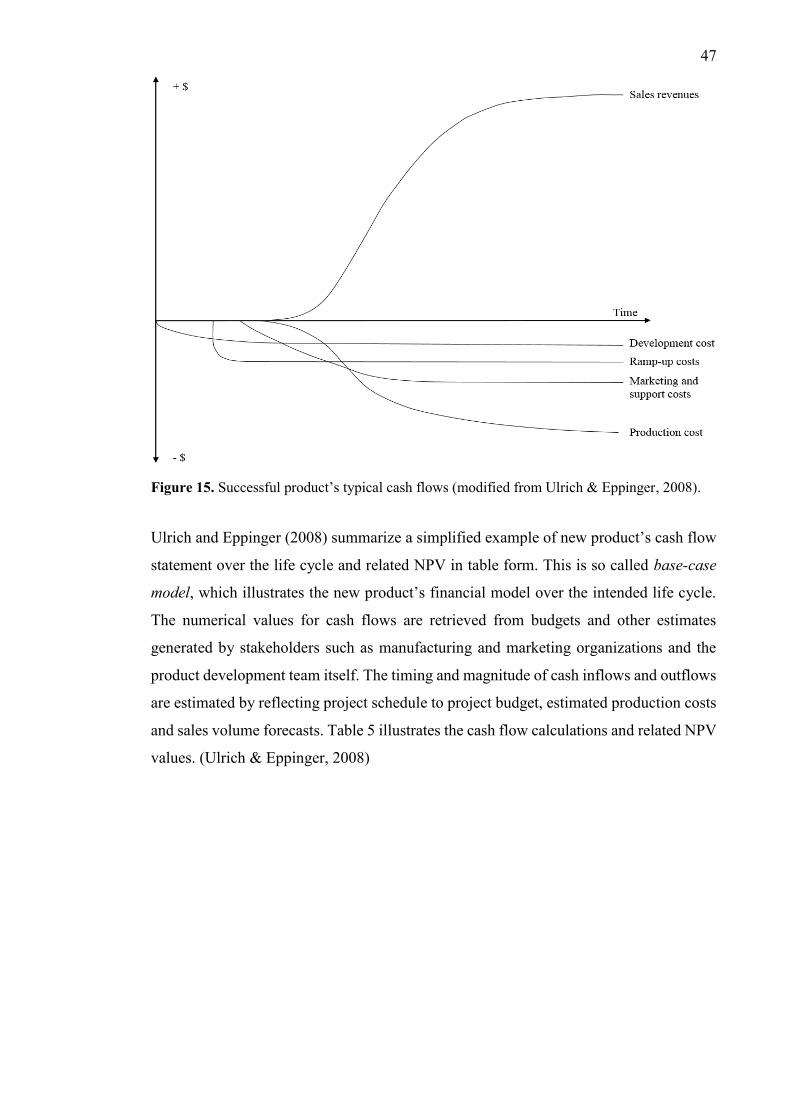
47
Figure 15. Successful product’s typical cash flows (modified from Ulrich & Eppinger, 2008).
Ulrich and Eppinger (2008) summarize a simplified example of new product’s cash flow
statement over the life cycle and related NPV in table form. This is so called base-case
model, which illustrates the new product’s financial model over the intended life cycle.
The numerical values for cash flows are retrieved from budgets and other estimates
generated by stakeholders such as manufacturing and marketing organizations and the
product development team itself. The timing and magnitude of cash inflows and outflows
are estimated by reflecting project schedule to project budget, estimated production costs
and sales volume forecasts. Table 5 illustrates the cash flow calculations and related NPV
values. (Ulrich & Eppinger, 2008)

48
Table 5. Example of cash flow-, present value- and NPV calculations (modified from Ulrich &
Eppinger, 2008).
2.10 Life Cycle Costing
Lindholm and Suomala (2007) describe life cycle costing (LCC) as an aspect of
managerial accounting that provides understanding in total costs generated over a
product’s life cycle. White and Oswald (1976) present how, in a broad application, an
LCC analysis can be harnessed in estimating relevant present and future costs in order to
evaluate different alternatives of action and execute decisions accordingly. Barringer
(2003) state that life cycle costs “include cradle to grave costs converted to NPV
economic models”.
Listed by Dhillon (2009), common uses for LCC are long-term budgeting and planning,
project controlling, comparing different projects, evaluating logistics solutions,
evaluating equipment options and selection among competing bidders. Dhillon (2009)
further describes the advantages of LCC to be usefulness in program control and
comparison of projects, cost reduction, and the possible use as a decision-making tool in
planning, supplier selection and budgeting. Barringer and Weber (1995) also emphasize
the managerial decision-making as an LCC related advantage; LCC can be a tool aiding
in cost discipline, purchasing, acquisition and design trade-offs. However, LCC is time-
consuming and thus costly as an accounting process, data availability for LCC process
can be uncertain and also the accuracy of results are debatable (Dhillon, 2009).

49
Woodward (1997) and Korpi and Ala-Riusku (2008) also highlight the element of
uncertainty when LCC is used.
Emblemsvåg (2003) presents LCC as a way of thinking rather than an engineering-
oriented concept in the NPD phase. LCC should also be used to all present and future
internal and external costs (Emblemsvåg, 2003). According to Cole and Sterner (2000),
however, the relevant LCC scope focuses only on direct and indirect financial costs and
contingent costs thus leaving broader environmental and social costs to vaster concepts
such as total cost accounting.
All stages of the life cycle can be applied to life cycle costing in practice. Evaluation
approach is used in the beginning and after actualization, total costs over life cycle can
be approximated. Continuous cost management and improvement of practices are
activities taken in the middle of the life cycle. These efforts are creating a cost image over
the life cycle. When focused on and properly managed over the product life cycle, LCC
enables the constant improvement of a product’s cost image which leads to better
understanding of product cost accounting for the product in the case and possibly for
future products as well. (Lindholm & Suomala, 2007)
2.10.1 Life cycle costing techniques
Asiedu and Gu (1998), Niazi et al. (2006), Emblemsvåg (2003) and Korpi and Ala-Riusku
(2008) each offer similar life cycle costing technique categorizations with only slight
differences. However, Niazi et al. (2006) splits different LCC models into sub-categories
thus constituting the most extensive classification found in the literature (figure 16).
Figure 16. Classification of LCC techniques (modified from Niazi et al., 2006).
For more accurate results, practical applications of LCC should utilize two or more LCC
approaches in parallel. Qualitative methods are advisable to be used in the generation of

50
cost estimates in the early stages of product life cycle. Quantitative methods can be used
to sharpen the cost image in latter stages of life cycle. Qualitative techniques can be
divided to intuitive- and analogical techniques, and sub-categories for quantitative
techniques are parametric- and analytical techniques. (Niazi et al., 2006)
Intuitive techniques base cost estimates on past experience focusing on expert knowledge.
Two sub-categories exist. Case-Based technique harnesses previous design cases similar
to the one in question. Cost estimation for a new product is created by combining existing
results with new cost components for newly designed items. This reduces the need to
execute cost estimation from scratch. The benefit of the methodology is that the use of
past data significantly decreases the estimation time. Case-Based technology, however,
can only be used when similar part and assembly designs are available to be incorporated
to new product’s cost estimation. Another category of intuitive techniques, decision
support techniques, is purposed to assist estimators to do better decisions and judgment
by providing experts’ knowledge, such as estimation rules, for use. (Niazi et al., 2006)
Analogical techniques estimate costs by identifying an analogy between target product
and similar existing product (Emblemsvåg, 2003). The cost estimate is generated by
adjusting existing product’s costs to differences between it and the target product (Asiedu
& Gu, 1998). This model of LCC is common for example in ship building industry, where
the mass of the ship is the factor costs are related to (Emblemsvåg, 2003). According to
Asiedu and Gu (1998), the main disadvantage of this method is the required high level of
judgment. They, however, bring out the appropriateness of method for new products.
Emblemsvåg (2003) view parametric models as more advanced analogy models.
Parametric costing uses regression analysis based on technical information and historical
cost data (Asiedu & Gu, 1998). This is a statistical methodology using equations
representing relationships between related parameters, and thereby the model is most
useful when cost drivers can be easily identified (Niazi et al., 2006). A large amount of
data is required for equations, which is the weakness of parametric method since it is not
very good in estimating costs for products utilizing new technology (Asiedu & Gu, 1998).
According to Niazi et al. (2006), analytical LCC techniques utilize an approach that
breaks down cost drivers into smaller entities and the cost is represented as a sum of those.
Asiedu and Gu (1998) describe detailed models that are similar to analytical models
presented by Niazi et al. (2006) and share the same bottom-up approach. Niazi et al.
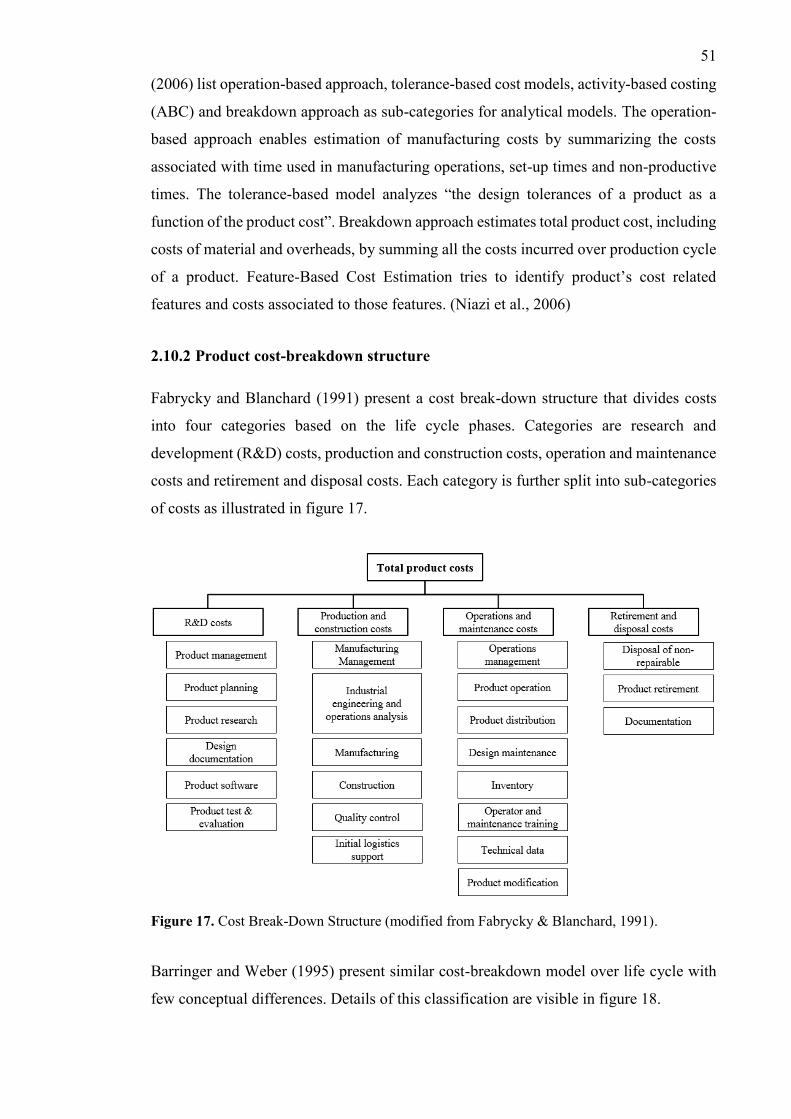
51
(2006) list operation-based approach, tolerance-based cost models, activity-based costing
(ABC) and breakdown approach as sub-categories for analytical models. The operation-
based approach enables estimation of manufacturing costs by summarizing the costs
associated with time used in manufacturing operations, set-up times and non-productive
times. The tolerance-based model analyzes “the design tolerances of a product as a
function of the product cost”. Breakdown approach estimates total product cost, including
costs of material and overheads, by summing all the costs incurred over production cycle
of a product. Feature-Based Cost Estimation tries to identify product’s cost related
features and costs associated to those features. (Niazi et al., 2006)
2.10.2 Product cost-breakdown structure
Fabrycky and Blanchard (1991) present a cost break-down structure that divides costs
into four categories based on the life cycle phases. Categories are research and
development (R&D) costs, production and construction costs, operation and maintenance
costs and retirement and disposal costs. Each category is further split into sub-categories
of costs as illustrated in figure 17.
Figure 17. Cost Break-Down Structure (modified from Fabrycky & Blanchard, 1991).
Barringer and Weber (1995) present similar cost-breakdown model over life cycle with
few conceptual differences. Details of this classification are visible in figure 18.

52
Figure 18. Cost Break-Down Structure (modified from Barringer & Weber, 1995).
2.11 Theory synthesis
Market assessment inputs general market potential and attractiveness into the business
case. Kinnunen et al. (2011) mention factors such as customer benefits, customer need,
target market, total market size and intensity and extent of competition as the basis for
anticipated sales volumes and –prices in NPD context. Expected revenues and cost
estimates including development–, production– and other life cycle costs are integrated
to conduct financial analysis. This general process flow for building a business case is
found in many sources of literature. For example Cooper (2001), Schmidt (2009) and
Kinnunen et al. (2011 & 2014) present models with corresponding contents. In addition,
Schmidt (2009) and Ulrich and Eppinger (2008) highlight sensitivity analysis. Generally,
this process includes collecting relevant and trusted information from different sources,
analyzing it in a rational way and based on that calculating the likely business outcomes
of certain decision (Kinnunen et al., 2011). The contents of business case related financial
analysis are also aligning among authors. Metrics such as NPV, net cash flow, ROI, IRR
and payback period are widely presented in business case literature as tools for assessing
new product development project attractiveness.
For new products that are developed by NPD and RaDe, literature provides means to
estimate market potential and thus conduct sales plans based on targeted market segments.
According to Kinnunen et al. (2011), initial sales estimates for a new product can be
predicted by assessing the total market size, target market, market growth and intensity

53
and extent of competition. These attributes are crucial when planning likely sales volumes
for a new product. Customer need –, customer benefit – and customer value analysis
define the price customers are likely willing to pay for the new product in case (Ulrich &
Eppinger, 2008; Kinnunen et al., 2011). That kind of inputs enable the revenue
estimations in NPD context. Kinnunen et al. (2014) summarize that process of conducting
sales estimates for a rapid productization case is similar to NPD. However, here the
marginal value of certain sales case or customership can have significant importance. As
RaDe is similar to rapid productization in time horizon and magnitude, it can be
synthesized that sales planning practices for rapid productization are suitable also for
RaDe.
Sales planning on commercial product portfolio level analyses all products over the life
cycle phases consisting of market segments, customers, solutions, product families, sub-
product families, product configurations and sales items. Haines (2014) presents that the
target of product management is to maximize value creation of a product over its life
cycle. Tolonen (2016) highlights product management objectives such as sales revenue-,
market share- and profit margin maximization. Furthermore, in product portfolio
management point of view, value maximization highlights the profitability of product
portfolio (Cooper, 2001). Thus it can be synthesized that product portfolio level sales
planning should support value maximization so that sales of different product portfolio
levels are actively planned and followed in order to maximize product management
objectives presented by Tolonen (2016). Various forecasting methods are available to
estimate demand for existing products and to evaluate larger scale market trends. Sales
planning for existing product portfolio solidifies to forecasting and related methods and
practices. When introducing a new product by NPD or rapid productization, Kinnunen et
al. (2011 & 2014) bring out taking into consideration product portfolio level effects in
sales. Lilien et al. (2002) also highlight that the impact on portfolio sales should be
estimated in NPD context. By this reasoning, it can be stated that same applies for RaDe
kind of activities. Impact on portfolio level sales can either be a negative cannibalization
or a positive sales boost. Cannibalization is a phenomenon in which sales of existing
products decrease in the case of introduced new product. This happens when products
with similar attributes/functionalities compete each other for the market share. (Raghavan
Srinivasan et al., 2005). According to the literature, it seems that financial metrics
presented earlier are often calculated without analyzing this impact of the new product
has on sales of existing products. Ulrich and Eppinger (2008) mention cannibalization in

54
context of cash inflow and –outflow calculations and Kinnunen et al. (2011 & 2014) take
into account portfolio level impact in their business case frameworks for NPD and rapid
productization, but neither do specify how these matters should be managed in practice.
Lilien et al. (2002) also considers the portfolio impact but do not provide methodology
either. As a conclusion, the earlier research and literature do not explicitly define how
product portfolio level business case calculations should be calculated.
For the empirical current state analysis, an essential part of the theoretical topics is the
sales planning for individual new products and its impact to the product portfolio.
According to Kinnunen et al. (2011 & 2014), market assessment elements such as
customer benefits, customer need, target market, total market size and intensity and extent
of competition are the factors on which anticipated sales volumes and sales prices are
generated when introducing a new product by NPD or rapid productization. For existing
product portfolio, forecasting is the main tool to predict sales figures. In addition, sales
planning on commercial product portfolio level should analyze sales on different portfolio
levels, such as market segments and product lines. The empirical analysis examines how
sales planning is done in case companies for existing products, new products and product
portfolio with reflection to this theory of sales planning.

55
3 CURRENT STATE ANALYSES ON CASE COMPANIES
3.1 Case companies
Table 6 summarizes an essential case company information regarding the executed
interviews. The questionnaire used is available in Appendix 1.
Table 6. Case companies and interviewed managers.
3.2 Current sales planning in case company A
In case company A, sales & marketing director is responsible for sales planning and
marketing activities overall. The starting point for sales planning is the budgets. In
budgeting sales estimates for next year are generated as accurately as possible and further
split by different product lines and geographical locations. Due to the size of the company,
in some cases sales estimates can be split to the level of an individual sales person.
Budgets are done yearly, which means that in the end of the year sales planning horizon
would be only a few months. To prevent this, case company A uses 12-month rolling
forecast to keep the planning horizon always one year ahead. The rolling forecast is
updated every month.
According to the chief technical officer (CTO), there is overall sales process description
available. The interviewed manager was not familiar with the detailed content, but he
mentioned that in the process it is tried to identify who are the customers, to give
instructions for a sales team of what kind of end user cases they should visit and find. It
is also described that in which kind of situations it is avoidable to end up in sales point of
view. However, for budgeting there is no process described.

56
3.2.1 Current sales planning practices for existing individual products
Sales volume forecasts in the case company A are conducted by collecting sales leads
from sales teams. These leads collected from each sales person are the foundation of
volume forecasts. The leads are recorded to customer relations management –system
(CRM) with estimation of volume, schedule of lead and so called probability factor which
describes the likelihood of certain lead. Sales & marketing director checks combined
leads and does further analysis how things look in the sense of forecast. This lead-based
method provides short visibility, only up to 4 months. Longer period forecasts are based
on judgmental estimates of country managers and sales & marketing director. Thus leads
by sales teams from CRM are used for short period forecasts when doing 12-month rolling
forecast monthly updates, and the forecast is completed with judgment methods to cover
one year ahead.
Sales prices are based on pricing policy in partner agreements. There is a price list, and
depending on the level of agreement with a partner, the partner will be entitled to get a
specific discount. In special cases in which some customer deal is really needed, the
project based discount policy might be used. Basically price list acts as a target price, and
there are strict discount rules for sales persons. On occasion, upper-level managers can
be consulted for permission to give a higher discount in order to win an important deal.
In planning point of view, it is assumed that price level is fixed over a planning horizon
of 12 months. In the end of the year prices might be changed for some reason or another.
Sales planning accuracy is followed by the director country by country, and on that level
at least the accuracy of the forecast for first three months is followed. On a higher level,
execution against budget is followed. Pricing is based on price lists that act as a target
price, and there are strict rules for sales personnel. Sales planning can be corrected based
on actual events. This kind of matters are normally taken into account in monthly
planning. In case of something big, planning can be corrected on the same day by
correcting 12-month rolling forecast immediately. The update must be done also to
manufacturing plant to assure manufacturing capability with the subcontractor. This kind
of ad hoc –adjustments to plans can be done because the company’s team is relatively
small.

57
3.2.2 Current market assessment and sales planning practices for new products
In case of new products, market potential estimations are based on customer value. If a
new idea is perceived to have customer value, it is estimated how much a customer would
be willing to pay and what should be the sales price in order to do profitable business.
For the product itself, the market potential estimations are largely based on people’s
qualitative thinking and opinion. There is a discussion with sales personnel of certain
target market and with country managers. Kind of “gut feeling” about the new product
idea is used. Realization possibilities, customer need and likely customers are discussed.
However, when considering new market areas, the used methods are more scientific. Own
estimation tool is used and the information is collected from public sources. The info
includes for example how many buildings, what kind of ownerships of buildings, how old
buildings and how much renovation needs there is in the building base of some
investigated market area. That kind of data is compared to existing business information,
and rough estimation of market size is conducted by comparing this analysis to the
number of citizen in the investigated market area. No marketing research services are
used in this process. New product initiatives are brought to so-called product management
group (PMG) meeting. No matter of source for a new idea, it is discussed and proposed
in PMG meeting. New product related sales planning practices follow more or less the
same pipeline with existing products. There is no different plan for new products.
Sales volume planning and forecasting are based mostly on experience and opinion more
than on scientific or quantitative analysis. That kind of initial volumes are generated in
PMG meeting, and when product decision is made, it is taken into account in 12-month
rolling forecast or budgeting, depending on the timing and magnitude of product decision.
In 12-month rolling forecast, it is cross-functionally discussed if it is possible to sell the
new product at an initially planned time. If not, the plan is changed to match the actual
situation. The most initial volume estimations discussed in PMG meeting are not
followed, but when a new product enters to 12-month rolling forecast or budgeting level,
the accuracy of volume estimations for new products is followed the same way as for
existing products.
Same tools and processes are used and same personnel is responsible for sales planning
for new products generated by RaDe kind of activities. RaDe is thought of something
relatively small in case company A, and thus it might be that RaDe-based new products

58
are not considered in the budget or even in the rolling 12-month forecast. However, new
products by RaDe are part of manufacturing 12-month rolling forecast when
manufactured by a subcontractor.
In RaDe kind of small new product introductions planning and decisions are based on
straightforward analysis of likely sales price and costs. For bigger projects, estimations
of the business case are considered in budgeting phase and strategy updates. Main factors
in overall product decisions are sales estimates, schedule, geographical areas and market
areas. No strict formal process is followed.
3.2.3 Current sales planning practices on product portfolio level
Overall sales plans are typically split by product lines and countries. Level of singe sales
person can be used in some cases. Forecast accuracy and sales performance for
corresponding planning levels are measured. In that sense sales planning is done on
product portfolio level in addition to single products.
Usually, when introducing new sales items to existing product lines, a new item is so
different that it is not assumed to have an effect on other sales items. However, if a new
item is a direct replacement for an existing item, ramp-down and ramp-up are planned.
Otherwise, the effect of new sales item’s sales to the sales of existing sales items is not
analyzed muchly, mostly because it is assumed that there is no effect or it is very little.
However, some additions to a portfolio can add sales of existing items. Usually, it is seen
that effect is marginal. The new product is added to the 12-month rolling forecast but
overall sales plan is not updated.
3.3 Current sales planning in case company B
In case company B, sales planning is done by supply chain management (SCM) in co-
operation with sales. SCM collects information from sales and bases sales plans on that.
The overall sales planning is split by country. Inside country-split volumes, there is more
detailed thinking of customer segments and other matters.
The sales planning process has been described but interviewed managers were not
familiar with exact contents. However, the basic procedure contains rough annual plan
done in the fall of the previous year. That can be called a budget as well. The annual plan

59
is turned into a sales plan and the plan is reviewed on a quarterly basis. So called SOP-
meeting discusses between SCM and production about capacity and sales volumes and
how these fit together. The essential target of planning is to match capacity with sales
plans.
Most used tool for sales planning is Microsoft Excel. SAP and specific capacity planning
tool are also used for certain purposes. However, not specific software barely on sales
planning is harnessed.
3.3.1 Current sales planning practices for existing individual products
Volume forecasts are strongly based on history and Excel is the main tool used to analyze
time-series data. Anyhow, interviewed personnel were not familiar with specific time-
series methods such as exponential smoothing. Generally, previous figures and judgment
by experience are the most important foundation for volume estimates. In addition,
customers can be interviewed to get more accurate predictions. The market situation is
also assessed in order to adjust forecast to general trends on the steel markets. Certain
kind of market reviews are also used to aid the forecasting process. A lot of forecasting
is based on a foreseen feeling of market situation and customers. The scope of volume
forecasting is to assess the overall demand and reflect it to the capacity of the factory. Ad
hoc planning regarding individual products is flexible since different steel grades can be
manufactured based on customer orders by adjusting the amount of ingredients used in
the alloy. All the needed ingredients are available in inventory. Sales planning in that
sense differs from products requiring components, sub-assemblies, and assemblies.
Sales price forecasts follow strongly market fluctuations. MEPS International Ltd.
provides a comprehensive analysis of steel market prices in the world. Indications and
price curves provided by MEPS are used by case company B as a benchmark value. Steel
prices differ between countries, and country specific price indications are generated by
MEPS. Additionally, price forecasts are partly based on discussions with customers and
competitor benchmarking.
In terms of forecasting accuracy management and sales planning reactivity, customer
orders are followed-up weekly and reflected to pre-determined allocations. Sales prices
are followed up by sales very carefully. As earlier stated, annual sales plan is reviewed
quarterly and updated if there is a need.

60
3.3.2 Current sales planning practices for new products
Before any NPD project is started to introduce a new product, product management
conducts business case which includes initial sales estimates. Product management
discusses with sales to generate the figures. Interviewed product manager was not familiar
with details of on which assumptions and by which methods sales department creates
sales estimates for new products. Anyhow, generated sales estimates in this kind of
situation depend on the product, market area, people and knowledge level in case.
When a new product is on a certain advanced level of development, case company B
utilizes a trial sales practice. Then among others quantity and price of new product sales
is followed. The figures are compared to those presented in the business case. One year
after new product introduction, a post launch review is held assessing actualized sales
prices, sales volumes and costs.
Sales planning in RaDe is very similar to sales planning in NPD. The business case is
conducted the same way, and same personnel is responsible and same processes used.
However, there are fewer inputs in RaDe related business plan and decision making is
faster.
3.3.3 Current sales planning practices on product portfolio level
Sales planning is based on country level. Due to nature of steel manufacturing process,
the scope of sales planning is to match demand and plant capacity. The focus is less on
individual products, but within the country, the level of planning is more detailed. For
example forecasts for single customers might be analyzed. At case company B, product
portfolio level sales planning solidifies into NPD and RaDe cases in which it is considered
how sales of new steel grade affect to existing grades. The thinking is that capacity is
limited and thus sales of new steel grades are covering part of existing products’ sales.
This is taken into account in sales planning and business case calculations. Overall
ideology is to replace unfavorable steel grades with profitable ones. End of sales for some
certain steel grade does not, however, mean that it is deleted from product portfolio. The
flexibility of steel manufacturing enables the restart of sales if some factor such as
increased demand makes it seem a profitable choice.

61
3.4 Empirical synthesis
For new products, case company A mostly relies on experience and opinion more than on
scientific or quantitative analysis when conducting initial sales predictions for new
products, regardless of NPD or RaDe context. The thinking is based on customer value;
how much a customer is willing to pay for a product with certain utilities and on which
markets it will be sold. Discussions with sales personnel of certain target market are gone
through. Sort of “gut feeling” about the new product idea, its realization possibilities,
potential customers and overall customer need is used.
When an introduced new product is significantly similar to some existing product, case
company A plans ramp-up of the new item and ramp-down of the old one accordingly.
Otherwise, the effect of new sales item’s sales to sales of existing sales items is not
analyzed much, mostly because the assumption is that there is no effect or it is very little.
In case of company B, before any project is started to introduce a new product, product
management conducts a business case which includes initial sales estimates. Product
management discusses with sales to generate the figures. However, interviewed product
manager was not familiar with details of on which assumptions and by which methods
sales department creates sales estimates for new products.
At case company B, product portfolio level sales planning solidifies into NPD and RaDe
cases in which it is considered how sales of new steel grade affect to existing grades. The
thinking is that capacity is limited and thus sales of new steel grades are covering part of
existing product’s sales. This is taken into account in sales planning and business case
calculations. However, the scope of interviews did not enable the gathering of more
detailed info about used business case calculation methods. Overall ideology in case
company B is to replace old steel grades with new, more profitable ones.
The scope of the empirical analyses was heavily on the side of sales planning and related
practices. Table 7 analyzes practices described in literature and practices used by case
companies. The focus of literature review, on the other hand, was on business case
methods and principles in general. Due to the positions of interviewees, time limitations
of interviews and the focus of the questionnaire, the interview data did not allow
fundamental comparison between business case methods and principles found in
literature and business case methods used in case companies. To perform such

62
comparison, broader interviews should be carried through in co-operation with sales and
product management functions.
Table 7. Comparison of sales planning practices between literature and case companies.

63
4 BUSINESS CASE SALES PLANNING CONCEPT FOR
NEW PRODUCTS AND PRODUCT PORTFOLIO
4.1 Defining portfolio effects of new sales item
The impact of the new sales item to the overall product portfolio must be analysed when
introducing a new sales item into product portfolio. The impact can be positive or
negative. The cannibalization between the new and existing products can be even targeted
business strategy to avoid the increase of the number of sales items in total and to make
a room for new product on the markets. If the cannibalization is not intended the impact
might be uncertain. The impact analysis of the new sales items should include following
aspects:
- Which existing market segments, product portfolios and sales items are affected
by the new sales item?
- How are the existing market segments, product portfolios and sales items
impacted?
- Which existing markets segments, product portfolios and sales items are impacted
positively (the ramp up of the new sales items will increase the sales price and/or
volume of the existing sales items)?
- Which existing markets segments, product portfolios and sales items are impacted
negatively (the ramp up of the new sales items will decrease the sales price and/or
volume of the existing sales items)?
- How much is the intended total sales increase or decrease by the affected sales
items?
- How much is the intended total sales increase or decrease by the affected product
portfolios?
- How much is the intended total sales increase or decrease by the affected market
segments?
- Are some existing sales items intended to be ramped down totally? If yes, on what
timeframe?
This analysis is based on qualitative estimates. However, this kind of planning is
necessary in order to assess the real business viability of the new sales item. Doing that,
financial metrics such as NPV, payback time and IRR are calculated in a way that takes

64
into account product portfolio changes in sales. If the new item cannibalizes portfolio
sales, calculating financial metrics without performing impact analysis makes the new
item appear unrealistically profitable. On the other hand, in some cases, the new item
increases portfolio sales, and neglected impact analysis in such case leads the calculated
financial metrics to indicate the new item to be less advantageous than it really is. Both
scenarios can lead to unfavorable business decisions.
4.2 Base-Case Scenario analysis for affected sales items
Table 8 shows a cash flow template for a single existing product for one year. Here,
product margin can be handled as a net cash flow for a single product. The table is very
simplified, and different cash outflows and inflows are added on occasion. For existing
products, this kind of analysis should be actively performed in order to follow current
profitability. Moreover, active cash flow assessment on sales item –level enables
estimation of likely effects in the case of a new sales item. Predictions of cash flows for
existing products can act as a Base-Case Scenario in business case analysis related to an
NPD– or RaDe project.
In Base-Case scenario analysis, it is estimated what the expected net cash flows would be
for affected sales items over the new product’s planned life cycle if the new item would
not be introduced at all. This kind of analysis focuses on the initially planned scenario for
existing products. If a new item is planned to be sold at years 1–5, Base-Case scenario
analysis calculates the initially expected net cash flows for each affected sales item over
years 1–5.
Table 8. Net cash flow calculation for single sales item for year t.

65
4.3 Base-Case scenario analysis and new sales item related business case
This chapter proposes how sales planning and related financial analysis for new sales item
can be done so that negative or positive effect on product portfolio level sales is taken
into account. This method is valid for new sales items developed by both full-scale NPD
and RaDe. However, the level of detail varies between occasions.
The expected net cash flows for affected sales items in the case of introduced new sales
item can be calculated after Base-Case scenario analysis is performed. Now, it is likely
that expected net cash flow for each affected sales item has decreased due to planned
cannibalization. However, the effect can be also positive for example in a case in which
new introduction to a product line is complementary and enables a company to have more
customers due to that offering. The decrease or increase of net cash flow of each affected
sales item at year t must be taken into account as a cash outflow or inflow for the new
item at a corresponding year. By doing this, the NPV and other financial calculations for
a new sales item take into account the sales decrease or increase of existing items. Thus,
taken that net cash flow calculations are accurate, positive NPV for new sales item
indicates that introduction of that sales item enhances the overall product portfolio
profitability. On the other hand, negative NPV for the new sales item evidences that
adding the sales item harms the product portfolio’s financial performance. Figure 20
illustrates the use of Base-Case scenario analysis in new sales item related NPV
calculations.
This methodology can be used to calculate all financial metrics presented in chapter 2.9
so that the product portfolio level impacts are accounted for. NPV, IRR, profitability
index and payback method are all based on net cash flow calculations and thus, depending
on the decision making criteria of a company in case, the presented procedure can be
adapted to calculate all mentioned key figures.
The upper scenario in figure 19 illustrates a simplified situation in which a company is
selling sales items A, B and C within a certain product line. When doing sales plan for
year 2 without taking into account the effect sales item D has on existing items, the
anticipated volume for A and B is 200 and 300 units, respectively. However, in this
specific example the new sales item D will not generate totally new market share; part of
its sales is cannibalized from sales items A and B. If this is not taken into account in

66
decision making, a new sales item developed by NPD or RaDe can initially seem
considerably more attractive in terms of NPV, IRR, payback time and profitability than
it really is. The opposite applies to the lower scenario in which the new item increases
portfolio sales. In this scenario, the new item will seem less attractive than it truly is. In
both scenarios, neglecting of portfolio impact can lead to unrealistic business case
calculations and moreover to unfavorable decisions and thus actually harm product
portfolio level profitability.
Figure 19. Example of product portfolio level sales planning in case of new sales item with and
without planned portfolio impact.

67
Figure 20 illustrates the Base-Case scenario analysis by using upper scenario of figure 19
as an example. In figure 20, Base-Case scenario calculates net cash flows for sales items
A, B and C and for years 1-5 with the assumption that the new sales item D affecting sales
would not be introduced. For year 2, this would mean net cash flows would be calculated
based on sales volumes 200, 300 and 150 for A, B and C, respectively. On the contrary,
new business case scenario calculates net cash flows for sales items A, B and C so that
cannibalization by item D is taken into account. In this case, the net cash flow for year 2
would be calculated based on sales volumes 100, 200 and 150 for A, B and C. The sum
of differences in net cash flows for each year is taken into account as a cash outflow for
respective year (or as an inflow, if the effect is positive) when calculating NPV for the
new sales item D.
Figure 20. NPV calculation for new sales item with a comparison to the Base-Case scenario.
4.4 Product portfolio level sales planning and follow-up concept
Business case analysis on product portfolio level analyses all products over the life cycle
phases on the side of commercial product portfolio consisting of market segments,
customers, solutions, product families, sub-product families, product configurations and

68
sales items. Business case sales planning should take place on corresponding portfolio
level accuracy.
In addition to sales planning related to business case and introduction of a new product,
regular sales planning should also be executed on product portfolio level. The level of
detail in sales planning for individual sales items should be the sales volumes and the
sales prices. Each product manager should define targeted volumes and prices for each
sales item in a way that the metric for sales planning is revenue in euro or other currency
in use. The actual sales performance should be followed on the same accuracy. The
detailed, sales item –level sales plans and actual sales figures should be rolled up to higher
product portfolio levels on a revenue basis. By doing that, targeted and actual sales
revenues for each product portfolio level, such as product line and business line can be
analyzed and compared. In the empirical part of this study, regular sales planning
practices were analyzed in the comparison between literature and interviewed case
companies. Table 9 provides a recommended methodology for these practices.

69
Table 9. Recommended sales planning practices.
As a part of this study, an Excel template was built to illustrate how product portfolio
level sales planning can be executed and followed up. The template collects sales plans
for individual sales items on a quarterly basis including targeted sales volumes and sales
prices. These targeted figures are rolled up to upper portfolio levels. This practice shows
targeted sales revenue for each sub-product family, product family et cetera depending
on portfolio levels in use in the case on hand. The Excel template was built on simple
business line – product line – sales item –structure with three customer accounts selling
this commercial product portfolio. In the template, actual sales figures of individual sales

70
items by different customer accounts are registered quarterly. Like the targeted figures,
actual figures are also rolled up to upper portfolio levels and the comparison of targeted
and actual performance takes place on every portfolio level including customer accounts.
This enables sales performance analysis for individual sales items, product lines, business
lines and customer accounts. Figure 21 presents a framework illustrating the logic of the
Excel template functioning. Furthermore, the template combines most important
quarterly figures to a sheet presenting figures for one year.
Figure 21. Product portfolio level sales planning based on targeted and actual sales figures
(volume * price) including a follow-up concept.
This framework and Excel template can also act as a simple simulation tool when new
sales item is introduced by NPD or RaDe. In such situation, product portfolio effects of
new sales item are defined as described in chapter 4.1. Then, the template is run with a
Base-Case scenario presented in chapter 4.2; that is to say with the expected sales figures
in a situation in which new sales item is not introduced. After that, new sales item is added
into the template and the sales plan for affected sales items is updated in order to take into
account the planned portfolio impact. This analysis enables the product portfolio sales
evaluation so that the effect of new sales item can be analyzed on the level of individual
sales items, product lines, business lines and customer accounts or according to a specific
company product portfolio structure.

71
5 CONCLUSION
This chapter summarizes the results for each of the research questions. Furthermore,
research validity and reliability of the study are discussed. Overall success and
contribution of the study are also evaluated and possible themes for further studies on this
subject are proposed.
5.1 Research results
Business case calculations for new product development, rapid development and product
portfolio is a synthesis of earnings and costs. For new products, main business case
methodology conducts sales estimates from market assessment. Sales revenue estimate is
a result of estimated volume * estimated price. The market assessment covers matters
such as total market size, target market, market growth and extent of competition. This is
the basis for sales volumes. Customer need–, customer benefit– and customer value
analysis define the likely sales price customers are willing to pay. Sales estimates are
combined with cost predictions and based on that synthesis, financial analysis is carried
through to define the attractiveness of the case. However, the focus of this study is on
sales planning and cost side of the business case is taken into account only generically.
Most used financial metrics to score new product development project attractiveness are
NPV, ROI, IRR and payback time.
According to an empirical current state analysis, case company A mostly relies on
experience and opinion more than on scientific or quantitative analysis when conducting
initial sales predictions for new products, regardless of NPD or RaDe context. The
thinking is based on customer value; how much is a customer willing to pay for a product
with certain utilities and on which markets it will be sold. Sort of “gut feeling” about the
new product idea, realization possibilities and customer need are used. In case of company
B, before any project is started to introduce a new product, product management conducts
a business case which includes initial sales estimates. Product management discusses with
sales to generate the figures. However, interviewed product manager was not familiar
with details how sales department creates sales estimates for new products.
In product portfolio level point of view, when an introduced new product is significantly
similar to some existing product, case company A plans ramp-up of the new item and

72
ramp-down of the old one accordingly. Otherwise, the effect of new sales item’s sales to
sales of existing sales items is not analyzed much, mostly because the assumption is that
there is no effect or it is very little. On the other hand, at case company B product portfolio
level sales planning solidifies into NPD and RaDe cases in which it is considered how
sales of new steel grade affect to existing grades. The thinking is that capacity is limited
and thus sales of new steel grades are covering part of existing products’ sales. This is
taken into account in sales planning and business case calculations. Overall ideology is
to replace old steel grades with new, more profitable ones.
As a main result of the study a constructing, a concept of how business case calculations
should be done for individual new products and product portfolio, was developed. First,
when introducing a new sales item is considered, it must be analyzed how it will affect
the sales of existing sales items on a portfolio level. By means of planned product
cannibalization, it should be defined how much sales of existing sales items will diminish
due to the introduction of a new sales item. After defining which sales items are likely
affected positively or negatively by new sales item and how much, so called Base-Case
scenario is run for the affected items. In Base-Case scenario analysis, it is estimated what
the expected net cash flows for affected sales items would be over the new product’s
planned life cycle if the new item would not be introduced at all. After Base-Case scenario
analysis is performed, the expected net cash flows for affected sales items in the case of
introduced new sales item can be calculated. It is likely that expected net cash flow for
each affected sales item has decreased. The increase is also possible on some occasions
such as when introducing the new sales items to totally new market segments and
customers. The decrease or increase of net cash flow of each affected sales item at year t
must be taken into account as a cash outflow or inflow for new sales item at a
corresponding year. By doing this, financial metrics based on cash flows take into account
the sales decrease or increase of existing items. Such major metrics are NPV, IRR,
profitability index, and payback time. When business case calculation for single new sales
item is executed like this, positive NPV for new sales item indicates that introduction of
the sales item improves profitability on product portfolio level.

73
5.2 Theoretical contribution
Taking product portfolio level effects in business cases is mentioned in literature several
times, but existing literature does not provide explicit practices for implementing business
case calculations in a way that accounts for sales volume and price changes on product
portfolio. Portfolio effects have been mentioned by Ulrich and Eppinger (2008) in context
of cash flow calculations, and Kinnunen et al. (2011 & 2014) point out portfolio level
impacts shortly in their business case frameworks for NPD and rapid productization.
However, methodology to execute business case calculations on product portfolio level
is not available adequately. However, among others, Raghavan Srinivasan et al. (2005)
provide tools to estimate the level of cannibalization on product portfolio. Based on that,
a sales decrease of existing sales items should be estimated when introducing new sales
item.
In regular sales planning point of view, literature presents mainly the sales volumes as
the unit of forecasting and sales planning. This study expands the sales planning literature
by highlighting that the sales plan should consist of both targeted volumes and targeted
sales prices and that the actual events should be followed with a comparison to initial
target-setting on product portfolio level.
In this study, previous research is applied and the coverage of the topic is extended. The
result of the study might have filled a notable research gap. Based on literature review
and case company analyses, this study developed an easily understandable concept of
how to do business case calculations for single new sales item so that calculated financial
metrics account for changes on product portfolio level. As such, that kind of methodology
was unavailable in earlier research.
5.3 Managerial implications
At least, this concept can act as a reminder for managerial decision-makers; a new sales
item does not likely generate completely new sales revenue, but it takes market share
from existing products. On the other hand, the new sales item can also accelerate the sales
of existing items. Both scenarios should be taken into account when estimating the
profitability of a new product. The Base-Case scenario business case calculation
methodology provided in this study is eligible for calculating different cash flow -based

74
financial metrics. The presented framework for calculating financial metrics for
individual new sales item should be used when conducting a business case for new
product initiative. Following that methodology ensures that product portfolio level effects
on sales are taken into consideration early in NPD and RaDe projects, and thus the true
business value of a new product initiative can be more precisely assessed from the very
beginning.
In addition to Base-Case scenario model for business case calculations, a product
portfolio level sales planning and follow-up concept and related Excel template were
constructed as a part of this study. The developed concept proposes that product managers
should generate targeted sales volume and sales price figures for each individual sales
item. The level of sales plan should be (sales volume * sales price) and thus the unit of
sales planning for individual sales items should be revenue. That kind of thinking is
important especially in cases in which a new item replaces an old item. In such cases,
typically sales prices are decreased in addition to sales volumes. This must be taken into
account both in the regular sales planning and the business case calculations for the new
item. In product portfolio sales planning point of view, the targeted and actual revenues
of each sales item should furthermore be rolled up to upper portfolio levels so that
performance of different product portfolio levels can be analyzed. To summarize, the
product portfolio level sales planning and follow-up concept and especially the related
Excel template can act as a simple control tool; sales performance can be assessed and
compared to targeted level on each commercial portfolio level and for each customer
account. This kind of practice can aid managers to perform reasoned product portfolio
related decisions. For example, it can be continuously assessed which sales items, product
lines and business lines are performing well in relation to set targets and on the contrary,
which ones are doing poorly. The Excel template can assist managers to perform
continuous analysis with less effort. That kind of timely sales performance management
enables managers to react agilely to noticed problems and other events that can affect the
profitability of product portfolio.
5.4 Validity and reliability
This research was constructed as a bi-case study. Two case companies were interviewed
in sessions lasting approximately one hour each. This is the major drawback of the study.
Research sampling for case company analysis is narrow, and interviewed managers were

75
not specialists in sales, which led to the rough description of processes and practices used.
The time limitations for interviews also influenced the scope of discussions. The impact
of case company analyses on results of this study could be more significant if larger
sample and more in-depth interviews would have gone through. We were not able to
gather all wanted information with these interview limitations. Ideally, broader interviews
should be performed in co-operation with sales and product management in order to get
deeper insight both on the used sales planning and business case practices in case
companies. Doing that, the information of how sales generate sales volume and price
estimates could be combined with information of how product management uses the
information provided by sales to conduct business cases. Moreover, the validity of the
proposed methodology in real life business environment is not yet proven. Proposed
methodology’s operability should be tested in practice to examine its validity for the
intended purpose. Anyhow, the study was able to provide a result that matches the initial
target setting.
The result of this study relies firmly on existing literature, which was explored widely
during the research process. Taken the narrow sample on empirical part of the study, it is
beneficial that the proposed frameworks are constructed mainly on existing literature
instead of current state analysis. Considering the wide theoretical basis and its significant
impact on results, it can be evaluated that the reliability of this study is on an adequate
level. In addition, we do not believe that the proposed result of this study would be
different even if empirical analysis would have been broader.
5.5 Future research
A business case calculation concept for new sales item taking into account product
portfolio level effects was proposed. In addition, a product portfolio level sales planning
and follow-up concept with illustrating Excel template were developed. Possible future
research could be a case study examining these concepts in real-life. It would be beneficial
to investigate if these frameworks are feasible in real NPD- and RaDe-projects, and does
the use of proposed business case calculation methodology actually improve the accuracy
of financial metric calculations in relation to methods used earlier in some case company.
Moreover, the product portfolio level sales planning and follow-up concept could be
researched when used as a control and performance evaluation tool in a case company.

76
REFERENCES
Asiedu, Y., & Gu, P. (1998). Product Life Cycle Cost Analysis: State of the Art
Review. International Journal of Production Research 36(4), 883–908.
doi:10.1080/002075498193444
Barringer, H., Weber, D. (1995). Life-cycle cost tutorials. In Fourth International
Conference on Process Plant Reliability, Gulf Publishing Company
Barringer, H. (2003). A Life Cycle Cost Summary. International Conference of
Maintenance Societies. ICOMS®-2003, 1–10.
Blank SG & Dorf B (2012) The startup owner's manual : the step-by-step guide for
building a great company. Pescadero, CA, K&S Ranch.
Blythe J (2012) Essentials of marketing. Harlow, Pearson.
Cahill DJ (1997) Target marketing and segmentation: valid and useful tools for
marketing. Management Decision 35(1): 10-13.
Capon N & Hulbert JM (2007) Managing marketing in the 21st century : developing
and implementing the market strategy. Bronxville, N.Y., Wessex Inc.
Carbonell-Foulquié P, Munuera-Alemán JL & Rodrıguez-Escudero AI (2004) Criteria
employed for go/no-go decisions when developing successful highly innovative
products. Industrial Marketing Management 33(4): 307-316.
Cole, R. J., & Sterner, E. (2000). Reconciling theory and practice of life-cycle costing.
Building Research & Information, 28(5-6), 368-375.
Cooper RG (2008) Perspective: The Stage‐Gate® idea‐to‐launch process—Update,
what's new, and NexGen systems. J Prod Innovation Manage 25(3): 213-232.
Cooper RG & Edgett SJ (2012) Best practices in the idea-to-launch process and its
governance. Research-Technology Management 55(2): 43-54.

77
Cooper RG, Edgett SJ & Kleinschmidt EJ (1997) Portfolio management in new product
development: Lessons from the leaders—I. Research-Technology Management
40(5): 16-28.
Cooper RG, Edgett SJ & Kleinschmidt EJ (1999) New product portfolio management:
practices and performance. J Prod Innovation Manage 16(4): 333-351.
Cooper RG (1993) Winning at new products : accelerating the process from idea to
launch. Reading, MA, Addison-Wesley.
Cooper RG (2001) Winning at new products : accelerating the process from idea to
launch. Cambridge (Mass.), Perseus Publishing.
Cooper RG (2011) Winning at new products : creating value through innovation. New
York, Basic Books.
Cravens DW (1994) Strategic marketing. : xxxi, 811, 15 sivua.
Dhillon BS (2009) Life cycle costing for engineers. , CRC Press.
Drury C (2012) Management and cost accounting. Andover, Cengage Learning EMEA.
Emblemsvåg, J. (2003) Life-cycle costing: Using Activity-Based Costing and Monte
Carlo Methods to Manage Future Costs and Risks. John Wiley & Sons, Inc., New
Jersey, USA.
Fabrycky, W. J., & Blanchard, B. S. (1991). Life-cycle cost and economic analysis.
Prentice Hall.
Garrison, R., Libby, T., Webb, A., Noreen, E., Brewer, P. (2015) Managerial
Accounting Tenth Canadian Edition. Canada: McGraw-Hill Ryerson Limited, 679
p. ISBN 978-1-25-902490-0
Gore , A., Panizzolo, R. (2012). Operations Management. Delphi: Cengage Learning,
581 p. ISBN 978-81-315-1646-1
Hague PN, Hague N & Morgan C (2013) Market research in practice: how to get greater
insight from your market. London, Kogan Page.

78
Haines S (2014) The Product Manager's Desk Reference 2E. , McGraw Hill
Professional.
Hänninen K, Kinnunen T, Muhos M & Haapasalo H (2012) Rapid productization -
empirical study on preconditions and challenges. 1/2012.
Hänninen K, Kinnunen T, Muhos M & Haapasalo, H. (2014) Decisions in setting up
rapid development projects in SMEs. R&D Management Conference, 3-6 June
2014, Stuttgart, Germany.
Harkonen J, Haapasalo H & Hanninen K (2015) Productisation: A review and research
agenda. Int J Prod Econ 164: 65-82.
Heizer J & Render B (2014) Operations management : sustainability and supply chain
management. Harlow, Pearson.
Information Systems Audit and Control Association (2010) The business case guide :
using Val IT 2.0. Rolling Meadows, IL, ISACA.
Jobber D & Lancaster G (2015) Selling and sales management. Harlow, Pearson.
Keen JM (2011) Making technology investments profitable : ROI roadmap from
business case to value realization, second edition. Hoboken, N.J., John Wiley &
Sons.
Kinnunen, T., Hanninen, K., Haapasalo, H. and Kropsu-Vehkapera, H. (2014) ‘Business
case analysis in rapid productisation’, Int. J. Rapid Manufacturing, Vol. 4, No. 1,
pp.14–27.
Kinnunen, T., Pekuri, A., Haapasalo, H. and Kuvaja, P. (2011) ‘Business case analysis in
new product development’, Global Journal of Management and Business Research,
Vol. 1, No. 1, pp.49–56.
Korpi, E., & Ala-Risku, T. (2008). Life cycle costing: a review of published case
studies. Managerial Auditing Journal, 23(3), 240–261.
Krajewski LJ, Ritzman LP & Malhotra MK (2012) Operations management: processes
and supply chains. Boston, Pearson Education.

79
Kropsu-Vehkapera H & Haapasalo H (2011) Defining Product Data Views for Different
Stakeholders. Journal of Computer Information Systems 52(2): 61-72.
Kropsu-Vehkaperä H (2012) Enhancing understanding of company-wide product data
management in ICT companies. Oulu, Oulun yliopiston kirjasto.
Lilien GL, Morrison PD, Searls K, Sonnack M & Hippel Ev (2002) Performance
assessment of the lead user idea-generation process for new product development.
Management science 48(8): 1042-1059.
Lindholm A & Suomala P (2007) Learning by costing: Sharpening cost image through
life cycle costing? International journal of productivity and performance
management 56(8): 651-672.
Lohikoski, P., Kujala, J., Haapasalo, H. and Ala-Mursula, L., 2014, July. Information
contingencies in the virtual teams of global new product development projects. In
Proceedings of the PMI Research and Education Conference (pp. 27-29).
Loutfy R & Belkhir L (2001) Managing innovation at Xerox. Research-Technology
Management 44(4): 15-24.
Mariotti S & Glackin C (2012) Entrepreneurship & small business management.
Boston, Prentice Hall.
Nahmias S & Olsen TL (2015) Production and operations analysis. , Waveland Press.
O’Connor M, Remus W & Griggs K (2000) Does updating judgmental forecasts
improve forecast accuracy? International Journal of Forecasting 16(1): 101-109.
Otto, K.N. and Wood, K.L (2001) Product Design: Techniques in Reverse Engineering
and New Product Development, Prentice Hall, Upper Saddle River, New Jersey.
Raghavan Srinivasan S, Ramakrishnan S & Grasman SE (2005) Identifying the effects
of cannibalization on the product portfolio. Marketing intelligence & planning
23(4): 359-371.
Reifer DJ (2001) Making the software business case: improvement by the numbers.
Boston, Mass., Addison-Wesley.

80
Simula H, Lethtimäki T & Salo J (2008) Re-thinking the product: from innovative
technology to productized offering. Proceedings, Proceedings of the 19th
International Society for Professional Innovation Management Conference, Tours,
France.
Slack, N., Brandon-Jones, A., Johnston, J. (2016). Operations Management (8th ed.).
Harlow: Pearson Education, 728 p. ISBN 978-1-292-09867-8
Sääksvuori A & Immonen A (2008) Product lifecycle management. Berlin, Springer.
Schmidt MJ (2009) Business case essentials. A Guide to Structure and Content.
Stark J (2015) Product lifecycle management. Cham, Springer.
Tolonen, A. (2016), Product management lecture notes (Unpublished reference)
Tolonen A, Harkonen J & Haapasalo H (2014) Product Portfolio Management—
Governance for Commercial and Technical Portfolios over Life Cycle. Technology
and Investment 5(04): 173.
Tolonen A, Shahmarichatghieh M, Harkonen J & Haapasalo H (2015) Product portfolio
management–Targets and key performance indicators for product portfolio renewal
over life cycle. Int J Prod Econ 170: 468-477.
Ulrich KT & Eppinger SD (2008) Product design and development. Boston, McGraw-
Hil.
Van De Weerd I, Brinkkemper S, Nieuwenhuis R, Versendaal J & Bijlsma L (2006)
Towards a reference framework for software product management. Requirements
Engineering, 14th IEEE International Conference. , IEEE: 319-322.
Van Horne JC (1992) Financial management and policy. Englewood Cliffs (N. J.),
Prentice-Hall.
Vigna, L., Hänninen, K., Kaikkonen, H., Haapasalo, H., 2015. How to build a
wellperforming team for rapid development. R&D Management conference, 23–26
June 2015, Pisa, Italy.

81
Zeller, T. L., & Metzger, L. M. (2013). Good Bye Traditional Budgeting, Hello Rolling
Forecast: Has The Time Come?. American Journal of Business Education (Online),
6(3), 299.

82
APPENDIX 1: Interview questionnaire


APPENDIX 2: Excel template for product portfolio level sales planning and follow-up
Table 1. Table summarizing yearly sales performance for each customer account under
analysis.

Table 2. Table summarizing yearly sales performance for each business line under analysis.

Table 3. Quarterly summary of sales performance for each customer account under analysis.

Table 4. Quarterly summary of performance for each business line.