Embed Size (px)
Citation preview
International Journal of Economics, Commerce and Management United Kingdom Vol. VI, Issue 2, February 2018
Licensed under Creative Common Page 323
http://ijecm.co.uk/ ISSN 2348 0386
BUSINESS ANALYSIS IN CONVERSION OF REGIONAL DEVELOPMENT
BANK INTO SHARIA BANKING: CASE STUDY IN NTB PROVINCE, INDONESIA
Hanif Rahmatullah
Faculty of Economy and Business Padjadjaran University, Bandung Indonesia
Rachmat Sudarsono
Faculty of Economy and Business Padjadjaran University, Bandung Indonesia
Ratna Komara
Faculty of Economy and Business Padjadjaran University, Bandung Indonesia
Abstract
This paper aims to formulate strategy to strengthen Regional Development Bank in Indonesia
(Bank NTB) and analyze the impact of the strategy using Business valuation method. A
Quantitative strategic Planning Matrix (QSPM) is conducted to formulate proper strategy
according to Bank NTB’s Internal Factor Environment (IFE), External Factors Environment
(EFE), and competitive profile Matrix. A Dividend discounted model (DDM) model is also used
to assess the effect of Bank NTB business conversion value by comparing the difference from
its existing business value in conventional bank. We also include the risk of uncertainty
probability return on asset (ROA) both in conventional and sharia based business using
combined DDM-Monte Carlo simulations (MCS) that used to estimate the impact of the risk
(volatility) of ROA to the Bank NTB Business Value. The results revealed that using QSPM - the
best strategy for Bank NTB - is to convert business it business to Sharia based bank. Moreover
using business valuation method, Bank NTB with Sharia based business will generate greater
value than existing Bank NTB’s conventional core business.
Keywords: Business valuation, Regional development bank, Islamic Bank, Bank Conversion,
Monte Carlo simulation
© Rahmatullah, Sudarsono & Komara
Licensed under Creative Common Page 324
INTRODUCTION
Indonesia is the 4th largest country and most of its populations are Muslims. As a country with
highest Muslims, the Islamic based economy also has a significant portion in the country’s
public choice. To the end of 2015, Indonesia Islamic finance asset ranks at 9th position among
countries that operates Islamic based business (Thomson and routers, 2016). Saudi Arabia and
Iran have the largest Islamic finance asset since their country’s ideologies are Islam even differ
in sect (sunni and shi’a). Malaysia moreover became the 3rd largest bank with extraordinary
growth of Islamic finance performers according to Thomson and routers, (2016), research which
based on country’s quantitative development, knowledge, government, CSR and awareness,
whereas Indonesia ranks at 10th position.
Indonesia Islamic finance is divided into five categories, sukuk (bonds), takaful
(insurance), Islamic Banking, Islamic funds/financing, and other Islamic finance instruments.
Sukuk are the most popular instrument used in Indonesia while other top 10 countries assets
are grown more in Islamic banking instrument (Thomson and routers, 2016).
Islamic banks in Indonesia were grown slowly under 5% before 2016 and then start to
grew up after the full flagged conversion of Regional Development Bank (RDB) Aceh to 5, 71%
on Islamic market share. Even the conversion results in the declining of Bank Aceh profitability
due to the unrecognizing of conventional interest income after the conversion.
Before the conversion of Bank Aceh, several sharia banks in Indonesia are previously
converted from the conventional bank. Some of those banks, in the beginning of conversion
generated positive trends on their financial performance, and the other experienced the
negative trends.
Bank Panin Sharia, Bank Mega Sharia, and Maybank Sharia are the examples of the
bank that experienced negative trends in their financial performance (ROA and ROE). In the
contrary, Bank Victoria and BRI experienced positive trends in the beginning of their conversion.
In the end of 2016, Bank NTB as a Regional Development Bank owned by the local
government in NTB Province decided to follow the mentioned banks by convert it business into
Islamic bank. Bank NTB recently operated in conventional bank and provided Islamic Windows
Bank/ business unit. This conversion is expected to be completed by August 2018.
Shafiiet al. (2016) states that the motivation of conversion varies from bank to bank and
from country to country depending on the situation of the State. But in general, almost all
research reveals that religion is the main and most significant factor affecting conventional
banks to convert to Islamic banking system. Referring to the research, Bank NTB policy came
out with a reason that the majority of the population of NTB is Muslim.
International Journal of Economics, Commerce and Management, United Kingdom
Licensed under Creative Common Page 325
The process of conversion requires consideration in both the comprehensive review of the
conversion and the performance of the bank during the conversion period. This conversion
process should consider the element of business projection both during and after the conversion
period in order to make a positive impact on the growth of the company and generate an optimal
contribution for the local government through the return of local financial assets investment.
Business valuation in this case is a very important aspect in strategic decision making by
stakeholder.
This study aims to conduct strategy formulation and business evaluation on the
conversion of NTB bank system in the NTB province. More specifically, this study will answer
the following :
[1] Are the conversion process has considered the strategy formulation?
[2] What is the business value of conversion using Dividend Discounted Model?
[3] What is the business value of conversion using Monte Carlo simulation to include the risk
element of ROA volatility based on the mean and standard deviation of historical data on sharia
banking loans allocation in NTB?
LITERATURE REVIEW
Conventional vs. Islamic Banks
Imam and Kpodar (2016), classified conventional banks as banks in practice provide loans
based on the value of collateral. While the characteristics of risk sharing in Islamic banking is
defined by agreement between the borrower and the bank to divide the investment risk based
on an agreement and divide any profit or loss between them, without providing payment
guarantee. They also found that Islamic banking, which is one of the fastest growing segments
in global finance, has a unique feature that is particularly suited to developing countries and
almost closely related to the real economy than conventional.
Hutapea and Kasri (2010), in their research on commercial banks and Islamic in
Indonesia stated that Islamic banking margins are responsive to market interest rate volatility.
This indicates the existence of market interest rate stability is a big concern in developing
Islamic banking industry. This result is in line with Trad et al. (2017) who have found that the
macroeconomic variables, except for inflation, are external indicators that favor the stability of
Islamic Banks.
Louati and Boujelbene (2015), on their research explain that the spectacular growth of
Islamic finance in the last few decades is due to several factors, especially the rise in oil prices
© Rahmatullah, Sudarsono & Komara
Licensed under Creative Common Page 326
and the proportion of Muslims in the population. She also found that in some studies, Islamic
banks appear as complementary not a substitute for conventional banks.
Furthermore Louati and Boujelbene (2015) in their research stated that increasing in the
size of Islamic banks can contribute to the strength and stability of the banking system as a
whole. This opinion is supported by Zarrouk et al. (2016), argued that there are many reasons
that may explain the fact of higher capitalization drives profitability. First, Islamic banks with high
profit and loss sharing capitalization ratios provide tight and wise loans. Second, Islamic banks
with a healthy capital position are able to pursue more effective business opportunities and
achieve increased profitability. Moreover Sudarsono (2009), found that Islamic banking system
is more stable than conventional bank in facing global financial crisis. He also found that
financial performance of Islamic banking compared to conventional bank has more consistent
and efficient conditions.
Mahmood (2005) in Hamid and Azmi (2011), with a case study on banks in Pakistan,
compared the financial performance of Islamic banking to conventional. He found that, almost in
all ratios, Islamic banks were superior to conventional banks during 2000 to 2004. The result
was in line with Olson and Zoubi, (2008), Bitar et al. (2017), who found on their research that
Islamic bank will have some characteristics such as higher capital, liquidity, and profitability.
Conversion Motives
Zoub (2008) in Zaki and Hussainey (2015), investigates the most important motives behind the
conversion process. He found that conventional banks convert to Islamic banks to: (1) retain
their customers; (2) for believing in the prohibition of riba; (3) competence to attract customers
of Islamic products and (4) to imitate success in Islamic banking and achieve higher returns.
Conversion Forms
Mostufa (2006) in Zaki and Hussainey (2015), divided the conversion forms as follows.
1) The full conversion: In this case the conventional banks are converted into to Islamic
banks. This might be caused because of a legal conversion of a country (such as Iran,
Pakistan and Sudan) or because of the decision of the conventional banks to be full-
fledged Islamic banks.
2) The other way is the micro conversion which takes many shapes such as (1) establishing
an Islamic window in the conventional bank; (2) providing some Islamic products,
instruments or investment funds and (3) converting a branch or more of conventional
banks into Islamic branches.

International Journal of Economics, Commerce and Management, United Kingdom
Licensed under Creative Common Page 327
RESEARCH METHODOLOGY
Research Design
This paper used two managerial approaches to formulate the best strategies in order to
strengthen the regional development Bank Nusa Tenggara Barat, Indonesia. First is strategy
formulation method using Quantitative Strategic Planning Matrix (QSPM) and second is
business Valuation method using Dividend Discounted model. Moreover, to include the risk of
loan growth uncertainty, we combine DDM with Monte Carlo Simulation that generated
numbers of pseudo random probability based on firm’s Return on Asset (ROA) historical
performance.
Strategy Formulation
Strategy formulation according to David (2011) is a part of strategic management refers to
developing a vision and mission, identifying an organization’s external opportunities and threats,
determining internal strengths and weaknesses, establishing long-term objectives, generating
alternative strategies, and choosing particular strategies to pursue. Strategy formulation is
divided into three stages. First is input Stage. In this stage, we analyze the environmental factor
of the firm. David (2011) divided the factors into Internal Factor Environment (IFE), External
Factor Environment (EFE) and Competitive Profile Matrix (CPM). IFE is related to the strength
and weakness in organization and consisted of its structure, culture and resources. The
resources can be analyzed in company’s business function such as business operation, human
resources management, finance, marketing and technology.
EFE especially the societal environment/macro factors is mankind’s social system that
includes general forces that do not directly touch on the short-run activities of the organization,
but that can influence its long-term decisions (Wheelen, 2014). This environment can be
analyzed by using PEST analysis which is an acronym of Politic-Law, Economy, Socio-cultural
and technological factors. To formulate the environmental factors into alternatives, several
matrix are used such as TOWS Matrix, IE Matrix, and Grand Strategy Matrix. TOWS matrix are
examined the IFE and EFE and evaluated them using approach proposed by (Vaněk et al.
2012) which score each variable with (-2) to 2 according to degree of their relationship. The
second Matrix is IE Matrix which scores the IFE and EFE according to its influence to company
with 4 (very strong), 3 (strong) on Strength and Opportunity and 2 (strong), 1 (very strong) on
weakness and Threat (Ommani, 2011). The last is grand strategy matrix with map the
competitive position and market growth and divide the market profile into four quadrant with
each alternatives provided. While CPM is the competitive position of firm among its rivals in the
© Rahmatullah, Sudarsono & Komara
Licensed under Creative Common Page 328
industry that in this study are based on the profitability profile (ROA) , efficiency profile (BOPO)
and credit risk profile (NPL) of Bank NTB competitors based on availability of data.
After executing matching stage by defining alternatives from each matrix, the proposed
alternatives are be discussed and added to the list of feasible alternative options to be decided
using QSP Matrix. The QSPM is a tool that allows strategists to evaluate alternative strategies
objectively, based on previously identified external and internal critical success factors. Like
other strategy-formulation analytical tools, the QSPM requires good intuitive judgment (David,
2011).
QSP Matrix consist of strategic alternatives, key factors (IFE and EFE), weights,
attractiveness scores, total attractiveness scores, and the sum total attractiveness score. The
attractiveness scores range from 1 (not attractive), 2 (somewhat attractive), 3 (reasonably
attractive), and 4 (highly attractive). In This research, we used modification on QSPM scoring
using Ommani (2011) approach with 4 (highly attractive), 3 (attractive) on Strength and
Opportunity and 2 (attractive), 1 (highly attractive) on weakness and Threat (Ommani, 2011).
The Sum Total Attractiveness Scores (STAS) reveal which strategy is most attractive
in each set of alternatives. Higher scores indicate more attractive strategies, considering all
the relevant external and internal factors that could affect the strategic decisions. The
magnitude of the difference between the Sum Total Attractiveness Scores in a given set of
strategic alternatives indicates the relative desirability of one strategy over another (David,
2011).
Business Valuation
In valuing the firm under different strategy that formulated using QSP Matrix, we used the
income approach. The use of income approach is based on its characteristic that present
valuing the future economic benefit of the business. The characteristic is in line with potential
economic benefit in different type of business generated from the QSPM analysis. This
approach can be applied by using free cash flow (FCF). The FCF models are divided into free
cash flow to firm and free cash flow to equity (FCFE). The usage of the models are depends on
the firms valued and the purpose of the valuation. For the Financial Firm especially Banks or
insurance companies the model used equity valuation by FCFE model (Damodaran, 2009). This
model is used based on the difference of financial firm capitals structure. In Financial firms,
debts are not simply defined as capital. It more narrowly defined as the banks raw materials that
molded into other financial product and can be sold in higher price and yield a profit
(Damodaran, 2009).

International Journal of Economics, Commerce and Management, United Kingdom
Licensed under Creative Common Page 329
Although the principles behind discounted cash flow valuation are simple, applying the theory to
equity valuation can be challenging. Four broad steps in applying DCF analysis to equity
valuation according to Pinto et al. (2010) are:
1) Choosing the class of DCF model equivalently, selecting a specific definition of cash flow
2) Forecasting the cash flows.
3) Choosing a discount rate methodology.
4) Estimating the discount rate.
The cash flows of the financial firm using the FCFE are not simply determined. It needs the
information that not usually provided or calculated by the firm. The information needed on FCFE
model is based on this equation (1):
FCFE = Net Income (-) Net Capital Expenditure(-) Change in Net Working Capital (1)
The equation required Net Capital expenditure and working capital information. This two
information are usually not determined or provided in the financial statement of the firm because
the nature of the business are neither majorly investing in physical asset (Capital expenditure)
nor current assets and liabilities (the working capital) but in human (intangible assets) and
regulatory capitals. Damodaran (2009), suggest the Dividend cash model as an alternative to
substitutes the free cash flow equity allocated to the shareholders. The Equity Value measured
by Dividend Model is calculated by this equation (2):
EV= D(1+g)
1+Ke 1
n
t=1+..+
TV
1+Ke n (2)
This model required two variables, dividend growth (g) and discount rate (ke). The number of
growth depends on the stages used in the cash flow projection. In this paper, we used two
stages dividend growth model that consist of high growth period in year projection and sustain
growth in terminal value. The high growth in Pinto et al. (2010) are calculated using the
fundamental growth equation, as follows:
g=b x ROE or
g=b x ROA x EM (3)
Since the Islamic Windows Banking didn’t have equity on their balance but liabilities on parents,
the ROE of the banks can be acquired using multiplication of ROA and parents equity multiplier
(EM). Moreover, the sustain growth in terminal value is calculated by the average of GDP
growth in Indonesia.
© Rahmatullah, Sudarsono & Komara
Licensed under Creative Common Page 330
The second step of valuing equity is defines discount rate. The discount rate can be interpreted
as the required return of the shareholders where it minimally defined as cost of capital to run the
business. in the equity valuation, the cost of equity are used to discount the future cash flow
projected at the rate that can be determined by the Capital Asset Pricing Model equation as
follows:
Ke = Rf + (Rm-Rf) x β (4)
Where, Rf is risk free rate determined by Indonesia government bond (SUN) mature more than
10 years, Rm-Rf is Risk Premium which in this paper using country risk premium published by
Damodaran (2017) on his web pages, and β is the asset’s beta that measures its market or
systematic risk, which in the theory is the sensitivity of its returns to the returns on the market
portfolio of risky assets. Concretely, beta equals the covariance of returns with the returns on
the market portfolio divided by the market portfolio’s variance of Returns. Since the Regional
Development Bank (RDB) sampled are non-public company. There are procedures to calculate
their betas which are difference in financial leverage to public company as the benchmark. First,
according to Pinto et al. (2010), the benchmark beta is unlevered to estimate the beta of the
benchmark’s assets reflecting just the systematic risk arising from the economics of the industry
then the re-levered to reflect the financial leverage of the Regional Development Banks (RDB).
The Sample’s benchmarks of the firm are Bank Jawa Timur. Tbk (BJTM), Bank Banten Tbk.
(BJBR), Bank Panin Dubai Islamic Tbk. BJTM and BJBR are selected as part of Indonesia
Regional development bank and Bank Panin is selected as one of the listed Islamic bank in
Indonesia.
RESULTS AND DISCUSSION
Strategy Formulation
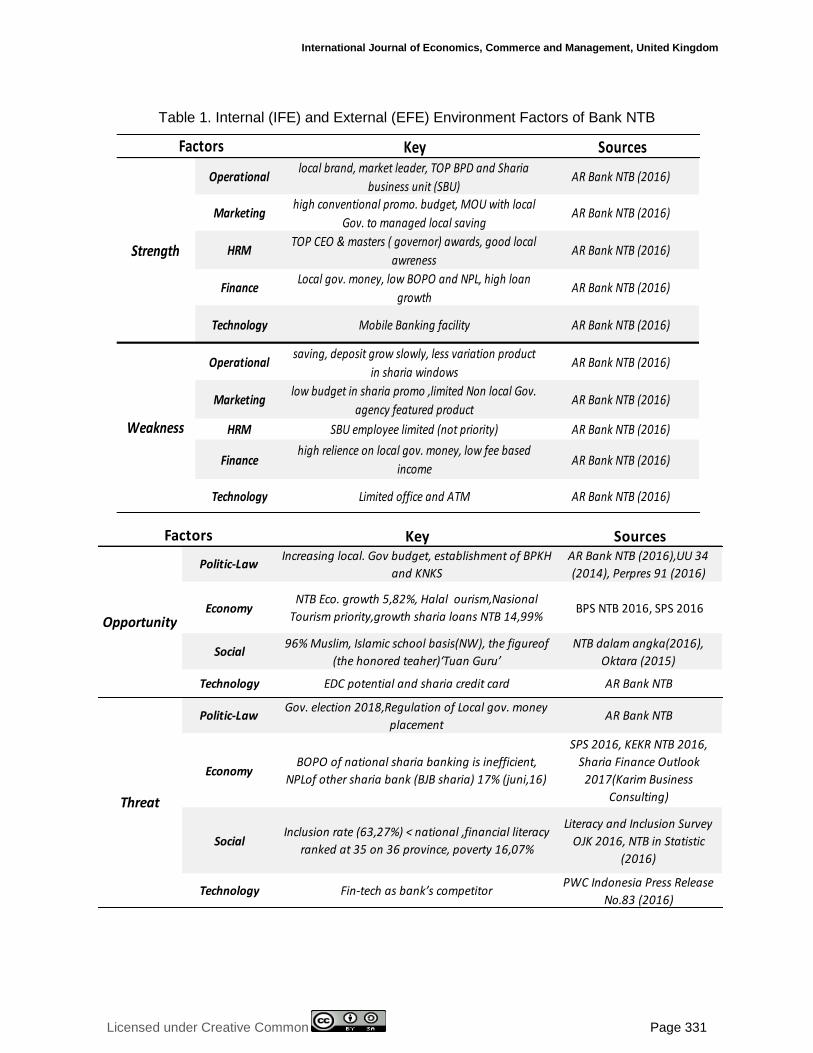
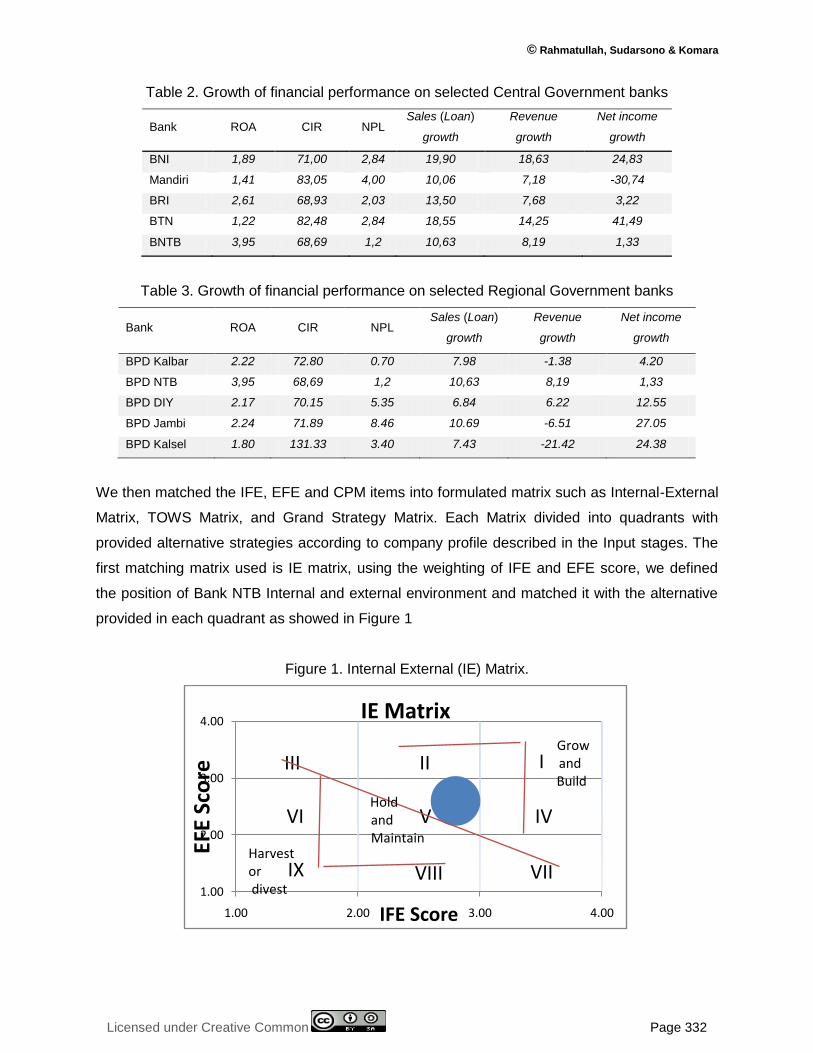
As mentioned previously, the strategies are formulated in three stages, input stage, matching
stage and decision stage. Input Stage analyzed the internal (IFE) and external (EFE)
environment factors of Bank NTB that summarized in Table 1. The internal factors are extracted
from the Bank’s business function that became its key strength and weakness to exploit the
external opportunity and to defend from the external threat (EFE). This EFE are gathered from
the PEST factor’s variables suggested by Wheleen (2015).After analyzed the IFE and EFE, we
profiled the competition on the industry especially among government’s conventional banks in
NTB in Table 2 and among another Regional Development Banks in Indonesia in Table 3 based
on data’s availability.
International Journal of Economics, Commerce and Management, United Kingdom
Licensed under Creative Common Page 331
Table 1. Internal (IFE) and External (EFE) Environment Factors of Bank NTB
Key Sources
Operationallocal brand, market leader, TOP BPD and Sharia
business unit (SBU)AR Bank NTB (2016)
Marketinghigh conventional promo. budget, MOU with local
Gov. to managed local savingAR Bank NTB (2016)
HRMTOP CEO & masters ( governor) awards, good local
awrenessAR Bank NTB (2016)
FinanceLocal gov. money, low BOPO and NPL, high loan
growthAR Bank NTB (2016)
Technology Mobile Banking facility AR Bank NTB (2016)
Operationalsaving, deposit grow slowly, less variation product
in sharia windowsAR Bank NTB (2016)
Marketinglow budget in sharia promo ,limited Non local Gov.
agency featured productAR Bank NTB (2016)
HRM SBU employee limited (not priority) AR Bank NTB (2016)
Financehigh relience on local gov. money, low fee based
incomeAR Bank NTB (2016)
Technology Limited office and ATM AR Bank NTB (2016)
Strength
Weakness
Factors
Key Sources
Politic-LawIncreasing local. Gov budget, establishment of BPKH
and KNKS
AR Bank NTB (2016),UU 34
(2014), Perpres 91 (2016)
EconomyNTB Eco. growth 5,82%, Halal ourism,Nasional
Tourism priority,growth sharia loans NTB 14,99%BPS NTB 2016, SPS 2016
Social96% Muslim, Islamic school basis(NW), the figureof
(the honored teaher)‘Tuan Guru’
NTB dalam angka(2016),
Oktara (2015)
Technology EDC potential and sharia credit card AR Bank NTB
Politic-LawGov. election 2018,Regulation of Local gov. money
placementAR Bank NTB
EconomyBOPO of national sharia banking is inefficient,
NPLof other sharia bank (BJB sharia) 17% (juni,16)
SPS 2016, KEKR NTB 2016,
Sharia Finance Outlook
2017(Karim Business
Consulting)
SocialInclusion rate (63,27%) < national ,financial literacy
ranked at 35 on 36 province, poverty 16,07%
Literacy and Inclusion Survey
OJK 2016, NTB in Statistic
(2016)
Technology Fin-tech as bank’s competitorPWC Indonesia Press Release
No.83 (2016)
Factors
Opportunity
Threat
© Rahmatullah, Sudarsono & Komara
Licensed under Creative Common Page 332
Table 2. Growth of financial performance on selected Central Government banks
Bank ROA CIR NPL Sales (Loan)
growth
Revenue
growth
Net income
growth
BNI 1,89 71,00 2,84 19,90 18,63 24,83
Mandiri 1,41 83,05 4,00 10,06 7,18 -30,74
BRI 2,61 68,93 2,03 13,50 7,68 3,22
BTN 1,22 82,48 2,84 18,55 14,25 41,49
BNTB 3,95 68,69 1,2 10,63 8,19 1,33
Table 3. Growth of financial performance on selected Regional Government banks
Bank ROA CIR NPL Sales (Loan)
growth
Revenue
growth
Net income
growth
BPD Kalbar 2.22 72.80 0.70 7.98 -1.38 4.20
BPD NTB 3,95 68,69 1,2 10,63 8,19 1,33
BPD DIY 2.17 70.15 5.35 6.84 6.22 12.55
BPD Jambi 2.24 71.89 8.46 10.69 -6.51 27.05
BPD Kalsel 1.80 131.33 3.40 7.43 -21.42 24.38
We then matched the IFE, EFE and CPM items into formulated matrix such as Internal-External
Matrix, TOWS Matrix, and Grand Strategy Matrix. Each Matrix divided into quadrants with
provided alternative strategies according to company profile described in the Input stages. The
first matching matrix used is IE matrix, using the weighting of IFE and EFE score, we defined
the position of Bank NTB Internal and external environment and matched it with the alternative
provided in each quadrant as showed in Figure 1
Figure 1. Internal External (IE) Matrix.
1.00
2.00
3.00
4.00
1.00 2.00 3.00 4.00
EFE
Sco
re
IFE Score
IE Matrix
IIIIII
IVVVI
VIIVIIIIX
Growand Build
Hold and Maintain
Harvestordivest
International Journal of Economics, Commerce and Management, United Kingdom
Licensed under Creative Common Page 333
Based on the matrix, the Bank NTB position on IE matrix is in Quadrant V with the score 2,8 on
IFE and 2,6 on EFE. According to David (2011) the alternative strategy for this position is grow
and build which suggest company to use the strategies such as backward, forward, or horizontal
integration, market penetration, market development, or product development. The second
matrix used is Grand Strategy Matrix. This matrix is based on the input in the CPM. We chose
four bank to compare with Bank NTB, they are BNI, BRI, BMRI, and BTN. We chose those bank
based on their share on national level are the largest in the industry.
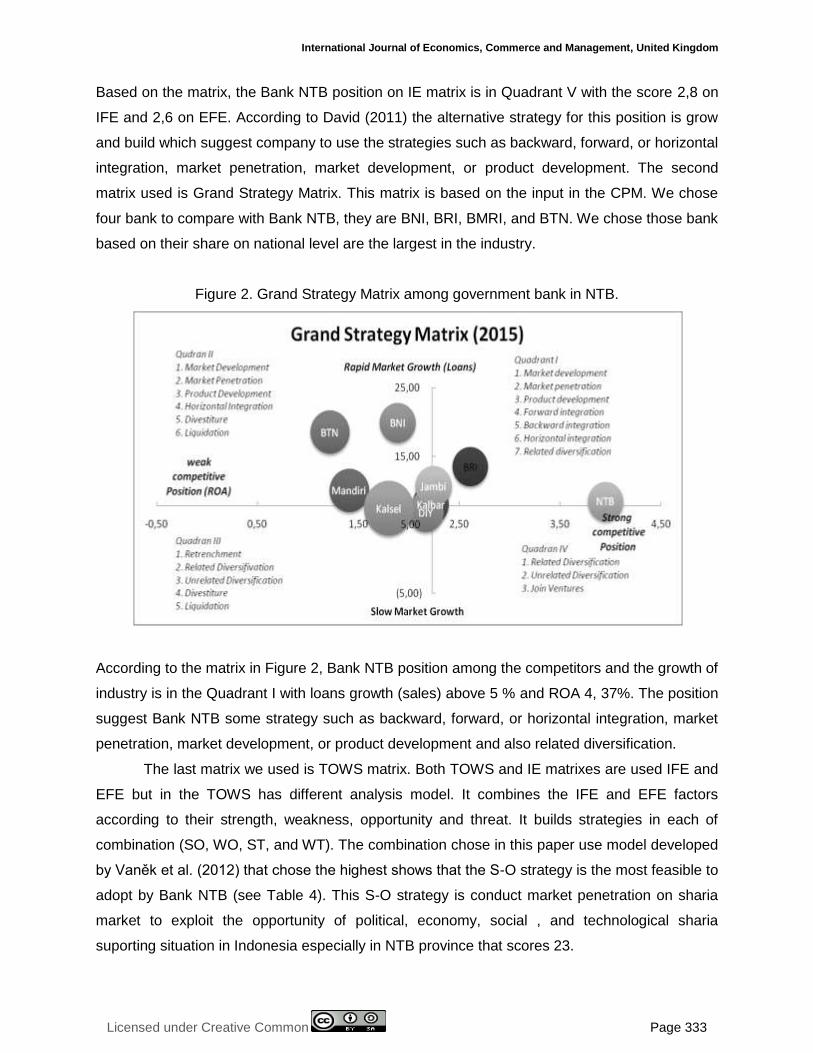
Figure 2. Grand Strategy Matrix among government bank in NTB.
According to the matrix in Figure 2, Bank NTB position among the competitors and the growth of
industry is in the Quadrant I with loans growth (sales) above 5 % and ROA 4, 37%. The position
suggest Bank NTB some strategy such as backward, forward, or horizontal integration, market
penetration, market development, or product development and also related diversification.
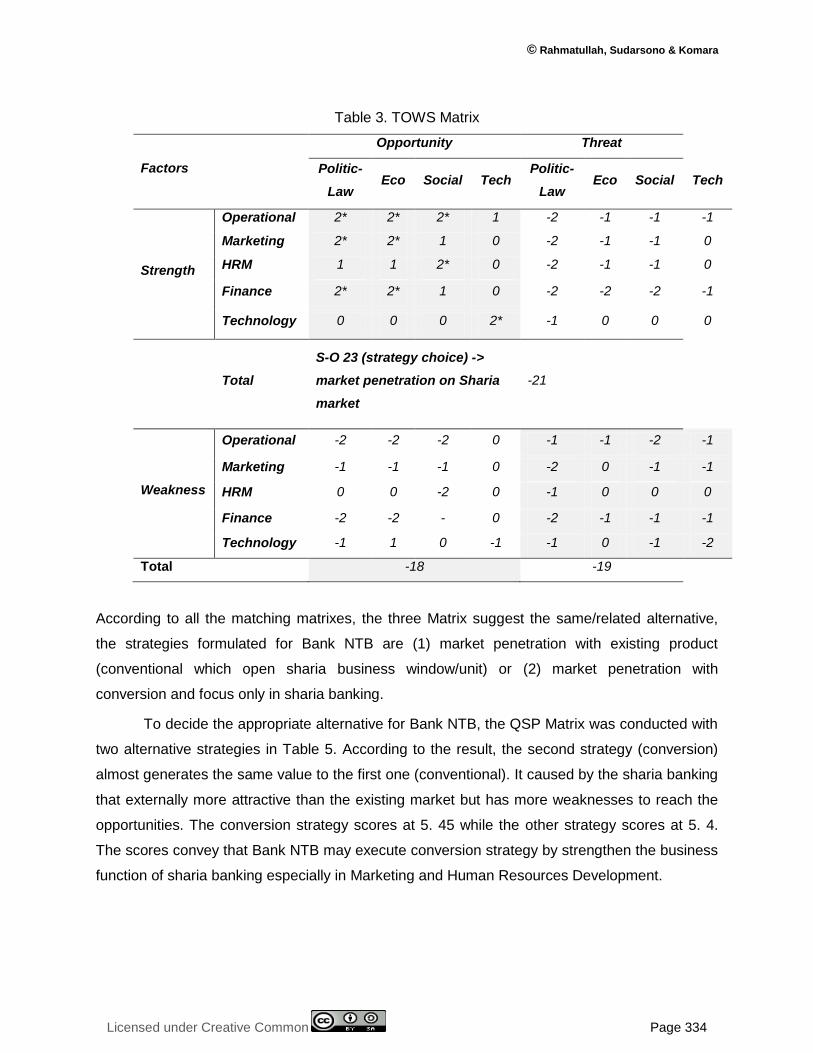
The last matrix we used is TOWS matrix. Both TOWS and IE matrixes are used IFE and
EFE but in the TOWS has different analysis model. It combines the IFE and EFE factors
according to their strength, weakness, opportunity and threat. It builds strategies in each of
combination (SO, WO, ST, and WT). The combination chose in this paper use model developed
by Vaněk et al. (2012) that chose the highest shows that the S-O strategy is the most feasible to
adopt by Bank NTB (see Table 4). This S-O strategy is conduct market penetration on sharia
market to exploit the opportunity of political, economy, social , and technological sharia
suporting situation in Indonesia especially in NTB province that scores 23.
© Rahmatullah, Sudarsono & Komara
Licensed under Creative Common Page 334
Table 3. TOWS Matrix
Factors
Opportunity Threat
Politic-
Law Eco Social Tech
Politic-
Law Eco Social Tech
Strength
Operational 2* 2* 2* 1 -2 -1 -1 -1
Marketing 2* 2* 1 0 -2 -1 -1 0
HRM 1 1 2* 0 -2 -1 -1 0
Finance 2* 2* 1 0 -2 -2 -2 -1
Technology 0 0 0 2* -1 0 0 0
Total
S-O 23 (strategy choice) ->
market penetration on Sharia
market
-21
Weakness
Operational -2 -2 -2 0 -1 -1 -2 -1
Marketing -1 -1 -1 0 -2 0 -1 -1
HRM 0 0 -2 0 -1 0 0 0
Finance -2 -2 - 0 -2 -1 -1 -1
Technology -1 1 0 -1 -1 0 -1 -2
Total -18 -19
According to all the matching matrixes, the three Matrix suggest the same/related alternative,
the strategies formulated for Bank NTB are (1) market penetration with existing product
(conventional which open sharia business window/unit) or (2) market penetration with
conversion and focus only in sharia banking.
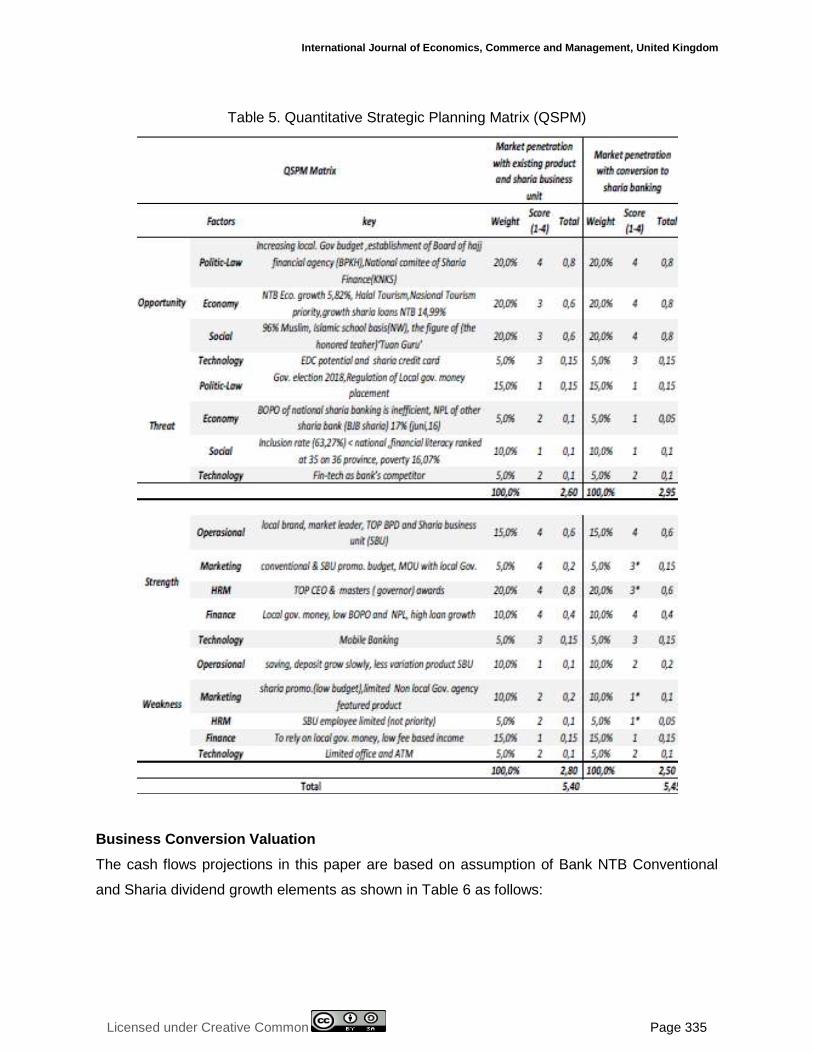
To decide the appropriate alternative for Bank NTB, the QSP Matrix was conducted with
two alternative strategies in Table 5. According to the result, the second strategy (conversion)
almost generates the same value to the first one (conventional). It caused by the sharia banking
that externally more attractive than the existing market but has more weaknesses to reach the
opportunities. The conversion strategy scores at 5. 45 while the other strategy scores at 5. 4.
The scores convey that Bank NTB may execute conversion strategy by strengthen the business
function of sharia banking especially in Marketing and Human Resources Development.
International Journal of Economics, Commerce and Management, United Kingdom
Licensed under Creative Common Page 335
Table 5. Quantitative Strategic Planning Matrix (QSPM)
Business Conversion Valuation
The cash flows projections in this paper are based on assumption of Bank NTB Conventional
and Sharia dividend growth elements as shown in Table 6 as follows:
© Rahmatullah, Sudarsono & Komara
Licensed under Creative Common Page 336
Table 6. dividend growth elements
Indicator Sharia Conven
St. dev ROA 0,71% 0,44%
ROA 3,53% 3,60%
EM 6,38 6,38
1-DPR 70,00% 70,00%
Growth 15,75% 16,07%
It showed that historically Bank NTB’s ROA is greater than its Sharia Windows’s ROA but has
smaller standard deviation on it. Besides using Dividend discounted model (DDM), we also
combined the DDM with Monte Carlo Simulation (MCS) both in calculation the first and second
strategies. The model results the different business value as shown in Table 7 below:
Table 7. Calculation of Bank NTB business value with DDM (in millions)
Base 2017 2018 2019 2020 2021 TV
Sharia 132.835 153.768 178.000 206.050 238.521 276.109 319.620
Conven 132.835 154.183 178.962 207.724 241.107 279.856 324.832
PV Sharia (Ke:17.65%) 130.700 128.598 126.531 124.497 122.495 1.403.955
PV Conven(Ke:21.56%) 126.837 121.110 115.641 110.420 105.434 1.211.670
Nilai Bisnis Sharia 2.036.779
Nilai Bisnis Conven 1.791.114
Nilai Conversion 245.665
Using the same steps in calculation, DDM-MCS combination method provides better
perspective as it can categorizes the business value into pessimistic, moderate, and optimistic
scenarios in Table 8. The result revealed that in any scenario Bank NTB sharia performs better
business value than the conventional. This potential success may be related to Bank NTB
internal financial performance. In summary, the conversion value both in DDM and DDM-MCS
Combined model are presented in Table 9.
Table 8. Calculation of Bank NTB business value with DDM-MCS combination
Scenario ROA range Probability Business Value
Sharia Conv. Sharia Conv. Sharia Conv.
Pessimist 1.00% - 2.85% 1.98% - 3.18% 15.20% 17.70% 1,581,023 1,515,166
Moderate 2.85%
4.27% 3.18% - 4.06% 72.00% 68.40% 2,044,099 1,791,221
Optimistic 4.27% - 5.65% 4.06% - 5.01% 12.80% 13.90% 2,610,975 212,387
Average
100% 100% 2,057,806 1,793,804
International Journal of Economics, Commerce and Management, United Kingdom
Licensed under Creative Common Page 337
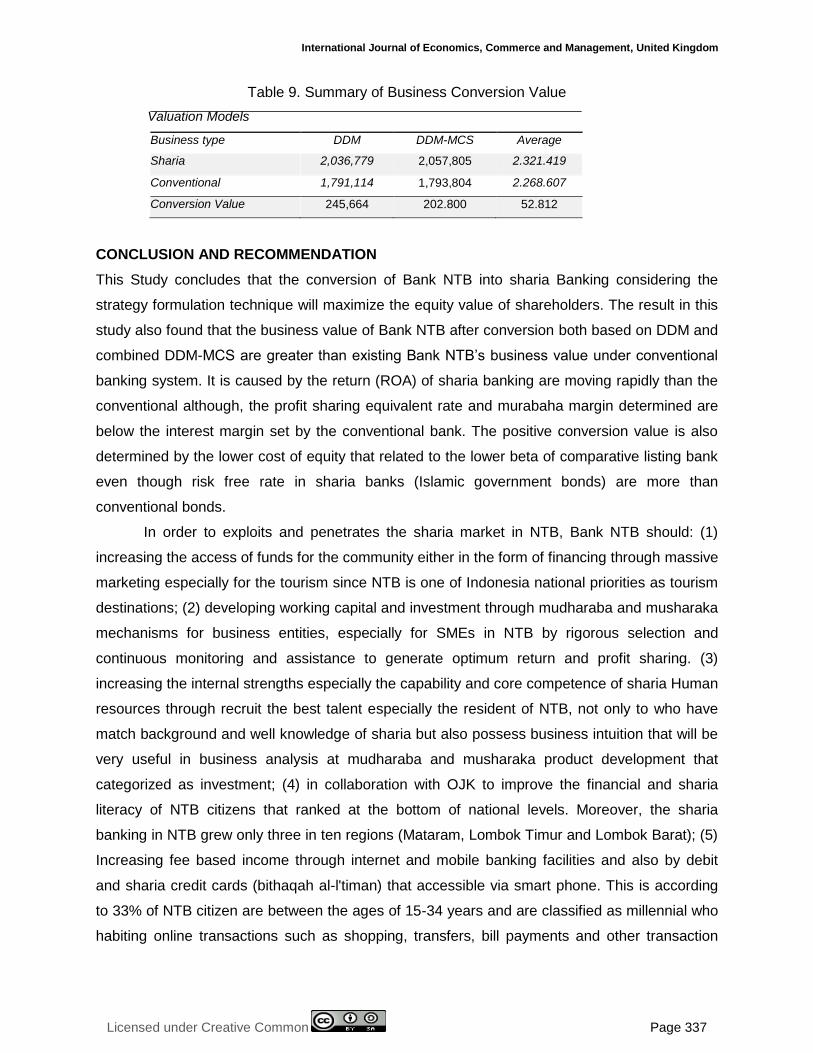
Table 9. Summary of Business Conversion Value
Valuation Models
Business type DDM DDM-MCS Average
Sharia 2,036,779 2,057,805 2.321.419
Conventional 1,791,114 1,793,804 2.268.607
Conversion Value 245,664 202.800 52.812
CONCLUSION AND RECOMMENDATION
This Study concludes that the conversion of Bank NTB into sharia Banking considering the
strategy formulation technique will maximize the equity value of shareholders. The result in this
study also found that the business value of Bank NTB after conversion both based on DDM and
combined DDM-MCS are greater than existing Bank NTB’s business value under conventional
banking system. It is caused by the return (ROA) of sharia banking are moving rapidly than the
conventional although, the profit sharing equivalent rate and murabaha margin determined are
below the interest margin set by the conventional bank. The positive conversion value is also
determined by the lower cost of equity that related to the lower beta of comparative listing bank
even though risk free rate in sharia banks (Islamic government bonds) are more than
conventional bonds.
In order to exploits and penetrates the sharia market in NTB, Bank NTB should: (1)
increasing the access of funds for the community either in the form of financing through massive
marketing especially for the tourism since NTB is one of Indonesia national priorities as tourism
destinations; (2) developing working capital and investment through mudharaba and musharaka
mechanisms for business entities, especially for SMEs in NTB by rigorous selection and
continuous monitoring and assistance to generate optimum return and profit sharing. (3)
increasing the internal strengths especially the capability and core competence of sharia Human
resources through recruit the best talent especially the resident of NTB, not only to who have
match background and well knowledge of sharia but also possess business intuition that will be
very useful in business analysis at mudharaba and musharaka product development that
categorized as investment; (4) in collaboration with OJK to improve the financial and sharia
literacy of NTB citizens that ranked at the bottom of national levels. Moreover, the sharia
banking in NTB grew only three in ten regions (Mataram, Lombok Timur and Lombok Barat); (5)
Increasing fee based income through internet and mobile banking facilities and also by debit
and sharia credit cards (bithaqah al-l'timan) that accessible via smart phone. This is according
to 33% of NTB citizen are between the ages of 15-34 years and are classified as millennial who
habiting online transactions such as shopping, transfers, bill payments and other transaction

© Rahmatullah, Sudarsono & Komara
Licensed under Creative Common Page 338
that considered as both time and cost efficient; (6) maximizing the potency of hajj funds
management by Bank NTB sharia as a local government bank in Province NTB by investing in
productive sectors that support the economic growth of NTB. This is important since the waiting
list of hajj departures in NTB province reaches 21 years. (7) In collaboration with the housing
ministry in the provision of public houses with direct sharia financing with ownership of public
housing stock or provision of soft loans/funds. This is important because up to now the public
houses funding are monopolized by conventional central government Bank (BTN).
This study has several limitations, one of them subjects in scoring and weighting on
internal and external factors of the company. Further research can use questionnaire and FGD
method with the management and stakeholders of the company in determining the weight and
score of internal and external factors of the company to produce alternative strategies that more
accurate and objective
REFERENCES
Bitar. M.. Madiès. P.. & Taramasco. O. (2017). What makes Islamic banks different? A multivariate approach. Economic Systems. 41(2). 215–235. https://doi.org/10.1016/j.ecosys.2016.06.003
Damodaran, A. (2009).Valuing Financial Service Firms. Retrieved from Http://People.Stern.Nyu.Edu/Adamodar/Pdfiles/Papers/Finfirm09.Pdf
David. F. R.. & Carolina. S. (2011). Strategic Management Concepts and Cases . Zeitschrift fur Personalforschung (Vol. 28). https://doi.org/10.1688/ZfP-2014-03-Rowold
Hutapea. E. G.. & Kasri. R. A. (2010). Bank margin determination: a comparison between Islamic and Conventional banks in Indonesia. International Journal of Islamic and Middle Eastern Finance and Management. 3(1). 65–82. https://doi.org/10.1108/17538391011033870
Imam. P.. & Kpodar. K. (2016). Islamic banking: Good for growth? Economic Modelling. 59. 387–401. https://doi.org/10.1016/j.econmod.2016.08.004
Louati. S.. & Boujelbene. Y. (2015). Banks’ stability-efficiency within dual banking system: a stochastic frontier analysis. International Journal of Islamic and Middle Eastern Finance and Management. 8(4). 472–490. https://doi.org/10.1108/IMEFM-12-2014-0121
Olson. D.. & Zoubi. T. A. (2008). Using accounting ratios to distinguish between Islamic and Conventional banks in the GCC region. International Journal of Accounting. 43(1). 45–65. https://doi.org/10.1016/j.intacc.2008.01.003
Ommani, A. R., (2011). Strengths, weaknesses, opportunities and threats (SWOT) analysis for farming system businesses management: Case of wheat farmers of Shadervan District , Shoushtar Township, Iran. African Journal of Business Management, 5(22), pp. 9448-9454
Pinto. J.. Henry. E.. Robinson. T..& Stowe. J. Equity Asset Valuation. John Wiley & Sons, Inc., Hoboken, New Jersey.
Shafii. Z.. Shahimi. S.. & Saaid. A. (2016). Obstacles and motivation behind conversion of Conventional banks to Islamic banks: An overview. International Review of Management and Business Research. 5(3). 1021–1038.
Sudarsono. H. (2009). Dampak Krisis Keuangan Global terhadap Perbankan di Indonesia: Perbandingan antara Bank Conventional dan Bank Sharia. La Riba Jurnal Ekonomi Islam. 3(1). 12. Retrieved from http://www.academia.edu/download/35006785/la-riba-vol3-no1-2009-02-sudarsono.pdf
International Journal of Economics, Commerce and Management, United Kingdom
Licensed under Creative Common Page 339
Thomson Reuters.(2016) Islamic Finance Development Report Resilient Growth. Retrieved fromhttps://www.icdps.org/en/.../viewfile?FilePath.../20161218101924234ICDIFDI_report_DIGITAL.pdf
Thomas L. Wheelen. J. David Hunger. Alan N. Hoffman. C. B. (2015). Strategic Management and Business Policy: Globalization. Innovation and Sustainablility (14th ed.). Pearson Education.
Trad. N.. Trabelsi. M. A.. & Goux. J. F. (2017). Risk and profitability of Islamic banks: A religious deception or an alternatif solution? Euromean Research on Management and Business Economics. 23(1). 40–45. https://doi.org/10.1016/j.iedeen.2016.09.001
Vaněk. M.. Mikoláš. M.. & Žváková. K. (2012). Evaluation Methods of Swot Analysis / Metody Vyhodnocení Swot Analýzy. GeoScience Engineering. 58(2). 23–31. https://doi.org/10.2478/gse-2014-0036
Zaki. F.. & Hussainey. K. (2015). Conversion into Islamic banks: Jurisprudence. economic and AAOIFI requirements. Euromean Journal of Islamic Finance. 3(June 2016). 1–9. https://doi.org/10.13135/2421-2172/1111
Zarrouk. H.. Ben Jedidia. K.. & Moualhi. M. (2016). Is Islamic bank profitability driven by same forces as Conventional banks? International Journal of Islamic and Middle Eastern Finance and Management. 9(1). 46–66. https://doi.org/10.1108/IMEFM-12-2014-0120


![Amazon S3 · THE NATIONAL COLLEGIATE ATHLETIC ASSOCIATION P.O. Box 6222 Indianapolis, Indiana 46206-6222 317/917-6222 NCAA.org July 2016 [ISSN 1093-3174] Text Prepared By: NCAA Academic](https://img.pdfslide.us/doc/110x75/5f12c67922ba1e0cfa67fdc2/amazon-s3-the-national-collegiate-athletic-association-po-box-6222-indianapolis.jpg)