Embed Size (px)
Citation preview
Bus Route O-D Matrix Generation:Relationship Between Biproportional andRecursive Methods
Planners must sometimes synthesize transit route origin-destination (0-0) matrices with limited data. usuallv on-off countsand sometimes a small or outdated 0-0 survey sa'mple. When asmall 0-0 sample is available. iterative methods such as the bi-proportional method that begin with the sample as a seed matrixcan be used. adjusted to match on-off totals. When only on-offtotals are available. the recursive method of Tsygalnitsky has beenfound to match 0-0 patterns on some routes better than others.This method is in fact a special case of the biproportional methodusing an implicit null seed matrix that contains information ondirectionality and minimum trip length. It illustrates wh\' therecursive method is inappropriate when there is significant'com-petition between routes. and offers a correction for when on-offdata have been aggregat~d to the segment level. Estimation errorsare then compared to help indicate how large the seed sampleshould be in order to produce a more accurate estimate than anestimate produced with a null seed.
A route-level origin-destination (O-D) matrix (trip table) givesthe number of passengers traveling between each pair of stopsor stations on a transit route in a particular direction. It canbe specific to any perioj of interest. from the individual ve-hicle trip to an entire day. A route-level 0-0 matrix is animportant descriptor of passenger demand that has been usedfor such analyses as systematic route evaluations (1.2). routeand schedule design for short-turning (3). zonal service (4).limited-stop service (5). and complementary express and localservice (6).
A route-level O-D matrix can be obtained by directly sam-pling passengers. The typical passenger survey. in which pas-sengers fill in a questionnaire asking where they boarded andwhere they plan to leave. leaves a lot to be desired. Responserates are often low. and vary according to critical factors suchas trip length-did the passenger have enough time to fill outthe questionnaire?-and origin-stop-did the passenger geta seat? Is this stop in a low literacy neighborhood?-whichmay bias the results. A special purpose survey method. calledby one author the "no questions asked" method (2). appearsto overcome this nonresponse problem. Passengers are givenorigin-coded cards when they board and are asked to returnthe cards when they alight. By careful collection of the cardsby alighting stop. O-D information is obtained. Practitionersreport response rates of over 90 percent (2.7). However. thismethod is not in common use. because it requires one checkerat each door and careful pre-trip preparation.
Far more common and easier to obtain than G-D data areon-off counts. In the context of G-D matrix generation. on-
Department of Civil Engineering. Northeastern University. 360Huntington Ave .. Boston. Mass. 02115.
off counts represent row and column totals. It is not difficultfor a ride checker to obtain a 100 percent sample of on-offcounts, and measurement error is generally agreed to be quitesmall. Therefore an 0-0 matrix whose row and column totalsagree with the on-off counts should be preferred to one ob-tained by simple expansion of a small G-D sample. Gf course.there are many possible G-D matrices whose row and columntotals match the on-off counts. The problem of G-D matrixsynthesis is to generate an G-D matrix that agrees with agiven set ofrow and column totals and that meets ~ome criteriaof being the best or most likely G-D matrix. Ben-Aki\'a etal. (8) describe three methods for combining a small G-Dsample with on-off counts: the biproportional method. con-strained maximum likelihood. and constrained generalizedleast squares. All three of these methods involve iterativecomputations. The first two are preferable because the thirdsometimes generates negative matrix entries. even though allthree yield very similar results. The biproportional method iscomputationally more attractive. is better known. and hasbeen used in a variety of contexts (9-11). In further work.Ben-Akiva (12) shows how the maximum likelihood approachcan be used to derive estimation methods that combine var-ious imperfect sources of information. In an application totransit route G-D estimation. his assumptions about the struc-ture of the nonresponse bias lead again to the simple bipro-portional method.
It is often the case. however. that a small G-D sample isnot available. or that the small sample is so small or suspectedof bias that an estimate based on it may not be reliable. Amethod for synthesizing a route-level G-D matrix from on-off counts alone was proposed by Tsygalnitsky (13). It is avery simple method involving a single pass of recursive cal-culations. and can be done by hand (although use of a spread-sheet or computer program is still advisable). This methodhas also been used by London Transport in at least one study.pres~mably having been developed independently (1). Ts;'-galmtsky found that his recursive method fit well with datafrom Toulouse. France. Simon and Furth (7) also tested itagainst G-D data from two routes in Los Angeles. and againfound a good fit. although the fit on one r~ute was b;tterthan that on another. Ben-Akiva et al. (8) tested the recursivemethod against G·D matrices generated using the bipropor-tional and constrained maximum likelihood methods for twoBoston area routes and found that it yielded matrix estimatesthat differed substantially from the e~timates obtained bv theiterative methods based 'on a small-sample G·D survey.'
Although Tsygalnitsky's recursive method and the bipro-portional method are motivated from different assumptions.
the recursi\'e method is actually a special case of the bipro-portional method. The biproportional method takes an initialmatrix. called a seed matrix. and factors it to match on-offcounts. The seed matrix contains information concerning thepreferences for the various O-D pairs. Typically. the seedmatrix is an O-D sample. If there is no O-D sample to beginwith. a reasonable guess is to use a "null seed." one thatassumes that every permissible O-D pair is equally preferred.It is demonstrated that Tsygalnitsky's recursive method is thesame as the biproportional method using a null seed.
This insight makes it possible to better analyze which methodis more appropriate under various circumstances. A smallO-D sample contains valuable site-specific information aboutO-D pair preferences but is also subject to sampling errorand nonresponse bias. A null seed has no sampling error ornonresponse bias but lacks site-specific information. In ad-dition. two common factors-aggregation of stops into seg-ments and competition from other routes-are shown to bein contradiction to the assumptions underlying the null seed.and consequently the recursive method should not be ex-pected to perform well under these circumstances.
Repeated reference is made to four bus routes that haw beenpreviously analyzed. Lines 16 and 93. analyzed by Simon andFurth (7) are operated by the Southern California Rapid Tran-sit District. For Line 16. virtually complete O-D data. en-compassing 266 passengers. were obtained from five inboundshort-turning trips over a 5-mi radial route containing ~Ostops.For Line 93. virtually complete O-D data were obtained onfour a.m.-peak (383 passengers) and four p.m.-peak (273 pas-sengers) trips. Four trips were local trips cO\'ering the entireI~O-stop route from downtown Los Angeles to the San Fer-nando Valley. three trips were short-turned in North Holly-wood (about 90 stops). and one p.m. trip ran express fromdowntown to the valley. Routes 77 and 350. analyzed by BenAkiva et al. (8). are operated by the Massachusetts Bay Trans-portation Authority. These routes were analyzed inbound inthe a.m. peak and outbound in the p.m. peak. The availabledata consist of a small 0-0 sample augmented by on-off counts.Route 77 is a heavily used radial route. 5.5 mi long. runningthrough the suburb of Arlington into Harvard Square in Cam-bridge. In the a.m. peak. 2.148 passengers were counted. and0-0 data were obtained from 54. In the p.m. peak. 1.617passengers were counted. with 0-0 data obtained from 138.Route 350 is 15.2 mi long. with a large collection/distributionsection in suburbs north of Boston. connected by expressoperation to selected stops in Cambridge and downtown Bos-ton. In the a.m. peak. 485 passengers were counted. with0-0 data obtained from 76. In the p.m. peak. 200 passengerswere counted, with 0-0 data obtained from 61.
Tsygalnitsky's recursive method proceeds stop by stop. dis-tributing alightings at each stop among origin stops in pro-portion to the number of people from each origin stop whoare eligible to alight. To be eligible. passengers must have
traveled a minimum distance. and must not have alightedpreviously. Taking each stop as a node. with nodes consec-uti\'ely numbered from 1 to 11 in the direction of travel. let
I" passenger trips from i to j.I,. boardings at i = ~/'J'I., alightings at j = ~,I",
Ill, first node at which passengers who board at i areeligible to alight (m, ~ i).
£, set of nodes that can serve as origins for passengersalighting at j.
e" number of passengers who boarded at i who are eli-gible to alight at j.
e., total number of passengers eligible to alight at jI,e". and
J; fraction of eligible passengers who alight at jt.,I eO}
Initially. set e" = 0 for all (i. j) except when j = Ill,. inwhich case set e" = I, •. Computation begins with the first nodeat which passengers are eligible to alight: call it Node k. Aftercalculating e.• and f•. let
and advance to the next node (let k = k + 1) and return toEquation I.
Simon and Furth call this method a fluid analogy. becausepassengers on the bus are likened to a thoroughly-mixed fluidout of which alighting passengers are drawn at each alightingstop in proportion to their representation in the fluid. Newlyboarding passengers are added to the fluid after they havemet the minimum travel distance criterion. (This minimumdistance may be expressed in stops. distance. or time units.and may vary from stop to stop.) Ben-Aki\'a et al. (8) call itan intervening opportunities method. because it follows thelogic of classical intervening opportunities models in givingpriority to closer destinations.
5,. seed matrix.A, o\'erall adjustment factor for row i.B. overall adjustment factor for column k.
The seed matrix contains information about relative like-lihoods of 0-0 pairs to be chosen by travelers. It may be asmall-sample 0-0 matrix or an out-of-date 0-0 matrix. If noempirical seed matrix is available. a seed matrix can be createdby an analyst to reflect information available on preferencesbetween 0-0 pairs. as done by Furth (1-1) for vehicular trafficat an intersection.
The method is to alternately balance rows and columns tomatch the desired row and column totals until ccinn:rgence.Initially. we set I,. = 5,•. Then. for iteration h. rows arebalanced:
where the balancing factor a~ is the ratio of the desired rowi total to the current row i total. Next. columns are likewisebalanced:
where the balancing factor bZ is the ratio of the desired columnk total to the current column k total. Since balancing columnsupsets the balance of the rows. the process is repeated untilconvergence is reached. that is, until. after balancing the col-umns. all the row totals agree (to some arbitrary tolerance)with the desired row totals. Reflecting the logic of the cal-culations. one name that has been used for this method is"iterative proportional fit." The name "biproportional method"derives from the form of the final estimate for cell (i. k).which is
where the overall balancing factor for row i is A, = n/a~ andthe overall balancing factor for column k is B, = n"bZ. It iswell known that the biproportional method has a unique so-lution (15.16): In general. there is no closed form or single-pass recursive algorithm for determining the overall balancingfactors. which must therefore be found by an iterative methodsuch as the iterative proportional fit.
The biproportional method has been derived in several dif-ferent ways. Several authors. including Ben-Akiva et al. (8)and Lamond and Stewart (16). derive it as a case of minimizinga measure of discrepancy between the estimate and the seed.Hauer et al. (10) derive it as the most likely realization of arandom (either Poisson or multinomial) process in which theseed represents the known ocurrence rates. Ben-Akiva (12)derives it as the maximum likelihood estimate of the popu-lation trip rates. assuming that the seed is a random samplesubject to sampling bias. and the relative bias is a product oftwo factors. one from the origin stop and one from the des-tination stop.
RECURSIVE METHOD AS SPECIAL CASE OFBIPROPORTIOl\AL METHOD
The estimates produced by Tsygalnitsky's recursive methodare actually a biproportional form. Implicitly underlying therecursive model is a null seed containing information on whethertravel is permitted or not. based on directionality and mini-mum trip length. given by
S,k = g if travel from i to k is permittedotherwise
The recursive method also implies the following restrictionson the seed: S," = I for all i, and for all k < n. 5•., _ I = 1 ifS,k = 1.
The recursive method is a special case of the biproportionalmethod in which the seed matrix is the null seed matrix given
by Equation 6. More specifically. the recursi\'e estimatesI" = e,.!. (Equation 1) are equi\'alent to the biproponionalestimates I" = 5,.A,B. (Equation 5). where
A, = e,n for all i = 1. .. .n (7)
B" = f" (8)
and
B,f,
for all k 1. . . . . 11 - 1 (9),,- ,n (1 - 1;)/-k
Because the biproportional method has a unique solution. itis sufficient to prove that estimates produced by the recursivemethod have a biproportional form. Consider column 11 (i.e ..let k = n). By inspection. it is clear that Equations 1 and 5are equivalent. Now consider column 11 - 1 (i.e .. let k =n - 1). By construction. the recursive method yields e•.n =e•.n. ,(1 - fn. ,) if travel from i to 11 - 1 is permitted. Rear-ranging. we obtain
{
e,._ I-f._,
e,,'l _ I -
o
which is a biproprotional form with the balancing factors givenby Equations 7 and 9.
Now consider column n - 2 (i.e .. k = 11 - 2). By similarargument.
{~_ 1 - I."e". _, -
o
{
1emo (I - I. - ,)(1 - In' I)
Substituting for e"n.; in Equation 1 with k = 11 - 2 againyields a biproportional form. with balancing factors gi\'en byEquations 7 and 9. Similar reasoning can be applied to eachsuccessive column k = n - 3. n - ~ .... Equation 13becomes generalized to
{
e,.,., 11 - I, = em .' I
e,. = 0 n (1 - 1,)

from which the equi\'alence of Equations 1 and 5. using th~substitutions gi\'en by Equations 7 and 9. is obvious, Q,E.D.
This theorem pro\'ides a framework for determining whichmethod of transit route O-D matrix generation. the recursi\'eor biproportional method. is better, Because the two methodsdiffer only in which seed is used. the question can be reframedin terms of which seed is better. a null seed or a seed derivedfrom exogenous data such as a small sample. We haw alreadymentioned a few empirical studies of the methods, The re-mainder of this paper examines theoretical deficiencies ofboth the null seed and the small sample seed in cornmansituations along with some experimentation. offering furtherguidance as to which seed is most appropriate in varioussituations.
One interesting corollary of this theorem is that when theseed has the form of a null seed. the recursive method providesa single-pass algorithm for finding the biproportional solution,Another corollary is that the recursive method is re\ersible:that is. it will yield the same results if one works backwardor forward along the route, In this sense, the recursi\'e methodis not myopic like other intervening opportunities models, Itappears to be myopic since it determines demand to stopsalong the route without explicitly considering what oppor-tunities lie further downstream,
FACTORS AFFECTI~G APPLICABILITY OFRECURSIVE METHOD
The fact that the recursive method is the same as the bipro-portional method with a null seed helps indicate the types ofroutes and situations in which the recursive model can orcannot be expected to perform well. It can be expected toperform well when there is little a priori reason to helie\'ethat anything other than the popularity of the origin and des-tination stops is responsible for the demand for tra\'el betweenO-D pairs, In the two situations suggested by Tsygalnitsky(J3). a null seed appears plausihle, These situations are (a) anexpress route with a collection segment outside the city anda distribution segment downtown. with tra\'el permitted onlybetween the collection and distribution segment: and (b) ashort local route free from interference (e ,g .. competition)with other routes.
However. there are other situations in which a null seed\'iolates a priori knowledge of trip-making behavior. the fore-most being when significant competition from other routesaffects demand. For example. imagine a local route betweenSegment A and Segment E. with several intermediate seg-ments. If there is another route that goes express from Seg-ment A to Segment E. we would expect that the express routewould capture most of the demand from A to E. The seedmatrix for the local route should therefore have a relativelylow propensity for stop pairs that are served by the expressroute. rather than equal propensities throughout. Likewise.if two local routes begin at a common intersection uptownand end at a common location downtown and use differentpaths to get there, the travel market that can use either routewill be split between the routes. lowering on both routes thepropensity to travel between stop pairs served by both rout~s,Other network effects can affect travel propensity along aroute as well. For example. a large transfer volume from a
feeder route can innuenc~ propensity for tra\'el hetw~~n thattransfer point and other stops on the main route necaust' tht'st'transferring passeng~rs may have a high propensity to go t\1certain portions of the main route. but not to other portions(e,g .. there may be a more expedient path to S(1me portionsof the main route than via that transfer point),
Long local routes may be another example of the unsuit-ahility of a null seed. Travel propensity is commonly agreedto decline with distance. except for very short distances. wherecompetition with walking yields the opposite effect, On shortroutes. travel time differences hetween different O-D pairsare sufficiently minor that an equal-propensity seed is stillplausible. But on long routes. e\'en if there is no C0mpetitionfrom other routes. propensities should be expected to be smallerfor long trips than for short trips, It has yet to be shown howlong a route can be before the null seed assumption becomesunrealistic,
Results reported in the literature confirm these expecta-tions. For example. Tsygalnitsky found that his method per-formed very well on the two routes he tested. one an expressroute with separate collection and distribution areas. the other
. a short local route, Simon and Furth (7) found that Tsygal-nitsky's recursi\'e method worked \ery well on a short loc~!1route. but that n a longer route with competition from ex-press routes. it overpredicted very long trips, It should henoted that. bec,iluse the average trip length is determined hythe given on and off totals on the route. any model for O-Dmatrix generation must yield the correct a\erage trip length,Therefore. an o\'erprediction of long trips must he accom-panied by an overprediction of short trips, Ben-Akiv~ et al.found that the recursive method o\'erpredicts \'ery long and\'ery short trips. particularly on Route 350. a long route withcompetition from express sen'ice, It is not clear. howe\er.whether the discrepancies on these longer routes arise hecauseof interference from competing routes. from route length. orfrom using segment-Ie\'el data.
O-D 1\1,\TRIX ESTI!\IA TIO" WITHSEGI\IE"T-LEVEL DATA
An important factor affecting the applicability of the recursi\emethod is whether the on-off counts are hy individual stopor by segment (aggregations of stops), With stop-Ie\'el data.travel along the diagonal of the O-D matrix (i.e .. beginningand ending at the same stop) is not permissible. but withsegment-level data. travel along the diagonal is permissible,Although the recursive method recognizes only the dichotomypermissible/not permissible (1 or 0). the possibilitv of intra-segment travel calls for a finer level of gradation. Intraseg-ment travel in a segment with n stops is an aggregation of 11'
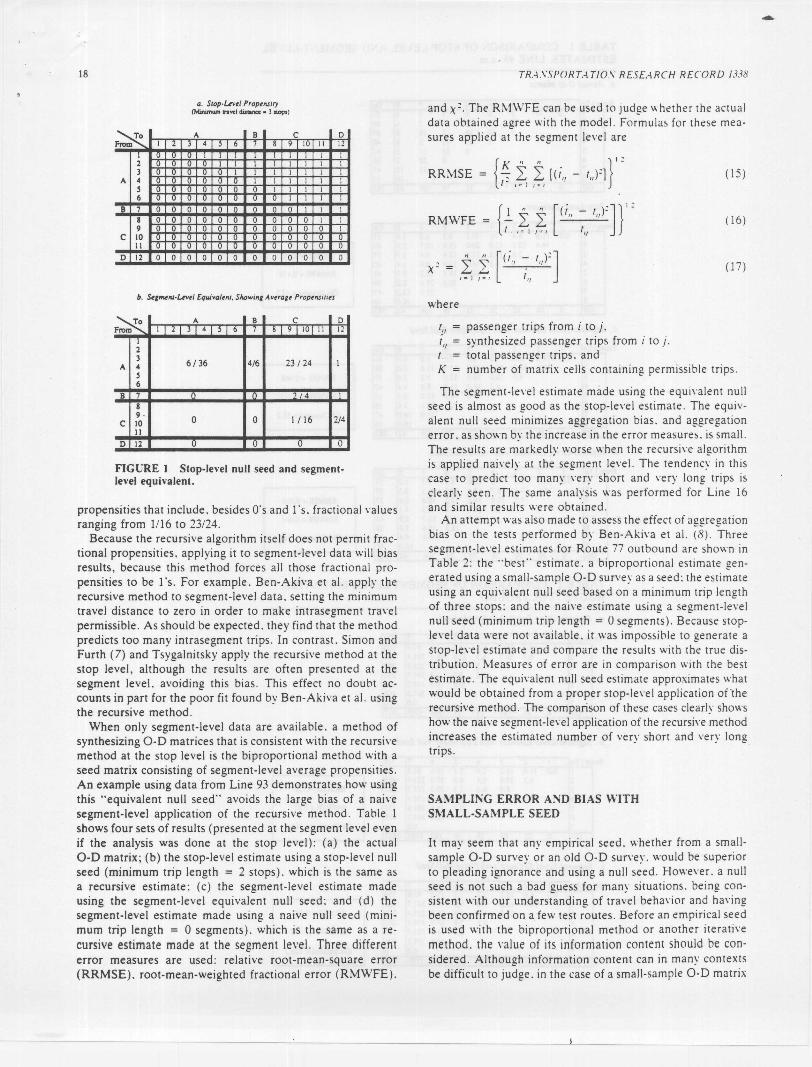
stop pairs, If propensity is I for stop pairs for which trawl ispermissible and 0 for ineligible pairs. then the a\'erage pro-pensity for stop pairs contained in that segment is at most(11 - 1)1211. which is less than 0,5, Similarly'. average tra\elpropensity between nearby segments can he less than I if theminimum travel distance is greater than one swp. hec~us~ thepair of nearby segments could contain stop pairs that areineligible for travel. In the example given in Figure l. a nullseed containing only O's and 1's at the stop le\'el is shown tobe equivalent at the segment level to a m~llrix of average
~A B C 0
1 4 ~ 6 7 8 9 10 11 12
~~r I 1
1 I I 1 1 1 I 13 I 1 1 1 I I 1
A 4 I 1 1 J I 1$ 0 0 1 1 J I 16 0 0 0- J J 1 1
B 7 0 0 0 0 0 0 0 n 0 1 1 I8 0 0 0 0 0 0 0 0 0 0 I I9 o 0 0 0 n- o 0 0 0 I
C 10 o 0 () () 0 0 0 -1;-11 u a a a a 0 0 0 0 0
D 12 0 0 0 0 0 0 0 0 0 0 0 0
F~A B C 0
From 1 2 3 4 ~ 6 7 8 9 10 11 12
I23 6136 4/6 23/24 1A 4$6
B 7 0 n 7 14 I
89· 0 0 1/16 2/4c 1011
D 12 0 0 0 0
FIGURE 1 Stop-level null seed and segment-level equivalent.
propensities that include. besides O's and l·s. fractional valuesranging from 1116 to 23/24.
Because the recursive algorithm itself does not permit frac-tional propensities. applying it to segment-level data will biasresults, because this method forces all those fractional pro-pensities to be l·s. For example. Ben-Akiva et al. apply therecursive method to segment-level data. setting the minimumtravel distance to zero in order to make intrasegment travelpermissible. As should be expected. they find that the methodpredicts too many intrasegment trips. In contrast. Simon andFurth (7) and Tsygalnitsky apply the recursive method at thestop level, although the results are often presented at thesegment level. avoiding this bias. This effect no doubt ac-counts in part for the poor fit found by Ben-Akiva et al. usingthe recursive method.
When only segment-level data are available. a method ofsynthesizing O-D matrices that is consistent with the recursivemethod at the stop level is the biproportional method with aseed matrix consisting of segment-level average propensities.An example using data from Line 93 demonstrates how usingthis "equivalent null seed" avoids the large bias of a naivesegment-level application of the recursive method. Table 1shows four sets of results (presented at the segment level evenif the analysis was done at the stop level): (a) the actualO-D matrix; (b) the stop-level estimate using a stop-level nullseed (minimum trip length = 2 stops). which is the same asa recursive estimate; (c) the segment-level estimate madeusing the segment-level equivalent null seed; and (d) thesegment-level estimate made using a naive null seed (mini-mum trip length = a segments). which is the same as a re-cursive estimate made at the segment level. Three differenterror measures are used: relative root-mean-square error(RRMSE). root-mean-weighted fractional error (RMWFE).
and X". The R:'>1WFE can be used to judge whether the actualdata obtained agree with the model. Formula~ for these mea-sures applied at the segment level are
RRMSE = {4 i i [(i'l - I,YJ}'" ( 15)1 /"-\ }"'/
RMWFE {!i i [(in - l..l"]}' " ( 16)I 1:Z I J ~ I t'l
n " [(i" -:- I.Y]X" I "\' (17)~I = I J'" I I"
1,1 = passenger trips from i to j.I,) = synthesized passenger trips from i to j.I. total passenger trips. andK = number of matrix cells containing perm'issible trips.
The segment-level estimate made using the equivalent nullseed is almost as good as the stop-level estimate. The equiv-alent null seed minimizes aggregation bias. and aggregationerror. as shown by the increase in the error measures. is small.The results are markedly worse when the recursiw algorithmis applied naively at the segment level. The tendency in thiscase to predict too many very short and very long trips isclearly seen. The same analysis was performed for Line 16and similar results were obtained.
An attempt was also made 10 assess the effect of aggregationbias on the tests performed by Ben-Aki\'a et al. (8) Threesegment-level estimates for Route 77 outbound are shown inTable 2: the "best" estimate. a biproportional estimate gen-erated using a small-sample O-D survey as a seed; the estimateusing an equivalent null seed based on a minimum trip lengthof three stops; and the naive estimate using a segment-levelnull seed (minimum trip length = 0 segments). Because SlOp-level data were not a\·ailable. it was impossible 10 generate astop-le\'el estimate and compare the results with the true dis-tribution. Measures of error are in comparison with the bestestimate. The equivalent null seed estimate approximates whatwould be obtained from a proper stop-level application of'therecursive method. The comparison of these cases clearly showshow the naive segment-level application of the recursive methodincreases the estimated number of very short and very longtrips.
SAMPLING ERROR AND BIAS WITHSMALL-SAMPLE SEED
It may seem that any empirical seed. whether from a small-sample O-D surveyor an old O-D survey. would be superiorto pleading ignorance and using a null seed. However. a nullseed is not such a bad guess for many situations. being con-sistent with our understanding of travel behavior and havingbeen confirmed on a few test routes. Before an empirical seedis used with the biproportional method or another iterativemethod. the value of its information content should be con-sidered. Although information content can in many contextsbe difficult to judge. in the case of a small-sample O-D matrix
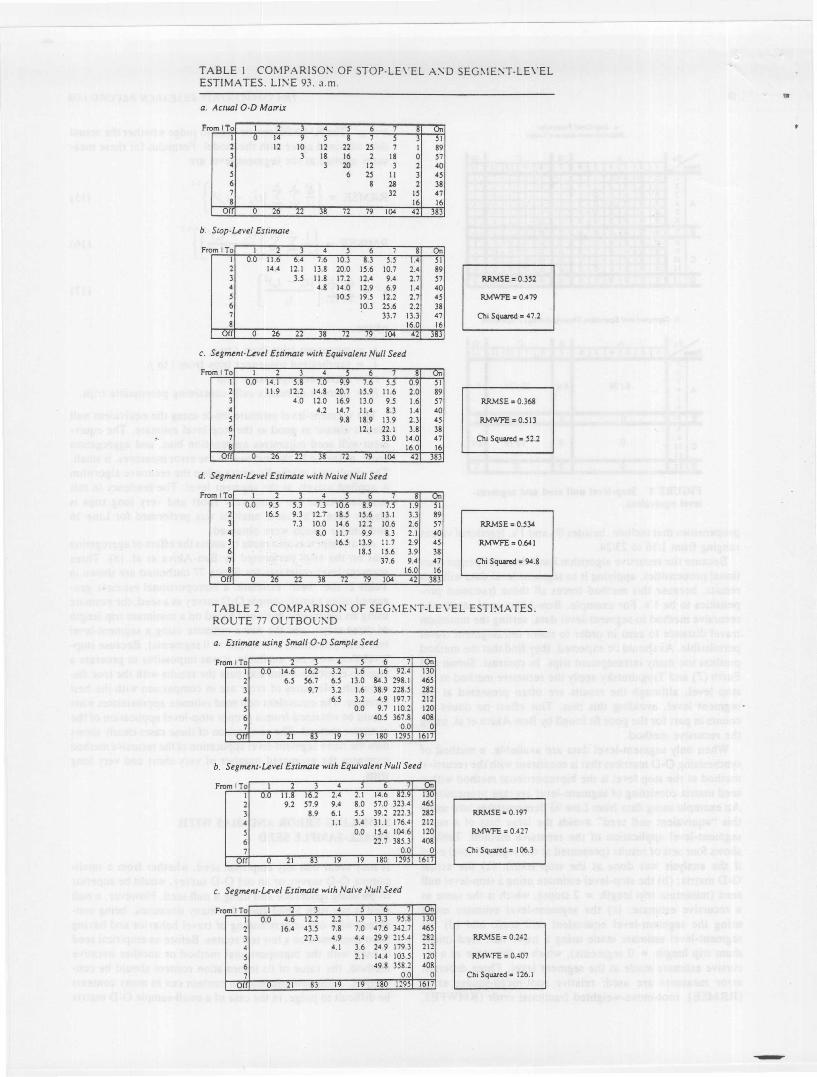
TABLE 1 COMPARISO:\ OF STOP-LE\'EL A:\D SEG\lE:\T-LE\'ELESTIMATES. LJ:\E 93. a.m.
m ITo I 2 4 5 6 7 onI 0 14 9 5 ~ 7 5 512 12 10 12 22 25 7 I 893 3 18 16 2 18 0 574 3 20 12 3 2 405 6 25 II 3 456 8 28 2 387 32 15 478 16 16
or 0 26 22 38 7 79 104 4 3~3
m ITa I 2 4 5 6 1 on1 00 11.6 6.4 7.6 10.3 8.3 5.5 1.4 512 14.4 12.1 13.8 20.0 15.6 10.7 2.4 893 3.5 11.8 17.2 12.4 9.4 2.7 574 4.8 14.0 12.9 6.9 1.4 405 100S 19.5 12.2 2.7 456 10.3 25.6 2.2 387 33.7 13.3 478 16.0 16
orr 0 26 22 38 72 79 104 4 83
m ITo I 2 3 4 5 6 7 On1 0.0 14.1 5.8 7.0 9.9 7.6 5.5 0.9 512 11.9 12.2 14.8 20.7 15.9 11.6 2.0 893 4.0 12.0 16.9 13.0 90S 1.6 574 4.2 14.7 11.4 8.3 1.4 405 9.8 18.9 13.9 2.3 456 12.1 22.1 3.8 387 33.0 14.0 478 16.0 16
orr 0 26 22 38 72 79 104 42 383
m ITo I 3 4 5 6 7 OnI 0.0 9.5 5.3 7.3 10.6 8.9 7.5 1.9 512 16.5 9.3 12.7 l80S 15.6 13.1 3.3 893 7.3 10.0 14.6 12.2 10.6 2.6 574 8.0 11.7 9.9 8.3 2.1 405 16.5 13.9 11.7 2.9 456 18.5 15.6 3.9 387 37.6 9.4 478 16.0 16
err 0 26 12 38 72 79 104 42 383
RRMSE = 0.534
RMWFE = 0.641
TABLE 2 COMPARISOl\: OF SEG\lE!"T-LE\'EL ESTIMATES.ROUTE 77 Ol'TBOlj~D
m ITo I 2 3 4 5 6 7 On1 U.U 14.6 16.2 3.2 1.6 1.6 92.4 1302 6.5 56.7 6.5 13.0 84.3 298.1 4653 9.7 3.2 1.6 38.9 228.5 2824 6.5 3.2 4.9 197.7 2125 0.0 9.7 110.2 1206 40.5 367.8 4087 00 0
or 0 21 83 19 19 180 1295 1617
From I To1234567rr
m ITo I 3 4 5 6 7 On1 0.0 4.6 12.2 2.2 1.9 13.3 95.8 1302 16.4 43.5 7.8 7.0 47.6 342.7 465
3 27.3 4.9 4.4 29.9 215.': 2824 4.1 3.6 24.9 179.3 2125 2.1 14.4 103.5 120
6 49.8 358.2 4087 0.0 0
orr 0 21 83 19 19 180 12y5 1617
seed. the infnrmation content can be e\aluatcd in terms ofbias and ~ample size.
The main bi<l~in 0-0 ~uf\'eys is non response bias. whichis present if the respome rate is substantially below 100 per-cent. a condition endemic to surveys on bu~y bus routes. andthe nonresponding population is different in its 0-0 patternsfrom the responding popul<ltion. The differences most oftencited are as follows: nonresponders (a) are more likely tocome from segments of the route in neighhorhood~ that havelower literacy or are less cooper<lti\'e. or hoth: (b) are morelikely to board where the route is crowded and they can't geta seat: and (c) are more likely to be making ~hort trips. Iea\'ingthem too little time to complete a survey. Fortunately. thefirst two biases <Ire proportional to the response rates <Iteachorigin and each destin<ltion stop. and since the biproportionalmethod correctly expands origin and destination tot<lls. thesebiases disappear. as confirmed by Ben·Akiva (12). The thirdbias. hO\\'e\·er. remains. and can be significant. though itsextent is hard to judge.
The effect of sample size on quality of information in an0-0 matrix is also well known. A common rule of thumh isthat an observation of fewer than five travelers in a cell isunreliable. since a difference of one or two people can effectan enormous rel<lti\'e ch<lnge in the \·alue. In the extremec<lse. a cell with no observation~ poses a ~pecial challenge.since a biproportional estimate for a cell must be zero if itsseed value i~ zero. If a small-~ample 0-0 matrix. aggregatedto the segment le\·el. where the segment i~ the level of thedetail one is finally interested in. has a suhstantia! number ofcells with fewer than fi\'e ohsen·<ltions. the information C,ln-tent of the seed may be so compromised by s<lmpling errorthat it is worse than the information content of a null seed.
For example. the small-~amplc 0-0 sun'eys used by Ben-Akiva et al. (8) are all quite small. containing 61. 70. DR.and 5~ respon~e~ for ihe four route 'direction Cl1mbination~studied. In the case with.the greatest sample ~ize. R,)ute 77outbound. only 8 of 25 segment-to-segment cells cont<lin fi\'eor more observations. and six of the~e all lie in the samecolumn of the matrix alighting <Itthe I<lst stop. Ten of the 25cells contain no ohservations at all. An estimate based onsuch a seed seems risky.
Ben-Akiva et al. respond to the problem posed hy cellswith zero observations by offering a correction to deal withthese "non-structural zeros." Even with this correction. es-timates based on the empiric<ll seed are hea\"ily influenced bypatterns that appear in the seed. Their estim<lte for Route 77outbound made using this empirical seed (Tahle 2a. equiva-lent to their Table 3) contains the peculiar pattern in which.although there is substantial demand from Segments 1 to 7(92 passengers) and from Segments 2 to 6 (8~ passengers).there is virtually no demand from Segments I to 0 (1.6 pas-sengers). because in the small-sample 0-0 sun·ey. no onewent from 1 to 6. In contrast. the estimate resulting from theequivalent null seed (Table 2h) has a much more typical pat-tern, assigning a far larger \'oJume (1~.6 passengers) to 0-0pair 1-6. Becau~e Route 77 is a short rouie and. at the timeof data collection. had no significant competition from otherroutes. a null seed seems quite plausible. The question iswhether the peculiar pattern found using the small-sampleseed is a reflection of true patterns in the popUlation. or justthe spurious outcome of a r<lndom sampling process.
The effect of sdmple ~Ile can he addressed mure rigorou~I~.Bcn-Aki\'a et al. pro\'ide equation~ for dekrmining the ap-proximate standard error of a hiproportional estimate hasedon the number of obsen'ations in a cell. and alsn reportapproximate ~tandard erTOrs of their e~timates. H,)\\ e\·er. be-cause many of their result, are reported normalized to a stan-dard grand total. the level of accuracy attained is not im-mediately apparent. Re\'ersing the normalilation. it \\ a~ foundthat for the case of Route 77 outhound. the relati\e standarderror of their estimates (standard error di\'ided h~ esrimate)is quite small (below 13 percent) for all six eligihk cells inwhich the destination is Segment 7. These \\ere the cells withmany observatiom in the empirical seed. In th.: remaining 19eligible cells of the matrix. the ~eed contain.:d on" ~6 ob-servations. Consequently. the relative ~tandard error i~greaterthan lOa percent in a majority of tho~e cells. For the entirematrix. the average passenger \'olume per eligihle cell is 17.and the average approximate standard error is R.4. \\'ith asmaller sample size. a~ in the other three cases examined byBen-Akiva et 31. (8). errors can he suhstantially larger.
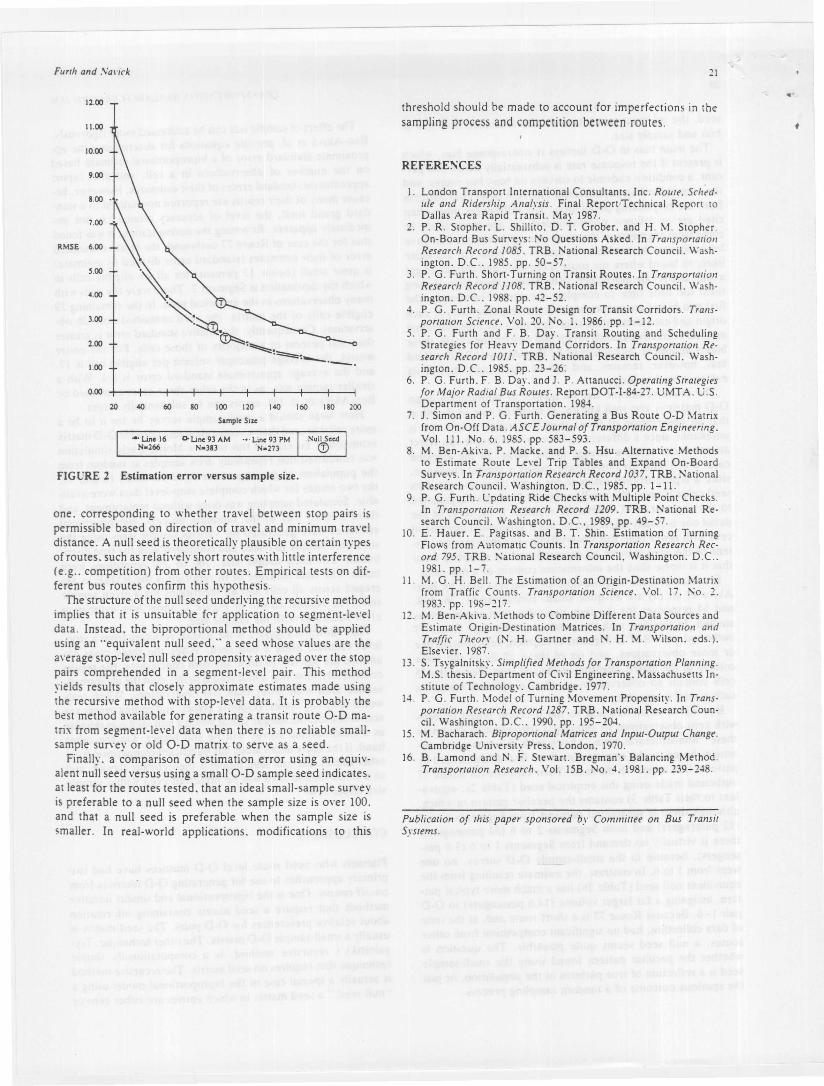
How large should a small-sample sun ey he for it to be amore reliable seed than an equi\'alent null seed for 0-0 matrixestimation? To explore this issue. a ~lonte Carlo simulationwas conducted that repeatedly drew ~amples at random fromthe population of passengers sun'eyed on Lines 16 and 93.the two routes for which cnmplete ~tnp-Je\'C1 data were avail-able. Simulated sampling wa~ done without replacement. andthere was no bias in the sampling proce~s. Biprop(lrtionalestimates were generated for \"arious sampie' sizes using thesimulated sample as a seed and compared with the true distri-bution. For each sample size. lOll to 20{) repetition~ weremade. The final measure of fit reported is the R\lSE as av-eraged across all cells and all repetitions f,)r a gi\'en sample~ize. The results. shown in Figure 2. sho\\ how e~timationerTOr decreases with the sample size.
Also shown in Figure 2 is the R\lSE resulting from a stop-level estimate using a null seed. While the three ca~es ex-amined are to,) few to draw i1n~'firm conclu~ion,. the resultsconsistently show that a null seed is hetter than the ideal small-sample seed with fewer than lOll ohsen·ations. When real-world sampling biases. respon,e errors. and coding errors areaccounted for. the sample sile at which a null seed is as reliableas a small-sample survey will he still higher. On the otherhand. if the TOute under study has significant competition fTOmother routes. the null seed model is theoretically flawed. andso a small-sample seed will he prderred even with a samplesize under WI).
Planners who need route le\'el 0-0 mat rice, ha\'e had twoprimary approaches to use for generating 0-0 matrices fromon-off counts. One is the hiproportional and ~imilar iterati\'emethods that require a seed matrix cnntaining infurmation<lbout relatiw preferences for 0-0 pairs. Th,' seed matrix i,usually a small-sample 0-0 matrix. The nther technil.jue. T~y-galnitsky's recursive methnd. is a cnmputatinnall~ simpletechnique that requires no se<:d matrix. The rClursiH' methouis actually a speci<ll ca~e of the bipropnrtional nhldel using a"null seed." a seed matrix in \\'hich entrie, <lTt' either zero or
Furth and .Val'irk
12,00
11.00
10,00
9.00
1,00
7.00
RMSE 6.00
5,00
•. 00
3.00
2.00
1.00
0.00
20 80 100 120 l.a 160 180 200
Sample Size
one. corresponding to whether travel between stop pairs ispermissible based on direction of navel and minimum traveldistance. A null seed is theoretically plausible on certain typesofroutes. such as relatively short routes with little interference(e.g .. competition) from other routes. Empirical tests on dif-ferent bus routes confirm this hypothesis.
The structure of the null seed underlying the recursive methodimplies that it is unsuitable fN application to segment-Ie\'eldata. Instead. the biproportional method should be appliedusing an "equivalent null seed," a seed whose values are theaverage stop-level null seed propensity averaged over the stoppairs comprehended in a segment-Ie\'el pair. This methodyields results that closely approximate estimates made usingthe recursive method with stop-level data. It is probably thebest method available for generating a transit route G-D ma-trix from segment-level data when there is no reliable small-sample surveyor old G-D matrix to serve as a seed.
Finally. a comparison of estimation error using an equiv-alent null seed versus using a small G-D sample seed indicates.at least for the routes tested. that an ideal small-sample surveyis preferable to a null seed when the sample size is over 100.and that a null seed is preferable when the sample size issmaller. In real-world applications. modifications to this
threshold should be made to account for imperfections in thesampling process and competition between routes.
I. London Transport International Consultants. Inc. Route. Srh~d.1111" alld Ridership Allalysis, Final Report'Technical Report toDallas Area Rapid Transit. May 1987.
2. P. R. Stopher. L. Shillito. D. T. Grober. and H. M, Stopher.On-Board Bus Surveys: No Questions Asked. In TrallsportariollResearch Record 1085. TRB. National Research Council. Wash-ington. DC .. 1985. pp. 50-57.
3. P. G. Furth. Short-Turning on Transit Routes. In TransportariollResearch Record 1l08. TRB. National Research Council. Wash-ington. D.C .. 1988. pp. ~2-52.
~. P. G. Furth. Zonal Route Design for Transit Corridors. Trans-portation Sciellce. Vol. 20. No, 1. 1986. pp, 1- 12.
5. P. G. Furth and F. B. Day. Transit Routing and SchedulingStrategies for Heavy Demand Corridors. In Transportatioll Re-search Record 101 I. TRB. National Research Council. Wash-ington. D.C .. 1985. pp. 23-26:
6. P. G. Furth. F, B. Day. and J. P, Attanucci. Operating Straregiesfor Major Radial Bus Routes. Report DOT-I-84-27, UMT A. lJ .S.Department of Transportation. 1984.
7. J. Simon and P. G, Furth, Generating a Bus Route O-D Matrixfrom On-Off Data. ASCE Journal of Transportation Engineering.Vol. Ill. No.6. 1985. pp. 583-593.
8. M. Ben-Akiva. P. Macke. and P, S. Hsu. Alternative Methodsto Estimate Route Level Trip Tables and Expand On-BoardSurveys. In Transportation Research Record 1037. TRB.1\ationalResearch Council. Washington. D,C., 1985. pp, 1-11.
9. P. G, Furth. L'pdating Ride Checks with Multiple Point Checks.In Transportatioll Research Record 1209. TRB. National Re-search Council. Washington. D.C., 1989, pp. 49-57.
10. E. Hauer. E. Pagitsas. and B. T. Shin. Estimation of TurningFlows from Automatic Counts. In Transportation Research Rec-ord 795. TRB. Sational Research Council, Washington. D.C..1981. pp, 1-7.
11. M. G. H. Bell. The Estimation of an Origin-Destination Matrixfrom Traffic Counts, Transportatioll Sciellce. Vol. 17. 1'0, 2.1983. pp. 198-217.
12. M. Ben-Aki\·a. \Iethods to Combine Different Data Sources andEstimate Origin-Destination Matrices. In Trallsportatioll alldTraffic Theory (N. H. Gartner and N. H. M. Wilson. eds.).Elsevier. 1987.
13. S. Tsygalnitsky. Simplified Methods for Transportation Plannillg.M.S. thesis. Department of Civil Engineering. Massachusetts In-stitute of Technology. Cambridge. 1977.
14. P. G. Furth. Model of Turning Movement Propensity. In Trans-portation Research Record 1287. TRB. National Research Coun-cil. Washington. D.C .. 1990. pp. 195-20~.
15. M. Bacharach. Biproportiollal Matrices and Input-Output Change.Cambridge University Press. London. 1970.
16. B. Lamond and N, F. Stewart. Bregman's Balancing Method.Transportation Research. Vol. 15B. No.4. 1981. pp. 239-2~8.
Publication of this paper sponsored by Committee on Bus TrallsitSystems.