Embed Size (px)
Citation preview
Bus Corridor Service Options
Outline• Corridor Objectives and Strategies
• Express
• Local
• Limited Stop Overlay on Local Service1
• Deadhead
1 Stacey Schwarcz, "Service Design for Heavy Demand Corridors: Limited-Stop Bus Service." MST Thesis, MIT, September 2004
Nigel Wilson 11.258J/1.541J/ESD.226J Spring 2010, Lecture 21
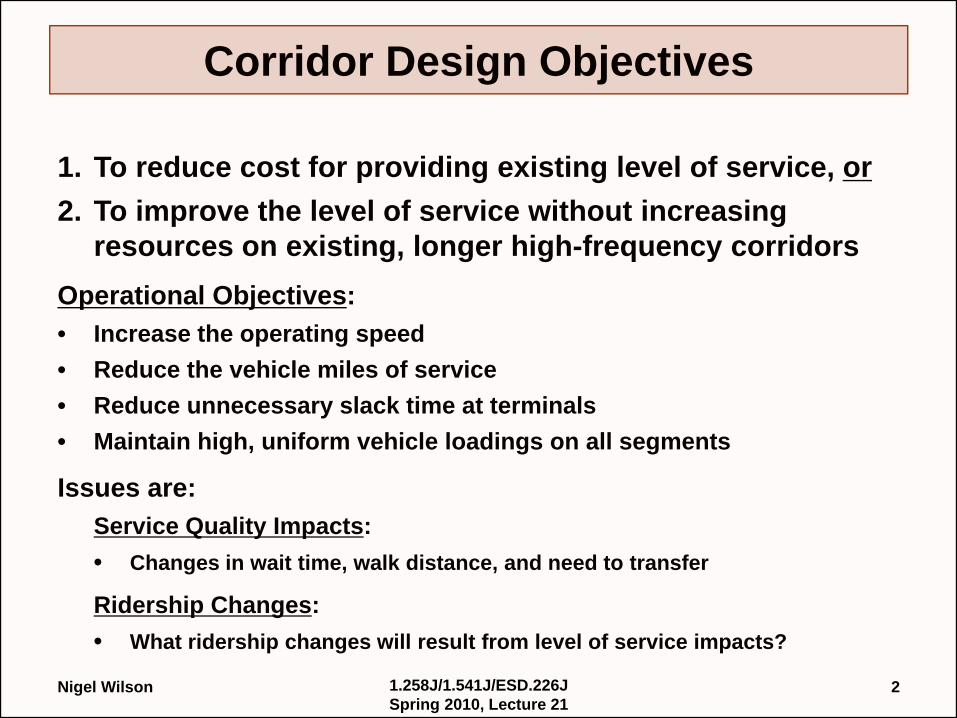
Corridor Design Objectives
1. To reduce cost for providing existing level of service, or2. To improve the level of service without increasing
resources on existing, longer high-frequency corridorsOperational Objectives:• Increase the operating speed• Reduce the vehicle miles of service• Reduce unnecessary slack time at terminals• Maintain high, uniform vehicle loadings on all segments
Issues are:Service Quality Impacts:• Changes in wait time, walk distance, and need to transfer
Ridership Changes:• What ridership changes will result from level of service impacts?
Nigel Wilson 21.258J/1.541J/ESD.226J Spring 2010, Lecture 21

Strategies
A. Express Service-- Downtown orientation-- Zonal Express-- Limited Stops on Express Segment
B. Local Service-- Short Turns/Lines-- Restricted Zonal-- Semi-Restricted Zonal-- Limited Stop Zonal
C. Light Direction Strategies-- Complete Deadheading-- Partial Deadheading
Nigel Wilson 31.258J/1.541J/ESD.226J Spring 2010, Lecture 21
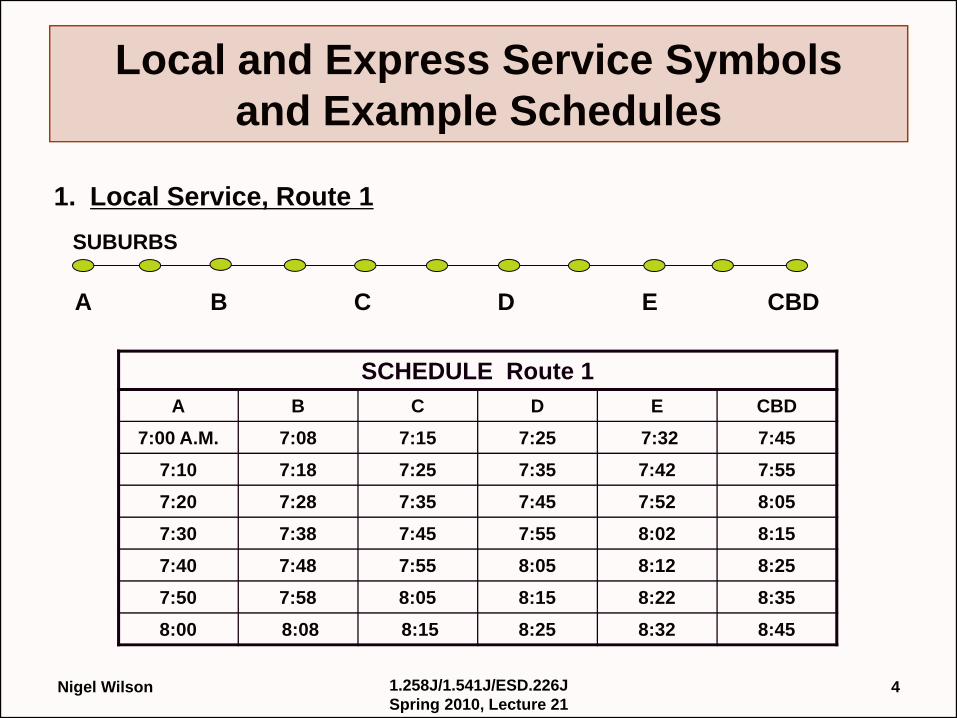
Local and Express Service Symbols and Example Schedules
1. Local Service, Route 1
A B C D E CBD
SUBURBS
SCHEDULE Route 1A B C D E CBD
7:00 A.M. 7:08 7:15 7:25 7:32 7:457:10 7:18 7:25 7:35 7:42 7:557:20 7:28 7:35 7:45 7:52 8:057:30 7:38 7:45 7:55 8:02 8:157:40 7:48 7:55 8:05 8:12 8:257:50 7:58 8:05 8:15 8:22 8:358:00 8:08 8:15 8:25 8:32 8:45
Nigel Wilson 41.258J/1.541J/ESD.226J Spring 2010, Lecture 21
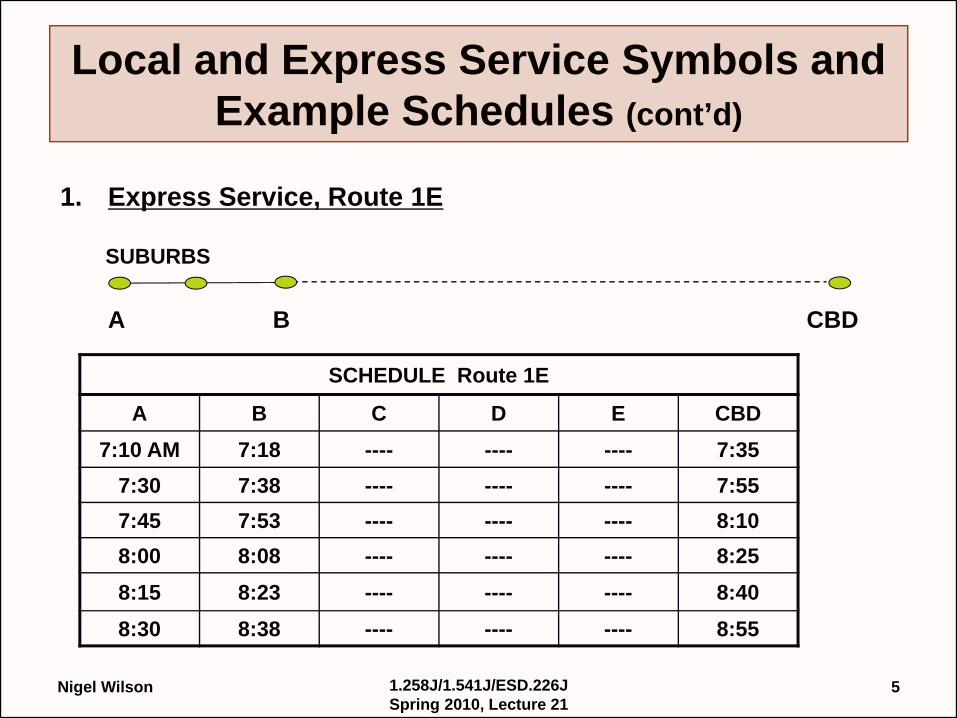
Local and Express Service Symbols and Example Schedules (cont’d)
1. Express Service, Route 1E
A B CBD
SUBURBS
SCHEDULE Route 1E
A B C D E CBD7:10 AM 7:18 ---- ---- ---- 7:35
7:30 7:38 ---- ---- ---- 7:557:45 7:53 ---- ---- ---- 8:108:00 8:08 ---- ---- ---- 8:258:15 8:23 ---- ---- ---- 8:408:30 8:38 ---- ---- ---- 8:55
Nigel Wilson 51.258J/1.541J/ESD.226J Spring 2010, Lecture 21
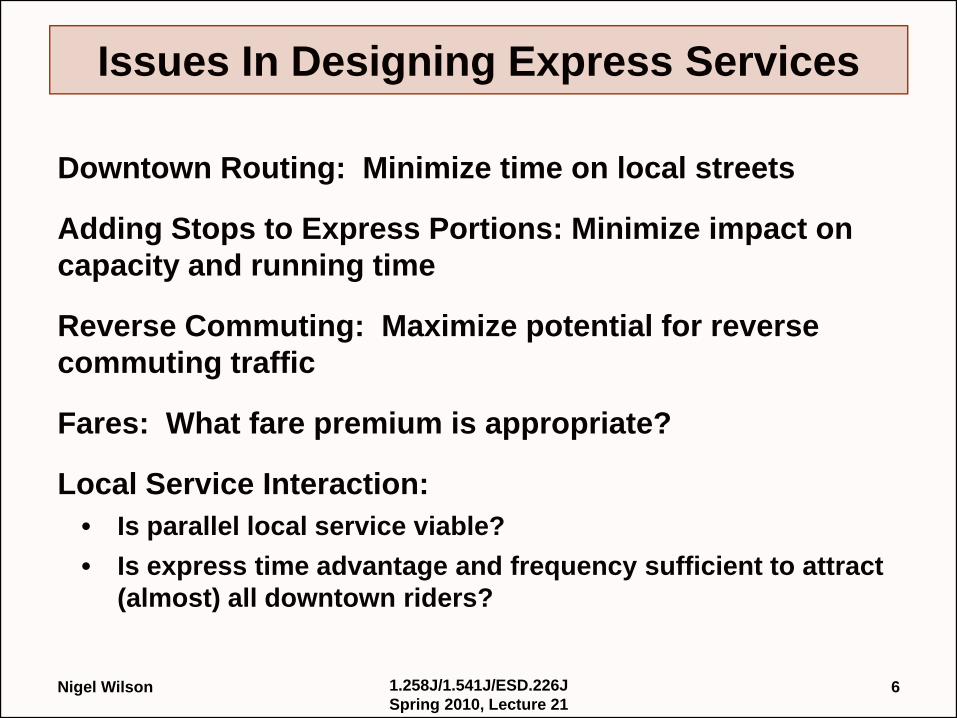
Issues In Designing Express Services
Downtown Routing: Minimize time on local streets
Adding Stops to Express Portions: Minimize impact on capacity and running time
Reverse Commuting: Maximize potential for reverse commuting traffic
Fares: What fare premium is appropriate?
Local Service Interaction: • Is parallel local service viable?• Is express time advantage and frequency sufficient to attract
(almost) all downtown riders?
Nigel Wilson 61.258J/1.541J/ESD.226J Spring 2010, Lecture 21
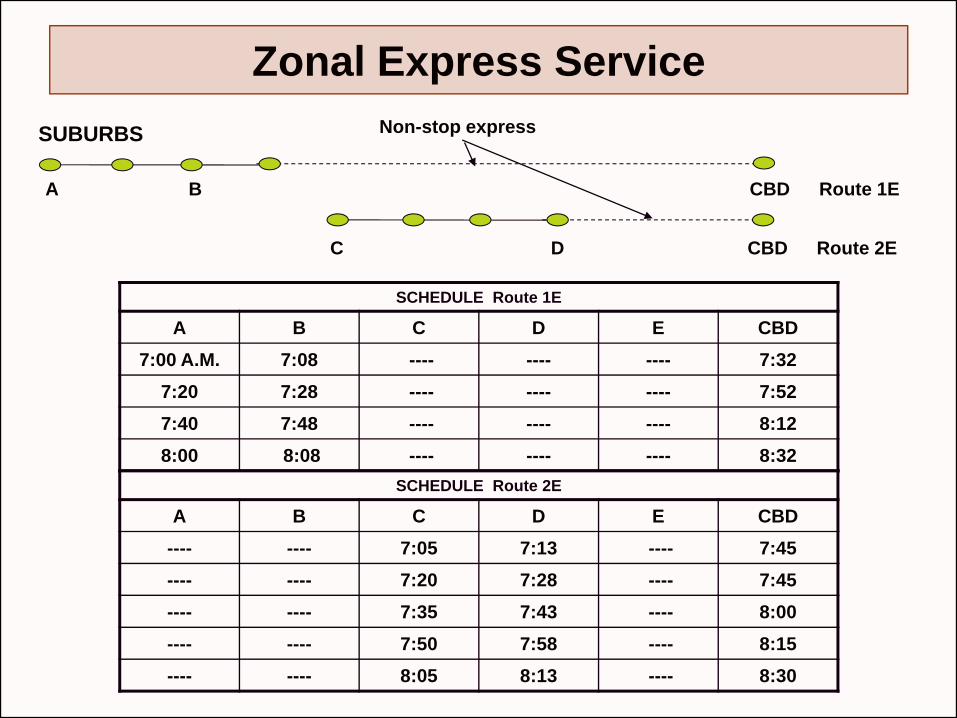
Zonal Express Service
C D CBD Route 2E
A B CBD Route 1E
SUBURBS Non-stop express
SCHEDULE Route 1E
A B C D E CBD7:00 A.M. 7:08 ---- ---- ---- 7:32
7:20 7:28 ---- ---- ---- 7:527:40 7:48 ---- ---- ---- 8:128:00 8:08 ---- ---- ---- 8:32
SCHEDULE Route 2E
A B C D E CBD---- ---- 7:05 7:13 ---- 7:45---- ---- 7:20 7:28 ---- 7:45---- ---- 7:35 7:43 ---- 8:00---- ---- 7:50 7:58 ---- 8:15---- ---- 8:05 8:13 ---- 8:30
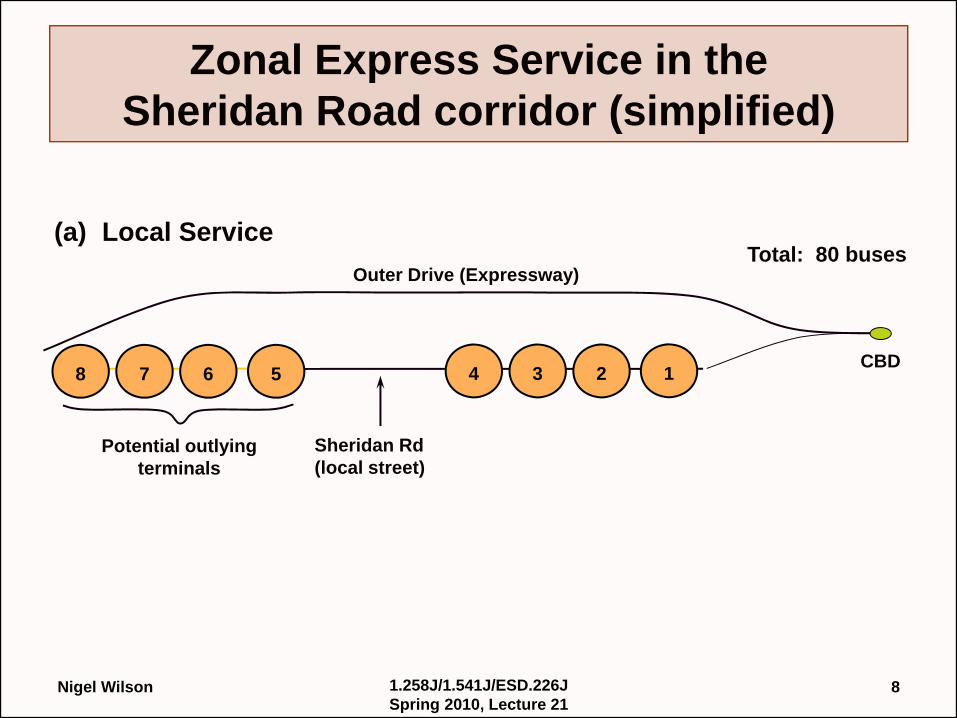
Zonal Express Service in the Sheridan Road corridor (simplified)
(a) Local Service
Potential outlying terminals
Sheridan Rd (local street)
CBD
Outer Drive (Expressway)
7 6 58 3 2 14
Total: 80 buses
Nigel Wilson 81.258J/1.541J/ESD.226J Spring 2010, Lecture 21
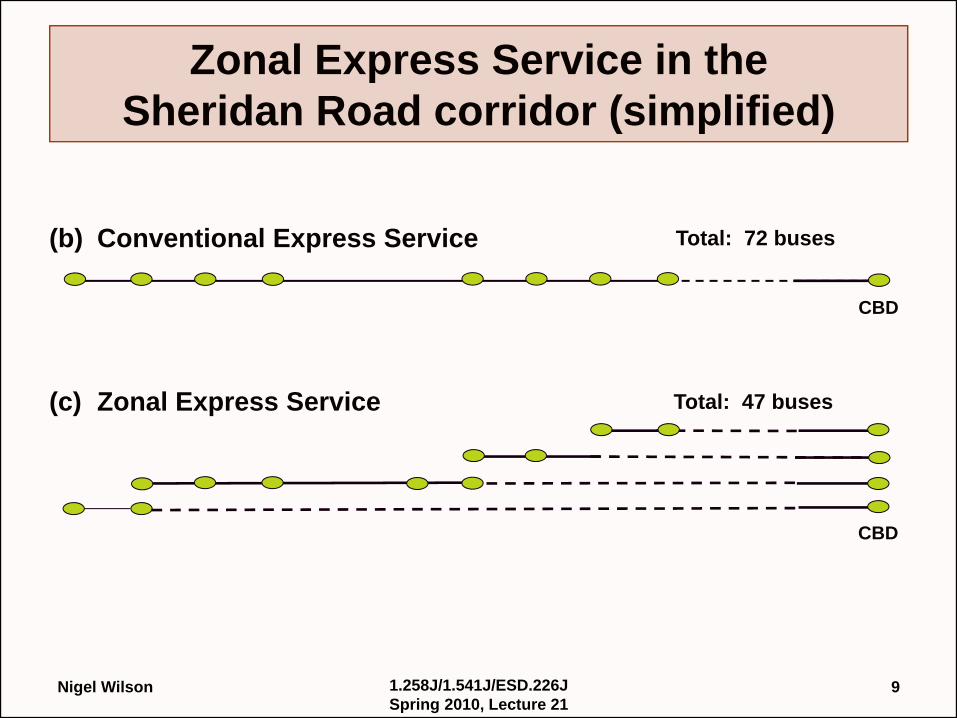
Zonal Express Service in the Sheridan Road corridor (simplified)
CBD
(b) Conventional Express Service Total: 72 buses
CBD
(c) Zonal Express Service Total: 47 buses
Nigel Wilson 91.258J/1.541J/ESD.226J Spring 2010, Lecture 21

Short-Turning Local Service
SUBURBS
A B C D E F
D E FTurnback point
CBD
SCHEDULE - Inbound
A B C D E F CBD7:00 A.M. 7:08 7:15 7:18 7:25 7:32 7:45
7:25 7:32 7:39 7:527:15 7:23 7:30 7:33 7:40 7:47 8:00
7:40 7:47 7:54 8:077:30 7:38 7:45 7:48 7:55 8:02 8:15
7:55 8:02 8:09 8:22
Nigel Wilson 101.258J/1.541J/ESD.226J Spring 2010, Lecture 21

Restricted Zonal Local Service
Inbound buses do not stop except to let passengers alight; boarding prohibited. Outbound buses do not stop except to let passengers board; alighting prohibited.
A B C D E CBD Route 1
C D E CBD Route 2
E CBD Route 3
Restricted boarding/alighting
Zone 1 Zone 2 Zone 3
Nigel Wilson 111.258J/1.541J/ESD.226J Spring 2010, Lecture 21
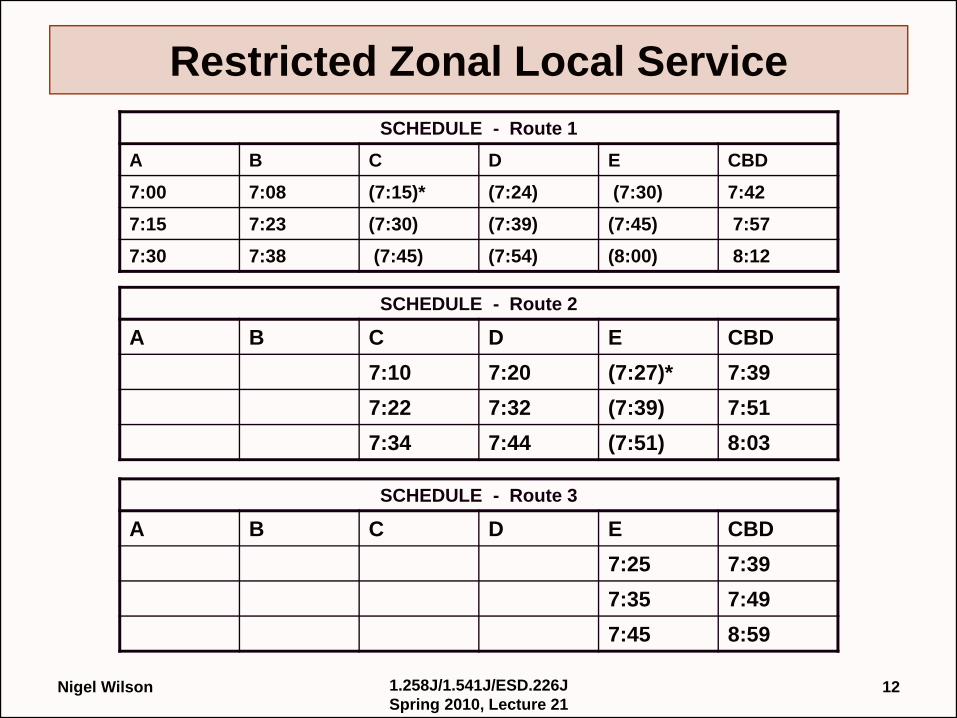
Restricted Zonal Local ServiceSCHEDULE - Route 1
A B C D E CBD7:00 7:08 (7:15)* (7:24) (7:30) 7:427:15 7:23 (7:30) (7:39) (7:45) 7:57 7:30 7:38 (7:45) (7:54) (8:00) 8:12
SCHEDULE - Route 2
A B C D E CBD7:10 7:20 (7:27)* 7:397:22 7:32 (7:39) 7:517:34 7:44 (7:51) 8:03
SCHEDULE - Route 3
A B C D E CBD7:25 7:397:35 7:497:45 8:59
Nigel Wilson 121.258J/1.541J/ESD.226J Spring 2010, Lecture 21
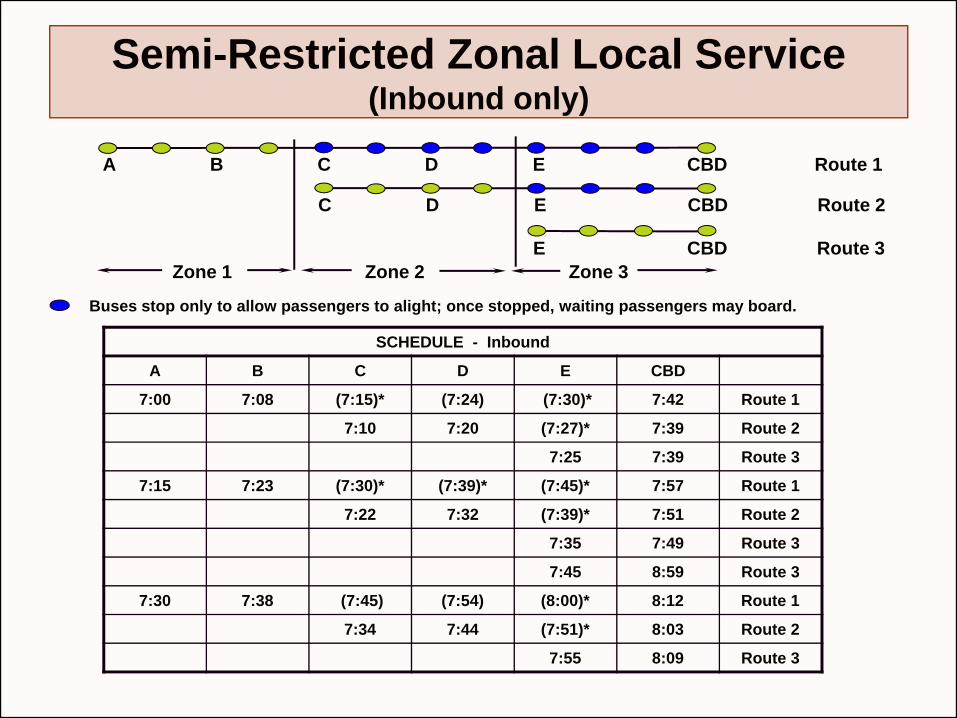
Semi-Restricted Zonal Local Service (Inbound only)
SCHEDULE - Inbound
A B C D E CBD
7:00 7:08 (7:15)* (7:24) (7:30)* 7:42 Route 1
7:10 7:20 (7:27)* 7:39 Route 2
7:25 7:39 Route 3
7:15 7:23 (7:30)* (7:39)* (7:45)* 7:57 Route 1
7:22 7:32 (7:39)* 7:51 Route 2
7:35 7:49 Route 3
7:45 8:59 Route 3
7:30 7:38 (7:45) (7:54) (8:00)* 8:12 Route 1
7:34 7:44 (7:51)* 8:03 Route 2
7:55 8:09 Route 3
A B C D E CBD Route 1
C D E CBD Route 2
Buses stop only to allow passengers to alight; once stopped, waiting passengers may board.
Zone 1 Zone 2 Zone 3E CBD Route 3
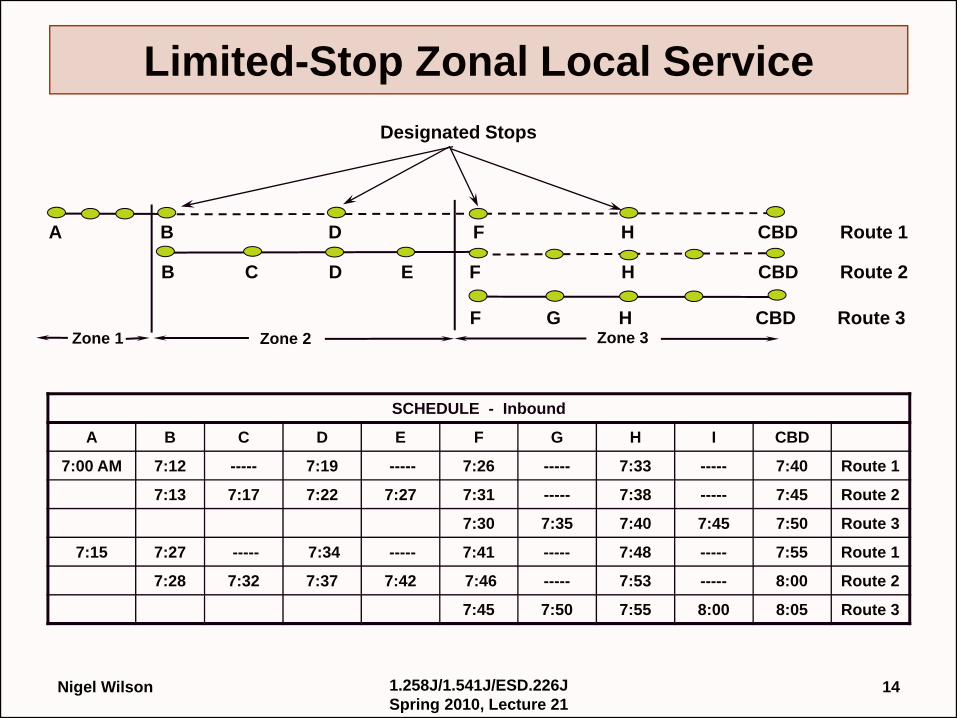
Limited-Stop Zonal Local Service
SCHEDULE - Inbound
A B C D E F G H I CBD
7:00 AM 7:12 ----- 7:19 ----- 7:26 ----- 7:33 ----- 7:40 Route 1
7:13 7:17 7:22 7:27 7:31 ----- 7:38 ----- 7:45 Route 2
7:30 7:35 7:40 7:45 7:50 Route 3
7:15 7:27 ----- 7:34 ----- 7:41 ----- 7:48 ----- 7:55 Route 1
7:28 7:32 7:37 7:42 7:46 ----- 7:53 ----- 8:00 Route 2
7:45 7:50 7:55 8:00 8:05 Route 3
B C D E F H CBD Route 2
A B D F H CBD Route 1
F G H CBD Route 3Zone 2 Zone 3
Designated Stops
Zone 1
Nigel Wilson 141.258J/1.541J/ESD.226J Spring 2010, Lecture 21
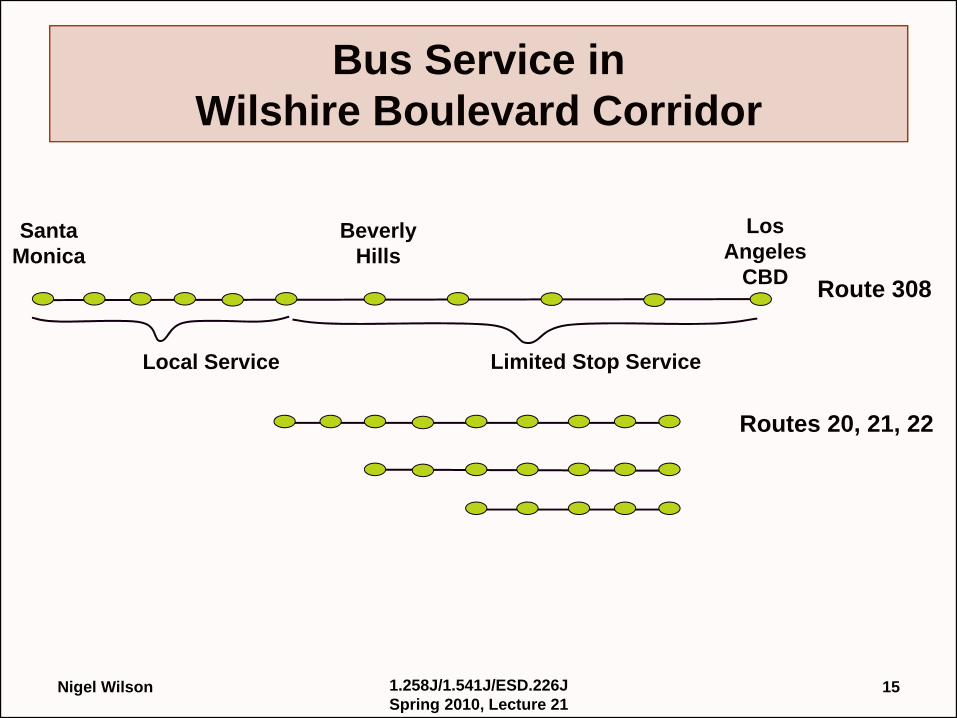
Bus Service in Wilshire Boulevard Corridor
Santa Monica
Local Service
Route 308
Limited Stop Service
Beverly Hills
Los Angeles
CBD
Routes 20, 21, 22
Nigel Wilson 151.258J/1.541J/ESD.226J Spring 2010, Lecture 21
Limited Stop Overlay on Local Service: Research Objectives
• Establish guidelines for the addition of limited-stop service
• Create a procedure and model for evaluation and design
• Apply the model to CTA case studies
Ref: Stacey Schwarcz, "Service Design for Heavy Demand Corridors: Limited-Stop Bus Service." MST Thesis, MIT, September 2004. Extended research now being conducted by Harvey Scorcia.
Nigel Wilson 161.258J/1.541J/ESD.226J Spring 2010, Lecture 21

Key Elements of Limited-Stop Service Design
• Stop Reduction
• Running Time Savings– Dwell times– Traffic and traffic signal delay
• Frequency split
• Resources: neutral or increased?
Nigel Wilson 171.258J/1.541J/ESD.226J Spring 2010, Lecture 21
CTA Limited-Stop Routes
• 3/X3,4/X4, 49/X49, 55/X55, 80/X80, 9/X9, 54A/54B/X54
• Average Route Length: ~8 miles; range: 7.5 to 16 miles
• Stop Reduction: 60-70% of existing stops
• Run Time reductions range from 13-26%
• Frequency split: 50-60% local service initially; based on MIT research, changed to 60-67% express, maintaining at least 15-minute headway on local service
Nigel Wilson 181.258J/1.541J/ESD.226J Spring 2010, Lecture 21
Findings
• Success of limited-stop service depends on– Running time savings – Frequency split between local and limited-stop service – Demand pattern: trip end concentration and trip length– Large number of limited-stop-only or choice riders
• Eliminating stops affects access time: the number of limited-stop only riders decreases as stop spacing increases
• Eliminating stops on CTA routes has had moderate impacts (13-26%) on running times
• Potential Strategy for Limited-Stop Service– Increase stop spacing while maintaining low frequency service
on the local
Nigel Wilson 191.258J/1.541J/ESD.226J Spring 2010, Lecture 21
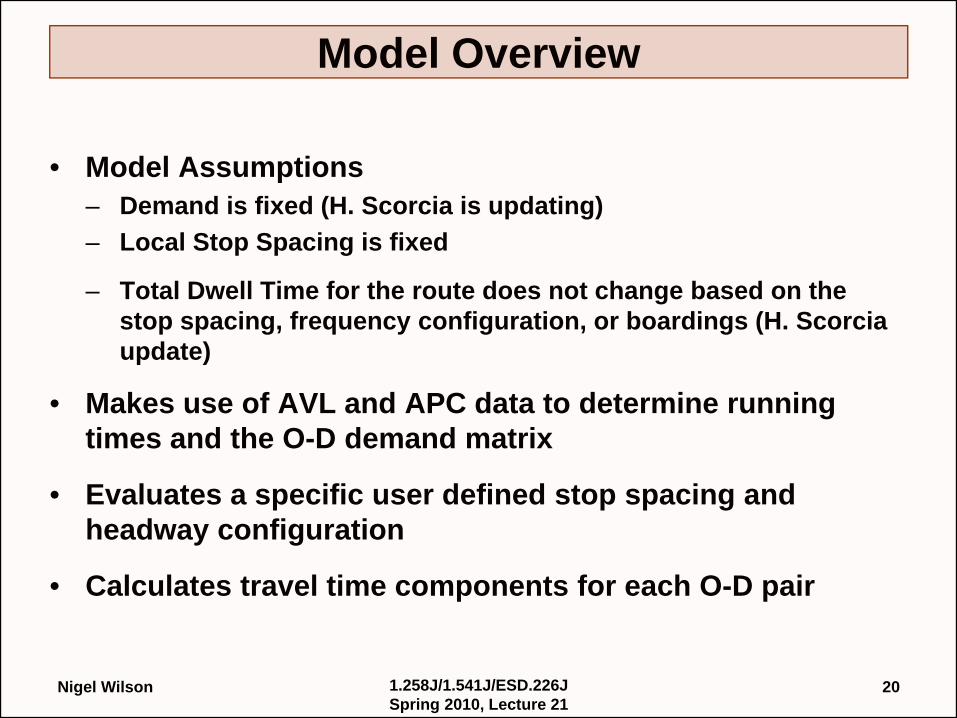
Model Overview
• Model Assumptions– Demand is fixed (H. Scorcia is updating)– Local Stop Spacing is fixed
– Total Dwell Time for the route does not change based on the stop spacing, frequency configuration, or boardings (H. Scorcia update)
• Makes use of AVL and APC data to determine running times and the O-D demand matrix
• Evaluates a specific user defined stop spacing and headway configuration
• Calculates travel time components for each O-D pair
Nigel Wilson 201.258J/1.541J/ESD.226J Spring 2010, Lecture 21
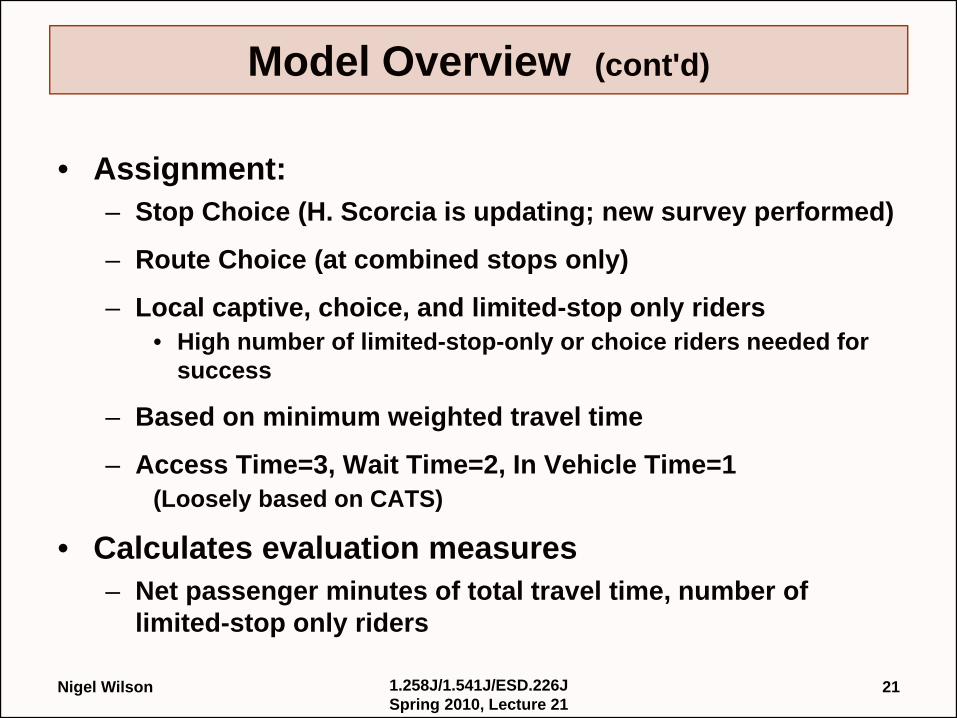
Model Overview (cont'd)
• Assignment: – Stop Choice (H. Scorcia is updating; new survey performed)
– Route Choice (at combined stops only)
– Local captive, choice, and limited-stop only riders• High number of limited-stop-only or choice riders needed for
success
– Based on minimum weighted travel time
– Access Time=3, Wait Time=2, In Vehicle Time=1(Loosely based on CATS)
• Calculates evaluation measures– Net passenger minutes of total travel time, number of
limited-stop only riders
Nigel Wilson 211.258J/1.541J/ESD.226J Spring 2010, Lecture 21
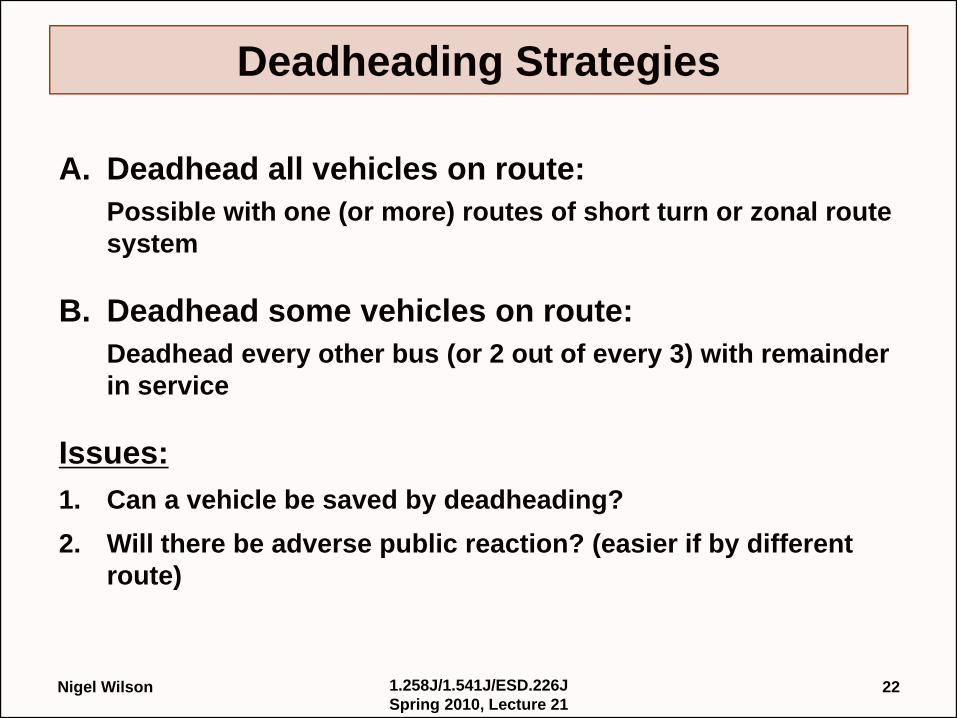
Deadheading Strategies
A. Deadhead all vehicles on route:Possible with one (or more) routes of short turn or zonal route system
B. Deadhead some vehicles on route:Deadhead every other bus (or 2 out of every 3) with remainder in service
Issues:1. Can a vehicle be saved by deadheading?2. Will there be adverse public reaction? (easier if by different
route)
Nigel Wilson 221.258J/1.541J/ESD.226J Spring 2010, Lecture 21
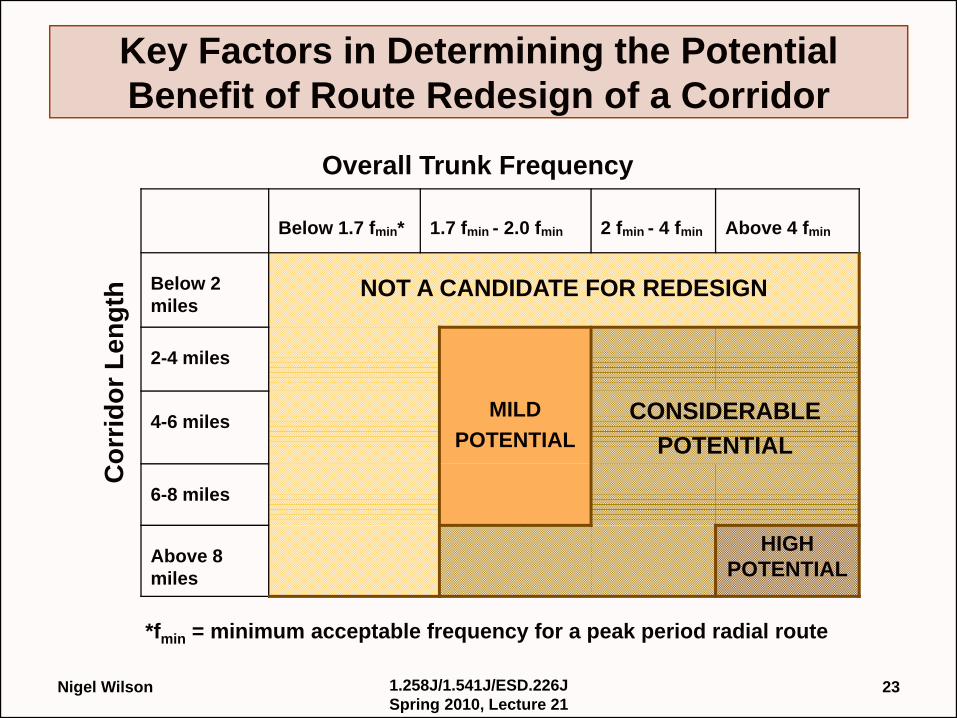
Key Factors in Determining the Potential Benefit of Route Redesign of a Corridor
Overall Trunk Frequency
Cor
ridor
Len
gth
*fmin = minimum acceptable frequency for a peak period radial route
Below 1.7 fmin* 1.7 fmin - 2.0 fmin 2 fmin - 4 fmin Above 4 fmin
Below 2 miles
NOT A CANDIDATE FOR REDESIGN
2-4 miles
4-6 miles MILDPOTENTIAL
CONSIDERABLEPOTENTIAL
6-8 miles
Above 8 miles
HIGH POTENTIAL
Nigel Wilson 231.258J/1.541J/ESD.226J Spring 2010, Lecture 21
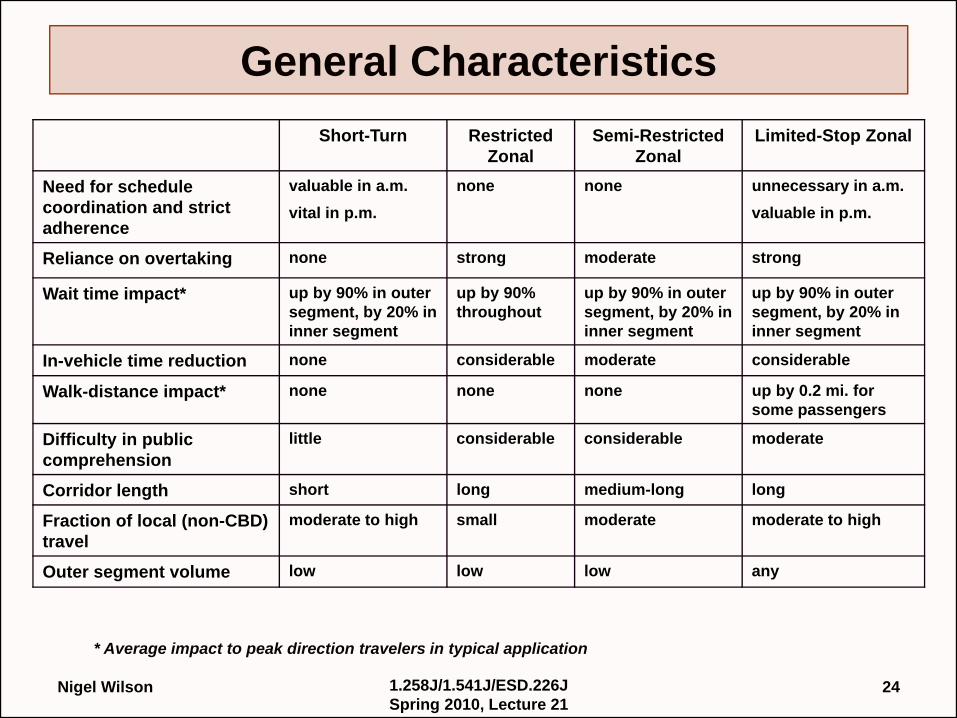
General Characteristics
* Average impact to peak direction travelers in typical application
Short-Turn Restricted Zonal
Semi-Restricted Zonal
Limited-Stop Zonal
Need for schedule coordination and strict adherence
valuable in a.m.vital in p.m.
none none unnecessary in a.m.valuable in p.m.
Reliance on overtaking none strong moderate strong
Wait time impact* up by 90% in outer segment, by 20% in inner segment
up by 90% throughout
up by 90% in outer segment, by 20% in inner segment
up by 90% in outer segment, by 20% in inner segment
In-vehicle time reduction none considerable moderate considerable
Walk-distance impact* none none none up by 0.2 mi. for some passengers
Difficulty in public comprehension
little considerable considerable moderate
Corridor length short long medium-long long
Fraction of local (non-CBD) travel
moderate to high small moderate moderate to high
Outer segment volume low low low any
Nigel Wilson 241.258J/1.541J/ESD.226J Spring 2010, Lecture 21
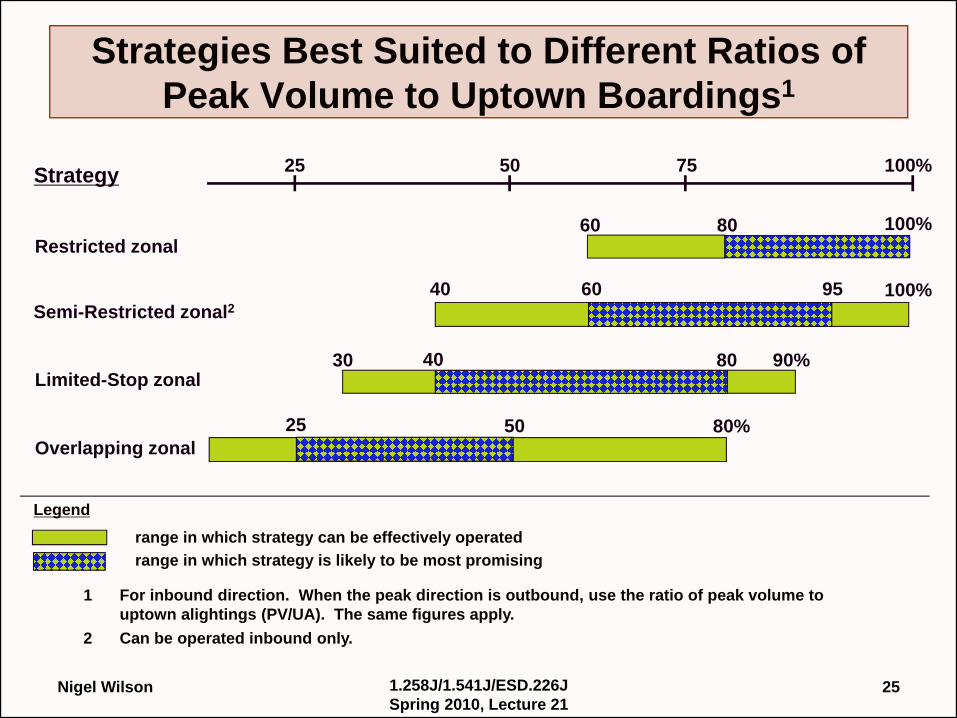
Strategies Best Suited to Different Ratios of Peak Volume to Uptown Boardings1
1 For inbound direction. When the peak direction is outbound, use the ratio of peak volume to uptown alightings (PV/UA). The same figures apply.
2 Can be operated inbound only.
range in which strategy can be effectively operatedrange in which strategy is likely to be most promising
Legend
Strategy
Restricted zonal
Limited-Stop zonal
Semi-Restricted zonal2
Overlapping zonal
25 7550 100%
60 80 100%
40 60 95 100%
30 40 80 90%
25 50 80%
Nigel Wilson 251.258J/1.541J/ESD.226J Spring 2010, Lecture 21
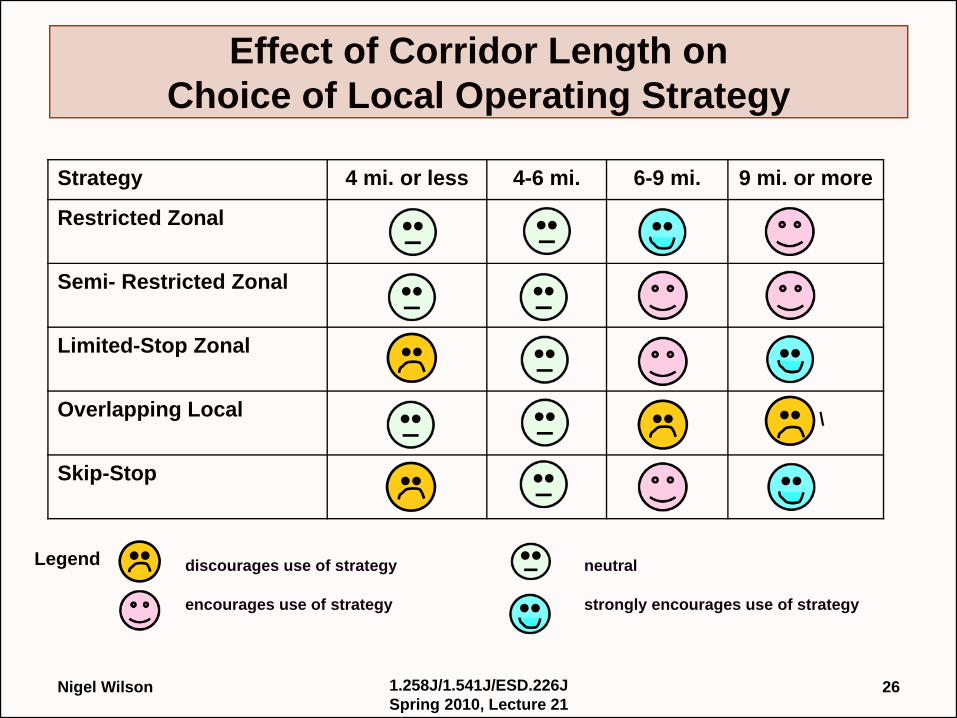
Effect of Corridor Length on Choice of Local Operating Strategy
Strategy 4 mi. or less 4-6 mi. 6-9 mi. 9 mi. or more
Restricted Zonal
Semi- Restricted Zonal
Limited-Stop Zonal
Overlapping Local
Skip-Stop ••
•• ••
••
••
••••
••
••
••
••••
••
••
Legend
\
•• ••••
••
Nigel Wilson 261.258J/1.541J/ESD.226J Spring 2010, Lecture 21
discourages use of strategy
encourages use of strategy
neutral
strongly encourages use of strategy
MIT OpenCourseWarehttp://ocw.mit.edu
1.258J / 11.541J / ESD.226J Public Transportation SystemsSpring 2010
For information about citing these materials or our Terms of Use, visit: http://ocw.mit.edu/terms.


![MIT Students Spring 2011 - MIT OpenCourseWare | … Students Spring 2011 [ATLANTA BELTLINE] A major urban redevelopment project that will transform a historic 22‐mile rail corridor](https://img.pdfslide.us/doc/110x75/5b1e225d7f8b9ae9218b51da/mit-students-spring-2011-mit-opencourseware-students-spring-2011-atlanta-beltline.jpg)