Embed Size (px)
Citation preview
G o v e r n m e n t C o n s u m e r S a f e t y R e s e a r c h
Burns and scalds accidents in the home
1. SUMMARY OVERVIEW - BURNS/SCALDS ACCIDENTS IN THE HOME 1
1.1 OVERVIEW OF BURNS AND SCALDS ACCIDENTS IN THE HOME 11.1.1 Total number of burns/scalds 11.1.2 Key age groups at risk - severe injuries 11.1.3 Key products involved in burns and scalds accidents 21.1.4 Key location for accidents causing burns and scalds 31.1.5 Key accident mechanisms - severe injuries 41.1.6 How typical burns vary by type of product and age of victim 51.1.7 Implications of medical treatment and psychological affects 61.1.8 Socio-economic trends of burns and scalds accidents 61.1.9 Key product already available which could be better promoted 71.1.10 Opportunities for innovation and improvements in safety design 71.1.11 Main safety messages for key target group -
parents/carers of children under 5 81.1.12 Safety awareness campaign 9
2. RESEARCH OBJECTIVES, METHOD AND SAMPLE 10
2.1 BACKGROUND, OBJECTIVES, RESEARCH METHOD AND SAMPLE 102.1.1 Background 102.1.2 Main objectives of the research 102.1.3 Research method 112.1.4 Sample achieved 112.1.5 A note on the report findings 122.1.6 Definitions 12
3. AN OVERVIEW OF NON-FATAL/FATAL ACCIDENTS 13
3.1 TOTAL MINOR, SEVERE AND FATAL INJURIES BY MAIN PRODUCT 133.1.1 Total number of minor, severe and fatal injuries by main product 133.1.2 Number of minor injuries requiring visits to GP surgeries 15
3.2 MATRIX OF THE SEVERITY OF BURNS AND SCALDS INJURIES BY AGE 153.2.1 Matrix of severe and fatal burns and scalds injuries by age group 15
3.3 SEVERE/FATAL OF BURNS AND SCALDS BY AGE AND TIME OF YEAR 173.3.1 Severe and fatal injuries per million population by age and sex 173.3.2 How accidents levels vary throughout the year 18
CONTENTS PAGE
4.5 CHIP PAN/DEEP FAT FRYER 454.5.1 Total accidents 454.5.2 Seasonal variations (severe injuries only) 454.5.3 Age and sex of victim (severe injuries only) 464.5.4 Accident mechanisms (severe injuries only) 474.5.5 Nature of typical burns and implications of required
medical treatment 494.5.6 Product design ideas emerging from the research 494.5.7 Key safety messages 50
4.6 SAUCEPANS 524.6.1 Total accidents 524.6.2 Seasonal variations (severe injuries only) 524.6.3 Age and sex of victim (severe injuries only) 464.6.4 Accident mechanisms (severe and fatal injuries only) 544.6.5 Nature of typical burns and implications of required
medical treatment 554.6.6 Product design ideas emerging from the research 554.6.7 Key safety messages 56
4.7 COOKERS ALL TYPES 574.7.1 Total accidents 574.7.2 Secondary ignition sources 574.7.3 Seasonal variations (severe injuries only) 574.7.4 Age and sex of victim (severe and fatal injuries only) 584.7.5 Accident mechanisms (severe and fatal injuries only) 594.7.6 Nature of typical burns and implications of required
medical treatment 604.7.7 Product design ideas emerging from the research 614.7.8 Key safety messages 61
4.8 CARS/MOTORCYCLES 634.8.1 Total accidents 634.8.2 Seasonal variations (severe injuries only) 634.8.3 Age and sex of victim (severe and fatal injuries only) 644.8.4 Accident mechanisms (severe and fatal injuries only) 64
4.9 PETROL 664.9.1 Total accidents 664.9.2 Secondary ignition sources 664.9.3 Seasonal variations (severe injuries only) 664.9.4 Age and sex of victim (severe and fatal injuries only) 674.9.5 Accident mechanisms (severe and fatal injuries only) 68
CONTENTS PAGE
4. BURNS AND SCALDS - ANALYSIS OF THE MAIN CAUSES 19
4.1 CUPS AND MUGS 194.1.1 Total accidents 194.1.2 Seasonal variations (severe injuries only) 194.1.3 Age and sex of victim (severe injuries only) 204.1.4 Accident mechanisms (severe injuries only) 204.1.5 Nature of typical burns and implications of required
medical treatment 224.1.6 Product design ideas emerging from the research 234.1.7 Key safety messages 23
4.2 BATHS 244.2.1 Total accidents 244.2.2 Seasonal variations (severe injuries only) 244.2.3 Age and sex of victim (severe and fatal injuries only) 254.2.4 Accident mechanisms (severe and fatal injuries only) 264.2.5 Nature of typical burns and implications of required
medical treatment 274.2.6 Product design ideas emerging from the research 284.2.7 Key safety messages 29
4.3 KETTLES 314.3.1 Total accidents 314.3.2 Seasonal variations (severe injuries only) 314.3.3 Age and sex of victim (severe injuries only) 324.3.4 Accident mechanisms (severe injuries only) 334.3.5 Nature of typical burns and implications of required
medical treatment 354.3.6 Product design ideas emerging from the research 364.3.7 Key safety messages 37
4.4 FIRE HEATERS ALL TYPES 384.4.1 Total accidents 384.4.2 Secondary ignition sources 384.4.3 Seasonal variations (severe injuries only) 394.4.4 Age and sex of victim (severe and fatal injuries only) 394.4.5 Accident mechanisms (severe and fatal injuries only) 404.4.6 Nature of typical burns and implications of required
medical treatment 434.4.7 Product design ideas emerging from the research 444.4.8 Key safety messages 44
CONTENTS PAGE
4.15 IRONS 874.15.1 Total accidents 874.15.2 Seasonal variations (severe injuries only) 874.15.3 Age and sex of victim (severe and fatal injuries only) 884.15.4 Accident mechanisms (severe injuries only) 884.15.5 Nature of typical burns and implications of required
medical treatment 894.15.6 Product design ideas emerging from the research 894.15.7 Key safety messages 90
4.16 HOT FOODS/HOT SAUCES 914.16.1 Total accidents 914.16.2 Seasonal variations (severe injuries only) 914.16.3 Age and sex of victim (severe injuries only) 924.16.4 Accident mechanisms (severe injuries only) 92
4.17 GAS CYLINDERS/GAS LEAKS 944.17.1 Total accidents 944.17.2 Seasonal variations (severe injuries only) 944.17.3 Age and sex of victim (severe injuries only) 954.17.4 Accident mechanisms (severe injuries only) 95
4.18 LIGHTERS 974.18.1 Total accidents 974.18.2 Secondary ignition sources 974.18.3 Seasonal variations (severe injuries only) 984.18.4 Age and sex of victim (severe and fatal injuries only) 984.18.5 Accident mechanisms (severe and fatal injuries only) 99
4.19 BOWLS/BUCKETS OF HOT WATER 1014.19.1 Total accidents 1014.19.2 Seasonal variations (severe injuries only) 1014.19.3 Age and sex of victim (severe injuries only) 1024.19.4 Accident mechanisms (severe and fatal injuries only) 102
4.20 FRYING PANS 1044.20.1 Total accidents 1044.20.2 Seasonal variations (severe injuries only) 1044.20.3 Age and sex of victim (severe injuries only) 1054.20.4 Accident mechanisms (severe injuries only) 105
CONTENTS PAGE
4.10 TEAPOTS/COFFEEPOTS 694.10.1 Total accidents 694.10.2 Seasonal variations (severe injuries only) 694.10.3 Age and sex of victim (several injuries only) 704.10.4 Accident mechanisms (severe injuries only) 704.10.5 Nature of typical burns and implications of required
medical treatment 714.10.6 Product design ideas emerging from the research 724.10.7 Key safety messages 72
4.11 CIGARETTES/SMOKING 734.11.1 Total accidents 734.11.2 Secondary ignition sources 734.11.3 Seasonal variations (severe injuries only) 734.11.4 Age and sex of victim (severe and fatal injuries only) 744.11.5 Accident mechanisms (severe and fatal injuries only) 74
4.12 RADIATORS/HOT PIPES 764.12.1 Total accidents 764.12.2 Seasonal variations (severe injuries only) 764.12.3 Age and sex of victim (severe and fatal injuries only) 774.12.4 Accident mechanisms (severe injuries only) 77
4.13 JUGS OF HOT WATER 794.13.1 Total accidents 794.13.2 Seasonal variations (severe injuries only) 794.13.3 Age and sex of victim (severe injuries only) 804.13.4 Accident mechanisms (severe injuries only) 804.13.5 Nature of typical burns and implications of
required medical treatment 814.13.6 Product design ideas emerging from the research 814.13.7 Key safety messages 82
4.14 GARDEN FIRE/BONFIRE 834.14.1 Total accidents 834.14.2 Seasonal variations (severe injuries only) 834.14.3 Age and sex of victim (severe injuries only) 844.14.4 Accident mechanisms (severe injuries only) 84
CONTENTS PAGE
4.28 HOT WATER BOTTLES 1234.28.1 Total accidents 1234.28.2 Seasonal variations (severe injuries only) 1234.28.3 Age and sex of victim (severe and fatal injuries only) 1244.28.4 Accident mechanisms (severe injuries only) 124
4.29 OTHER MINOR GROUPS 1254.29.1 Total accidents 1254.29.2 Age and sex of victim (severe and fatal injuries only) 126
4.30 UNKNOWN CAUSES 1274.30.1 Total accidents 1274.30.2 Age and sex of victim (severe and fatal injuries only) 127
5. APPENDICES 128
5.1 HOW FATAL AND NON-FATAL INJURIES WERE CALCULATED 1285.1.1 Fatal injuries 1285.1.2 Non-fatal injuries 128
5.2 SOCIO ECONOMIC TRENDS IN BURNS/SCALDS 1305.2.1 Segmentation by socio-economic groupings 1305.2.2 Reasons for a higher incidence of burns/scalds
in lower socio-economic groups 131
5.3 MINOR BURNS AND SCALDS VICTIMS - GP SURGERIES 1325.3.1 Estimate of the number of GP treated minor burns
and scald injuries 132
5.4 HOW BURNS AND SCALDS ARE ADDRESSED OVERSEAS 1335.4.1 How a campaign can best succeed
in reducing burns/scalds injuries 1335.4.2 Experience of tackling burns & scalds injuries
in Norway, USA and Australia 1365.4.3 Reports on burns and scalds extracted
from the literature search 142
5.5 RESPONDENTS INTERVIEWED, REPORTS/LITERATURE CONSULTED 1455.5.1 Details of respondents interviewed during
the programme of research 1455.5.2 Details of reports, articles and other material
used as reference material 147
CONTENTS PAGE
4.21 FIREWORKS 1074.21.1 Total accidents 1074.21.2 Seasonal variations (severe injuries only) 1074.21.3 Age and sex of victim (severe injuries only) 1084.21.4 Accident mechanisms (severe injuries only) 108
4.22 SUN 1094.22.1 Total accidents 1094.22.2 Seasonal variations (severe injuries only) 1094.22.3 Age and sex of victim (severe injuries only) 1104.22.4 Accident mechanisms (severe injuries only) 110
4.23 BABY BOTTLES 1114.23.1 Total accidents 1114.23.2 Seasonal variations (severe injuries only) 1114.23.3 Age and sex of victim (severe injuries only) 1124.23.4 Accident mechanisms (severe injuries only) 112
4.24 MATCHES 1134.24.1 Total accidents 1134.24.2 Secondary ignition sources 1134.24.3 Seasonal variations (severe injuries only) 1134.24.4 Age and sex of victim (severe and fatal injuries only) 1144.24.5 Accident mechanisms (severe and fatal injuries only) 114
4.25 WELDING 1164.25.1 Total accidents 1164.25.2 Seasonal variations (severe injuries only) 1164.25.3 Age and sex of victim (severe injuries only) 1174.25.4 Accident mechanisms (severe injuries only) 117
4.26 BARBECUE 1184.26.1 Total accidents 1184.26.2 Seasonal variations (severe injuries only) 1184.26.3 Age and sex of victim (severe only) 1194.26.4 Accident mechanisms (severe injuries only) 119
4.27 CANDLES 1204.27.1 Total accidents 1204.27.2 Secondary ignition sources 1204.27.3 Seasonal variations (severe injuries only) 1214.27.4 Age and sex of victim (severe and fatal injuries only) 1214.27.5 Accident mechanisms (severe and fatal injuries only) 122
CONTENTS PAGE
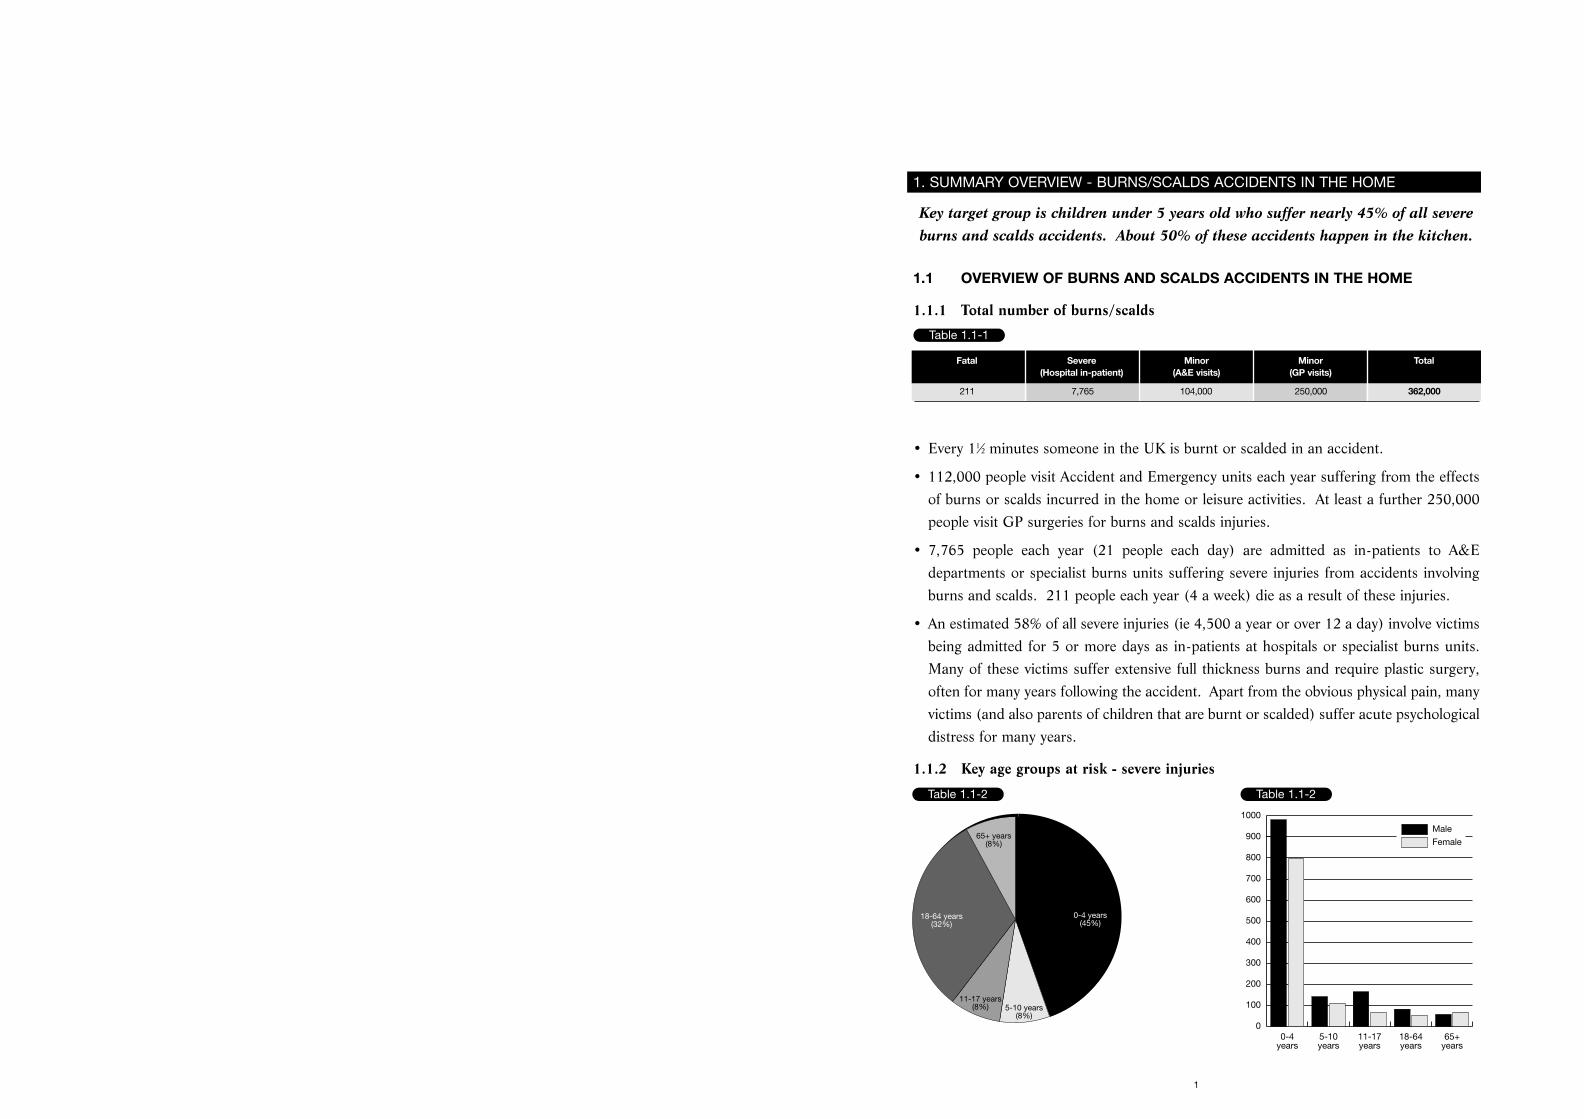
Key target group is children under 5 years old who suffer nearly 45% of all severeburns and scalds accidents. About 50% of these accidents happen in the kitchen.
1.1 OVERVIEW OF BURNS AND SCALDS ACCIDENTS IN THE HOME
1.1.1 Total number of burns/scalds
• Every 11⁄2 minutes someone in the UK is burnt or scalded in an accident.
• 112,000 people visit Accident and Emergency units each year suffering from the effectsof burns or scalds incurred in the home or leisure activities. At least a further 250,000people visit GP surgeries for burns and scalds injuries.
• 7,765 people each year (21 people each day) are admitted as in-patients to A&Edepartments or specialist burns units suffering severe injuries from accidents involvingburns and scalds. 211 people each year (4 a week) die as a result of these injuries.
• An estimated 58% of all severe injuries (ie 4,500 a year or over 12 a day) involve victimsbeing admitted for 5 or more days as in-patients at hospitals or specialist burns units.Many of these victims suffer extensive full thickness burns and require plastic surgery,often for many years following the accident. Apart from the obvious physical pain, manyvictims (and also parents of children that are burnt or scalded) suffer acute psychologicaldistress for many years.
1.1.2 Key age groups at risk - severe injuries
1
1. SUMMARY OVERVIEW - BURNS/SCALDS ACCIDENTS IN THE HOME
Table 1.1-1
Fatal Severe Minor Minor Total(Hospital in-patient) (A&E visits) (GP visits)
211 7,765 104,000 250,000 362,000
Table 1.1-2 Table 1.1-2
0-4 years(45%)
5-10 years(8%)
11-17 years(8%)
18-64 years(32%)
65+ years(8%)
0-4years
5-10years
11-17years
18-64years
65+years
0
100
200
300
400
500
600
700
800
900
1000
Male
Female
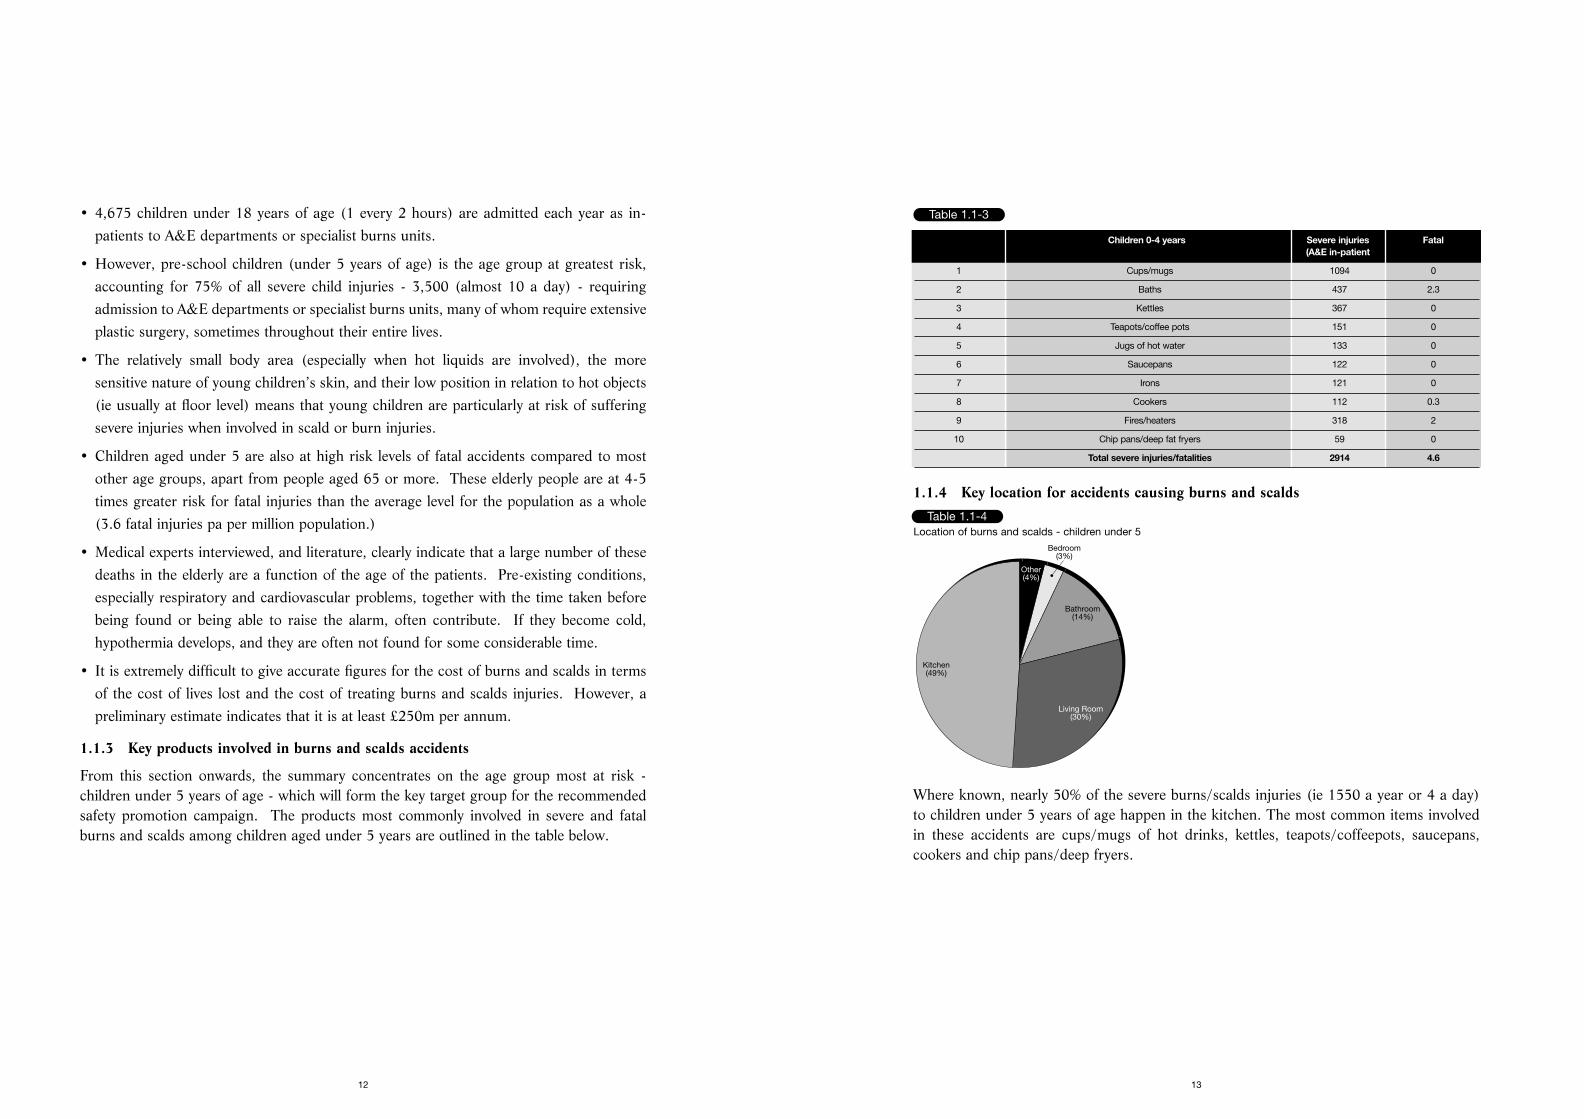
1.1.4 Key location for accidents causing burns and scalds
Where known, nearly 50% of the severe burns/scalds injuries (ie 1550 a year or 4 a day)to children under 5 years of age happen in the kitchen. The most common items involvedin these accidents are cups/mugs of hot drinks, kettles, teapots/coffeepots, saucepans,cookers and chip pans/deep fryers.
13
• 4,675 children under 18 years of age (1 every 2 hours) are admitted each year as in-patients to A&E departments or specialist burns units.
• However, pre-school children (under 5 years of age) is the age group at greatest risk,accounting for 75% of all severe child injuries - 3,500 (almost 10 a day) - requiringadmission to A&E departments or specialist burns units, many of whom require extensiveplastic surgery, sometimes throughout their entire lives.
• The relatively small body area (especially when hot liquids are involved), the moresensitive nature of young children’s skin, and their low position in relation to hot objects(ie usually at floor level) means that young children are particularly at risk of sufferingsevere injuries when involved in scald or burn injuries.
• Children aged under 5 are also at high risk levels of fatal accidents compared to mostother age groups, apart from people aged 65 or more. These elderly people are at 4-5times greater risk for fatal injuries than the average level for the population as a whole(3.6 fatal injuries pa per million population.)
• Medical experts interviewed, and literature, clearly indicate that a large number of thesedeaths in the elderly are a function of the age of the patients. Pre-existing conditions,especially respiratory and cardiovascular problems, together with the time taken beforebeing found or being able to raise the alarm, often contribute. If they become cold,hypothermia develops, and they are often not found for some considerable time.
• It is extremely difficult to give accurate figures for the cost of burns and scalds in termsof the cost of lives lost and the cost of treating burns and scalds injuries. However, apreliminary estimate indicates that it is at least £250m per annum.
1.1.3 Key products involved in burns and scalds accidents
From this section onwards, the summary concentrates on the age group most at risk -children under 5 years of age - which will form the key target group for the recommendedsafety promotion campaign. The products most commonly involved in severe and fatalburns and scalds among children aged under 5 years are outlined in the table below.
12
Table 1.1-3
Children 0-4 years Severe injuries Fatal(A&E in-patient
1 Cups/mugs 1094 0
2 Baths 437 2.3
3 Kettles 367 0
4 Teapots/coffee pots 151 0
5 Jugs of hot water 133 0
6 Saucepans 122 0
7 Irons 121 0
8 Cookers 112 0.3
9 Fires/heaters 318 2
10 Chip pans/deep fat fryers 59 0
Total severe injuries/fatalities 2914 4.6
Table 1.1-4
Other(4%)
Bedroom(3%)
Bathroom(14%)
Living Room(30%)
Kitchen(49%)
Location of burns and scalds - children under 5
cooker grill. Adult injuries (160 severe injuries and 13 deaths) mostly involve items ofclothing igniting when leaning over the cooker.
• Fires and heaters are involved in 420 severe injuries a year (over 1 a day) requiringadmission as in-patients (affecting all age groups) and 30 deaths a year (mainly theelderly). Children under 5 tend to fall onto or touch a fire. Many adults and olderchildren suffer burns when their clothes catch alight.
• Chip pans and deep fat fryers are involved in over 400 severe injuries (requiringadmission as in-patients), ie over 1 a day. (300 of these severe injuries happen to adults,most of the accidents involving the chip pan/deep fat pan catching fire.) 59 of the severeinjuries happen to children under 5 years of age, where the child pulls the flex of a deepfat fryer or the fryer itself off the work surface, or pulls a chip pan off the cooker. Thehot oil usually causes deep dermal burns with burns to 20-40% of the total body surfacearea of a small child, requiring extensive treatment over many years as the child grows.
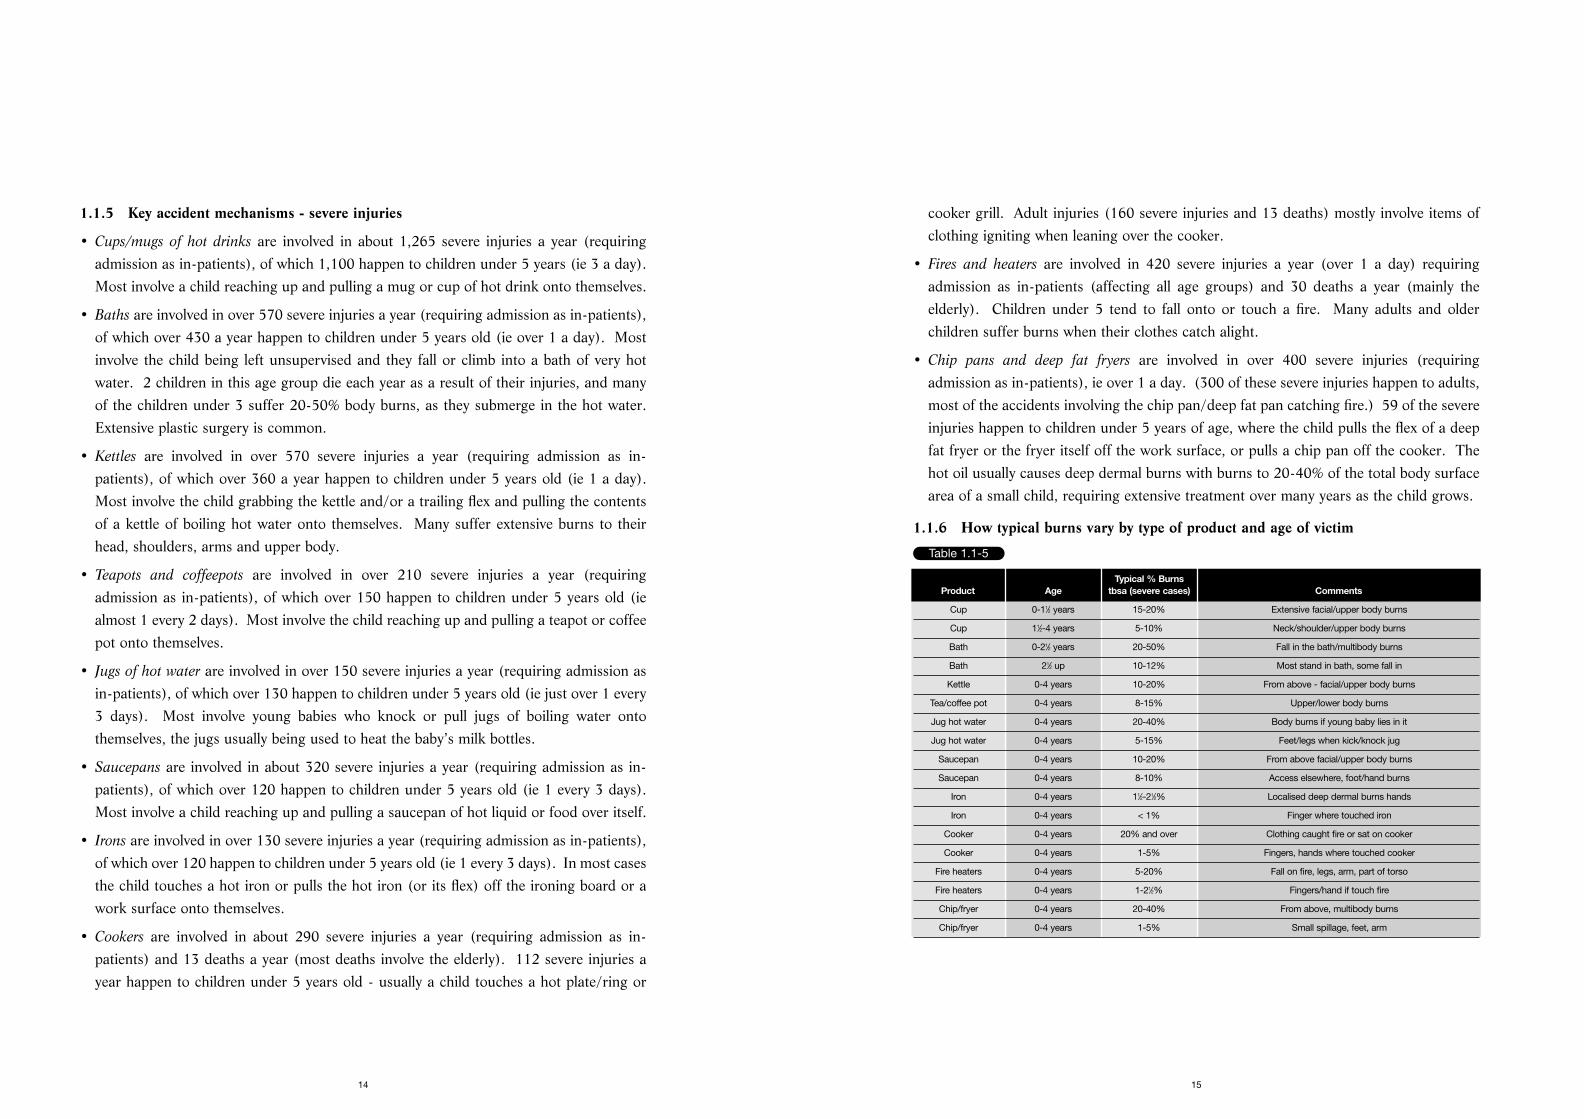
1.1.6 How typical burns vary by type of product and age of victim
15
1.1.5 Key accident mechanisms - severe injuries
• Cups/mugs of hot drinks are involved in about 1,265 severe injuries a year (requiringadmission as in-patients), of which 1,100 happen to children under 5 years (ie 3 a day).Most involve a child reaching up and pulling a mug or cup of hot drink onto themselves.
• Baths are involved in over 570 severe injuries a year (requiring admission as in-patients),of which over 430 a year happen to children under 5 years old (ie over 1 a day). Mostinvolve the child being left unsupervised and they fall or climb into a bath of very hotwater. 2 children in this age group die each year as a result of their injuries, and manyof the children under 3 suffer 20-50% body burns, as they submerge in the hot water.Extensive plastic surgery is common.
• Kettles are involved in over 570 severe injuries a year (requiring admission as in-patients), of which over 360 a year happen to children under 5 years old (ie 1 a day).Most involve the child grabbing the kettle and/or a trailing flex and pulling the contentsof a kettle of boiling hot water onto themselves. Many suffer extensive burns to theirhead, shoulders, arms and upper body.
• Teapots and coffeepots are involved in over 210 severe injuries a year (requiringadmission as in-patients), of which over 150 happen to children under 5 years old (iealmost 1 every 2 days). Most involve the child reaching up and pulling a teapot or coffeepot onto themselves.
• Jugs of hot water are involved in over 150 severe injuries a year (requiring admission asin-patients), of which over 130 happen to children under 5 years old (ie just over 1 every3 days). Most involve young babies who knock or pull jugs of boiling water ontothemselves, the jugs usually being used to heat the baby’s milk bottles.
• Saucepans are involved in about 320 severe injuries a year (requiring admission as in-patients), of which over 120 happen to children under 5 years old (ie 1 every 3 days).Most involve a child reaching up and pulling a saucepan of hot liquid or food over itself.
• Irons are involved in over 130 severe injuries a year (requiring admission as in-patients),of which over 120 happen to children under 5 years old (ie 1 every 3 days). In most casesthe child touches a hot iron or pulls the hot iron (or its flex) off the ironing board or awork surface onto themselves.
• Cookers are involved in about 290 severe injuries a year (requiring admission as in-patients) and 13 deaths a year (most deaths involve the elderly). 112 severe injuries ayear happen to children under 5 years old - usually a child touches a hot plate/ring or
14
Table 1.1-5
Typical % Burns Product Age tbsa (severe cases) Comments
Cup 0-11⁄2 years 15-20% Extensive facial/upper body burns
Cup 11⁄2-4 years 5-10% Neck/shoulder/upper body burns
Bath 0-21⁄2 years 20-50% Fall in the bath/multibody burns
Bath 21⁄2 up 10-12% Most stand in bath, some fall in
Kettle 0-4 years 10-20% From above - facial/upper body burns
Tea/coffee pot 0-4 years 8-15% Upper/lower body burns
Jug hot water 0-4 years 20-40% Body burns if young baby lies in it
Jug hot water 0-4 years 5-15% Feet/legs when kick/knock jug
Saucepan 0-4 years 10-20% From above facial/upper body burns
Saucepan 0-4 years 8-10% Access elsewhere, foot/hand burns
Iron 0-4 years 11⁄2-21⁄2% Localised deep dermal burns hands
Iron 0-4 years < 1% Finger where touched iron
Cooker 0-4 years 20% and over Clothing caught fire or sat on cooker
Cooker 0-4 years 1-5% Fingers, hands where touched cooker
Fire heaters 0-4 years 5-20% Fall on fire, legs, arm, part of torso
Fire heaters 0-4 years 1-21⁄2% Fingers/hand if touch fire
Chip/fryer 0-4 years 20-40% From above, multibody burns
Chip/fryer 0-4 years 1-5% Small spillage, feet, arm
and scalds injuries, about 50% more injuries per million population, compared to people fromhigher socio-economic backgrounds, ABC1s. Similar trends for above average numbers ofaccidents in lower socio-economic groups is also reported in the USA and Australia.
1.1.9 Key products already available which could be better promoted
There are already products on the market which can assist in preventing burns and scalds. For example:
Kitchen
• Short and/or curly flexes on kettles (as required by safety standards).
• Cordless irons and kettles.
• Lockable lids for kettles and deep fat fryers.
• Cooker guards to prevent young children from pulling pans off the cooker.
• Automatic ignitions on gas cookers.
• Safety release buttons for hot liquid containers such as kettles, teapots/coffee pots.
• Bottle warmers for babies’ bottles and food in place of jugs.
Bathroom
• Child resistant taps.
• Thermostatic controlled mixers.
• Thermometer fixed to the bath to test water temperature.
• Dual hot water systems (to deliver different temperatures to the bathroom and otheroutlets such as the kitchen sink).
• Anti scald devices which will shut off or reduce water flow when the temperature passesa pre-set maximum.
1.1.10 Opportunities for innovation and improvements in safety design
There seems to be opportunities for innovators and designers to further develop safetyfeatures in products for the mass consumer market. Examples might include:
• Stable ironing boards and a means to secure the irons and/or remove the flex out of reachof young children so that the iron cannot be pulled down.
• Coffee and teapots with heavy bases to increase stability and locking lids.
• Safety mugs with broad stable slip resistant bases or mugs with a special lid (these arecurrently used in the USA and Australia by drivers to avoid spillage).
17
The nature of the burn or scald is dependent on the severity of the burn, ie its depth, andthe area it covers. The depth is a function of i) the temperature of the hot object or liquidwhich caused the burn or scald, ii) the length of time of the exposure to the hot object orliquid, iii) the time taken before corrective actions are taken, and iv) the length of time thatcool water is applied (preferably for 30 minutes for maximum effect).
Baths cause the most serious scald injuries, particularly in children under 2 as they oftensubmerge under the water. They can suffer 50% total body surface area (tbsa) burns, withdeep dermal/full thickness burns, often requiring skin grafts.
Kettles, saucepans, teapots, jugs of hot water and hot fat spillages are the next group interms of severity, typically 10-20% tbsa burns. Skin grafts of parts of the burn/scald areaare often required because of the large volume of liquid involved and its high temperatureat or near boiling point, or higher for hot oil.
Cookers, fires and heaters cause variable injuries as there are a mixture of contact burnsinvolving 1-5% tbsa where the child touches the appliance, and 20%+ tbsa burns where thechild falls on the appliance and/or their clothing catches alight, albeit less common.
Most iron injuries appear to be less than 1% tbsa burns as a finger touches the iron,although there are also some deep burns to the hand and fingers, which can requiregrafting, further operations to release tight skin and may limit mobility in the hand.
1.1.7 Implications of medical treatment and psychological affects
The critical areas in terms of visual appearance are the face, neck, arms, hands and legs asthese cannot be hidden by clothing. Girls are considered to find it even more difficult tohandle than boys as it can mean that they feel less confident in skirts, dresses and short tops.
Victims of severe burns usually have to return to hospital on a regular basis for up to 2 yearsinitially for assessment, changes in pressure garments and physiotherapy. As the childgrows, skin graft areas tighten, and further treatment is required to release the tight skin.Puberty can bring additional problems for girls as the breasts develop, and in pregnancy theabdomen stretches (if these areas require skin grafts). The scarring of burns and scaldschanges the skin colour of the area, and this is noticeable in people with darker skins, whocan find the change in appearance to a white/pink colour particularly traumatic.
The burns' units endeavour to help patients with physical and psychological problemsthroughout their lives, although there are very few formal arrangements for psychologicalsupport in place.
1.1.8 Socio-economic trends of burns and scalds accidents
Qualitative estimates by respondents in burns units and GP surgeries suggest that peoplefrom lower socio-economic backgrounds, C2DEs, experience a higher number of burns
16
• Keep the bathroom safe.
� Fit safety devices such as childproof hot water taps, thermostatic mixing valves (TMVs)or thermostatic mixing shower valves.
� Always check the temperature of the bath water before placing a child in it.
� Never leave a child alone in the bathroom or the bath, even for a short time.
1.1.12 Safety awareness campaign
The initial findings of the research provided the Department with enough information tolaunch a safety campaign on burns and scalds in February 1998. The campaign particularlyfocused on vulnerable groups such as pre-school children and drew attention to the kitchenas a key potential hazard area.
The campaign entailed a three pronged initiative which involved:
• Distributing two million free safety advice leaflets which provided top ten safety tips andincluded first aid advice. The leaflets were made available in high street stores and GP surgeries.
• Televising a new series of safety adverts dramatising the risks faced by toddlers at homeand what parents can do to prevent accidents; and
• Magazine articles showing where hazards can occur in the home and how to deal with them.
The campaign urged all parents and carers of young children to follow these key safety tips:
• Keep handles of pots and pans turned away from the edges of cookers and work surfaces.
• Teach toddlers not to play in the kitchen or bathroom.
• Don’t leave kettle and other flexes for toddlers to reach.
• Always check the temperature of water before bathing children. When filling a bath, runthe cold tap first.
• Try and keep toddlers occupied and out of harm’s way when you are cooking.
• Always keep hot drinks out of reach of toddlers.
The campaign was supported by the Child Accident Prevention Trust, St John Ambulanceand many parts of industry.
19
1.1.11 Main safety messages for key target group - parents/carers of children under 5
Consumers need to i) recognise the danger, ii) take action to avoid the danger, iii) changetheir behaviour, to reduce or eliminate burns and scalds accidents and iv) take the correctaction to minimise the severity of the injury if burnt or scalded. The key messages foraccidents to the parents and carers of children under 5 years of age are:-
• Hot water burns like fire. A child exposed to hot water at 60°C (140°F) for 3 seconds cansustain a 3rd degree burn, an injury requiring hospitalisation and possibly a skin graft.
• If you are burnt or scalded, ACT IMMEDIATELY - a) remove clothing from theburn/scald area, b) run the burnt/scalded area under cold running water preferably for30 minutes, c) cover the burn with a dry sterile dressing or cling film, d) seek medicalattention if the scald or burn is serious. DO NOT apply creams/greases or ice.
• Keep the kitchen safe.
� Keep children safely out of the kitchen when cooking, making hot drinks or ironing,otherwise put very small children into a playpen.
� Ensure that flexes on kettles and deep fat fryers are not hanging down and that the flexis as short as is practical (use a short curly cord or a food bag tie to shorten long leads).
� Place hot cooking vessels (kettles, teapots, coffee pots, saucepans deep fat fryers, etc)well away from the reach of young children, to the back of the work surface or cooker.
� Place cups/mugs containing hot drinks such as tea and coffee in the centre of a table orat the back of the work surface.
� Do not hold a young child in your arms or on your lap when you are having or carryinga cup/mug of hot drink or when carrying a teapot or coffeepot, etc.
� Turn pan handles inwards and cook on back burners first rather than front burners.
� Ensure that the cooker is well secured and cannot topple over.
� Use a fixed cooker guard to prevent young children from pulling pans off the cooker.
� Use an electric bottle warmer rather than jugs of hot water to heat feeding bottles.
� Don’t place the baby near jugs of hot water that are heating feeding bottles.
� Iron when the children are being looked after, or secured within a playpen, or when theyare asleep.
� Remove a hot iron out of reach of children when leaving it to cool down.
18
2.1.3 Research method
A key element of this project is the careful analysis of the statistical data (based on thedetailed analysis of relevant accident data taken from the Home Accident SurveillanceSystem (HASS), the Leisure Accident Surveillance System (LASS) and the Home AccidentDeath Database (HADD) over a five year period - 1992-1996), reports gathered by theresearch team, and discussions with experts that are active in the field of burns and scaldsinjuries in the UK, USA, Australia and Norway.
In-depth face-to-face interviews were carried out for a focused analysis of serious burnsand scalds cases, the treatment and outcome of accidents with Regional Burns Units. Face-to-face interviews with GP surgeries were needed to obtain an estimate of the additionalnumber of minor injuries which were seen in the local practice and did not require hospitaltreatment, and also the nature and treatment of these injuries. These interviews alsoaddressed the key safety messages and the methods of best reaching the target audiences.They lasted 1-3 hours.
Telephone interviews were an essential method of gathering and checking information.Some of the telephone contacts consisted of short discussions (5-15 minutes) to identify,for example, if cases studies were available, usually requiring personal letters and faxes tobe sent formally requesting information. Longer interviews (30-60 minutes) were carriedout, particularly with product manufacturers/suppliers to discuss aspects of product design,and follow-up calls were also conducted, covering a wide range of issues.
An Internet search on burns and scalds was also undertaken, which yielded a high level ofinformation, particularly on the nature of burn and scald safety promotional campaigns inthe USA, Canada and Australia.
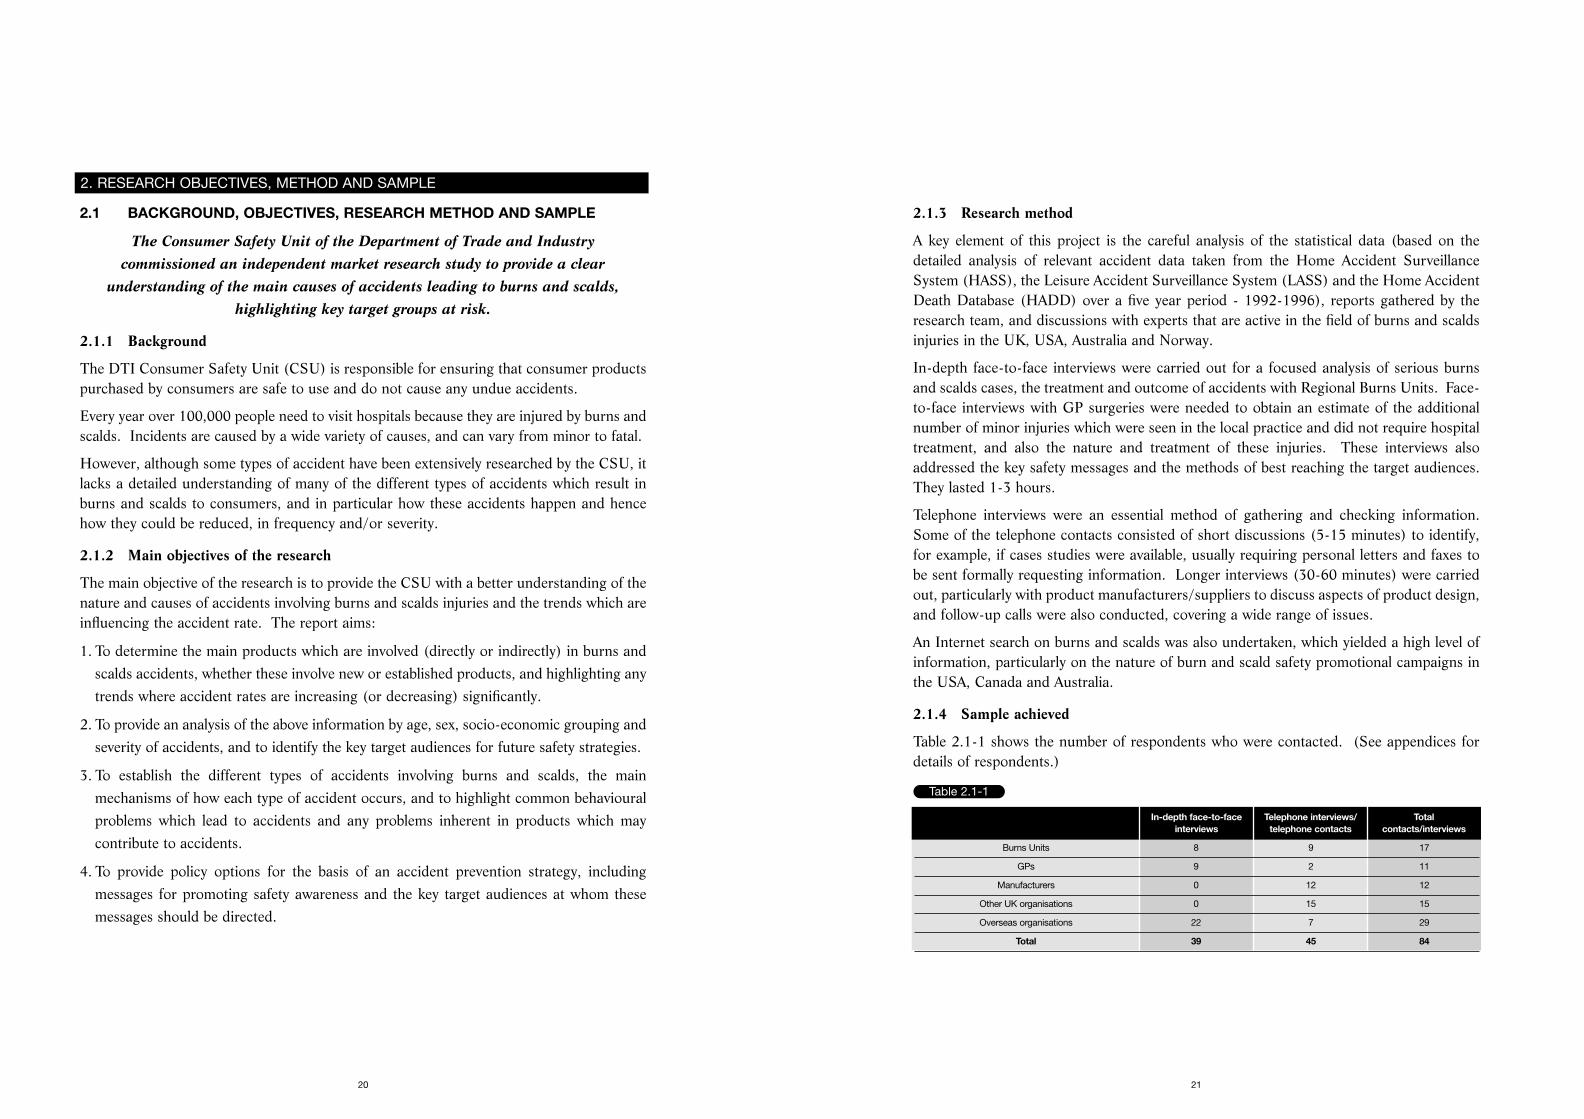
2.1.4 Sample achieved
Table 2.1-1 shows the number of respondents who were contacted. (See appendices fordetails of respondents.)
21
2.1 BACKGROUND, OBJECTIVES, RESEARCH METHOD AND SAMPLE
The Consumer Safety Unit of the Department of Trade and Industry commissioned an independent market research study to provide a clear
understanding of the main causes of accidents leading to burns and scalds,highlighting key target groups at risk.
2.1.1 Background
The DTI Consumer Safety Unit (CSU) is responsible for ensuring that consumer productspurchased by consumers are safe to use and do not cause any undue accidents.
Every year over 100,000 people need to visit hospitals because they are injured by burns andscalds. Incidents are caused by a wide variety of causes, and can vary from minor to fatal.
However, although some types of accident have been extensively researched by the CSU, itlacks a detailed understanding of many of the different types of accidents which result inburns and scalds to consumers, and in particular how these accidents happen and hencehow they could be reduced, in frequency and/or severity.
2.1.2 Main objectives of the research
The main objective of the research is to provide the CSU with a better understanding of thenature and causes of accidents involving burns and scalds injuries and the trends which areinfluencing the accident rate. The report aims:
1. To determine the main products which are involved (directly or indirectly) in burns andscalds accidents, whether these involve new or established products, and highlighting anytrends where accident rates are increasing (or decreasing) significantly.
2. To provide an analysis of the above information by age, sex, socio-economic grouping andseverity of accidents, and to identify the key target audiences for future safety strategies.
3. To establish the different types of accidents involving burns and scalds, the mainmechanisms of how each type of accident occurs, and to highlight common behaviouralproblems which lead to accidents and any problems inherent in products which maycontribute to accidents.
4. To provide policy options for the basis of an accident prevention strategy, includingmessages for promoting safety awareness and the key target audiences at whom thesemessages should be directed.
20
2. RESEARCH OBJECTIVES, METHOD AND SAMPLE
Table 2.1-1
In-depth face-to-face Telephone interviews/ Total interviews telephone contacts contacts/interviews
Burns Units 8 9 17
GPs 9 2 11
Manufacturers 0 12 12
Other UK organisations 0 15 15
Overseas organisations 22 7 29
Total 39 45 84
3.1 TOTAL MINOR, SEVERE AND FATAL INJURIES BY MAIN PRODUCT
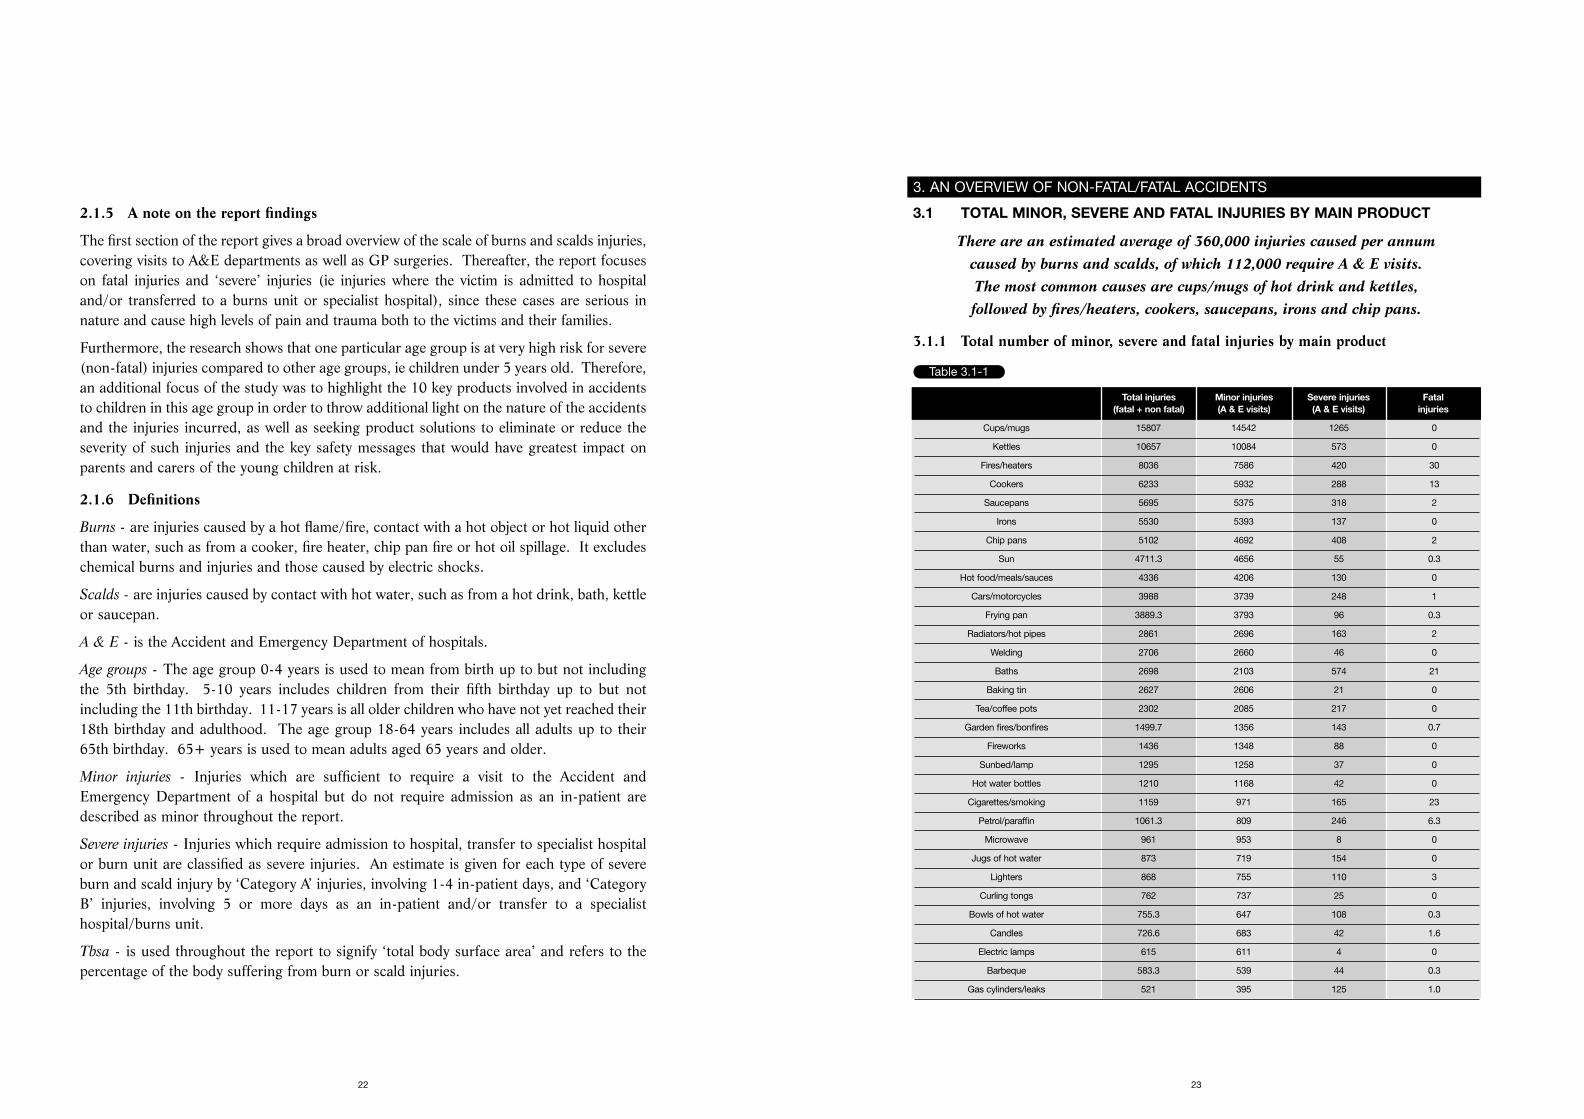
There are an estimated average of 360,000 injuries caused per annum caused by burns and scalds, of which 112,000 require A & E visits. The most common causes are cups/mugs of hot drink and kettles, followed by fires/heaters, cookers, saucepans, irons and chip pans.
3.1.1 Total number of minor, severe and fatal injuries by main product
23
2.1.5 A note on the report findings
The first section of the report gives a broad overview of the scale of burns and scalds injuries,covering visits to A&E departments as well as GP surgeries. Thereafter, the report focuseson fatal injuries and ‘severe’ injuries (ie injuries where the victim is admitted to hospitaland/or transferred to a burns unit or specialist hospital), since these cases are serious innature and cause high levels of pain and trauma both to the victims and their families.
Furthermore, the research shows that one particular age group is at very high risk for severe(non-fatal) injuries compared to other age groups, ie children under 5 years old. Therefore,an additional focus of the study was to highlight the 10 key products involved in accidentsto children in this age group in order to throw additional light on the nature of the accidentsand the injuries incurred, as well as seeking product solutions to eliminate or reduce theseverity of such injuries and the key safety messages that would have greatest impact onparents and carers of the young children at risk.
2.1.6 Definitions
Burns - are injuries caused by a hot flame/fire, contact with a hot object or hot liquid otherthan water, such as from a cooker, fire heater, chip pan fire or hot oil spillage. It excludeschemical burns and injuries and those caused by electric shocks.
Scalds - are injuries caused by contact with hot water, such as from a hot drink, bath, kettleor saucepan.
A & E - is the Accident and Emergency Department of hospitals.
Age groups - The age group 0-4 years is used to mean from birth up to but not includingthe 5th birthday. 5-10 years includes children from their fifth birthday up to but notincluding the 11th birthday. 11-17 years is all older children who have not yet reached their18th birthday and adulthood. The age group 18-64 years includes all adults up to their65th birthday. 65+ years is used to mean adults aged 65 years and older.
Minor injuries - Injuries which are sufficient to require a visit to the Accident andEmergency Department of a hospital but do not require admission as an in-patient aredescribed as minor throughout the report.
Severe injuries - Injuries which require admission to hospital, transfer to specialist hospitalor burn unit are classified as severe injuries. An estimate is given for each type of severeburn and scald injury by ‘Category A’ injuries, involving 1-4 in-patient days, and ‘CategoryB’ injuries, involving 5 or more days as an in-patient and/or transfer to a specialisthospital/burns unit.
Tbsa - is used throughout the report to signify ‘total body surface area’ and refers to thepercentage of the body suffering from burn or scald injuries.
22
3. AN OVERVIEW OF NON-FATAL/FATAL ACCIDENTS
Table 3.1-1
Total injuries Minor injuries Severe injuries Fatal(fatal + non fatal) (A & E visits) (A & E visits) injuries
Cups/mugs 15807 14542 1265 0
Kettles 10657 10084 573 0
Fires/heaters 8036 7586 420 30
Cookers 6233 5932 288 13
Saucepans 5695 5375 318 2
Irons 5530 5393 137 0
Chip pans 5102 4692 408 2
Sun 4711.3 4656 55 0.3
Hot food/meals/sauces 4336 4206 130 0
Cars/motorcycles 3988 3739 248 1
Frying pan 3889.3 3793 96 0.3
Radiators/hot pipes 2861 2696 163 2
Welding 2706 2660 46 0
Baths 2698 2103 574 21
Baking tin 2627 2606 21 0
Tea/coffee pots 2302 2085 217 0
Garden fires/bonfires 1499.7 1356 143 0.7
Fireworks 1436 1348 88 0
Sunbed/lamp 1295 1258 37 0
Hot water bottles 1210 1168 42 0
Cigarettes/smoking 1159 971 165 23
Petrol/paraffin 1061.3 809 246 6.3
Microwave 961 953 8 0
Jugs of hot water 873 719 154 0
Lighters 868 755 110 3
Curling tongs 762 737 25 0
Bowls of hot water 755.3 647 108 0.3
Candles 726.6 683 42 1.6
Electric lamps 615 611 4 0
Barbeque 583.3 539 44 0.3
Gas cylinders/leaks 521 395 125 1.0
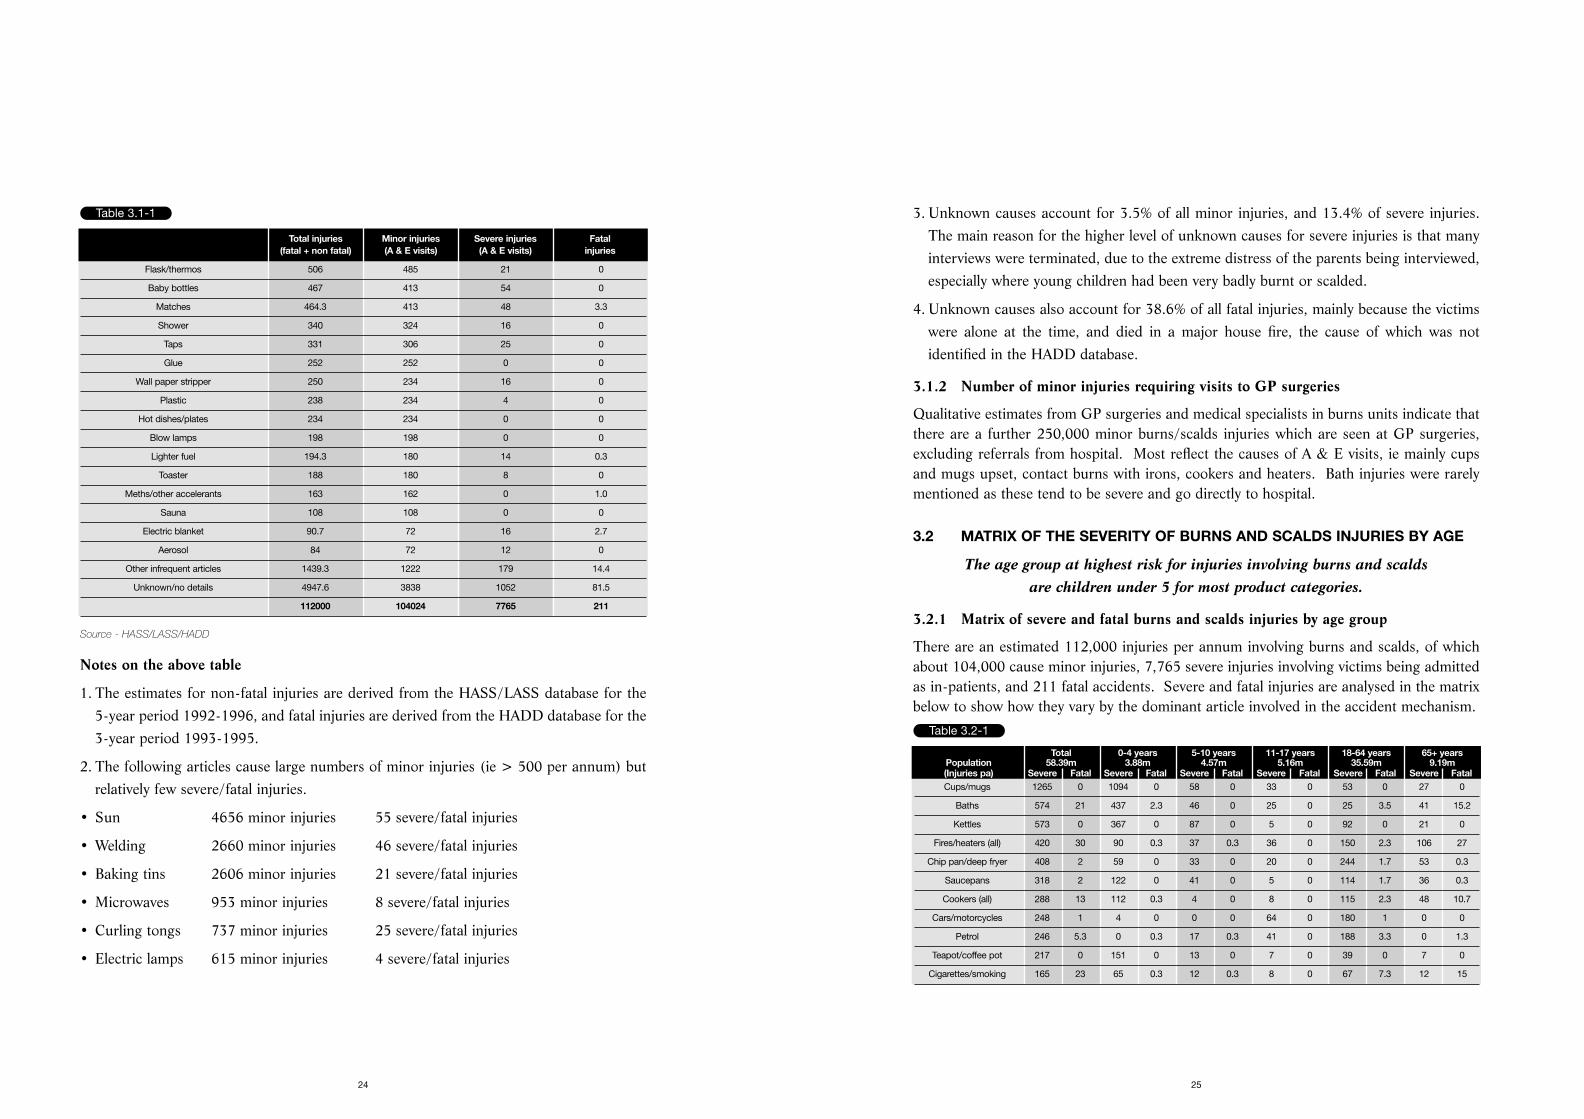
3. Unknown causes account for 3.5% of all minor injuries, and 13.4% of severe injuries.The main reason for the higher level of unknown causes for severe injuries is that manyinterviews were terminated, due to the extreme distress of the parents being interviewed,especially where young children had been very badly burnt or scalded.
4. Unknown causes also account for 38.6% of all fatal injuries, mainly because the victimswere alone at the time, and died in a major house fire, the cause of which was notidentified in the HADD database.
3.1.2 Number of minor injuries requiring visits to GP surgeries
Qualitative estimates from GP surgeries and medical specialists in burns units indicate thatthere are a further 250,000 minor burns/scalds injuries which are seen at GP surgeries,excluding referrals from hospital. Most reflect the causes of A & E visits, ie mainly cupsand mugs upset, contact burns with irons, cookers and heaters. Bath injuries were rarelymentioned as these tend to be severe and go directly to hospital.
3.2 MATRIX OF THE SEVERITY OF BURNS AND SCALDS INJURIES BY AGE
The age group at highest risk for injuries involving burns and scalds are children under 5 for most product categories.
3.2.1 Matrix of severe and fatal burns and scalds injuries by age group
There are an estimated 112,000 injuries per annum involving burns and scalds, of whichabout 104,000 cause minor injuries, 7,765 severe injuries involving victims being admittedas in-patients, and 211 fatal accidents. Severe and fatal injuries are analysed in the matrixbelow to show how they vary by the dominant article involved in the accident mechanism.
25
Source - HASS/LASS/HADD
Notes on the above table
1. The estimates for non-fatal injuries are derived from the HASS/LASS database for the5-year period 1992-1996, and fatal injuries are derived from the HADD database for the3-year period 1993-1995.
2. The following articles cause large numbers of minor injuries (ie > 500 per annum) butrelatively few severe/fatal injuries.
• Sun 4656 minor injuries 55 severe/fatal injuries
• Welding 2660 minor injuries 46 severe/fatal injuries
• Baking tins 2606 minor injuries 21 severe/fatal injuries
• Microwaves 953 minor injuries 8 severe/fatal injuries
• Curling tongs 737 minor injuries 25 severe/fatal injuries
• Electric lamps 615 minor injuries 4 severe/fatal injuries
24
Table 3.1-1
Total injuries Minor injuries Severe injuries Fatal(fatal + non fatal) (A & E visits) (A & E visits) injuries
Flask/thermos 506 485 21 0
Baby bottles 467 413 54 0
Matches 464.3 413 48 3.3
Shower 340 324 16 0
Taps 331 306 25 0
Glue 252 252 0 0
Wall paper stripper 250 234 16 0
Plastic 238 234 4 0
Hot dishes/plates 234 234 0 0
Blow lamps 198 198 0 0
Lighter fuel 194.3 180 14 0.3
Toaster 188 180 8 0
Meths/other accelerants 163 162 0 1.0
Sauna 108 108 0 0
Electric blanket 90.7 72 16 2.7
Aerosol 84 72 12 0
Other infrequent articles 1439.3 1222 179 14.4
Unknown/no details 4947.6 3838 1052 81.5
112000 104024 7765 211
Table 3.2-1
Total 0-4 years 5-10 years 11-17 years 18-64 years 65+ yearsPopulation 58.39m 3.88m 4.57m 5.16m 35.59m 9.19m(Injuries pa) Severe Fatal Severe Fatal Severe Fatal Severe Fatal Severe Fatal Severe FatalCups/mugs 1265 0 1094 0 58 0 33 0 53 0 27 0
Baths 574 21 437 2.3 46 0 25 0 25 3.5 41 15.2
Kettles 573 0 367 0 87 0 5 0 92 0 21 0
Fires/heaters (all) 420 30 90 0.3 37 0.3 36 0 150 2.3 106 27
Chip pan/deep fryer 408 2 59 0 33 0 20 0 244 1.7 53 0.3
Saucepans 318 2 122 0 41 0 5 0 114 1.7 36 0.3
Cookers (all) 288 13 112 0.3 4 0 8 0 115 2.3 48 10.7
Cars/motorcycles 248 1 4 0 0 0 64 0 180 1 0 0
Petrol 246 5.3 0 0.3 17 0.3 41 0 188 3.3 0 1.3
Teapot/coffee pot 217 0 151 0 13 0 7 0 39 0 7 0
Cigarettes/smoking 165 23 65 0.3 12 0.3 8 0 67 7.3 12 15
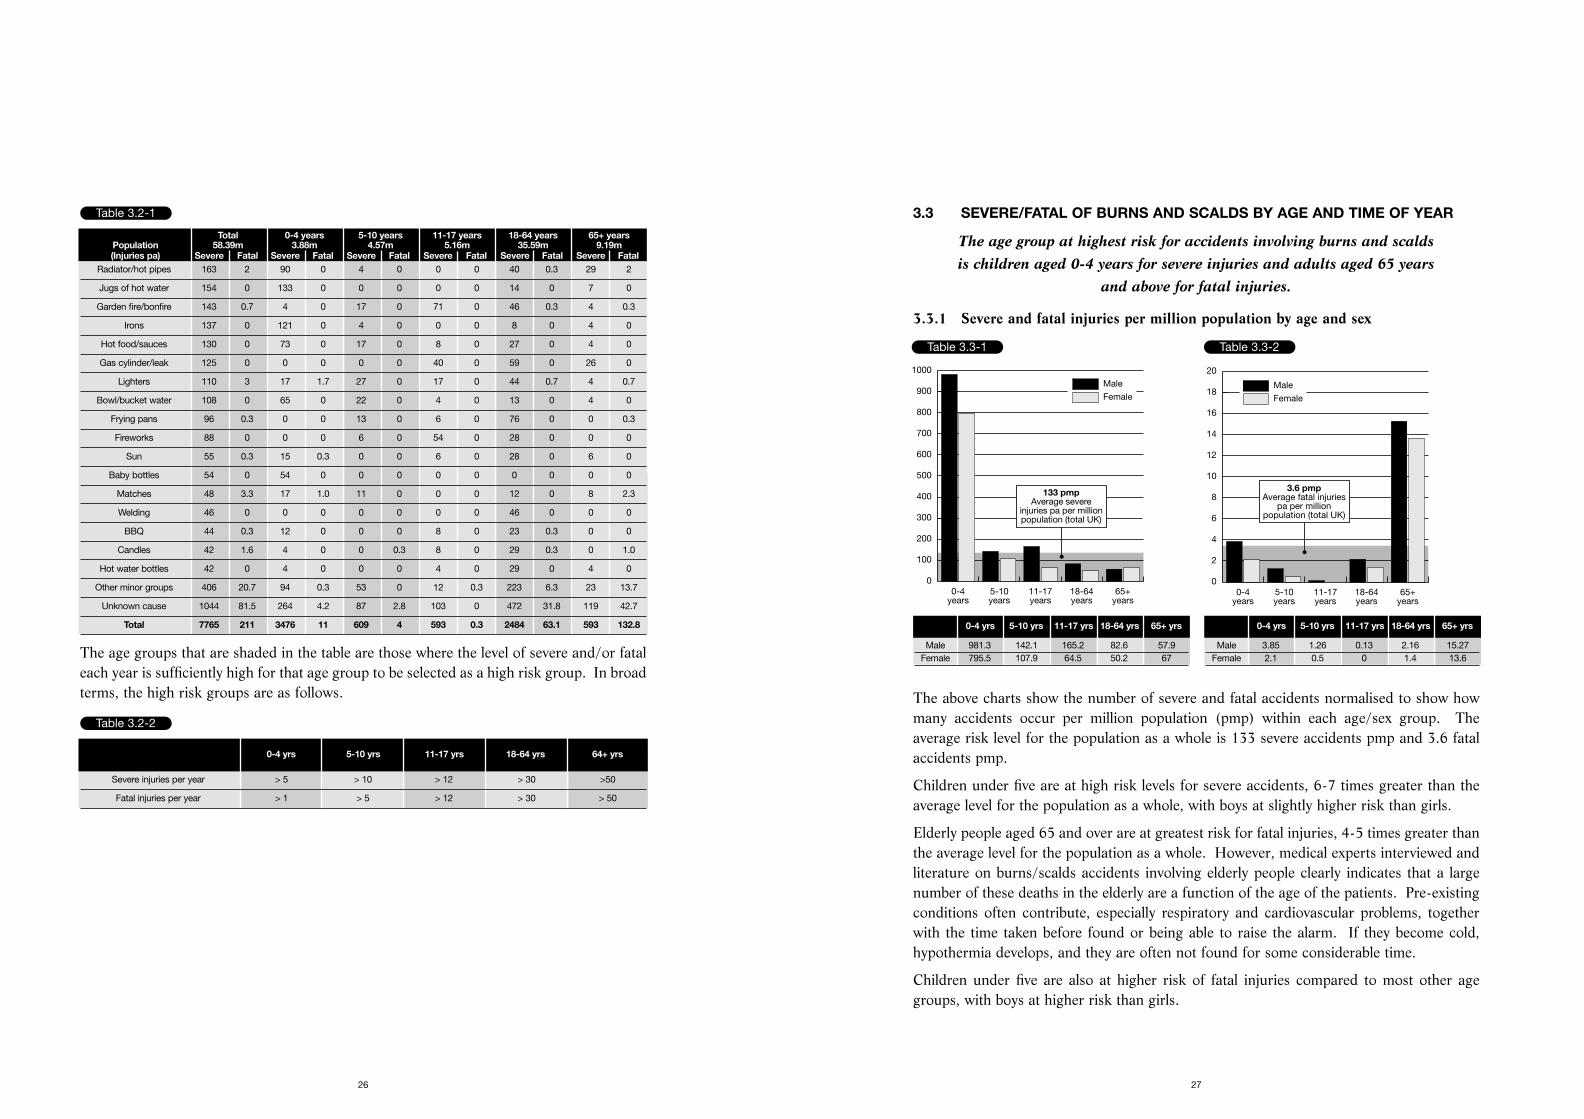
3.3 SEVERE/FATAL OF BURNS AND SCALDS BY AGE AND TIME OF YEAR
The age group at highest risk for accidents involving burns and scalds is children aged 0-4 years for severe injuries and adults aged 65 years
and above for fatal injuries.
3.3.1 Severe and fatal injuries per million population by age and sex
The above charts show the number of severe and fatal accidents normalised to show howmany accidents occur per million population (pmp) within each age/sex group. Theaverage risk level for the population as a whole is 133 severe accidents pmp and 3.6 fatalaccidents pmp.
Children under five are at high risk levels for severe accidents, 6-7 times greater than theaverage level for the population as a whole, with boys at slightly higher risk than girls.
Elderly people aged 65 and over are at greatest risk for fatal injuries, 4-5 times greater thanthe average level for the population as a whole. However, medical experts interviewed andliterature on burns/scalds accidents involving elderly people clearly indicates that a largenumber of these deaths in the elderly are a function of the age of the patients. Pre-existingconditions often contribute, especially respiratory and cardiovascular problems, togetherwith the time taken before found or being able to raise the alarm. If they become cold,hypothermia develops, and they are often not found for some considerable time.
Children under five are also at higher risk of fatal injuries compared to most other agegroups, with boys at higher risk than girls.
27
The age groups that are shaded in the table are those where the level of severe and/or fataleach year is sufficiently high for that age group to be selected as a high risk group. In broadterms, the high risk groups are as follows.
26
Table 3.2-1
Total 0-4 years 5-10 years 11-17 years 18-64 years 65+ yearsPopulation 58.39m 3.88m 4.57m 5.16m 35.59m 9.19m(Injuries pa) Severe Fatal Severe Fatal Severe Fatal Severe Fatal Severe Fatal Severe Fatal
Radiator/hot pipes 163 2 90 0 4 0 0 0 40 0.3 29 2
Jugs of hot water 154 0 133 0 0 0 0 0 14 0 7 0
Garden fire/bonfire 143 0.7 4 0 17 0 71 0 46 0.3 4 0.3
Irons 137 0 121 0 4 0 0 0 8 0 4 0
Hot food/sauces 130 0 73 0 17 0 8 0 27 0 4 0
Gas cylinder/leak 125 0 0 0 0 0 40 0 59 0 26 0
Lighters 110 3 17 1.7 27 0 17 0 44 0.7 4 0.7
Bowl/bucket water 108 0 65 0 22 0 4 0 13 0 4 0
Frying pans 96 0.3 0 0 13 0 6 0 76 0 0 0.3
Fireworks 88 0 0 0 6 0 54 0 28 0 0 0
Sun 55 0.3 15 0.3 0 0 6 0 28 0 6 0
Baby bottles 54 0 54 0 0 0 0 0 0 0 0 0
Matches 48 3.3 17 1.0 11 0 0 0 12 0 8 2.3
Welding 46 0 0 0 0 0 0 0 46 0 0 0
BBQ 44 0.3 12 0 0 0 8 0 23 0.3 0 0
Candles 42 1.6 4 0 0 0.3 8 0 29 0.3 0 1.0
Hot water bottles 42 0 4 0 0 0 4 0 29 0 4 0
Other minor groups 406 20.7 94 0.3 53 0 12 0.3 223 6.3 23 13.7
Unknown cause 1044 81.5 264 4.2 87 2.8 103 0 472 31.8 119 42.7
Total 7765 211 3476 11 609 4 593 0.3 2484 63.1 593 132.8
Table 3.2-2
0-4 yrs 5-10 yrs 11-17 yrs 18-64 yrs 64+ yrs
Severe injuries per year > 5 > 10 > 12 > 30 >50
Fatal injuries per year > 1 > 5 > 12 > 30 > 50
0-4years
5-10years
11-17years
18-64years
65+years
0
100
200
300
400
500
600
700
800
900
1000
Male
Female
133 pmpAverage severe
injuries pa per millionpopulation (total UK)
Table 3.3-1
Female
Male
0-4years
5-10years
11-17years
18-64years
65+years
0
2
4
6
8
10
12
14
16
18
20
3.6 pmpAverage fatal injuries
pa per millionpopulation (total UK)
Table 3.3-2
0-4 yrs 5-10 yrs 11-17 yrs 18-64 yrs 65+ yrs
Male 981.3 142.1 165.2 82.6 57.9Female 795.5 107.9 64.5 50.2 67
0-4 yrs 5-10 yrs 11-17 yrs 18-64 yrs 65+ yrs
Male 3.85 1.26 0.13 2.16 15.27Female 2.1 0.5 0 1.4 13.6
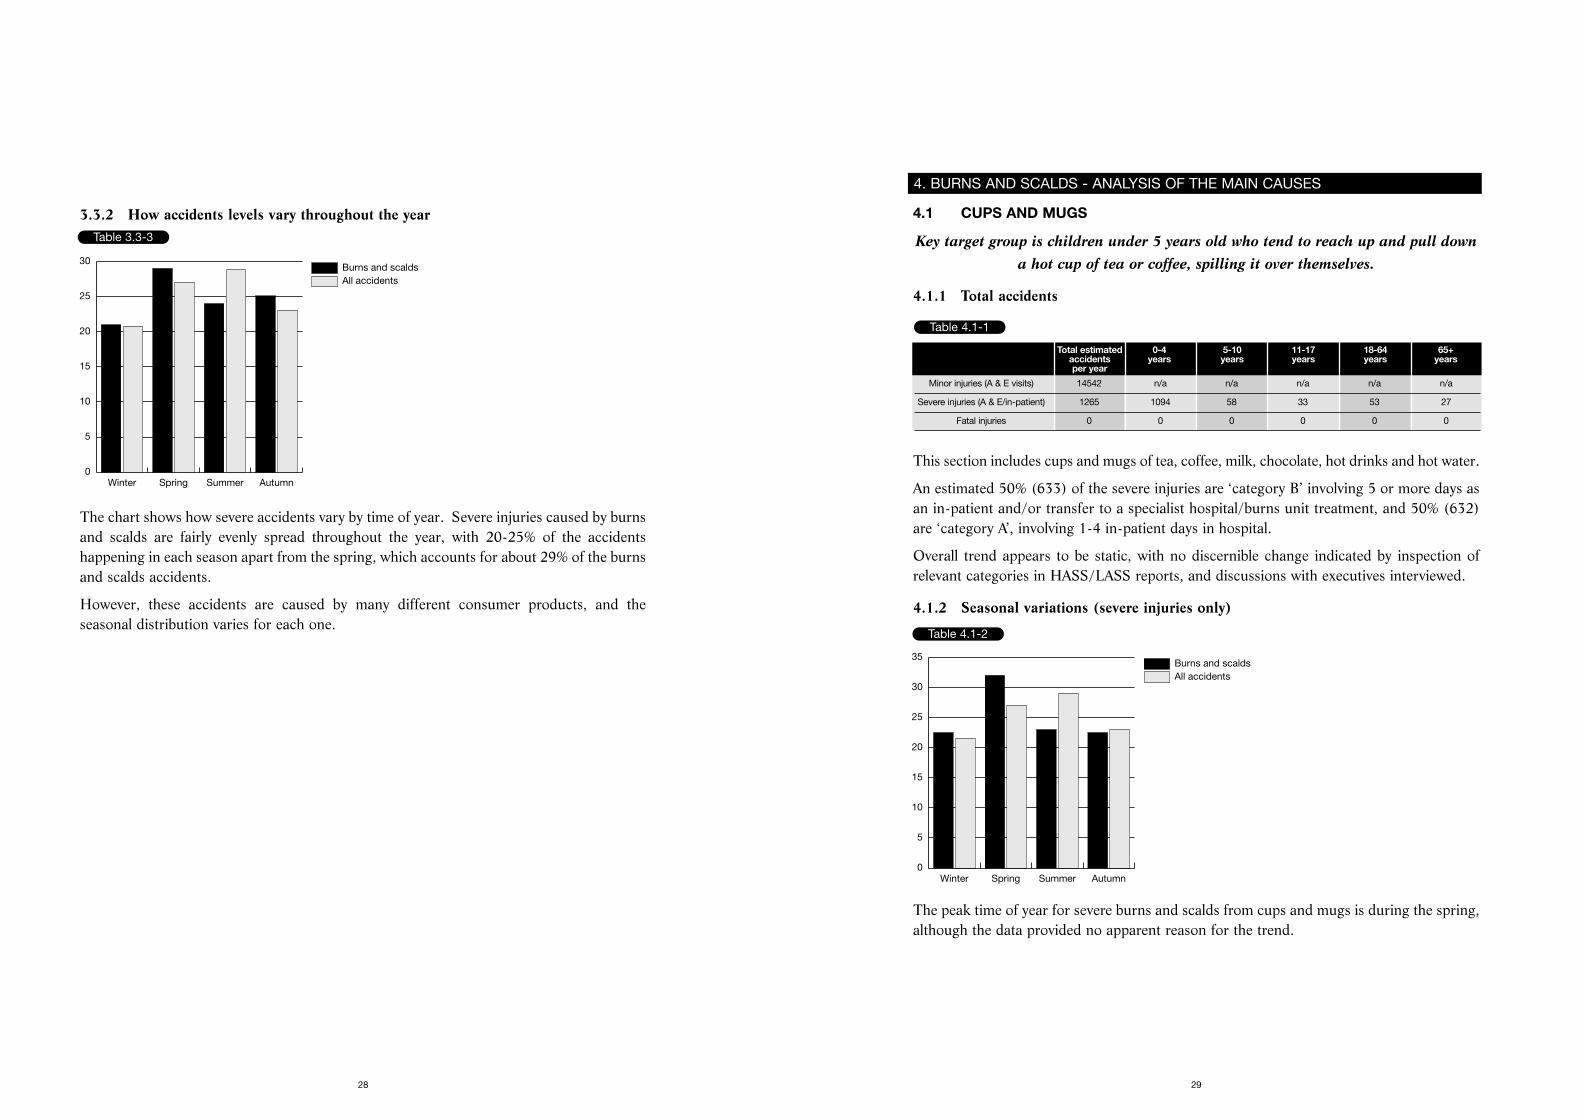
4.1 CUPS AND MUGS
Key target group is children under 5 years old who tend to reach up and pull downa hot cup of tea or coffee, spilling it over themselves.
4.1.1 Total accidents
This section includes cups and mugs of tea, coffee, milk, chocolate, hot drinks and hot water.
An estimated 50% (633) of the severe injuries are ‘category B’ involving 5 or more days asan in-patient and/or transfer to a specialist hospital/burns unit treatment, and 50% (632)are ‘category A’, involving 1-4 in-patient days in hospital.
Overall trend appears to be static, with no discernible change indicated by inspection ofrelevant categories in HASS/LASS reports, and discussions with executives interviewed.
4.1.2 Seasonal variations (severe injuries only)
The peak time of year for severe burns and scalds from cups and mugs is during the spring,although the data provided no apparent reason for the trend.
2928
3.3.2 How accidents levels vary throughout the year
The chart shows how severe accidents vary by time of year. Severe injuries caused by burnsand scalds are fairly evenly spread throughout the year, with 20-25% of the accidentshappening in each season apart from the spring, which accounts for about 29% of the burnsand scalds accidents.
However, these accidents are caused by many different consumer products, and theseasonal distribution varies for each one.
All accidentsBurns and scalds
Winter Spring Summer Autumn0
5
10
15
20
25
30
Table 3.3-3
4. BURNS AND SCALDS - ANALYSIS OF THE MAIN CAUSES
Table 4.1-1
Total estimated 0-4 5-10 11-17 18-64 65+accidents years years years years yearsper year
Minor injuries (A & E visits) 14542 n/a n/a n/a n/a n/a
Severe injuries (A & E/in-patient) 1265 1094 58 33 53 27
Fatal injuries 0 0 0 0 0 0
Table 4.1-2
All accidentsBurns and scalds
Winter Spring Summer Autumn0
5
10
15
20
25
30
35
There was little information about the location of the accident, probably due to the distressof parents and child on arrival at the accident and emergency unit. Where specified, theliving room was the main location, followed by the kitchen. Examples of typical accidentsare given below.
‘3rd September 1993. A 1 year old boy pulled a very hot cup of tea over which spilt over hischest and upper arms at 11.30 in the morning. Patient was transferred to the burns unit.’
‘17th May 1993. An 11 month old baby boy in the living room in the early evening pulleda cup of hot coffee onto his chest. He pulled it off a shelf. He was an in-patient for 7 days.’
‘Six years ago, 4 year old boy, now aged 10. His mother said - “I found it quite traumaticat the time. I was shocked to see in hospital so many children who had had similaraccidents. He was 10 months old and pulled a cup of coffee down onto himself. Myhusband had just made me a cup of coffee and put it on the highchair (empty) for me as Iwas wrapping Christmas presents. He crawled and pulled the leg of the highchair. Thecoffee fell on his arm, luckily not on his face. I know since the accident that I should haveput cold water on it. He had skin grafts at the time and another operation when he was 6,but it is now worse. The doctors told us that sometimes that can happen as the skin swellsup. It is up to him when he is older if he wants another operation. He was in hospital for2 weeks. He was dehydrated and quite poorly. He was 2 years in a pressure jacket. Hehad just started school so it has not been easy. Now he asks, “will it go altogether?”’
‘July 1997. A 2 year old boy pulled a mug of hot chocolate over himself. He suffered 131⁄2%burns to his chest, abdomen and arm. He was in the burns unit for 2 days, and then movedto the paediatric ward.’
Target group 2 - Children aged 5-10 years (58 severe injuries pa)
‘2nd June 1995. A 10 year old girl knocked a freshly made boiling Lemsip over herself inthe early evening and was referred to another hospital with burns to the lower arm.’
Target group 3 - Children aged 11-17 years (33 severe injuries pa)
‘21st September 1992. An 11 year old girl accidentally spilt a cup of Lemsip on herself at8 o’clock in the evening. She was an in-patient for 5 days.’
31
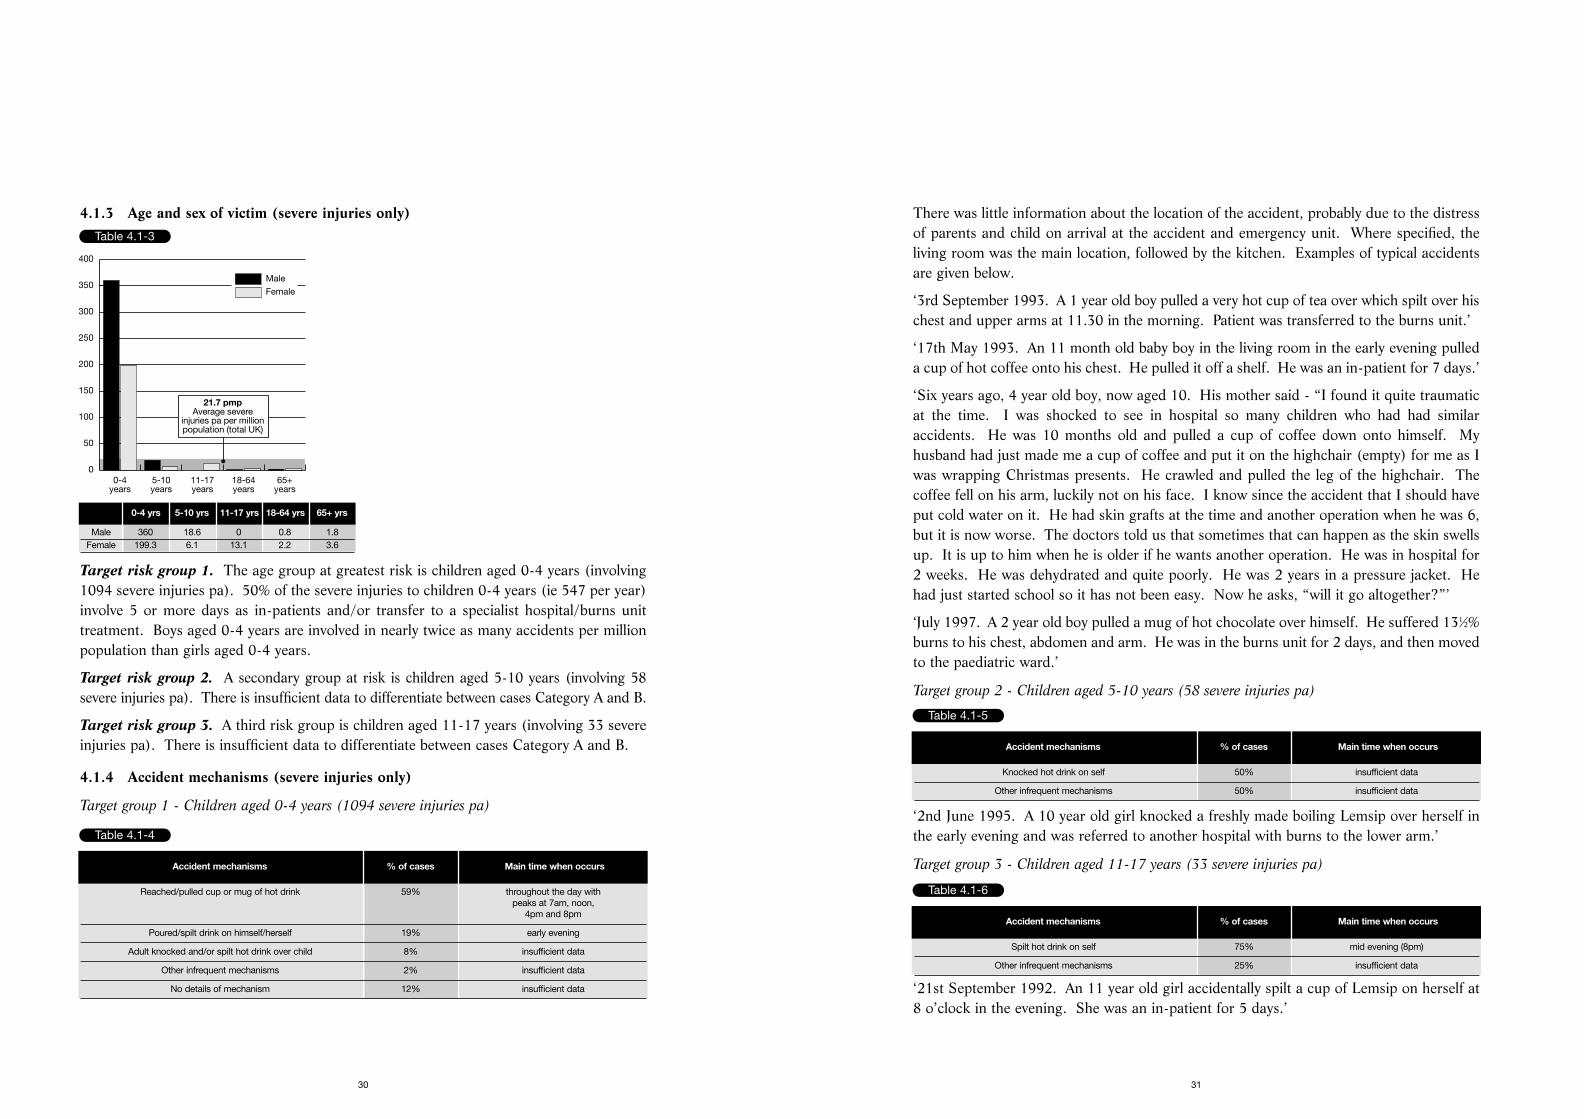
4.1.3 Age and sex of victim (severe injuries only)
Target risk group 1. The age group at greatest risk is children aged 0-4 years (involving1094 severe injuries pa). 50% of the severe injuries to children 0-4 years (ie 547 per year)involve 5 or more days as in-patients and/or transfer to a specialist hospital/burns unittreatment. Boys aged 0-4 years are involved in nearly twice as many accidents per millionpopulation than girls aged 0-4 years.
Target risk group 2. A secondary group at risk is children aged 5-10 years (involving 58severe injuries pa). There is insufficient data to differentiate between cases Category A and B.
Target risk group 3. A third risk group is children aged 11-17 years (involving 33 severeinjuries pa). There is insufficient data to differentiate between cases Category A and B.
4.1.4 Accident mechanisms (severe injuries only)
Target group 1 - Children aged 0-4 years (1094 severe injuries pa)
30
Table 4.1-3
Female
Male
0-4years
5-10years
11-17years
18-64years
65+years
0
50
100
150
200
250
300
350
400
21.7 pmpAverage severe
injuries pa per millionpopulation (total UK)
0-4 yrs 5-10 yrs 11-17 yrs 18-64 yrs 65+ yrs
Male 360 18.6 0 0.8 1.8Female 199.3 6.1 13.1 2.2 3.6
Table 4.1-4
Accident mechanisms % of cases Main time when occurs
Reached/pulled cup or mug of hot drink 59% throughout the day withpeaks at 7am, noon,
4pm and 8pm
Poured/spilt drink on himself/herself 19% early evening
Adult knocked and/or spilt hot drink over child 8% insufficient data
Other infrequent mechanisms 2% insufficient data
No details of mechanism 12% insufficient data
Table 4.1-5
Accident mechanisms % of cases Main time when occurs
Knocked hot drink on self 50% insufficient data
Other infrequent mechanisms 50% insufficient data
Table 4.1-6
Accident mechanisms % of cases Main time when occurs
Spilt hot drink on self 75% mid evening (8pm)
Other infrequent mechanisms 25% insufficient data
4.1.6 Product design ideas emerging from the research
1. Lid similar to that used on takeaway hot drinks with small opening for drinking withoutremoving the lid. This is one potentially effective method of keeping hot liquid in a cupif it is upset, providing it is a firm fit.
2. Experts believe that broad based slip resistant mugs are less likely to tip over than a cupwhich has a small base.
3. Heat indicators are available in terms of adapting the technology used in heat reactivemugs as a positive indicator of the heat of the liquid in the mug, changing as the liquidcools. This would be effective in reminding parents to be careful.
4. Warning sticker on cup when purchased to advise consumer of the danger of scalds. Onemanufacturer said that they put a warning on the packaging for heat reactive mugs thatthese products are not suitable for children under 5 years of age. This is because theywere considered particularly attractive to children and need to contain hot liquid toactivate the heat reaction.
4.1.7 Key safety messages
Target audience 1 - children aged 0-5 years
Primary message:-
• Place cups and mugs containing hot drinks such as tea and coffee in the centre of a tableor at the back of the work surface.
Remember young children can reach places that are considered out of harm’s way.
• Do not hold a young child in your arms or on your lap when you are having or carryinga hot drink.
The child may turn suddenly, knocking the cup out of your hands and be scalded. You cannot
hold both safely.
Secondary messages:-
• Do not use a tablecloth when the children are young.
Small children can easily pull a tablecloth, upsetting anything, such as hot drinks, on it.
• Put the child in a playpen, before you have a cup of coffee.
33
4.1.5 Nature of typical burns and implications of required medical treatment
Cup and mug scalds are often caused by the cup being pulled or knocked down from a levelhigher than the child. Injuries can vary from a splash burn on the chin and neck to extensivescalds on the face, shoulders, chest and arms, often with 10-15% mixed level burns,depending on the temperature of the liquid and how quickly the clothes are pulled off thepatient. (Adult cup and mug scald injuries tend to be on the genital area as the cup is restedor held in the lap of the adult.)
The table below shows how the typical average percentage burns on the total body surfacearea caused by a cup/mug scald varies by age of the child under 2 years.
Source: medical respondents. literature.
Minor - these include patients seen by the practice nurse of a GP practice or by the A & Eunit. The burn is assessed, covered with a clean Flamazin dressing, and the patient returnsseveral times to the nurse or outpatients clinic to ensure that the wound is not infected andto change the dressings.
Severe/very severe - On admission as an in-patient, the child is monitored for 48 hours toreview the wound. If the burn is superficial, the patient is often released and treated as anoutpatient. If the burns are healing well, the patient is usually in hospital for up to 5 days.
If the burn is partial thickness or deeper, the injury may require a skin graft, and 5-10%deep dermal burns in relatively small areas often require grafting. If one skin graftoperation is required, 11 in-patient days is typical, followed by visits to the burns unit fortreatment every other day initially then twice a week for up to a month. If the burns arefully healed at that stage, the patient is then fitted with pressure garments which are wornfor 12-18 months or until the burn area has fully settled down. Every 3-4 months, newpressure garments are made, taking into account the growth of the child. The patient isseen by the occupational therapist for 3 months, then visits the treatment unit every 3-6months to monitor progress. The child may need further operations to release the skinwhich has grown tight, following a skin graft, until adulthood.
In addition to the physical damage caused by burns, victims may also suffer emotional andpsychological problems which can last a lifetime.
32
Table 4.1-7
Accident mechanisms % of cases Main time when occurs
0-18 months 15-20% face, neck, shoulder, chest and arms
18 months - 4 years 5-10% face, neck, shoulder, chest and arms
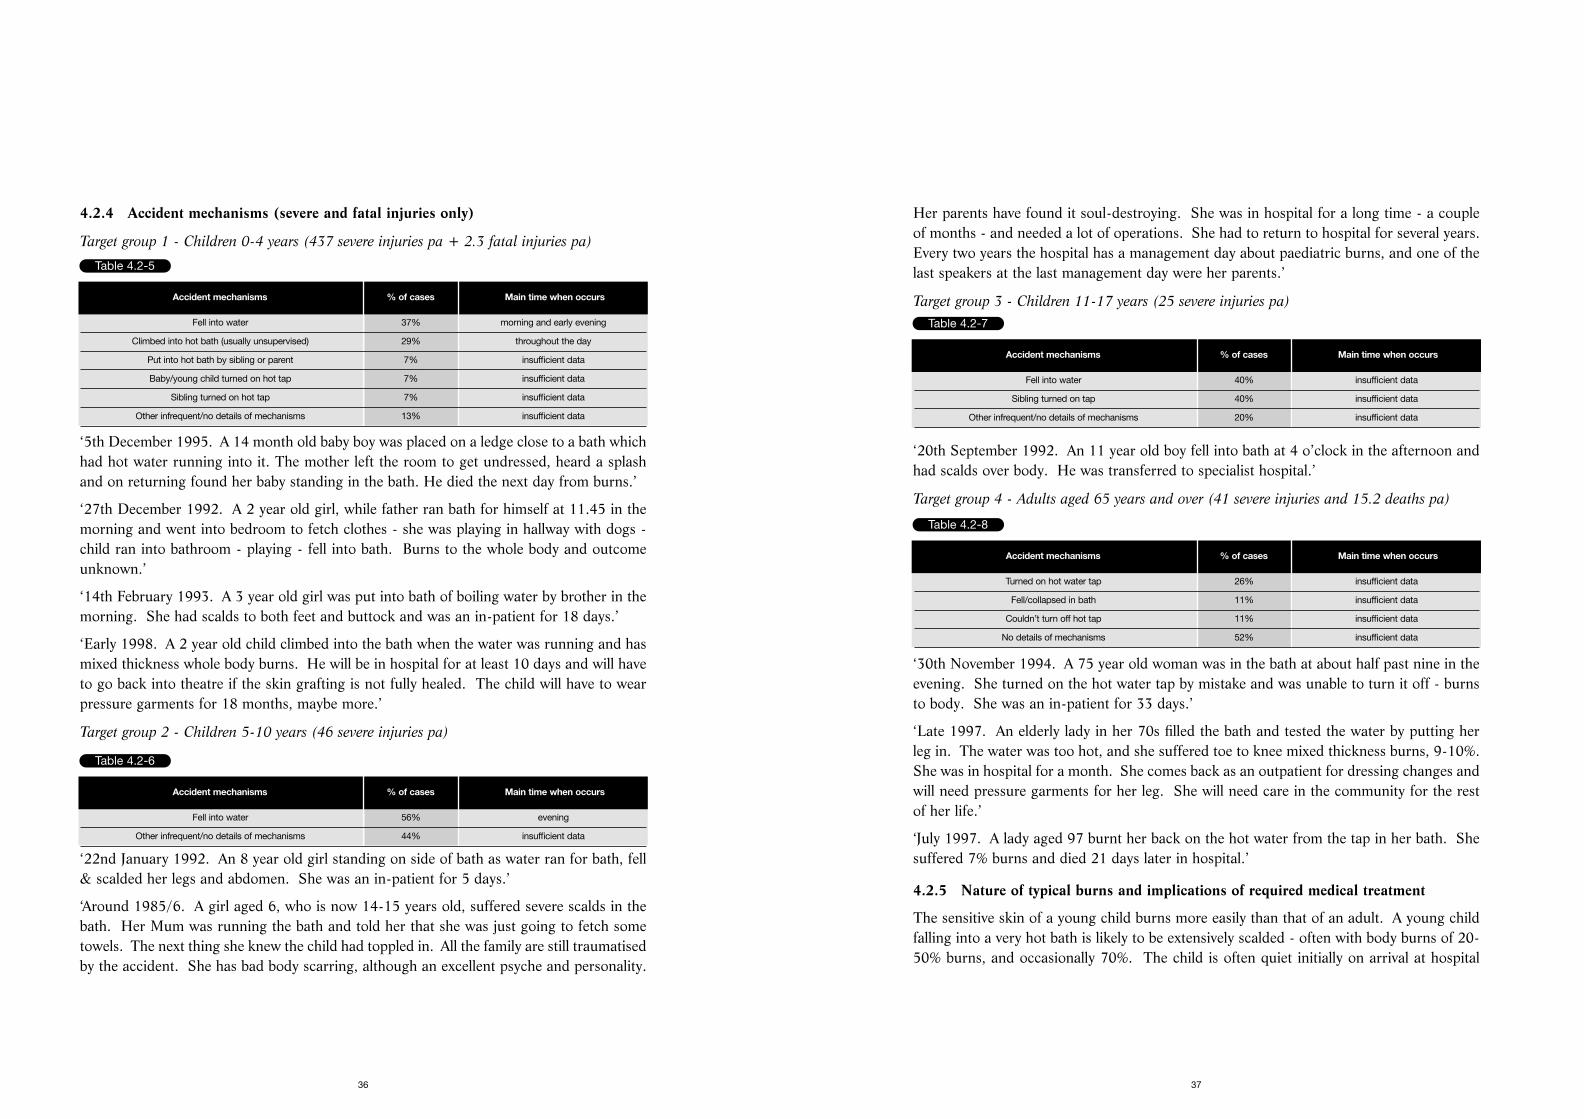
4.2.3 Age and sex of victim (severe and fatal injuries only)
Target risk group 1. The age group at greatest risk is children aged 0-4 years (involving437 severe injuries and 2.3 deaths per year). 67% of the severe injuries to children aged 0-4 years ( ie 249 per year) involve 5 or more days as in-patients and/or transfer to aspecialist hospital/burns unit. Boys aged 0-4 are involved in 1.2 times more accidents permillion population than girls aged 0-4 years.
Target risk group 2. A secondary group at risk is children aged 5-10 years (involving 46severe injuries per year). 33% of the severe injuries to children aged 5-10 years (ie 15 peryear) involve 5 or more days as in-patients and/or transfer to a specialist hospital/burns unit.
Target risk group 3. A third group at risk is children aged 11-17 years (involving 25 severeinjuries per year). There are insufficient cases to differentiate between Category A and B injuries.
Target risk group 4. A fourth group at risk are the elderly, aged 65 years and over(involving 41 severe injuries and 15.2 deaths per year). 75% of the severe injuries amongthe elderly (ie 31 per year) involve 5 or more days as in-patients and/or transfer to aspecialist hospital/burns unit.
35
4.2 BATHS
All children, particularly those under 5 years old, are target groups. The elderly are also a target group.
4.2.1 Total accidents
An estimated 59% (339) of the severe injuries are ‘category B’ involving 5 or more days asan in-patient and/or transfer to a specialist hospital/burns unit treatment, and 41% (235)are ‘category A’, involving 1-4 in-patient days in hospital.
Overall trend appears to be static, with no discernible change indicated by inspection ofrelevant categories in HASS/LASS reports, and discussions with executives interviewed.
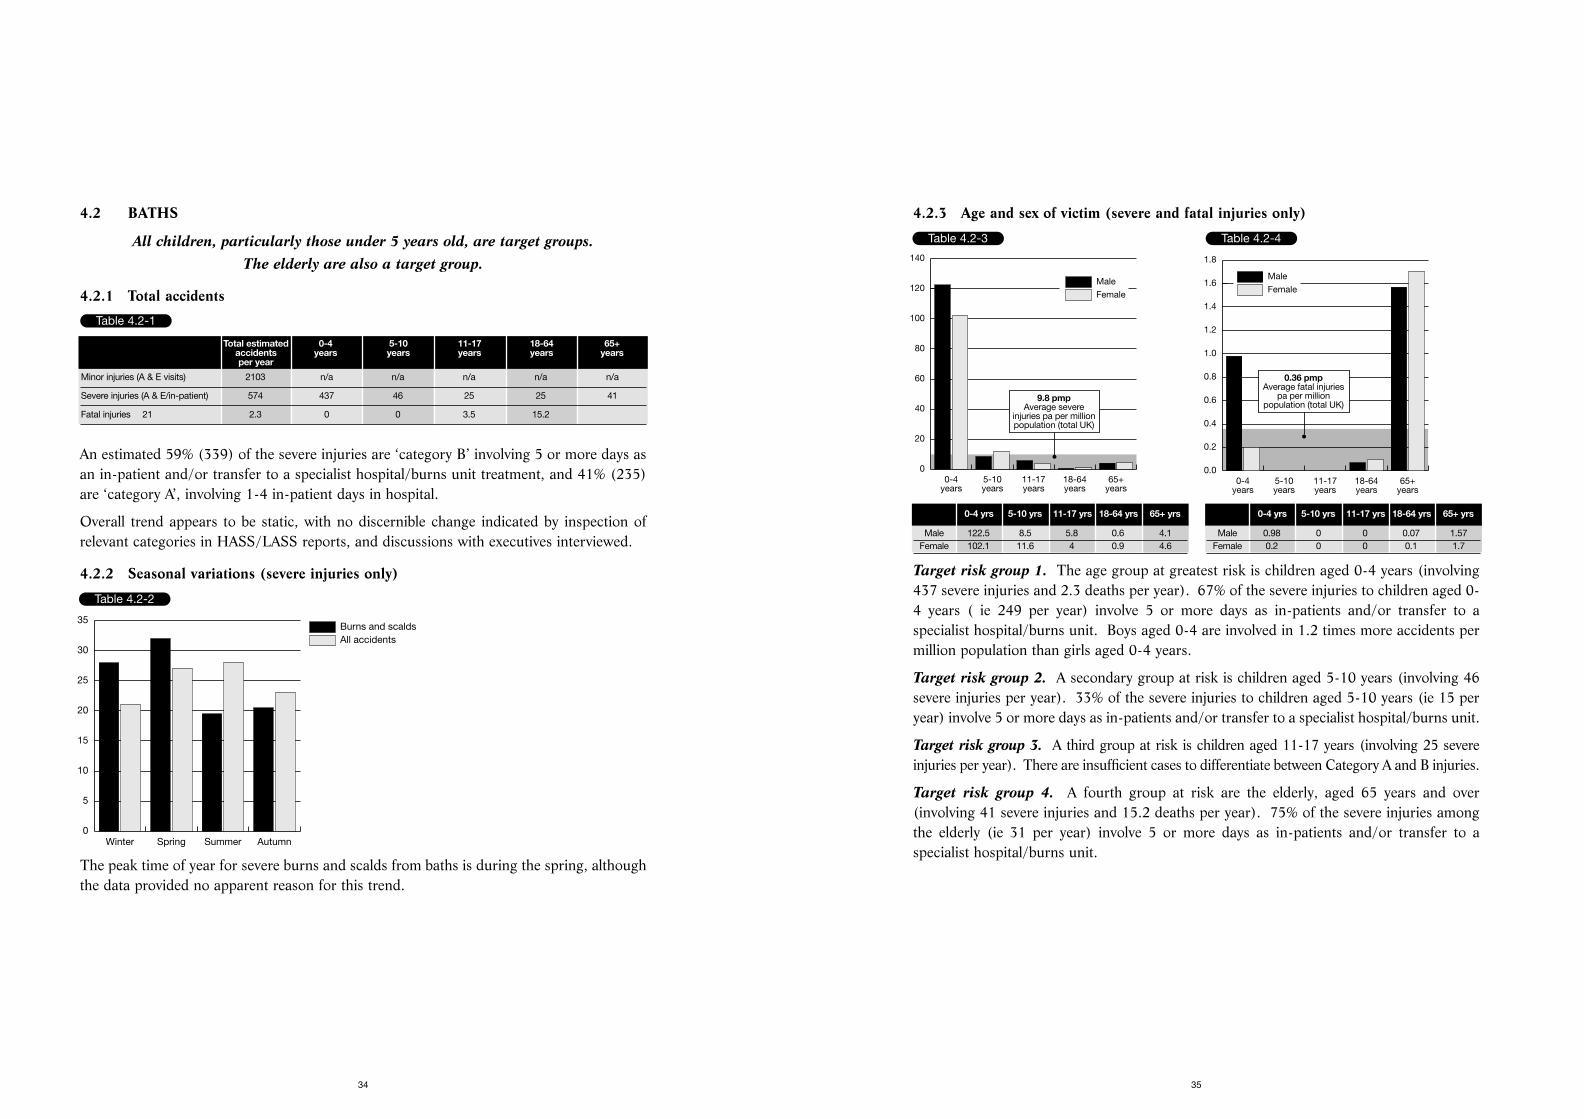
4.2.2 Seasonal variations (severe injuries only)
The peak time of year for severe burns and scalds from baths is during the spring, althoughthe data provided no apparent reason for this trend.
34
Table 4.2-1
Total estimated 0-4 5-10 11-17 18-64 65+accidents years years years years yearsper year
Minor injuries (A & E visits) 2103 n/a n/a n/a n/a n/a
Severe injuries (A & E/in-patient) 574 437 46 25 25 41
Fatal injuries 21 2.3 0 0 3.5 15.2
Table 4.2-2
All accidentsBurns and scalds
Winter Spring Summer Autumn0
5
10
15
20
25
30
35
Table 4.2-3
Female
Male
0-4years
5-10years
11-17years
18-64years
65+years
0
20
40
60
80
100
120
140
9.8 pmpAverage severe
injuries pa per millionpopulation (total UK)
0-4 yrs 5-10 yrs 11-17 yrs 18-64 yrs 65+ yrs
Male 122.5 8.5 5.8 0.6 4.1Female 102.1 11.6 4 0.9 4.6
Table 4.2-4
Female
Male
0-4years
5-10years
11-17years
18-64years
65+years
0.0
0.2
0.4
0.6
0.8
1.0
1.2
1.4
1.6
1.8
0.36 pmpAverage fatal injuries
pa per millionpopulation (total UK)
0-4 yrs 5-10 yrs 11-17 yrs 18-64 yrs 65+ yrs
Male 0.98 0 0 0.07 1.57Female 0.2 0 0 0.1 1.7
Her parents have found it soul-destroying. She was in hospital for a long time - a coupleof months - and needed a lot of operations. She had to return to hospital for several years.Every two years the hospital has a management day about paediatric burns, and one of thelast speakers at the last management day were her parents.’
Target group 3 - Children 11-17 years (25 severe injuries pa)
‘20th September 1992. An 11 year old boy fell into bath at 4 o’clock in the afternoon andhad scalds over body. He was transferred to specialist hospital.’
Target group 4 - Adults aged 65 years and over (41 severe injuries and 15.2 deaths pa)
‘30th November 1994. A 75 year old woman was in the bath at about half past nine in theevening. She turned on the hot water tap by mistake and was unable to turn it off - burnsto body. She was an in-patient for 33 days.’
‘Late 1997. An elderly lady in her 70s filled the bath and tested the water by putting herleg in. The water was too hot, and she suffered toe to knee mixed thickness burns, 9-10%.She was in hospital for a month. She comes back as an outpatient for dressing changes andwill need pressure garments for her leg. She will need care in the community for the restof her life.’
‘July 1997. A lady aged 97 burnt her back on the hot water from the tap in her bath. Shesuffered 7% burns and died 21 days later in hospital.’
4.2.5 Nature of typical burns and implications of required medical treatment
The sensitive skin of a young child burns more easily than that of an adult. A young childfalling into a very hot bath is likely to be extensively scalded - often with body burns of 20-50% burns, and occasionally 70%. The child is often quiet initially on arrival at hospital
37
4.2.4 Accident mechanisms (severe and fatal injuries only)
Target group 1 - Children 0-4 years (437 severe injuries pa + 2.3 fatal injuries pa)
‘5th December 1995. A 14 month old baby boy was placed on a ledge close to a bath whichhad hot water running into it. The mother left the room to get undressed, heard a splashand on returning found her baby standing in the bath. He died the next day from burns.’
‘27th December 1992. A 2 year old girl, while father ran bath for himself at 11.45 in themorning and went into bedroom to fetch clothes - she was playing in hallway with dogs -child ran into bathroom - playing - fell into bath. Burns to the whole body and outcomeunknown.’
‘14th February 1993. A 3 year old girl was put into bath of boiling water by brother in themorning. She had scalds to both feet and buttock and was an in-patient for 18 days.’
‘Early 1998. A 2 year old child climbed into the bath when the water was running and hasmixed thickness whole body burns. He will be in hospital for at least 10 days and will haveto go back into theatre if the skin grafting is not fully healed. The child will have to wearpressure garments for 18 months, maybe more.’
Target group 2 - Children 5-10 years (46 severe injuries pa)
‘22nd January 1992. An 8 year old girl standing on side of bath as water ran for bath, fell& scalded her legs and abdomen. She was an in-patient for 5 days.’
‘Around 1985/6. A girl aged 6, who is now 14-15 years old, suffered severe scalds in thebath. Her Mum was running the bath and told her that she was just going to fetch sometowels. The next thing she knew the child had toppled in. All the family are still traumatisedby the accident. She has bad body scarring, although an excellent psyche and personality.
36
Table 4.2-5
Accident mechanisms % of cases Main time when occurs
Fell into water 37% morning and early evening
Climbed into hot bath (usually unsupervised) 29% throughout the day
Put into hot bath by sibling or parent 7% insufficient data
Baby/young child turned on hot tap 7% insufficient data
Sibling turned on hot tap 7% insufficient data
Other infrequent/no details of mechanisms 13% insufficient data
Table 4.2-6
Accident mechanisms % of cases Main time when occurs
Fell into water 56% evening
Other infrequent/no details of mechanisms 44% insufficient data
Table 4.2-7
Accident mechanisms % of cases Main time when occurs
Fell into water 40% insufficient data
Sibling turned on tap 40% insufficient data
Other infrequent/no details of mechanisms 20% insufficient data
Table 4.2-8
Accident mechanisms % of cases Main time when occurs
Turned on hot water tap 26% insufficient data
Fell/collapsed in bath 11% insufficient data
Couldn’t turn off hot tap 11% insufficient data
No details of mechanisms 52% insufficient data
the desired temperature at the water outlet. TMVs can also be installed in specific partsof the house, eg the bathroom, rather than throughout. This method is mainly effectivein new houses, due to the cost and difficulties of installation with existing plumbing.Showers installed within the past 6-7 years have either dedicated pipework fitted or athermostat valve so that the water does not go hotter when someone uses water elsewherein the house, for example when flushing the lavatory. Contact a member of a professionalbody, such as The Institute of Plumbing for further advice.
2. Liquid crystal display (LCD) thermometer, fixed to the bath, would float in the water andindicate the temperature of the water. Colour gradation, such as orange to red as itbecomes too hot, could be used as a visual guide.
3. Child proof taps, fitted to the bath, which can inhibit small children from turning on thehot water tap.
4.2.7 Key safety messages
Target audience 1 - children aged 0-4 and 5-10 years
Primary message:-
• Ensure that the temperature of the hot water delivered to the bath is below 50ºC.
This gives a 5 minute margin before full thickness burns can develop in a child. The
temperature of hot water in the home can be checked by means of an LCD thermometer,
which changes colour and is similar to strip thermometers used to check human temperature.
• Never leave a child alone in the bathroom or the bath, even for a short time.
Take the child with you. Older children can turn the hot water on by themselves, scalding
themselves or other child. If the telephone rings, take the child also whilst answering the
phone or let it ring. Bring clothing and towels into the bathroom beforehand.
• Fit childproof hot water taps.
• Always check the temperature of the bath before placing the child in it.
Secondary messages:-
• Run the bath with cold water first then the hot.
• Place non slip mats, strips or other non slip designs in the bath to prevent the child slipping.
39
due to the severity of the burns, which destroy the nerve endings in full thickness burns,and the parents are usually very distressed.
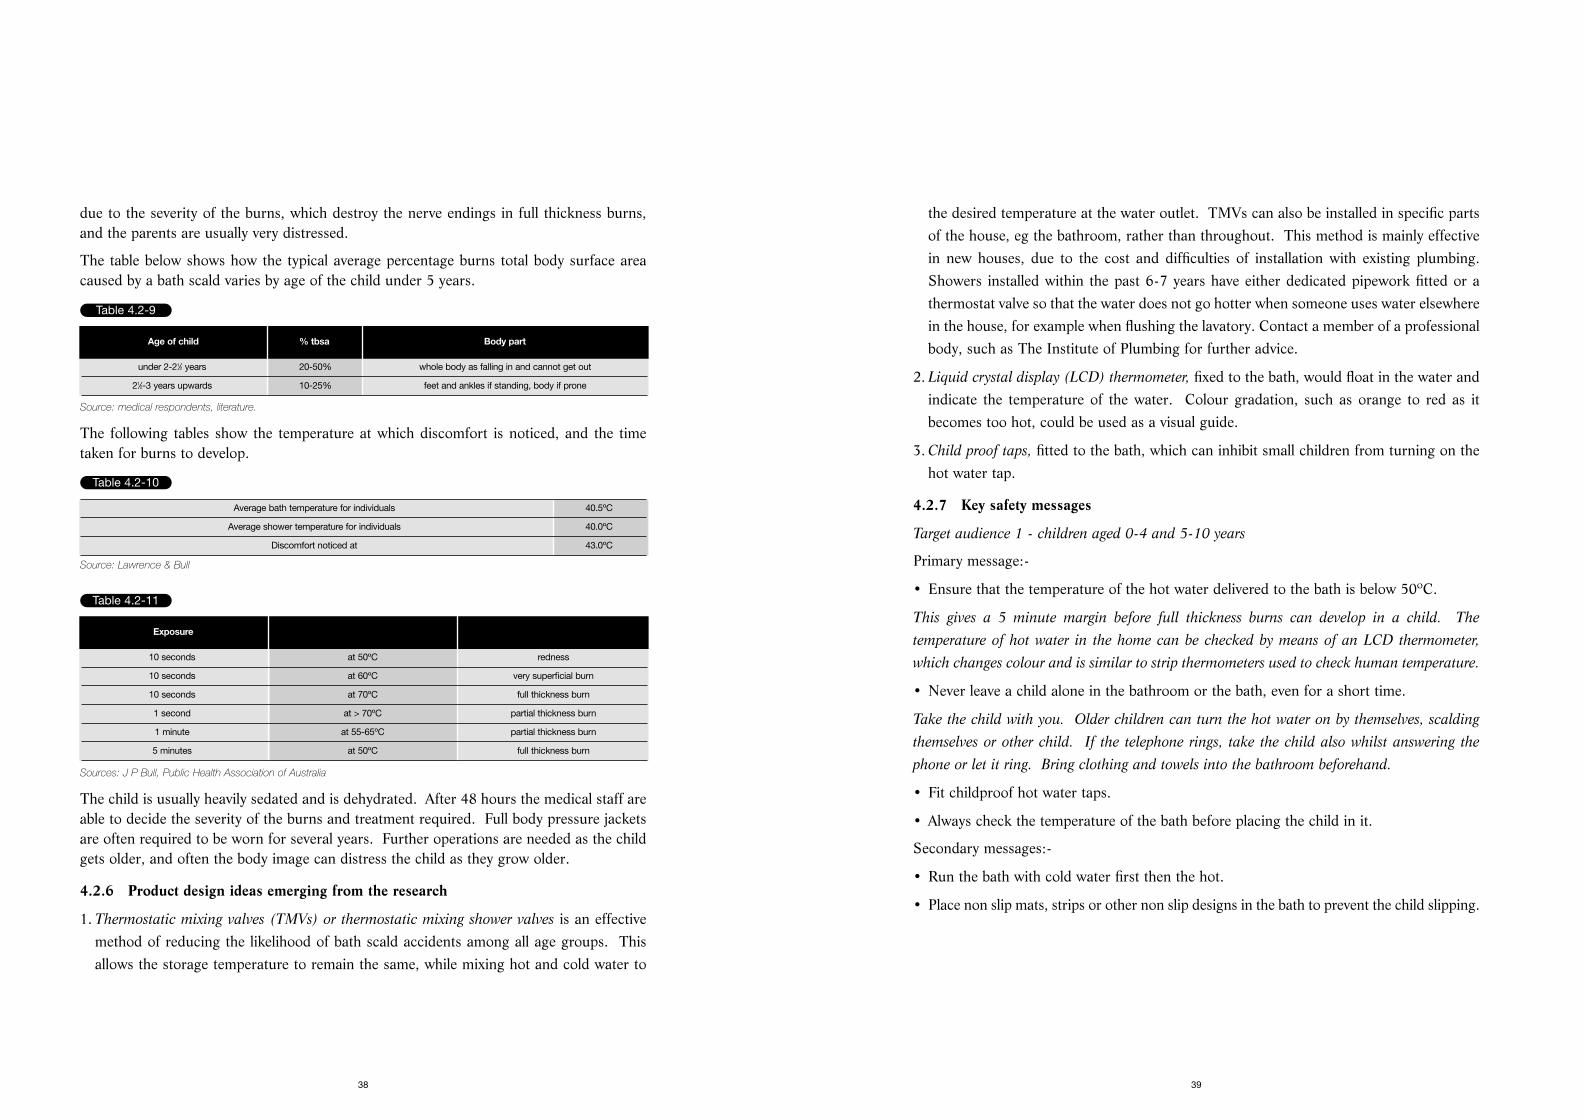
The table below shows how the typical average percentage burns total body surface areacaused by a bath scald varies by age of the child under 5 years.
Source: medical respondents, literature.
The following tables show the temperature at which discomfort is noticed, and the timetaken for burns to develop.
Source: Lawrence & Bull
Sources: J P Bull, Public Health Association of Australia
The child is usually heavily sedated and is dehydrated. After 48 hours the medical staff areable to decide the severity of the burns and treatment required. Full body pressure jacketsare often required to be worn for several years. Further operations are needed as the childgets older, and often the body image can distress the child as they grow older.
4.2.6 Product design ideas emerging from the research
1. Thermostatic mixing valves (TMVs) or thermostatic mixing shower valves is an effectivemethod of reducing the likelihood of bath scald accidents among all age groups. Thisallows the storage temperature to remain the same, while mixing hot and cold water to
38
Table 4.2-9
Age of child % tbsa Body part
under 2-21⁄2 years 20-50% whole body as falling in and cannot get out
21⁄2-3 years upwards 10-25% feet and ankles if standing, body if prone
Table 4.2-11
Exposure
10 seconds at 50ºC redness
10 seconds at 60ºC very superficial burn
10 seconds at 70ºC full thickness burn
1 second at > 70ºC partial thickness burn
1 minute at 55-65ºC partial thickness burn
5 minutes at 50ºC full thickness burn
Table 4.2-10
Average bath temperature for individuals 40.5ºC
Average shower temperature for individuals 40.0ºC
Discomfort noticed at 43.0ºC

4.3 KETTLES
Key target group is children under 5 years old. Children aged 5-10 years is asecondary target group. A third target group is adults aged 18-64 years.
4.3.1 Total accidents
An estimated 58% (333) of the severe injuries are ‘category B’ involving 5 or more days asan in-patient and/or transfer to a specialist hospital/burns unit treatment, and 42% (240)are ‘category A’, involving 1-4 in-patient days in hospital.
Overall trend appears to be static, with no discernible change indicated by inspection ofrelevant categories in HASS/LASS reports, and discussions with executives interviewed.
4.3.2 Seasonal variations (severe injuries only)
The peak time of year for severe burns and scalds caused by kettles is during the autumn,followed by winter months, possibly reflecting the greater number of hot drinks being prepared,with young children (the age group at greatest risk) being indoors rather than outdoors.
41
Target audience 2 - the elderly aged 65 years and over
Primary message:-
• Ensure that the temperature of the hot water delivered to the bath is below 50ºC by fittinga thermostatic mixing valve or thermostatic mixing shower valve.
This gives a 5 minute margin before full thickness burns can develop. The temperature of hot
water in the home can be checked by means of an LCD thermometer, which changes colour
and are similar to strip thermometers used to check human temperature.
Secondary messages:-
• Mark cold and hot taps clearly.
• Run the bath with cold water first then the hot.
• If possible, bathe when help is available.
• Fit taps which are designed to be easier for the elderly or infirm to operate.
• Install grab rails to support the elderly climbing in and out of the bath to prevent falls.
• Place non slip mats, strips or other non slip designs in the bath to prevent the adult slipping.
40
Table 4.3-1
Total estimated 0-4 5-10 11-17 18-64 65+accidents years years years years yearsper year
Minor injuries (A & E visits) 10,084 n/a n/a n/a n/a n/a
Severe injuries (A & E/in-patient) 573 367 87 5 92 21
Fatal injuries 0 0 0 0 0 0
Table 4.3-2
All accidentsBurns and scalds
Winter Spring Summer Autumn0
5
10
15
20
25
30
35
4.3.4 Accident mechanisms (severe injuries only)
Target group 1 - Children aged 0-4 years (367 severe injuries pa)
Nearly all accidents occur in the kitchen. Examples of typical accidents are given below.
‘23rd June 1996, during the afternoon between 12.00 and 15.59, a 10 month old baby girlwas in the kitchen, when she pulled a boiling kettle onto herself. She received multiplescalds and spent 54 days in hospital.’
‘20th September 1993, at 10.00 in the morning, a 3 year old girl spilled boiling water fromkettle over herself. She received severe scalds covering 24% of body. She was transferredimmediately to a specialist hospital.’
‘27th July 1992, at about 7.00 am - a 10 month old baby boy pulled the flex from a kettle of boilingwater, which went on abdomen and legs. He was an in-patient at the hospital for 38 days.’
‘1991. Kettle scald to boy when 4 years old, now aged 10. Mother - “He was playing in thelounge with his father and elder brother. He was running, trying to escape from them andran into the kitchen where I was. He fell against the kitchen wall. As he did so, he loopedhis arm round the kettle flex and pulled the kettle down on top of him. The kettle had justboiled. Luckily my husband was there, otherwise I would have been in a such a panic. Wewere living in a terraced house at the time, and the bathroom was right next to the kitchen.My husband carried him to the bathroom and ripped off his clothes. The skin was justsliding off with the clothes. We called an ambulance, and they wrapped him in cling film.
He stayed in hospital for 3 weeks. The consultant treating him thought it would traumatisehim further if he was moved to the regional burns unit. He was unrecognisable at first.They pumped liquids into him, and he went a terrible shape. Although the nurses anddoctors told us that that was normal and he would be OK, you just don’t believe them.Luckily he didn’t need plastic surgery as, although he had quite a high percentage of burns,they were not in jointed areas. The scarring is quite minimal considering how bad it was.The kettle had a straight wire. We got a curled one straightaway after that. Not that it was
43
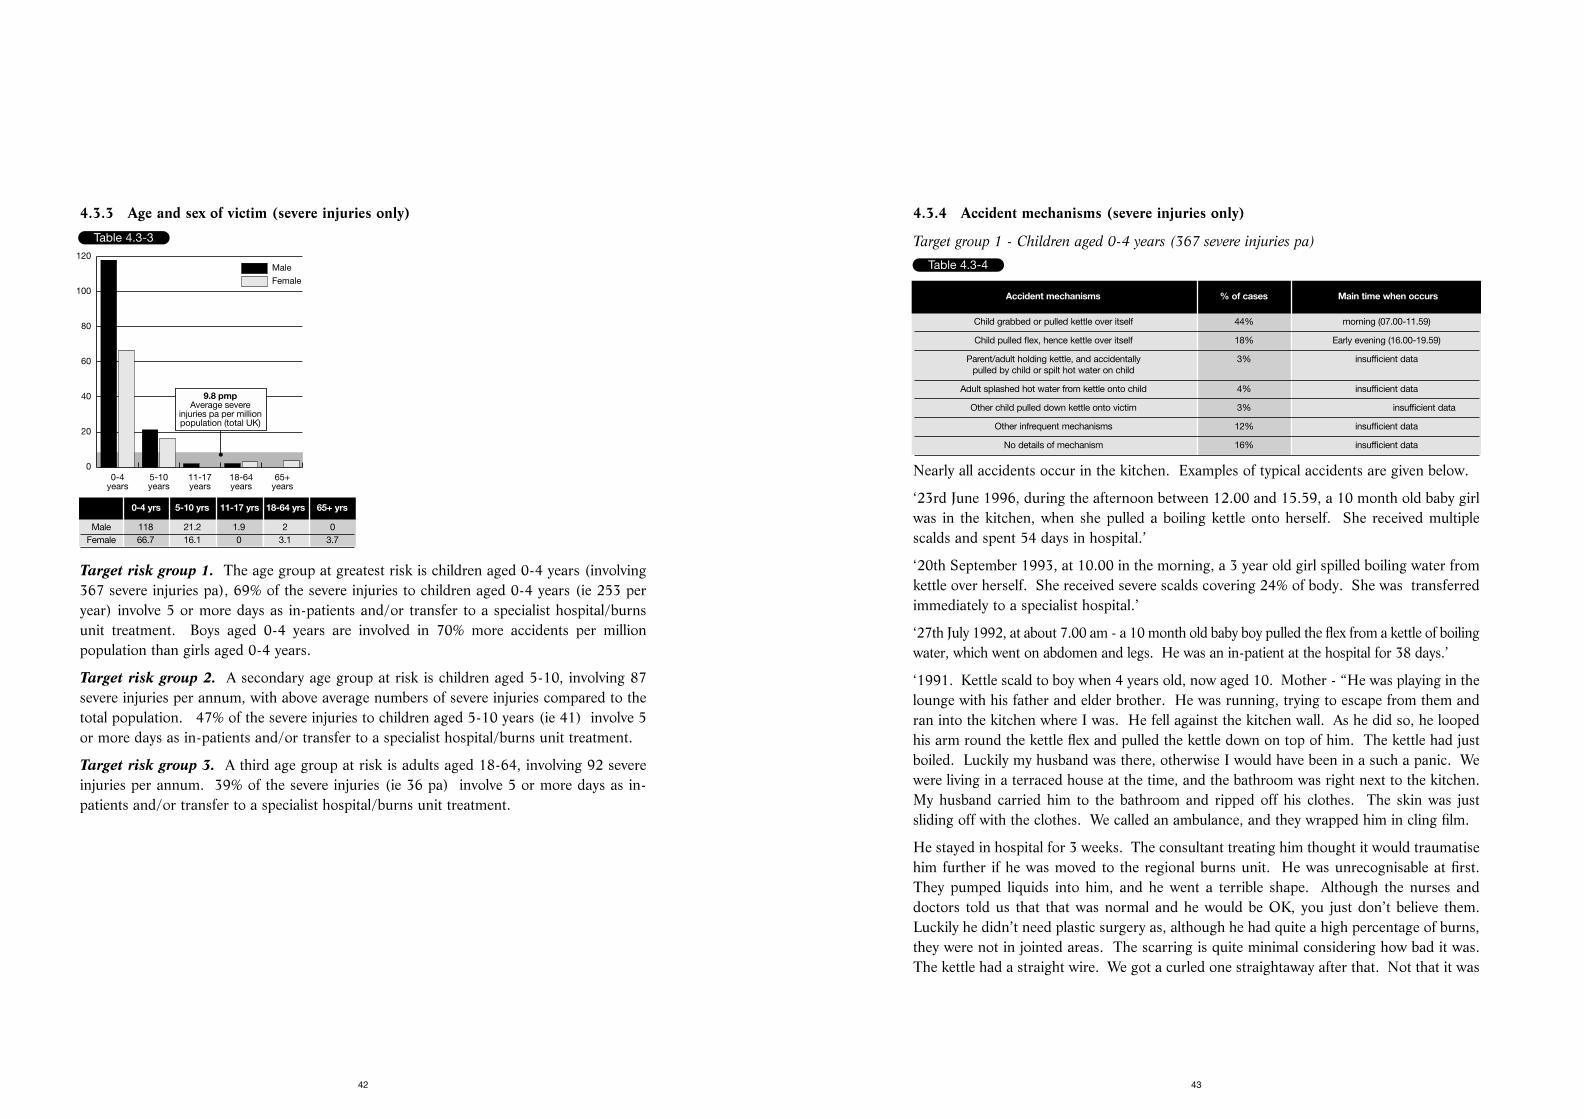
4.3.3 Age and sex of victim (severe injuries only)
Target risk group 1. The age group at greatest risk is children aged 0-4 years (involving367 severe injuries pa), 69% of the severe injuries to children aged 0-4 years (ie 253 peryear) involve 5 or more days as in-patients and/or transfer to a specialist hospital/burnsunit treatment. Boys aged 0-4 years are involved in 70% more accidents per millionpopulation than girls aged 0-4 years.
Target risk group 2. A secondary age group at risk is children aged 5-10, involving 87severe injuries per annum, with above average numbers of severe injuries compared to thetotal population. 47% of the severe injuries to children aged 5-10 years (ie 41) involve 5or more days as in-patients and/or transfer to a specialist hospital/burns unit treatment.
Target risk group 3. A third age group at risk is adults aged 18-64, involving 92 severeinjuries per annum. 39% of the severe injuries (ie 36 pa) involve 5 or more days as in-patients and/or transfer to a specialist hospital/burns unit treatment.
42
Table 4.3-3
Female
Male
0-4years
5-10years
11-17years
18-64years
65+years
0
20
40
60
80
100
120
9.8 pmpAverage severe
injuries pa per millionpopulation (total UK)
0-4 yrs 5-10 yrs 11-17 yrs 18-64 yrs 65+ yrs
Male 118 21.2 1.9 2 0Female 66.7 16.1 0 3.1 3.7
Table 4.3-4
Accident mechanisms % of cases Main time when occurs
Child grabbed or pulled kettle over itself 44% morning (07.00-11.59)
Child pulled flex, hence kettle over itself 18% Early evening (16.00-19.59)
Parent/adult holding kettle, and accidentally 3% insufficient datapulled by child or spilt hot water on child
Adult splashed hot water from kettle onto child 4% insufficient data
Other child pulled down kettle onto victim 3% insufficient data
Other infrequent mechanisms 12% insufficient data
No details of mechanism 16% insufficient data
the air and went over patient. Mother had warned him before about standing on board.Went directly to treatment area. He was an in-patient for 2 days.’
Target group 3 - adults aged 18-64 years (92 severe injuries pa)
Nearly all accidents occur in the kitchen. Example of typical accidents is given below.
‘4th August 1993, at 08.30 in the morning, a 34 year old male was in the kitchen boiling akettle. He had changed his uncorded kettle recently to a corded one, and as he went to pourout the hot water, the resistance caused by cord made the hot water spill over his forearm.He received minor burns to his forearm, and was an in-patient for 1 day before beingdischarged and referred to the out-patient department for further treatment.’
‘31st May 1993, at 21.15 in the evening, a 50 year female was in the kitchen making a cupof tea. She was about to pour the boiling water from the kettle into the teapot, when shethought someone was knocking at the window. She turned round and missed the teapot,and the boiling water went over her hand.’
‘29th December 1996, a 62 year old female, was in the kitchen boiling a kettle to make acup of tea. She took a seizure while holding kettle at the time, and spilled boiling waterdown her legs. She suffered burns to her upper legs, and spent 15 days in hospital as anin-patient.’
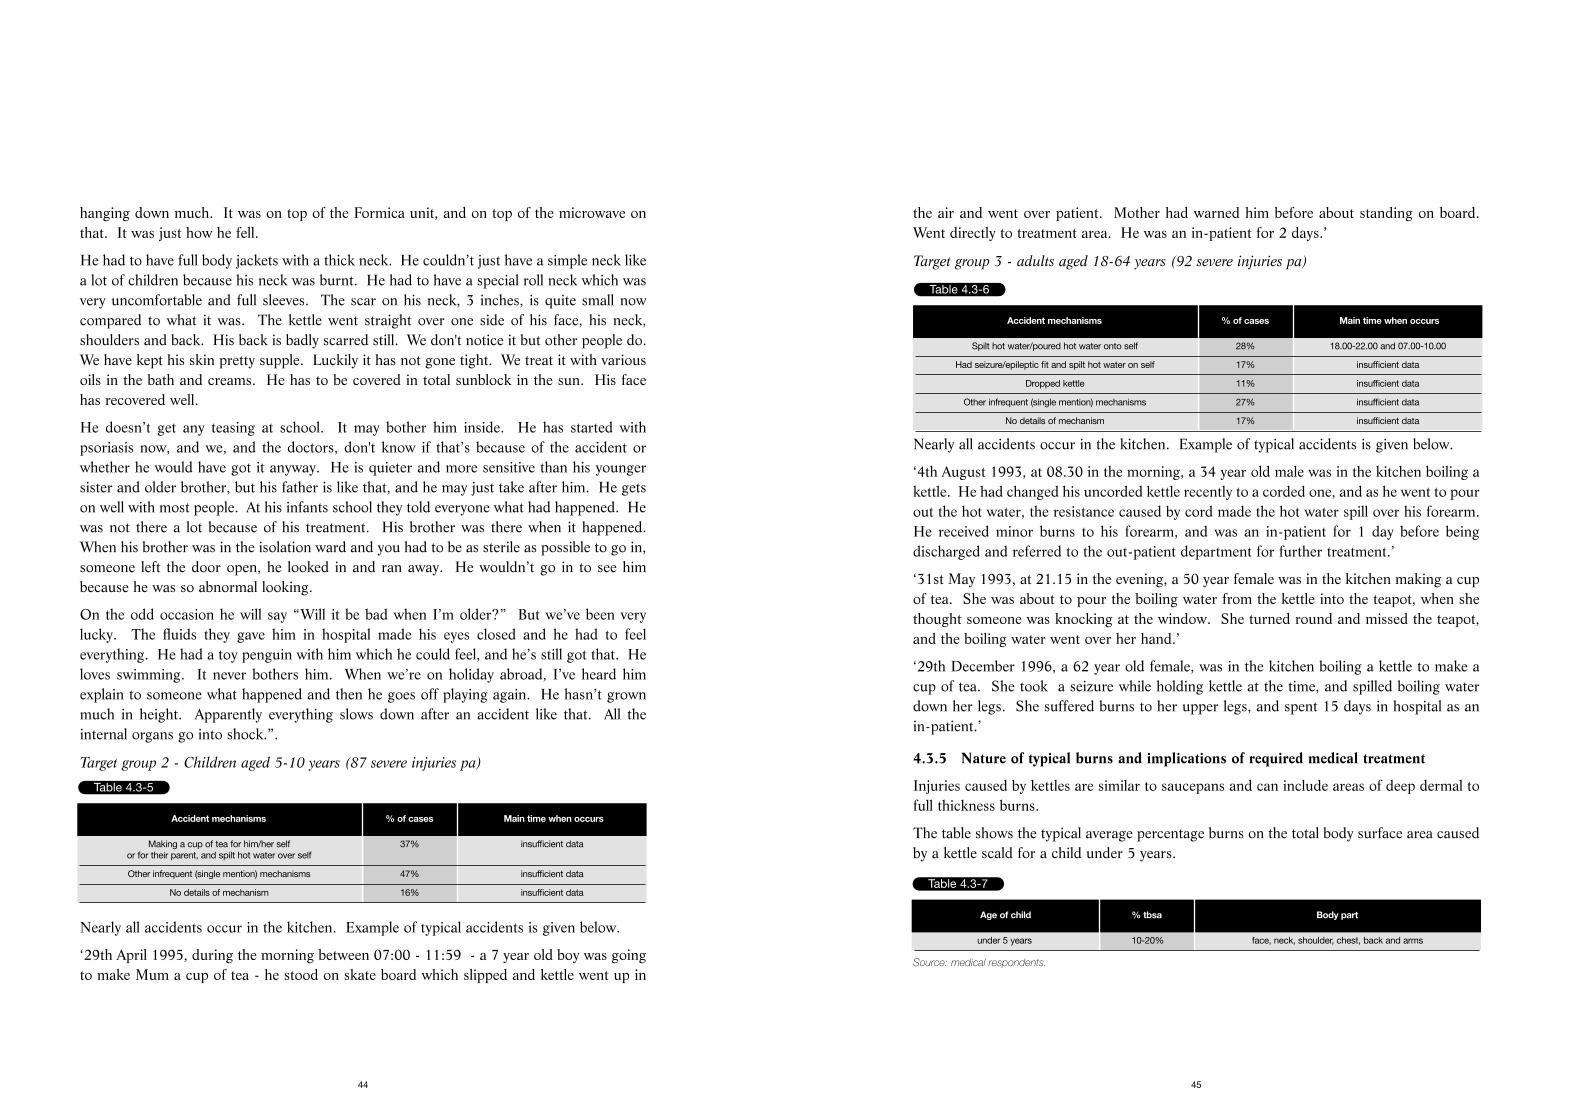
4.3.5 Nature of typical burns and implications of required medical treatment
Injuries caused by kettles are similar to saucepans and can include areas of deep dermal tofull thickness burns.
The table shows the typical average percentage burns on the total body surface area causedby a kettle scald for a child under 5 years.
Source: medical respondents.
45
hanging down much. It was on top of the Formica unit, and on top of the microwave onthat. It was just how he fell.
He had to have full body jackets with a thick neck. He couldn’t just have a simple neck likea lot of children because his neck was burnt. He had to have a special roll neck which wasvery uncomfortable and full sleeves. The scar on his neck, 3 inches, is quite small nowcompared to what it was. The kettle went straight over one side of his face, his neck,shoulders and back. His back is badly scarred still. We don't notice it but other people do.We have kept his skin pretty supple. Luckily it has not gone tight. We treat it with variousoils in the bath and creams. He has to be covered in total sunblock in the sun. His facehas recovered well.
He doesn’t get any teasing at school. It may bother him inside. He has started withpsoriasis now, and we, and the doctors, don't know if that’s because of the accident orwhether he would have got it anyway. He is quieter and more sensitive than his youngersister and older brother, but his father is like that, and he may just take after him. He getson well with most people. At his infants school they told everyone what had happened. Hewas not there a lot because of his treatment. His brother was there when it happened.When his brother was in the isolation ward and you had to be as sterile as possible to go in,someone left the door open, he looked in and ran away. He wouldn’t go in to see himbecause he was so abnormal looking.
On the odd occasion he will say “Will it be bad when I’m older?” But we’ve been verylucky. The fluids they gave him in hospital made his eyes closed and he had to feeleverything. He had a toy penguin with him which he could feel, and he’s still got that. Heloves swimming. It never bothers him. When we’re on holiday abroad, I’ve heard himexplain to someone what happened and then he goes off playing again. He hasn’t grownmuch in height. Apparently everything slows down after an accident like that. All theinternal organs go into shock.”.
Target group 2 - Children aged 5-10 years (87 severe injuries pa)
Nearly all accidents occur in the kitchen. Example of typical accidents is given below.
‘29th April 1995, during the morning between 07:00 - 11:59 - a 7 year old boy was goingto make Mum a cup of tea - he stood on skate board which slipped and kettle went up in
44
Table 4.3-5
Accident mechanisms % of cases Main time when occurs
Making a cup of tea for him/her self 37% insufficient dataor for their parent, and spilt hot water over self
Other infrequent (single mention) mechanisms 47% insufficient data
No details of mechanism 16% insufficient data
Table 4.3-6
Accident mechanisms % of cases Main time when occurs
Spilt hot water/poured hot water onto self 28% 18.00-22.00 and 07.00-10.00
Had seizure/epileptic fit and spilt hot water on self 17% insufficient data
Dropped kettle 11% insufficient data
Other infrequent (single mention) mechanisms 27% insufficient data
No details of mechanism 17% insufficient data
Table 4.3-7
Age of child % tbsa Body part
under 5 years 10-20% face, neck, shoulder, chest, back and arms
anticipate that it might be hot and will be slower to react to a hot contact temperaturethan older child or adult.
6. A safety release button is a safety option, known to be used by at least one manufacturer.A button has to be pressed to allow the water to be poured from the kettle. Without thisaction, the water remains sealed in the kettle.
4.3.7 Key safety messages
Target audience children aged 0-4 years
Primary messages:-
• Keep kettles well away from the edge of a work surface and that the flex is not hanging down.
• Ensure that the flex is as short as is practical. Use a short curly cord.
Secondary messages:-
• Never leave the kettle on the floor.
• Use plastic kettles with a lockable lid which have a large base area and short curly cord.
• Only boil enough water for your immediate needs and empty the kettle immediately after use.
47
Minor injuries are likely to be small splash and contact burns from kettles. Wherenecessary, these receive a Flamazin dressing and are reviewed two or three times to see howthey are progressing. Respondents among general practitioners felt that most kettle scaldsvictims would go directly to A & E rather than visit their doctor.
Severe burns caused by a kettle can require between 10 days and 4 weeks as an in-patientin hospital, due to the need for plastic surgery. With burns greater than 10%, the childneeds to be resuscitated with plasma.
Pressure garments are worn for 18 months to 2 years, and future surgery may be requiredas the child grows and the skin tightens in the scald areas, for example when a girl isdeveloping breasts. In addition to the physical damage caused by the scald, victims mayalso suffer emotional and psychological problems which can last a lifetime. Starting orchanging school, taking up a particular sport and puberty are all times which can beparticularly difficult. Total sunblock is required if they wish to go out in the sun. Medicalrespondents interviewed also mentioned the psychological effect on the parents, who cannever get over the guilt of what has happened. “One mother has not spoken to the fatherfor two years now as he was there when it happened. Some end in divorce.”
4.3.6 Product design ideas emerging from the research
1. The nature of the flex of the kettle is identified as a problem as it is pulled by the youngchild. Curly flexes have been available for some time as it is thought that this is less likelyto dangle over the work surface, within the child’s grasp.
2. Shorter flexes are less likely to dangle over the work surface and to necessitate the kettlebeing kept nearer the back of the work surface and therefore further away from the edge.There has been a general tendency to shorten kettle leads over the past 10 years to reducethe chance of it being pulled over, from 1 metre to about 0.75 metre. Some kettles areavailable with the facility to shorten the flex (without needing to cut the flex), particularlyon cordless kettles.
3. Fully lockable lids are available on kettles, but tend to not be the cheapest models. Jug kettlestend to have lockable lids. These are considered an improvement on non locking or semilocking lids as they are designed to keep the lid in place. Manufacturers/suppliers interviewedmentioned a tip test, where the lid must stay on if the kettle is tipped up for 5 seconds.
4. Traditional shape kettles provide a larger base area, making the kettle more stable on thework surface than the smaller base of a jug kettle.
5. Plastic kettles when heated have a lower outer temperature than metal kettles, makingthem safer if the outside is accidentally touched, especially by a young child who does not
46
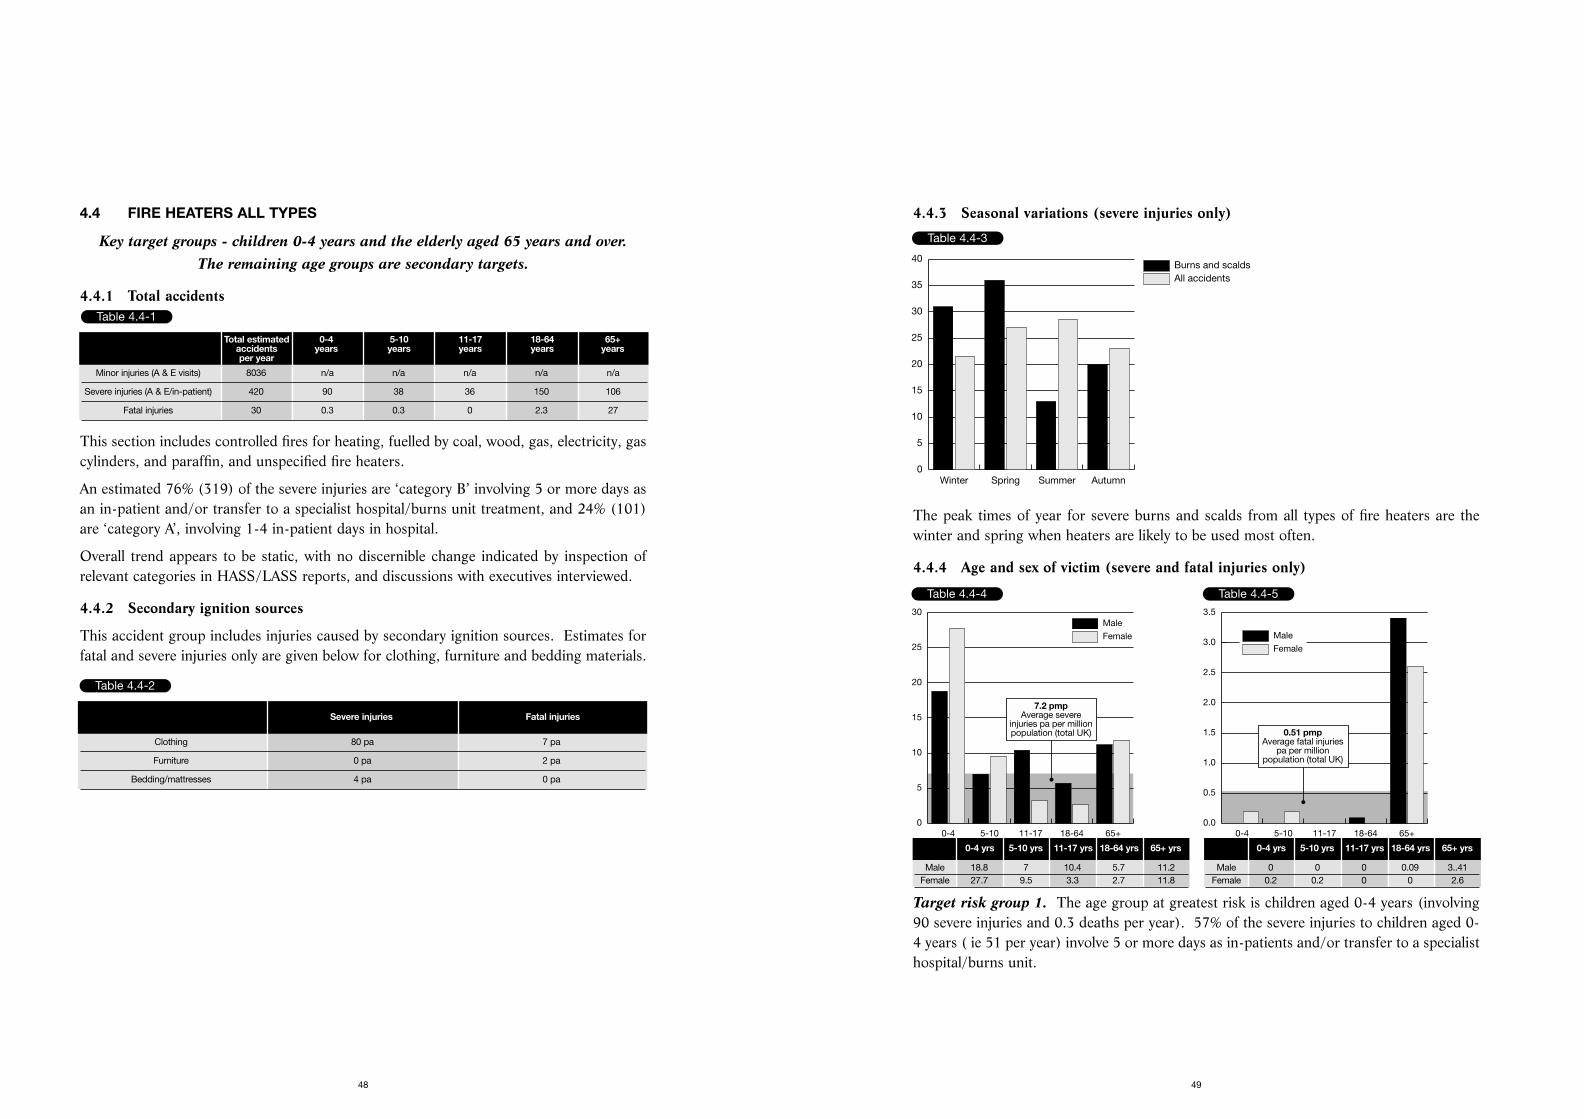
4.4.3 Seasonal variations (severe injuries only)
The peak times of year for severe burns and scalds from all types of fire heaters are thewinter and spring when heaters are likely to be used most often.
4.4.4 Age and sex of victim (severe and fatal injuries only)
Target risk group 1. The age group at greatest risk is children aged 0-4 years (involving90 severe injuries and 0.3 deaths per year). 57% of the severe injuries to children aged 0-4 years ( ie 51 per year) involve 5 or more days as in-patients and/or transfer to a specialisthospital/burns unit.
49
4.4 FIRE HEATERS ALL TYPES
Key target groups - children 0-4 years and the elderly aged 65 years and over. The remaining age groups are secondary targets.
4.4.1 Total accidents
This section includes controlled fires for heating, fuelled by coal, wood, gas, electricity, gascylinders, and paraffin, and unspecified fire heaters.
An estimated 76% (319) of the severe injuries are ‘category B’ involving 5 or more days asan in-patient and/or transfer to a specialist hospital/burns unit treatment, and 24% (101)are ‘category A’, involving 1-4 in-patient days in hospital.
Overall trend appears to be static, with no discernible change indicated by inspection ofrelevant categories in HASS/LASS reports, and discussions with executives interviewed.
4.4.2 Secondary ignition sources
This accident group includes injuries caused by secondary ignition sources. Estimates forfatal and severe injuries only are given below for clothing, furniture and bedding materials.
48
Table 4.4-1
Total estimated 0-4 5-10 11-17 18-64 65+accidents years years years years yearsper year
Minor injuries (A & E visits) 8036 n/a n/a n/a n/a n/a
Severe injuries (A & E/in-patient) 420 90 38 36 150 106
Fatal injuries 30 0.3 0.3 0 2.3 27
Table 4.4-2
Severe injuries Fatal injuries
Clothing 80 pa 7 pa
Furniture 0 pa 2 pa
Bedding/mattresses 4 pa 0 pa
Table 4.4-3
All accidentsBurns and scalds
Winter Spring Summer Autumn0
5
10
15
20
25
30
35
40
Table 4.4-4
Female
Male
0-4years
5-10years
11-17years
18-64years
65+years
0
5
10
15
20
25
30
7.2 pmpAverage severe
injuries pa per millionpopulation (total UK)
0-4 yrs 5-10 yrs 11-17 yrs 18-64 yrs 65+ yrs
Male 18.8 7 10.4 5.7 11.2Female 27.7 9.5 3.3 2.7 11.8
Table 4.4-5
Female
Male
0-4years
5-10years
11-17years
18-64years
65+years
0.0
0.5
1.0
1.5
2.0
2.5
3.0
3.5
0.51 pmpAverage fatal injuries
pa per millionpopulation (total UK)
0-4 yrs 5-10 yrs 11-17 yrs 18-64 yrs 65+ yrs
Male 0 0 0 0.09 3..41Female 0.2 0.2 0 0 2.6
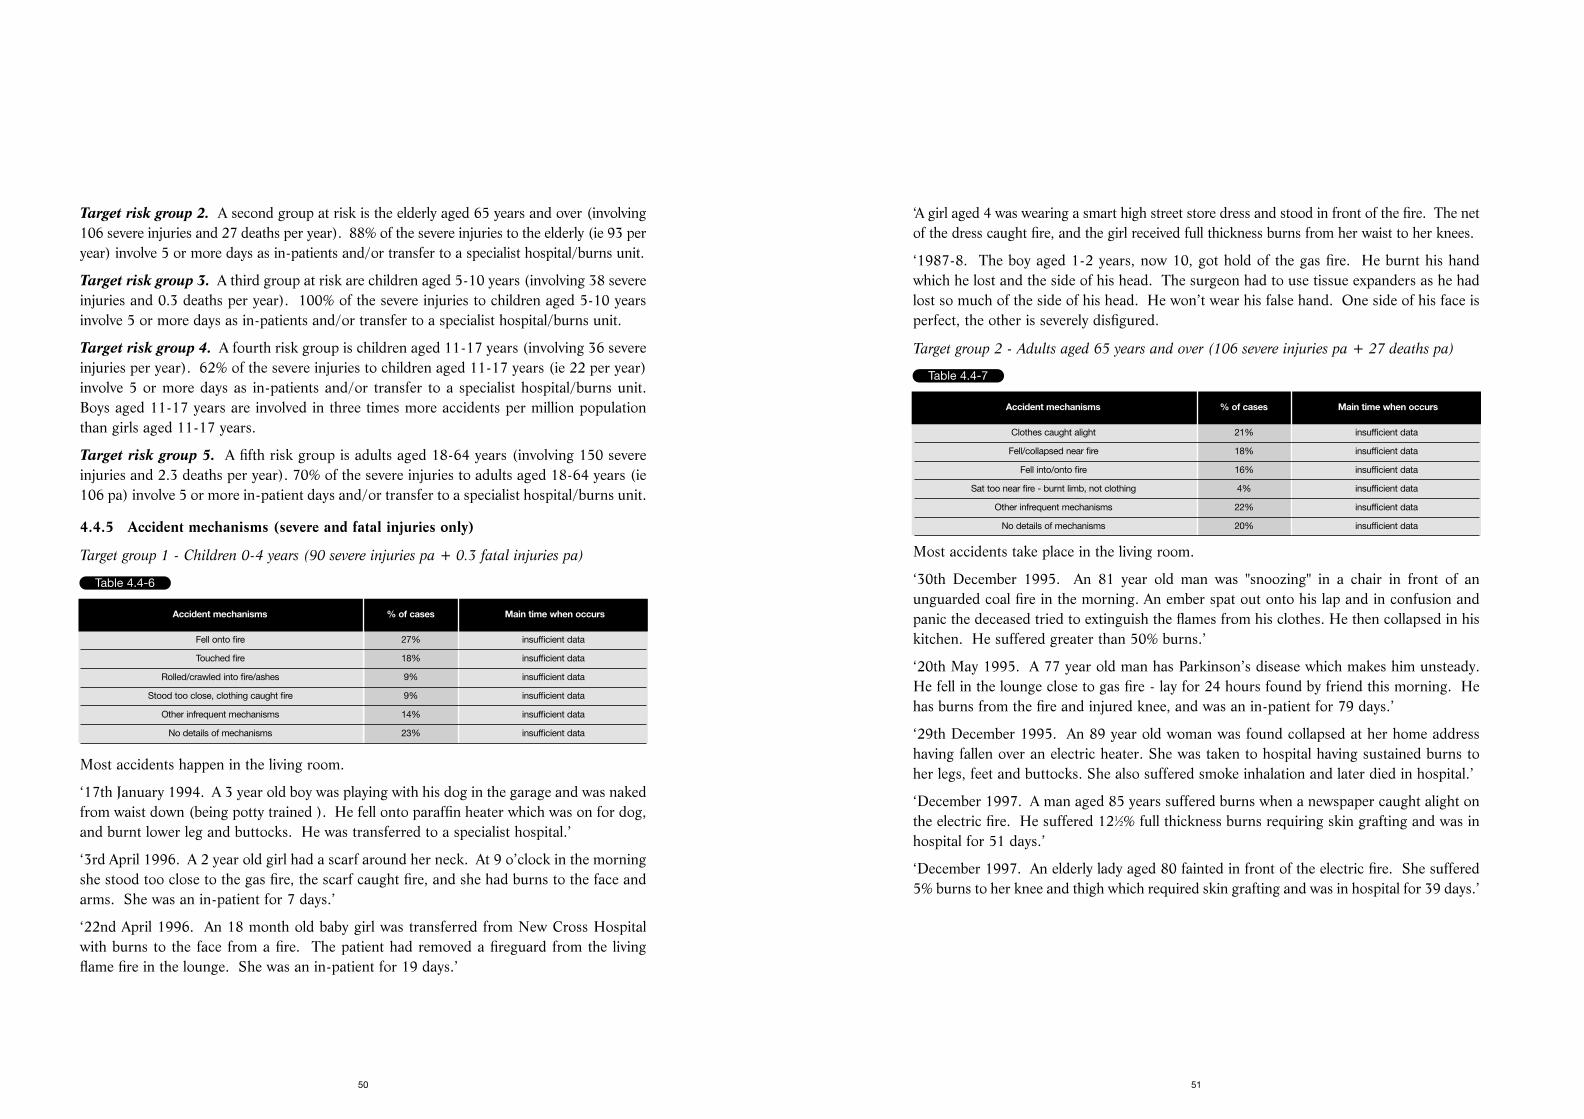
‘A girl aged 4 was wearing a smart high street store dress and stood in front of the fire. The netof the dress caught fire, and the girl received full thickness burns from her waist to her knees.
‘1987-8. The boy aged 1-2 years, now 10, got hold of the gas fire. He burnt his handwhich he lost and the side of his head. The surgeon had to use tissue expanders as he hadlost so much of the side of his head. He won’t wear his false hand. One side of his face isperfect, the other is severely disfigured.
Target group 2 - Adults aged 65 years and over (106 severe injuries pa + 27 deaths pa)
Most accidents take place in the living room.
‘30th December 1995. An 81 year old man was "snoozing" in a chair in front of anunguarded coal fire in the morning. An ember spat out onto his lap and in confusion andpanic the deceased tried to extinguish the flames from his clothes. He then collapsed in hiskitchen. He suffered greater than 50% burns.’
‘20th May 1995. A 77 year old man has Parkinson’s disease which makes him unsteady.He fell in the lounge close to gas fire - lay for 24 hours found by friend this morning. Hehas burns from the fire and injured knee, and was an in-patient for 79 days.’
‘29th December 1995. An 89 year old woman was found collapsed at her home addresshaving fallen over an electric heater. She was taken to hospital having sustained burns toher legs, feet and buttocks. She also suffered smoke inhalation and later died in hospital.’
‘December 1997. A man aged 85 years suffered burns when a newspaper caught alight onthe electric fire. He suffered 121⁄2% full thickness burns requiring skin grafting and was inhospital for 51 days.’
‘December 1997. An elderly lady aged 80 fainted in front of the electric fire. She suffered5% burns to her knee and thigh which required skin grafting and was in hospital for 39 days.’
51
Target risk group 2. A second group at risk is the elderly aged 65 years and over (involving106 severe injuries and 27 deaths per year). 88% of the severe injuries to the elderly (ie 93 peryear) involve 5 or more days as in-patients and/or transfer to a specialist hospital/burns unit.
Target risk group 3. A third group at risk are children aged 5-10 years (involving 38 severeinjuries and 0.3 deaths per year). 100% of the severe injuries to children aged 5-10 yearsinvolve 5 or more days as in-patients and/or transfer to a specialist hospital/burns unit.
Target risk group 4. A fourth risk group is children aged 11-17 years (involving 36 severeinjuries per year). 62% of the severe injuries to children aged 11-17 years (ie 22 per year)involve 5 or more days as in-patients and/or transfer to a specialist hospital/burns unit.Boys aged 11-17 years are involved in three times more accidents per million populationthan girls aged 11-17 years.
Target risk group 5. A fifth risk group is adults aged 18-64 years (involving 150 severeinjuries and 2.3 deaths per year). 70% of the severe injuries to adults aged 18-64 years (ie106 pa) involve 5 or more in-patient days and/or transfer to a specialist hospital/burns unit.
4.4.5 Accident mechanisms (severe and fatal injuries only)
Target group 1 - Children 0-4 years (90 severe injuries pa + 0.3 fatal injuries pa)
Most accidents happen in the living room.
‘17th January 1994. A 3 year old boy was playing with his dog in the garage and was nakedfrom waist down (being potty trained ). He fell onto paraffin heater which was on for dog,and burnt lower leg and buttocks. He was transferred to a specialist hospital.’
‘3rd April 1996. A 2 year old girl had a scarf around her neck. At 9 o’clock in the morningshe stood too close to the gas fire, the scarf caught fire, and she had burns to the face andarms. She was an in-patient for 7 days.’
‘22nd April 1996. An 18 month old baby girl was transferred from New Cross Hospitalwith burns to the face from a fire. The patient had removed a fireguard from the livingflame fire in the lounge. She was an in-patient for 19 days.’
50
Table 4.4-6
Accident mechanisms % of cases Main time when occurs
Fell onto fire 27% insufficient data
Touched fire 18% insufficient data
Rolled/crawled into fire/ashes 9% insufficient data
Stood too close, clothing caught fire 9% insufficient data
Other infrequent mechanisms 14% insufficient data
No details of mechanisms 23% insufficient data
Table 4.4-7
Accident mechanisms % of cases Main time when occurs
Clothes caught alight 21% insufficient data
Fell/collapsed near fire 18% insufficient data
Fell into/onto fire 16% insufficient data
Sat too near fire - burnt limb, not clothing 4% insufficient data
Other infrequent mechanisms 22% insufficient data
No details of mechanisms 20% insufficient data
‘25th January 1993. A 52 year old woman was lighting the gas fire in the living room with matchbecause pilot light was not working - flames blew back as she bent forward. Her hair was heavilylacquered and caught fire - burnt her scalp. She was transferred to a specialist hospital.’
‘12th December 1995. A 48 year old man sustained a burn to left leg on fire in the lateevening - trousers caught fire on fire in living room - smells strongly of alcohol. He wastransferred to a specialist hospital.’
‘29th December 1996. A 44 year old man fell asleep in front of the gas fire and burnt hisleg. He was an in-patient for 7 days before being referred to the outpatients clinic.’
4.4.6 Nature of typical burns and implications of required medical treatment
The normal reaction time to heat is very fast - 0.2 seconds. However up to three years ofage the reaction time is slower, and young children will burn their hands and fingers if theytouch a fire, or have more extensive burns if they fall on a fire.
Medical respondents consistently agreed that many of the elderly involved in accidents aresuffering from predispositions which make it more likely that they will have an accident thanothers in the population. Unsteadiness, alcoholic tendencies, Alzheimer’s, senile dementia,arthritis, epilepsy, declining eyesight were some of the factors mentioned. The burns canbe extremely severe, as they often do not know what is happening.
The table below shows the typical average percentage burns of the total body surface areacaused by a fire/heater burn.
Source: medical respondents, literature.
Minor - Superficial finger or leg burns are treated by a practice nurse at the GP surgery andseen by the A & E department but do not tend to require becoming an in-patient.
Severe - A hand with diminished function can be a handicap as the child grows older,particularly in terms of employment. The elderly often suffer deep dermal burns andrequire skin grafting.
53
Target group 3 - Children aged 5-10 years (38 severe injuries pa + 0.3 fatal injuries pa)
Most accidents happen in the living room.
‘7th November 1996. A young girl aged 6 stood in front of the fire and her clothes wereset on fire. She was an in-patient for 6 days and then referred to the outpatients clinic.’
‘9th September 1995. A young boy aged 5 fell onto the fire with his outstretched hand. Hewas transferred to a specialist hospital.’
Target group 4 - Children aged 11-17 years (36 severe injuries pa)
Most accidents take place in the living room.
‘7th May 1996. An 11 year old boy’s dressing gown caught fire on the fire in the lounge.He was burnt on the back and was an in-patient for 28 days before being referred to theoutpatients clinic.’
Target group 5 - Adults aged 18-64 (150 severe injuries and 2.3 deaths pa)
Most accidents take place in the living room.
52
Table 4.4-8
Accident mechanisms % of cases Main time when occurs
Too close to fire and clothing caught fire 67% mid evening
Fell onto fire 22% insufficient data
Other infrequent mechanisms 11% insufficient data
Table 4.4-9
Accident mechanisms % of cases Main time when occurs
Too close to fire and clothing caught fire 25% insufficient data
Other infrequent mechanisms 75% insufficient data
Table 4.4-10
Accident mechanisms % of cases Main time when occurs
Trying to light gas fire 17% insufficient data
Clothing caught fire 15% insufficient data
Too close to fire - limbs burnt, not clothing 10% insufficient data
Fell/collapsed close to the fire 7% insufficient data
Fell/collapsed onto fire 7% insufficient data
Mobile gas heater exploded 7% insufficient data
Other infrequent mechanisms 27% insufficient data
No details of mechanism 17% insufficient data
Table 4.4-11
Age % tbsa Body part
under 5 years 1-21⁄2% fingers, hands if touch fire
under 5 years 5-20% legs, hand, arm, if fall on fire
elderly 10-60+% multi body parts, depending how long before found
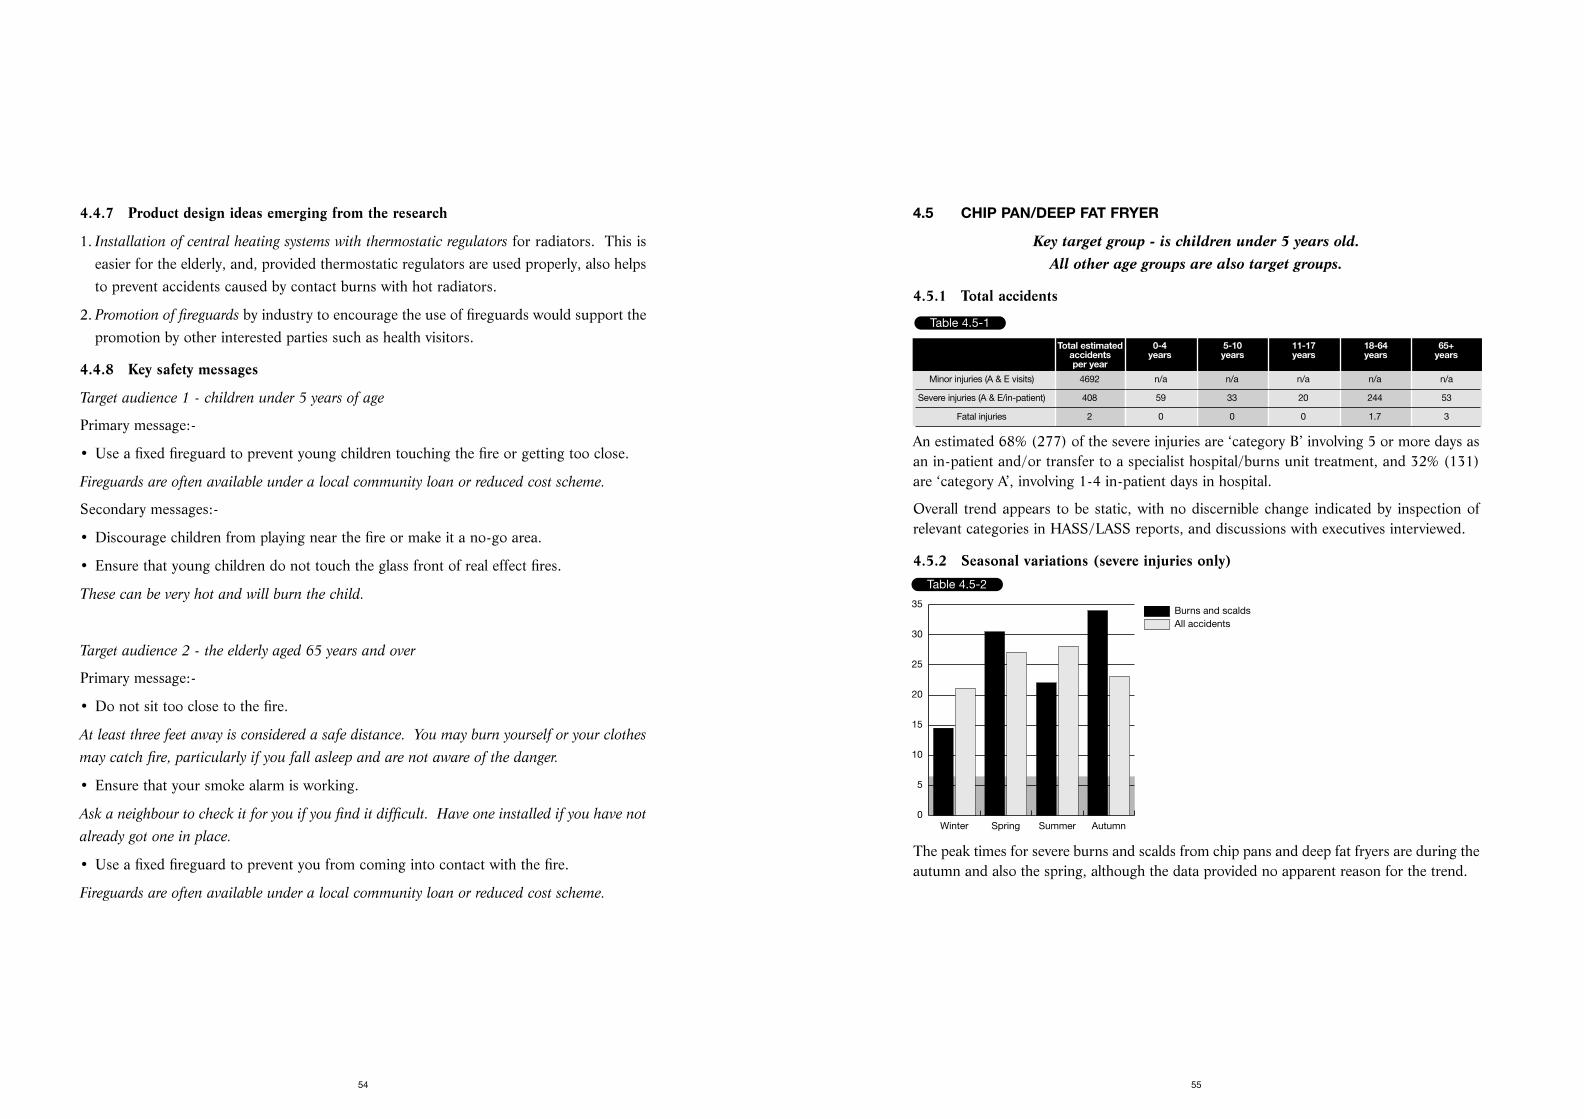
4.5 CHIP PAN/DEEP FAT FRYER
Key target group - is children under 5 years old. All other age groups are also target groups.
4.5.1 Total accidents
An estimated 68% (277) of the severe injuries are ‘category B’ involving 5 or more days asan in-patient and/or transfer to a specialist hospital/burns unit treatment, and 32% (131)are ‘category A’, involving 1-4 in-patient days in hospital.
Overall trend appears to be static, with no discernible change indicated by inspection ofrelevant categories in HASS/LASS reports, and discussions with executives interviewed.
4.5.2 Seasonal variations (severe injuries only)
The peak times for severe burns and scalds from chip pans and deep fat fryers are during theautumn and also the spring, although the data provided no apparent reason for the trend.
55
4.4.7 Product design ideas emerging from the research
1. Installation of central heating systems with thermostatic regulators for radiators. This iseasier for the elderly, and, provided thermostatic regulators are used properly, also helpsto prevent accidents caused by contact burns with hot radiators.
2. Promotion of fireguards by industry to encourage the use of fireguards would support thepromotion by other interested parties such as health visitors.
4.4.8 Key safety messages
Target audience 1 - children under 5 years of age
Primary message:-
• Use a fixed fireguard to prevent young children touching the fire or getting too close.
Fireguards are often available under a local community loan or reduced cost scheme.
Secondary messages:-
• Discourage children from playing near the fire or make it a no-go area.
• Ensure that young children do not touch the glass front of real effect fires.
These can be very hot and will burn the child.
Target audience 2 - the elderly aged 65 years and over
Primary message:-
• Do not sit too close to the fire.
At least three feet away is considered a safe distance. You may burn yourself or your clothes
may catch fire, particularly if you fall asleep and are not aware of the danger.
• Ensure that your smoke alarm is working.
Ask a neighbour to check it for you if you find it difficult. Have one installed if you have not
already got one in place.
• Use a fixed fireguard to prevent you from coming into contact with the fire.
Fireguards are often available under a local community loan or reduced cost scheme.
54
Table 4.5-1
Total estimated 0-4 5-10 11-17 18-64 65+accidents years years years years yearsper year
Minor injuries (A & E visits) 4692 n/a n/a n/a n/a n/a
Severe injuries (A & E/in-patient) 408 59 33 20 244 53
Fatal injuries 2 0 0 0 1.7 3
Table 4.5-2
All accidentsBurns and scalds
Winter Spring Summer Autumn0
5
10
15
20
25
30
35
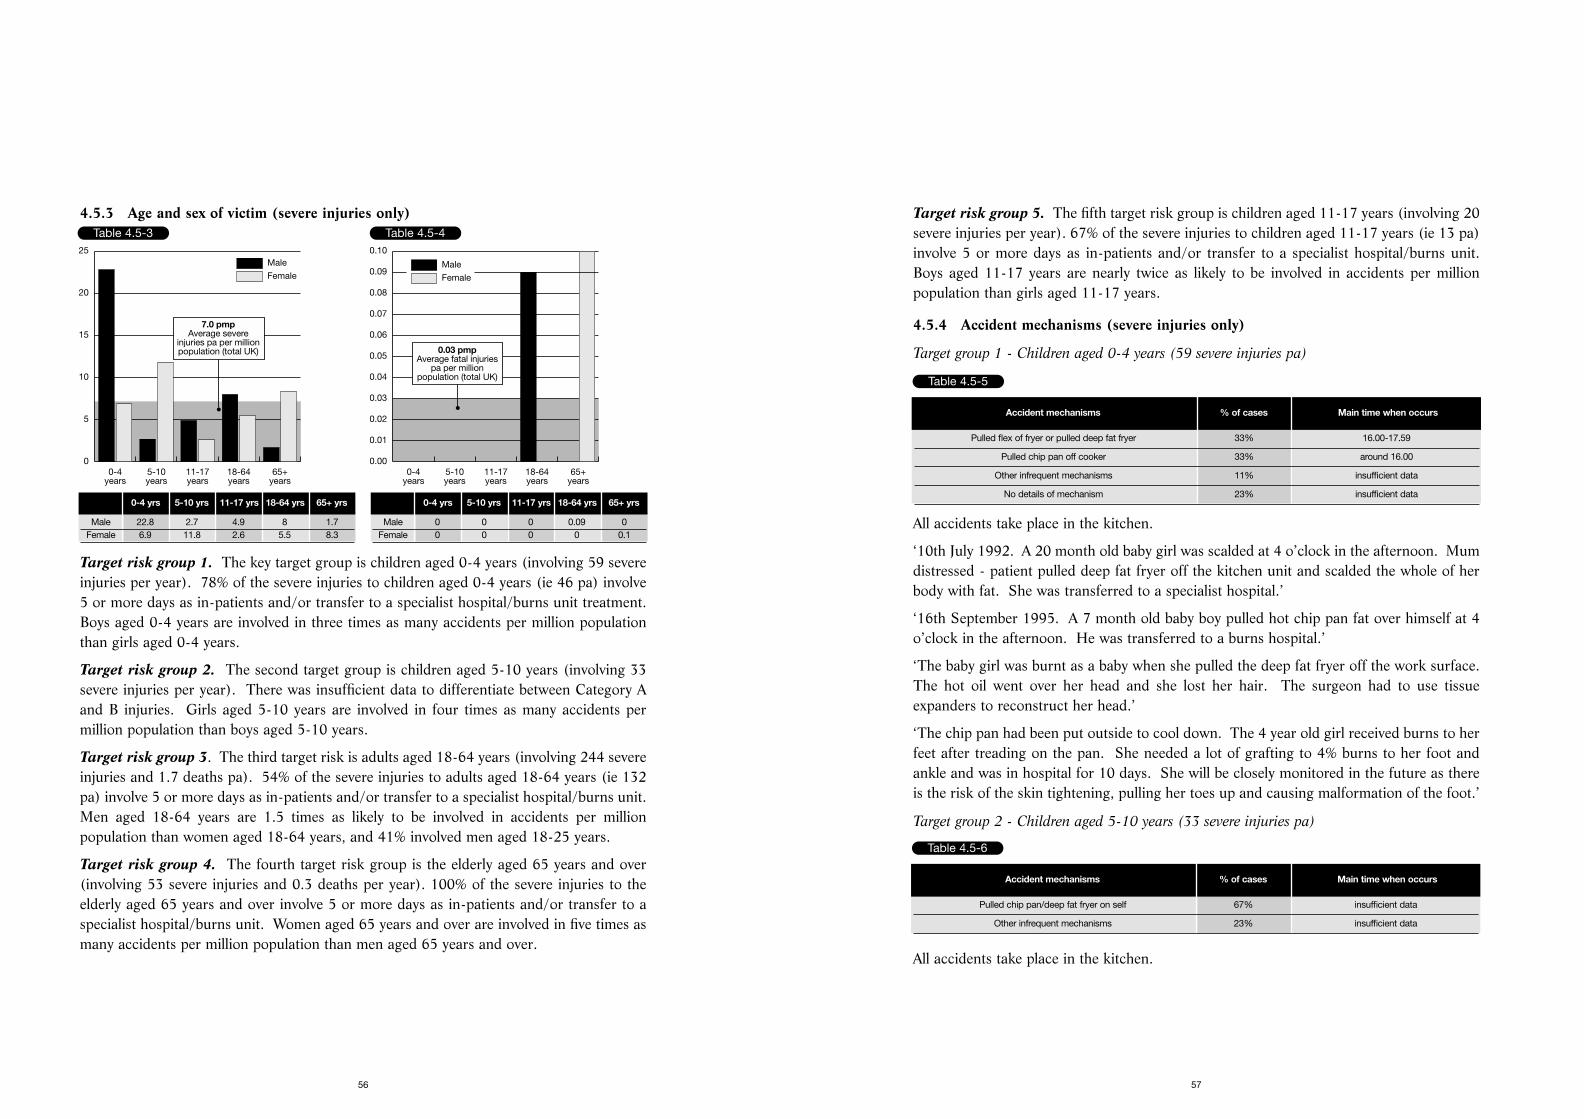
Target risk group 5. The fifth target risk group is children aged 11-17 years (involving 20severe injuries per year). 67% of the severe injuries to children aged 11-17 years (ie 13 pa)involve 5 or more days as in-patients and/or transfer to a specialist hospital/burns unit.Boys aged 11-17 years are nearly twice as likely to be involved in accidents per millionpopulation than girls aged 11-17 years.
4.5.4 Accident mechanisms (severe injuries only)
Target group 1 - Children aged 0-4 years (59 severe injuries pa)
All accidents take place in the kitchen.
‘10th July 1992. A 20 month old baby girl was scalded at 4 o’clock in the afternoon. Mumdistressed - patient pulled deep fat fryer off the kitchen unit and scalded the whole of herbody with fat. She was transferred to a specialist hospital.’
‘16th September 1995. A 7 month old baby boy pulled hot chip pan fat over himself at 4o’clock in the afternoon. He was transferred to a burns hospital.’
‘The baby girl was burnt as a baby when she pulled the deep fat fryer off the work surface.The hot oil went over her head and she lost her hair. The surgeon had to use tissueexpanders to reconstruct her head.’
‘The chip pan had been put outside to cool down. The 4 year old girl received burns to herfeet after treading on the pan. She needed a lot of grafting to 4% burns to her foot andankle and was in hospital for 10 days. She will be closely monitored in the future as thereis the risk of the skin tightening, pulling her toes up and causing malformation of the foot.’
Target group 2 - Children aged 5-10 years (33 severe injuries pa)
All accidents take place in the kitchen.
57
4.5.3 Age and sex of victim (severe injuries only)
Target risk group 1. The key target group is children aged 0-4 years (involving 59 severeinjuries per year). 78% of the severe injuries to children aged 0-4 years (ie 46 pa) involve5 or more days as in-patients and/or transfer to a specialist hospital/burns unit treatment.Boys aged 0-4 years are involved in three times as many accidents per million populationthan girls aged 0-4 years.
Target risk group 2. The second target group is children aged 5-10 years (involving 33severe injuries per year). There was insufficient data to differentiate between Category Aand B injuries. Girls aged 5-10 years are involved in four times as many accidents permillion population than boys aged 5-10 years.
Target risk group 3. The third target risk is adults aged 18-64 years (involving 244 severeinjuries and 1.7 deaths pa). 54% of the severe injuries to adults aged 18-64 years (ie 132pa) involve 5 or more days as in-patients and/or transfer to a specialist hospital/burns unit.Men aged 18-64 years are 1.5 times as likely to be involved in accidents per millionpopulation than women aged 18-64 years, and 41% involved men aged 18-25 years.
Target risk group 4. The fourth target risk group is the elderly aged 65 years and over(involving 53 severe injuries and 0.3 deaths per year). 100% of the severe injuries to theelderly aged 65 years and over involve 5 or more days as in-patients and/or transfer to aspecialist hospital/burns unit. Women aged 65 years and over are involved in five times asmany accidents per million population than men aged 65 years and over.
56
Table 4.5-3
Female
Male
0-4years
5-10years
11-17years
18-64years
65+years
0
5
10
15
20
25
7.0 pmpAverage severe
injuries pa per millionpopulation (total UK)
0-4 yrs 5-10 yrs 11-17 yrs 18-64 yrs 65+ yrs
Male 22.8 2.7 4.9 8 1.7Female 6.9 11.8 2.6 5.5 8.3
Table 4.5-4
Female
Male
0-4years
5-10years
11-17years
18-64years
65+years
0.00
0.01
0.02
0.03
0.04
0.05
0.06
0.07
0.08
0.09
0.10
0.03 pmpAverage fatal injuries
pa per millionpopulation (total UK)
0-4 yrs 5-10 yrs 11-17 yrs 18-64 yrs 65+ yrs
Male 0 0 0 0.09 0Female 0 0 0 0 0.1
Table 4.5-5
Accident mechanisms % of cases Main time when occurs
Pulled flex of fryer or pulled deep fat fryer 33% 16.00-17.59
Pulled chip pan off cooker 33% around 16.00
Other infrequent mechanisms 11% insufficient data
No details of mechanism 23% insufficient data
Table 4.5-6
Accident mechanisms % of cases Main time when occurs
Pulled chip pan/deep fat fryer on self 67% insufficient data
Other infrequent mechanisms 23% insufficient data
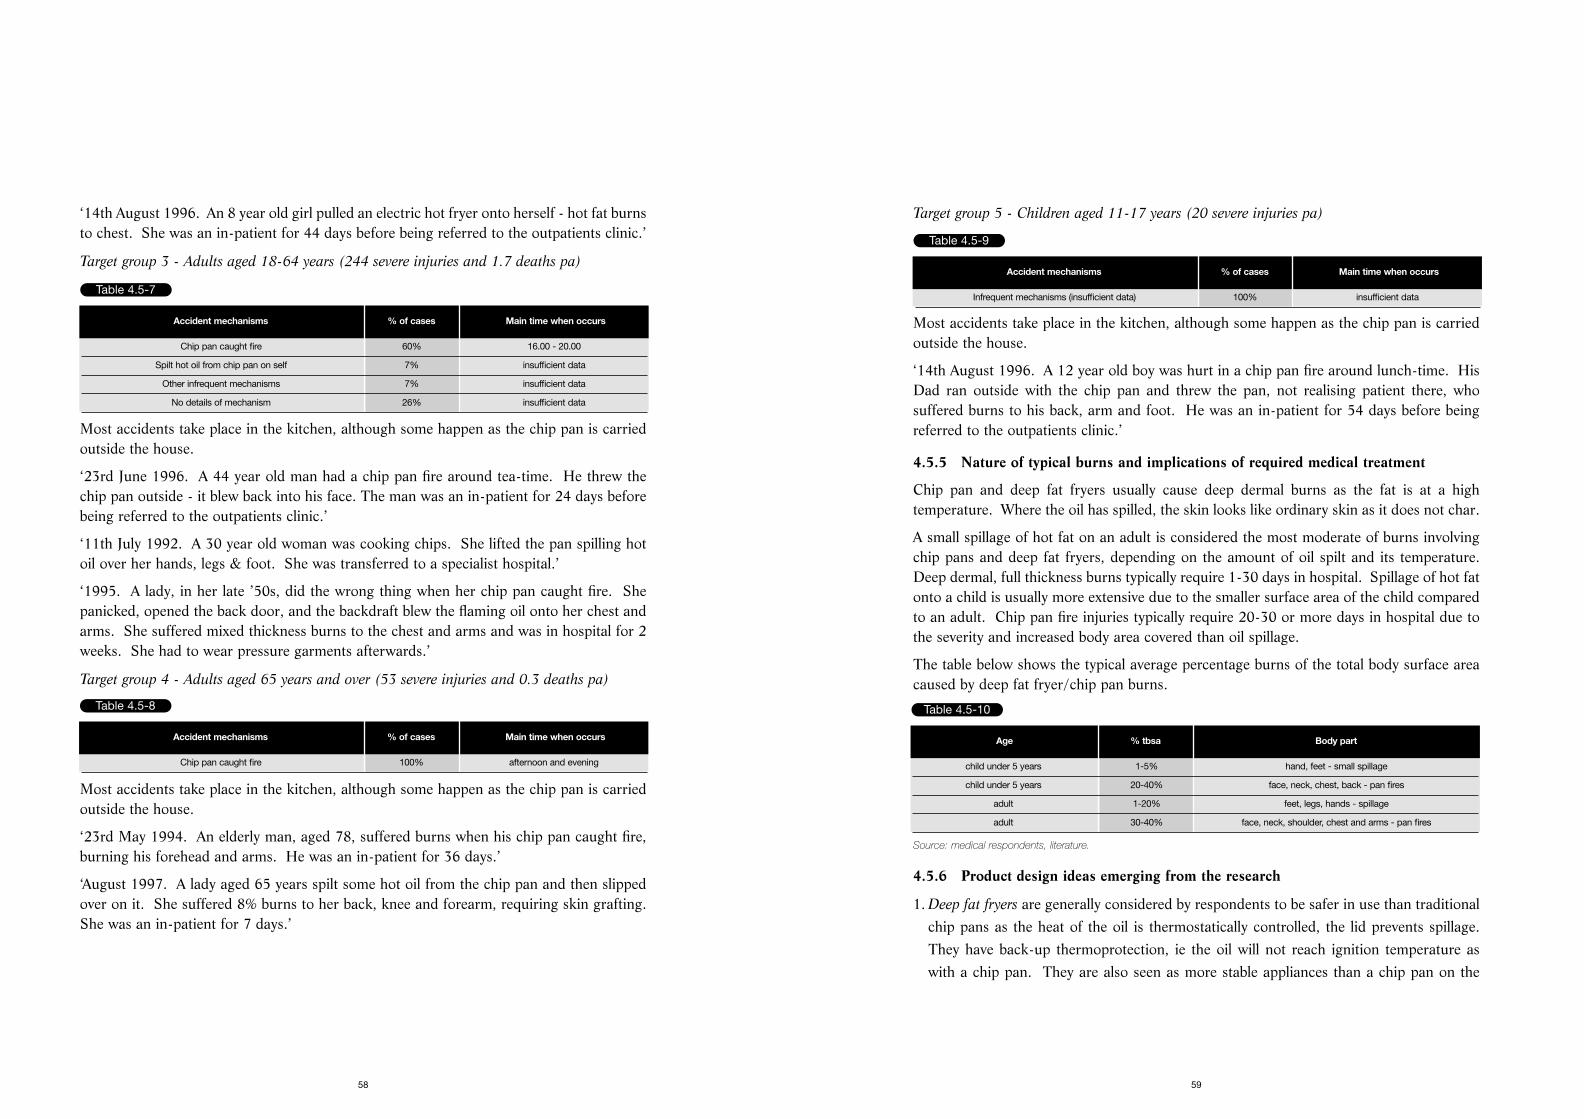
Target group 5 - Children aged 11-17 years (20 severe injuries pa)
Most accidents take place in the kitchen, although some happen as the chip pan is carriedoutside the house.
‘14th August 1996. A 12 year old boy was hurt in a chip pan fire around lunch-time. HisDad ran outside with the chip pan and threw the pan, not realising patient there, whosuffered burns to his back, arm and foot. He was an in-patient for 54 days before beingreferred to the outpatients clinic.’
4.5.5 Nature of typical burns and implications of required medical treatment
Chip pan and deep fat fryers usually cause deep dermal burns as the fat is at a hightemperature. Where the oil has spilled, the skin looks like ordinary skin as it does not char.
A small spillage of hot fat on an adult is considered the most moderate of burns involvingchip pans and deep fat fryers, depending on the amount of oil spilt and its temperature.Deep dermal, full thickness burns typically require 1-30 days in hospital. Spillage of hot fatonto a child is usually more extensive due to the smaller surface area of the child comparedto an adult. Chip pan fire injuries typically require 20-30 or more days in hospital due tothe severity and increased body area covered than oil spillage.
The table below shows the typical average percentage burns of the total body surface areacaused by deep fat fryer/chip pan burns.
Source: medical respondents, literature.
4.5.6 Product design ideas emerging from the research
1. Deep fat fryers are generally considered by respondents to be safer in use than traditionalchip pans as the heat of the oil is thermostatically controlled, the lid prevents spillage.They have back-up thermoprotection, ie the oil will not reach ignition temperature aswith a chip pan. They are also seen as more stable appliances than a chip pan on the
59
‘14th August 1996. An 8 year old girl pulled an electric hot fryer onto herself - hot fat burnsto chest. She was an in-patient for 44 days before being referred to the outpatients clinic.’
Target group 3 - Adults aged 18-64 years (244 severe injuries and 1.7 deaths pa)
Most accidents take place in the kitchen, although some happen as the chip pan is carriedoutside the house.
‘23rd June 1996. A 44 year old man had a chip pan fire around tea-time. He threw thechip pan outside - it blew back into his face. The man was an in-patient for 24 days beforebeing referred to the outpatients clinic.’
‘11th July 1992. A 30 year old woman was cooking chips. She lifted the pan spilling hotoil over her hands, legs & foot. She was transferred to a specialist hospital.’
‘1995. A lady, in her late ’50s, did the wrong thing when her chip pan caught fire. Shepanicked, opened the back door, and the backdraft blew the flaming oil onto her chest andarms. She suffered mixed thickness burns to the chest and arms and was in hospital for 2weeks. She had to wear pressure garments afterwards.’
Target group 4 - Adults aged 65 years and over (53 severe injuries and 0.3 deaths pa)
Most accidents take place in the kitchen, although some happen as the chip pan is carriedoutside the house.
‘23rd May 1994. An elderly man, aged 78, suffered burns when his chip pan caught fire,burning his forehead and arms. He was an in-patient for 36 days.’
‘August 1997. A lady aged 65 years spilt some hot oil from the chip pan and then slippedover on it. She suffered 8% burns to her back, knee and forearm, requiring skin grafting.She was an in-patient for 7 days.’
58
Table 4.5-7
Accident mechanisms % of cases Main time when occurs
Chip pan caught fire 60% 16.00 - 20.00
Spilt hot oil from chip pan on self 7% insufficient data
Other infrequent mechanisms 7% insufficient data
No details of mechanism 26% insufficient data
Table 4.5-8
Accident mechanisms % of cases Main time when occurs
Chip pan caught fire 100% afternoon and evening
Table 4.5-9
Accident mechanisms % of cases Main time when occurs
Infrequent mechanisms (insufficient data) 100% insufficient data
Table 4.5-10
Age % tbsa Body part
child under 5 years 1-5% hand, feet - small spillage
child under 5 years 20-40% face, neck, chest, back - pan fires
adult 1-20% feet, legs, hands - spillage
adult 30-40% face, neck, shoulder, chest and arms - pan fires
Target audience - adults and the elderly
Primary messages:-
• Use a purpose designed thermostatically controlled deep fat fryer, rather than a chip pan.
• When using a chip pan, never leave a chip pan unattended while cooking and alwaysmake sure the cooker is switched off after use.
• In the event of a chip pan fire, follow the correct safety sequence:- i) Do not try to move the chip pan or carry it outside. ii) Turn off the heat. iii) Cover it with a damp teacloth or towel or fire blanket. iv) NEVER USE WATER. v) Leave the pan to cool for at least 30 minutes.
• Keep a fire safety blanket handy in the kitchen
Secondary messages:-
• Do not fill the chip pan more than one-third full of oil.
61
cooker as they have a large foot base.
2. Shorter flexes on deep fat fryers are less likely to dangle over the work surface and tonecessitate the deep fat fryer being kept nearer the back of the work surface, andtherefore further away from the edge.
3. The facility to shorten the flex has been available since the 1980s. However it is notknown to what extent consumers are aware of this facility.
4. A safety release button would allow the lid of the deep fat fryer to open only when arelease button is pressed.
5. Cool wall deep fat fryers are available to prevent the danger of contact burns, shouldpeople accidentally touch the wall of the fryers, and represent about 51% of current deepfat fryer sales.
6. Cooker guards can help prevent young children from pulling pans off the cooker.
7. Microwave and oven chips offer an alternative method of cooking chips, particularly forthe elderly, which does not involve the use of hot oil.
4.5.7 Key safety messages
Target audience 1 - children under 5 years of age
Primary messages:-
• When using a deep fat fryer, ensure it is placed well back on the work surface and thatthe cord is short enough not to be accessible to children.
• Never leave a chip pan/deep fat fryer unattended while cooking and always make surethe cooker is switched off after use.
Secondary messages:-
• Discourage children from playing in the kitchen.
Ensure that young children are playing safely away from the chip pan or deep fat fryer, ie
away from the cooker or work surface. If possible, they should be kept out of the kitchen
during meal preparation, or in a high chair/playpen, but not in a baby walker.
• Use cooker guards to prevent young children from coming too close to the cooker.
• When using a chip pan, use the back burners of the cooker rather than the front.
60
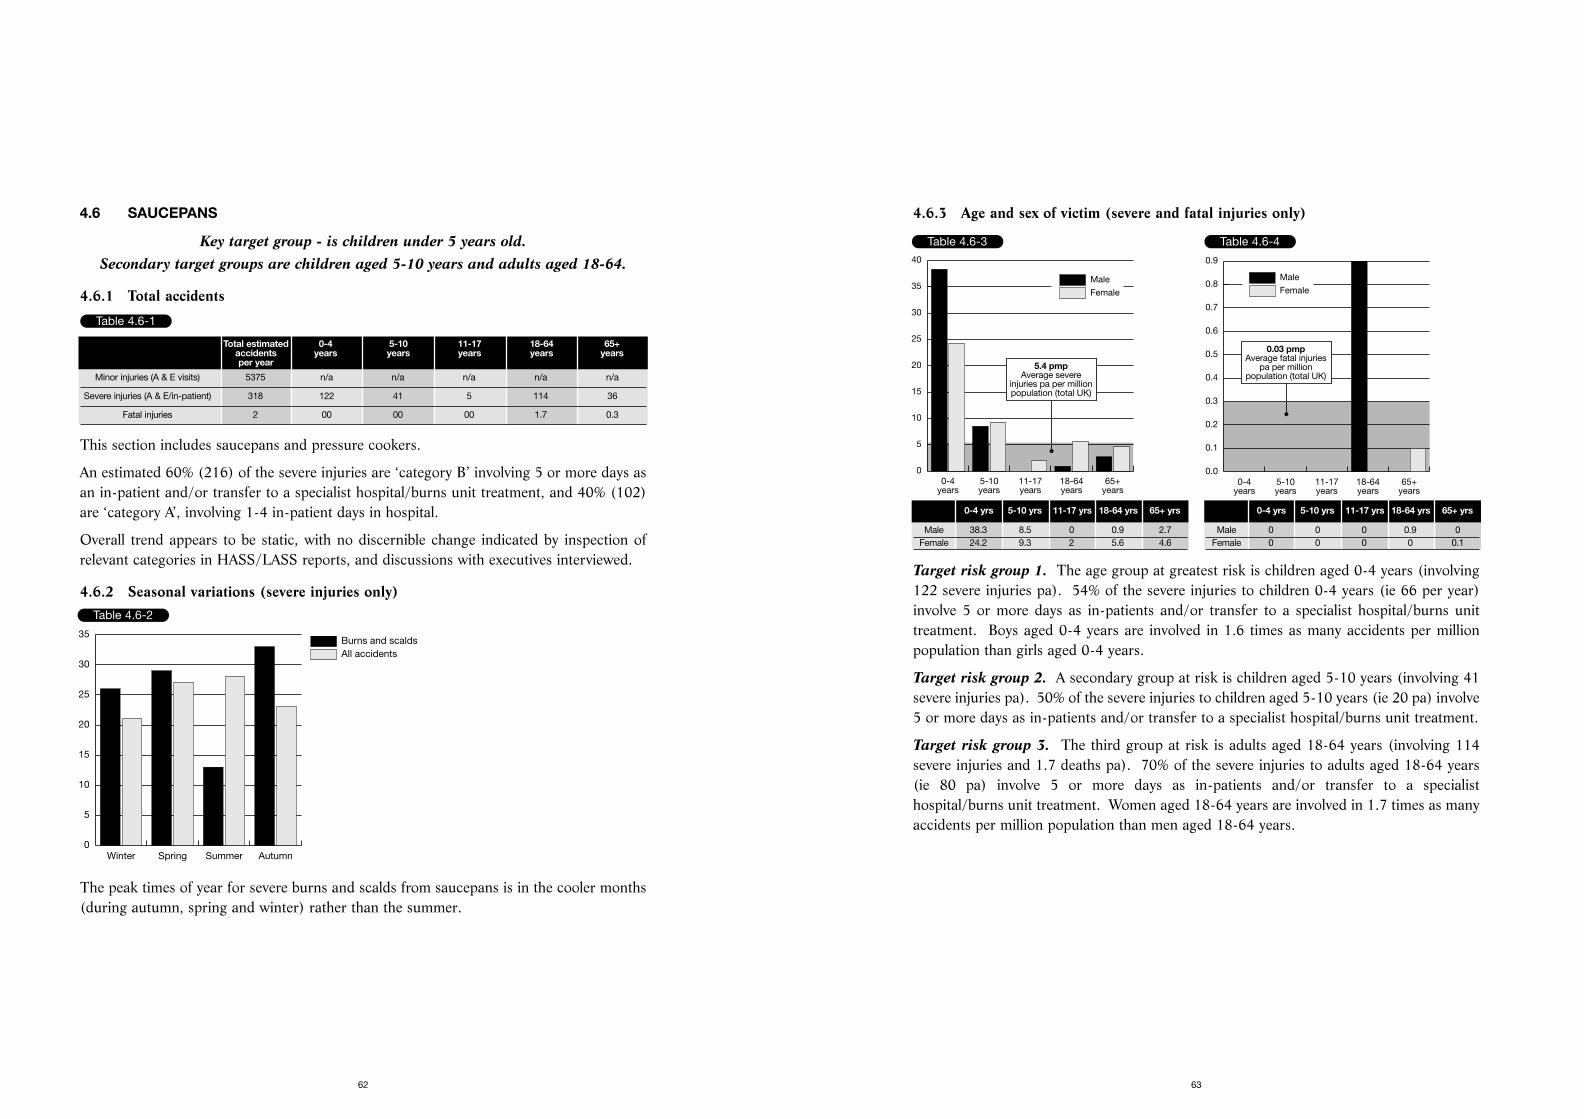
4.6.3 Age and sex of victim (severe and fatal injuries only)
Target risk group 1. The age group at greatest risk is children aged 0-4 years (involving122 severe injuries pa). 54% of the severe injuries to children 0-4 years (ie 66 per year)involve 5 or more days as in-patients and/or transfer to a specialist hospital/burns unittreatment. Boys aged 0-4 years are involved in 1.6 times as many accidents per millionpopulation than girls aged 0-4 years.
Target risk group 2. A secondary group at risk is children aged 5-10 years (involving 41severe injuries pa). 50% of the severe injuries to children aged 5-10 years (ie 20 pa) involve5 or more days as in-patients and/or transfer to a specialist hospital/burns unit treatment.
Target risk group 3. The third group at risk is adults aged 18-64 years (involving 114severe injuries and 1.7 deaths pa). 70% of the severe injuries to adults aged 18-64 years(ie 80 pa) involve 5 or more days as in-patients and/or transfer to a specialisthospital/burns unit treatment. Women aged 18-64 years are involved in 1.7 times as manyaccidents per million population than men aged 18-64 years.
63
4.6 SAUCEPANS
Key target group - is children under 5 years old. Secondary target groups are children aged 5-10 years and adults aged 18-64.
4.6.1 Total accidents
This section includes saucepans and pressure cookers.
An estimated 60% (216) of the severe injuries are ‘category B’ involving 5 or more days asan in-patient and/or transfer to a specialist hospital/burns unit treatment, and 40% (102)are ‘category A’, involving 1-4 in-patient days in hospital.
Overall trend appears to be static, with no discernible change indicated by inspection ofrelevant categories in HASS/LASS reports, and discussions with executives interviewed.
4.6.2 Seasonal variations (severe injuries only)
The peak times of year for severe burns and scalds from saucepans is in the cooler months(during autumn, spring and winter) rather than the summer.
62
Table 4.6-1
Total estimated 0-4 5-10 11-17 18-64 65+accidents years years years years yearsper year
Minor injuries (A & E visits) 5375 n/a n/a n/a n/a n/a
Severe injuries (A & E/in-patient) 318 122 41 5 114 36
Fatal injuries 2 00 00 00 1.7 0.3
Table 4.6-2
All accidentsBurns and scalds
Winter Spring Summer Autumn0
5
10
15
20
25
30
35
Table 4.6-3
Female
Male
0-4years
5-10years
11-17years
18-64years
65+years
0
5
10
15
20
25
30
35
40
5.4 pmpAverage severe
injuries pa per millionpopulation (total UK)
0-4 yrs 5-10 yrs 11-17 yrs 18-64 yrs 65+ yrs
Male 38.3 8.5 0 0.9 2.7Female 24.2 9.3 2 5.6 4.6
Table 4.6-4
Female
Male
0-4years
5-10years
11-17years
18-64years
65+years
0.0
0.1
0.2
0.3
0.4
0.5
0.6
0.7
0.8
0.9
0.03 pmpAverage fatal injuries
pa per millionpopulation (total UK)
0-4 yrs 5-10 yrs 11-17 yrs 18-64 yrs 65+ yrs
Male 0 0 0 0.9 0Female 0 0 0 0 0.1
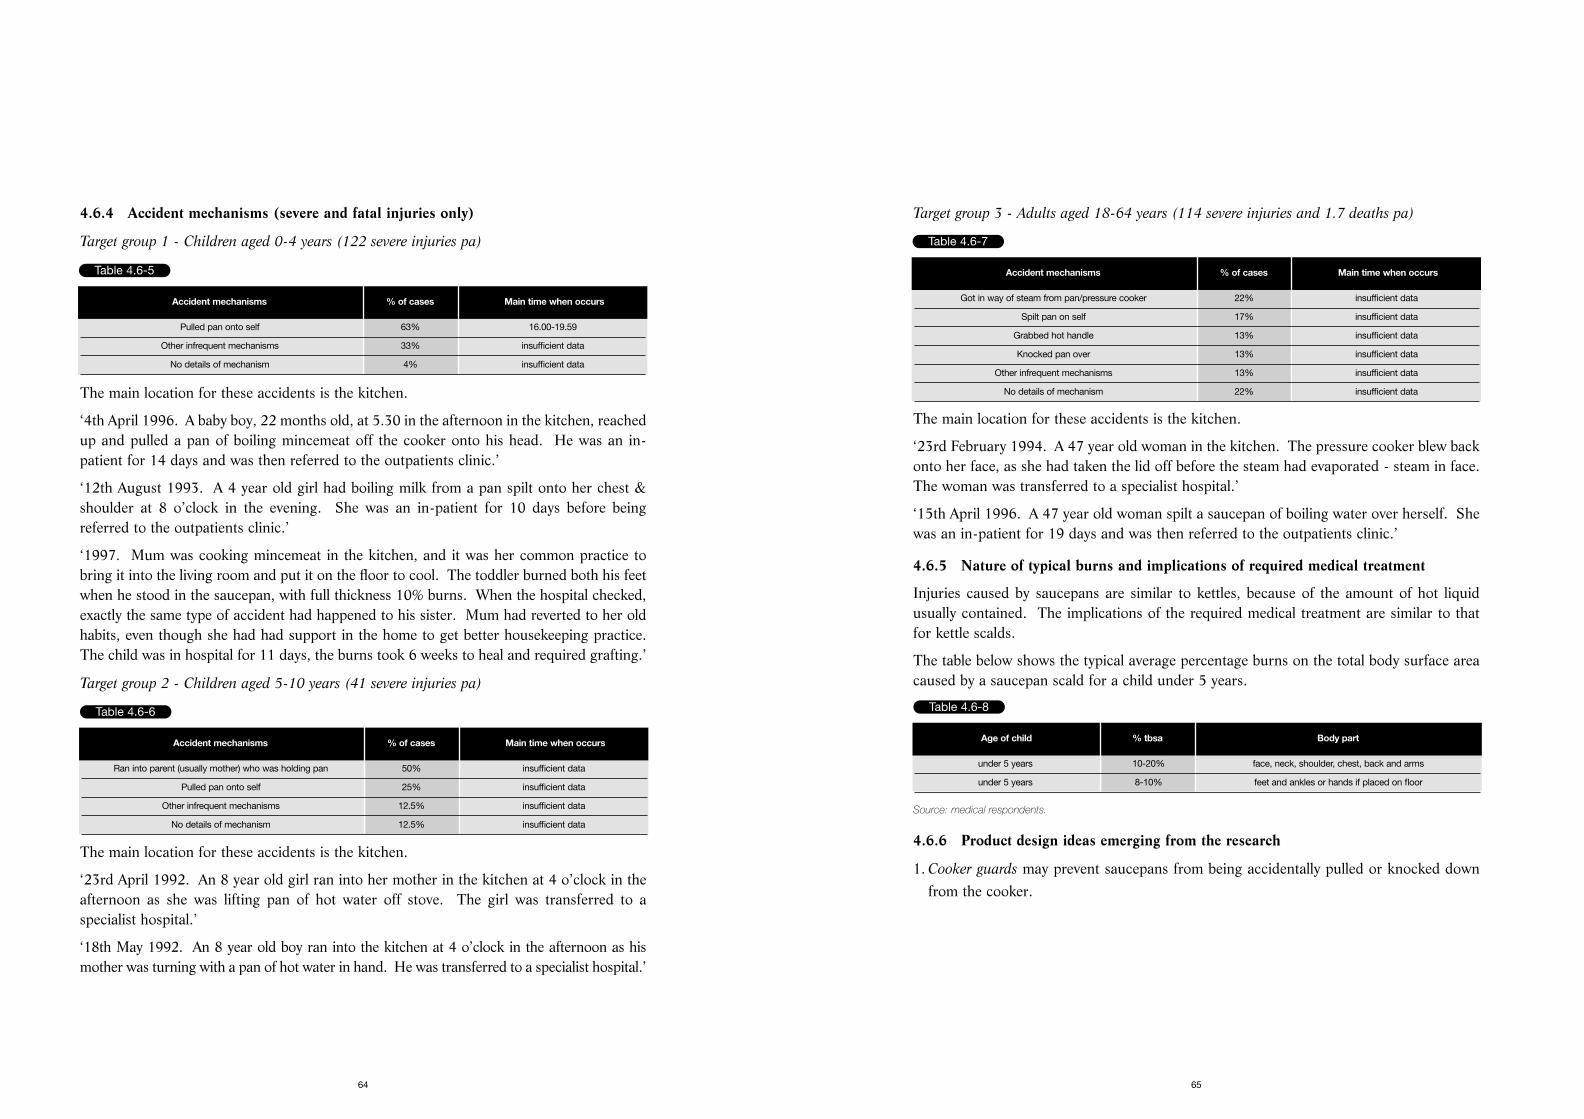
Target group 3 - Adults aged 18-64 years (114 severe injuries and 1.7 deaths pa)
The main location for these accidents is the kitchen.
‘23rd February 1994. A 47 year old woman in the kitchen. The pressure cooker blew backonto her face, as she had taken the lid off before the steam had evaporated - steam in face.The woman was transferred to a specialist hospital.’
‘15th April 1996. A 47 year old woman spilt a saucepan of boiling water over herself. Shewas an in-patient for 19 days and was then referred to the outpatients clinic.’
4.6.5 Nature of typical burns and implications of required medical treatment
Injuries caused by saucepans are similar to kettles, because of the amount of hot liquidusually contained. The implications of the required medical treatment are similar to thatfor kettle scalds.
The table below shows the typical average percentage burns on the total body surface areacaused by a saucepan scald for a child under 5 years.
Source: medical respondents.
4.6.6 Product design ideas emerging from the research
1. Cooker guards may prevent saucepans from being accidentally pulled or knocked downfrom the cooker.
65
4.6.4 Accident mechanisms (severe and fatal injuries only)
Target group 1 - Children aged 0-4 years (122 severe injuries pa)
The main location for these accidents is the kitchen.
‘4th April 1996. A baby boy, 22 months old, at 5.30 in the afternoon in the kitchen, reachedup and pulled a pan of boiling mincemeat off the cooker onto his head. He was an in-patient for 14 days and was then referred to the outpatients clinic.’
‘12th August 1993. A 4 year old girl had boiling milk from a pan spilt onto her chest &shoulder at 8 o’clock in the evening. She was an in-patient for 10 days before beingreferred to the outpatients clinic.’
‘1997. Mum was cooking mincemeat in the kitchen, and it was her common practice tobring it into the living room and put it on the floor to cool. The toddler burned both his feetwhen he stood in the saucepan, with full thickness 10% burns. When the hospital checked,exactly the same type of accident had happened to his sister. Mum had reverted to her oldhabits, even though she had had support in the home to get better housekeeping practice.The child was in hospital for 11 days, the burns took 6 weeks to heal and required grafting.’
Target group 2 - Children aged 5-10 years (41 severe injuries pa)
The main location for these accidents is the kitchen.
‘23rd April 1992. An 8 year old girl ran into her mother in the kitchen at 4 o’clock in theafternoon as she was lifting pan of hot water off stove. The girl was transferred to aspecialist hospital.’
‘18th May 1992. An 8 year old boy ran into the kitchen at 4 o’clock in the afternoon as hismother was turning with a pan of hot water in hand. He was transferred to a specialist hospital.’
64
Table 4.6-5
Accident mechanisms % of cases Main time when occurs
Pulled pan onto self 63% 16.00-19.59
Other infrequent mechanisms 33% insufficient data
No details of mechanism 4% insufficient data
Table 4.6-6
Accident mechanisms % of cases Main time when occurs
Ran into parent (usually mother) who was holding pan 50% insufficient data
Pulled pan onto self 25% insufficient data
Other infrequent mechanisms 12.5% insufficient data
No details of mechanism 12.5% insufficient data
Table 4.6-7
Accident mechanisms % of cases Main time when occurs
Got in way of steam from pan/pressure cooker 22% insufficient data
Spilt pan on self 17% insufficient data
Grabbed hot handle 13% insufficient data
Knocked pan over 13% insufficient data
Other infrequent mechanisms 13% insufficient data
No details of mechanism 22% insufficient data
Table 4.6-8
Age of child % tbsa Body part
under 5 years 10-20% face, neck, shoulder, chest, back and arms
under 5 years 8-10% feet and ankles or hands if placed on floor
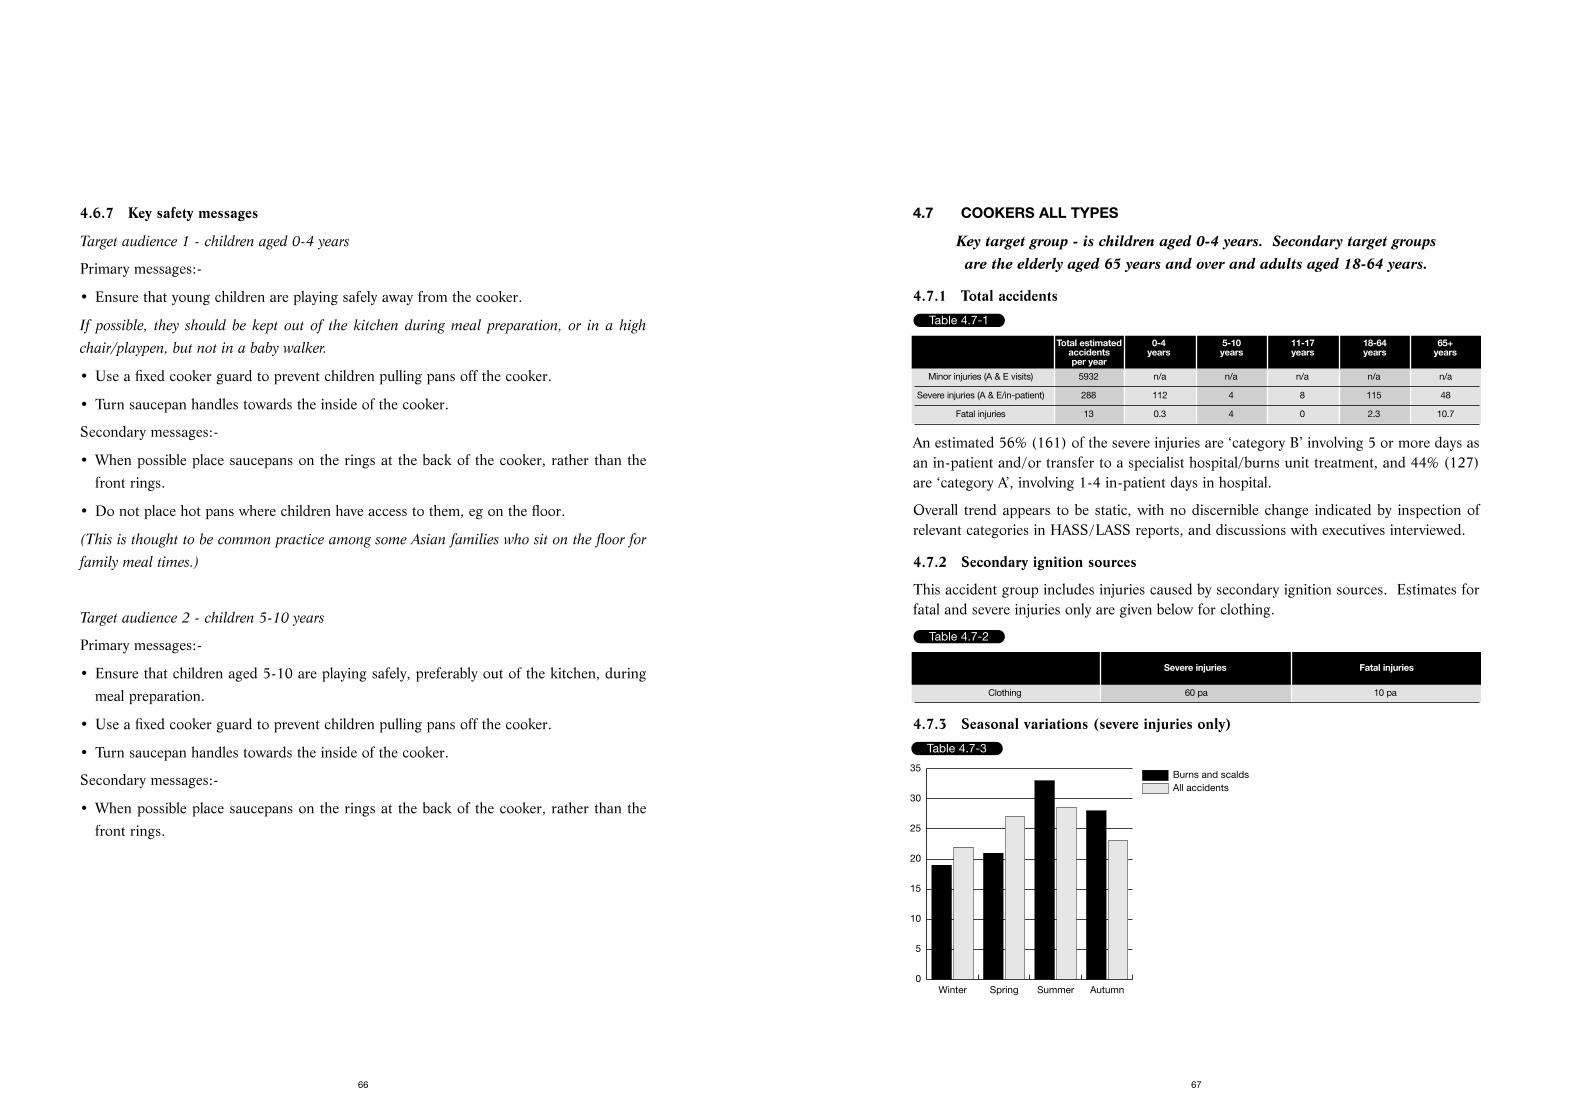
4.7 COOKERS ALL TYPES
Key target group - is children aged 0-4 years. Secondary target groups are the elderly aged 65 years and over and adults aged 18-64 years.
4.7.1 Total accidents
An estimated 56% (161) of the severe injuries are ‘category B’ involving 5 or more days asan in-patient and/or transfer to a specialist hospital/burns unit treatment, and 44% (127)are ‘category A’, involving 1-4 in-patient days in hospital.
Overall trend appears to be static, with no discernible change indicated by inspection ofrelevant categories in HASS/LASS reports, and discussions with executives interviewed.
4.7.2 Secondary ignition sources
This accident group includes injuries caused by secondary ignition sources. Estimates forfatal and severe injuries only are given below for clothing.
4.7.3 Seasonal variations (severe injuries only)
67
4.6.7 Key safety messages
Target audience 1 - children aged 0-4 years
Primary messages:-
• Ensure that young children are playing safely away from the cooker.
If possible, they should be kept out of the kitchen during meal preparation, or in a high
chair/playpen, but not in a baby walker.
• Use a fixed cooker guard to prevent children pulling pans off the cooker.
• Turn saucepan handles towards the inside of the cooker.
Secondary messages:-
• When possible place saucepans on the rings at the back of the cooker, rather than thefront rings.
• Do not place hot pans where children have access to them, eg on the floor.
(This is thought to be common practice among some Asian families who sit on the floor for
family meal times.)
Target audience 2 - children 5-10 years
Primary messages:-
• Ensure that children aged 5-10 are playing safely, preferably out of the kitchen, duringmeal preparation.
• Use a fixed cooker guard to prevent children pulling pans off the cooker.
• Turn saucepan handles towards the inside of the cooker.
Secondary messages:-
• When possible place saucepans on the rings at the back of the cooker, rather than thefront rings.
66
Table 4.7-1
Total estimated 0-4 5-10 11-17 18-64 65+accidents years years years years yearsper year
Minor injuries (A & E visits) 5932 n/a n/a n/a n/a n/a
Severe injuries (A & E/in-patient) 288 112 4 8 115 48
Fatal injuries 13 0.3 4 0 2.3 10.7
Table 4.7-2
Severe injuries Fatal injuries
Clothing 60 pa 10 pa
Table 4.7-3
All accidentsBurns and scalds
Winter Spring Summer Autumn0
5
10
15
20
25
30
35
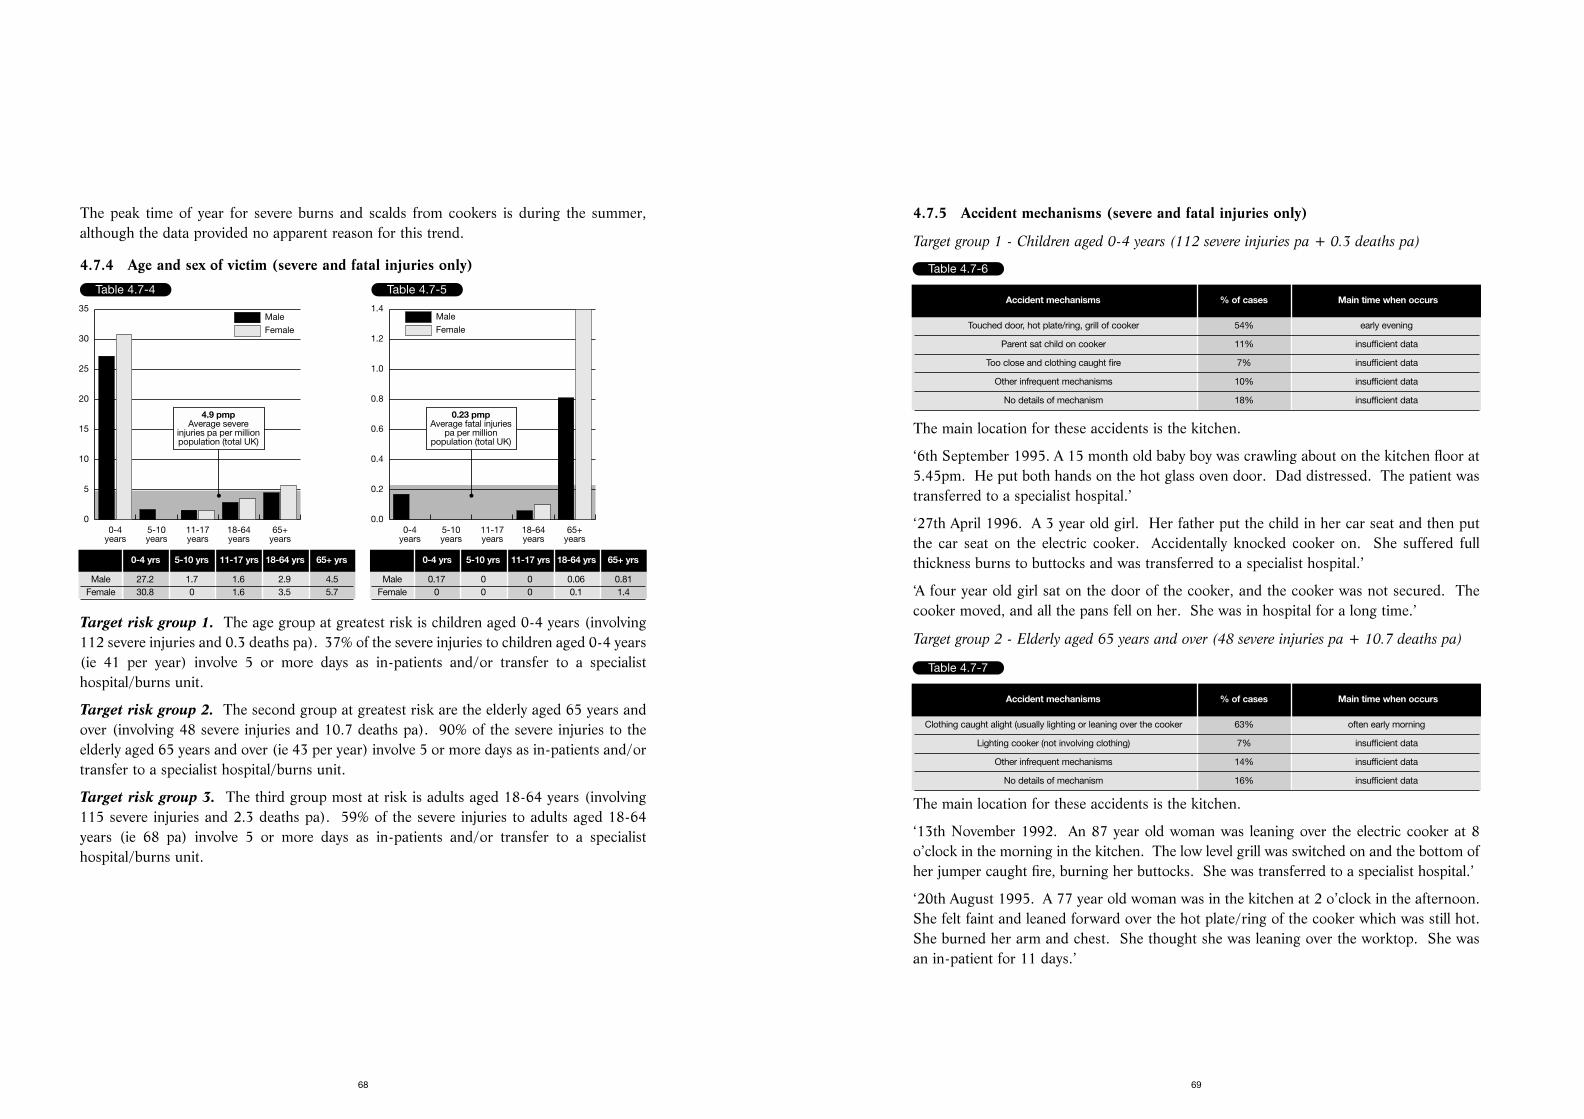
4.7.5 Accident mechanisms (severe and fatal injuries only)
Target group 1 - Children aged 0-4 years (112 severe injuries pa + 0.3 deaths pa)
The main location for these accidents is the kitchen.
‘6th September 1995. A 15 month old baby boy was crawling about on the kitchen floor at5.45pm. He put both hands on the hot glass oven door. Dad distressed. The patient wastransferred to a specialist hospital.’
‘27th April 1996. A 3 year old girl. Her father put the child in her car seat and then putthe car seat on the electric cooker. Accidentally knocked cooker on. She suffered fullthickness burns to buttocks and was transferred to a specialist hospital.’
‘A four year old girl sat on the door of the cooker, and the cooker was not secured. Thecooker moved, and all the pans fell on her. She was in hospital for a long time.’
Target group 2 - Elderly aged 65 years and over (48 severe injuries pa + 10.7 deaths pa)
The main location for these accidents is the kitchen.
‘13th November 1992. An 87 year old woman was leaning over the electric cooker at 8o’clock in the morning in the kitchen. The low level grill was switched on and the bottom ofher jumper caught fire, burning her buttocks. She was transferred to a specialist hospital.’
‘20th August 1995. A 77 year old woman was in the kitchen at 2 o’clock in the afternoon.She felt faint and leaned forward over the hot plate/ring of the cooker which was still hot.She burned her arm and chest. She thought she was leaning over the worktop. She wasan in-patient for 11 days.’
69
The peak time of year for severe burns and scalds from cookers is during the summer,although the data provided no apparent reason for this trend.
4.7.4 Age and sex of victim (severe and fatal injuries only)
Target risk group 1. The age group at greatest risk is children aged 0-4 years (involving112 severe injuries and 0.3 deaths pa). 37% of the severe injuries to children aged 0-4 years(ie 41 per year) involve 5 or more days as in-patients and/or transfer to a specialisthospital/burns unit.
Target risk group 2. The second group at greatest risk are the elderly aged 65 years andover (involving 48 severe injuries and 10.7 deaths pa). 90% of the severe injuries to theelderly aged 65 years and over (ie 43 per year) involve 5 or more days as in-patients and/ortransfer to a specialist hospital/burns unit.
Target risk group 3. The third group most at risk is adults aged 18-64 years (involving115 severe injuries and 2.3 deaths pa). 59% of the severe injuries to adults aged 18-64years (ie 68 pa) involve 5 or more days as in-patients and/or transfer to a specialisthospital/burns unit.
68
Table 4.7-4
Female
Male
0-4years
5-10years
11-17years
18-64years
65+years
0
5
10
15
20
25
30
35
4.9 pmpAverage severe
injuries pa per millionpopulation (total UK)
0-4 yrs 5-10 yrs 11-17 yrs 18-64 yrs 65+ yrs
Male 27.2 1.7 1.6 2.9 4.5Female 30.8 0 1.6 3.5 5.7
Table 4.7-5
Female
Male
0-4years
5-10years
11-17years
18-64years
65+years
0.0
0.2
0.4
0.6
0.8
1.0
1.2
1.4
0.23 pmpAverage fatal injuries
pa per millionpopulation (total UK)
0-4 yrs 5-10 yrs 11-17 yrs 18-64 yrs 65+ yrs
Male 0.17 0 0 0.06 0.81Female 0 0 0 0.1 1.4
Table 4.7-6
Accident mechanisms % of cases Main time when occurs
Touched door, hot plate/ring, grill of cooker 54% early evening
Parent sat child on cooker 11% insufficient data
Too close and clothing caught fire 7% insufficient data
Other infrequent mechanisms 10% insufficient data
No details of mechanism 18% insufficient data
Table 4.7-7
Accident mechanisms % of cases Main time when occurs
Clothing caught alight (usually lighting or leaning over the cooker 63% often early morning
Lighting cooker (not involving clothing) 7% insufficient data
Other infrequent mechanisms 14% insufficient data
No details of mechanism 16% insufficient data
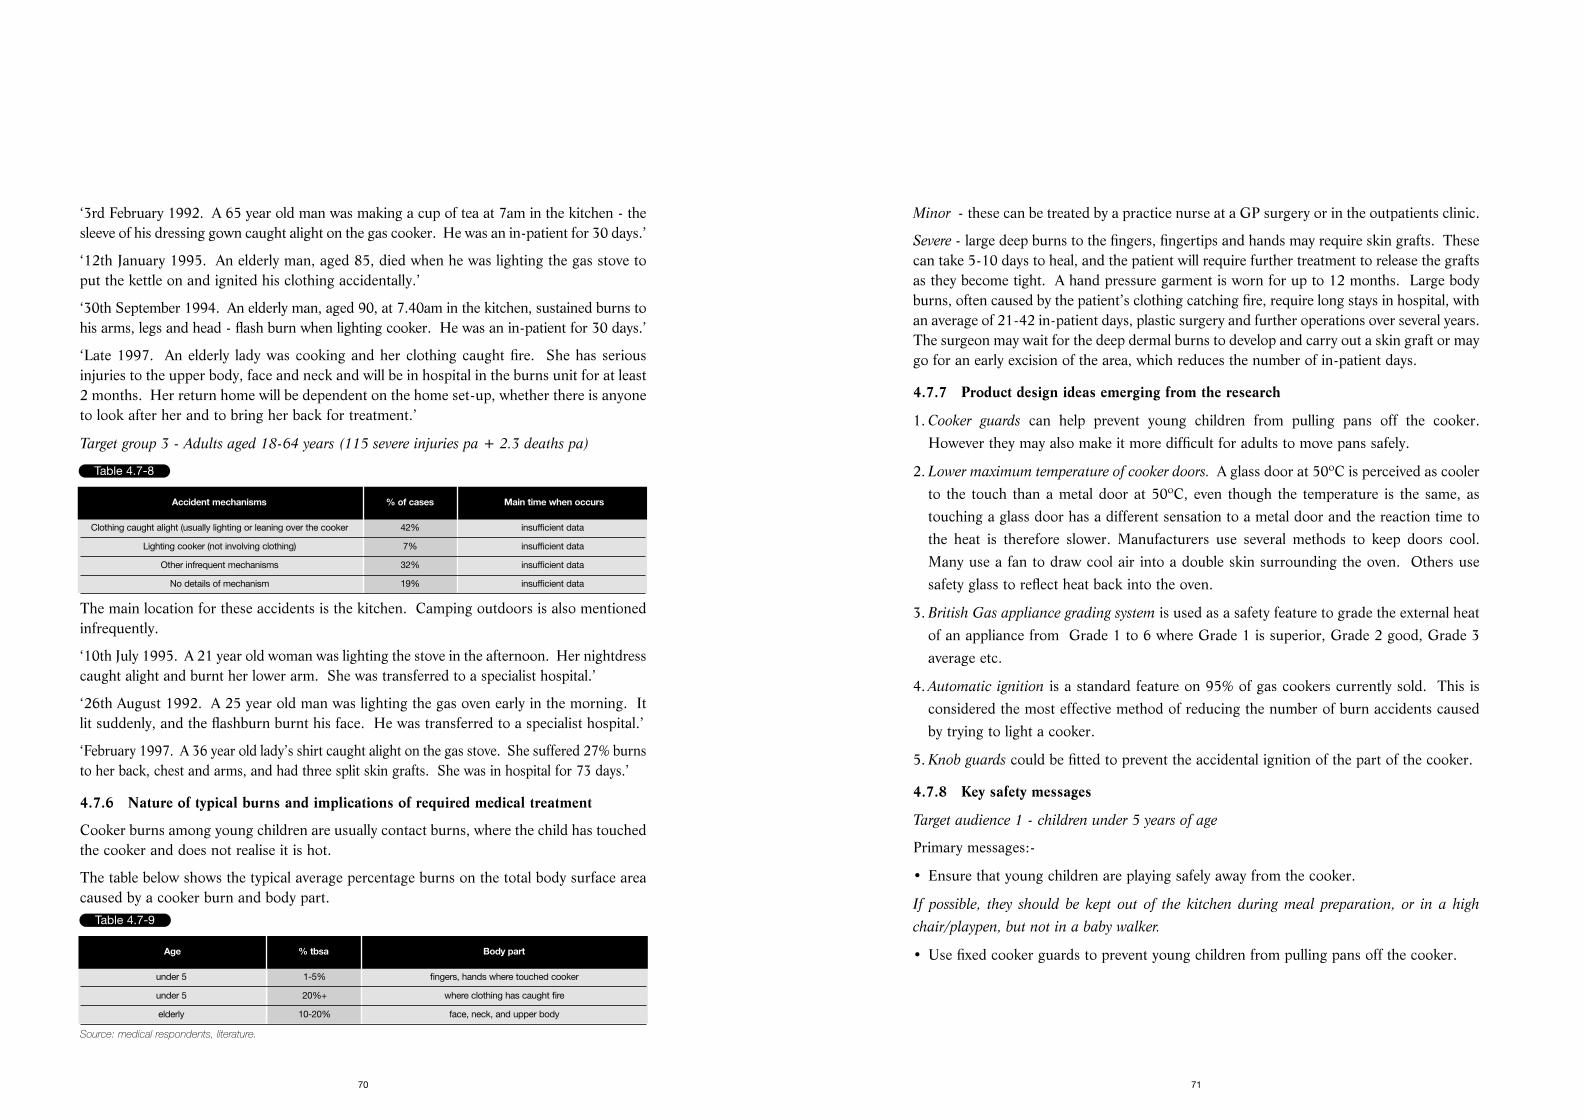
Minor - these can be treated by a practice nurse at a GP surgery or in the outpatients clinic.
Severe - large deep burns to the fingers, fingertips and hands may require skin grafts. Thesecan take 5-10 days to heal, and the patient will require further treatment to release the graftsas they become tight. A hand pressure garment is worn for up to 12 months. Large bodyburns, often caused by the patient’s clothing catching fire, require long stays in hospital, withan average of 21-42 in-patient days, plastic surgery and further operations over several years.The surgeon may wait for the deep dermal burns to develop and carry out a skin graft or maygo for an early excision of the area, which reduces the number of in-patient days.
4.7.7 Product design ideas emerging from the research
1. Cooker guards can help prevent young children from pulling pans off the cooker.However they may also make it more difficult for adults to move pans safely.
2. Lower maximum temperature of cooker doors. A glass door at 50ºC is perceived as coolerto the touch than a metal door at 50ºC, even though the temperature is the same, astouching a glass door has a different sensation to a metal door and the reaction time tothe heat is therefore slower. Manufacturers use several methods to keep doors cool.Many use a fan to draw cool air into a double skin surrounding the oven. Others usesafety glass to reflect heat back into the oven.
3. British Gas appliance grading system is used as a safety feature to grade the external heatof an appliance from Grade 1 to 6 where Grade 1 is superior, Grade 2 good, Grade 3average etc.
4. Automatic ignition is a standard feature on 95% of gas cookers currently sold. This isconsidered the most effective method of reducing the number of burn accidents causedby trying to light a cooker.
5. Knob guards could be fitted to prevent the accidental ignition of the part of the cooker.
4.7.8 Key safety messages
Target audience 1 - children under 5 years of age
Primary messages:-
• Ensure that young children are playing safely away from the cooker.
If possible, they should be kept out of the kitchen during meal preparation, or in a high
chair/playpen, but not in a baby walker.
• Use fixed cooker guards to prevent young children from pulling pans off the cooker.
71
‘3rd February 1992. A 65 year old man was making a cup of tea at 7am in the kitchen - thesleeve of his dressing gown caught alight on the gas cooker. He was an in-patient for 30 days.’
‘12th January 1995. An elderly man, aged 85, died when he was lighting the gas stove toput the kettle on and ignited his clothing accidentally.’
‘30th September 1994. An elderly man, aged 90, at 7.40am in the kitchen, sustained burns tohis arms, legs and head - flash burn when lighting cooker. He was an in-patient for 30 days.’
‘Late 1997. An elderly lady was cooking and her clothing caught fire. She has seriousinjuries to the upper body, face and neck and will be in hospital in the burns unit for at least2 months. Her return home will be dependent on the home set-up, whether there is anyoneto look after her and to bring her back for treatment.’
Target group 3 - Adults aged 18-64 years (115 severe injuries pa + 2.3 deaths pa)
The main location for these accidents is the kitchen. Camping outdoors is also mentionedinfrequently.
‘10th July 1995. A 21 year old woman was lighting the stove in the afternoon. Her nightdresscaught alight and burnt her lower arm. She was transferred to a specialist hospital.’
‘26th August 1992. A 25 year old man was lighting the gas oven early in the morning. Itlit suddenly, and the flashburn burnt his face. He was transferred to a specialist hospital.’
‘February 1997. A 36 year old lady’s shirt caught alight on the gas stove. She suffered 27% burnsto her back, chest and arms, and had three split skin grafts. She was in hospital for 73 days.’
4.7.6 Nature of typical burns and implications of required medical treatment
Cooker burns among young children are usually contact burns, where the child has touchedthe cooker and does not realise it is hot.
The table below shows the typical average percentage burns on the total body surface areacaused by a cooker burn and body part.
Source: medical respondents, literature.
70
Table 4.7-8
Accident mechanisms % of cases Main time when occurs
Clothing caught alight (usually lighting or leaning over the cooker 42% insufficient data
Lighting cooker (not involving clothing) 7% insufficient data
Other infrequent mechanisms 32% insufficient data
No details of mechanism 19% insufficient data
Table 4.7-9
Age % tbsa Body part
under 5 1-5% fingers, hands where touched cooker
under 5 20%+ where clothing has caught fire
elderly 10-20% face, neck, and upper body
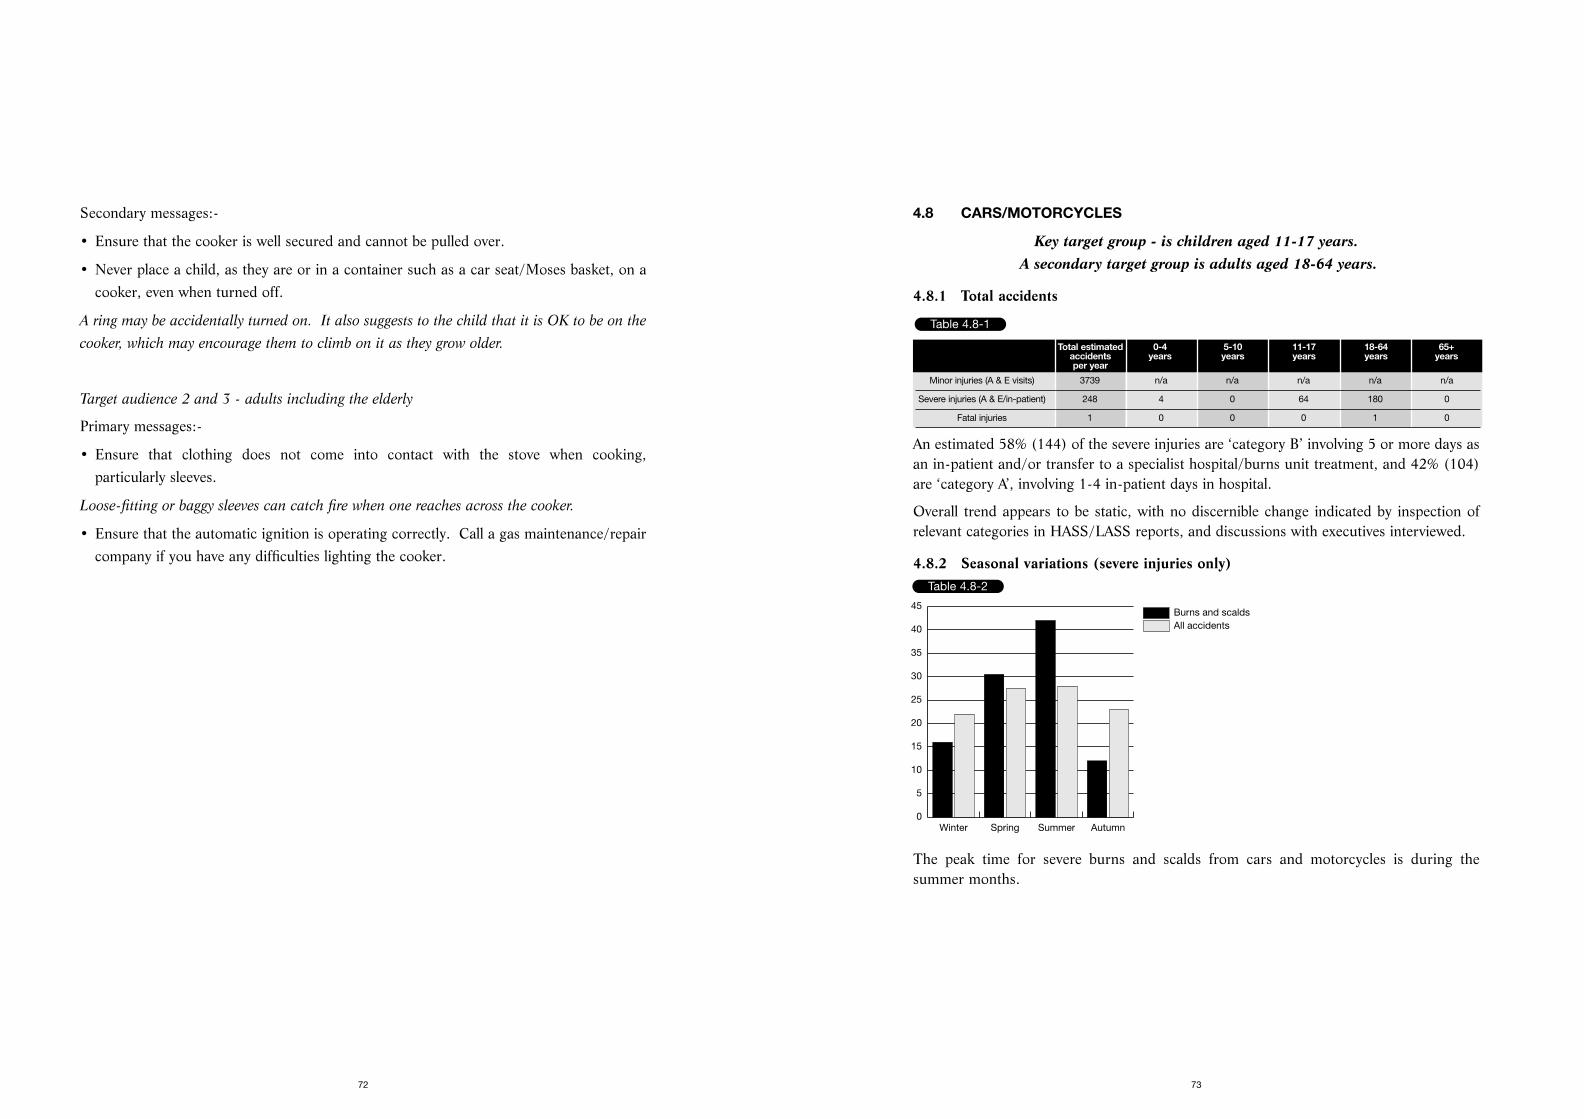
4.8 CARS/MOTORCYCLES
Key target group - is children aged 11-17 years. A secondary target group is adults aged 18-64 years.
4.8.1 Total accidents
An estimated 58% (144) of the severe injuries are ‘category B’ involving 5 or more days asan in-patient and/or transfer to a specialist hospital/burns unit treatment, and 42% (104)are ‘category A’, involving 1-4 in-patient days in hospital.
Overall trend appears to be static, with no discernible change indicated by inspection ofrelevant categories in HASS/LASS reports, and discussions with executives interviewed.
4.8.2 Seasonal variations (severe injuries only)
The peak time for severe burns and scalds from cars and motorcycles is during thesummer months.
73
Secondary messages:-
• Ensure that the cooker is well secured and cannot be pulled over.
• Never place a child, as they are or in a container such as a car seat/Moses basket, on acooker, even when turned off.
A ring may be accidentally turned on. It also suggests to the child that it is OK to be on the
cooker, which may encourage them to climb on it as they grow older.
Target audience 2 and 3 - adults including the elderly
Primary messages:-
• Ensure that clothing does not come into contact with the stove when cooking,particularly sleeves.
Loose-fitting or baggy sleeves can catch fire when one reaches across the cooker.
• Ensure that the automatic ignition is operating correctly. Call a gas maintenance/repaircompany if you have any difficulties lighting the cooker.
72
Table 4.8-1
Total estimated 0-4 5-10 11-17 18-64 65+accidents years years years years yearsper year
Minor injuries (A & E visits) 3739 n/a n/a n/a n/a n/a
Severe injuries (A & E/in-patient) 248 4 0 64 180 0
Fatal injuries 1 0 0 0 1 0
Table 4.8-2
All accidentsBurns and scalds
Winter Spring Summer Autumn0
5
10
15
20
25
30
35
40
45
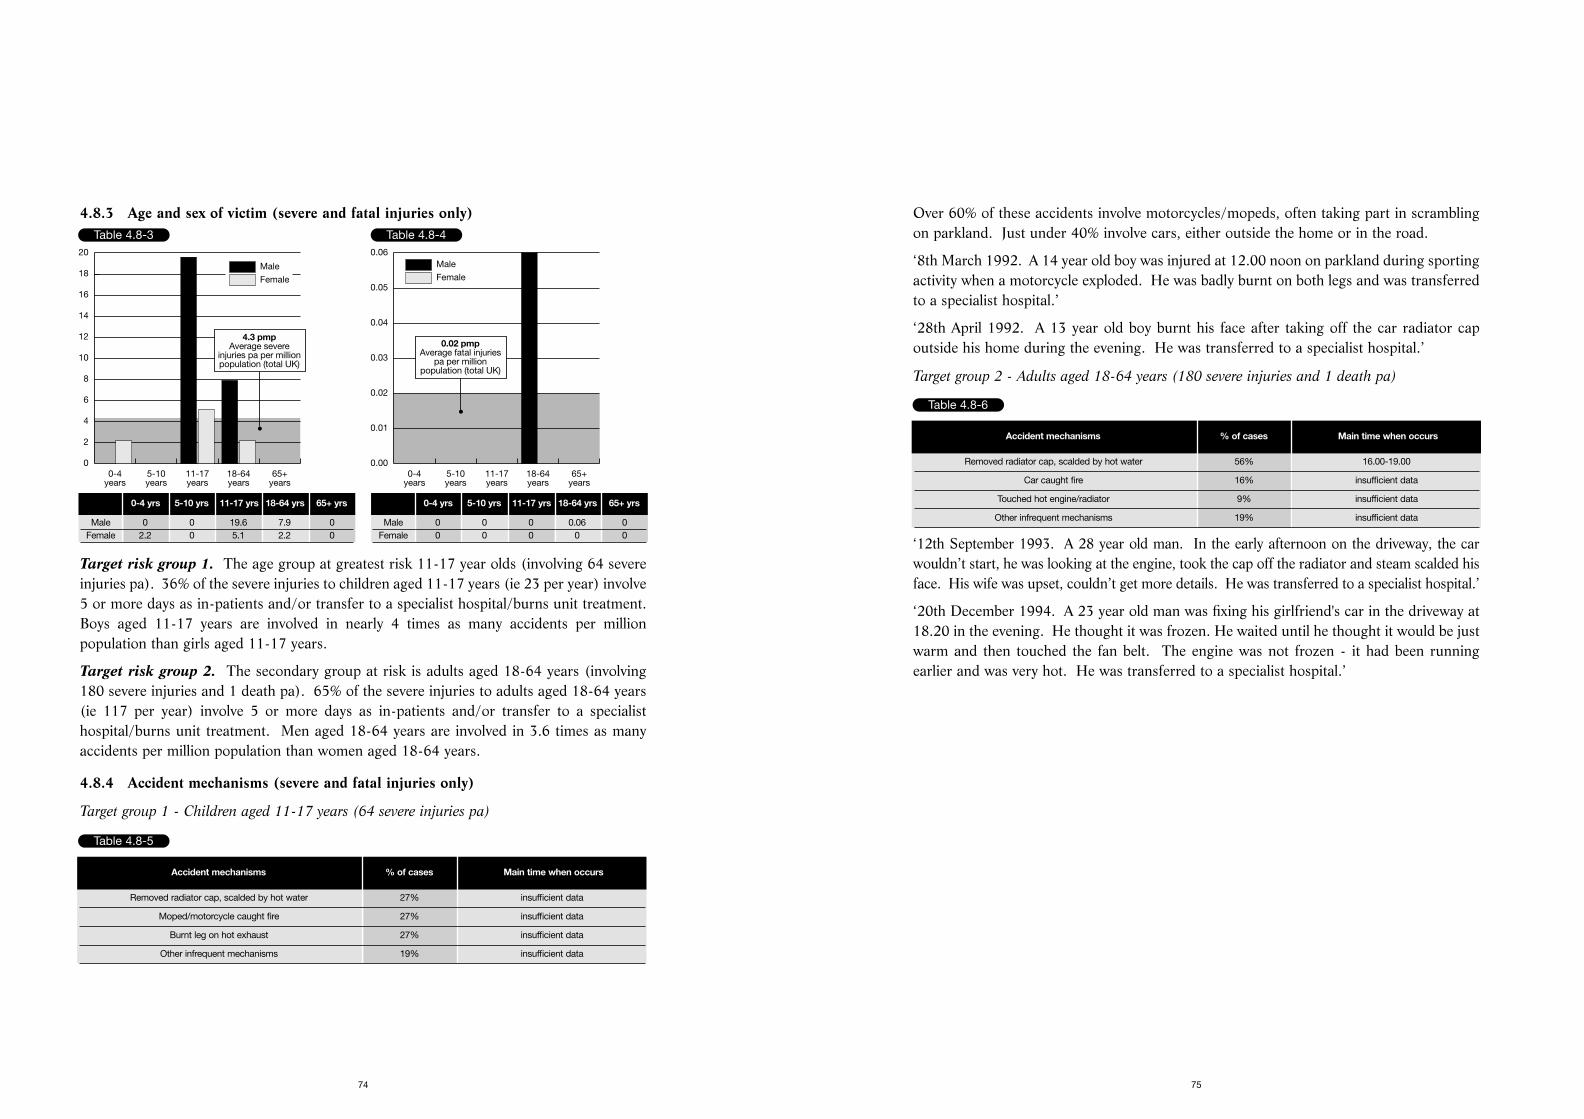
Over 60% of these accidents involve motorcycles/mopeds, often taking part in scramblingon parkland. Just under 40% involve cars, either outside the home or in the road.
‘8th March 1992. A 14 year old boy was injured at 12.00 noon on parkland during sportingactivity when a motorcycle exploded. He was badly burnt on both legs and was transferredto a specialist hospital.’
‘28th April 1992. A 13 year old boy burnt his face after taking off the car radiator capoutside his home during the evening. He was transferred to a specialist hospital.’
Target group 2 - Adults aged 18-64 years (180 severe injuries and 1 death pa)
‘12th September 1993. A 28 year old man. In the early afternoon on the driveway, the carwouldn’t start, he was looking at the engine, took the cap off the radiator and steam scalded hisface. His wife was upset, couldn’t get more details. He was transferred to a specialist hospital.’
‘20th December 1994. A 23 year old man was fixing his girlfriend's car in the driveway at18.20 in the evening. He thought it was frozen. He waited until he thought it would be justwarm and then touched the fan belt. The engine was not frozen - it had been runningearlier and was very hot. He was transferred to a specialist hospital.’
75
4.8.3 Age and sex of victim (severe and fatal injuries only)
Target risk group 1. The age group at greatest risk 11-17 year olds (involving 64 severeinjuries pa). 36% of the severe injuries to children aged 11-17 years (ie 23 per year) involve5 or more days as in-patients and/or transfer to a specialist hospital/burns unit treatment.Boys aged 11-17 years are involved in nearly 4 times as many accidents per millionpopulation than girls aged 11-17 years.
Target risk group 2. The secondary group at risk is adults aged 18-64 years (involving180 severe injuries and 1 death pa). 65% of the severe injuries to adults aged 18-64 years(ie 117 per year) involve 5 or more days as in-patients and/or transfer to a specialisthospital/burns unit treatment. Men aged 18-64 years are involved in 3.6 times as manyaccidents per million population than women aged 18-64 years.
4.8.4 Accident mechanisms (severe and fatal injuries only)
Target group 1 - Children aged 11-17 years (64 severe injuries pa)
74
Table 4.8-3
Female
Male
0-4years
5-10years
11-17years
18-64years
65+years
0
2
4
6
8
10
12
14
16
18
20
4.3 pmpAverage severe
injuries pa per millionpopulation (total UK)
0-4 yrs 5-10 yrs 11-17 yrs 18-64 yrs 65+ yrs
Male 0 0 19.6 7.9 0Female 2.2 0 5.1 2.2 0
Table 4.8-4
Female
Male
0-4years
5-10years
11-17years
18-64years
65+years
0.00
0.01
0.02
0.03
0.04
0.05
0.06
0.02 pmpAverage fatal injuries
pa per millionpopulation (total UK)
0-4 yrs 5-10 yrs 11-17 yrs 18-64 yrs 65+ yrs
Male 0 0 0 0.06 0Female 0 0 0 0 0
Table 4.8-5
Accident mechanisms % of cases Main time when occurs
Removed radiator cap, scalded by hot water 27% insufficient data
Moped/motorcycle caught fire 27% insufficient data
Burnt leg on hot exhaust 27% insufficient data
Other infrequent mechanisms 19% insufficient data
Table 4.8-6
Accident mechanisms % of cases Main time when occurs
Removed radiator cap, scalded by hot water 56% 16.00-19.00
Car caught fire 16% insufficient data
Touched hot engine/radiator 9% insufficient data
Other infrequent mechanisms 19% insufficient data
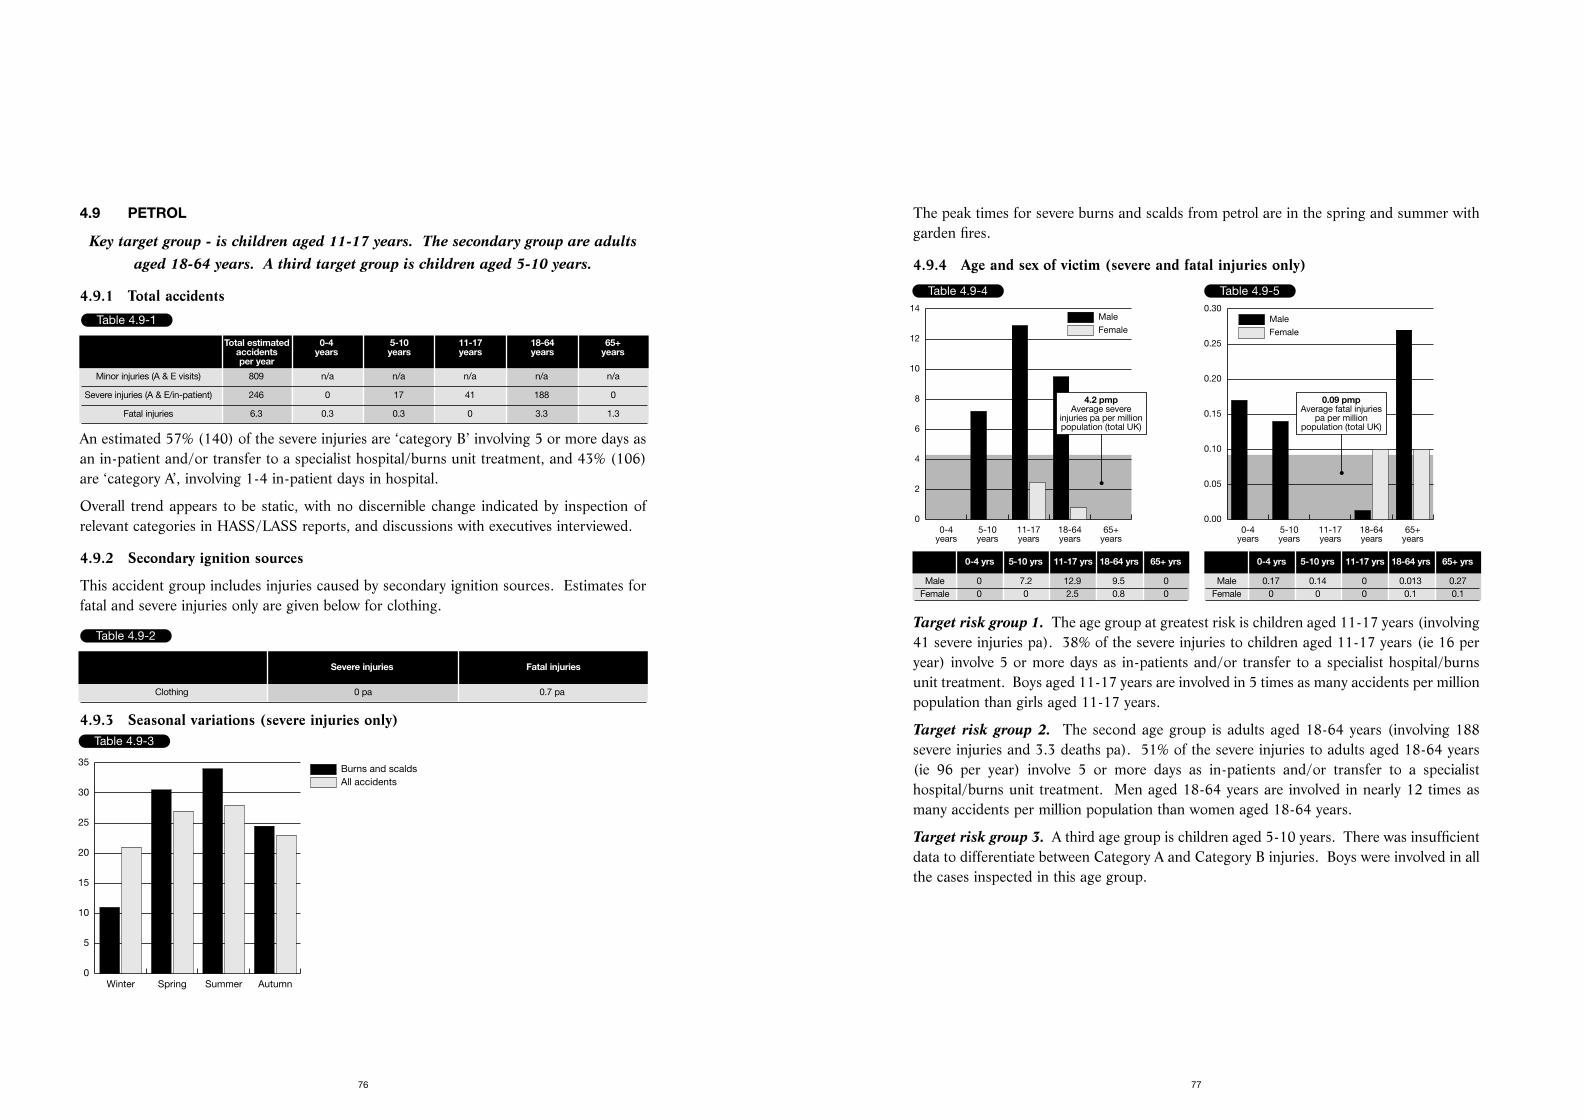
The peak times for severe burns and scalds from petrol are in the spring and summer withgarden fires.
4.9.4 Age and sex of victim (severe and fatal injuries only)
Target risk group 1. The age group at greatest risk is children aged 11-17 years (involving41 severe injuries pa). 38% of the severe injuries to children aged 11-17 years (ie 16 peryear) involve 5 or more days as in-patients and/or transfer to a specialist hospital/burnsunit treatment. Boys aged 11-17 years are involved in 5 times as many accidents per millionpopulation than girls aged 11-17 years.
Target risk group 2. The second age group is adults aged 18-64 years (involving 188severe injuries and 3.3 deaths pa). 51% of the severe injuries to adults aged 18-64 years(ie 96 per year) involve 5 or more days as in-patients and/or transfer to a specialisthospital/burns unit treatment. Men aged 18-64 years are involved in nearly 12 times asmany accidents per million population than women aged 18-64 years.
Target risk group 3. A third age group is children aged 5-10 years. There was insufficientdata to differentiate between Category A and Category B injuries. Boys were involved in allthe cases inspected in this age group.
77
4.9 PETROL
Key target group - is children aged 11-17 years. The secondary group are adultsaged 18-64 years. A third target group is children aged 5-10 years.
4.9.1 Total accidents
An estimated 57% (140) of the severe injuries are ‘category B’ involving 5 or more days asan in-patient and/or transfer to a specialist hospital/burns unit treatment, and 43% (106)are ‘category A’, involving 1-4 in-patient days in hospital.
Overall trend appears to be static, with no discernible change indicated by inspection ofrelevant categories in HASS/LASS reports, and discussions with executives interviewed.
4.9.2 Secondary ignition sources
This accident group includes injuries caused by secondary ignition sources. Estimates forfatal and severe injuries only are given below for clothing.
4.9.3 Seasonal variations (severe injuries only)
76
Table 4.9-1
Total estimated 0-4 5-10 11-17 18-64 65+accidents years years years years yearsper year
Minor injuries (A & E visits) 809 n/a n/a n/a n/a n/a
Severe injuries (A & E/in-patient) 246 0 17 41 188 0
Fatal injuries 6.3 0.3 0.3 0 3.3 1.3
Table 4.9-2
Severe injuries Fatal injuries
Clothing 0 pa 0.7 pa
Table 4.9-3
All accidentsBurns and scalds
Winter Spring Summer Autumn0
5
10
15
20
25
30
35
Table 4.9-4
Female
Male
0-4years
5-10years
11-17years
18-64years
65+years
0
2
4
6
8
10
12
14
4.2 pmpAverage severe
injuries pa per millionpopulation (total UK)
0-4 yrs 5-10 yrs 11-17 yrs 18-64 yrs 65+ yrs
Male 0 7.2 12.9 9.5 0Female 0 0 2.5 0.8 0
Table 4.9-5
Female
Male
0-4years
5-10years
11-17years
18-64years
65+years
0.00
0.05
0.10
0.15
0.20
0.25
0.30
0.09 pmpAverage fatal injuries
pa per millionpopulation (total UK)
0-4 yrs 5-10 yrs 11-17 yrs 18-64 yrs 65+ yrs
Male 0.17 0.14 0 0.013 0.27Female 0 0 0 0.1 0.1
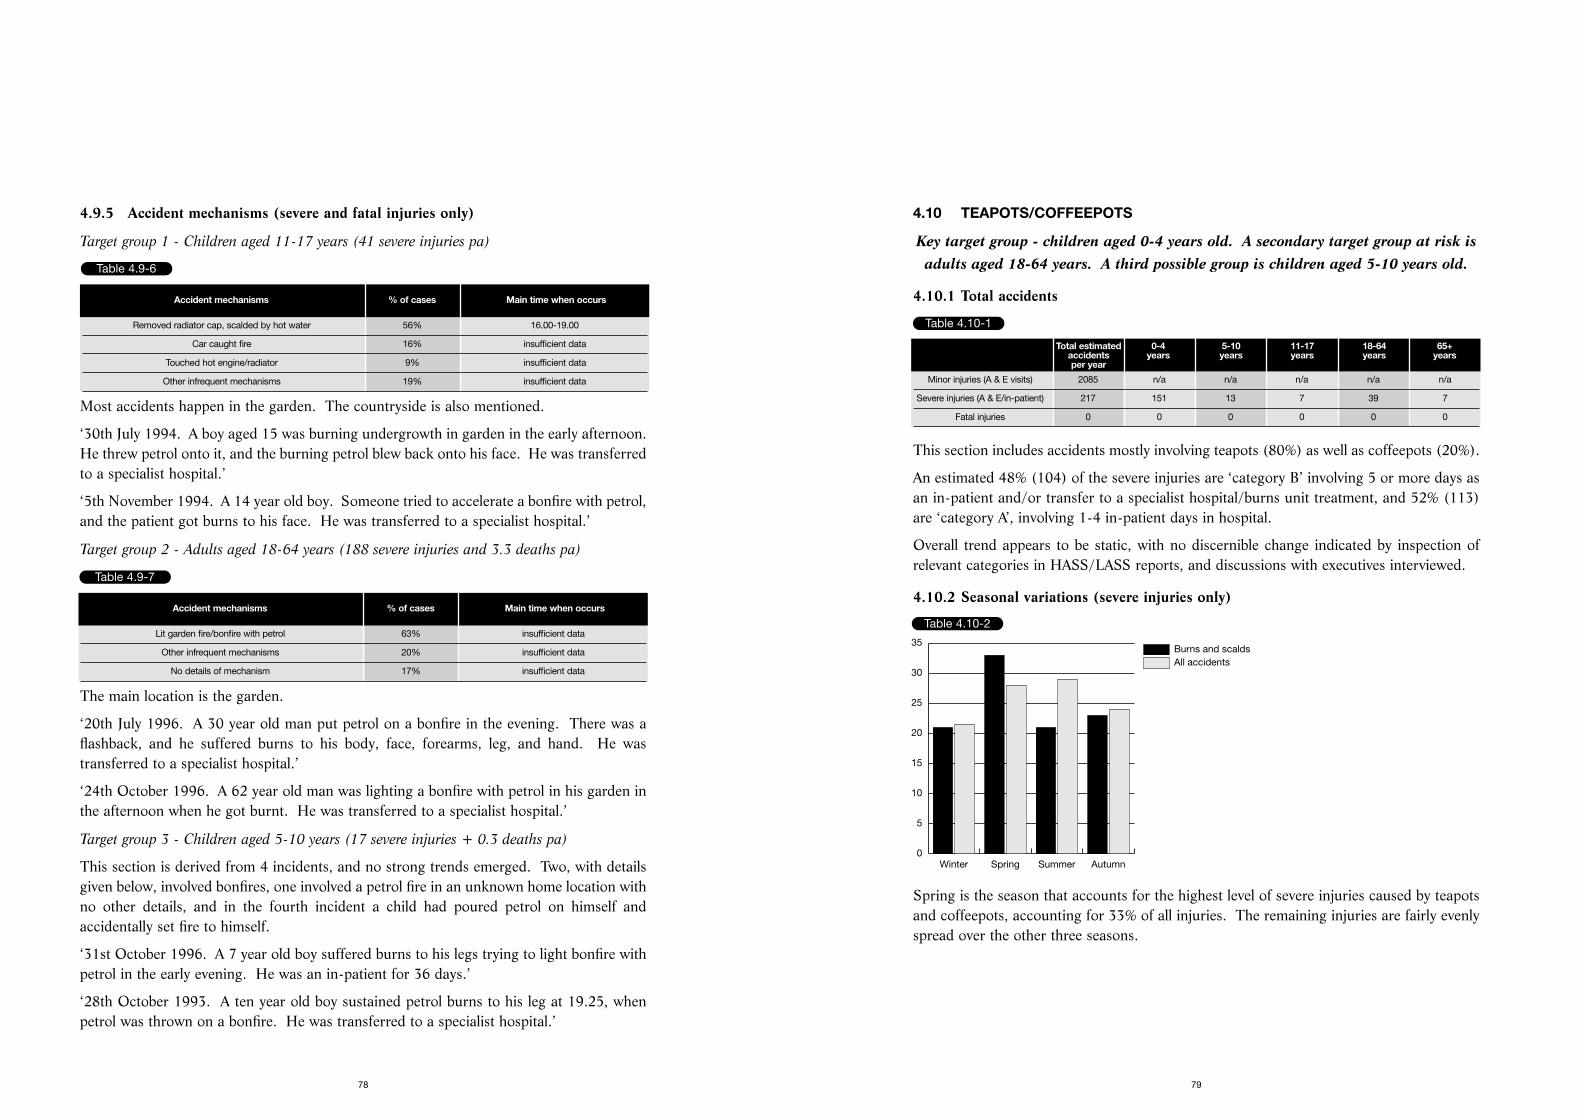
4.10 TEAPOTS/COFFEEPOTS
Key target group - children aged 0-4 years old. A secondary target group at risk isadults aged 18-64 years. A third possible group is children aged 5-10 years old.
4.10.1 Total accidents
This section includes accidents mostly involving teapots (80%) as well as coffeepots (20%).
An estimated 48% (104) of the severe injuries are ‘category B’ involving 5 or more days asan in-patient and/or transfer to a specialist hospital/burns unit treatment, and 52% (113)are ‘category A’, involving 1-4 in-patient days in hospital.
Overall trend appears to be static, with no discernible change indicated by inspection ofrelevant categories in HASS/LASS reports, and discussions with executives interviewed.
4.10.2 Seasonal variations (severe injuries only)
Table 4.10-2
Spring is the season that accounts for the highest level of severe injuries caused by teapotsand coffeepots, accounting for 33% of all injuries. The remaining injuries are fairly evenlyspread over the other three seasons.
79
4.9.5 Accident mechanisms (severe and fatal injuries only)
Target group 1 - Children aged 11-17 years (41 severe injuries pa)
Most accidents happen in the garden. The countryside is also mentioned.
‘30th July 1994. A boy aged 15 was burning undergrowth in garden in the early afternoon.He threw petrol onto it, and the burning petrol blew back onto his face. He was transferredto a specialist hospital.’
‘5th November 1994. A 14 year old boy. Someone tried to accelerate a bonfire with petrol,and the patient got burns to his face. He was transferred to a specialist hospital.’
Target group 2 - Adults aged 18-64 years (188 severe injuries and 3.3 deaths pa)
The main location is the garden.
‘20th July 1996. A 30 year old man put petrol on a bonfire in the evening. There was aflashback, and he suffered burns to his body, face, forearms, leg, and hand. He wastransferred to a specialist hospital.’
‘24th October 1996. A 62 year old man was lighting a bonfire with petrol in his garden inthe afternoon when he got burnt. He was transferred to a specialist hospital.’
Target group 3 - Children aged 5-10 years (17 severe injuries + 0.3 deaths pa)
This section is derived from 4 incidents, and no strong trends emerged. Two, with detailsgiven below, involved bonfires, one involved a petrol fire in an unknown home location withno other details, and in the fourth incident a child had poured petrol on himself andaccidentally set fire to himself.
‘31st October 1996. A 7 year old boy suffered burns to his legs trying to light bonfire withpetrol in the early evening. He was an in-patient for 36 days.’
‘28th October 1993. A ten year old boy sustained petrol burns to his leg at 19.25, whenpetrol was thrown on a bonfire. He was transferred to a specialist hospital.’
78
Table 4.9-6
Accident mechanisms % of cases Main time when occurs
Removed radiator cap, scalded by hot water 56% 16.00-19.00
Car caught fire 16% insufficient data
Touched hot engine/radiator 9% insufficient data
Other infrequent mechanisms 19% insufficient data
Table 4.9-7
Accident mechanisms % of cases Main time when occurs
Lit garden fire/bonfire with petrol 63% insufficient data
Other infrequent mechanisms 20% insufficient data
No details of mechanism 17% insufficient data
Table 4.10-1
Total estimated 0-4 5-10 11-17 18-64 65+accidents years years years years yearsper year
Minor injuries (A & E visits) 2085 n/a n/a n/a n/a n/a
Severe injuries (A & E/in-patient) 217 151 13 7 39 7
Fatal injuries 0 0 0 0 0 0
Table 4.10-2
All accidentsBurns and scalds
Winter Spring Summer Autumn0
5
10
15
20
25
30
35
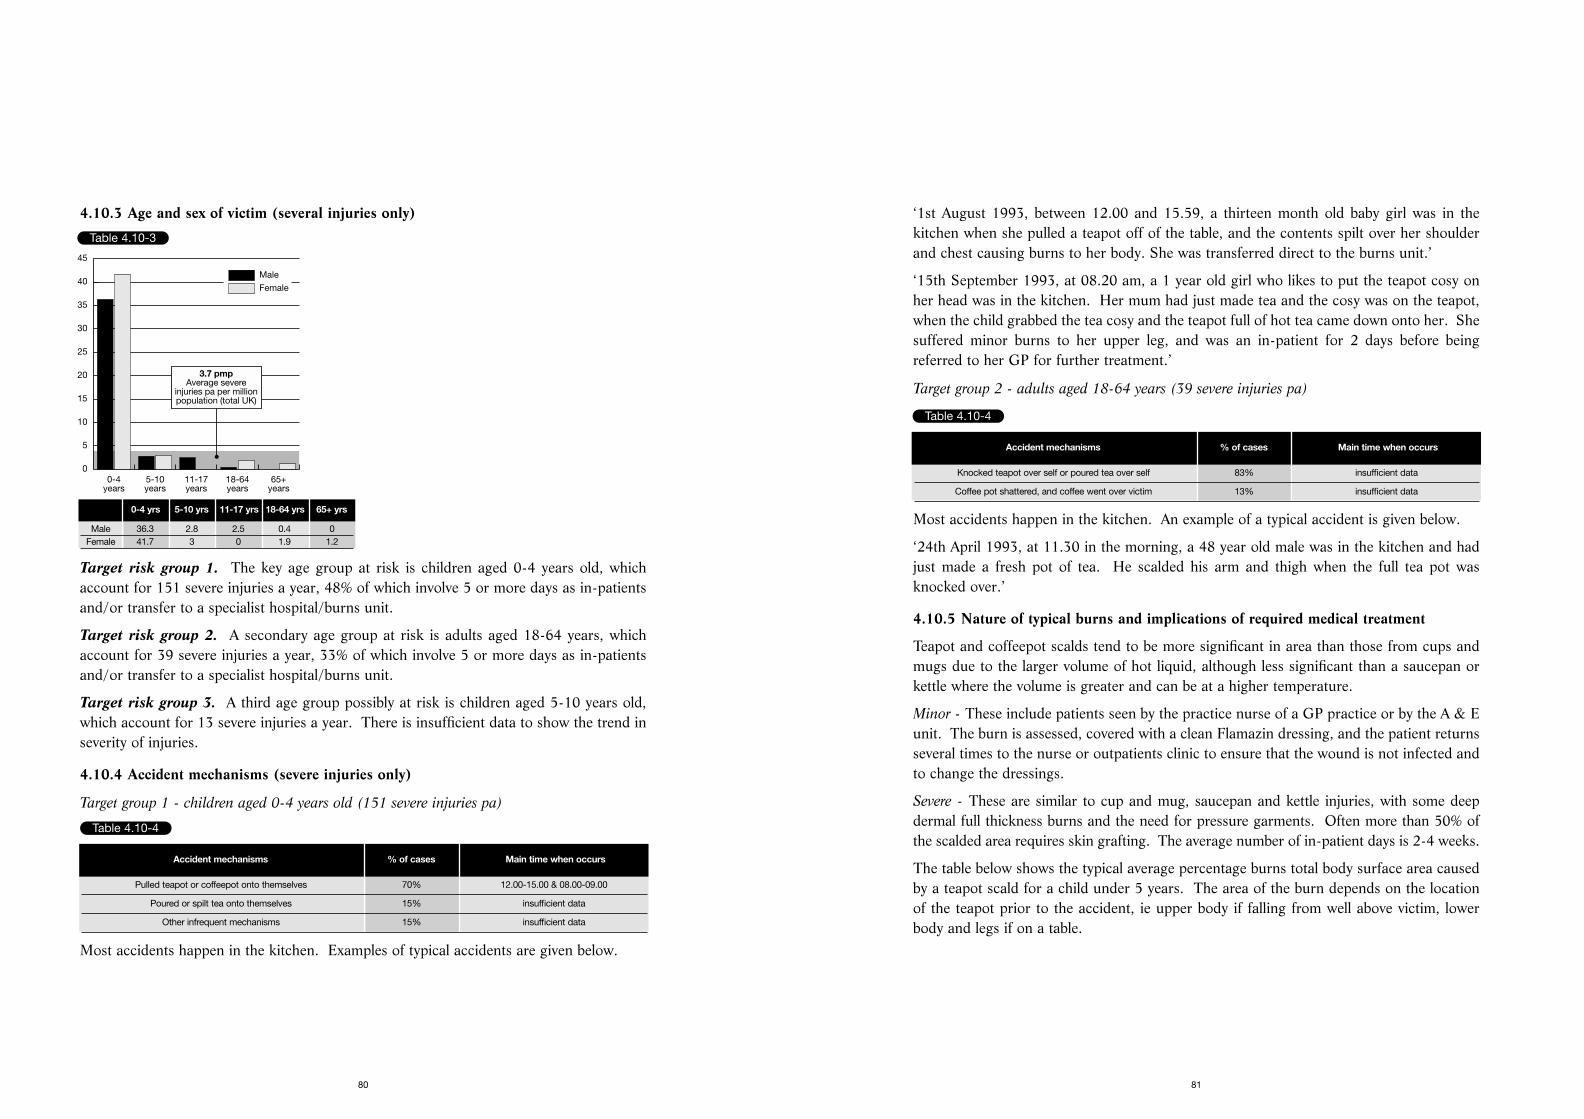
‘1st August 1993, between 12.00 and 15.59, a thirteen month old baby girl was in thekitchen when she pulled a teapot off of the table, and the contents spilt over her shoulderand chest causing burns to her body. She was transferred direct to the burns unit.’
‘15th September 1993, at 08.20 am, a 1 year old girl who likes to put the teapot cosy onher head was in the kitchen. Her mum had just made tea and the cosy was on the teapot,when the child grabbed the tea cosy and the teapot full of hot tea came down onto her. Shesuffered minor burns to her upper leg, and was an in-patient for 2 days before beingreferred to her GP for further treatment.’
Target group 2 - adults aged 18-64 years (39 severe injuries pa)
Most accidents happen in the kitchen. An example of a typical accident is given below.
‘24th April 1993, at 11.30 in the morning, a 48 year old male was in the kitchen and hadjust made a fresh pot of tea. He scalded his arm and thigh when the full tea pot wasknocked over.’
4.10.5 Nature of typical burns and implications of required medical treatment
Teapot and coffeepot scalds tend to be more significant in area than those from cups andmugs due to the larger volume of hot liquid, although less significant than a saucepan orkettle where the volume is greater and can be at a higher temperature.
Minor - These include patients seen by the practice nurse of a GP practice or by the A & Eunit. The burn is assessed, covered with a clean Flamazin dressing, and the patient returnsseveral times to the nurse or outpatients clinic to ensure that the wound is not infected andto change the dressings.
Severe - These are similar to cup and mug, saucepan and kettle injuries, with some deepdermal full thickness burns and the need for pressure garments. Often more than 50% ofthe scalded area requires skin grafting. The average number of in-patient days is 2-4 weeks.
The table below shows the typical average percentage burns total body surface area causedby a teapot scald for a child under 5 years. The area of the burn depends on the locationof the teapot prior to the accident, ie upper body if falling from well above victim, lowerbody and legs if on a table.
81
4.10.3 Age and sex of victim (several injuries only)
Target risk group 1. The key age group at risk is children aged 0-4 years old, whichaccount for 151 severe injuries a year, 48% of which involve 5 or more days as in-patientsand/or transfer to a specialist hospital/burns unit.
Target risk group 2. A secondary age group at risk is adults aged 18-64 years, whichaccount for 39 severe injuries a year, 33% of which involve 5 or more days as in-patientsand/or transfer to a specialist hospital/burns unit.
Target risk group 3. A third age group possibly at risk is children aged 5-10 years old,which account for 13 severe injuries a year. There is insufficient data to show the trend inseverity of injuries.
4.10.4 Accident mechanisms (severe injuries only)
Target group 1 - children aged 0-4 years old (151 severe injuries pa)
Most accidents happen in the kitchen. Examples of typical accidents are given below.
80
Table 4.10-3
Female
Male
0-4years
5-10years
11-17years
18-64years
65+years
0
5
10
15
20
25
30
35
40
45
3.7 pmpAverage severe
injuries pa per millionpopulation (total UK)
0-4 yrs 5-10 yrs 11-17 yrs 18-64 yrs 65+ yrs
Male 36.3 2.8 2.5 0.4 0Female 41.7 3 0 1.9 1.2
Table 4.10-4
Accident mechanisms % of cases Main time when occurs
Pulled teapot or coffeepot onto themselves 70% 12.00-15.00 & 08.00-09.00
Poured or spilt tea onto themselves 15% insufficient data
Other infrequent mechanisms 15% insufficient data
Table 4.10-4
Accident mechanisms % of cases Main time when occurs
Knocked teapot over self or poured tea over self 83% insufficient data
Coffee pot shattered, and coffee went over victim 13% insufficient data
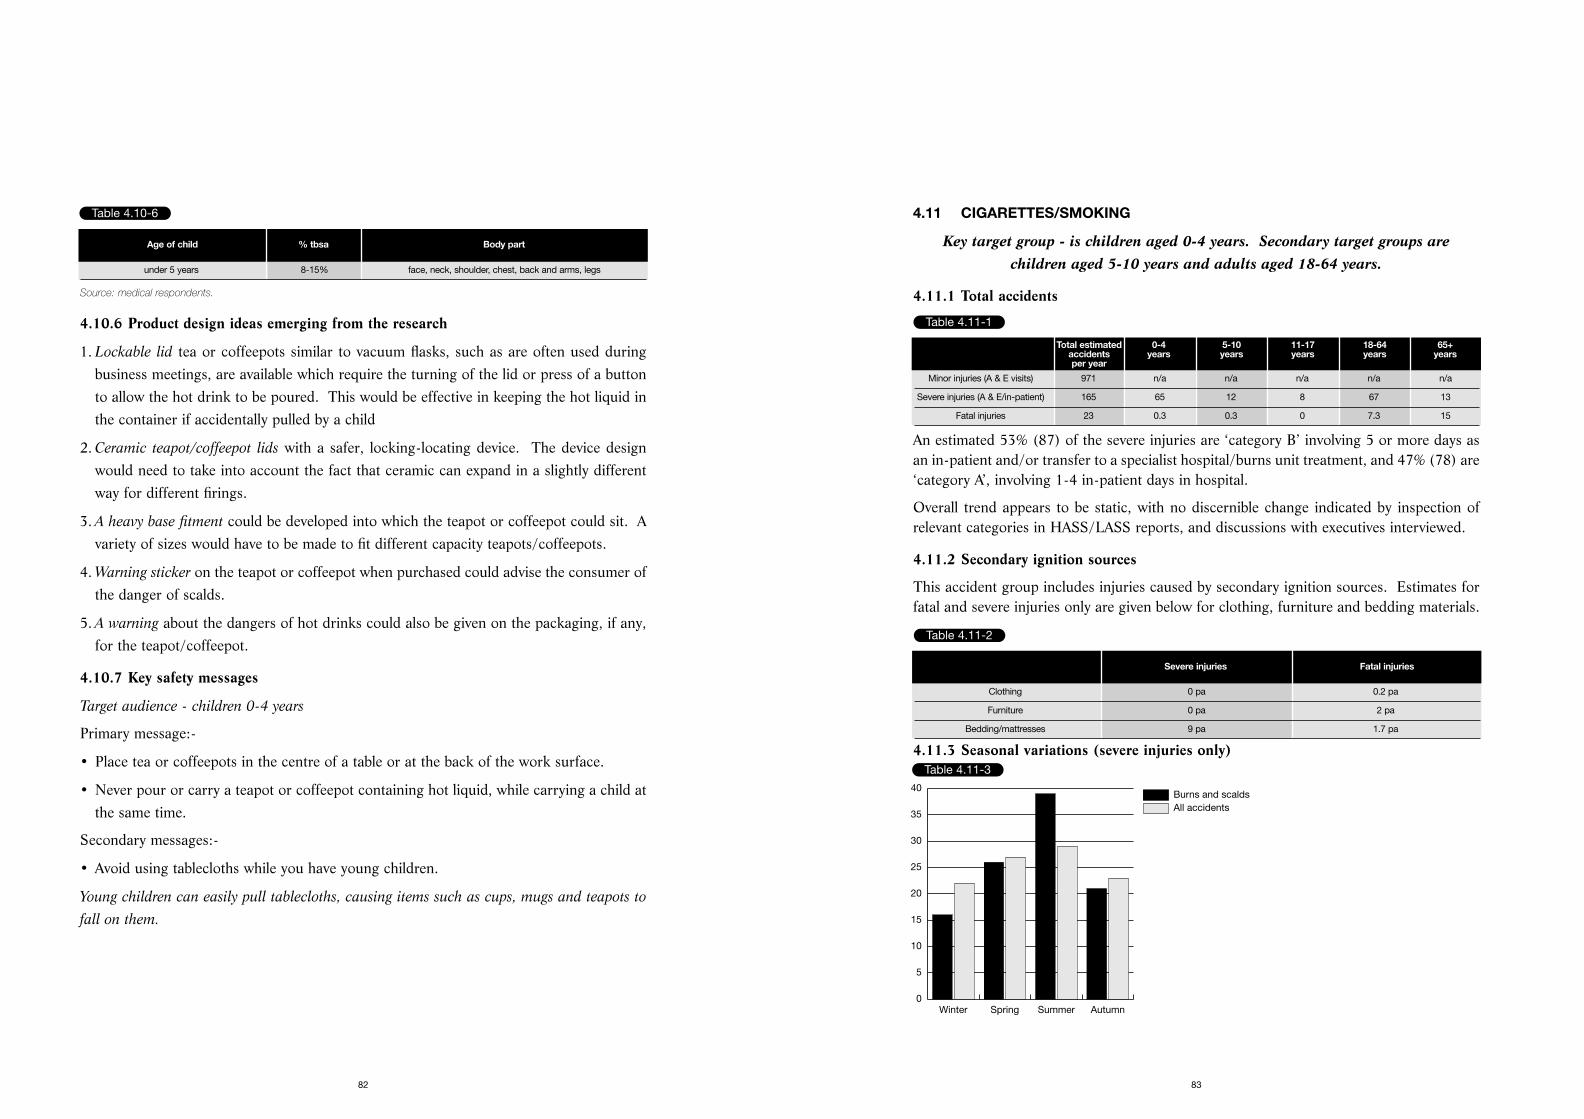
4.11 CIGARETTES/SMOKING
Key target group - is children aged 0-4 years. Secondary target groups arechildren aged 5-10 years and adults aged 18-64 years.
4.11.1 Total accidents
An estimated 53% (87) of the severe injuries are ‘category B’ involving 5 or more days asan in-patient and/or transfer to a specialist hospital/burns unit treatment, and 47% (78) are‘category A’, involving 1-4 in-patient days in hospital.
Overall trend appears to be static, with no discernible change indicated by inspection ofrelevant categories in HASS/LASS reports, and discussions with executives interviewed.
4.11.2 Secondary ignition sources
This accident group includes injuries caused by secondary ignition sources. Estimates forfatal and severe injuries only are given below for clothing, furniture and bedding materials.
4.11.3 Seasonal variations (severe injuries only)
83
Source: medical respondents.
4.10.6 Product design ideas emerging from the research
1. Lockable lid tea or coffeepots similar to vacuum flasks, such as are often used duringbusiness meetings, are available which require the turning of the lid or press of a buttonto allow the hot drink to be poured. This would be effective in keeping the hot liquid inthe container if accidentally pulled by a child
2. Ceramic teapot/coffeepot lids with a safer, locking-locating device. The device designwould need to take into account the fact that ceramic can expand in a slightly differentway for different firings.
3. A heavy base fitment could be developed into which the teapot or coffeepot could sit. Avariety of sizes would have to be made to fit different capacity teapots/coffeepots.
4. Warning sticker on the teapot or coffeepot when purchased could advise the consumer ofthe danger of scalds.
5. A warning about the dangers of hot drinks could also be given on the packaging, if any,for the teapot/coffeepot.
4.10.7 Key safety messages
Target audience - children 0-4 years
Primary message:-
• Place tea or coffeepots in the centre of a table or at the back of the work surface.
• Never pour or carry a teapot or coffeepot containing hot liquid, while carrying a child atthe same time.
Secondary messages:-
• Avoid using tablecloths while you have young children.
Young children can easily pull tablecloths, causing items such as cups, mugs and teapots to
fall on them.
82
Table 4.10-6
Age of child % tbsa Body part
under 5 years 8-15% face, neck, shoulder, chest, back and arms, legs
Table 4.11-1
Total estimated 0-4 5-10 11-17 18-64 65+accidents years years years years yearsper year
Minor injuries (A & E visits) 971 n/a n/a n/a n/a n/a
Severe injuries (A & E/in-patient) 165 65 12 8 67 13
Fatal injuries 23 0.3 0.3 0 7.3 15
Table 4.11-2
Severe injuries Fatal injuries
Clothing 0 pa 0.2 pa
Furniture 0 pa 2 pa
Bedding/mattresses 9 pa 1.7 pa
Table 4.11-3
All accidentsBurns and scalds
Winter Spring Summer Autumn0
5
10
15
20
25
30
35
40
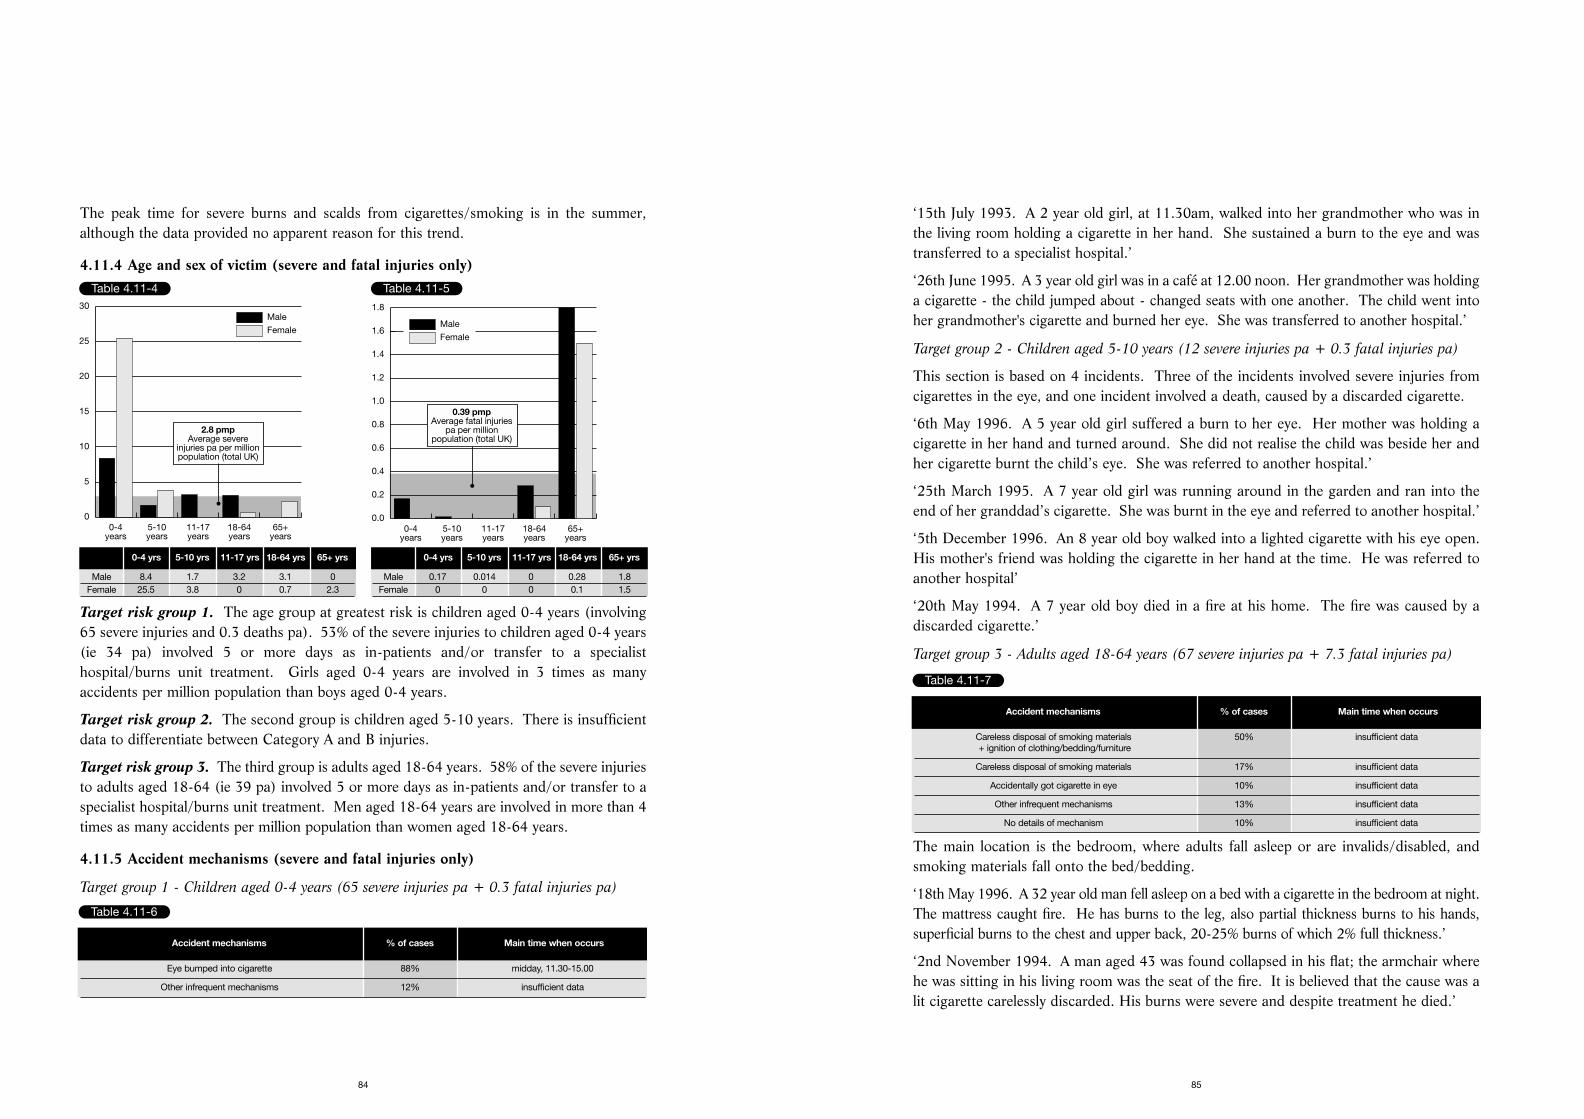
‘15th July 1993. A 2 year old girl, at 11.30am, walked into her grandmother who was inthe living room holding a cigarette in her hand. She sustained a burn to the eye and wastransferred to a specialist hospital.’
‘26th June 1995. A 3 year old girl was in a café at 12.00 noon. Her grandmother was holdinga cigarette - the child jumped about - changed seats with one another. The child went intoher grandmother's cigarette and burned her eye. She was transferred to another hospital.’
Target group 2 - Children aged 5-10 years (12 severe injuries pa + 0.3 fatal injuries pa)
This section is based on 4 incidents. Three of the incidents involved severe injuries fromcigarettes in the eye, and one incident involved a death, caused by a discarded cigarette.
‘6th May 1996. A 5 year old girl suffered a burn to her eye. Her mother was holding acigarette in her hand and turned around. She did not realise the child was beside her andher cigarette burnt the child’s eye. She was referred to another hospital.’
‘25th March 1995. A 7 year old girl was running around in the garden and ran into theend of her granddad’s cigarette. She was burnt in the eye and referred to another hospital.’
‘5th December 1996. An 8 year old boy walked into a lighted cigarette with his eye open.His mother's friend was holding the cigarette in her hand at the time. He was referred toanother hospital’
‘20th May 1994. A 7 year old boy died in a fire at his home. The fire was caused by adiscarded cigarette.’
Target group 3 - Adults aged 18-64 years (67 severe injuries pa + 7.3 fatal injuries pa)
The main location is the bedroom, where adults fall asleep or are invalids/disabled, andsmoking materials fall onto the bed/bedding.
‘18th May 1996. A 32 year old man fell asleep on a bed with a cigarette in the bedroom at night.The mattress caught fire. He has burns to the leg, also partial thickness burns to his hands,superficial burns to the chest and upper back, 20-25% burns of which 2% full thickness.’
‘2nd November 1994. A man aged 43 was found collapsed in his flat; the armchair wherehe was sitting in his living room was the seat of the fire. It is believed that the cause was alit cigarette carelessly discarded. His burns were severe and despite treatment he died.’
85
The peak time for severe burns and scalds from cigarettes/smoking is in the summer,although the data provided no apparent reason for this trend.
4.11.4 Age and sex of victim (severe and fatal injuries only)
Target risk group 1. The age group at greatest risk is children aged 0-4 years (involving65 severe injuries and 0.3 deaths pa). 53% of the severe injuries to children aged 0-4 years(ie 34 pa) involved 5 or more days as in-patients and/or transfer to a specialisthospital/burns unit treatment. Girls aged 0-4 years are involved in 3 times as manyaccidents per million population than boys aged 0-4 years.
Target risk group 2. The second group is children aged 5-10 years. There is insufficientdata to differentiate between Category A and B injuries.
Target risk group 3. The third group is adults aged 18-64 years. 58% of the severe injuriesto adults aged 18-64 (ie 39 pa) involved 5 or more days as in-patients and/or transfer to aspecialist hospital/burns unit treatment. Men aged 18-64 years are involved in more than 4times as many accidents per million population than women aged 18-64 years.
4.11.5 Accident mechanisms (severe and fatal injuries only)
Target group 1 - Children aged 0-4 years (65 severe injuries pa + 0.3 fatal injuries pa)
84
Table 4.11-4
Female
Male
0-4years
5-10years
11-17years
18-64years
65+years
0
5
10
15
20
25
30
2.8 pmpAverage severe
injuries pa per millionpopulation (total UK)
0-4 yrs 5-10 yrs 11-17 yrs 18-64 yrs 65+ yrs
Male 8.4 1.7 3.2 3.1 0Female 25.5 3.8 0 0.7 2.3
Table 4.11-5
Female
Male
0-4years
5-10years
11-17years
18-64years
65+years
0.0
0.2
0.4
0.6
0.8
1.0
1.2
1.4
1.6
1.8
0.39 pmpAverage fatal injuries
pa per millionpopulation (total UK)
0-4 yrs 5-10 yrs 11-17 yrs 18-64 yrs 65+ yrs
Male 0.17 0.014 0 0.28 1.8Female 0 0 0 0.1 1.5
Table 4.11-6
Accident mechanisms % of cases Main time when occurs
Eye bumped into cigarette 88% midday, 11.30-15.00
Other infrequent mechanisms 12% insufficient data
Table 4.11-7
Accident mechanisms % of cases Main time when occurs
Careless disposal of smoking materials 50% insufficient data+ ignition of clothing/bedding/furniture
Careless disposal of smoking materials 17% insufficient data
Accidentally got cigarette in eye 10% insufficient data
Other infrequent mechanisms 13% insufficient data
No details of mechanism 10% insufficient data
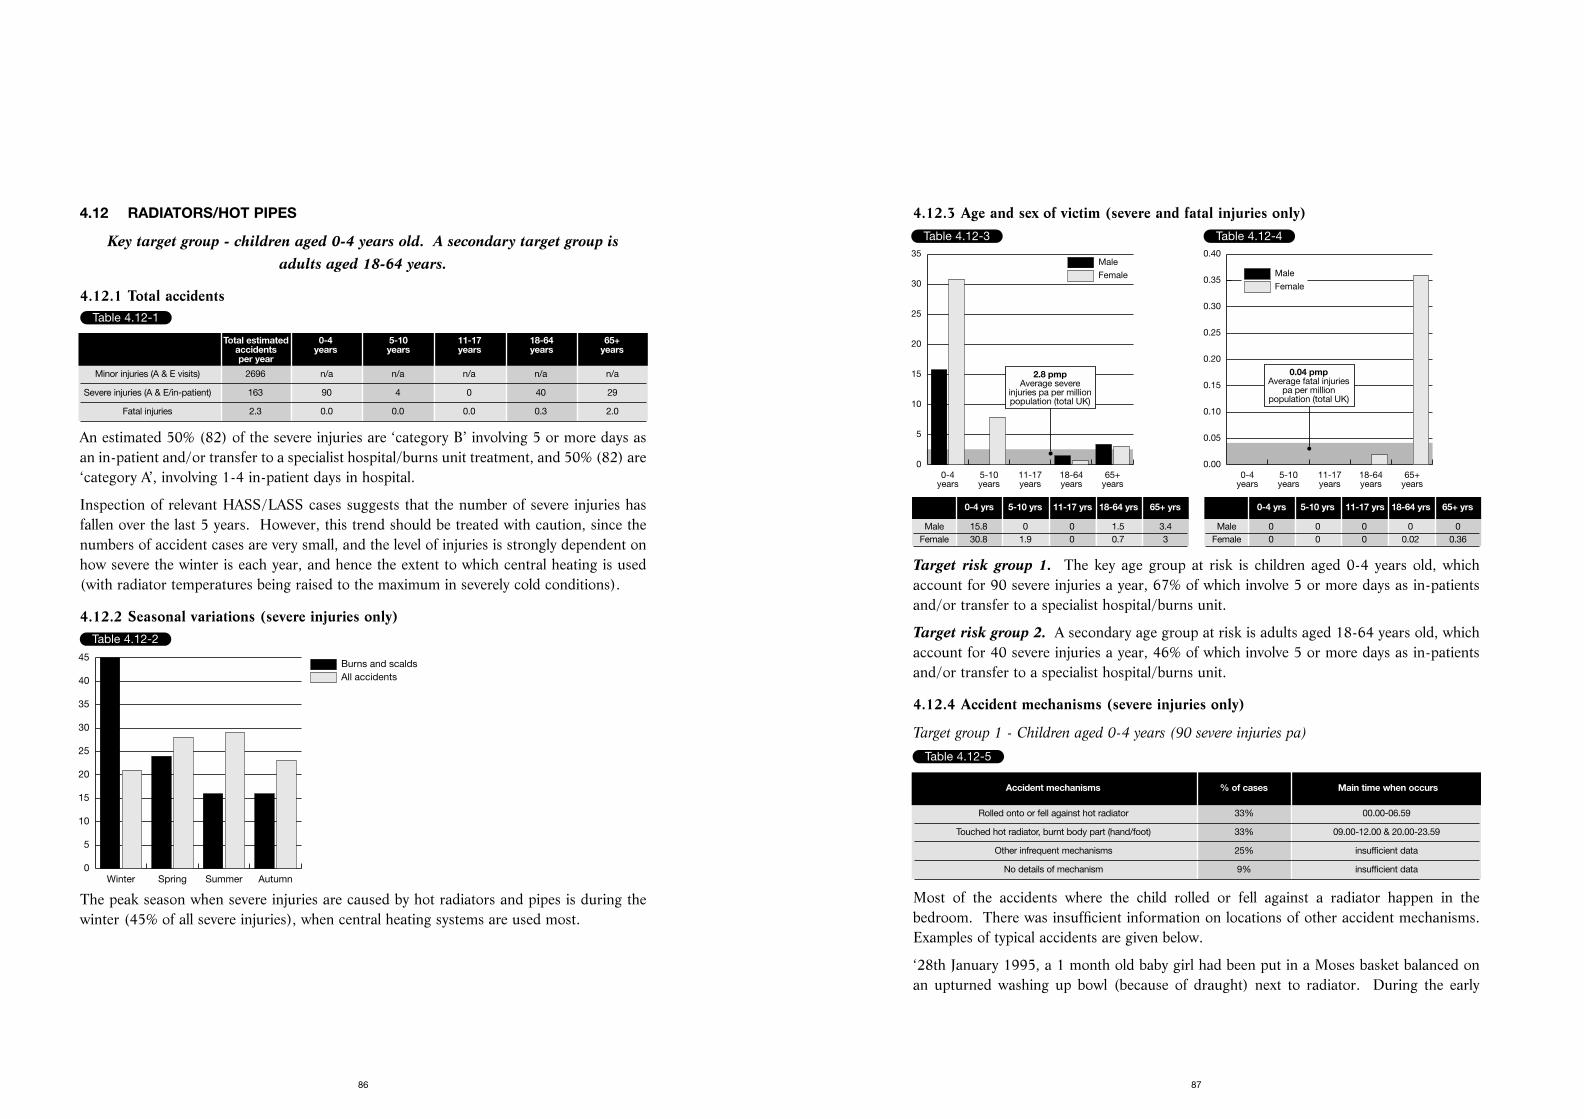
4.12.3 Age and sex of victim (severe and fatal injuries only)
Target risk group 1. The key age group at risk is children aged 0-4 years old, whichaccount for 90 severe injuries a year, 67% of which involve 5 or more days as in-patientsand/or transfer to a specialist hospital/burns unit.
Target risk group 2. A secondary age group at risk is adults aged 18-64 years old, whichaccount for 40 severe injuries a year, 46% of which involve 5 or more days as in-patientsand/or transfer to a specialist hospital/burns unit.
4.12.4 Accident mechanisms (severe injuries only)
Target group 1 - Children aged 0-4 years (90 severe injuries pa)
Most of the accidents where the child rolled or fell against a radiator happen in thebedroom. There was insufficient information on locations of other accident mechanisms.Examples of typical accidents are given below.
‘28th January 1995, a 1 month old baby girl had been put in a Moses basket balanced onan upturned washing up bowl (because of draught) next to radiator. During the early
87
4.12 RADIATORS/HOT PIPES
Key target group - children aged 0-4 years old. A secondary target group is adults aged 18-64 years.
4.12.1 Total accidents
An estimated 50% (82) of the severe injuries are ‘category B’ involving 5 or more days asan in-patient and/or transfer to a specialist hospital/burns unit treatment, and 50% (82) are‘category A’, involving 1-4 in-patient days in hospital.
Inspection of relevant HASS/LASS cases suggests that the number of severe injuries hasfallen over the last 5 years. However, this trend should be treated with caution, since thenumbers of accident cases are very small, and the level of injuries is strongly dependent onhow severe the winter is each year, and hence the extent to which central heating is used(with radiator temperatures being raised to the maximum in severely cold conditions).
4.12.2 Seasonal variations (severe injuries only)
The peak season when severe injuries are caused by hot radiators and pipes is during thewinter (45% of all severe injuries), when central heating systems are used most.
86
Table 4.12-1
Total estimated 0-4 5-10 11-17 18-64 65+accidents years years years years yearsper year
Minor injuries (A & E visits) 2696 n/a n/a n/a n/a n/a
Severe injuries (A & E/in-patient) 163 90 4 0 40 29
Fatal injuries 2.3 0.0 0.0 0.0 0.3 2.0
Table 4.12-2
All accidentsBurns and scalds
Winter Spring Summer Autumn0
5
10
15
20
25
30
35
40
45
Table 4.12-3
Female
Male
0-4years
5-10years
11-17years
18-64years
65+years
0
5
10
15
20
25
30
35
2.8 pmpAverage severe
injuries pa per millionpopulation (total UK)
0-4 yrs 5-10 yrs 11-17 yrs 18-64 yrs 65+ yrs
Male 15.8 0 0 1.5 3.4Female 30.8 1.9 0 0.7 3
Table 4.12-4
Female
Male
0-4years
5-10years
11-17years
18-64years
65+years
0.00
0.05
0.10
0.15
0.20
0.25
0.30
0.35
0.40
0.04 pmpAverage fatal injuries
pa per millionpopulation (total UK)
0-4 yrs 5-10 yrs 11-17 yrs 18-64 yrs 65+ yrs
Male 0 0 0 0 0Female 0 0 0 0.02 0.36
Table 4.12-5
Accident mechanisms % of cases Main time when occurs
Rolled onto or fell against hot radiator 33% 00.00-06.59
Touched hot radiator, burnt body part (hand/foot) 33% 09.00-12.00 & 20.00-23.59
Other infrequent mechanisms 25% insufficient data
No details of mechanism 9% insufficient data
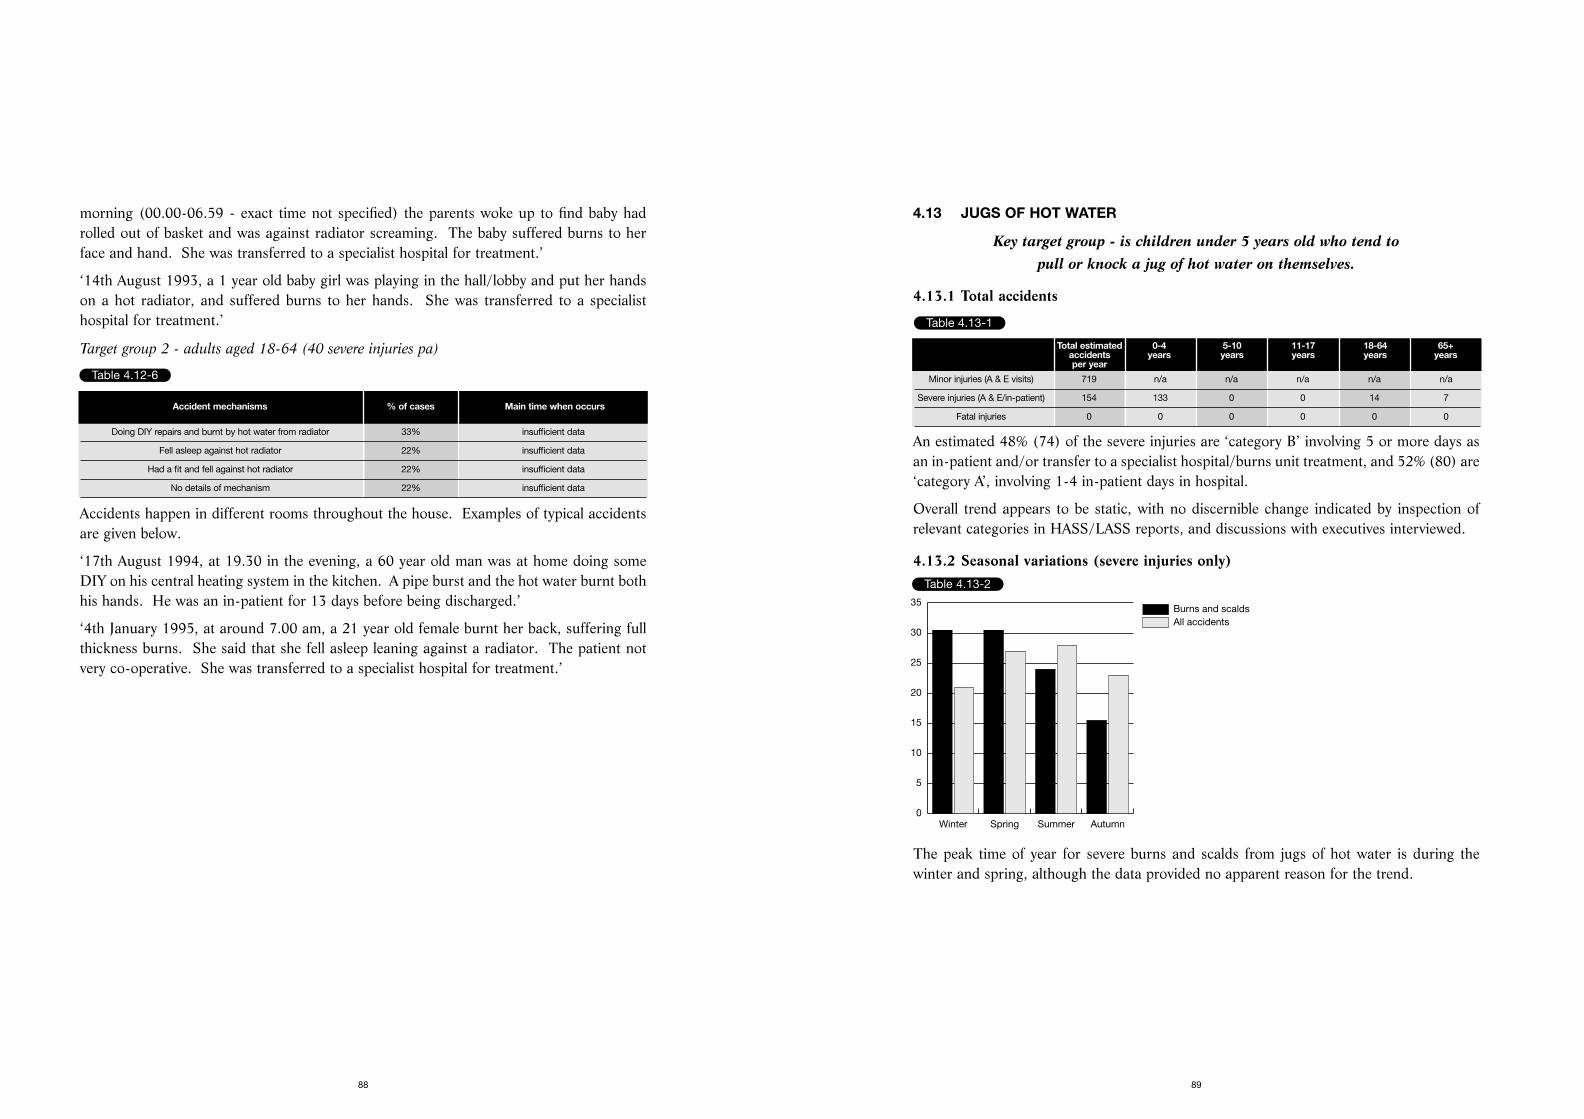
4.13 JUGS OF HOT WATER
Key target group - is children under 5 years old who tend to pull or knock a jug of hot water on themselves.
4.13.1 Total accidents
An estimated 48% (74) of the severe injuries are ‘category B’ involving 5 or more days asan in-patient and/or transfer to a specialist hospital/burns unit treatment, and 52% (80) are‘category A’, involving 1-4 in-patient days in hospital.
Overall trend appears to be static, with no discernible change indicated by inspection ofrelevant categories in HASS/LASS reports, and discussions with executives interviewed.
4.13.2 Seasonal variations (severe injuries only)
The peak time of year for severe burns and scalds from jugs of hot water is during thewinter and spring, although the data provided no apparent reason for the trend.
89
morning (00.00-06.59 - exact time not specified) the parents woke up to find baby hadrolled out of basket and was against radiator screaming. The baby suffered burns to herface and hand. She was transferred to a specialist hospital for treatment.’
‘14th August 1993, a 1 year old baby girl was playing in the hall/lobby and put her handson a hot radiator, and suffered burns to her hands. She was transferred to a specialisthospital for treatment.’
Target group 2 - adults aged 18-64 (40 severe injuries pa)
Accidents happen in different rooms throughout the house. Examples of typical accidentsare given below.
‘17th August 1994, at 19.30 in the evening, a 60 year old man was at home doing someDIY on his central heating system in the kitchen. A pipe burst and the hot water burnt bothhis hands. He was an in-patient for 13 days before being discharged.’
‘4th January 1995, at around 7.00 am, a 21 year old female burnt her back, suffering fullthickness burns. She said that she fell asleep leaning against a radiator. The patient notvery co-operative. She was transferred to a specialist hospital for treatment.’
88
Table 4.12-6
Accident mechanisms % of cases Main time when occurs
Doing DIY repairs and burnt by hot water from radiator 33% insufficient data
Fell asleep against hot radiator 22% insufficient data
Had a fit and fell against hot radiator 22% insufficient data
No details of mechanism 22% insufficient data
Table 4.13-1
Total estimated 0-4 5-10 11-17 18-64 65+accidents years years years years yearsper year
Minor injuries (A & E visits) 719 n/a n/a n/a n/a n/a
Severe injuries (A & E/in-patient) 154 133 0 0 14 7
Fatal injuries 0 0 0 0 0 0
Table 4.13-2
All accidentsBurns and scalds
Winter Spring Summer Autumn0
5
10
15
20
25
30
35
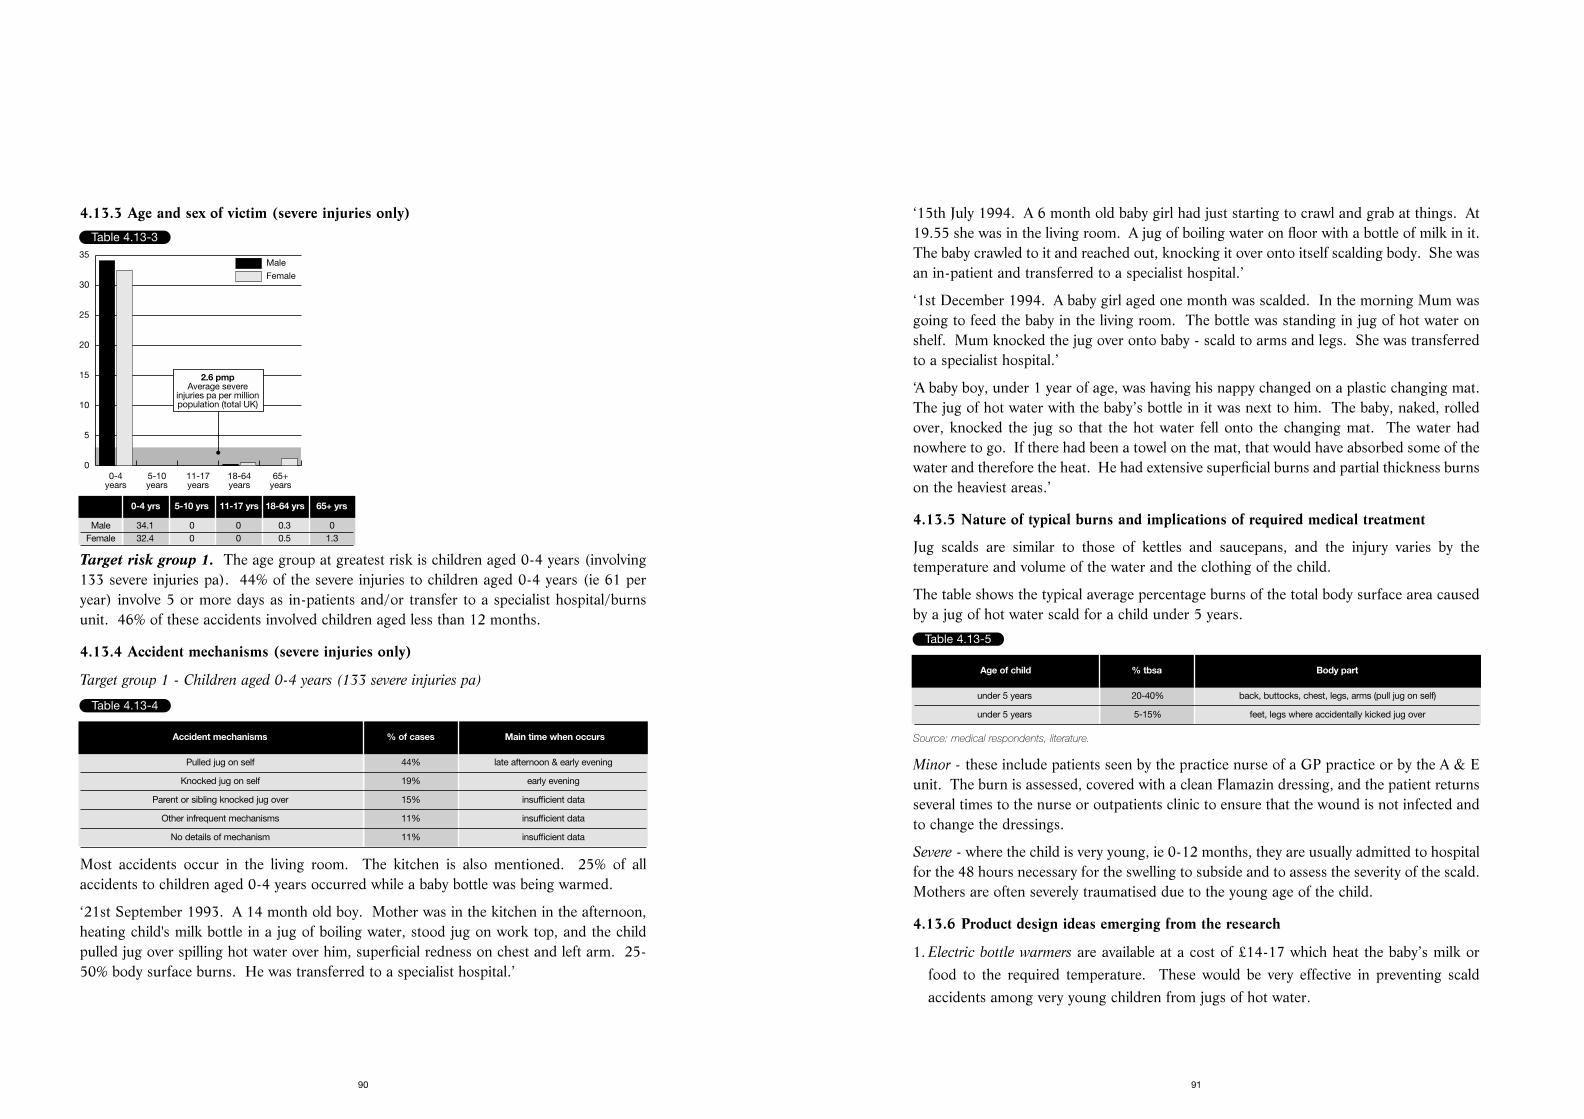
‘15th July 1994. A 6 month old baby girl had just starting to crawl and grab at things. At19.55 she was in the living room. A jug of boiling water on floor with a bottle of milk in it.The baby crawled to it and reached out, knocking it over onto itself scalding body. She wasan in-patient and transferred to a specialist hospital.’
‘1st December 1994. A baby girl aged one month was scalded. In the morning Mum wasgoing to feed the baby in the living room. The bottle was standing in jug of hot water onshelf. Mum knocked the jug over onto baby - scald to arms and legs. She was transferredto a specialist hospital.’
‘A baby boy, under 1 year of age, was having his nappy changed on a plastic changing mat.The jug of hot water with the baby’s bottle in it was next to him. The baby, naked, rolledover, knocked the jug so that the hot water fell onto the changing mat. The water hadnowhere to go. If there had been a towel on the mat, that would have absorbed some of thewater and therefore the heat. He had extensive superficial burns and partial thickness burnson the heaviest areas.’
4.13.5 Nature of typical burns and implications of required medical treatment
Jug scalds are similar to those of kettles and saucepans, and the injury varies by thetemperature and volume of the water and the clothing of the child.
The table shows the typical average percentage burns of the total body surface area causedby a jug of hot water scald for a child under 5 years.
Source: medical respondents, literature.
Minor - these include patients seen by the practice nurse of a GP practice or by the A & Eunit. The burn is assessed, covered with a clean Flamazin dressing, and the patient returnsseveral times to the nurse or outpatients clinic to ensure that the wound is not infected andto change the dressings.
Severe - where the child is very young, ie 0-12 months, they are usually admitted to hospitalfor the 48 hours necessary for the swelling to subside and to assess the severity of the scald.Mothers are often severely traumatised due to the young age of the child.
4.13.6 Product design ideas emerging from the research
1. Electric bottle warmers are available at a cost of £14-17 which heat the baby’s milk orfood to the required temperature. These would be very effective in preventing scaldaccidents among very young children from jugs of hot water.
91
4.13.3 Age and sex of victim (severe injuries only)
Target risk group 1. The age group at greatest risk is children aged 0-4 years (involving133 severe injuries pa). 44% of the severe injuries to children aged 0-4 years (ie 61 peryear) involve 5 or more days as in-patients and/or transfer to a specialist hospital/burnsunit. 46% of these accidents involved children aged less than 12 months.
4.13.4 Accident mechanisms (severe injuries only)
Target group 1 - Children aged 0-4 years (133 severe injuries pa)
Most accidents occur in the living room. The kitchen is also mentioned. 25% of allaccidents to children aged 0-4 years occurred while a baby bottle was being warmed.
‘21st September 1993. A 14 month old boy. Mother was in the kitchen in the afternoon,heating child's milk bottle in a jug of boiling water, stood jug on work top, and the childpulled jug over spilling hot water over him, superficial redness on chest and left arm. 25-50% body surface burns. He was transferred to a specialist hospital.’
90
Table 4.13-3
Female
Male
0-4years
5-10years
11-17years
18-64years
65+years
0
5
10
15
20
25
30
35
2.6 pmpAverage severe
injuries pa per millionpopulation (total UK)
Table 4.13-4
Accident mechanisms % of cases Main time when occurs
Pulled jug on self 44% late afternoon & early evening
Knocked jug on self 19% early evening
Parent or sibling knocked jug over 15% insufficient data
Other infrequent mechanisms 11% insufficient data
No details of mechanism 11% insufficient data
Table 4.13-5
Age of child % tbsa Body part
under 5 years 20-40% back, buttocks, chest, legs, arms (pull jug on self)
under 5 years 5-15% feet, legs where accidentally kicked jug over
0-4 yrs 5-10 yrs 11-17 yrs 18-64 yrs 65+ yrs
Male 34.1 0 0 0.3 0Female 32.4 0 0 0.5 1.3
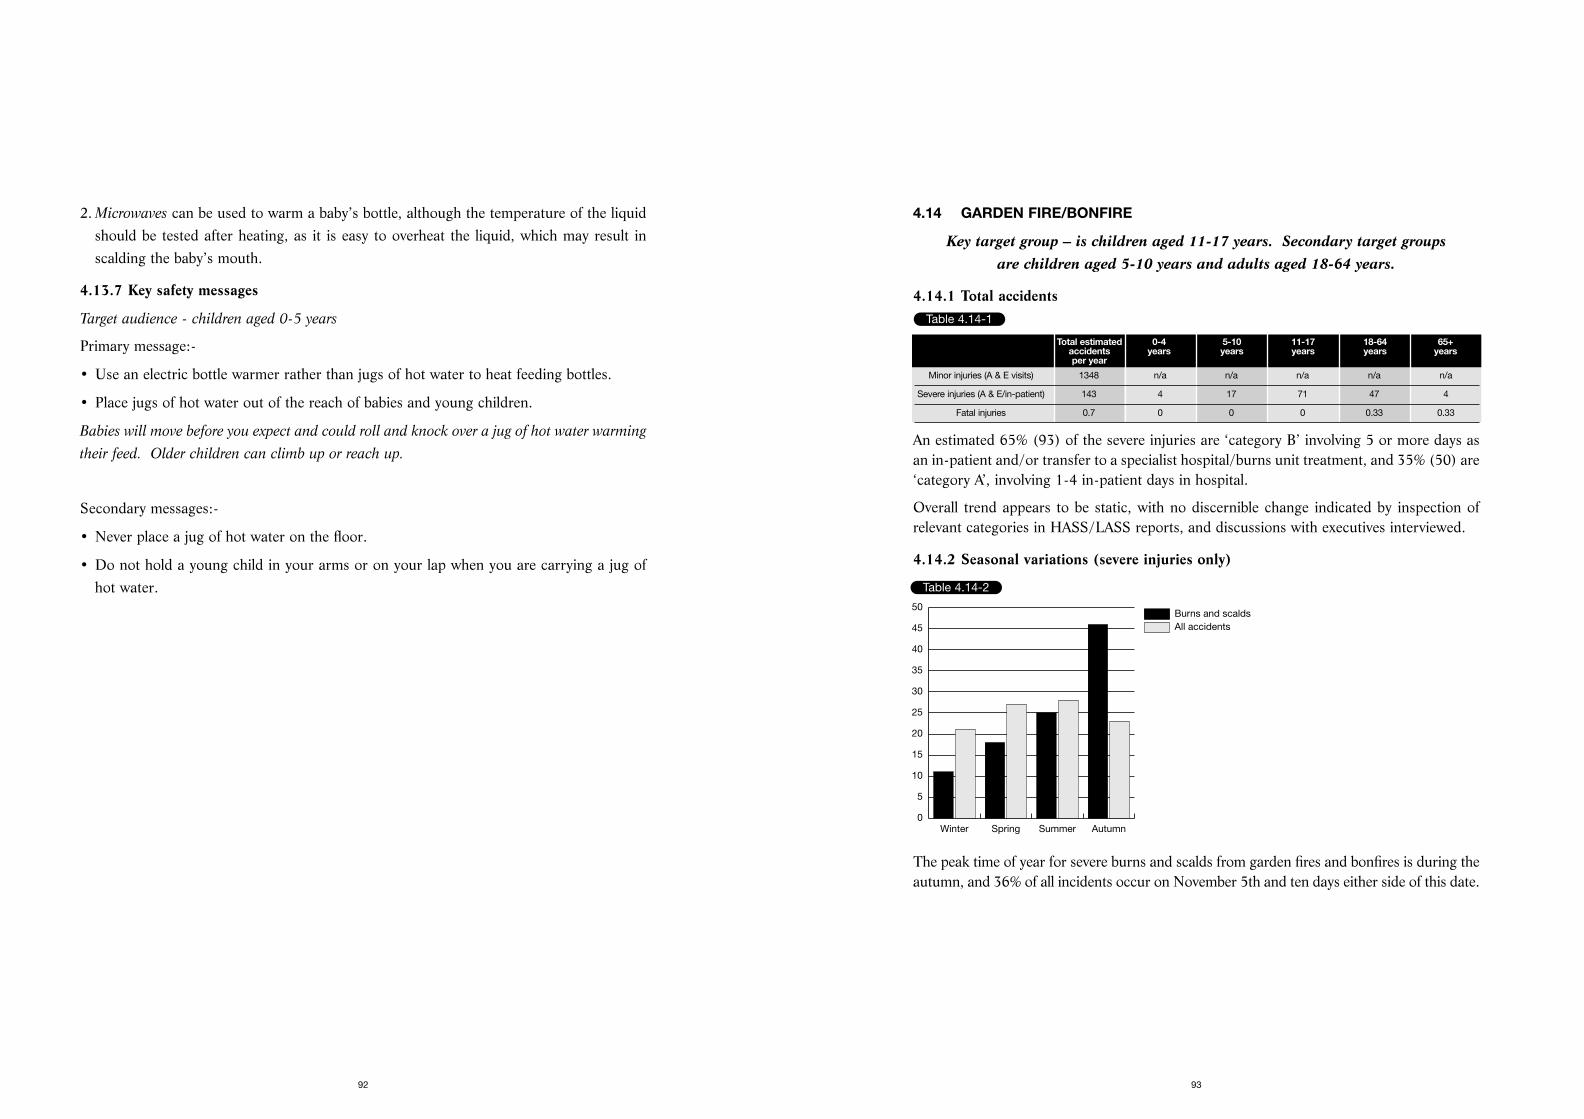
4.14 GARDEN FIRE/BONFIRE
Key target group – is children aged 11-17 years. Secondary target groups are children aged 5-10 years and adults aged 18-64 years.
4.14.1 Total accidents
An estimated 65% (93) of the severe injuries are ‘category B’ involving 5 or more days asan in-patient and/or transfer to a specialist hospital/burns unit treatment, and 35% (50) are‘category A’, involving 1-4 in-patient days in hospital.
Overall trend appears to be static, with no discernible change indicated by inspection ofrelevant categories in HASS/LASS reports, and discussions with executives interviewed.
4.14.2 Seasonal variations (severe injuries only)
The peak time of year for severe burns and scalds from garden fires and bonfires is during theautumn, and 36% of all incidents occur on November 5th and ten days either side of this date.
93
2. Microwaves can be used to warm a baby’s bottle, although the temperature of the liquidshould be tested after heating, as it is easy to overheat the liquid, which may result inscalding the baby’s mouth.
4.13.7 Key safety messages
Target audience - children aged 0-5 years
Primary message:-
• Use an electric bottle warmer rather than jugs of hot water to heat feeding bottles.
• Place jugs of hot water out of the reach of babies and young children.
Babies will move before you expect and could roll and knock over a jug of hot water warming
their feed. Older children can climb up or reach up.
Secondary messages:-
• Never place a jug of hot water on the floor.
• Do not hold a young child in your arms or on your lap when you are carrying a jug ofhot water.
92
Table 4.14-1
Total estimated 0-4 5-10 11-17 18-64 65+accidents years years years years yearsper year
Minor injuries (A & E visits) 1348 n/a n/a n/a n/a n/a
Severe injuries (A & E/in-patient) 143 4 17 71 47 4
Fatal injuries 0.7 0 0 0 0.33 0.33
Table 4.14-2
All accidentsBurns and scalds
Winter Spring Summer Autumn0
5
10
15
20
25
30
35
40
45
50
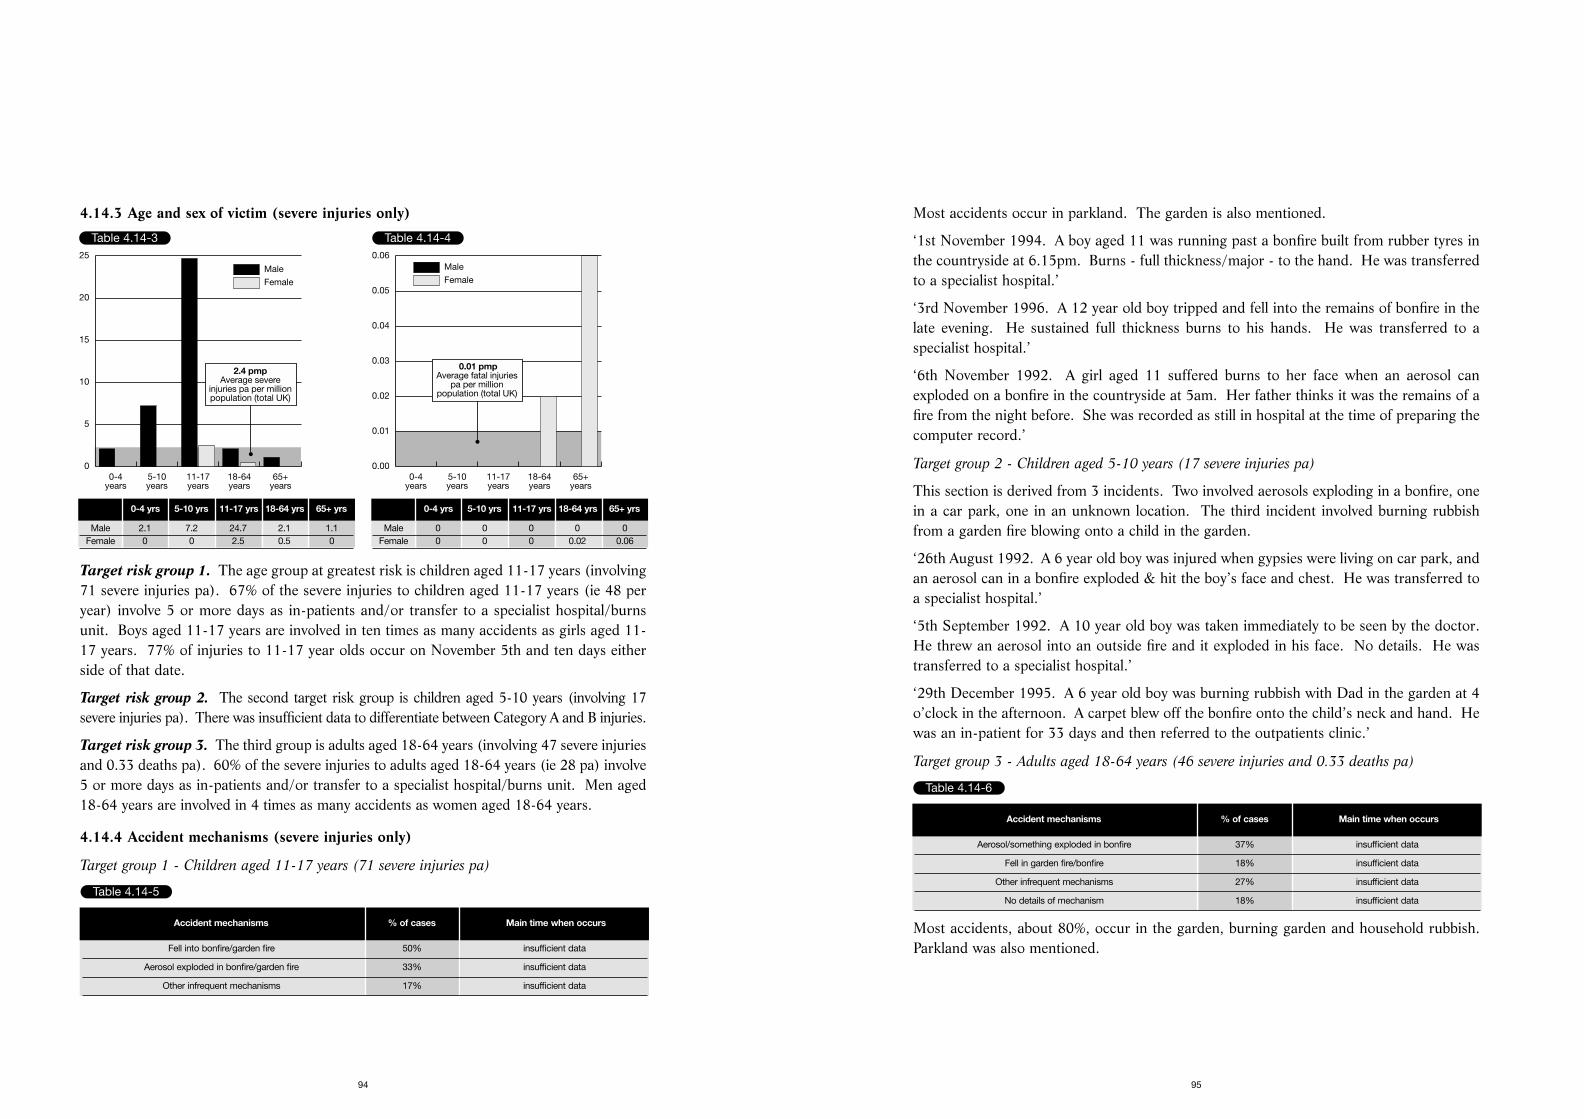
Most accidents occur in parkland. The garden is also mentioned.
‘1st November 1994. A boy aged 11 was running past a bonfire built from rubber tyres inthe countryside at 6.15pm. Burns - full thickness/major - to the hand. He was transferredto a specialist hospital.’
‘3rd November 1996. A 12 year old boy tripped and fell into the remains of bonfire in thelate evening. He sustained full thickness burns to his hands. He was transferred to aspecialist hospital.’
‘6th November 1992. A girl aged 11 suffered burns to her face when an aerosol canexploded on a bonfire in the countryside at 5am. Her father thinks it was the remains of afire from the night before. She was recorded as still in hospital at the time of preparing thecomputer record.’
Target group 2 - Children aged 5-10 years (17 severe injuries pa)
This section is derived from 3 incidents. Two involved aerosols exploding in a bonfire, onein a car park, one in an unknown location. The third incident involved burning rubbishfrom a garden fire blowing onto a child in the garden.
‘26th August 1992. A 6 year old boy was injured when gypsies were living on car park, andan aerosol can in a bonfire exploded & hit the boy’s face and chest. He was transferred toa specialist hospital.’
‘5th September 1992. A 10 year old boy was taken immediately to be seen by the doctor.He threw an aerosol into an outside fire and it exploded in his face. No details. He wastransferred to a specialist hospital.’
‘29th December 1995. A 6 year old boy was burning rubbish with Dad in the garden at 4o’clock in the afternoon. A carpet blew off the bonfire onto the child’s neck and hand. Hewas an in-patient for 33 days and then referred to the outpatients clinic.’
Target group 3 - Adults aged 18-64 years (46 severe injuries and 0.33 deaths pa)
Most accidents, about 80%, occur in the garden, burning garden and household rubbish.Parkland was also mentioned.
95
4.14.3 Age and sex of victim (severe injuries only)
Target risk group 1. The age group at greatest risk is children aged 11-17 years (involving71 severe injuries pa). 67% of the severe injuries to children aged 11-17 years (ie 48 peryear) involve 5 or more days as in-patients and/or transfer to a specialist hospital/burnsunit. Boys aged 11-17 years are involved in ten times as many accidents as girls aged 11-17 years. 77% of injuries to 11-17 year olds occur on November 5th and ten days eitherside of that date.
Target risk group 2. The second target risk group is children aged 5-10 years (involving 17severe injuries pa). There was insufficient data to differentiate between Category A and B injuries.
Target risk group 3. The third group is adults aged 18-64 years (involving 47 severe injuriesand 0.33 deaths pa). 60% of the severe injuries to adults aged 18-64 years (ie 28 pa) involve5 or more days as in-patients and/or transfer to a specialist hospital/burns unit. Men aged18-64 years are involved in 4 times as many accidents as women aged 18-64 years.
4.14.4 Accident mechanisms (severe injuries only)
Target group 1 - Children aged 11-17 years (71 severe injuries pa)
94
Table 4.14-3
Female
Male
0-4years
5-10years
11-17years
18-64years
65+years
0
5
10
15
20
25
2.4 pmpAverage severe
injuries pa per millionpopulation (total UK)
0-4 yrs 5-10 yrs 11-17 yrs 18-64 yrs 65+ yrs
Male 2.1 7.2 24.7 2.1 1.1Female 0 0 2.5 0.5 0
Table 4.14-4
Female
Male
0-4years
5-10years
11-17years
18-64years
65+years
0.00
0.01
0.02
0.03
0.04
0.05
0.06
0.01 pmpAverage fatal injuries
pa per millionpopulation (total UK)
0-4 yrs 5-10 yrs 11-17 yrs 18-64 yrs 65+ yrs
Male 0 0 0 0 0Female 0 0 0 0.02 0.06
Table 4.14-5
Accident mechanisms % of cases Main time when occurs
Fell into bonfire/garden fire 50% insufficient data
Aerosol exploded in bonfire/garden fire 33% insufficient data
Other infrequent mechanisms 17% insufficient data
Table 4.14-6
Accident mechanisms % of cases Main time when occurs
Aerosol/something exploded in bonfire 37% insufficient data
Fell in garden fire/bonfire 18% insufficient data
Other infrequent mechanisms 27% insufficient data
No details of mechanism 18% insufficient data
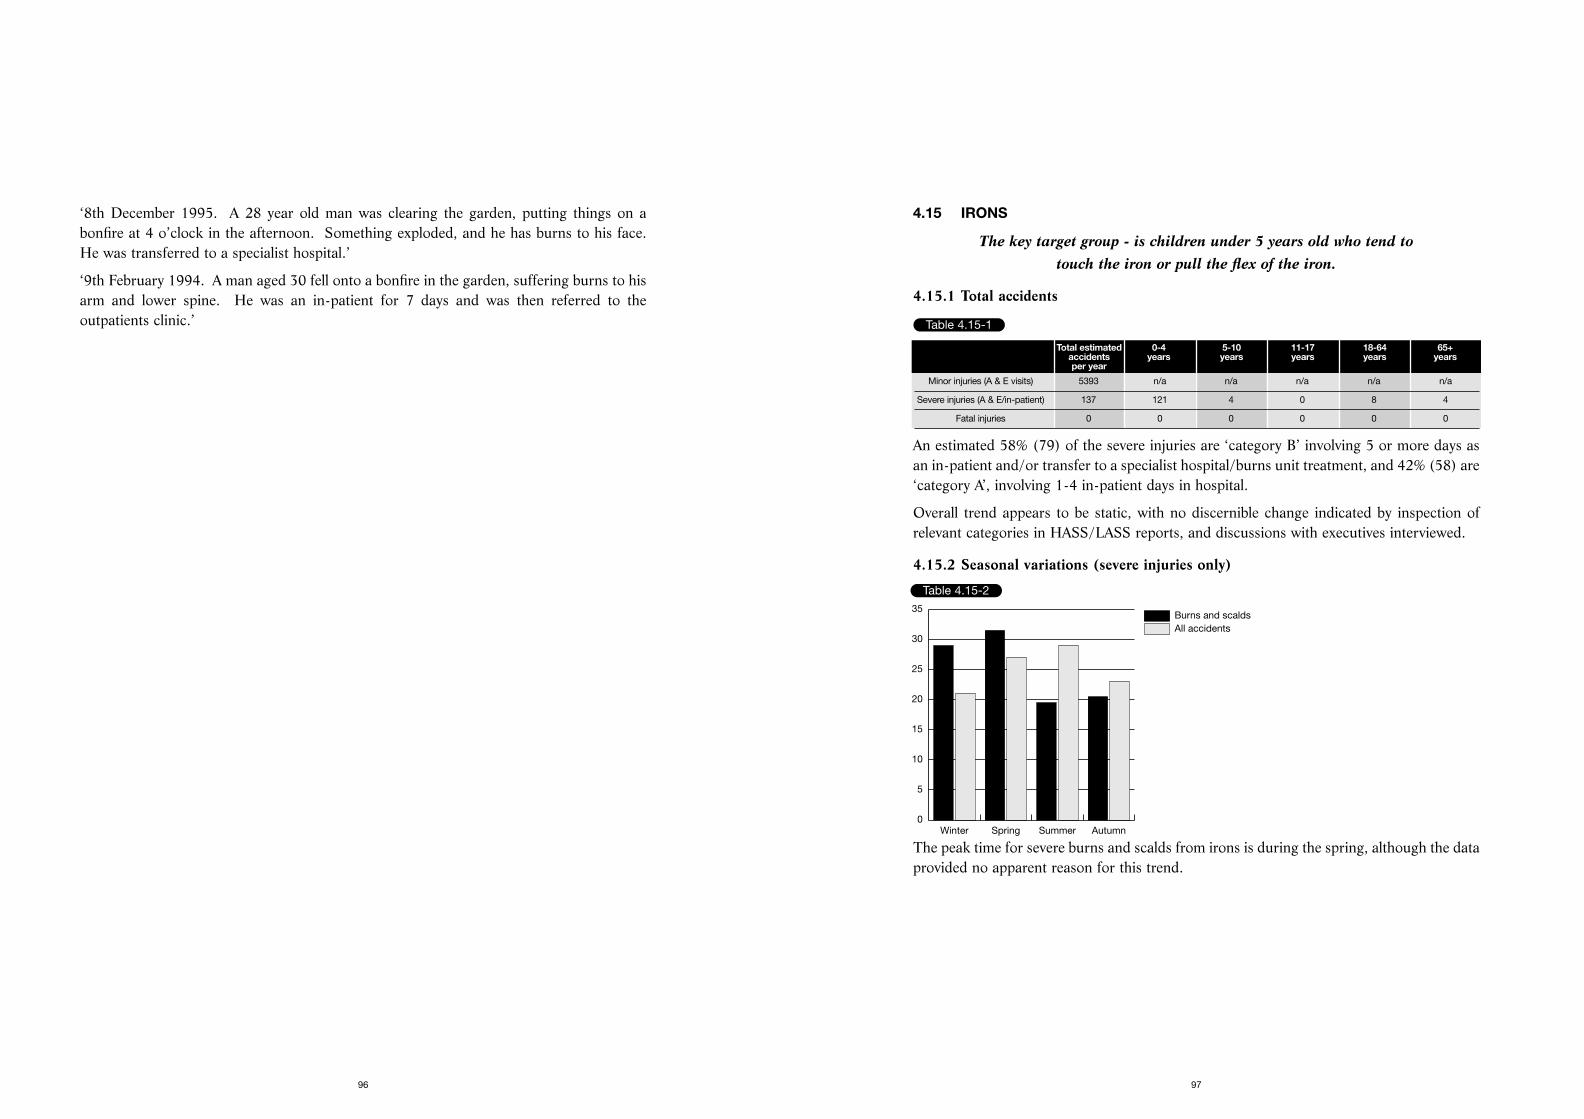
4.15 IRONS
The key target group - is children under 5 years old who tend to touch the iron or pull the flex of the iron.
4.15.1 Total accidents
An estimated 58% (79) of the severe injuries are ‘category B’ involving 5 or more days asan in-patient and/or transfer to a specialist hospital/burns unit treatment, and 42% (58) are‘category A’, involving 1-4 in-patient days in hospital.
Overall trend appears to be static, with no discernible change indicated by inspection ofrelevant categories in HASS/LASS reports, and discussions with executives interviewed.
4.15.2 Seasonal variations (severe injuries only)
The peak time for severe burns and scalds from irons is during the spring, although the dataprovided no apparent reason for this trend.
97
‘8th December 1995. A 28 year old man was clearing the garden, putting things on abonfire at 4 o’clock in the afternoon. Something exploded, and he has burns to his face.He was transferred to a specialist hospital.’
‘9th February 1994. A man aged 30 fell onto a bonfire in the garden, suffering burns to hisarm and lower spine. He was an in-patient for 7 days and was then referred to theoutpatients clinic.’
96
Table 4.15-1
Total estimated 0-4 5-10 11-17 18-64 65+accidents years years years years yearsper year
Minor injuries (A & E visits) 5393 n/a n/a n/a n/a n/a
Severe injuries (A & E/in-patient) 137 121 4 0 8 4
Fatal injuries 0 0 0 0 0 0
Table 4.15-2
All accidentsBurns and scalds
Winter Spring Summer Autumn0
5
10
15
20
25
30
35
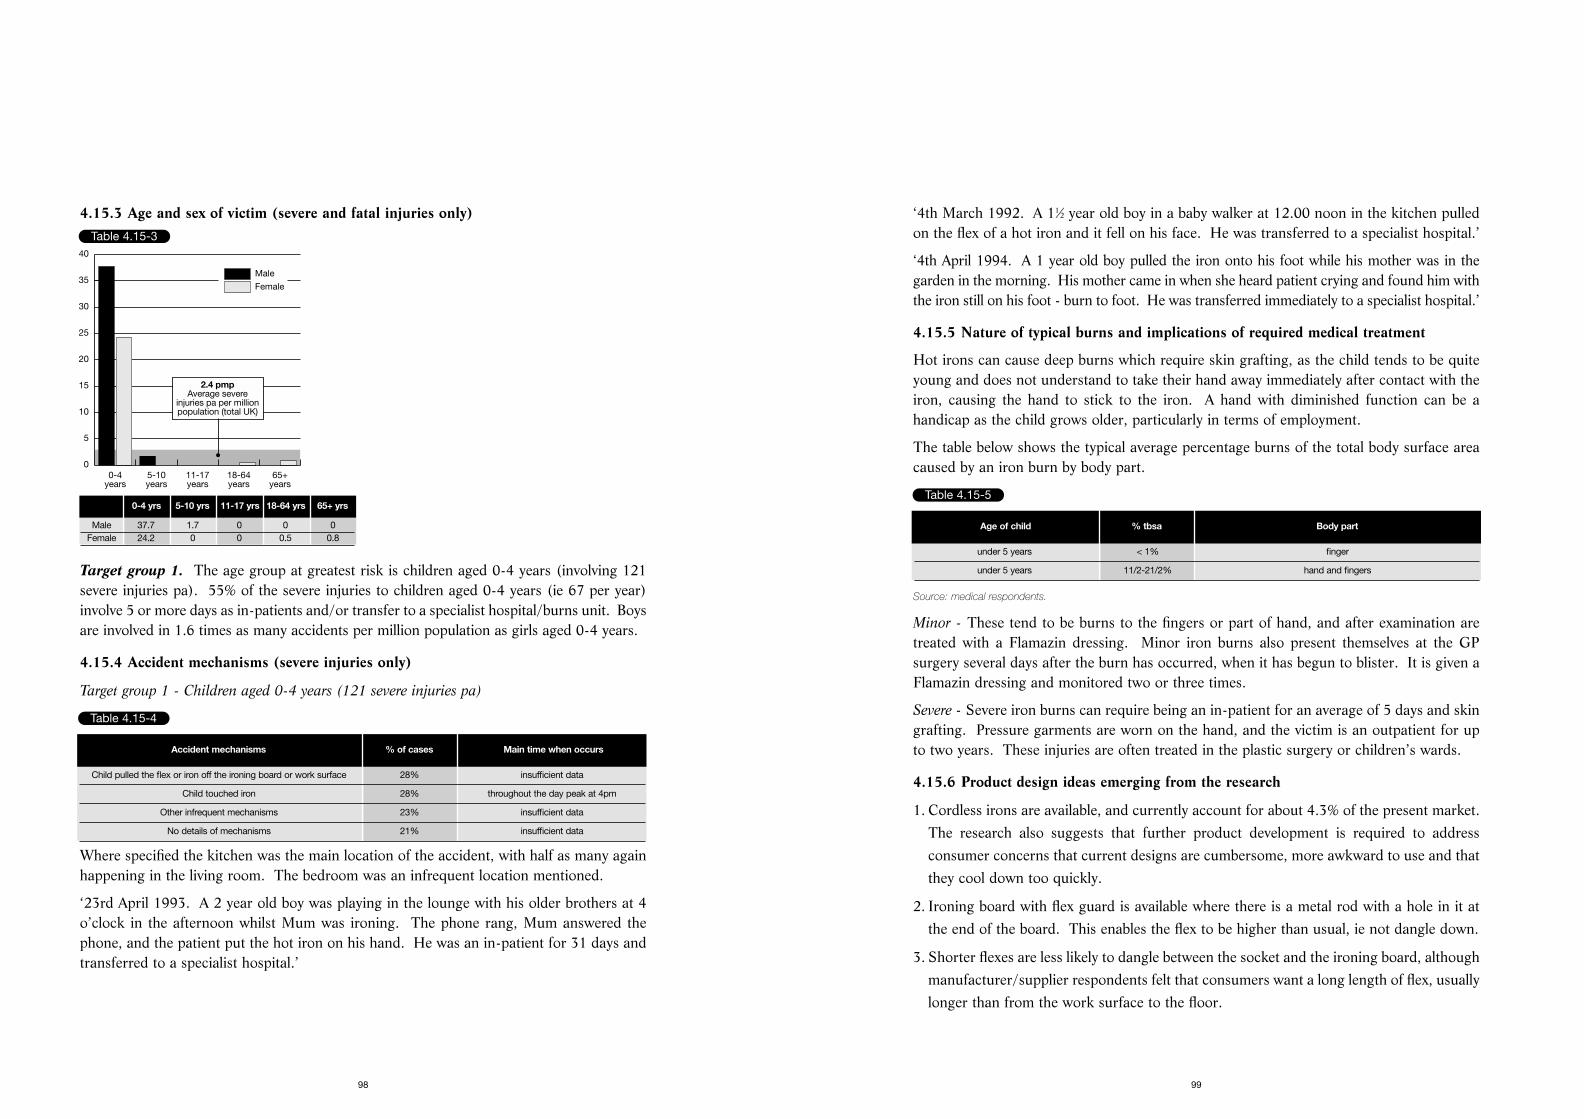
‘4th March 1992. A 11⁄2 year old boy in a baby walker at 12.00 noon in the kitchen pulledon the flex of a hot iron and it fell on his face. He was transferred to a specialist hospital.’
‘4th April 1994. A 1 year old boy pulled the iron onto his foot while his mother was in thegarden in the morning. His mother came in when she heard patient crying and found him withthe iron still on his foot - burn to foot. He was transferred immediately to a specialist hospital.’
4.15.5 Nature of typical burns and implications of required medical treatment
Hot irons can cause deep burns which require skin grafting, as the child tends to be quiteyoung and does not understand to take their hand away immediately after contact with theiron, causing the hand to stick to the iron. A hand with diminished function can be ahandicap as the child grows older, particularly in terms of employment.
The table below shows the typical average percentage burns of the total body surface areacaused by an iron burn by body part.
Source: medical respondents.
Minor - These tend to be burns to the fingers or part of hand, and after examination aretreated with a Flamazin dressing. Minor iron burns also present themselves at the GPsurgery several days after the burn has occurred, when it has begun to blister. It is given aFlamazin dressing and monitored two or three times.
Severe - Severe iron burns can require being an in-patient for an average of 5 days and skingrafting. Pressure garments are worn on the hand, and the victim is an outpatient for upto two years. These injuries are often treated in the plastic surgery or children’s wards.
4.15.6 Product design ideas emerging from the research
1. Cordless irons are available, and currently account for about 4.3% of the present market.The research also suggests that further product development is required to addressconsumer concerns that current designs are cumbersome, more awkward to use and thatthey cool down too quickly.
2. Ironing board with flex guard is available where there is a metal rod with a hole in it atthe end of the board. This enables the flex to be higher than usual, ie not dangle down.
3. Shorter flexes are less likely to dangle between the socket and the ironing board, althoughmanufacturer/supplier respondents felt that consumers want a long length of flex, usuallylonger than from the work surface to the floor.
99
4.15.3 Age and sex of victim (severe and fatal injuries only)
Target group 1. The age group at greatest risk is children aged 0-4 years (involving 121severe injuries pa). 55% of the severe injuries to children aged 0-4 years (ie 67 per year)involve 5 or more days as in-patients and/or transfer to a specialist hospital/burns unit. Boysare involved in 1.6 times as many accidents per million population as girls aged 0-4 years.
4.15.4 Accident mechanisms (severe injuries only)
Target group 1 - Children aged 0-4 years (121 severe injuries pa)
Where specified the kitchen was the main location of the accident, with half as many againhappening in the living room. The bedroom was an infrequent location mentioned.
‘23rd April 1993. A 2 year old boy was playing in the lounge with his older brothers at 4o’clock in the afternoon whilst Mum was ironing. The phone rang, Mum answered thephone, and the patient put the hot iron on his hand. He was an in-patient for 31 days andtransferred to a specialist hospital.’
98
Table 4.15-3
Female
Male
0-4years
5-10years
11-17years
18-64years
65+years
0
5
10
15
20
25
30
35
40
2.4 pmpAverage severe
injuries pa per millionpopulation (total UK)
0-4 yrs 5-10 yrs 11-17 yrs 18-64 yrs 65+ yrs
Male 37.7 1.7 0 0 0Female 24.2 0 0 0.5 0.8
Table 4.15-4
Accident mechanisms % of cases Main time when occurs
Child pulled the flex or iron off the ironing board or work surface 28% insufficient data
Child touched iron 28% throughout the day peak at 4pm
Other infrequent mechanisms 23% insufficient data
No details of mechanisms 21% insufficient data
Table 4.15-5
Age of child % tbsa Body part
under 5 years < 1% finger
under 5 years 11/2-21/2% hand and fingers
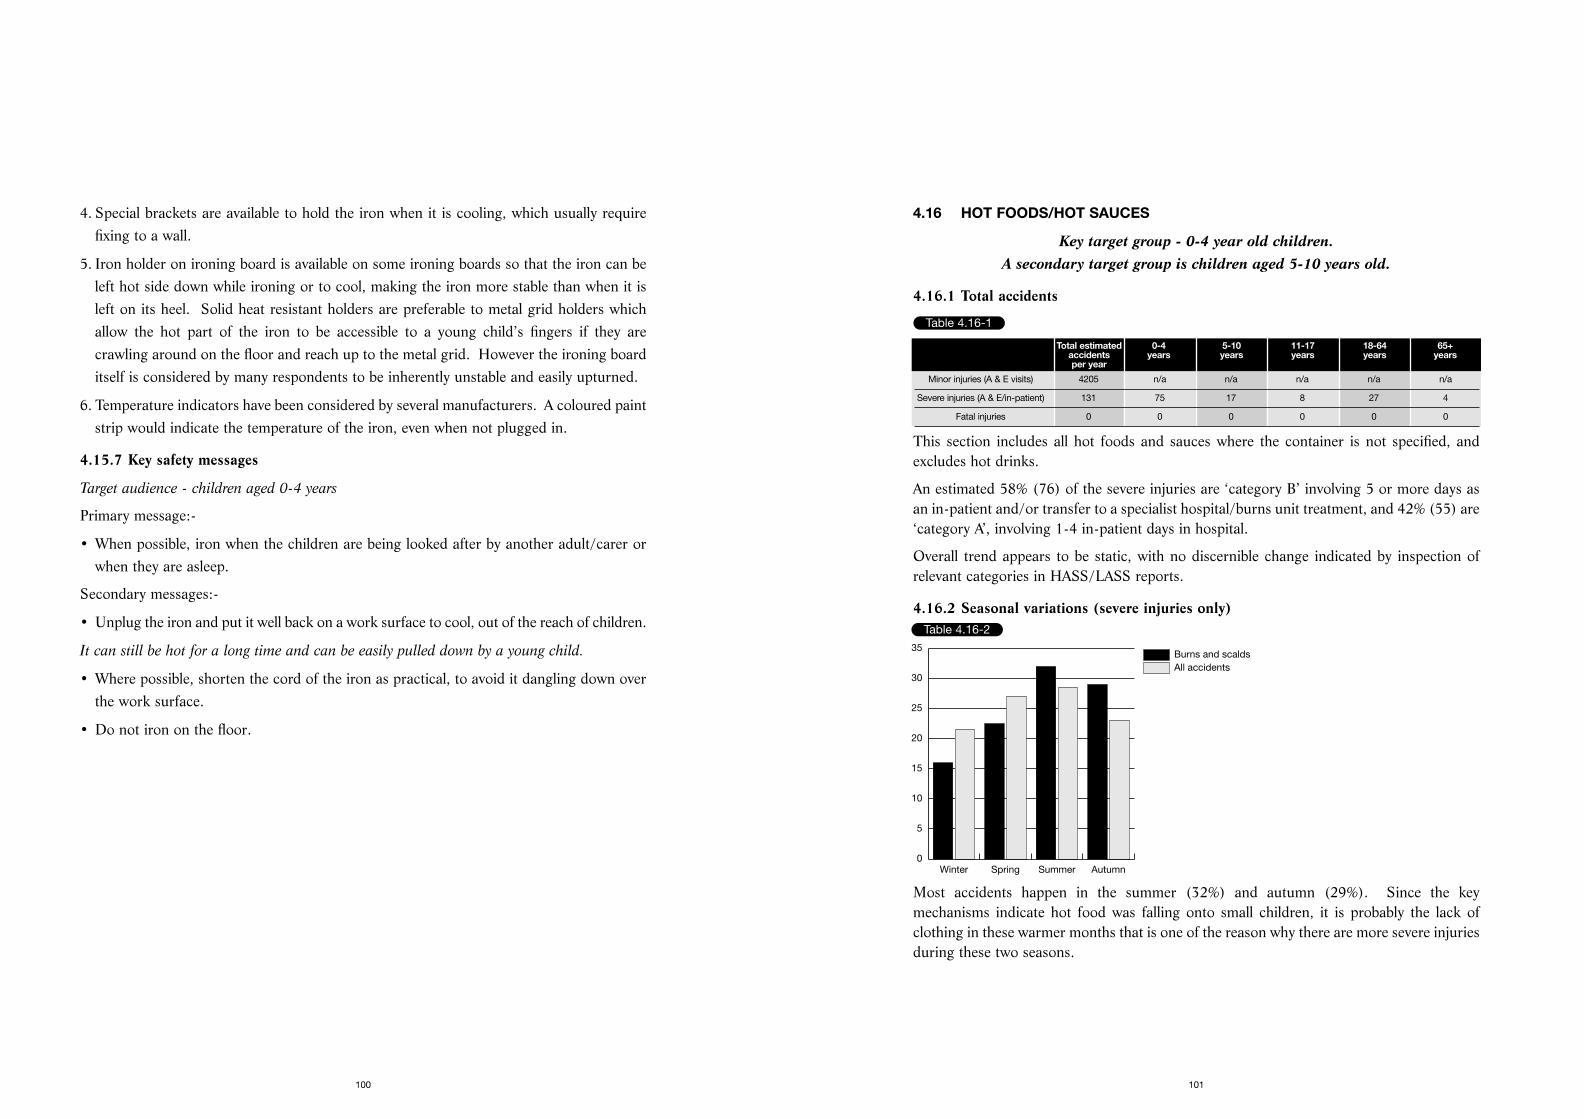
4.16 HOT FOODS/HOT SAUCES
Key target group - 0-4 year old children. A secondary target group is children aged 5-10 years old.
4.16.1 Total accidents
This section includes all hot foods and sauces where the container is not specified, andexcludes hot drinks.
An estimated 58% (76) of the severe injuries are ‘category B’ involving 5 or more days asan in-patient and/or transfer to a specialist hospital/burns unit treatment, and 42% (55) are‘category A’, involving 1-4 in-patient days in hospital.
Overall trend appears to be static, with no discernible change indicated by inspection ofrelevant categories in HASS/LASS reports.
4.16.2 Seasonal variations (severe injuries only)
Most accidents happen in the summer (32%) and autumn (29%). Since the keymechanisms indicate hot food was falling onto small children, it is probably the lack ofclothing in these warmer months that is one of the reason why there are more severe injuriesduring these two seasons.
101
4. Special brackets are available to hold the iron when it is cooling, which usually requirefixing to a wall.
5. Iron holder on ironing board is available on some ironing boards so that the iron can beleft hot side down while ironing or to cool, making the iron more stable than when it isleft on its heel. Solid heat resistant holders are preferable to metal grid holders whichallow the hot part of the iron to be accessible to a young child’s fingers if they arecrawling around on the floor and reach up to the metal grid. However the ironing boarditself is considered by many respondents to be inherently unstable and easily upturned.
6. Temperature indicators have been considered by several manufacturers. A coloured paintstrip would indicate the temperature of the iron, even when not plugged in.
4.15.7 Key safety messages
Target audience - children aged 0-4 years
Primary message:-
• When possible, iron when the children are being looked after by another adult/carer orwhen they are asleep.
Secondary messages:-
• Unplug the iron and put it well back on a work surface to cool, out of the reach of children.
It can still be hot for a long time and can be easily pulled down by a young child.
• Where possible, shorten the cord of the iron as practical, to avoid it dangling down overthe work surface.
• Do not iron on the floor.
100
Table 4.16-1
Total estimated 0-4 5-10 11-17 18-64 65+accidents years years years years yearsper year
Minor injuries (A & E visits) 4205 n/a n/a n/a n/a n/a
Severe injuries (A & E/in-patient) 131 75 17 8 27 4
Fatal injuries 0 0 0 0 0 0
Table 4.16-2
All accidentsBurns and scalds
Winter Spring Summer Autumn0
5
10
15
20
25
30
35
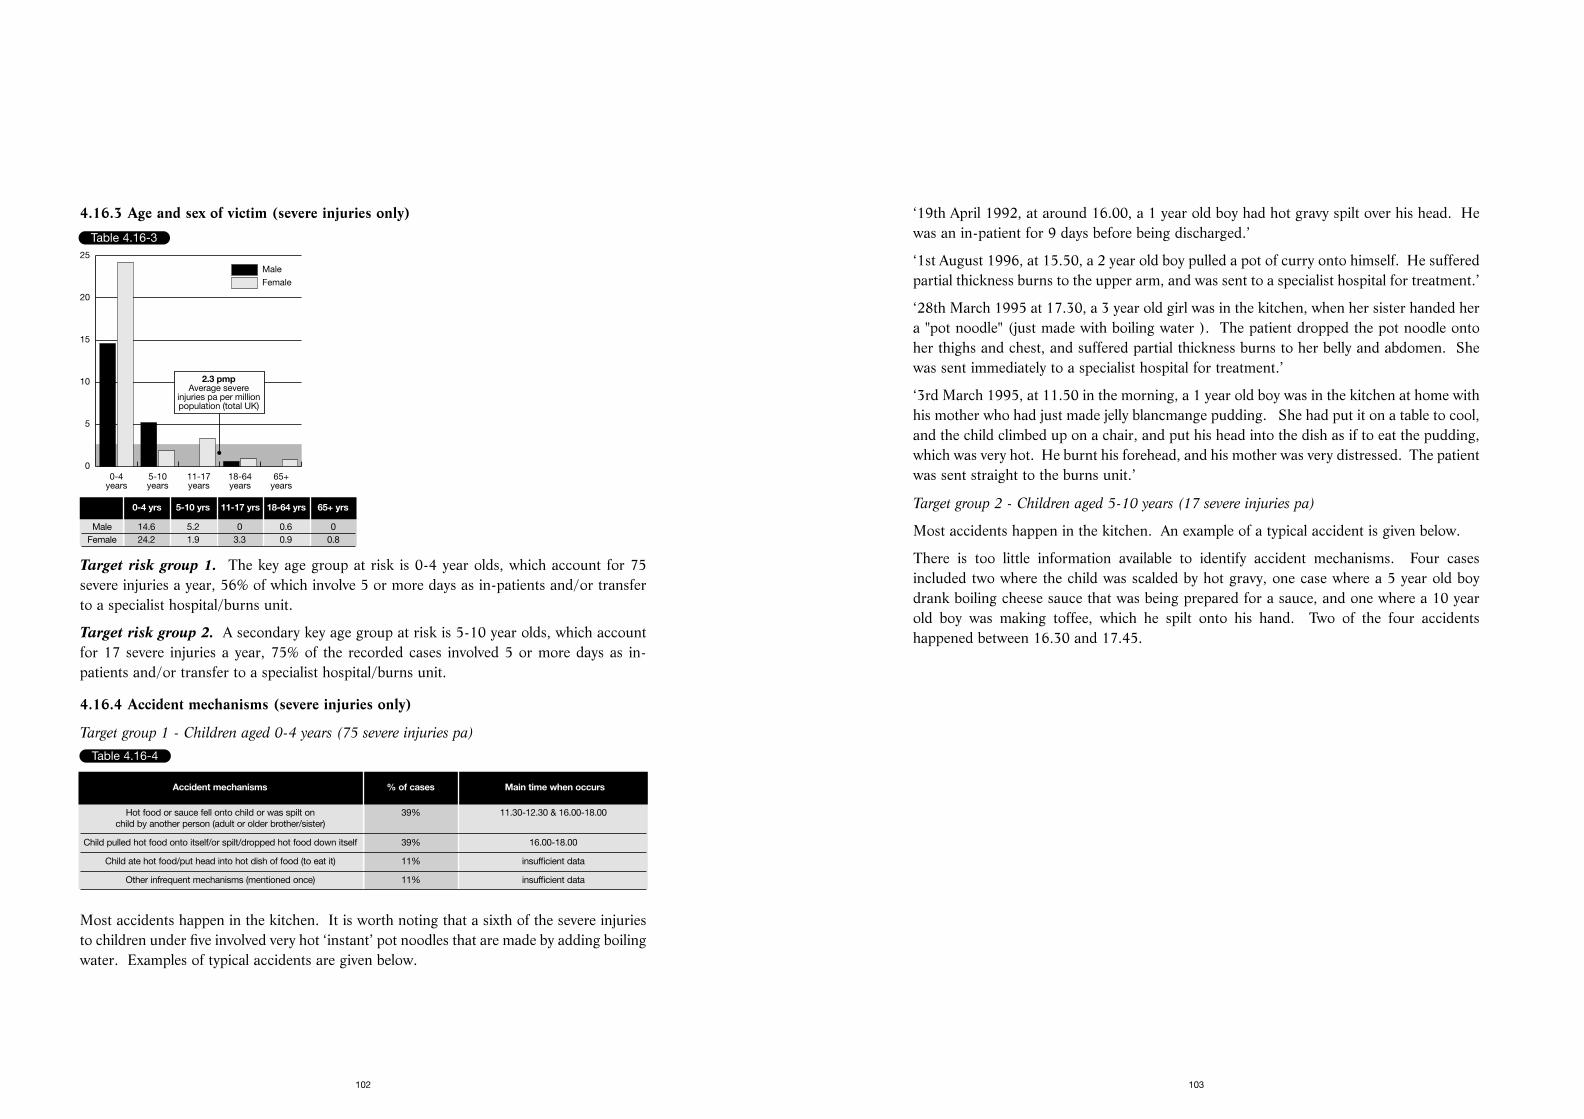
‘19th April 1992, at around 16.00, a 1 year old boy had hot gravy spilt over his head. Hewas an in-patient for 9 days before being discharged.’
‘1st August 1996, at 15.50, a 2 year old boy pulled a pot of curry onto himself. He sufferedpartial thickness burns to the upper arm, and was sent to a specialist hospital for treatment.’
‘28th March 1995 at 17.30, a 3 year old girl was in the kitchen, when her sister handed hera "pot noodle" (just made with boiling water ). The patient dropped the pot noodle ontoher thighs and chest, and suffered partial thickness burns to her belly and abdomen. Shewas sent immediately to a specialist hospital for treatment.’
‘3rd March 1995, at 11.50 in the morning, a 1 year old boy was in the kitchen at home withhis mother who had just made jelly blancmange pudding. She had put it on a table to cool,and the child climbed up on a chair, and put his head into the dish as if to eat the pudding,which was very hot. He burnt his forehead, and his mother was very distressed. The patientwas sent straight to the burns unit.’
Target group 2 - Children aged 5-10 years (17 severe injuries pa)
Most accidents happen in the kitchen. An example of a typical accident is given below.
There is too little information available to identify accident mechanisms. Four casesincluded two where the child was scalded by hot gravy, one case where a 5 year old boydrank boiling cheese sauce that was being prepared for a sauce, and one where a 10 yearold boy was making toffee, which he spilt onto his hand. Two of the four accidentshappened between 16.30 and 17.45.
103
4.16.3 Age and sex of victim (severe injuries only)
Target risk group 1. The key age group at risk is 0-4 year olds, which account for 75severe injuries a year, 56% of which involve 5 or more days as in-patients and/or transferto a specialist hospital/burns unit.
Target risk group 2. A secondary key age group at risk is 5-10 year olds, which accountfor 17 severe injuries a year, 75% of the recorded cases involved 5 or more days as in-patients and/or transfer to a specialist hospital/burns unit.
4.16.4 Accident mechanisms (severe injuries only)
Target group 1 - Children aged 0-4 years (75 severe injuries pa)
Most accidents happen in the kitchen. It is worth noting that a sixth of the severe injuriesto children under five involved very hot ‘instant’ pot noodles that are made by adding boilingwater. Examples of typical accidents are given below.
102
Table 4.16-3
Female
Male
0-4years
5-10years
11-17years
18-64years
65+years
0
5
10
15
20
25
2.3 pmpAverage severe
injuries pa per millionpopulation (total UK)
0-4 yrs 5-10 yrs 11-17 yrs 18-64 yrs 65+ yrs
Male 14.6 5.2 0 0.6 0Female 24.2 1.9 3.3 0.9 0.8
Table 4.16-4
Accident mechanisms % of cases Main time when occurs
Hot food or sauce fell onto child or was spilt on 39% 11.30-12.30 & 16.00-18.00child by another person (adult or older brother/sister)
Child pulled hot food onto itself/or spilt/dropped hot food down itself 39% 16.00-18.00
Child ate hot food/put head into hot dish of food (to eat it) 11% insufficient data
Other infrequent mechanisms (mentioned once) 11% insufficient data
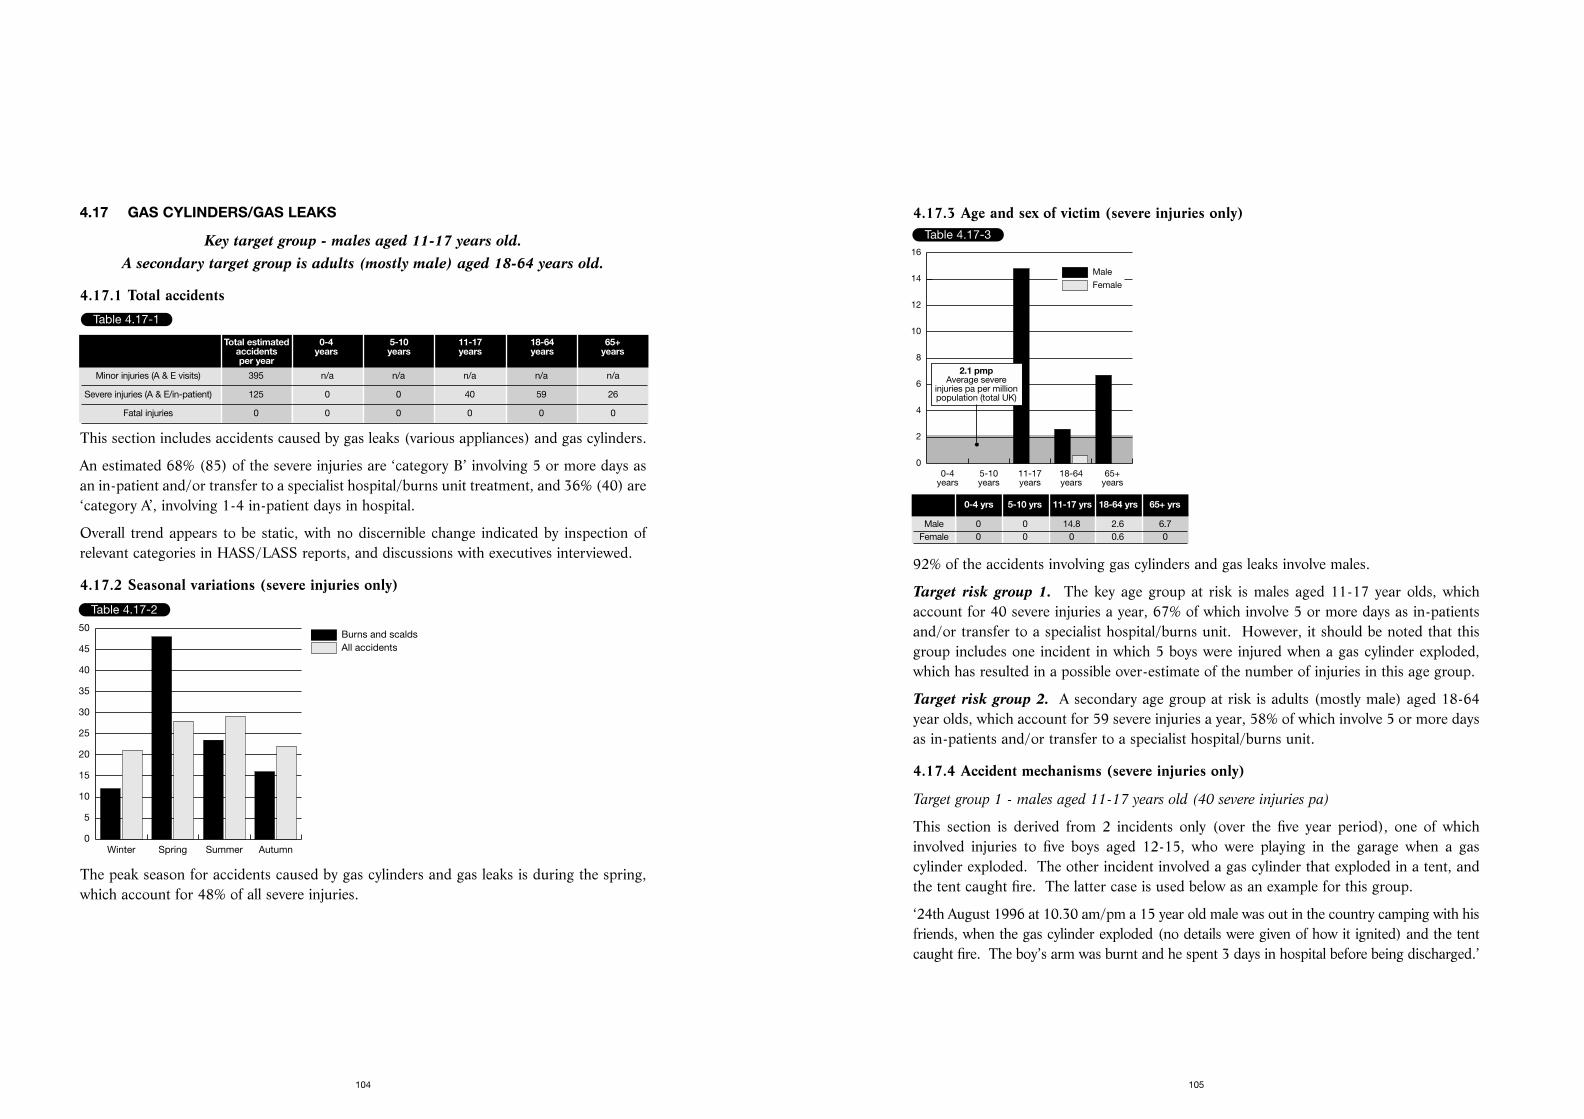
4.17.3 Age and sex of victim (severe injuries only)
92% of the accidents involving gas cylinders and gas leaks involve males.
Target risk group 1. The key age group at risk is males aged 11-17 year olds, whichaccount for 40 severe injuries a year, 67% of which involve 5 or more days as in-patientsand/or transfer to a specialist hospital/burns unit. However, it should be noted that thisgroup includes one incident in which 5 boys were injured when a gas cylinder exploded,which has resulted in a possible over-estimate of the number of injuries in this age group.
Target risk group 2. A secondary age group at risk is adults (mostly male) aged 18-64year olds, which account for 59 severe injuries a year, 58% of which involve 5 or more daysas in-patients and/or transfer to a specialist hospital/burns unit.
4.17.4 Accident mechanisms (severe injuries only)
Target group 1 - males aged 11-17 years old (40 severe injuries pa)
This section is derived from 2 incidents only (over the five year period), one of whichinvolved injuries to five boys aged 12-15, who were playing in the garage when a gascylinder exploded. The other incident involved a gas cylinder that exploded in a tent, andthe tent caught fire. The latter case is used below as an example for this group.
‘24th August 1996 at 10.30 am/pm a 15 year old male was out in the country camping with hisfriends, when the gas cylinder exploded (no details were given of how it ignited) and the tentcaught fire. The boy’s arm was burnt and he spent 3 days in hospital before being discharged.’
105
4.17 GAS CYLINDERS/GAS LEAKS
Key target group - males aged 11-17 years old. A secondary target group is adults (mostly male) aged 18-64 years old.
4.17.1 Total accidents
This section includes accidents caused by gas leaks (various appliances) and gas cylinders.
An estimated 68% (85) of the severe injuries are ‘category B’ involving 5 or more days asan in-patient and/or transfer to a specialist hospital/burns unit treatment, and 36% (40) are‘category A’, involving 1-4 in-patient days in hospital.
Overall trend appears to be static, with no discernible change indicated by inspection ofrelevant categories in HASS/LASS reports, and discussions with executives interviewed.
4.17.2 Seasonal variations (severe injuries only)
The peak season for accidents caused by gas cylinders and gas leaks is during the spring,which account for 48% of all severe injuries.
104
Table 4.17-1
Total estimated 0-4 5-10 11-17 18-64 65+accidents years years years years yearsper year
Minor injuries (A & E visits) 395 n/a n/a n/a n/a n/a
Severe injuries (A & E/in-patient) 125 0 0 40 59 26
Fatal injuries 0 0 0 0 0 0
Table 4.17-2
All accidentsBurns and scalds
Winter Spring Summer Autumn0
5
10
15
20
25
30
35
40
45
50
Table 4.17-3
Female
Male
0-4years
5-10years
11-17years
18-64years
65+years
0
2
4
6
8
10
12
14
16
2.1 pmpAverage severe
injuries pa per millionpopulation (total UK)
0-4 yrs 5-10 yrs 11-17 yrs 18-64 yrs 65+ yrs
Male 0 0 14.8 2.6 6.7Female 0 0 0 0.6 0
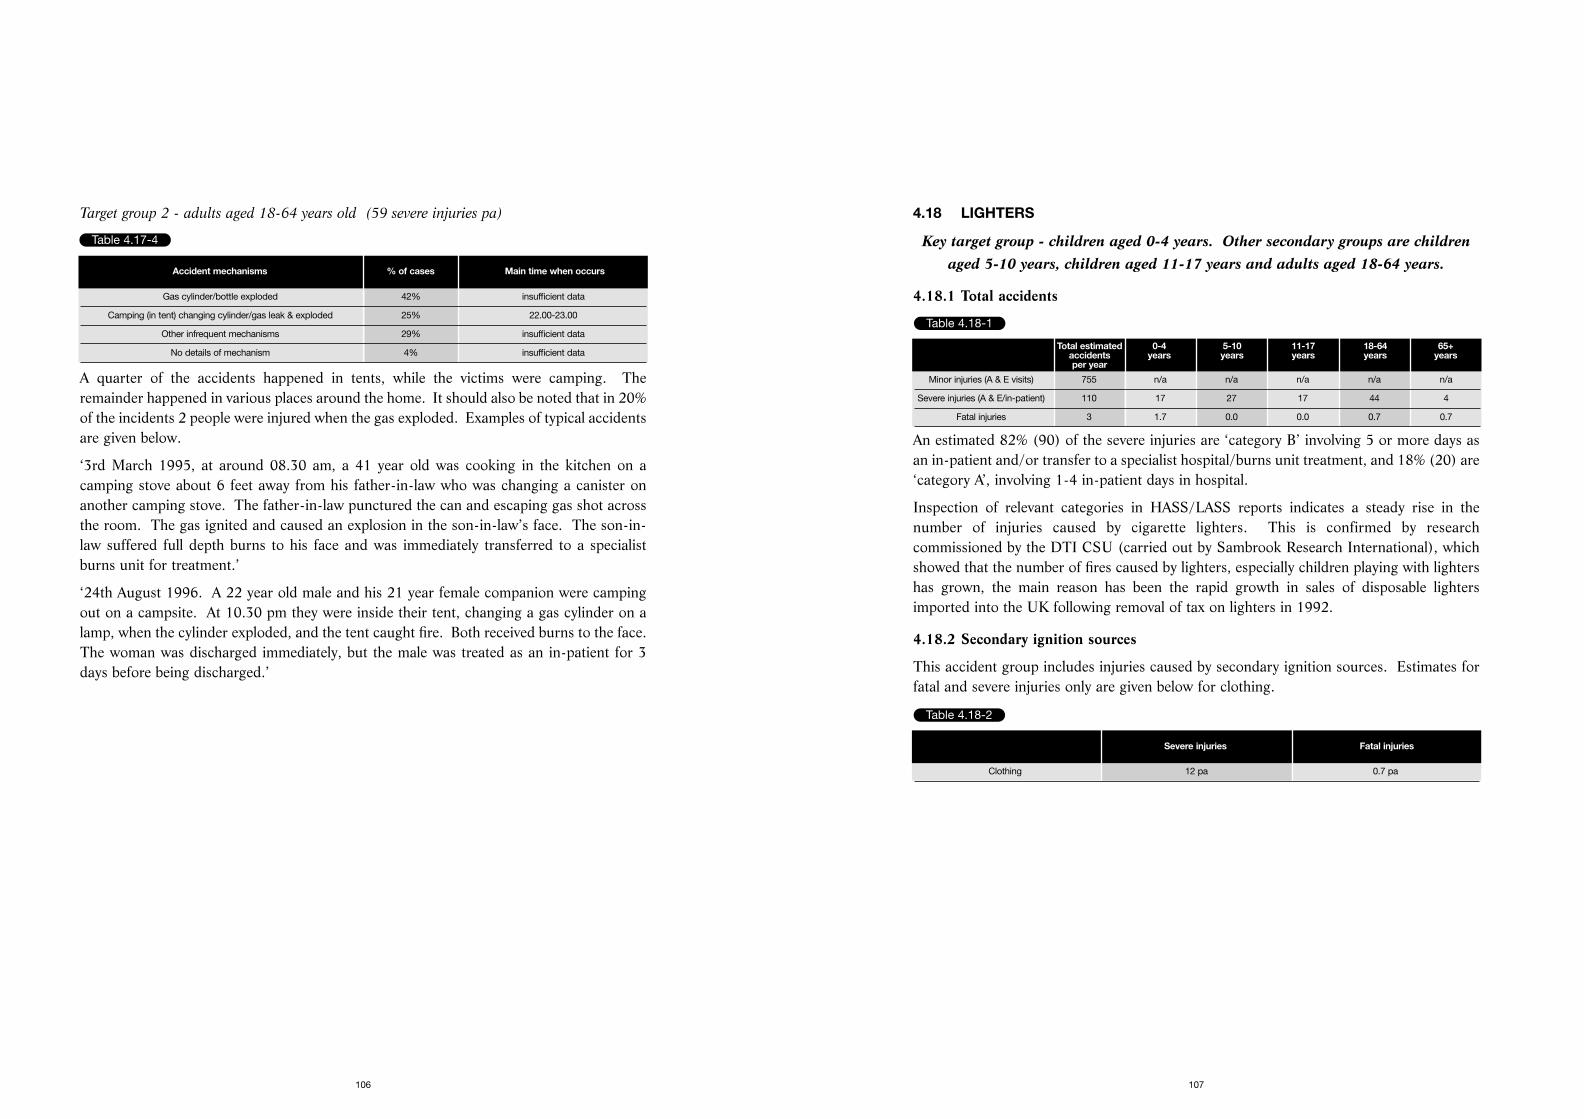
4.18 LIGHTERS
Key target group - children aged 0-4 years. Other secondary groups are childrenaged 5-10 years, children aged 11-17 years and adults aged 18-64 years.
4.18.1 Total accidents
An estimated 82% (90) of the severe injuries are ‘category B’ involving 5 or more days asan in-patient and/or transfer to a specialist hospital/burns unit treatment, and 18% (20) are‘category A’, involving 1-4 in-patient days in hospital.
Inspection of relevant categories in HASS/LASS reports indicates a steady rise in thenumber of injuries caused by cigarette lighters. This is confirmed by researchcommissioned by the DTI CSU (carried out by Sambrook Research International), whichshowed that the number of fires caused by lighters, especially children playing with lightershas grown, the main reason has been the rapid growth in sales of disposable lightersimported into the UK following removal of tax on lighters in 1992.
4.18.2 Secondary ignition sources
This accident group includes injuries caused by secondary ignition sources. Estimates forfatal and severe injuries only are given below for clothing.
107
Target group 2 - adults aged 18-64 years old (59 severe injuries pa)
A quarter of the accidents happened in tents, while the victims were camping. Theremainder happened in various places around the home. It should also be noted that in 20%of the incidents 2 people were injured when the gas exploded. Examples of typical accidentsare given below.
‘3rd March 1995, at around 08.30 am, a 41 year old was cooking in the kitchen on acamping stove about 6 feet away from his father-in-law who was changing a canister onanother camping stove. The father-in-law punctured the can and escaping gas shot acrossthe room. The gas ignited and caused an explosion in the son-in-law’s face. The son-in-law suffered full depth burns to his face and was immediately transferred to a specialistburns unit for treatment.’
‘24th August 1996. A 22 year old male and his 21 year female companion were campingout on a campsite. At 10.30 pm they were inside their tent, changing a gas cylinder on alamp, when the cylinder exploded, and the tent caught fire. Both received burns to the face.The woman was discharged immediately, but the male was treated as an in-patient for 3days before being discharged.’
106
Table 4.17-4
Accident mechanisms % of cases Main time when occurs
Gas cylinder/bottle exploded 42% insufficient data
Camping (in tent) changing cylinder/gas leak & exploded 25% 22.00-23.00
Other infrequent mechanisms 29% insufficient data
No details of mechanism 4% insufficient data
Table 4.18-1
Total estimated 0-4 5-10 11-17 18-64 65+accidents years years years years yearsper year
Minor injuries (A & E visits) 755 n/a n/a n/a n/a n/a
Severe injuries (A & E/in-patient) 110 17 27 17 44 4
Fatal injuries 3 1.7 0.0 0.0 0.7 0.7
Table 4.18-2
Severe injuries Fatal injuries
Clothing 12 pa 0.7 pa
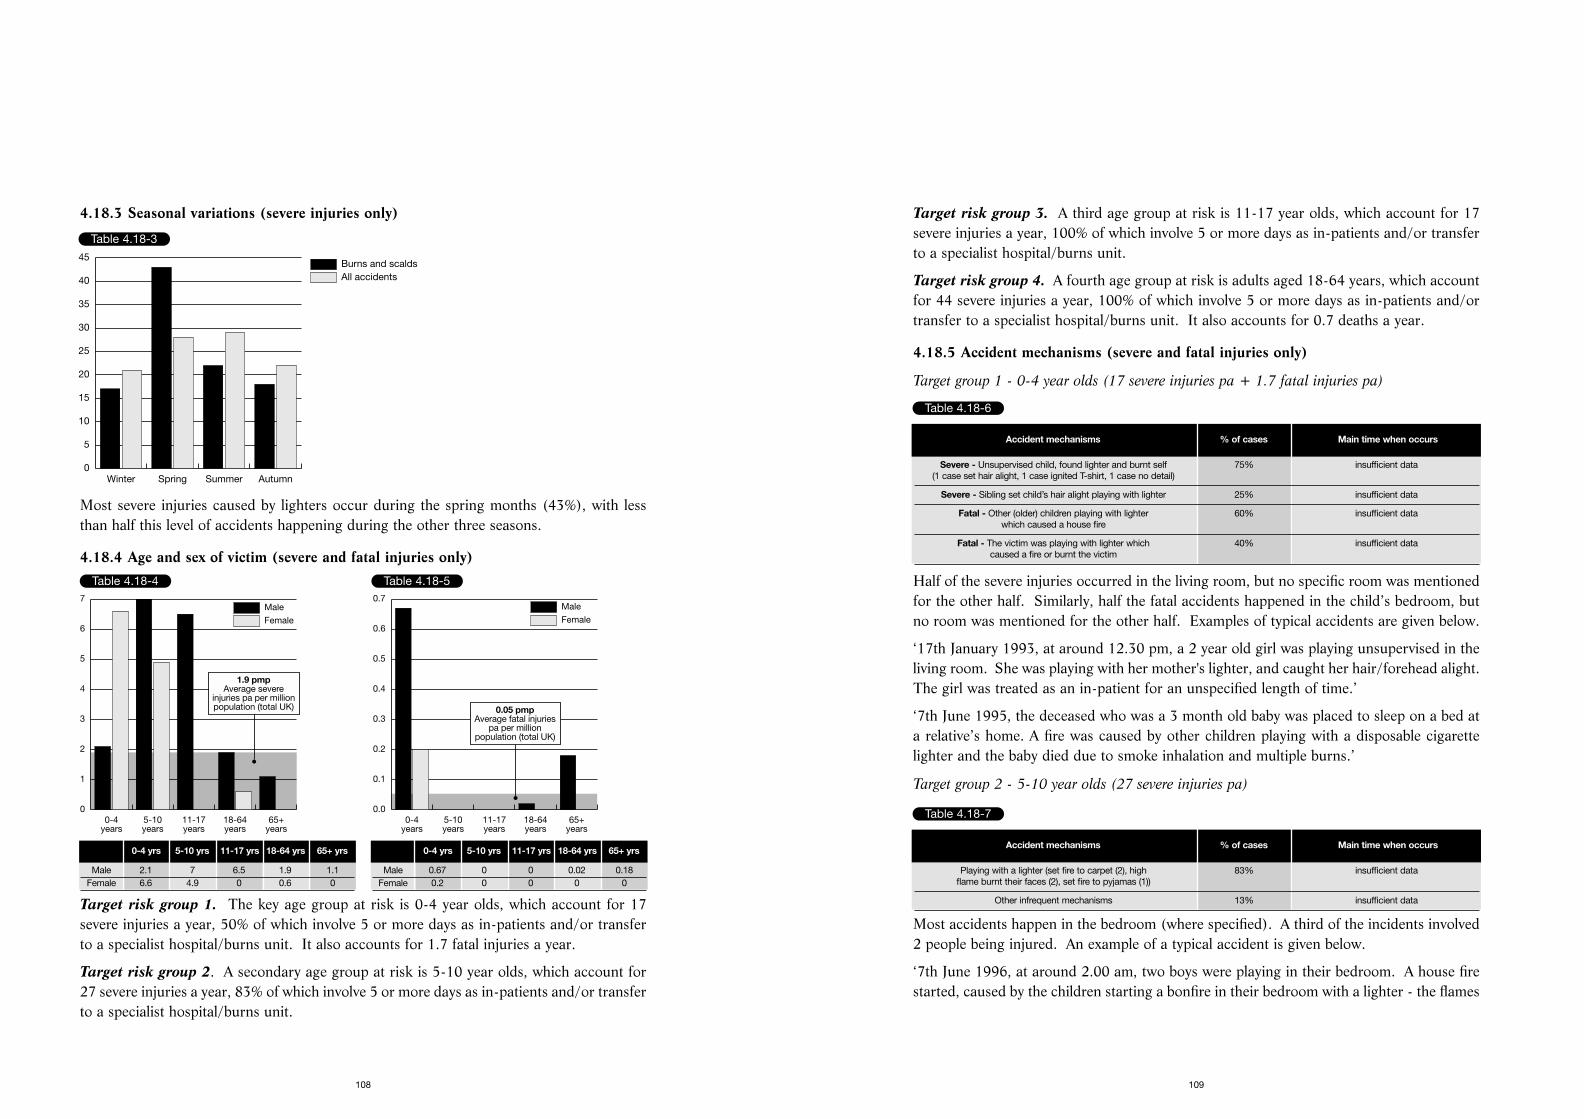
Target risk group 3. A third age group at risk is 11-17 year olds, which account for 17severe injuries a year, 100% of which involve 5 or more days as in-patients and/or transferto a specialist hospital/burns unit.
Target risk group 4. A fourth age group at risk is adults aged 18-64 years, which accountfor 44 severe injuries a year, 100% of which involve 5 or more days as in-patients and/ortransfer to a specialist hospital/burns unit. It also accounts for 0.7 deaths a year.
4.18.5 Accident mechanisms (severe and fatal injuries only)
Target group 1 - 0-4 year olds (17 severe injuries pa + 1.7 fatal injuries pa)
Half of the severe injuries occurred in the living room, but no specific room was mentionedfor the other half. Similarly, half the fatal accidents happened in the child’s bedroom, butno room was mentioned for the other half. Examples of typical accidents are given below.
‘17th January 1993, at around 12.30 pm, a 2 year old girl was playing unsupervised in theliving room. She was playing with her mother's lighter, and caught her hair/forehead alight.The girl was treated as an in-patient for an unspecified length of time.’
‘7th June 1995, the deceased who was a 3 month old baby was placed to sleep on a bed ata relative’s home. A fire was caused by other children playing with a disposable cigarettelighter and the baby died due to smoke inhalation and multiple burns.’
Target group 2 - 5-10 year olds (27 severe injuries pa)
Most accidents happen in the bedroom (where specified). A third of the incidents involved2 people being injured. An example of a typical accident is given below.
‘7th June 1996, at around 2.00 am, two boys were playing in their bedroom. A house firestarted, caused by the children starting a bonfire in their bedroom with a lighter - the flames
109
4.18.3 Seasonal variations (severe injuries only)
Most severe injuries caused by lighters occur during the spring months (43%), with lessthan half this level of accidents happening during the other three seasons.
4.18.4 Age and sex of victim (severe and fatal injuries only)
Target risk group 1. The key age group at risk is 0-4 year olds, which account for 17severe injuries a year, 50% of which involve 5 or more days as in-patients and/or transferto a specialist hospital/burns unit. It also accounts for 1.7 fatal injuries a year.
Target risk group 2. A secondary age group at risk is 5-10 year olds, which account for27 severe injuries a year, 83% of which involve 5 or more days as in-patients and/or transferto a specialist hospital/burns unit.
108
Table 4.18-3
All accidentsBurns and scalds
Winter Spring Summer Autumn0
5
10
15
20
25
30
35
40
45
Table 4.18-4
Female
Male
0-4years
5-10years
11-17years
18-64years
65+years
0
1
2
3
4
5
6
7
1.9 pmpAverage severe
injuries pa per millionpopulation (total UK)
0-4 yrs 5-10 yrs 11-17 yrs 18-64 yrs 65+ yrs
Male 2.1 7 6.5 1.9 1.1Female 6.6 4.9 0 0.6 0
Table 4.18-5
Female
Male
0-4years
5-10years
11-17years
18-64years
65+years
0.0
0.1
0.2
0.3
0.4
0.5
0.6
0.7
0.05 pmpAverage fatal injuries
pa per millionpopulation (total UK)
0-4 yrs 5-10 yrs 11-17 yrs 18-64 yrs 65+ yrs
Male 0.67 0 0 0.02 0.18Female 0.2 0 0 0 0
Table 4.18-6
Accident mechanisms % of cases Main time when occurs
Severe - Unsupervised child, found lighter and burnt self 75% insufficient data(1 case set hair alight, 1 case ignited T-shirt, 1 case no detail)
Severe - Sibling set child’s hair alight playing with lighter 25% insufficient data
Fatal - Other (older) children playing with lighter 60% insufficient data which caused a house fire
Fatal - The victim was playing with lighter which 40% insufficient datacaused a fire or burnt the victim
Table 4.18-7
Accident mechanisms % of cases Main time when occurs
Playing with a lighter (set fire to carpet (2), high 83% insufficient dataflame burnt their faces (2), set fire to pyjamas (1))
Other infrequent mechanisms 13% insufficient data
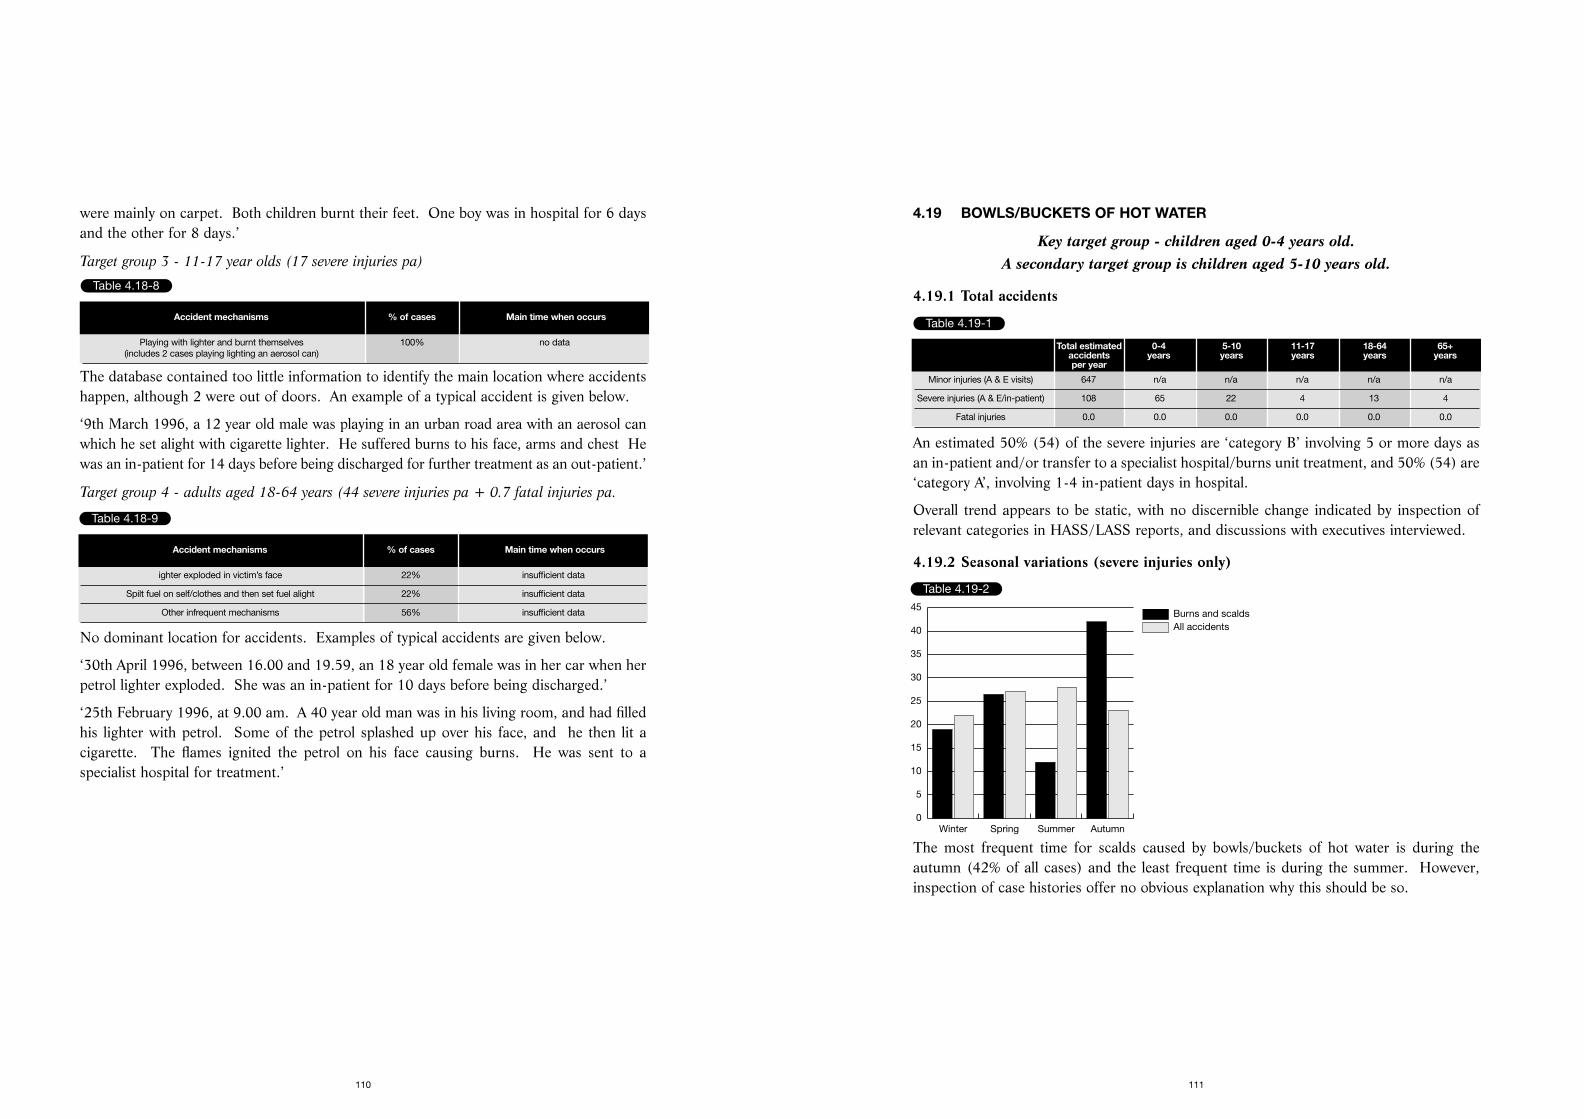
4.19 BOWLS/BUCKETS OF HOT WATER
Key target group - children aged 0-4 years old. A secondary target group is children aged 5-10 years old.
4.19.1 Total accidents
An estimated 50% (54) of the severe injuries are ‘category B’ involving 5 or more days asan in-patient and/or transfer to a specialist hospital/burns unit treatment, and 50% (54) are‘category A’, involving 1-4 in-patient days in hospital.
Overall trend appears to be static, with no discernible change indicated by inspection ofrelevant categories in HASS/LASS reports, and discussions with executives interviewed.
4.19.2 Seasonal variations (severe injuries only)
The most frequent time for scalds caused by bowls/buckets of hot water is during theautumn (42% of all cases) and the least frequent time is during the summer. However,inspection of case histories offer no obvious explanation why this should be so.
111
were mainly on carpet. Both children burnt their feet. One boy was in hospital for 6 daysand the other for 8 days.’
Target group 3 - 11-17 year olds (17 severe injuries pa)
The database contained too little information to identify the main location where accidentshappen, although 2 were out of doors. An example of a typical accident is given below.
‘9th March 1996, a 12 year old male was playing in an urban road area with an aerosol canwhich he set alight with cigarette lighter. He suffered burns to his face, arms and chest Hewas an in-patient for 14 days before being discharged for further treatment as an out-patient.’
Target group 4 - adults aged 18-64 years (44 severe injuries pa + 0.7 fatal injuries pa.
No dominant location for accidents. Examples of typical accidents are given below.
‘30th April 1996, between 16.00 and 19.59, an 18 year old female was in her car when herpetrol lighter exploded. She was an in-patient for 10 days before being discharged.’
‘25th February 1996, at 9.00 am. A 40 year old man was in his living room, and had filledhis lighter with petrol. Some of the petrol splashed up over his face, and he then lit acigarette. The flames ignited the petrol on his face causing burns. He was sent to aspecialist hospital for treatment.’
110
Table 4.18-8
Accident mechanisms % of cases Main time when occurs
Playing with lighter and burnt themselves 100% no data(includes 2 cases playing lighting an aerosol can)
Table 4.18-9
Accident mechanisms % of cases Main time when occurs
ighter exploded in victim’s face 22% insufficient data
Spilt fuel on self/clothes and then set fuel alight 22% insufficient data
Other infrequent mechanisms 56% insufficient data
Table 4.19-1
Total estimated 0-4 5-10 11-17 18-64 65+accidents years years years years yearsper year
Minor injuries (A & E visits) 647 n/a n/a n/a n/a n/a
Severe injuries (A & E/in-patient) 108 65 22 4 13 4
Fatal injuries 0.0 0.0 0.0 0.0 0.0 0.0
Table 4.19-2
All accidentsBurns and scalds
Winter Spring Summer Autumn0
5
10
15
20
25
30
35
40
45
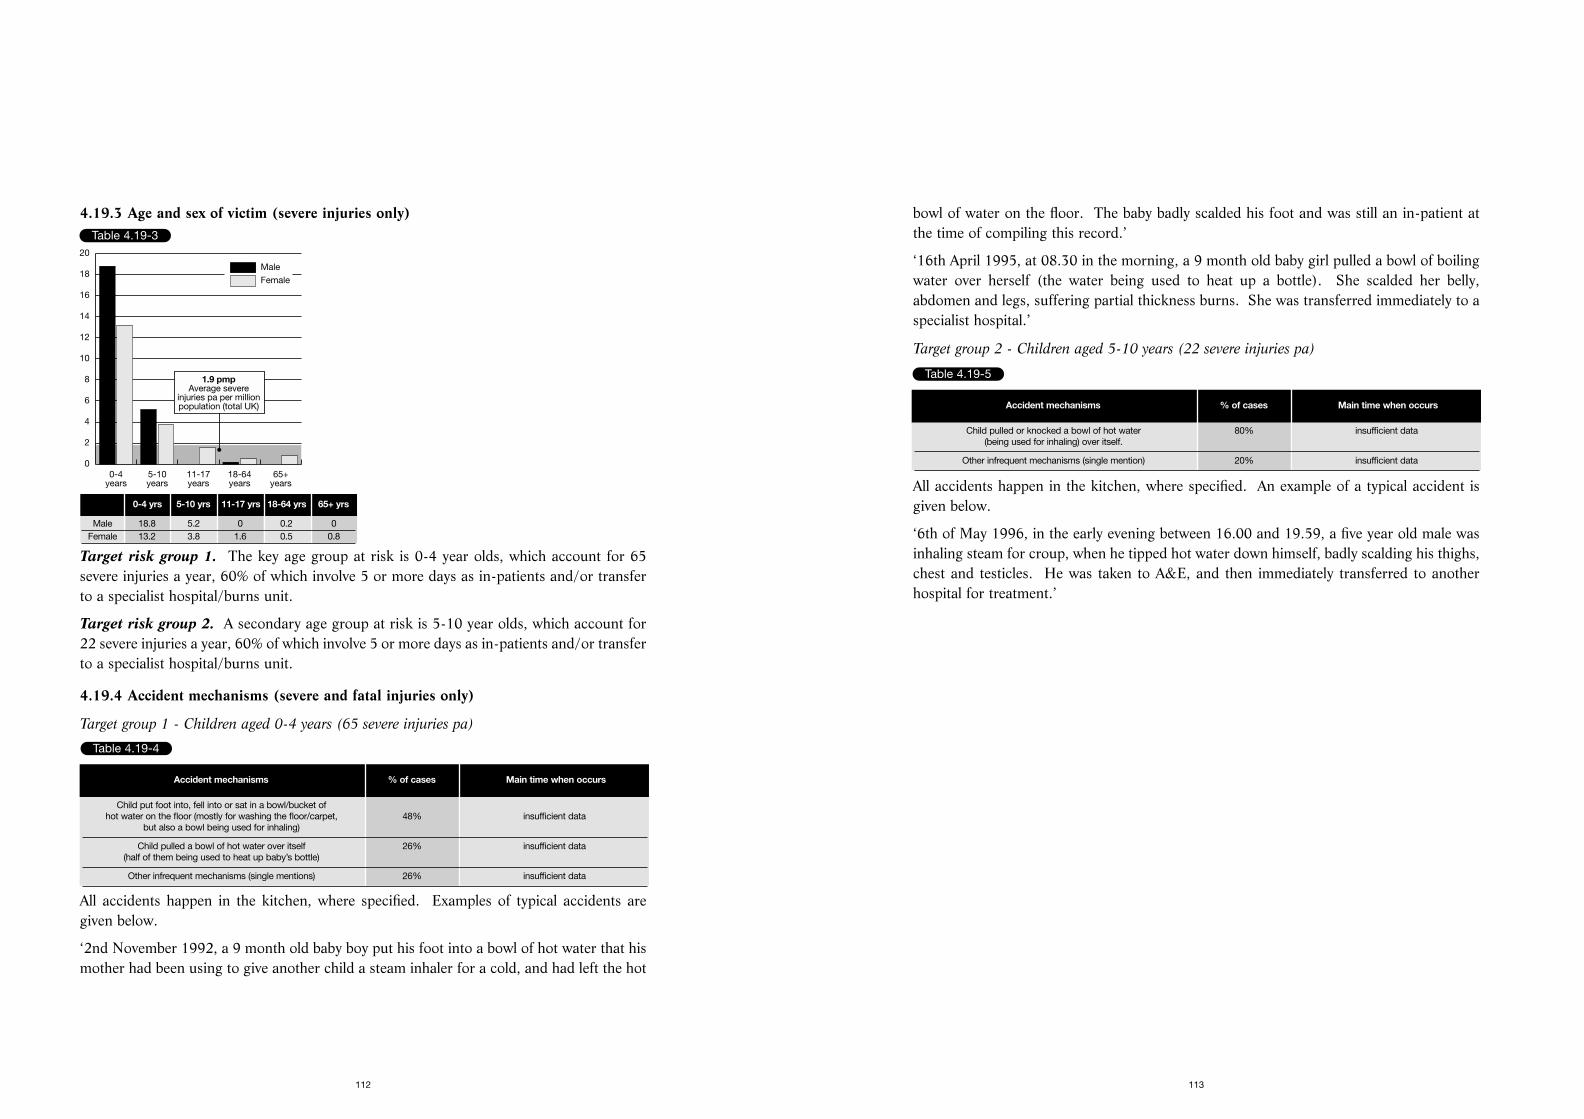
bowl of water on the floor. The baby badly scalded his foot and was still an in-patient atthe time of compiling this record.’
‘16th April 1995, at 08.30 in the morning, a 9 month old baby girl pulled a bowl of boilingwater over herself (the water being used to heat up a bottle). She scalded her belly,abdomen and legs, suffering partial thickness burns. She was transferred immediately to aspecialist hospital.’
Target group 2 - Children aged 5-10 years (22 severe injuries pa)
All accidents happen in the kitchen, where specified. An example of a typical accident isgiven below.
‘6th of May 1996, in the early evening between 16.00 and 19.59, a five year old male wasinhaling steam for croup, when he tipped hot water down himself, badly scalding his thighs,chest and testicles. He was taken to A&E, and then immediately transferred to anotherhospital for treatment.’
113
4.19.3 Age and sex of victim (severe injuries only)
Target risk group 1. The key age group at risk is 0-4 year olds, which account for 65severe injuries a year, 60% of which involve 5 or more days as in-patients and/or transferto a specialist hospital/burns unit.
Target risk group 2. A secondary age group at risk is 5-10 year olds, which account for22 severe injuries a year, 60% of which involve 5 or more days as in-patients and/or transferto a specialist hospital/burns unit.
4.19.4 Accident mechanisms (severe and fatal injuries only)
Target group 1 - Children aged 0-4 years (65 severe injuries pa)
All accidents happen in the kitchen, where specified. Examples of typical accidents aregiven below.
‘2nd November 1992, a 9 month old baby boy put his foot into a bowl of hot water that hismother had been using to give another child a steam inhaler for a cold, and had left the hot
112
Table 4.19-3
Female
Male
0-4years
5-10years
11-17years
18-64years
65+years
0
2
4
6
8
10
12
14
16
18
20
1.9 pmpAverage severe
injuries pa per millionpopulation (total UK)
0-4 yrs 5-10 yrs 11-17 yrs 18-64 yrs 65+ yrs
Male 18.8 5.2 0 0.2 0Female 13.2 3.8 1.6 0.5 0.8
Table 4.19-4
Accident mechanisms % of cases Main time when occurs
Child put foot into, fell into or sat in a bowl/bucket of hot water on the floor (mostly for washing the floor/carpet, 48% insufficient data
but also a bowl being used for inhaling)
Child pulled a bowl of hot water over itself 26% insufficient data(half of them being used to heat up baby’s bottle)
Other infrequent mechanisms (single mentions) 26% insufficient data
Table 4.19-5
Accident mechanisms % of cases Main time when occurs
Child pulled or knocked a bowl of hot water 80% insufficient data(being used for inhaling) over itself.
Other infrequent mechanisms (single mention) 20% insufficient data
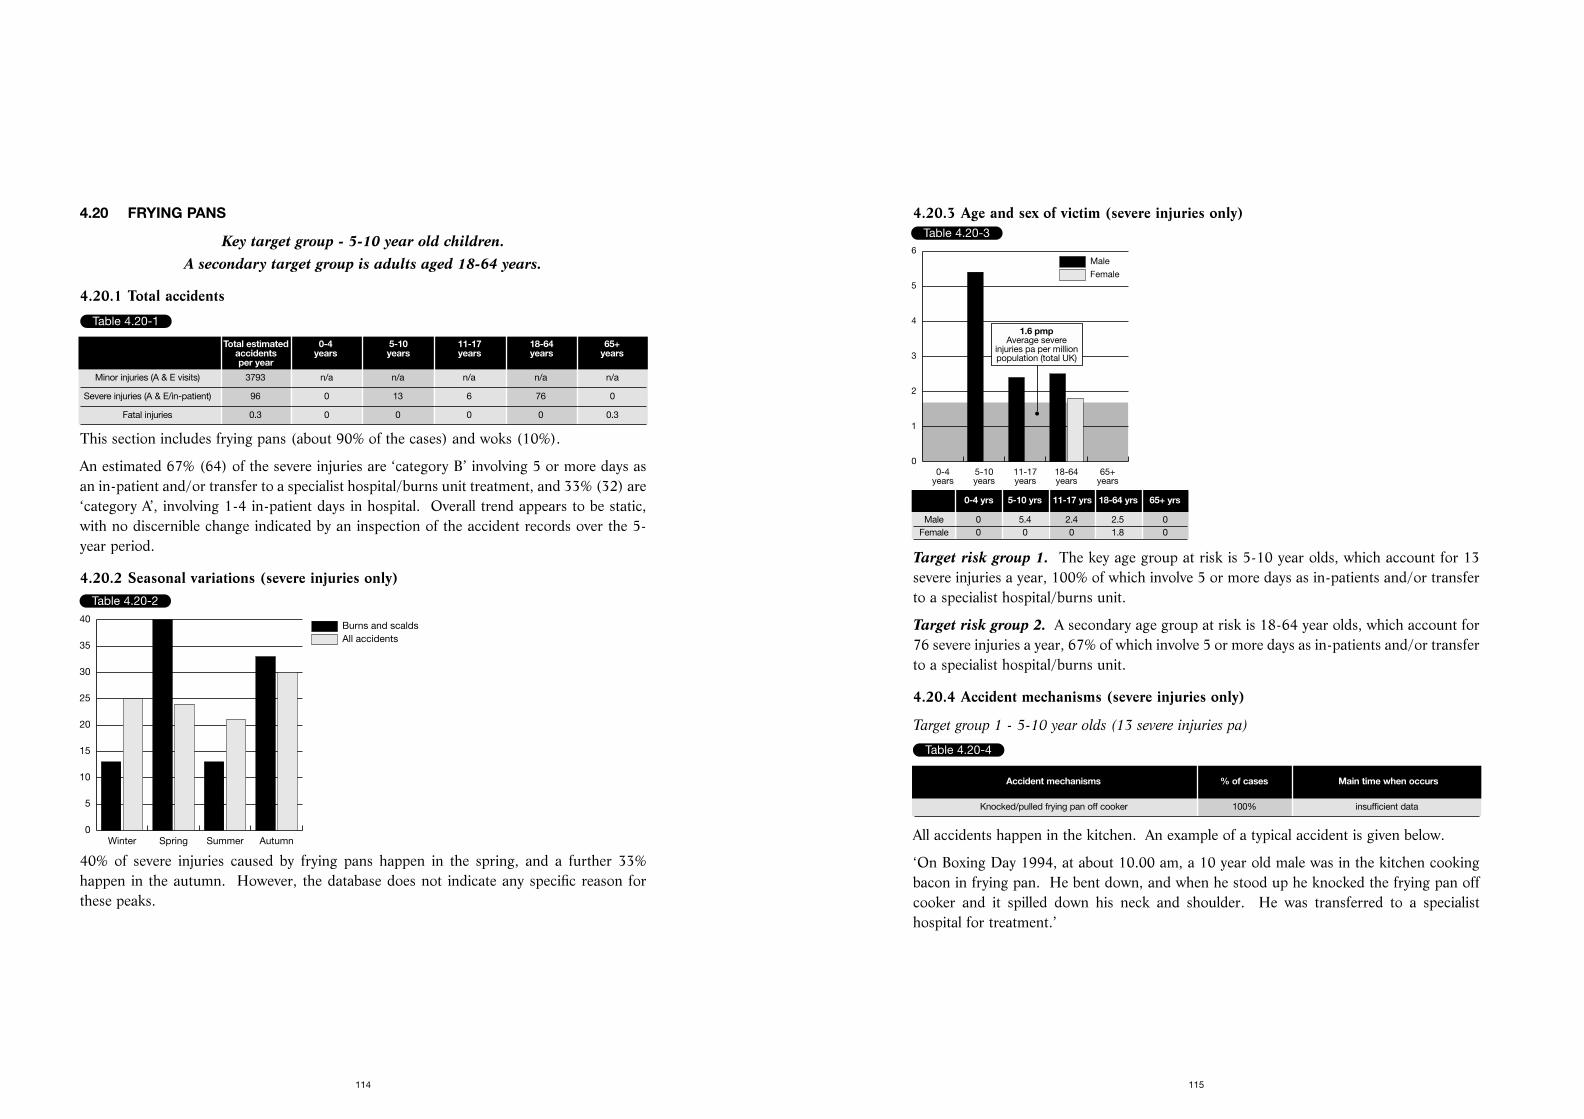
4.20.3 Age and sex of victim (severe injuries only)
Target risk group 1. The key age group at risk is 5-10 year olds, which account for 13severe injuries a year, 100% of which involve 5 or more days as in-patients and/or transferto a specialist hospital/burns unit.
Target risk group 2. A secondary age group at risk is 18-64 year olds, which account for76 severe injuries a year, 67% of which involve 5 or more days as in-patients and/or transferto a specialist hospital/burns unit.
4.20.4 Accident mechanisms (severe injuries only)
Target group 1 - 5-10 year olds (13 severe injuries pa)
All accidents happen in the kitchen. An example of a typical accident is given below.
‘On Boxing Day 1994, at about 10.00 am, a 10 year old male was in the kitchen cookingbacon in frying pan. He bent down, and when he stood up he knocked the frying pan offcooker and it spilled down his neck and shoulder. He was transferred to a specialisthospital for treatment.’
115
4.20 FRYING PANS
Key target group - 5-10 year old children. A secondary target group is adults aged 18-64 years.
4.20.1 Total accidents
This section includes frying pans (about 90% of the cases) and woks (10%).
An estimated 67% (64) of the severe injuries are ‘category B’ involving 5 or more days asan in-patient and/or transfer to a specialist hospital/burns unit treatment, and 33% (32) are‘category A’, involving 1-4 in-patient days in hospital. Overall trend appears to be static,with no discernible change indicated by an inspection of the accident records over the 5-year period.
4.20.2 Seasonal variations (severe injuries only)
40% of severe injuries caused by frying pans happen in the spring, and a further 33%happen in the autumn. However, the database does not indicate any specific reason forthese peaks.
114
Table 4.20-1
Total estimated 0-4 5-10 11-17 18-64 65+accidents years years years years yearsper year
Minor injuries (A & E visits) 3793 n/a n/a n/a n/a n/a
Severe injuries (A & E/in-patient) 96 0 13 6 76 0
Fatal injuries 0.3 0 0 0 0 0.3
Table 4.20-2
All accidentsBurns and scalds
Winter Spring Summer Autumn0
5
10
15
20
25
30
35
40
Table 4.20-3
Female
Male
0-4years
5-10years
11-17years
18-64years
65+years
0
1
2
3
4
5
6
1.6 pmpAverage severe
injuries pa per millionpopulation (total UK)
0-4 yrs 5-10 yrs 11-17 yrs 18-64 yrs 65+ yrs
Male 0 5.4 2.4 2.5 0Female 0 0 0 1.8 0
Table 4.20-4
Accident mechanisms % of cases Main time when occurs
Knocked/pulled frying pan off cooker 100% insufficient data
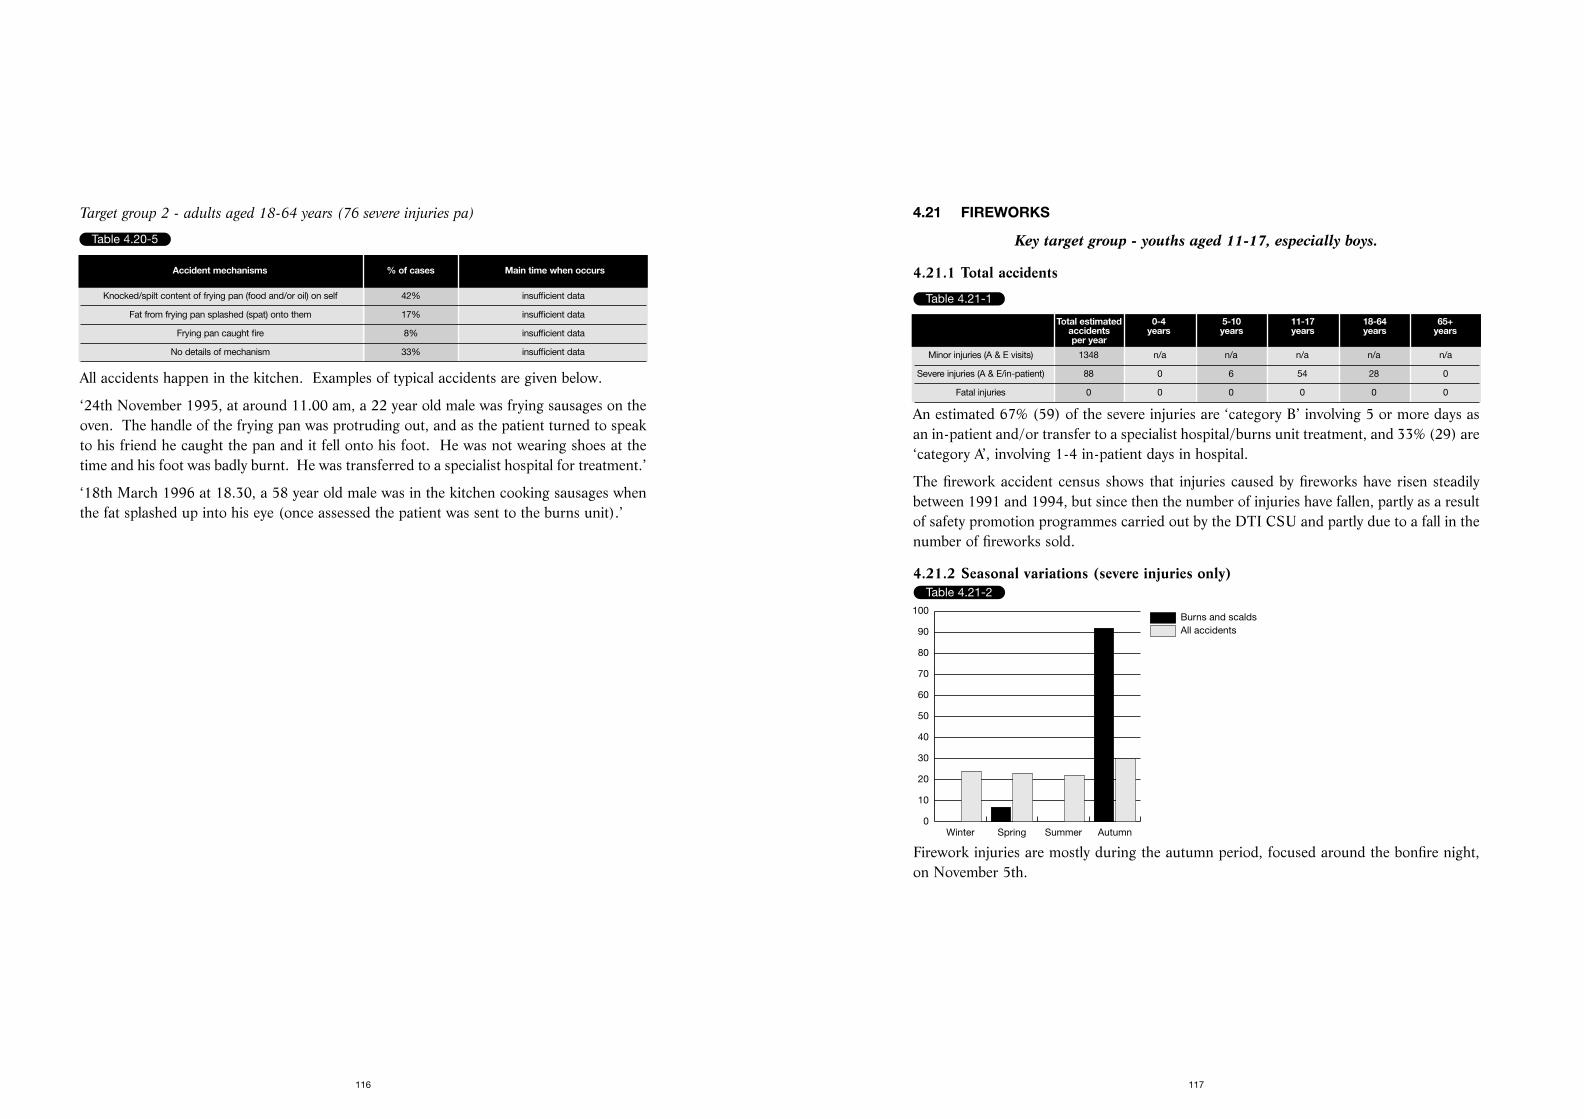
4.21 FIREWORKS
Key target group - youths aged 11-17, especially boys.
4.21.1 Total accidents
An estimated 67% (59) of the severe injuries are ‘category B’ involving 5 or more days asan in-patient and/or transfer to a specialist hospital/burns unit treatment, and 33% (29) are‘category A’, involving 1-4 in-patient days in hospital.
The firework accident census shows that injuries caused by fireworks have risen steadilybetween 1991 and 1994, but since then the number of injuries have fallen, partly as a resultof safety promotion programmes carried out by the DTI CSU and partly due to a fall in thenumber of fireworks sold.
4.21.2 Seasonal variations (severe injuries only)
Firework injuries are mostly during the autumn period, focused around the bonfire night,on November 5th.
117
Target group 2 - adults aged 18-64 years (76 severe injuries pa)
All accidents happen in the kitchen. Examples of typical accidents are given below.
‘24th November 1995, at around 11.00 am, a 22 year old male was frying sausages on theoven. The handle of the frying pan was protruding out, and as the patient turned to speakto his friend he caught the pan and it fell onto his foot. He was not wearing shoes at thetime and his foot was badly burnt. He was transferred to a specialist hospital for treatment.’
‘18th March 1996 at 18.30, a 58 year old male was in the kitchen cooking sausages whenthe fat splashed up into his eye (once assessed the patient was sent to the burns unit).’
116
Table 4.20-5
Accident mechanisms % of cases Main time when occurs
Knocked/spilt content of frying pan (food and/or oil) on self 42% insufficient data
Fat from frying pan splashed (spat) onto them 17% insufficient data
Frying pan caught fire 8% insufficient data
No details of mechanism 33% insufficient data
Table 4.21-1
Total estimated 0-4 5-10 11-17 18-64 65+accidents years years years years yearsper year
Minor injuries (A & E visits) 1348 n/a n/a n/a n/a n/a
Severe injuries (A & E/in-patient) 88 0 6 54 28 0
Fatal injuries 0 0 0 0 0 0
Table 4.21-2
All accidentsBurns and scalds
Winter Spring Summer Autumn0
10
20
30
40
50
60
70
80
90
100
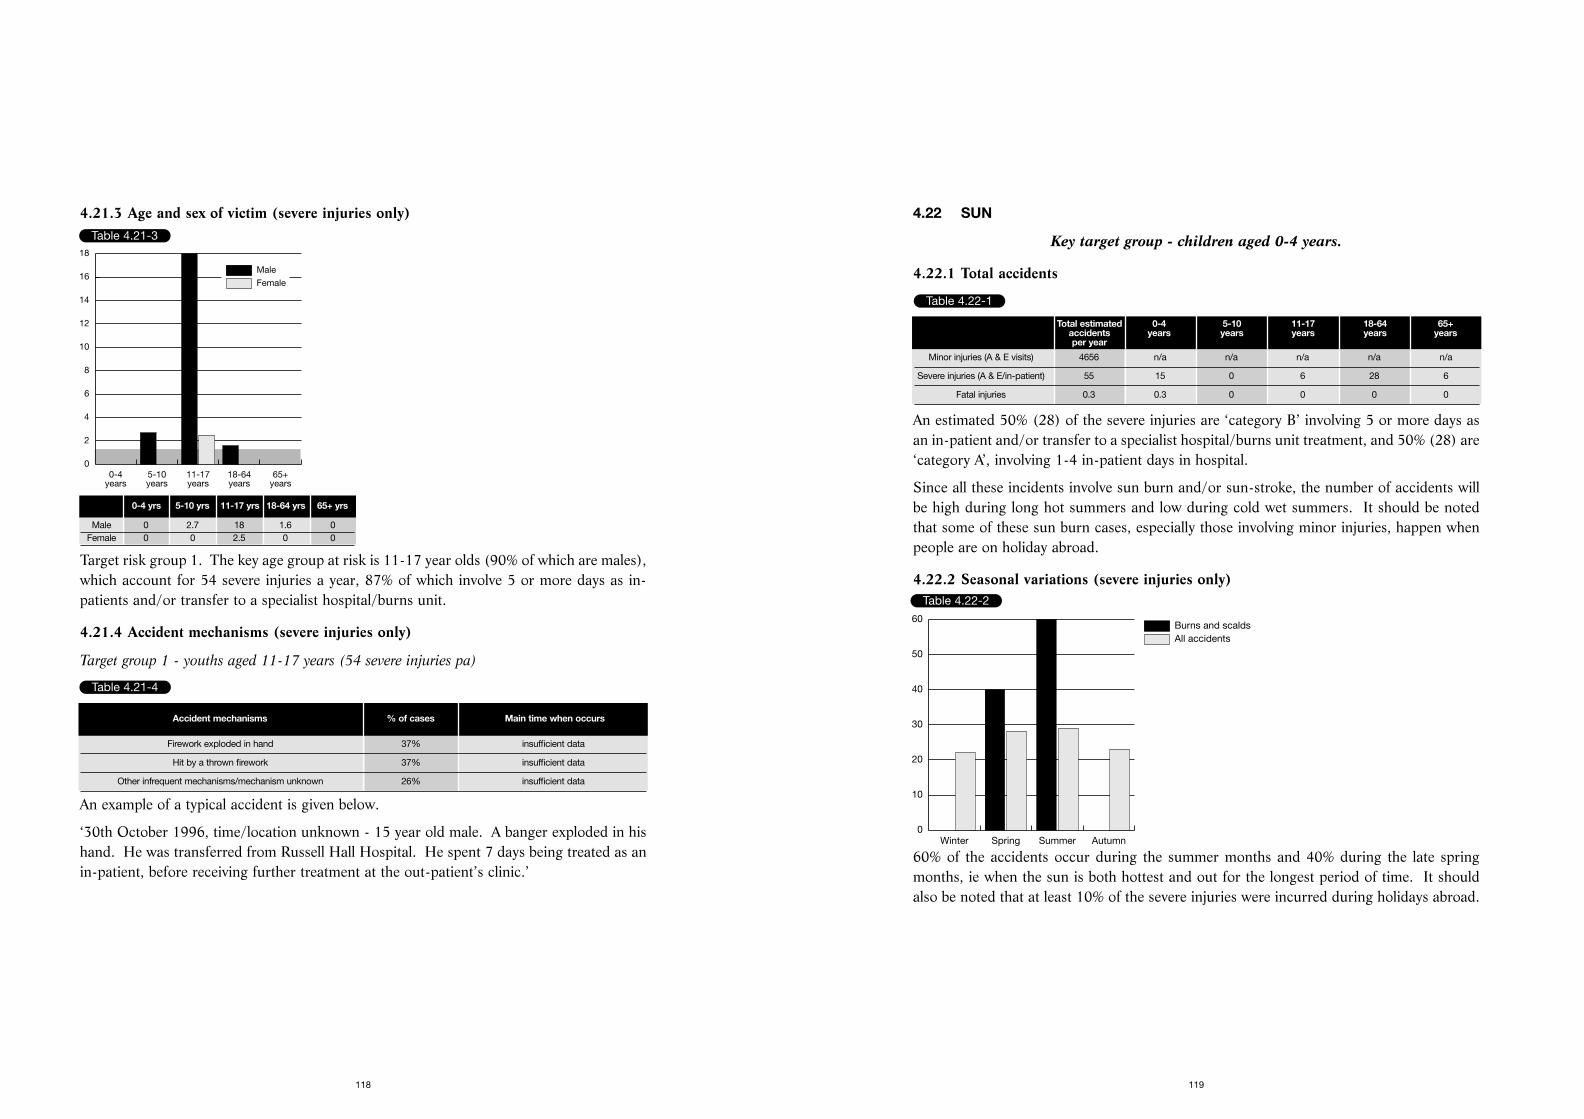
4.22 SUN
Key target group - children aged 0-4 years.
4.22.1 Total accidents
An estimated 50% (28) of the severe injuries are ‘category B’ involving 5 or more days asan in-patient and/or transfer to a specialist hospital/burns unit treatment, and 50% (28) are‘category A’, involving 1-4 in-patient days in hospital.
Since all these incidents involve sun burn and/or sun-stroke, the number of accidents willbe high during long hot summers and low during cold wet summers. It should be notedthat some of these sun burn cases, especially those involving minor injuries, happen whenpeople are on holiday abroad.
4.22.2 Seasonal variations (severe injuries only)
60% of the accidents occur during the summer months and 40% during the late springmonths, ie when the sun is both hottest and out for the longest period of time. It shouldalso be noted that at least 10% of the severe injuries were incurred during holidays abroad.
119
4.21.3 Age and sex of victim (severe injuries only)
Target risk group 1. The key age group at risk is 11-17 year olds (90% of which are males),which account for 54 severe injuries a year, 87% of which involve 5 or more days as in-patients and/or transfer to a specialist hospital/burns unit.
4.21.4 Accident mechanisms (severe injuries only)
Target group 1 - youths aged 11-17 years (54 severe injuries pa)
An example of a typical accident is given below.
‘30th October 1996, time/location unknown - 15 year old male. A banger exploded in hishand. He was transferred from Russell Hall Hospital. He spent 7 days being treated as anin-patient, before receiving further treatment at the out-patient’s clinic.’
118
Table 4.21-3
Female
Male
0-4years
5-10years
11-17years
18-64years
65+years
0
2
4
6
8
10
12
14
16
18
0-4 yrs 5-10 yrs 11-17 yrs 18-64 yrs 65+ yrs
Male 0 2.7 18 1.6 0Female 0 0 2.5 0 0
Table 4.21-4
Accident mechanisms % of cases Main time when occurs
Firework exploded in hand 37% insufficient data
Hit by a thrown firework 37% insufficient data
Other infrequent mechanisms/mechanism unknown 26% insufficient data
Table 4.22-1
Total estimated 0-4 5-10 11-17 18-64 65+accidents years years years years yearsper year
Minor injuries (A & E visits) 4656 n/a n/a n/a n/a n/a
Severe injuries (A & E/in-patient) 55 15 0 6 28 6
Fatal injuries 0.3 0.3 0 0 0 0
Table 4.22-2
All accidentsBurns and scalds
Winter Spring Summer Autumn0
10
20
30
40
50
60
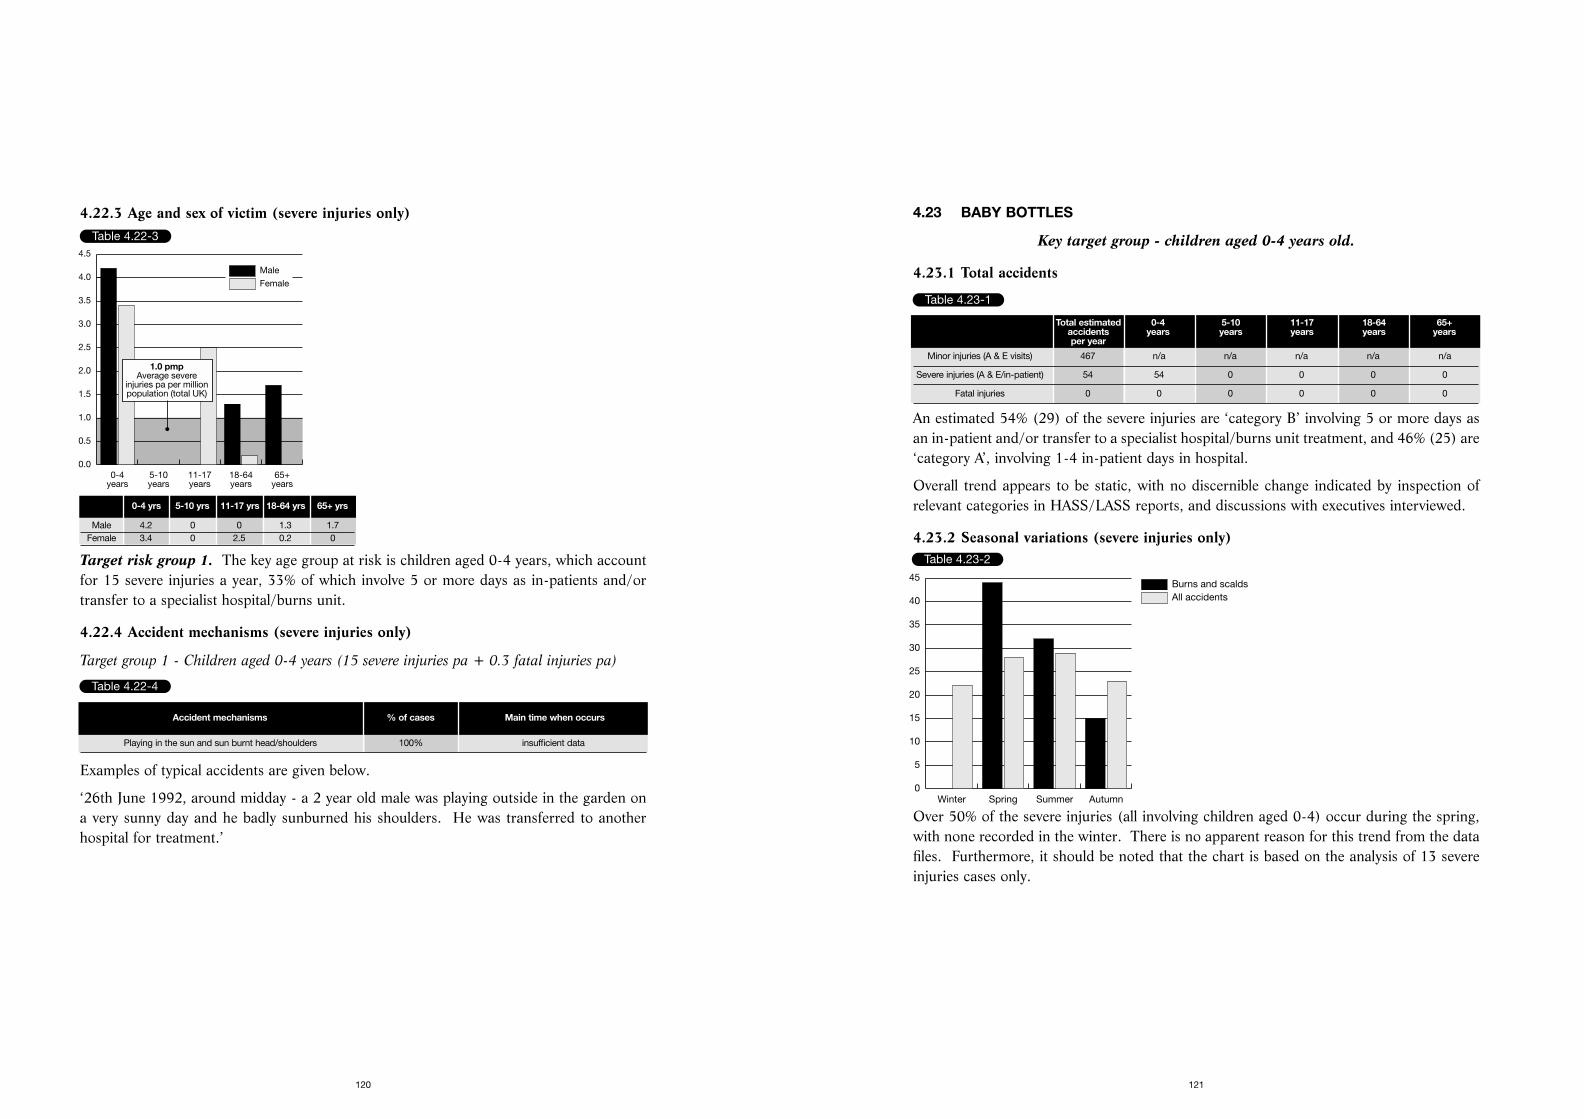
4.23 BABY BOTTLES
Key target group - children aged 0-4 years old.
4.23.1 Total accidents
An estimated 54% (29) of the severe injuries are ‘category B’ involving 5 or more days asan in-patient and/or transfer to a specialist hospital/burns unit treatment, and 46% (25) are‘category A’, involving 1-4 in-patient days in hospital.
Overall trend appears to be static, with no discernible change indicated by inspection ofrelevant categories in HASS/LASS reports, and discussions with executives interviewed.
4.23.2 Seasonal variations (severe injuries only)
Over 50% of the severe injuries (all involving children aged 0-4) occur during the spring,with none recorded in the winter. There is no apparent reason for this trend from the datafiles. Furthermore, it should be noted that the chart is based on the analysis of 13 severeinjuries cases only.
121
4.22.3 Age and sex of victim (severe injuries only)
Target risk group 1. The key age group at risk is children aged 0-4 years, which accountfor 15 severe injuries a year, 33% of which involve 5 or more days as in-patients and/ortransfer to a specialist hospital/burns unit.
4.22.4 Accident mechanisms (severe injuries only)
Target group 1 - Children aged 0-4 years (15 severe injuries pa + 0.3 fatal injuries pa)
Examples of typical accidents are given below.
‘26th June 1992, around midday - a 2 year old male was playing outside in the garden ona very sunny day and he badly sunburned his shoulders. He was transferred to anotherhospital for treatment.’
120
Table 4.22-3
Female
Male
0-4years
5-10years
11-17years
18-64years
65+years
0.0
0.5
1.0
1.5
2.0
2.5
3.0
3.5
4.0
4.5
1.0 pmpAverage severe
injuries pa per millionpopulation (total UK)
0-4 yrs 5-10 yrs 11-17 yrs 18-64 yrs 65+ yrs
Male 4.2 0 0 1.3 1.7Female 3.4 0 2.5 0.2 0
Table 4.22-4
Accident mechanisms % of cases Main time when occurs
Playing in the sun and sun burnt head/shoulders 100% insufficient data
Table 4.23-1
Total estimated 0-4 5-10 11-17 18-64 65+accidents years years years years yearsper year
Minor injuries (A & E visits) 467 n/a n/a n/a n/a n/a
Severe injuries (A & E/in-patient) 54 54 0 0 0 0
Fatal injuries 0 0 0 0 0 0
Table 4.23-2
All accidentsBurns and scalds
Winter Spring Summer Autumn0
5
10
15
20
25
30
35
40
45
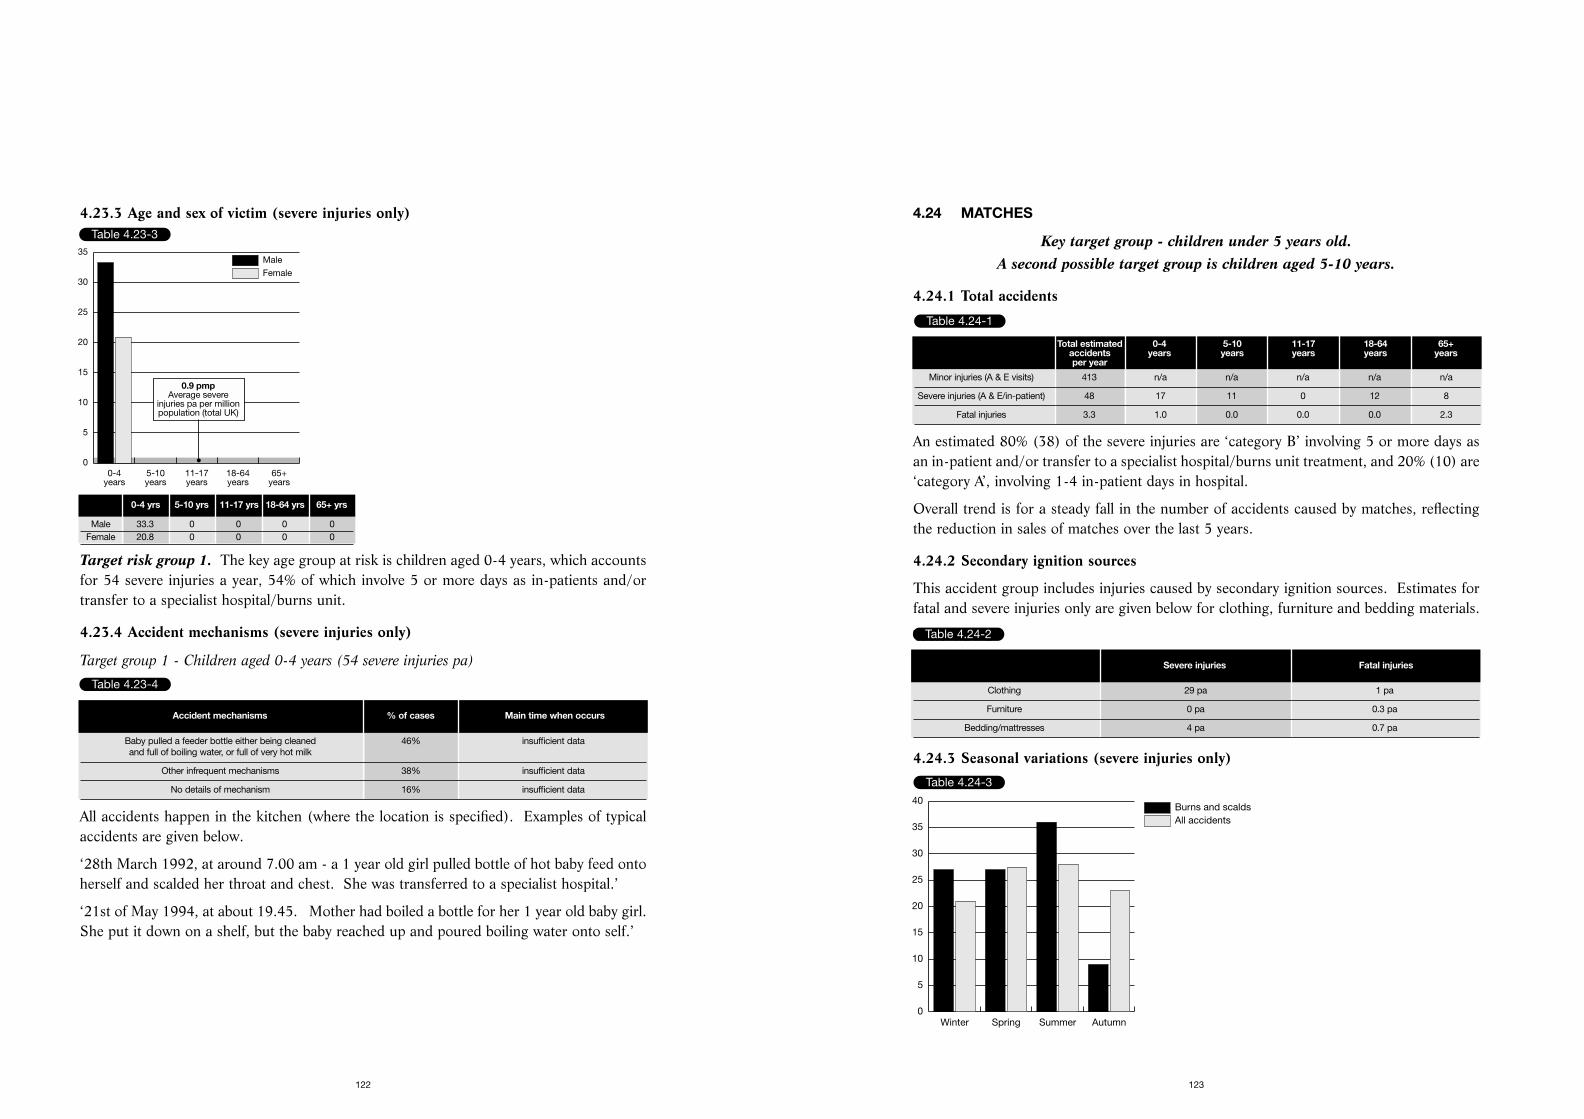
4.24 MATCHES
Key target group - children under 5 years old. A second possible target group is children aged 5-10 years.
4.24.1 Total accidents
An estimated 80% (38) of the severe injuries are ‘category B’ involving 5 or more days asan in-patient and/or transfer to a specialist hospital/burns unit treatment, and 20% (10) are‘category A’, involving 1-4 in-patient days in hospital.
Overall trend is for a steady fall in the number of accidents caused by matches, reflectingthe reduction in sales of matches over the last 5 years.
4.24.2 Secondary ignition sources
This accident group includes injuries caused by secondary ignition sources. Estimates forfatal and severe injuries only are given below for clothing, furniture and bedding materials.
Table 4.24-2
4.24.3 Seasonal variations (severe injuries only)
123
4.23.3 Age and sex of victim (severe injuries only)
Target risk group 1. The key age group at risk is children aged 0-4 years, which accountsfor 54 severe injuries a year, 54% of which involve 5 or more days as in-patients and/ortransfer to a specialist hospital/burns unit.
4.23.4 Accident mechanisms (severe injuries only)
Target group 1 - Children aged 0-4 years (54 severe injuries pa)
All accidents happen in the kitchen (where the location is specified). Examples of typicalaccidents are given below.
‘28th March 1992, at around 7.00 am - a 1 year old girl pulled bottle of hot baby feed ontoherself and scalded her throat and chest. She was transferred to a specialist hospital.’
‘21st of May 1994, at about 19.45. Mother had boiled a bottle for her 1 year old baby girl.She put it down on a shelf, but the baby reached up and poured boiling water onto self.’
122
Table 4.23-3
Female
Male
0-4years
5-10years
11-17years
18-64years
65+years
0
5
10
15
20
25
30
35
0.9 pmpAverage severe
injuries pa per millionpopulation (total UK)
0-4 yrs 5-10 yrs 11-17 yrs 18-64 yrs 65+ yrs
Male 33.3 0 0 0 0Female 20.8 0 0 0 0
Table 4.23-4
Accident mechanisms % of cases Main time when occurs
Baby pulled a feeder bottle either being cleaned 46% insufficient dataand full of boiling water, or full of very hot milk
Other infrequent mechanisms 38% insufficient data
No details of mechanism 16% insufficient data
Table 4.24-1
Total estimated 0-4 5-10 11-17 18-64 65+accidents years years years years yearsper year
Minor injuries (A & E visits) 413 n/a n/a n/a n/a n/a
Severe injuries (A & E/in-patient) 48 17 11 0 12 8
Fatal injuries 3.3 1.0 0.0 0.0 0.0 2.3
Table 4.24-2
Severe injuries Fatal injuries
Clothing 29 pa 1 pa
Furniture 0 pa 0.3 pa
Bedding/mattresses 4 pa 0.7 pa
Table 4.24-3
All accidentsBurns and scalds
Winter Spring Summer Autumn0
5
10
15
20
25
30
35
40
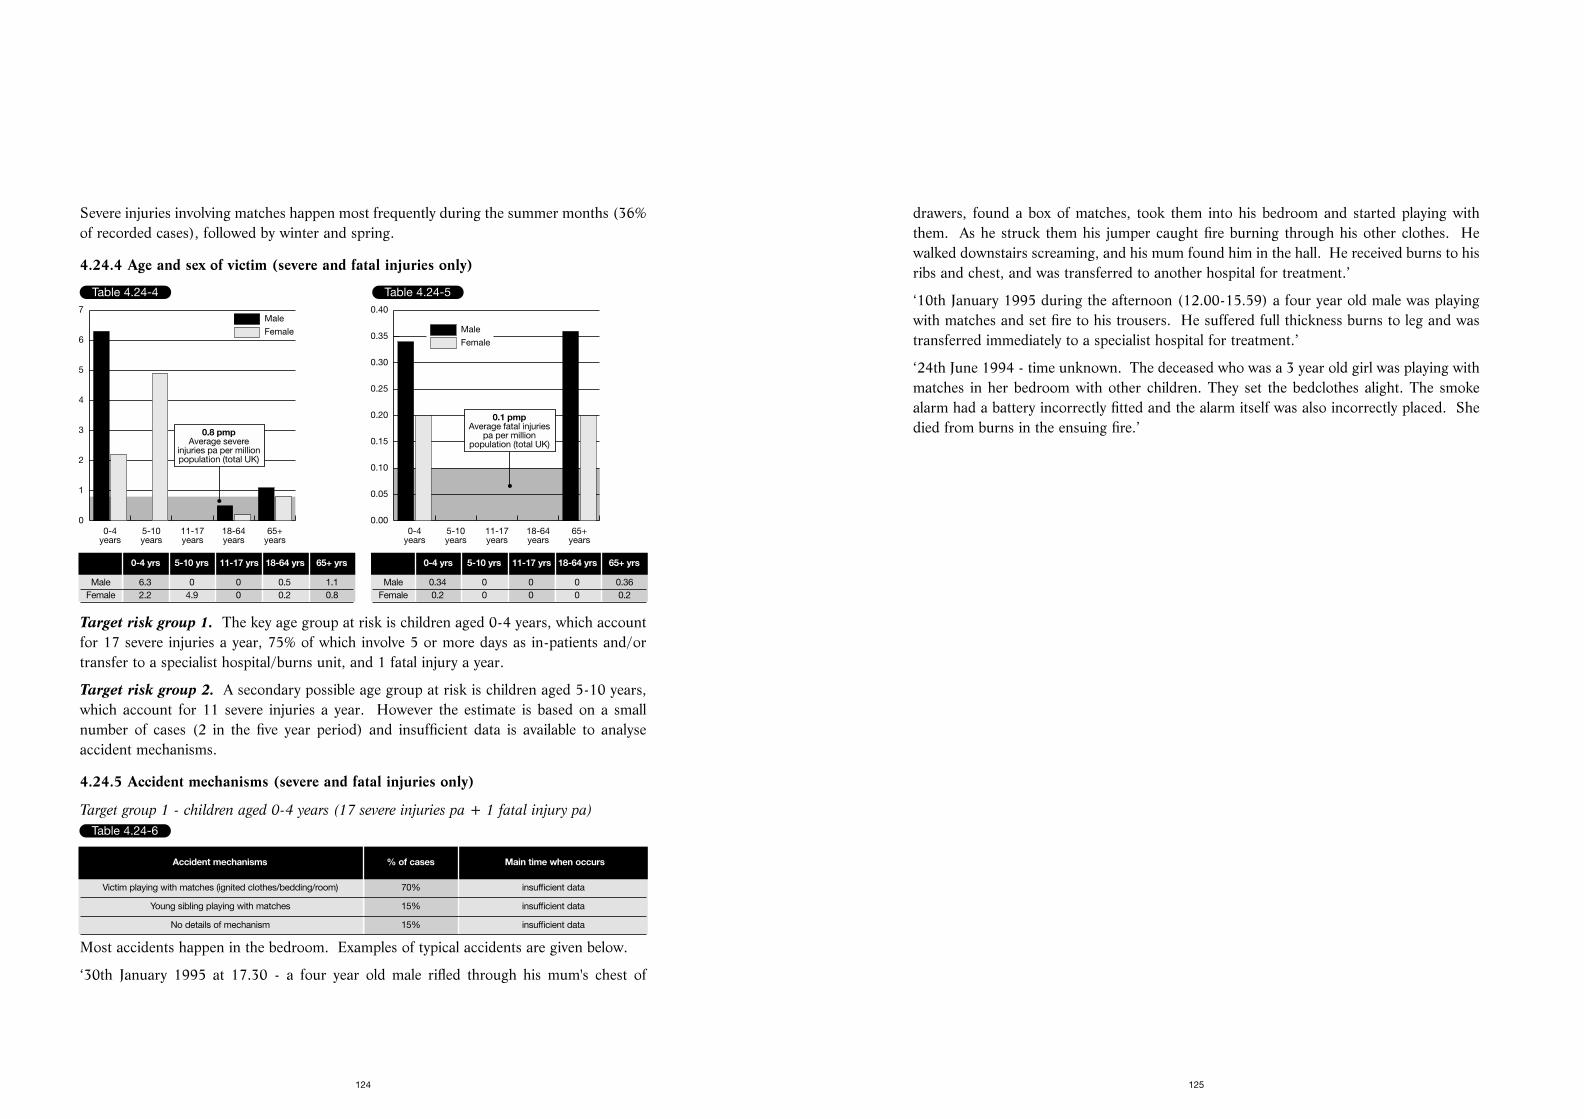
drawers, found a box of matches, took them into his bedroom and started playing withthem. As he struck them his jumper caught fire burning through his other clothes. Hewalked downstairs screaming, and his mum found him in the hall. He received burns to hisribs and chest, and was transferred to another hospital for treatment.’
‘10th January 1995 during the afternoon (12.00-15.59) a four year old male was playingwith matches and set fire to his trousers. He suffered full thickness burns to leg and wastransferred immediately to a specialist hospital for treatment.’
‘24th June 1994 - time unknown. The deceased who was a 3 year old girl was playing withmatches in her bedroom with other children. They set the bedclothes alight. The smokealarm had a battery incorrectly fitted and the alarm itself was also incorrectly placed. Shedied from burns in the ensuing fire.’
125
Severe injuries involving matches happen most frequently during the summer months (36%of recorded cases), followed by winter and spring.
4.24.4 Age and sex of victim (severe and fatal injuries only)
Target risk group 1. The key age group at risk is children aged 0-4 years, which accountfor 17 severe injuries a year, 75% of which involve 5 or more days as in-patients and/ortransfer to a specialist hospital/burns unit, and 1 fatal injury a year.
Target risk group 2. A secondary possible age group at risk is children aged 5-10 years,which account for 11 severe injuries a year. However the estimate is based on a smallnumber of cases (2 in the five year period) and insufficient data is available to analyseaccident mechanisms.
4.24.5 Accident mechanisms (severe and fatal injuries only)
Target group 1 - children aged 0-4 years (17 severe injuries pa + 1 fatal injury pa)
Most accidents happen in the bedroom. Examples of typical accidents are given below.
‘30th January 1995 at 17.30 - a four year old male rifled through his mum's chest of
124
Table 4.24-4
Female
Male
0-4years
5-10years
11-17years
18-64years
65+years
0
1
2
3
4
5
6
7
0.8 pmpAverage severe
injuries pa per millionpopulation (total UK)
0-4 yrs 5-10 yrs 11-17 yrs 18-64 yrs 65+ yrs
Male 6.3 0 0 0.5 1.1Female 2.2 4.9 0 0.2 0.8
Table 4.24-5
Female
Male
0-4years
5-10years
11-17years
18-64years
65+years
0.00
0.05
0.10
0.15
0.20
0.25
0.30
0.35
0.40
0.1 pmpAverage fatal injuries
pa per millionpopulation (total UK)
0-4 yrs 5-10 yrs 11-17 yrs 18-64 yrs 65+ yrs
Male 0.34 0 0 0 0.36Female 0.2 0 0 0 0.2
Table 4.24-6
Accident mechanisms % of cases Main time when occurs
Victim playing with matches (ignited clothes/bedding/room) 70% insufficient data
Young sibling playing with matches 15% insufficient data
No details of mechanism 15% insufficient data
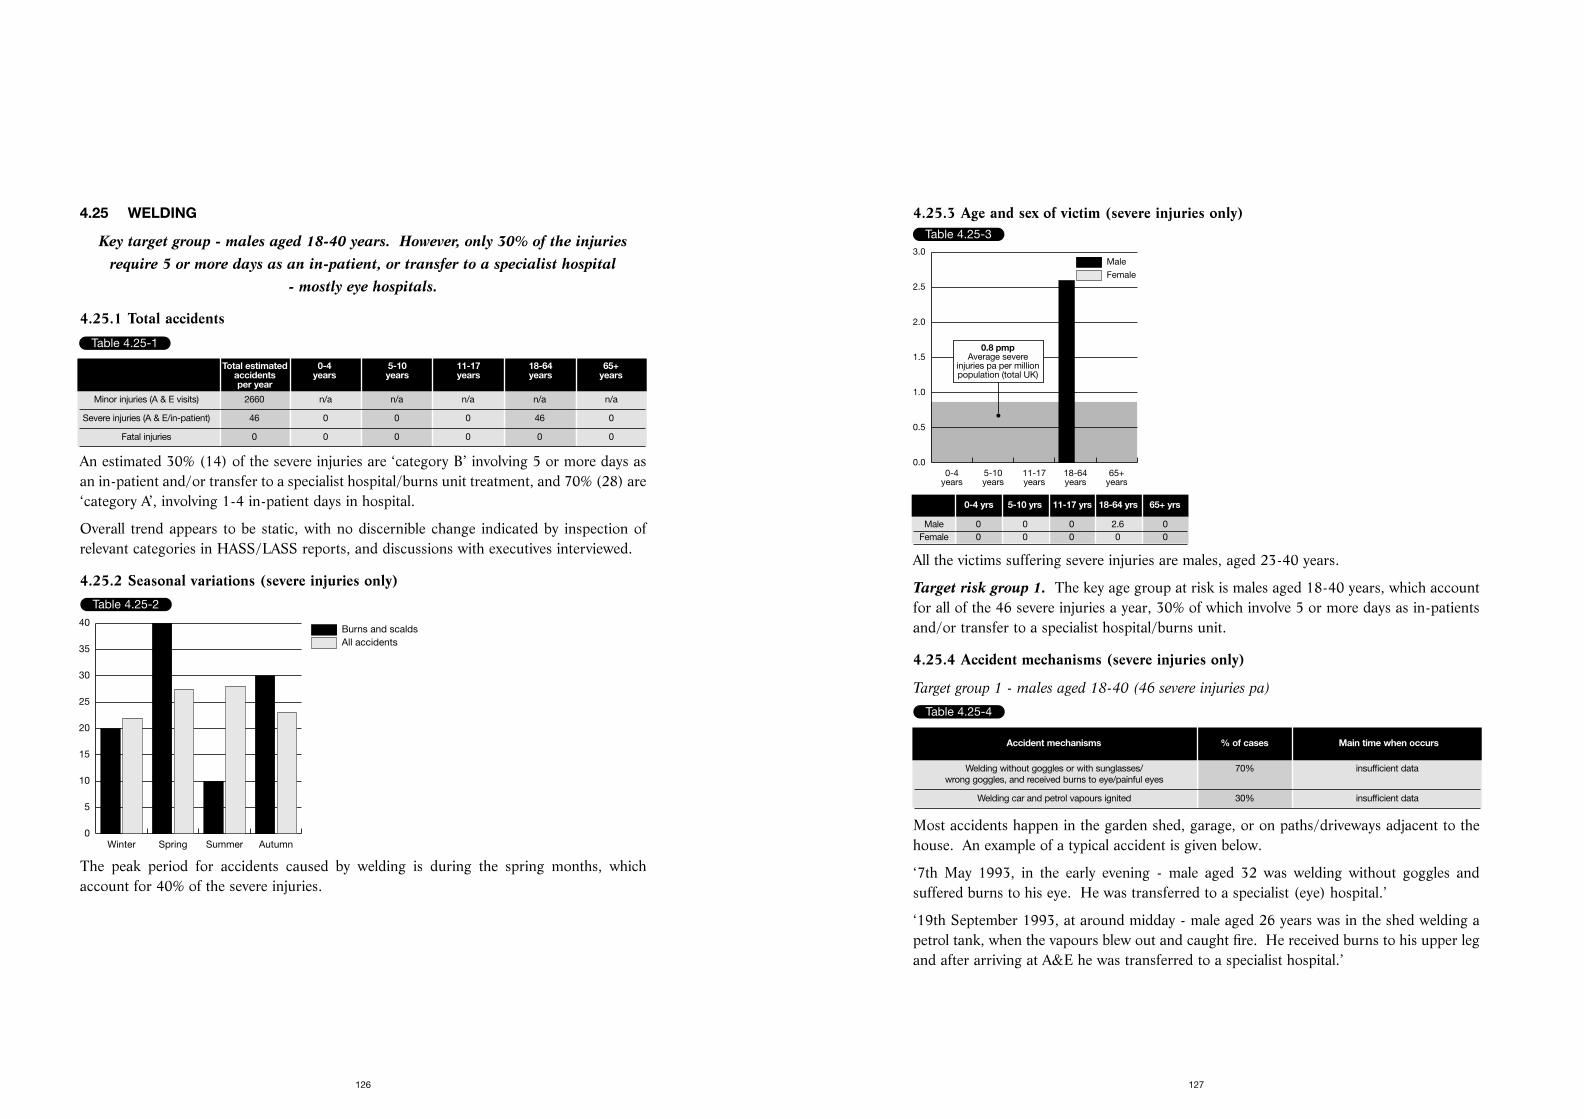
4.25.3 Age and sex of victim (severe injuries only)
All the victims suffering severe injuries are males, aged 23-40 years.
Target risk group 1. The key age group at risk is males aged 18-40 years, which accountfor all of the 46 severe injuries a year, 30% of which involve 5 or more days as in-patientsand/or transfer to a specialist hospital/burns unit.
4.25.4 Accident mechanisms (severe injuries only)
Target group 1 - males aged 18-40 (46 severe injuries pa)
Most accidents happen in the garden shed, garage, or on paths/driveways adjacent to thehouse. An example of a typical accident is given below.
‘7th May 1993, in the early evening - male aged 32 was welding without goggles andsuffered burns to his eye. He was transferred to a specialist (eye) hospital.’
‘19th September 1993, at around midday - male aged 26 years was in the shed welding apetrol tank, when the vapours blew out and caught fire. He received burns to his upper legand after arriving at A&E he was transferred to a specialist hospital.’
127
4.25 WELDING
Key target group - males aged 18-40 years. However, only 30% of the injuriesrequire 5 or more days as an in-patient, or transfer to a specialist hospital
- mostly eye hospitals.
4.25.1 Total accidents
An estimated 30% (14) of the severe injuries are ‘category B’ involving 5 or more days asan in-patient and/or transfer to a specialist hospital/burns unit treatment, and 70% (28) are‘category A’, involving 1-4 in-patient days in hospital.
Overall trend appears to be static, with no discernible change indicated by inspection ofrelevant categories in HASS/LASS reports, and discussions with executives interviewed.
4.25.2 Seasonal variations (severe injuries only)
The peak period for accidents caused by welding is during the spring months, whichaccount for 40% of the severe injuries.
126
Table 4.25-1
Total estimated 0-4 5-10 11-17 18-64 65+accidents years years years years yearsper year
Minor injuries (A & E visits) 2660 n/a n/a n/a n/a n/a
Severe injuries (A & E/in-patient) 46 0 0 0 46 0
Fatal injuries 0 0 0 0 0 0
Table 4.25-2
All accidentsBurns and scalds
Winter Spring Summer Autumn0
5
10
15
20
25
30
35
40
Table 4.25-3
Female
Male
0-4years
5-10years
11-17years
18-64years
65+years
0.0
0.5
1.0
1.5
2.0
2.5
3.0
0.8 pmpAverage severe
injuries pa per millionpopulation (total UK)
0-4 yrs 5-10 yrs 11-17 yrs 18-64 yrs 65+ yrs
Male 0 0 0 2.6 0Female 0 0 0 0 0
Table 4.25-4
Accident mechanisms % of cases Main time when occurs
Welding without goggles or with sunglasses/ 70% insufficient datawrong goggles, and received burns to eye/painful eyes
Welding car and petrol vapours ignited 30% insufficient data
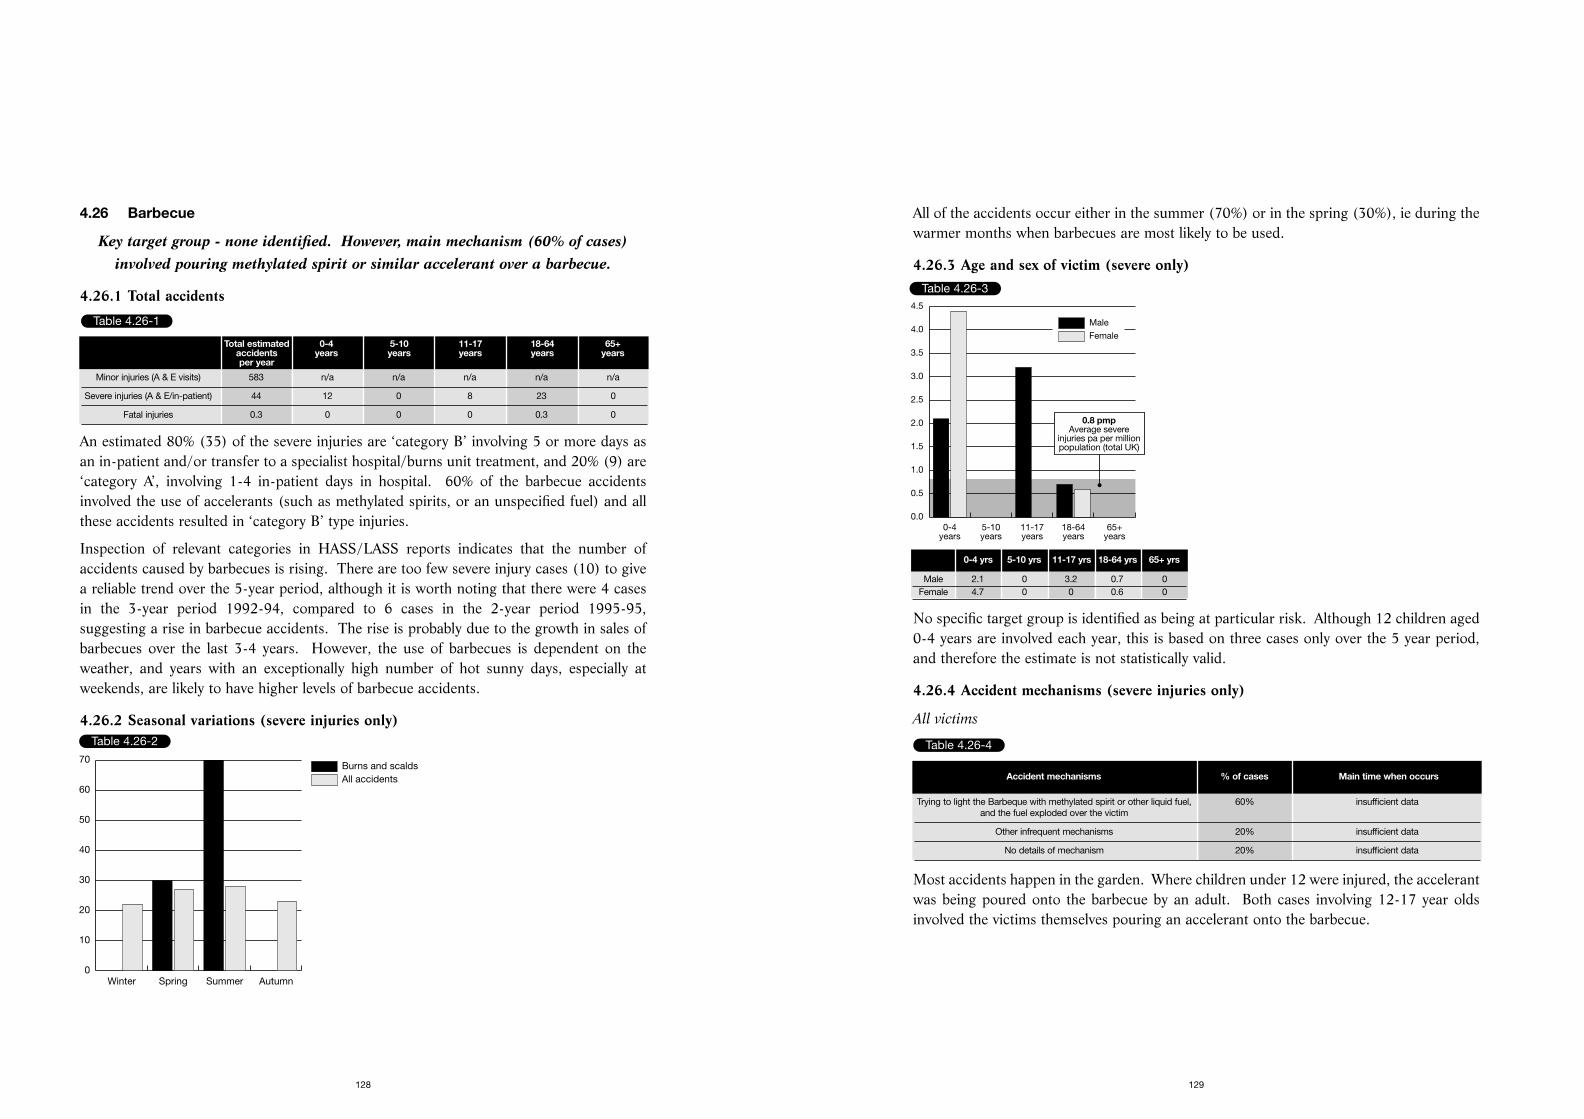
All of the accidents occur either in the summer (70%) or in the spring (30%), ie during thewarmer months when barbecues are most likely to be used.
4.26.3 Age and sex of victim (severe only)
No specific target group is identified as being at particular risk. Although 12 children aged0-4 years are involved each year, this is based on three cases only over the 5 year period,and therefore the estimate is not statistically valid.
4.26.4 Accident mechanisms (severe injuries only)
All victims
Most accidents happen in the garden. Where children under 12 were injured, the accelerantwas being poured onto the barbecue by an adult. Both cases involving 12-17 year oldsinvolved the victims themselves pouring an accelerant onto the barbecue.
129
4.26 Barbecue
Key target group - none identified. However, main mechanism (60% of cases)involved pouring methylated spirit or similar accelerant over a barbecue.
4.26.1 Total accidents
An estimated 80% (35) of the severe injuries are ‘category B’ involving 5 or more days asan in-patient and/or transfer to a specialist hospital/burns unit treatment, and 20% (9) are‘category A’, involving 1-4 in-patient days in hospital. 60% of the barbecue accidentsinvolved the use of accelerants (such as methylated spirits, or an unspecified fuel) and allthese accidents resulted in ‘category B’ type injuries.
Inspection of relevant categories in HASS/LASS reports indicates that the number ofaccidents caused by barbecues is rising. There are too few severe injury cases (10) to givea reliable trend over the 5-year period, although it is worth noting that there were 4 casesin the 3-year period 1992-94, compared to 6 cases in the 2-year period 1995-95,suggesting a rise in barbecue accidents. The rise is probably due to the growth in sales ofbarbecues over the last 3-4 years. However, the use of barbecues is dependent on theweather, and years with an exceptionally high number of hot sunny days, especially atweekends, are likely to have higher levels of barbecue accidents.
4.26.2 Seasonal variations (severe injuries only)
128
Table 4.26-1
Total estimated 0-4 5-10 11-17 18-64 65+accidents years years years years yearsper year
Minor injuries (A & E visits) 583 n/a n/a n/a n/a n/a
Severe injuries (A & E/in-patient) 44 12 0 8 23 0
Fatal injuries 0.3 0 0 0 0.3 0
Table 4.26-2
All accidentsBurns and scalds
Winter Spring Summer Autumn0
10
20
30
40
50
60
70
Table 4.26-3
Female
Male
0-4years
5-10years
11-17years
18-64years
65+years
0.0
0.5
1.0
1.5
2.0
2.5
3.0
3.5
4.0
4.5
0.8 pmpAverage severe
injuries pa per millionpopulation (total UK)
0-4 yrs 5-10 yrs 11-17 yrs 18-64 yrs 65+ yrs
Male 2.1 0 3.2 0.7 0Female 4.7 0 0 0.6 0
Table 4.26-4
Accident mechanisms % of cases Main time when occurs
Trying to light the Barbeque with methylated spirit or other liquid fuel, 60% insufficient data and the fuel exploded over the victim
Other infrequent mechanisms 20% insufficient data
No details of mechanism 20% insufficient data
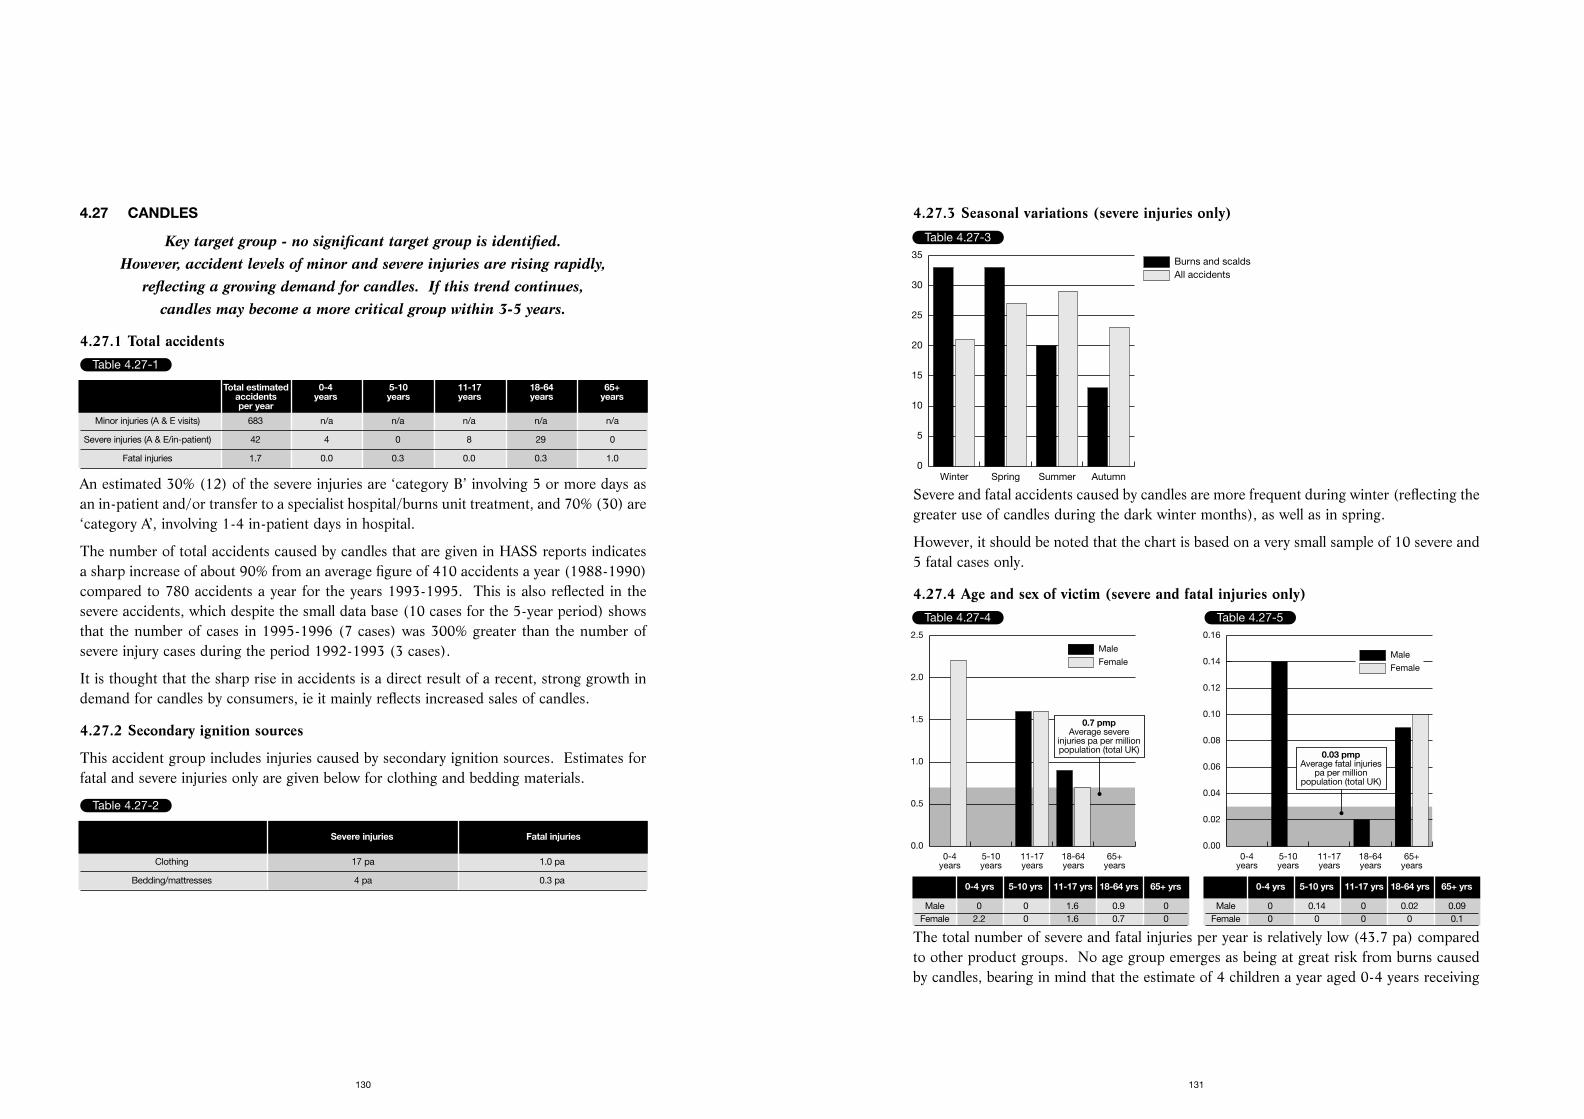
4.27.3 Seasonal variations (severe injuries only)
Severe and fatal accidents caused by candles are more frequent during winter (reflecting thegreater use of candles during the dark winter months), as well as in spring.
However, it should be noted that the chart is based on a very small sample of 10 severe and5 fatal cases only.
4.27.4 Age and sex of victim (severe and fatal injuries only)
The total number of severe and fatal injuries per year is relatively low (43.7 pa) comparedto other product groups. No age group emerges as being at great risk from burns causedby candles, bearing in mind that the estimate of 4 children a year aged 0-4 years receiving
131
4.27 CANDLES
Key target group - no significant target group is identified. However, accident levels of minor and severe injuries are rising rapidly,
reflecting a growing demand for candles. If this trend continues, candles may become a more critical group within 3-5 years.
4.27.1 Total accidents
An estimated 30% (12) of the severe injuries are ‘category B’ involving 5 or more days asan in-patient and/or transfer to a specialist hospital/burns unit treatment, and 70% (30) are‘category A’, involving 1-4 in-patient days in hospital.
The number of total accidents caused by candles that are given in HASS reports indicatesa sharp increase of about 90% from an average figure of 410 accidents a year (1988-1990)compared to 780 accidents a year for the years 1993-1995. This is also reflected in thesevere accidents, which despite the small data base (10 cases for the 5-year period) showsthat the number of cases in 1995-1996 (7 cases) was 300% greater than the number ofsevere injury cases during the period 1992-1993 (3 cases).
It is thought that the sharp rise in accidents is a direct result of a recent, strong growth indemand for candles by consumers, ie it mainly reflects increased sales of candles.
4.27.2 Secondary ignition sources
This accident group includes injuries caused by secondary ignition sources. Estimates forfatal and severe injuries only are given below for clothing and bedding materials.
130
Table 4.27-1
Total estimated 0-4 5-10 11-17 18-64 65+accidents years years years years yearsper year
Minor injuries (A & E visits) 683 n/a n/a n/a n/a n/a
Severe injuries (A & E/in-patient) 42 4 0 8 29 0
Fatal injuries 1.7 0.0 0.3 0.0 0.3 1.0
Table 4.27-2
Severe injuries Fatal injuries
Clothing 17 pa 1.0 pa
Bedding/mattresses 4 pa 0.3 pa
Table 4.27-3
All accidentsBurns and scalds
Winter Spring Summer Autumn0
5
10
15
20
25
30
35
Table 4.27-4
Female
Male
0-4years
5-10years
11-17years
18-64years
65+years
0.0
0.5
1.0
1.5
2.0
2.5
0.7 pmpAverage severe
injuries pa per millionpopulation (total UK)
0-4 yrs 5-10 yrs 11-17 yrs 18-64 yrs 65+ yrs
Male 0 0 1.6 0.9 0Female 2.2 0 1.6 0.7 0
Table 4.27-5
Female
Male
0-4years
5-10years
11-17years
18-64years
65+years
0.00
0.02
0.04
0.06
0.08
0.10
0.12
0.14
0.16
0.03 pmpAverage fatal injuries
pa per millionpopulation (total UK)
0-4 yrs 5-10 yrs 11-17 yrs 18-64 yrs 65+ yrs
Male 0 0.14 0 0.02 0.09Female 0 0 0 0 0.1
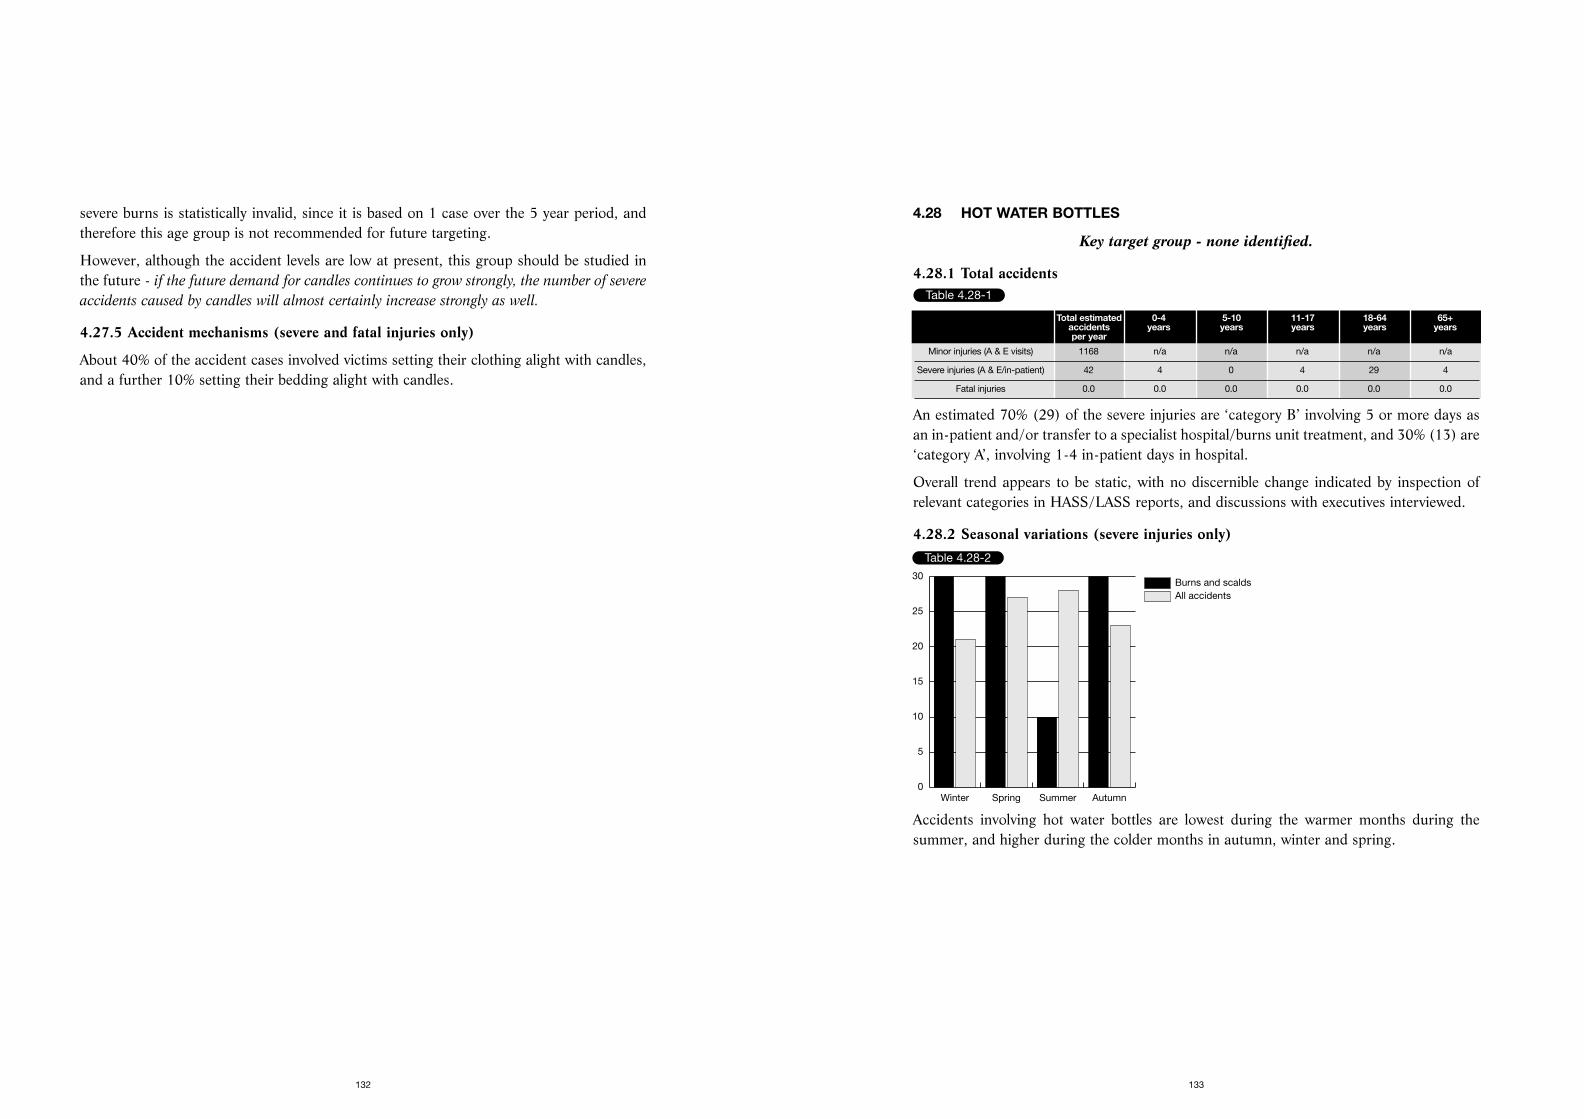
4.28 HOT WATER BOTTLES
Key target group - none identified.
4.28.1 Total accidents
An estimated 70% (29) of the severe injuries are ‘category B’ involving 5 or more days asan in-patient and/or transfer to a specialist hospital/burns unit treatment, and 30% (13) are‘category A’, involving 1-4 in-patient days in hospital.
Overall trend appears to be static, with no discernible change indicated by inspection ofrelevant categories in HASS/LASS reports, and discussions with executives interviewed.
4.28.2 Seasonal variations (severe injuries only)
Accidents involving hot water bottles are lowest during the warmer months during thesummer, and higher during the colder months in autumn, winter and spring.
133
severe burns is statistically invalid, since it is based on 1 case over the 5 year period, andtherefore this age group is not recommended for future targeting.
However, although the accident levels are low at present, this group should be studied inthe future - if the future demand for candles continues to grow strongly, the number of severe
accidents caused by candles will almost certainly increase strongly as well.
4.27.5 Accident mechanisms (severe and fatal injuries only)
About 40% of the accident cases involved victims setting their clothing alight with candles,and a further 10% setting their bedding alight with candles.
132
Table 4.28-1
Total estimated 0-4 5-10 11-17 18-64 65+accidents years years years years yearsper year
Minor injuries (A & E visits) 1168 n/a n/a n/a n/a n/a
Severe injuries (A & E/in-patient) 42 4 0 4 29 4
Fatal injuries 0.0 0.0 0.0 0.0 0.0 0.0
Table 4.28-2
All accidentsBurns and scalds
Winter Spring Summer Autumn0
5
10
15
20
25
30
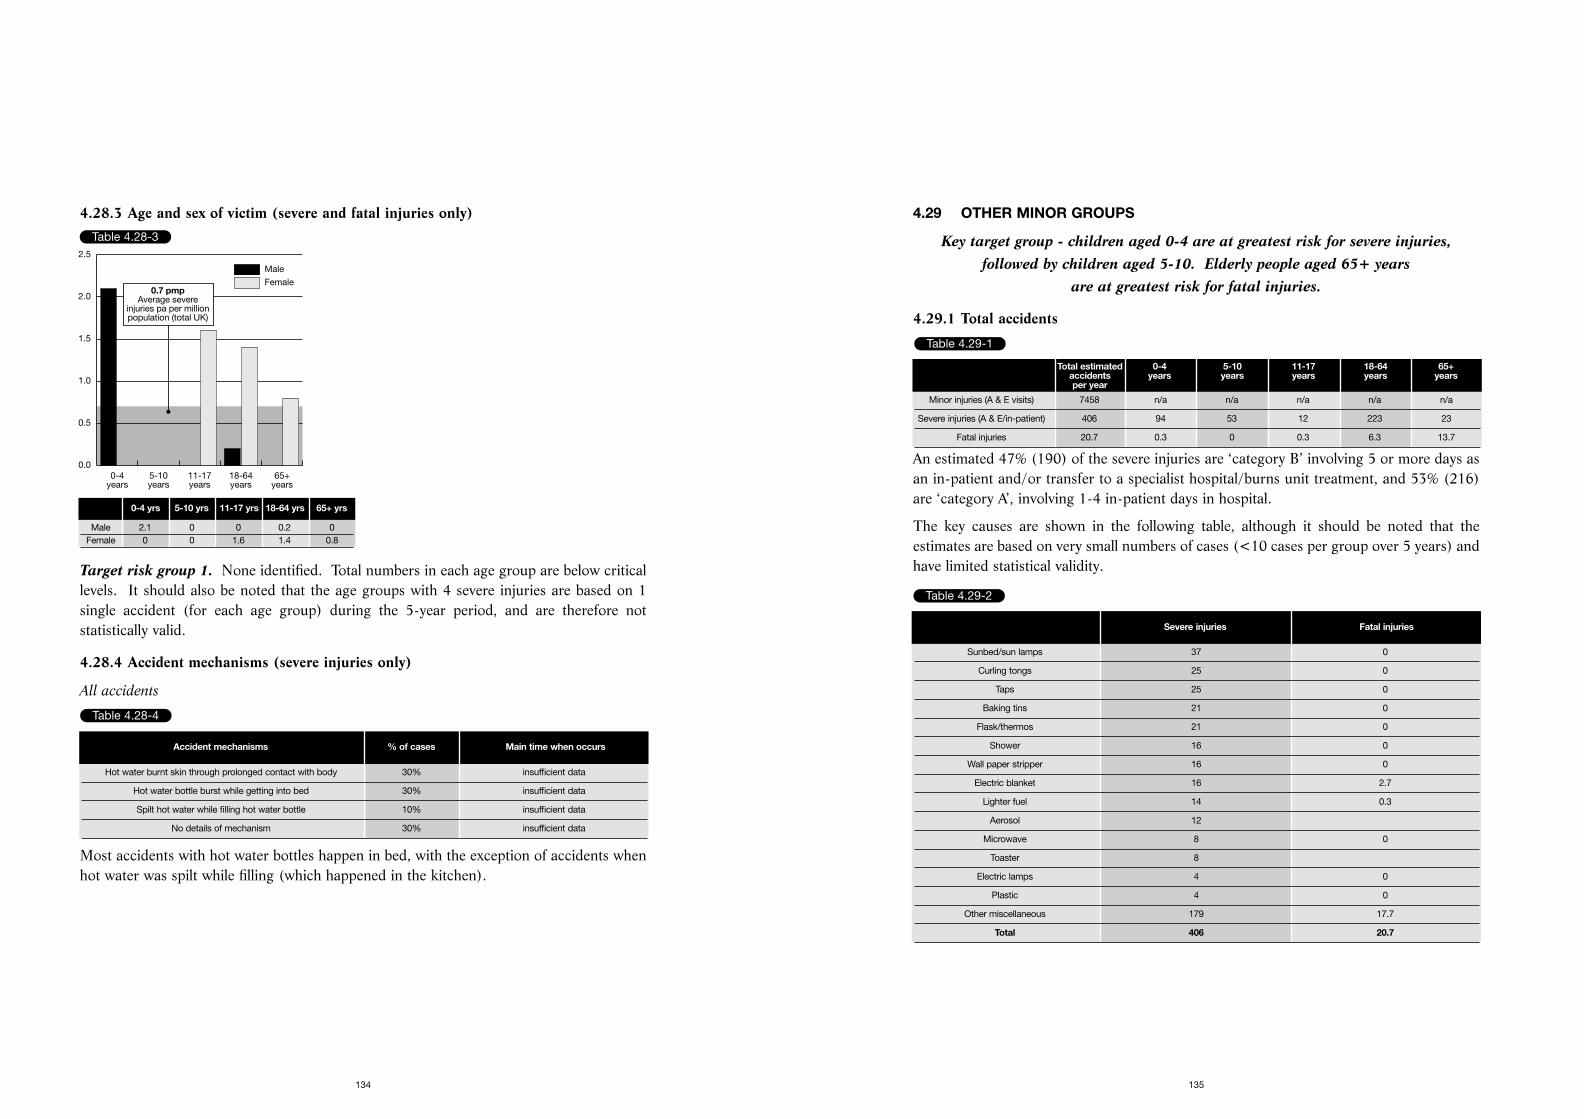
4.29 OTHER MINOR GROUPS
Key target group - children aged 0-4 are at greatest risk for severe injuries,followed by children aged 5-10. Elderly people aged 65+ years
are at greatest risk for fatal injuries.
4.29.1 Total accidents
An estimated 47% (190) of the severe injuries are ‘category B’ involving 5 or more days asan in-patient and/or transfer to a specialist hospital/burns unit treatment, and 53% (216)are ‘category A’, involving 1-4 in-patient days in hospital.
The key causes are shown in the following table, although it should be noted that theestimates are based on very small numbers of cases (<10 cases per group over 5 years) andhave limited statistical validity.
135
4.28.3 Age and sex of victim (severe and fatal injuries only)
Target risk group 1. None identified. Total numbers in each age group are below criticallevels. It should also be noted that the age groups with 4 severe injuries are based on 1single accident (for each age group) during the 5-year period, and are therefore notstatistically valid.
4.28.4 Accident mechanisms (severe injuries only)
All accidents
Most accidents with hot water bottles happen in bed, with the exception of accidents whenhot water was spilt while filling (which happened in the kitchen).
134
Table 4.28-3
Female
Male
0-4years
5-10years
11-17years
18-64years
65+years
0.0
0.5
1.0
1.5
2.0
2.5
0.7 pmpAverage severe
injuries pa per millionpopulation (total UK)
0-4 yrs 5-10 yrs 11-17 yrs 18-64 yrs 65+ yrs
Male 2.1 0 0 0.2 0Female 0 0 1.6 1.4 0.8
Table 4.28-4
Accident mechanisms % of cases Main time when occurs
Hot water burnt skin through prolonged contact with body 30% insufficient data
Hot water bottle burst while getting into bed 30% insufficient data
Spilt hot water while filling hot water bottle 10% insufficient data
No details of mechanism 30% insufficient data
Table 4.29-1
Total estimated 0-4 5-10 11-17 18-64 65+accidents years years years years yearsper year
Minor injuries (A & E visits) 7458 n/a n/a n/a n/a n/a
Severe injuries (A & E/in-patient) 406 94 53 12 223 23
Fatal injuries 20.7 0.3 0 0.3 6.3 13.7
Table 4.29-2
Severe injuries Fatal injuries
Sunbed/sun lamps 37 0
Curling tongs 25 0
Taps 25 0
Baking tins 21 0
Flask/thermos 21 0
Shower 16 0
Wall paper stripper 16 0
Electric blanket 16 2.7
Lighter fuel 14 0.3
Aerosol 12
Microwave 8 0
Toaster 8
Electric lamps 4 0
Plastic 4 0
Other miscellaneous 179 17.7
Total 406 20.7
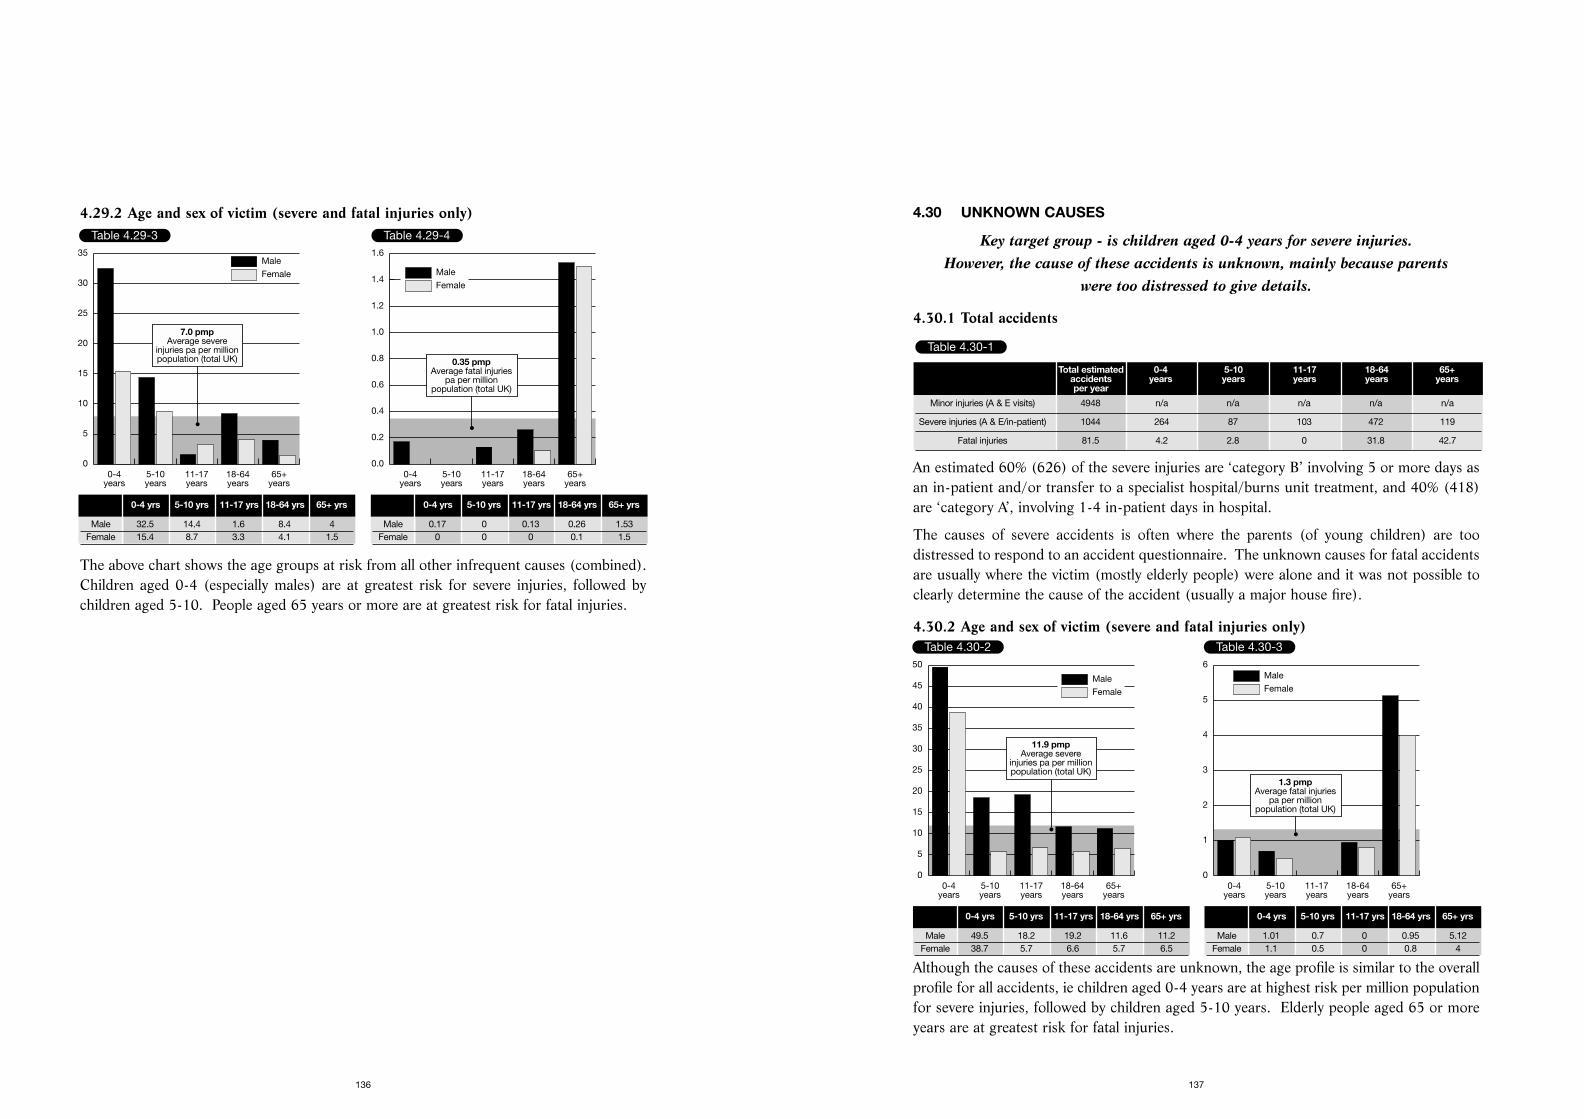
4.30 UNKNOWN CAUSES
Key target group - is children aged 0-4 years for severe injuries. However, the cause of these accidents is unknown, mainly because parents
were too distressed to give details.
4.30.1 Total accidents
An estimated 60% (626) of the severe injuries are ‘category B’ involving 5 or more days asan in-patient and/or transfer to a specialist hospital/burns unit treatment, and 40% (418)are ‘category A’, involving 1-4 in-patient days in hospital.
The causes of severe accidents is often where the parents (of young children) are toodistressed to respond to an accident questionnaire. The unknown causes for fatal accidentsare usually where the victim (mostly elderly people) were alone and it was not possible toclearly determine the cause of the accident (usually a major house fire).
4.30.2 Age and sex of victim (severe and fatal injuries only)
Although the causes of these accidents are unknown, the age profile is similar to the overallprofile for all accidents, ie children aged 0-4 years are at highest risk per million populationfor severe injuries, followed by children aged 5-10 years. Elderly people aged 65 or moreyears are at greatest risk for fatal injuries.
137
4.29.2 Age and sex of victim (severe and fatal injuries only)
The above chart shows the age groups at risk from all other infrequent causes (combined).Children aged 0-4 (especially males) are at greatest risk for severe injuries, followed bychildren aged 5-10. People aged 65 years or more are at greatest risk for fatal injuries.
136
Table 4.29-3
Female
Male
0-4years
5-10years
11-17years
18-64years
65+years
0
5
10
15
20
25
30
35
7.0 pmpAverage severe
injuries pa per millionpopulation (total UK)
0-4 yrs 5-10 yrs 11-17 yrs 18-64 yrs 65+ yrs
Male 32.5 14.4 1.6 8.4 4Female 15.4 8.7 3.3 4.1 1.5
Table 4.29-4
Female
Male
0-4years
5-10years
11-17years
18-64years
65+years
0.0
0.2
0.4
0.6
0.8
1.0
1.2
1.4
1.6
0.35 pmpAverage fatal injuries
pa per millionpopulation (total UK)
0-4 yrs 5-10 yrs 11-17 yrs 18-64 yrs 65+ yrs
Male 0.17 0 0.13 0.26 1.53Female 0 0 0 0.1 1.5
Table 4.30-1
Total estimated 0-4 5-10 11-17 18-64 65+accidents years years years years yearsper year
Minor injuries (A & E visits) 4948 n/a n/a n/a n/a n/a
Severe injuries (A & E/in-patient) 1044 264 87 103 472 119
Fatal injuries 81.5 4.2 2.8 0 31.8 42.7
Table 4.30-2
Female
Male
0-4years
5-10years
11-17years
18-64years
65+years
0
5
10
15
20
25
30
35
40
45
50
11.9 pmpAverage severe
injuries pa per millionpopulation (total UK)
0-4 yrs 5-10 yrs 11-17 yrs 18-64 yrs 65+ yrs
Male 49.5 18.2 19.2 11.6 11.2Female 38.7 5.7 6.6 5.7 6.5
Table 4.30-3
Female
Male
0-4years
5-10years
11-17years
18-64years
65+years
0
1
2
3
4
5
6
1.3 pmpAverage fatal injuries
pa per millionpopulation (total UK)
0-4 yrs 5-10 yrs 11-17 yrs 18-64 yrs 65+ yrs
Male 1.01 0.7 0 0.95 5.12Female 1.1 0.5 0 0.8 4
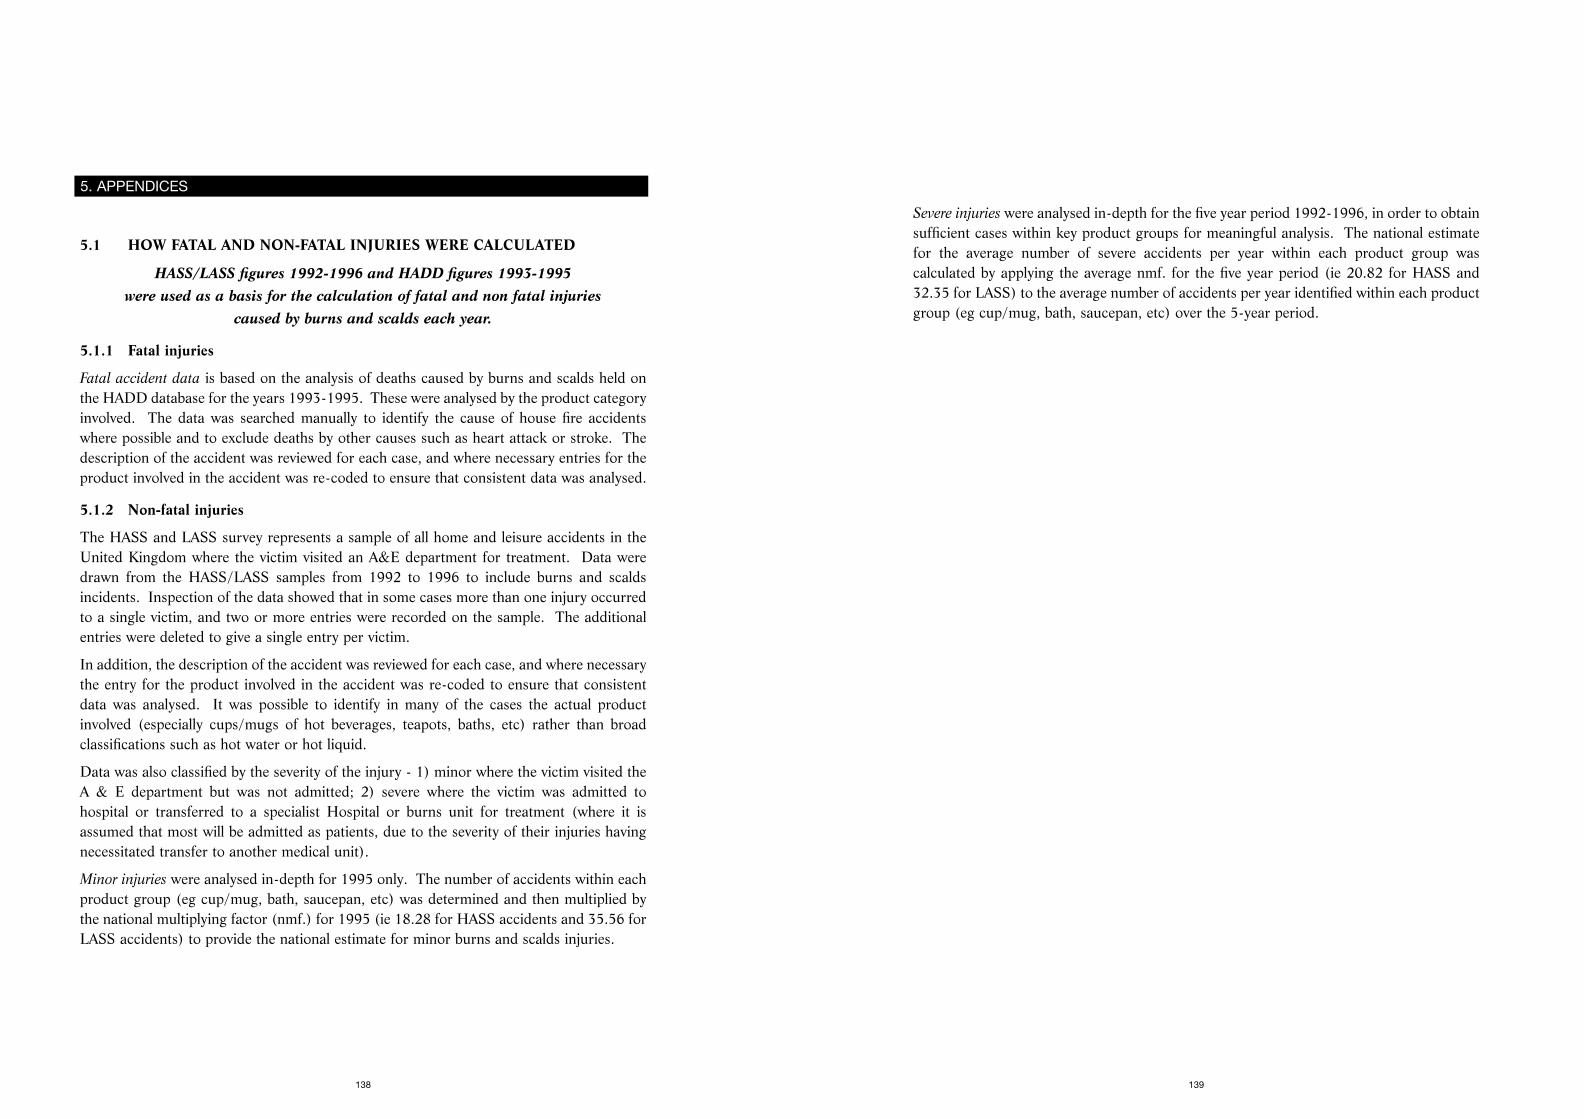
Severe injuries were analysed in-depth for the five year period 1992-1996, in order to obtainsufficient cases within key product groups for meaningful analysis. The national estimatefor the average number of severe accidents per year within each product group wascalculated by applying the average nmf. for the five year period (ie 20.82 for HASS and32.35 for LASS) to the average number of accidents per year identified within each productgroup (eg cup/mug, bath, saucepan, etc) over the 5-year period.
139
5.1 HOW FATAL AND NON-FATAL INJURIES WERE CALCULATED
HASS/LASS figures 1992-1996 and HADD figures 1993-1995 were used as a basis for the calculation of fatal and non fatal injuries
caused by burns and scalds each year.
5.1.1 Fatal injuries
Fatal accident data is based on the analysis of deaths caused by burns and scalds held onthe HADD database for the years 1993-1995. These were analysed by the product categoryinvolved. The data was searched manually to identify the cause of house fire accidentswhere possible and to exclude deaths by other causes such as heart attack or stroke. Thedescription of the accident was reviewed for each case, and where necessary entries for theproduct involved in the accident was re-coded to ensure that consistent data was analysed.
5.1.2 Non-fatal injuries
The HASS and LASS survey represents a sample of all home and leisure accidents in theUnited Kingdom where the victim visited an A&E department for treatment. Data weredrawn from the HASS/LASS samples from 1992 to 1996 to include burns and scaldsincidents. Inspection of the data showed that in some cases more than one injury occurredto a single victim, and two or more entries were recorded on the sample. The additionalentries were deleted to give a single entry per victim.
In addition, the description of the accident was reviewed for each case, and where necessarythe entry for the product involved in the accident was re-coded to ensure that consistentdata was analysed. It was possible to identify in many of the cases the actual productinvolved (especially cups/mugs of hot beverages, teapots, baths, etc) rather than broadclassifications such as hot water or hot liquid.
Data was also classified by the severity of the injury - 1) minor where the victim visited theA & E department but was not admitted; 2) severe where the victim was admitted tohospital or transferred to a specialist Hospital or burns unit for treatment (where it isassumed that most will be admitted as patients, due to the severity of their injuries havingnecessitated transfer to another medical unit).
Minor injuries were analysed in-depth for 1995 only. The number of accidents within eachproduct group (eg cup/mug, bath, saucepan, etc) was determined and then multiplied bythe national multiplying factor (nmf.) for 1995 (ie 18.28 for HASS accidents and 35.56 forLASS accidents) to provide the national estimate for minor burns and scalds injuries.
138
5. APPENDICES
locations. His preliminary findings are given below, comparing the relatively affluent SouthEast region with the relatively less affluent North East/North West regions.
Source - National Casemix Register
The above findings suggest that the number of burns and scalds in regions such as theNorth West and North East are about twice as high per hundred thousand populationcompared to the South East.
5.2.2 Reasons for a higher incidence of burns/scalds in lower socio-economic groups
Respondents gave several reasons explaining why people from low socio-economic groups(C2DE) are involved in more accidents per million population than people from highersocio-economic groups (ABC1). The most common reasons mentioned are given below.
• Higher unemployment and lack of finances, resulting in pressure to buy the cheapestproducts (rather than more expensive products that may have added safety features).
• Overcrowding
• Lack of parental control/supervision of children
• Poorer facilities used, eg low quality cookers, sometimes unsecured to the wall, or use of2-ring gas cookers at floor level.
• Fewer thermostats are thought to be used in hot water systems in council houses
• Higher frequency of deep fat frying in pans on the cooker at home.
• More smokers and associated smokers materials such as lighters/matches
NOTE - The above findings on socio-economic trends, are indicative only, being based on
qualitative views of specialists working with burns and scalds patients. A more rigorous
approach is required, including formal collection of key information regarding the occupation
of the main income earner of the burn/scald victim’s family, in order to obtain statistically
reliable information.
141
5.2 SOCIO ECONOMIC TRENDS IN BURNS/SCALDS
Discussions with regional burns units suggests that people from lower socio-economic backgrounds experience a higher number of burns and scalds
injuries compared to people from higher socio-economic backgrounds.
5.2.1 Segmentation by socio-economic groupings
Respondents at burns units were asked to estimate what proportion of the burns cases thatthey handle are from people in socio-economic groups ABC1 and what proportion fromgroups C2DE. (Most respondents were familiar with these groupings, and a briefexplanation was given by the interviewer if respondents were unclear.)
Six burns units provided estimates for the proportion of C2DE victims, and these are givenin the following table.
It is worth noting that the two highest percentages were given in Manchester and Birmingham,and the two lowest percentages were given for Nottingham and Stoke Mandeville.
These estimates are applied to the total number of severe burns/scalds (7765 pa), andnormalised per million population in the following table.
The above calculation suggests that people from C2DE backgrounds are about 50% morelikely to experience burns and scalds injuries compared to people from ABC1 groups.
It must be stressed that the above estimate is indicative only, since it is based on qualitativeestimates given by respondents in burns units who have a close working knowledge of theirpatients, rather than a statistically valid analysis of cases including details of the occupationof the main income earner in the family of the burns/scald victim).
The above findings are consistent with reports (identified during the literature search) anddiscussions with experts in the USA and Australia, which indicate that lower socio-economic groups overseas also suffer significantly higher numbers of burns and scaldsinjuries (per million population) compared with people in higher socio-economic groups.
Furthermore, Mr Ken Dunn, Senior Burns Surgeon at Withington Hospital, Manchester,is currently researching the incidence of burns and scalds injuries in different geographical
140
Table 5.2-1
50% 55% 60% 60% 75% 80% Average = 63%
Estimated % of C2DE victims
Table 5.2-2
Socio economic % of all Number of severe Est number of Severe burns/scaldsgroup burns /scalds burns/scalds population (m) per (m) population
ABC1 37% 2873 28.6 100
C2DE 63% 4891 29.8 164
Table 5.2-3
South East North East/North West
Total number of all burns/scalds (domestic and non-domestic) 15-16 35admissions per 1000,000 population
Disposable income per head (1995) 9,589 NW = £7,971NE = £7,420
Unemployment (1997) 3.8% NW = 6.3%NE = 8.5%
5.4 HOW BURNS AND SCALDS ARE ADDRESSED OVERSEAS
There has been notable success in reducing injuries, especially those caused by hot tap water. However, the number of scalds caused by
hot beverages remains unchanged.
5.4.1 How a campaign can best succeed in reducing burns/scalds injuries
Discussions with specialists in the USA, Australia and New Zealand, and analysis of 100+reports on burns and scalds injuries, highlighted which activities have had greatest impacton educating consumers of the risks of burns and scalds and more importantly on reducingthe number and severity of burn injuries, as well as what doesn’t work well. The findingscorresponded well with the injury analysis and discussions with specialists in the UK.
Key aspects of how a campaign is more likely to succeed in reducing burns and scaldsinjuries are summarised below, in approximate order of importance.
1. A passive solution is often an effective and permanent means of reducing injuries. The mosteffective solutions addressing burns/scalds injuries (relevant to the UK) are as follows:• Reduce the temperature of stored water to 50°C.• Alternatively, maintain stored water above 60°C but reduce the temperature of
delivered water (to the bath primarily) to 50°C through the use of thermostaticcontrolled mixer taps, although this may have limited application in the UK where itis thought that single hot/cold water taps are used, where as mixer taps are verycommon overseas.
Other passive solutions mentioned and considered to be effective are:• Cooker guards• Shorter flexes/curly flexes or cordless appliances (kettles)• Child safe taps• Deep fat electric fryers (as opposed to heating deep fat in a pan)• Smoke alarms• Child safe lighters• Flame resistant nightwear• Sprinkler systems
2. Safety promotional activities in the media can increase consumers awareness andknowledge about the risks of burns and scalds. It may also influence some consumersto consider initiating passive measures, if such measures or products exist (such aslowering water heater temperatures), and a facilitating agent such as a temperature testcard was found to be highly effective in combination with a co-ordinated media
143
5.3 MINOR BURNS AND SCALDS VICTIMS - GP SURGERIES
Discussions with respondents in GP surgeries indicate that there are at least 250,000 minor burn and scald accidents per year in addition
to those attending A & E departments.
5.3.1 Estimate of the number of GP treated minor burns and scald injuries
Respondents at GP surgeries were asked to estimate the number of patients per yearattending the GP surgery for treatment of a burn or scald injury, excluding industrial/workaccidents and referrals from hospital. Most minor burns and scald injuries are seen by thenurse practitioner and are not registered on the computer records unless they requiretreatment by the doctor, eg for antibiotics if infection occurs. Therefore the estimates wereusually based on a consensus among staff at the surgery.
* The Bridgnorth Surgery is also a cottage hospital, and therefore the figures may be higher than normal as patients who
elsewhere would go to an A & E department are likely to go immediately to the cottage hospital.
As can be seen in the table above, the highest proportion of burns and scalds cases are inthe practices with the highest percentage of C2DE patients on their lists. These were areasin Salford and Burton.
Although the above sample is small and is not statistically reliable, the average of 4.2 minorburns and scalds patients attending the doctor’s surgery per 1000 population gives a totalannual figure of around 250,000 additional accidents to those 112,000 per annum visitingthe A & E departments and fatalities. This compares favourably with the view of specialistsin burns units that there are 21⁄2 times as many patients with burns and scalds going to GPpractices for treatment than patients going to A & E departments.
Most burns and scalds cases at GP surgeries reflect the causes of A & E visits, ie mainlycups and mugs upset, contact burns with irons, cookers and heaters. Bath injuries wererarely mentioned as these tend to be severe and go directly to hospital. The burn or scaldis assessed, covered with a Flamazin dressing, and the patient returns several times to thenurse to ensure the wound is not infected and to change the dressing.
142
Table 5.3-1
Burns/scalds Patient List Cases per Commentspatients pa 1000 patients
Salford 150 13,000 11.5 70% of list C2DE
Burton-on-Trent 100 12,000 8.3 70% of list C2DE
Bridgnorth* 95 15,000 6.3 50/50 ABC1/C2DE
Tamworth 40 16,000 2.5 50/50 ABC1/C2DE
Sherwood 20 9,500 2.1 50/50 ABC1/C2DE
Newcastle, Staffs 20 10,000 2.0 50/50 ABC1/C2DE
Burton-on-Trent 7 11,500 0.6 70% of list ABC1
Bristol 10 19,000 0.5 70% of list ABC1
Total 442 106,000 33.8 Average 4.2 per 1000patients/population
Consumer perceptions may vary from country to country, and receptiveness to keysafety message may also vary. Several organisations overseas have found it verybeneficial to conduct surveys to a) determine the actual level of risk awareness thatexists amongst consumers and b) test different possible safety messages to ascertainwhich messages are most easily understood by consumers within the key target groups.
6. Community based education programmes are highly effective. The prime target shouldbe parents of young children, especially new mothers. One-to-one discussions or one-to-group discussions are found to be highly effective in educating consumers, especiallyif there is a relevant passive measure that can be initiated to eliminate (or greatly reduce)the risk. In the UK, there are good opportunities to initiate education of young parentsa) at pre-natal classes; b) in post natal gift packs and c) through the dissemination ofinformation via health visitors during post natal home visits.
7. School based education programmes can also be very effective. It is found that youngchildren especially (aged 5-10) are highly susceptible to safety messages, and respondwell to checking out how safe their own home is. They also enjoy being able to teachtheir parents something. Many young children also have younger siblings. Successfulpresentations need to be about 30 minutes long, contain simple repetitive messages,which are enhanced by teacher led modules during the normal school curriculum. Onelong term benefit of this type of approach is that many of the young people beingeducated become new parents themselves.
8. Identifying the key stakeholders involved can be essential. The process should involveall parties that are directly involved in the campaign, as well as any third parties that arelikely to be affected by the goals of the campaign (and/or may raise serious objectionsor promote policies that are alien to the goals of the campaign). Good communicationwith the parties concerned is essential. Well organised meetings where key participantscan be involved and air their concerns and views have been found to be particularlyeffective. Key participants may include representatives from health departments, tradeand industry departments, trading standards and safety executives, standards and codemakers, relevant branches of industry, trade and retail, and relevant trade associations.
9. Involvement of industry in promoting safer products can be a highly effective (and lowcost) way of getting consumers to buy safer products. Design competition can beeffective in stimulating industry to come up with new, effective ideas, especially if aprestigious award is involved. More importantly, industry is more likely to get stronglyinvolved if it clearly understands that a demand exists for a safer product, and that
145
programme. The insertion of literature into the utility bill explaining the value of testingthe level of risk in the home such as the temperature of hot water and the availability ofa free thermometer test card was also found to be extremely effective.
In addition, mass media is found to be very useful in getting the risk issues onto thepublic agenda, and informing key decision makers of the issues at stake.
TV consumer programmes are found to be quite effective, especially where 5-10 minutescan be spent on a single safety issue. Public safety announcements on the TV are alsoquite effective. Press and local radio can be fairly effective if focused on ethnic groups,especially where the information is given in the local language. Leaflets have greatest usein giving the key safety messages to key stakeholders such as standards departments,trading standards officers, community workers, etc, and ensuring that all concerned are‘singing from the same hymn sheet’ and trying to achieve an agreed common goal.
3. A facilitating agent, such as a temperature test card, can greatly enhance the successrate in getting consumers to act, either by reducing the temperature of their hot watersystem, or by seeking alternative ways of making the hot water system safer. A knockon benefit of such a facilitating agent was that once consumers had received literatureand acted on the primary area of risk (ie the hot water temperature) some consumersalso took note of the other burn/scald risk situations in their homes (highlighted in theaccompanying literature) and acted by buying safer appliances or fitting guard rails, etc.
4. A key safety message to promote is the correct actions to take after a burn or scald. Itis important that consumers are aware of the correct actions to take when dealing witha burn/scald victim - the most important action being to immediately immerse thecomplete burn area under cold running water for a minimum of 30 minutes if possible,before seeking further medical attention, unless the severity of the injury is lifethreatening. Burns specialists throughout the world agree that this action alone canoften reduce the severity of the burn (ie from a 3rd degree to 2nd degree or from 2nddegree to 1st degree) for all or part of the area of the body burnt/scalded. This in turncan reduce or even eliminate the need for subsequent skin grafts.
5. Other safety messages need to be kept simple for maximum impact. An effective safetycampaign should focus on one or two simple concepts, rather than risk confusingconsumers with a wide range of safety messages. Key messages identified fromdiscussions with overseas respondents and literature have been incorporated in themain body of the report (where relevant).
144
5.4.2.2 National Safekids, USA
National Safekids employs 43 people directly and has 235 coalitions throughout the USA.It has been successful in attracting sponsorship from the private sector. Johnson andJohnson has provided $1m pa for many years, and recent significant sponsorship contractsinclude General Motors, 1st Alert Smoke Detectors and Belsports (sponsoring bicyclehelmets). National Safekids has been instrumental in getting 28 states in the USA to amendplumbing codes to reduce hot water temperatures.
It found that focus groups were very important in a) establishing the actual level ofawareness (or lack of awareness) amongst parents and carers of the risks of burns/scaldsfrom different sources of hot water in the home (especially the bath) and b) the key safetymessages that were meaningful to parents/carers of young children.
The media it has found most effective in getting safety messages across have been thetelevision, especially major shows such as the Oprah Winfrey Show, and public serviceannouncements (PSAs) on the TV. Radio is also quite useful for targeting low income families,and certain ethnic minorities (especially where transmissions are in the ethnic language).Pamphlets and leaflets are thought to be extremely valuable in promoting a consensus messageamongst different funders and stake holders. They also ensure that codemakers, communityworkers, educators (as well as funders) are all ‘singing the same hymn’.
Another of Kidsafe’s goals is to provide suitable literature, videos, PSAs and other safetypromotion materials to support its local coalitions to ‘empower the local community’ andestablish effective community led education of the target audience. In many cases, thisinvolves staff at local health departments or hospitals.
5.4.2.3 Burns Institute - San Diego
San Diego regional burns centre has seen burns injuries fall about 25% over the last 6 yearsfrom 436 to 333 acute injury admissions a year. About 75% of these injuries are home andleisure accidents. During the same period, the population is estimated to have grown about15%, hence the real decrease in injury rate per million population is about 35%.
The Burns Institute believes that much of the success in reducing burns and scalds injuriesare a result of the vigorous safety prevention campaign that it has initiated. The campaignhas focused on educating consumers of the risks.
10% of the Institute’s safety promotion effort is media based, mainly PSAs which areconsidered to be more valuable in promoting general awareness amongst potential fundraisers of the role of the burn institute, rather than raising public awareness significantly.90% of its safety promotion effort is community based. Most of the past efforts havefocused on targeting children of different ages, through school education programmes, andmotivating the children to educate their parents and siblings. The puppet show (aimed at
147
public safety campaigns are going to strongly increase the public’s awareness of thesafety issues and create a growing demand for safer solutions. Once companies can seea profitable market opportunity developing, they often initiate highly focused andeffective marketing campaigns to get the desired products to the consumers at risk.
Some major corporations that sell products related to products involved in burns or scaldsinjuries (or high risk groups such as young children) are often prepared to fund wellorganised safety campaigns. Being associated with saving the lives and welfare of babiesand young children in particular is perceived as greatly enhancing the funders’ corporateimage. Effective ways of getting industry involved include a) personal visits (enhanced ifit includes a senior burns surgeon and a suitable burn/scald victim), b) special events, c)brochures/literature setting out the general message and safety policies/goals.
10. Changes in standards/codes, and legislation (where relevant), can sometimes supportthe process of replacing older, less safe products with new safer products, provided suchlegislation can be enforced in practice. This can apply to replacement products (iewhen old water heaters need replacing) as well as new installations.
5.4.2 Experience of tackling burns & scalds injuries in Norway, USA and Australia
5.4.2.1 Harstad, Norway
A 10 year programme which targeted the prevention of burns an small children. The burnrates in Harstad (23,000 inhabitants) and its six surrounding municipalities (14,000inhabitants) fell by 51% and 40% respectively following a community based interventionprogramme, while burn rates in Trondheim (population 134,000) where no interventionswere promoted, remained stable over the same period.
The programme consisted of a mix of passive interventions (the two most successful beingthe lowering of tap water thermostat settings to 55°C and the promotion and installation ofcooker safeguards) and active interventions through the promotion of increased parentalvigilance in putative burn situations. Parental counselling via public health nurses (at thetime of birth and at 4 monthly intervals throughout the statutory 4-year vaccinationprogramme) was thought to be particularly effective in raising the awareness of the risks ofburns and scalds to young children and the subsequent installation of passive interventions.The use of local statistics and case studies of recent accidents in the Harstad region wasalso considered to have been an effective tool in convincing people that these types ofaccident can happen to them, rather than to someone else far away in a national database.
A project is now under consideration to apply the community based interventionprogramme to a large community, i.e. Oslo. The city will be divided into about 9 separate‘communities’ and accident data will be provided for each separate community.
146
Health Department. The Department approached the plumbing industry to raise itsawareness of the number of injuries involved each year and the seriousness of the injuries,including articles in plumbing newsletters and sending safety material packs to plumbers.More importantly it promoted the value added business available to the plumbing industryby promoting safer products.
One of the key tools available was the low cost temperature test card, with Kidsafe(Australia) and the Department of Health on it endorsing the campaign. This allowedplumbers to test the temperature of hot water of people’s homes when called out for a visit,and explain on a one-to-one basis if the temperature of the water was unsafe. They couldalso produce safety literature and advise of solutions that were available. Two suppliers ofhot water systems changed their marketing strategies and focused on promoting new safetyproducts. Several solutions were made available, and both companies profited significantlyfrom the campaign. The major energy producer also stopped its ‘Hottest of Hot Water’campaign, which was contradictory to the goal of the safety campaign.
Child health centres throughout the state promoted safety awareness to parents of youngchildren. The Safety Centre at the Royal Children’s Hospital in Melbourne has akitchen/bathroom display, highlighting the dangers of burns and scalds in the home andalso sells a wide range of safety products including child safe taps, dual water systems,tempering valves, oven door guards, stove guards, etc.
The third goal of hot tea/coffee is as yet unresolved. Monash University has developed someprototype designs for a more stable heavy bodied/wide based mug (with a low centre ofgravity) but currently lacks the funds to test the mugs for stability as well as test theacceptability of different designs amongst consumers. The mugs would be targeted atnursing mothers, possibly promoting them through maternity hospitals as part of new babygift packs. However, one problem these mugs face is overcoming consumer resistance interms of lack of aesthetic appeal of such a mug.
5.4.2.5 New South Wales, Australia
In New South Wales State an estimated 450 children under 15 are hospitalised each yearas a result of scalds, a further 900 seek care at an Emergency Department (ED) for suchinjuries and up to 1,800 seek medical care by a GP. Of those hospitalised, a third are severecases requiring 5 or more days in hospital, and these children almost always need manyoperations for skin grafts and on-going treatment. It is estimated that each severe scaldinjury costs at least $60,000 (£25,000) to treat (including multiple surgery, burnsmanagement treatment, physiotherapy, ongoing medical check-ups and medication). Theleading cause of scalds to children in the home is hot beverages (50% of ED admissions).However, hot tap water accounts for about 25% of all admissions, and tend to be moreserious because of the large surface body area involved and longer exposure time.
149
6-9 year olds) is considered to be extremely successful, as well as popular. Key safetymessages (given by Burns Institute personnel) are enhanced by teacher led modules andwork assignments aimed at the children checking the safety of their own homes andteaching their parents the key safety messages. Young children are particularly motivatedat the prospect of teaching their own parents something new and important. Follow upeducation programmes are repeated to 9-13 year olds and 14-17 year olds, with the formatand safety messages adapted to address the burns risks relevant to each age group.
Child care burn prevention messages are also presented to groups of expectant mothers andnew parents. These involve the presentation of a 45 minute video followed by discussionof the key safety issues. The focus is safety in the kitchen and bathroom. Similar videopresentations and discussions are given to senior citizens (55 years and over!). Both theseprogrammes are currently limited in number, but are becoming more important in theInstitute’s future promotion campaigns.
Several key aspects of successful safety promotion material emerged over the years.
1. Pictures and images are much more powerful than words.
2. One-to-one or one-to-small group interactive teaching is very effective in getting thesafety messages both understood and remembered.
3. A small number of simple messages, repeated several times, is more effective than tryingto present many complex messages.
5.4.2.4 Victoria, Australia
Victoria State identified three priorities regarding burns and scalds injuries - a) house fires,b) hot water scalds and c) scalds from tea and coffee (mainly cups/mugs).
There has been some success in addressing house fires, by getting smoke alarms fitted inhomes. All new homes in Victoria as well as homes having substantial alterations arerequired to have smoke alarms fitted. It is estimated that 75% of homes now have alarms.The second generation campaign has focused on ensuring that alarms are still functional.Consumers are reminded to change batteries at the same time that they change their clocks.Local fire brigades also promote safety awareness to children during school visits.
There has been a significant reduction in the number of burn/scald injuries in Victoria Stateover the last 5 years from scalds caused by hot water. Most water in Australia is heated byelectricity, and heated to 65-70°C to utilise the benefits of off-peak electricity. One of thekey goals was to set the standards to deliver water in the bathroom to a maximum of 50°C.The next goal is to get the standard incorporated into state legislation.
Another key factor in the campaign that is thought to have contributed to the fall in hotwater scalds was the successful ‘Working with Industry’ campaign, funded by the Victoria
148
Sept 1994 The Plumbing Code of Australia, Australian Standard AS3500 part 4 wasamended in line with the NSW Residential Hot Water Policy Statement torecommend that all new residential hot water supply systems be established toensure that the maximum temperature of hot water delivered to new bathroomswill not exceed 50°C.
The media campaign commenced in July 1994, once the key groundwork outlined abovehad been carried out. The central tool or ‘enabling factor’ in the campaign was a hot watertemperature test card containing a liquid crystal thermometer and an accompanyingbrochure, which encouraged the testing of hot water and gave different options available tothe consumer to reduce the risk of a tap water scald. Many stakeholders, especially gascompany plumbers, reproduced the card with their own logo alongside NSW Health.
Key supporting media marketing included a paid television commercial featuring the Headof the Burns Unit of the Children’s Hospital (and his daughter) promoting the hot watertemperature card, paid radio advertising, newspaper adverts and the dissemination of120,000 cards and brochures. In addition, NSW Health in conjunction with StandardsAustralia sponsored an award for the design of a scald safety product as part of the annualDesign Mark Awards. 17 companies entered designs, covering all aspects of scalds in thehome and the winner was an Australian manufacturer of tempering valves (which mix coldwater with hot to ensure that a pre-set temperature is delivered from the hot water tap).
In 1995, a random survey showed that 24% of homes contacted (with children aged 0-4years) said they had a temperature card, 84% of these families had used the card to measurethe temperature of the hot water in their home and 81% had turned down the temperatureof their hot water system. Hence about 20% of NSW homes with children aged 0-4 weresafer from the risk of scalds from hot tap water.
The use of the test card is therefore believed to be one of the major contributors to the
reduction of scalds injuries in the NSW region.
Another key factor that contributed to the success of the campaign was the identificationand involvement of the key stakeholders, which included discussing potential barriers to theimplementation of the campaign and finding acceptable solutions.
The media considered most effective (in approximate order of effectiveness) is as follows:
Temperature test card - accepted by all parties, easily understood by consumers, and couldbe re-used. (There is evidence that some parents passed it on to friends/relatives).
TV programmes - can get 4-5 minutes addressing the issues in depth, supported by wellchosen case stories. TV adverts also very good, but short and expensive.
Meetings with stakeholders/partners - Communication was essential for the campaign towork. This included correcting mis-information, and addressing genuine fears so thatbetter solutions could be developed, even though agreement wasn’t possible on every issue.
151
The aim of the campaign was to reduce the number of scalds in young people by 28% over10 years (1992 to 2001). In the 7 year period (1988/89 to 1995/96) the number of scaldsin NSW children aged 0-4 (the dominant age group among children under 15) fell by13.5%. Furthermore, the mean length of stay for child scalds fell by 18% from 6.7 days to5.5 days and the total bed days fell by 22% in the last 2 financial years. These results showa reduction in the severity of scalds incurred as well as the number of scald victims. Theprogramme to date involved 2 distinct phases.
Phase 1 (1988-1992) was to put scald injuries on the public agenda. The ‘Hot Water BurnsLike Fire’ campaign, was aimed at raising parents and carers awareness of the frequencyand nature of scalds to young children. It also raised the issue of scalds with key decisionmakers, in respect of safer standards and the promotion of safer products to minimise therisks through passive intervention. Key marketing included TV commercials, an 8-pagesupplement in major Sunday newspapers, ‘Doctors Television Network’ in GP waitingrooms, a national current affairs programme and coverage in local TV and radio.
Phase 2 (1993-1996) was a more focused campaign, targeting accidents involving hotwater scalds, partly because these injuries usually involve more serious injuries. Two keyareas of focus were - 1) to ensure that new hot water systems (new homes and renovatedhot water systems) should deliver water at safe temperatures (50°C) and 2) to raiseawareness amongst consumers of options available to reduce temperatures of deliveredwater in existing hot water systems. Major milestones in this campaign were as follows:
May 1993 Meeting called by NSW Health of State and national experts in infectioncontrol to discuss safe home water storage temperatures results in unanimoussupport for 50°C as a safe storage temperature for residential settings.
Sept 1993 Meeting between NSW Health and hot water manufacturers to discuss barriersand (business) opportunities linked to changes in the Plumbing Code.
Dec 1993 NSW convened a meeting with over 20 stakeholders in the hot water industry(including Standards Australia, Pacific Power, Sydney Electricity, ProspectCounty Council, The Water Heater Industry Group, Rheem Australia, AGL,Australian Gas Association, The National Gas Company, Master PlumbersAssociation of NSW, NSW Department of Public Works, and various traders,retailers and manufacturers) and reached agreement on the wording of theNSW Policy Statement - “To reduce the incidence of hot tap water scalding, allnew residential hot water supply systems should be installed to deliver hot waterat a maximum of 50°C measured at the outlet of all sanitary fixtures (eg inbathrooms, including ensuites)”.
150
Between 1970 and 1994 there was a 66% reduction in the annual number of burnadmissions to the Royal Children’s Hospital, a similar reduction across the state, and a 40%fall in the mortality rate. Reductions occurred for all types of burns, ie scalds by 60%, flameburns by 55% and contact burns by 70%, but at differing times corresponding to theintroduction of product legislation, education programmes and changes in heatingpractices. However there was no decline in the number of beverage related scalds. Theburn education prevention campaigns in the media, especially those directed towards hotwater burn injuries among younger children is thought to have played a role in reducing thenumber of burns and scalds injuries.
NSW Public Health Policy Statement on the safety of 50°C temperature hot waterdelivery in domestic settings. Dr George Rubin, Chief Health Officer, New South WalesDepartment of Health, 1993. The policy statement was - “To reduce the incidence of hot
tap water scalding, all new residential hot water supply systems should be installed to deliver
hot water at a maximum of 50°C measured at the outlet of all sanitary fixtures (eg in
bathrooms, including ensuites”. The following responses were made to questions raised.
A committee of infectious disease specialists and injury prevention specialists met in May1993. The infectious disease specialists, including a representative on the NH&MRCLegionella task force were satisfied that 50°C storage temperature would not increase thepopulation risk of Legionnaire’s disease. Facts provided by Professor Lyn Gilbert at themeeting included - “Legionellae multiply rapidly at 37°C, more slowly at 45°C, while growth
is inhibited at temperatures in excess of 45°C, and destroyed at 50°C. The kill rate depends
on further increases. 50°C means a kill rate of 50% every 30 minutes, 54°C means a kill rate
of 99% in 10 minutes and 60°C means a kill rate of 99% in 1 minute.”
Furthermore, at present in the USA, over half of the states (28/50) have legislated for 49°Cas a setting for new home hot water systems (aimed to reach 130 million people). Somestates have had this legislation for over 10 years. A review of the Centers for DiseaseControl - data from “Summary tables - notifiable diseases - reported cases by geographicareas” (in “Summary of notifiable diseases in the United States”), MMWR - 1980 through1989, shows that there has been no significant increase in Legionnaire’s disease in thesestates compared with those which do not have the legislation in place.
In addition, a review of literature by Dr Alfild Larson of the University of Tasmania, showedthat despite many case control studies looking for the cause of sporadic cases ofLegionnaire’s disease and the many millions of people who are exposed to Legionellae intheir own homes, there are published reports of only four cases of Legionnaire’s diseasesuspected to have been acquired from home hot water heaters. Only two of these casesreported the tank temperatures, and the temperatures were 37°C and 35°C - well below therecommended temperature of 50°C and right within the prime breeding temperature range(ref; Stout JE. Yu VL, Muraca P: Legionnaire’s disease acquired within the homes of twopatients: link to the home hot water supply. JAMA; 257 (9), 1215-1217 1987).
153
Press and radio were considered useful for reaching specific ethnic groups and lower socio-economic groups.
Leaflets were considered to have been quite useful, especially in explaining the morecomplex messages. They also contain important contact numbers.
5.4.3 Reports on burns and scalds extracted from the literature search
Prevention of tap water scald burns: Evaluation of a multi-media injury controlprogramme. Murray Katcher, AJPH Sept 1987, Vol.77, No9. A prospective study wasdesigned to evaluate a mass media prevention programme reaching 2m people to determinethe impact on risk awareness of hot tap water burns and injury prevention behaviour.Liquid crystal thermometers for testing hot water temperature were offered at no cost.140,000 thermometers were requested, 45% learning about it from the television and 44%from the utility bill insert, 7.7% from newspaper adverts. 61.5% of people who requesteda liquid crystal thermometer tested their hot water temperature. Of these, 43% rated theirwater as high in temperature (ie >54.4°C) and 52% of this sub group turned down theirhot water system. This meant that about 15% of the 140,000 people who requested athermometer acted and reduced the potential for scalds. However, a separate surveyamongst people that did not receive a thermometer showed that although the educationprogramme raised awareness of the danger of hot tap water from 72% to 89%, there wasno increase in either testing or lowering of water heater temperatures. Clearly, the additionof a ‘facilitating agent’ had a major impact on consumer behaviour.
Tap water burn prevention: The effect of legislation. Erdman, Feldman, Rivara,
Heimbach and Wall, PEDIATRICS Vol. 88 No. 3 September 1991. Five years after a 1983Washington State Law required new water heaters to be preset at 49°C (120°C), 77% ofhomes (84% of homes with post-law and 70% of homes with pre-law water heaters) hadtap water temperatures of less than 54°C, compared with 20% in 1977. Few peopleincreased their water heater temperature after installation The average admission rate forburns victims fell by 56% from 5.5 in the 1970’s to 2.4 from July 1979 to May 1988.Compared with the 1970’s the total body surface area burned, mortality, grafting, scarring,and length of stay in hospital were all reduced. A combination of legislation and educationcampaigns has resulted in significantly safer water temperatures, and appears to haveresulted in a reduction of frequency, morbidity and mortality of tap water burn injuries inchildren. Furthermore, lower water heater settings proved acceptable to the consumer.
Reduction in paediatric burn admissions over 25 years, 1970-94. C Streeton, T Nolan,
Injury Prevention 1997;3. Hospital records of the Royal Children’s Hospital burns unit,Melbourne were audited for 1974-90 (4992 cases), as well as statewide hospital admissionsidentified from the Victorian Inpatient Minimum Database for 1987-94 (3353 cases) andburn deaths in Victoria (163 cases) from the Australian Bureau of Statistics 1970-94.
152
5.5 RESPONDENTS INTERVIEWED, REPORTS/LITERATURE CONSULTED
84 respondents were interviewed - 39 by face-to-face interviews indicated by an asterisk (*) and 45 by telephone interviews. Over 100 reports
and articles were also reviewed.
5.5.1 Details of respondents interviewed during the programme of research
Burns Units/HospitalsAberdeen Royal Sr Fiona Day, Ward Sister UKBooth Hall Children’s Burns Unit* Kevin Ryan, Ward Manager UKBooth Hall Children’s Burns Unit* Nurse Marcia Watson UKCity Hospital, Nottingham* Miss F Bailie, Consultant Plastic/Surgery UKMount Vernon Burns Unit Sue Forbes, Unit Manager UKNorth Staffordshire Burns Unit* Sr P Dunn, Unit Manager UKNuffield Burns Unit, Stoke Mandeville Staff Nurse Adele Jones UKPinderfields Hospital, Wakefield* Dr K Judkins UKRoyal Hospital for Sick Children, Peter Raine, Consultant Burns Surgeon UKSt Andrews Centre for Plastic Surgery Ms Jackie Watson, Ward Manager UKSandwell District Hospital Jane Purvis, Secretary to Plastic Surgeon UKSelly Oak Hospital Burns Unit* Sr Lesley Street, Development Mgr UKSelly Oak Hospital Burns Unit* Helen King, Play Therapist UKSelly Oak Hospital Burns Unit John Gowar, Snr Consult Burns Surgeon UKWithington Hospital* Ken Dunn, Consult Burns Surgeon UKWithington Hospital Ken Dunn, Consult Burns Surgeon UKYorkhill Hospital, Peach Unit Dr David Stone, Director UK
GP surgeriesBridge Street Surgery, Stapenhill* Sr Helen Wanda, Nurse Manager UKBridge Street Surgery, Stapenhill* Sr Sylvia Smith, Practice Nurse UKBridgnorth Hospital* Sr Joyce Green, Nurse Manager UKGordon Street Surgery, Burton* Sr Tracey Atherton, Practice Nurse UKHollies Medical Centre, Tamworth* Sr Jan Wheeldon, Practice Nurse UKLangworthy Medical Centre, Salford* Sr Colleen Greenall, Nurse Practitioner UKSherwood Health Centre, Nottingham Rachel Nield, Practice Nurse UKWhiteladies Health Centre, Bristol Sr J Edmonds, Treatment Room Nurse UKWolstanton Medical Centre* Dr R J Tucker UKWolstanton Medical Centre* Rose Goodwin, Nurse Team Leader UKWolstanton Medical Centre* Pat Cartwright, Health Visitor UK
UK
Manufacturers/suppliers/trade associationsBuilding Research Establishment Dr David Purser, Section Head UKBuilding Research Establishment Martin Schuler, Public Health, Water UKHaden M Attwood, Sales Director UKCreda Edward Alcock, Health & Safety Officer UKMoulinex Swan Garry Wassall, Technical Manager UKNational Housebuilders Council Richard Brown, Technical Officer UKNational Home Improvement Council Mary Murphy, Housing Trusts Officer UKPhilips Domestic Appliances Barry Coldbreath, Marketing Dir UKPhilips Domestic Appliances Geoff Train, Total Quality Manager UK
155
Iron burns to the hand in the young paediatric patient: A problem in prevention.Brown, Greenhalgh and Warden, J Burn Care Rehabil 1997. Iron burns are a commoncause of contact burns in children. Although the total surface area is usually small, the handis frequently involved, often resulting in both functional and cosmetic deformities. A reviewof 82 paediatric patients suffering iron burns to the hand during the period 1987-92 inCincinnati, Ohio showed that iron burns to the hand occurred most commonly in malechildren less than 2 years of age. Most were minor partial thickness burns, but 15%sustained full thickness burns requiring grafting. 10% of patients developed complicationsincluding hypertrophic scarring and scar contractures requiring surgical release.
Socio economic factors and parental inexperience appeared to play a significant role, asmost of these injuries occurred in low income, single parent, single child households. Mostinjuries were unintentional, however, many were caused by carelessness or neglect. Abusewas suspected or proven in 7% of the cases.
154
5.5.2 Details of reports, articles and other material used as reference material
Internet pages1997 Babyproofing the bathroom, Parentzone, USA1997 Burns, Scalds and You, Safekids, USA1997 Childhood Burns: The Preventable Epidemic, Jean L Athey, USA1997 Childproof tap cover offer, NSW Health Department, Australia1997 DFRS - Fire Safety Tips, Maryland Fire & Rescue, USA1997 Don’t get burned, Baton Rouge Gen Med Centre, USA1997 Fire and Burn Injury Interventions, Harborview Inj. Prevention Centre, USA1997 Fire and Burn Safety education materials, Burn Institute, San Diego, USA1997 Fire Safety Quiz, Harleysville Group, USA1997 Injury Prevention Program, Loyola University Med Centre, USA1997 Iowa Health Book: Preventing Scalds, Mass.Public Health Dept, USA1997 Kids Safety Page, The Childproofer Inc, USA1997 Microwave Burn Prevention, Shriners Burns Institute, USA1997 Parents Appliance Use & Safety Exchange, Ohio State University, USA1997 Press release Dr Ytterstad winning prize, State Ministry for Health, Norway1997 Preventing burn injuries among special needs, Univ of Kansas Med Centre, USA1997 Preventing Hot Water Scalds, Canadian Parents Online, Canada1997 Report - Victorian Scalds Prevention Campaign, Kidsafe, Australia1997 Scald Burn Injury, Kidsafe Washington, USA1997 Scald Burn Prevention, Safe Kids Home page, USA1997 Scalds & Falls of Infants & Small Children, CPSC, USA1997 Scalds in the Kitchen, Kennett Fire Company, USA1997 Tips for burn prevention, Arkansas Children’s Hospital, USA1997 Your Home Fire Safety Checklist, CPSC, USA1996 Accidents & Safety Health Education Scotland, HEBS, UK1996 Accidents in the Home - RIB, Strategy & Intelligence Group, Ireland1996 Children and Burns, University of Georgia, USA1996 Fire Burn Prevention Week, Safe Kids Coalition, USA1996 Home Injury Prevention Project, University of Georgia, USA1996 Home Safety for Seniors, Victoria Care Division, Australia1996 Hot water temperature and scald burns, Public Health Assoc., Australia1996 Manic Moms Safety Video, Manic Moms Journal, USA1995 First Aid Book - Burns & Scalds, MedAccess Corporation, USA1995 Overview initiatives to reduce incidence/severity scalds, Kidsafe Australia1995 Water heater settings - safety first, Missouri Outreach, USA1994 Fires, flames and scald deaths Australia 1994, NISU, Australia
Other reports, articles, teaching aids1997 "Hot Water Burns like Fire", NSW Scalds Prevention Campaign evaluation report, NSW Injury
Prevention Policy Unit1997 Accident Notebook, S. Birmingham Community Health1997 Burn Incidence and Treatment in the United States, American Burn Ass’n 1997 fact sheet1997 Child Accident Prevention Campaign Evaluation, Health Education Board Scotland1997 Choose the right kettle, September issue of Which?1997 First Aid for Scalds Campaign, Angela Georgiou and Kristen Gatenby1997 Iron burns to the Hand in the, Young Paediatric Patient a Problem in Prevention, R Brown, D
Greenhalgh and G Warden Journal of Burn Care and Rehabilitation1997 Reduction in paediatric burn admissions 25 years 1970-94, C Streeton, T Nolan/Injury Prevention
157
Royal Doulton Tableware Richard Halliday, Marketing Manager UKStaffordshire Tableware Gail Jones, Licensing Manager UKStoves Ray Bowen, Research & Development UK
OthersArgyll & Clyde Health Board Lorraine Crawford, Librarian UKBirmingham Post and Mail Anna Burke, Information Officer UKHealth Education Board for Scotland Heather Kennen, Programmes Officer UKHealth Education Board for Scotland Sandy Whiteacre, Promotions Department UKHealth Education Board for Scotland Steve Garrad, Audio Visual Department UKLiverpool Post and Echo Jenny McLaren, Information Officer UKRoSPA Janice Cave, Safety Officer UKSt Margaret’s CE Junior School R Whittaker, Headmaster UKSolihull Council Social Services Ms Liz Hobbs, Senior Social Officer UKSouthern Birmingham Health Trust Jackie Montgomery, Care Dev Officer UKSouthern Birmingham Health Trust Lynn Inglis, Promotions Unit UKUniversity Newcastle, Child Health Dr E Towner, Snr Lecturer Child Health UKUniversity Newcastle, Child Health Dr Thein Ohn, Research Associate UKParent of scald patient Mrs Wareham UKParent of scald patient Mrs Gregory UK
Overseas organisations Kidsafe NSW, Sydney* Peta Smith AustraliaKidsafe Victoria, Melbourne* Ian Scott AustraliaNSW Health Department, Sydney* Pam Albany, Injury Prevention Unit AustraliaNSW Health Department, Sydney* Jane Elkington, Injury Prevention Unit AustraliaNSW Health Department, Sydney* Carl Erle, Injury Prevention Unit AustraliaRoyal Children's Hospital, Melbourne* Julian Keogh, Burns Surgeon AustraliaThe Safety Centre, Melbourne* Lynda Hannah, Manager AustraliaThe Safety Centre, Melbourne* Jeni Foster, Safety Programme Co-ordinator AustraliaThe Safety Centre, Melbourne* Barbara Minuzzo, Advisory Line AustraliaCounty Hospital of Aarhus Secretarial Department DenmarkMinistry Family Affairs & Childcare Vibeke Bildoy, Product Advisor NorwayNorwegian Board of Health Marit Christie, Adviser NorwayStatens Institut för Folkehelse Dr J Wiik, Deputy Director NorwayStatens Institut för Folkehelse Branco Coppia, Head of Health NorwayStatens Institut för Folkehelse Steffi Wetterland, Information Officer NorwayInjury Prevention Research Centre* Borge Ytterstad (on secondment to IPRC),
author of the Harstad Injury Prevention Study NZBurns Institute San Diego* James Floros, Executive Director USABurns Institute San Diego* Nancy Nowak, Director Programme Services USACPSC, Washington DC* Jim Hoebbel, Chief Engineer Fire Hazzards USACPSC, Washington DC* Donald Switzer, Directorate Engineering USACPSC, Washington DC* Linda E Smith, Senior Statistician USACPSC, Washington DC* Suad Nakamura, Physiologist USANational Safekids Campaign, Washington* Heather Paul, Executive Director USANational Safekids Campaign, Washington* Angela Mickalide, Program Director USANational Safekids Campaign, Washington* Ana Validzic, Research Assistant USAOhio State University, Columbus Dee Jepson, Engineering Health and Safety Dept USATrauma Foundation, San Francisco* Andrew McGuire, Executive Director USATrauma Foundation, San Francisco* Eric Gorovitz, Resident Lawyer USATrauma Foundation, San Francisco* Elizabeth McLoughlin, Director of Programmes USA
156
1993 Preventing Tap Water Scalds: do consumers change their pre-set Thermostats?, S Webene andB Kaplan, American Journal of Public Health Vol 83
1993 Prevention of Hot Tap Water Burns – a comparative study of three types of automatic mixingvalve, F Stephen and J Murray Worthing Hospital, Burns (1993) Vol 19 /No.1
1993 The Effect of Education and Safety Devices on Scald Burn Prevention, M Fallat, S Rengers/The Journal of Trauma, Vol 34
1992 Burns Prevention, Marga Penny, Victorian Injury Surveillance System1992 Decreasing Mortality and Morbidity Rates After the Institution of a Statewide Burn Program, D
Clark, M Katz, Susan Campbell/Journal of Burn Care and Rehabilitation Vol 13 March/April 19921992 Microwave Heating of Infant Formula : A Dilemma Resolved, M Sigman-Grant, G Bush, R
Anantheswaran, Paediatrics Vol 90 Sept 19921992 Stop Carelessness? No, Reduce Burn Risk, E McLoughlin, P Brigham/Paediatric Annals July 19921991 Bath scalds in children in the south-east of Scotland, W Tennant , P Davison/J R Coll Surg
Edinburgh Vol 361991 Efforts to prevent Burns from Hot Tap Water, M Katcher1991 Tap Water Burn Prevention: The Effect of Legislation, T C Erdmann, K Feldman, F Rivara, D
Heimbach, H, Wall, Paediatrics Vol 99 Sept 19911991 The prevention of hot tap water burns – a study of electric immersion heater safety, F Stephen
and J Murray Burns Vol 171990 Burns from Hot Oil and Greases, Burns Prevention Forum1990 A Rising Hazard, Chisholm, Paediatric Nursing, Nov.1990 Leisure Accidents to the Under Fives, Consumer Safety Research, DTI1990 A Rising Hazard: A disturbing increase in the incidence of burns and scalds, Jan
Chisholm/Paediatric Nursing November1990 Burns from Hot Oil and Grease: A Public Health Hazard, W Schubert, D Ahrenholz and L
Solem/Journal of Burn Care and Rehabilitation Vol 11 Nov1990 Crawl on Your Belly Like GI Joe, J Wade, Purdue, Hunt and Childers Burn Prevention Forum1990 Domestic burns among children, B E Lindblad and C J Terklesen/ Burns printed in Great
Britain August 19901990 Epidemiology of domestic burns related to products, B Lindblad, C Terkelsen and H
ChristensenBurns Vol 16 no 2
1990 Fatal tap water scald burns in the USA 1979-86, A R Walker, Burns Vol 161990 Patient Perception of Quality of Life After Burn Injury. Results of an eleven year survey, N
Cobb, G Maxwell P Silverstein/Journal of burn care and rehabilitation July/Aug 19901990 Scald Burn Prevention Strategy, Safe Kids are no accident, National Safe Kids Campaign1990 The Causes, Cost and Prevention of Childhood Burns Injuries, E McLoughlin, A
McGuire/AJDC June 19901989 Frequency of suspected abuse/neglect in burn patients, N Rosenberg, D Marino/ Paediatric
Emergency Care Vol 51989 Liquid-Crystal Thermometer Use in Paediatric Office Counselling about Tap Water Burn
Prevention, M Katcher, G Landry, M Shapiro Paediatrics Vol 83 May 19891989 Evaluation of the Efficacy of a Strategy to Reduce Tap Water Temperature in a Population at
Risk for Scalds, S Weben, B Kaplan, M Shaw - Developmental and Behavioural paediatrics1989 Scald Burns Associated with Tap Water, M Maley/Burn Prevention Forum March/April Vol 101989 Report on focus group with parents/ grandparents of young children about reactions to
brochure/ audio tape with info about burns and scalds, Naomie R Henderson, Children's Nat.Medical Centre
1988 The epidemiology of childhood scalds in Brisbane, W Phillips, E Mahiras, D Hunt, S P Pegg,Burns 1986 printed in Great Britain
1987 Hazards of microwave ovens , V Siu, M Kissoon/Paediatric Emergency Care Vol 31987 Paediatric Burns, J Stewart, J Kenny and R Morgan Virginia Medical Centre1987 Prevention of Tap Water Scald Burns Evaluation of a Multi-Media Injury Control Programme,
M Katcher/AJPH September 1987 Vol 77
159
1997 Residential Fires in Mattresses and Bedding, M A Boudreault, L E Smith/ Hazard AnalysisDivision Directorate for Epidemiology and Health Sciences
1997 Sparklers as a major hazard for burn injury, S Singh, Royal Victoria Hospital BU1997 Tapwater Scalds in Residential Bathrooms:The Size of the Problem in NSW, Injury Prevention
Unit NSW Health 1997 The Feasibility of Lowering Water Heater Temperature as a Means of Reducing Scald Hazards,
Arthur D Little Inc, US CSC1997 Victorian Scalds Prevention Campaign 'Hot Water Burns like Fire', Kidsafe Report1996 Burn Incidence and Medical Care Use in the United States: Estimates, Trends and Data
Sources, P Brigham, E McLoughlin/Journal of Burn Care and Rehabilitation March/April 19961996 Common Products that cause Uncommonly Severe Burn Injuries, B Harwood/ NFPA Journal
Feb-March 19961996 Common Products that cause Uncommonly Severe Burn Injuries, Beatrice Harwood/NFPA
Journal January/February 1996 Domestic central heating radiators: a cause for concern in all age groups, R D Harper, W A
Dickson Elsevier Science Ltd Burns Vol. 22.1996 Home Radiator Burns Amongst Inner-City Children, K Quinlan Dept of Paediatrics University
of Chicago /MMWR1996 Injury Control in Practice Home Radiator Burns in Inner City Children, K Quinlan/ARCH
PEDIATR ADOLESC Med vol 150 Sept 19961996 Family Safety Check, National Safekids Campaign, USA1996 Journal of Paediatric Surgery, S Morrow, D L Smith, B C Cairns, D K Nakayama and H D
Peterson/Journal of Paediatric Surgery March 19961996 Kerosene Heater-related injuries in children, Selbst, Henretig, Baker/Paediatric Emergency Care1996 Pause with Children, The Ohio State University, Safety Plays1996 Play it safe, Health Education Board Scotland1996 Surveillance and Prevention of Residential – Fire injuries, S Mallonee, G Istre, M Rosenberg,
New England Journal of Medicine July Vol 335 1996 Taking Injury Prevention Forward, Victorian Injury Prevention committee1996 Video Play it Safe campaign TV advertisement, Health Education Board Scotland1995 'If Only' Burns and Scalds, Lynne Brodie, Kidsafe magazine1995 Can you tell me why? Treatment guide, The City Hospital Nottingham1995 Hot Water Burns in Cape Town, D Hudson & F Duminy Burns Vol 211995 Harstad Injury Prevention Study: prevention of burns in small children by a community-based
intervention. , B Ytterstad and A Søogaard, Burns Vol 211995 TIPP Injury Prevention Programme, American Academy of Paediatrics, USA1995 Toasters on test, November issue of Which?1995 Working Party on Burn and Scald Accidents to Children, R H Jackson and C Whittington Child
Prevention Trust December1994 Electric iron contact burns in an Australian paediatric population, M A Hollyoak, M J Muller, S
P Pegg - Paediatric & Perinatal Epidemiology July 19941994 Promotional Hot Water Temperature Cards, Carl Erle, NSW Health Department1994 Public Health Policy Statement of the Safety of 50ºC Temperature Hot Water Delivery in
Domestic Settings, G Rubin, Chief Health Officer NSW Department of Health 1994 Taking Injury Prevention Forward, Strategic Directions for Victoria1994 Turn Down the Heat Hot water burns like fire, Penny Galloway, The Australian Standard1993 An Evaluation of a program to reduce home hot tap water temperatures, A Walker, J Clarke and
J Langley, Australian Journal of Public Health Vol: 171993 Comparison of Childhood Burns Associated with use of Microwave ovens and Conventional
Stoves, E Powell, R Tanz /Paediatrics Vol 91 February 19931993 Cooler designs for built-in ovens, September issue of Which?1993 Evaluation Guidebook for Community Youth Safety Programs, P Lantz, B Lee, S Gallagher and
N Young, MCHB October
158
1986 A survey of thermal injuries to children in Australia, P G Gordon, G C Ramsay/ AustralianFamily Physician Vol 15 Sept 1986
1986 Accidents to the Elderly, Consumer Safety Research, DTI1986 Kitchen Equipment, Safety Research Section, CSU DTI1986 Accidents in the home involving LPG, Consumer Safety Research, DTI1985 Burn and Scald accidents to children, Child Accident Prevention Trust1985 Injuries from Fireworks, L Berger, S Kalishman and F Rivara, Paediatrics Vol 751984 Childhood Burns Reconsidered: The child, the Family and the Burn Injury, S Libber, D J
Stayton/ The Journal of Trauma Vol 241983 Scald Burns, J Thacker, J Kenney, J Stafford, G Rodenheaver, R Edlich Current Concepts in
Trauma Care1982 Burns, Consumer Safety Research, DTI1982 Analysis of accidents located in the bathroom, Consumer Safety Research, DTI1982 Childhood Scald Burns, P Lewis, M Zuker Hospital for sick children Toronto1982 Project Burn Prevention: Outcome and Implications, E McLoughlin, C J Vince, A M Lees, J
Crawford/AJPH March 19821982 The Incidence and Severity of Burn Injuries Following Project Burn Prevention, A MacKay, K
Rothman/AJPH March 1982 Vol 721981 Hot tap water scalds in Canadian Children, R Stanwick, M Moffatt, H Loeser, Ronald Zuker
CMA Journal1981 Scalds to pre-school children, J Langley, J Dodge and P Silva New Zealand Medical Journal1980 Preventing Tap Water Burns, M Baptiste, Gerald Feck/AJPH July 1980 Vol 70
Childhood accidents involving the electric jug – options for prevention, J Langley and Phil SilvaBurns Vol 7
160
Research commissioned by
Consumer Affairs Directorate, DTI.
Department of Trade and Industry
1 Victoria Street
London
SW1H 0ET
June 1999
SAMBROOK RESEARCH INTERNATIONAL
30 STATION ROAD,
NEWPORT
SHROPSHIRE
TF10 7EN
TEL: 01952 825444
FAX: 01952 825425
URN 98/757