Embed Size (px)
Citation preview
Ferreira et al. BMC Fam Pract (2021) 22:81 https://doi.org/10.1186/s12875-021-01425-9
RESEARCH ARTICLE
Burnout and health status differences among primary healthcare professionals in PortugalPedro L. Ferreira1,2, Vitor Raposo1,2, Aida Isabel Tavares1,3* and Ana Pinto1,4
Abstract
Background: This paper is focused on two indicators which may be considered as proxies of individuals’ well-being: self-assessed health and burnout intensity. There is little research relating these concepts with the type of the primary healthcare setting, its urbanization density and the region. The aims of this work are threefold: (i) to find determi-nant factors of individual health status and burnout, (ii) to find possible differences across different types of health care units, differently urbanized areas, and different administrative regions, and (iii) to verify if there are differences in between GPs and nurses.
Methods: Data was gathered from an online questionnaire implemented on primary health care. A sample of 9,094 professionals from all 1,212 primary health care settings in Portugal mainland was obtained from an online ques-tionnaire filled from January and April 2018. Statistical analyses include the estimation of two ordered probits, one explaining self-assessed health and the other the burnout.
Results: The individual drivers for good health and lower levels of burnout, that is, better well-being, are estimated for GPs and nurses. Main findings support that, first, nurses report worst health than GPs, but the latter tend to suffer higher levels of burnout, and also that, ’place’ effects arising from the health unit settings and regional location are more significant in GPs than in nurses. However, urbanization density is not significantly associated with health or burnout.
Conclusions: A set of policy recommendations are suggested to improve the healthcare workforce well-being, such as improving job satisfaction and income. These policies should be taken at the health care unit level and at the regional administrative level.
Keywords: Self-assessed health, Burnout, Well-being, Primary care, Portugal
© The Author(s) 2021. Open Access This article is licensed under a Creative Commons Attribution 4.0 International License, which permits use, sharing, adaptation, distribution and reproduction in any medium or format, as long as you give appropriate credit to the original author(s) and the source, provide a link to the Creative Commons licence, and indicate if changes were made. The images or other third party material in this article are included in the article’s Creative Commons licence, unless indicated otherwise in a credit line to the material. If material is not included in the article’s Creative Commons licence and your intended use is not permitted by statutory regulation or exceeds the permitted use, you will need to obtain permission directly from the copyright holder. To view a copy of this licence, visit http:// creat iveco mmons. org/ licen ses/ by/4. 0/. The Creative Commons Public Domain Dedication waiver (http:// creat iveco mmons. org/ publi cdoma in/ zero/1. 0/) applies to the data made available in this article, unless otherwise stated in a credit line to the data.
BackgroundNaturally, the major goal of any health system is to improve people’s health [1]. To achieve this goal, the sys-tem should rely on a health care workforce to sustain its functioning. A motivated, productive, caring, and efficient workforce ensures that health care services are delivered
in the most appropriate way to people, considering their needs and expectations [2]. In this way well-being is con-sidered a key element to ensure that healthcare organi-zations meet the major health systems goals, e.g. health, responsiveness and protection for social and financial problems. Healthcare professionals show consistently across different countries high rates of sickness absence, burnout, and distress compared to other sectors [3].
There is evidence that physicians and nurses experienc-ing burnout are more likely to make poor decisions and
Open Access
*Correspondence: [email protected] CEISUC - Centre for Health Studies and Research, University of Coimbra, Coimbra, PortugalFull list of author information is available at the end of the article
Page 2 of 17Ferreira et al. BMC Fam Pract (2021) 22:81
mistakes, to display less empathic or even hostile atti-tudes towards patients and among colleagues. Healthcare professionals suffering from burnout are more willing to change jobs, report job dissatisfaction, and provide low quality care [4–8]. So there is an increasing concern to improve the wellbeing, the mental and the physical health, of health professionals [3, 9].
In our analysis, we focused our attention on two indi-cators, namely, self-assessed health and burnout which may be considered as proxies for individuals’ well-being. We take well-being as an umbrella and wide concept that accounts for good physical and mental health and lower burnout intensity. These two indicators cause opposite feelings in a person’s well-being, by using the rationale that a good health contributes to a pleasant feeling, while burnout causes an unpleasant effect [10] (APA, 2020). In this way, a good perception of self-health is associated with a good level of well-being [11–13], while a high level of burnout is associated with a low level of well-being [14–16].
Well-being is a state of good health, happiness, ful-filment and positive perception of one’s life [17]. It is also considered as a multidimensional construct [18], accounting for several dimensions including mental, social, physical and spiritual well-being [19].
Burnout, on its turn, is a psychological, emotional and mental feeling of fatigue, exhaustion, helplessness and prostration. It has been defined in the 11th Revision of the International Classification of Diseases (ICD-11) [20] as an occupational syndrome and not a medical condi-tion. Feelings of low energy, exhaustion and fatigue are part of specific domains or spheres in the person’s life, including personal, work-related burnout, and client-related burnout [21].
The set of factors determining burnout is similar to the one that determines health [22, 23], including individual socioeconomic factors such as age, gender, education, marital status, and professional status. Concerning the determinants of burnout, the importance of occupational and organizational factors should also be stressed [24], as well as the factors related to job and career satisfaction [25, 26]. Empirical evidence reveals that lower levels of job and career satisfaction correlate with higher levels of burnout.
The ’place’ where individuals work also influences health and burnout. On the one hand, regarding the relationship between ‘place’ and health, it is known that regional factors and urban density affect individ-ual’s health and interact with individual and socioeco-nomic factors [27–33]. On the other hand, less is known about the correlation between the urbanization density and region where individuals work and their burnout intensity.
Some studies show that physicians in urban hospitals tend to suffer more from burnout than those in smaller rural hospitals [34], and physicians in rural areas tend to report good job satisfaction due to low emotional exhaus-tion [35]. However, some authors [8] suggested that phy-sicians and nurses in rural areas could suffer from higher levels of burnout, while others [36] did not find differ-ences of burnout between rural and urban nursing units.
Empirical evidence reached different findings concern-ing the levels of burnout among physicians and nurses. Some studies place higher burnout on physicians [37], others on nurses [38], and others find no significant dif-ference [39]. Professionals working in primary healthcare are more likely to suffer higher burnout than those work-ing in a hospital [38], and prevalence of burnout among GPs is very high [25, 40], but burnout affecting physicians seems also to vary according to their specialty [41].
Little research exists in primary healthcare relating health status and burnout of health professionals with the type of setting where the care is provided, which includes the type of health unit, the urbanization and the region of location.
This work aims to contribute to this research field. Its purposes are of threefold. First, to estimate the determi-nant factors of individual well-being, measured by self-assessed health and by burnout level. Second, to find possible differences of well-being across different types of health care units, differently urbanized areas, and various administrative regions. In other words, this work aims to identify effects related to health care unit, urbani-zation and region on the well-being of GPs and nurses. And, finally, to verify if there are differences in health and burnout between GPs and nurses.
Short description of the primary healthcare system in PortugalIn Portugal, the primary healthcare system has a relevant role in the overall health system as it works as a gate-keeper for hospital care. An international comparison of the importance of primary health care in Europe was pre-sented by Kringos et al. [42]. They showed that Portugal as Belgium, Denmark, Finland, Spain and UK have a rela-tively strong primary care.
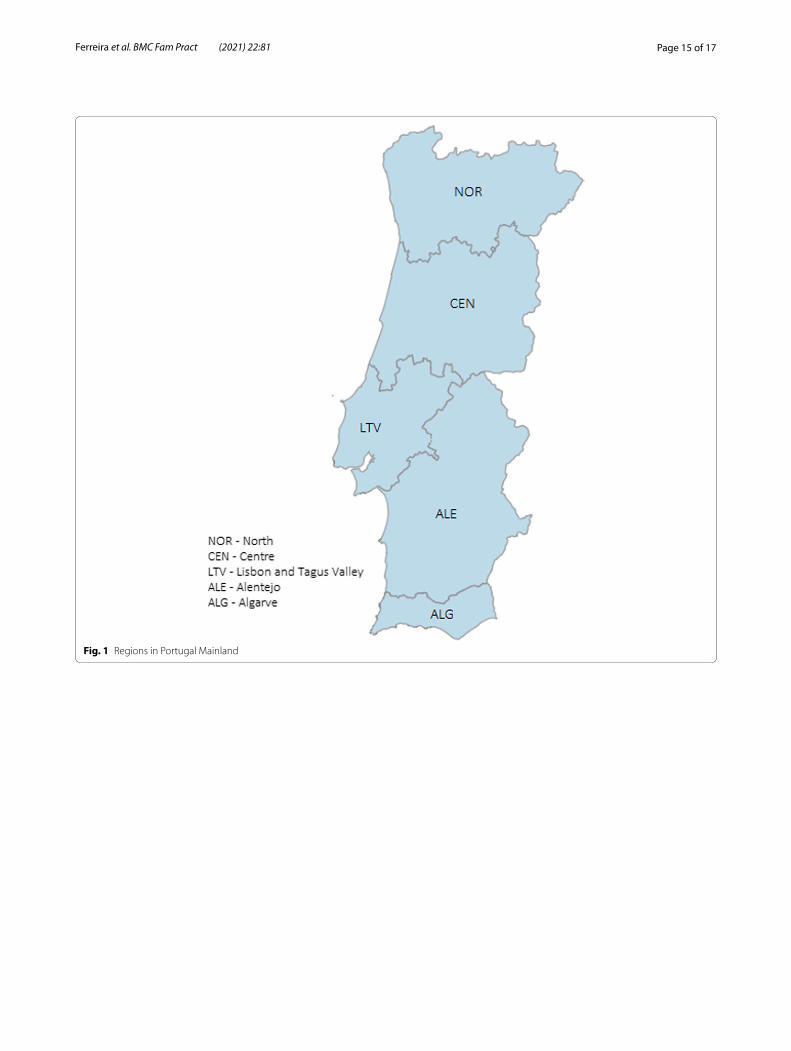
Portugal mainland comprises five Regional Health Authorities: North (NOR), Central (CEN), Lisbon and Tagus Valley (LTV), Alentejo (ALE), and Algarve (ALG) (as shown in Figure 1 in Appendix). Each of these Regional Health Authorities is responsible for running several Groups of Primary Care Centers, which in turn include several primary health care units [43, 44].
These primary health care units may have differ-ent organization formats. In our work, we identify the
Page 3 of 17Ferreira et al. BMC Fam Pract (2021) 22:81
so-called family health units (USF) and the traditional primary health care units (UCSP). The former can be classified in models A and B, based on the way they are organized and on the type of incentives paid to profes-sionals. USF units have some level of autonomy and par-ticipative management. Professionals in USF-B receive a monetary incentive for performance, in particular, GPs, whereas in USF-A payments are only salaries.
On the other hand, UCSP have well established verti-cal hierarchies and very low level of autonomy. Other pri-mary health care units include USP (public health unit), UCC (continued care unit), and URAP (shared assistance resources unit) [44, 45].
It is noteworthy that the access by users to primary healthcare services may be different across regions. These differences have been described in a previous work by Ferreira et al. [46]. For instance, in Lisbon and Tagus Valley region is more likely to find people who are not enrolled in a GP which makes access to medical appoint-ments very difficult.
MethodsStudy design and samplingData was gathered from an online questionnaire to health professionals, which includes GP, nurses, tech-nicians and other health care professionals. The survey was applied to all 19,563 healthcare professionals in all 1,212 primary healthcare units in Portugal mainland, between January and April 2018. The questionnaire was answered in a private access e-platform (LimeSur-vey), using a password system to ensure anonym-ity, non-duplication and answers only from the target population.
The questionnaire was approved by the Portuguese Authority for Individual Data Protection. It included three main groups of questions: (i) sociodemographic and labour characteristics, (ii) job satisfaction, and (iii) burnout.
Sociodemographic data included gender, age, edu-cation level and family status. Labour characteristics encompassed professional category, regular working hours, experience in coordinating, managerial or leader-ship functions, and how long the professionals have been working in the unit and in the profession. The question-naire was designed to evaluate professionals’ satisfaction with their job and workplace.
Measurement of job satisfaction was based on the questionnaire ‘Hospital Employee Judgment Sys-tem’ [47] and developed and validated to the Portu-guese context by the Centre for Health Studies and Research of the University of Coimbra, Portugal [48]. The instrument measures the dimensions ’quality of the workplace’, ’quality of services provided’ and ’con-tinuous quality improvement’. An overall level of sat-isfaction regarding the unit where individuals work was computed by weighted average based on those dimensions.
Professionals’ burnout was measured by the Portuguese validated version of the Copenhagen Burnout Inventory (CBI) [21] that encompasses three scales of burnout: per-sonal, work-related, and patient-related [49, 50]. According to CBI authors, personal burnout measures professional’s perception of psychological fatigue and exhaustion. Work-related burnout refers to the extent to which a professional attaches his/her perception of physical and emotional fatigue and exhaustion to his/her work. And patient-related burnout measures how much s/he attributes his/her perceived feelings of physical and emotional fatigue and exhaustion to the work with patients. The overall burnout indicator is obtained by computing a simple aver-age between those three dimensions of burnout.
VariablesDependent variablesThe dependent variables used to capture professional well-being were self-assessed health (SAH) and burnout level, as summarized in Table 1. Self-assessed health was obtained from the question "how do you consider your health in general?" with the possible five answers, varying from ’excellent’ to ’very poor.
Independent variablesThe set of independent variables include socioeconomic variables, professional and labour variables, satisfaction indicator, geographic indicators and unit type. These var-iables are described in Table 2.
The existing strong correlation between age and profes-sional experience (r = 0.84) forced us to only use one of these variables, due to multicollinearity in a regression. We kept variable age as it is also a proxy for the years of profes-sional experience.
Table 1 Dependent variables description
Group Variable Description
Well-being burnout Overall burnout indicator is a continuous variable, ranging from 0 (no burnout) to 100 (complete exhaustion)
self-assessed health Level of self-assessed health in categories, ranging from 1 (very poor) to 5 (excellent)

Page 4 of 17Ferreira et al. BMC Fam Pract (2021) 22:81
Empirical ModelTwo equations were estimated, one for SAH and the other for burnout as follows:
where β and δ correspond to a vector of the estimated coefficients for the independent variables, εi and μi is the residual term, and i represents an individual.
The set of independent variables in SAH-model could have included the burnout indicator and the
SAH - model: SAHi = constant
+ � independent variablesi + εi,
Burnout - model ∶ Burnouti = constant
+ � independent variablesi + μi .
Burnout-model could also have included SAH variable [46, 51]. However, this modelling specification raises the problem of endogeneity, resulting in biased and inconsistent coefficient estimates.
This means that there are unobservable variables which are correlated with both dependent and independent variables, such as lifestyle, family and personal life, spir-ituality, and genetic characteristics. Another possibility to explain endogeneity is by reverse causality, when the dependent variable has a causal effect on the independ-ent variable, e.g. in the SAH-model, SAH may also deter-mine burnout level.
One way to overcome the endogeneity problem would be to use instrumental variables. However, the variables available in our questionnaire are very limited, and so the
Table 2 Independent variables description
Group Variable Description
Socio-economic male Dummy variable: 1 if male; 0 otherwise
age Number of years old
married Dummy variable: 1 if married or partnership; 0 otherwise
nb_children Number of children
education Years of completed level of education. It ranges from 4 years of primary school to 22 years of doctorate
income Family income sufficiency for family needs and personal training. Dummy variable: 1 if income is sufficient; 0 otherwise
Professional and labour GP Dummy variable: 1 if GP; 0 otherwise
nurse Dummy variable: 1 if nurse; 0 otherwise
technician Dummy variable: 1 if health technician; 0 otherwiseReference category for professional category
experience Number of years of professional experience
tenure Dummy variable: 1 if permanent and tenure contract; 0 otherwise
Job Satisfaction Overall job satisfaction (OJS) Level of overall professional satisfaction, ranging from 0 (completely unsatisfied) to 1 (com-pletely satisfied)
Geographic urban Dummy variable: 1 if geographical area with more than 5,000 inhabitants and a population density higher than 500 inhabitants per Km2; 0 otherwise
rural Dummy variable: 1 if area with less than 2,000 inhabitants and a population density lower than 100 inhabitants per Km2; 0 otherwise
moderately urban It is defined in-between urban and rural areas defined above. Reference category for urbaniza-tion density
NOR Dummy variable: 1 if Northern region; 0 otherwiseSee picture Table 6 in Appendix
CEN Dummy variable: 1 if Central region; 0 otherwiseSee picture Table 6 in Appendix
ALE Dummy variable: 1 if Alentejo; 0 otherwiseSee picture Table 6 in Appendix
ALG Dummy variable: 1 if Algarve; 0 otherwiseSee picture Table 6 in Appendix
LTV Lisbon and Tagus Valley regionReference category for health administrative region
Unit type USF-A Dummy variable: 1 if USF without performance-based incentives; 0 otherwise
USF-B Dummy variable: 1 if USF with performance-based incentives; 0 otherwise
USCP Dummy variable: 1 if UCSP, former primary health care unit; 0 otherwise
other units Other types of primary health care units, e.g. UCC, USP and URAP. Reference category for unit type
Page 5 of 17Ferreira et al. BMC Fam Pract (2021) 22:81
use of instrumental variables is not an analytical option. Another possible alternative was to estimate simultane-ous equations. However, burnout level and health sta-tus do not occur simultaneously. Also, the direction of the causality between health and burnout is not yet well established in the literature [49–51].
The main hypothesis to be tested by this research paper is whether professionals’ well-being, measured by SAH and burnout, is influenced by ’place’, which includes the type of healthcare unit, level of urbaniza-tion and administrative region. Since it was not our pur-pose to establish a causal relationship between health and burnout, and the estimated models are not trivial (both models are expressed in different forms of regres-sion), we estimated two single equations for each well-being variable, one for SAH and another for burnout.
Quantitative analysisWe began by presenting some descriptive statis-tics about the sample of primary healthcare profes-sionals. Next, we estimated the SAH-model and the Burnout-model. Based on the nature of the depend-ent variable, an ordered probit model was estimated for self-assessed health, and a tobit model was esti-mated for burnout level. Estimations were performed for all the primary healthcare professionals, and for GPs and nurses separately. These estimations were not worth reporting for the technicians because of the relatively small sample for these professionals and the consequent absence of statistical significance of most results.
The models were estimated for two specifications, a reduced and a full model. The ’reduced model’ included only independent variables related to ‘place’, that is, type of healthcare unit, urbanization density where the unit is located, and health administrative region. The ’full model’ considered all independent variables described above and the potential relation between SAH and burnout levels for the set of all professionals. For this purpose, we have included the burnout indica-tor in SAH-model and the SAH variable in the Burnout-model. These estimations, as explained above, may be subject to endogeneity, so they may be taken here as a sensitivity analysis. The results are presented in the Appendix.
All estimations were done using the econometric soft-ware package STATA 15.
ResultsFrom the 19,486 existing primary healthcare pro-fessionals, 9,094 answered our questionnaire, cor-responding to a 46.7% response rate. Splitting by professionals, we obtained the following response rates:
37.2% for physicians, 48.3% for nurses, and 52.6% of technicians.
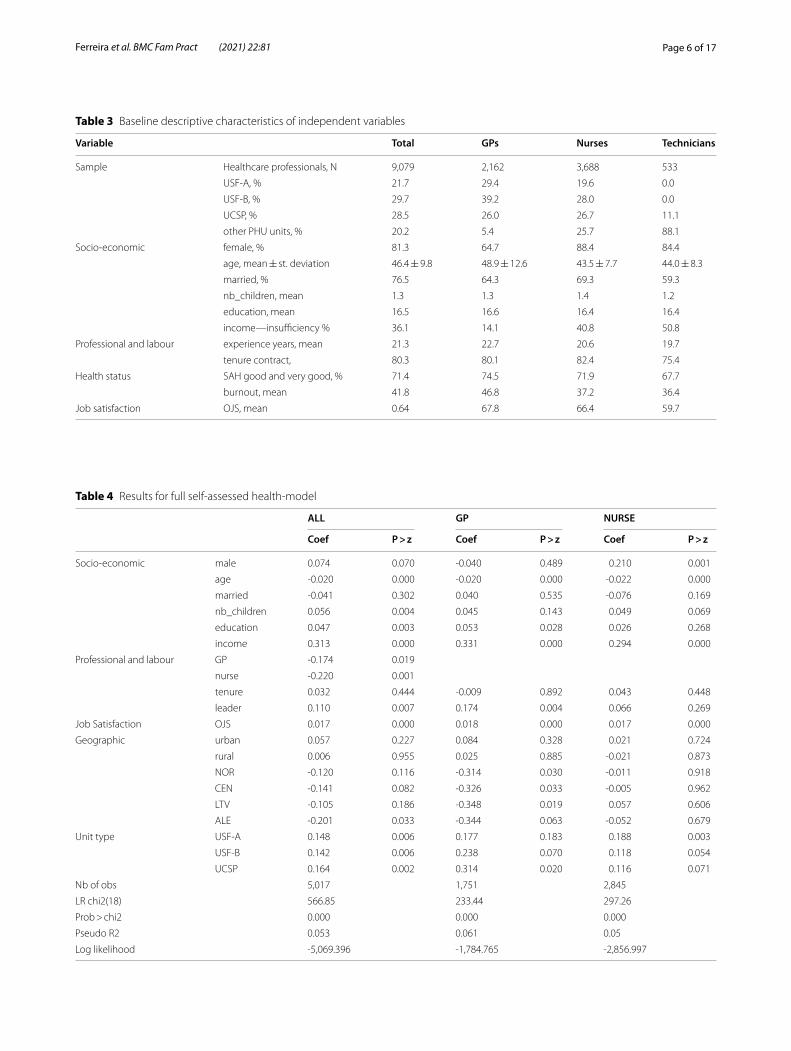
Descriptive statisticsThe descriptive statistics concerning independent vari-ables are displayed in Table 3.
The average number of completed years of education is 16.5, and so it may be said that on average profes-sionals have college education, as it would be expected. We also evidenced that burnout indicator was normally distributed.
The correlation between burnout indicator and SAH was not high, equal to -0.395, corresponding to about 16% of explanation.
The values of the burnout indicator were, on average, different between GPs and nurses. While nurses reported an overall burnout equal to 37.2, GPs reported a higher value equal to 46.8. On the other hand, nurses reported more often lower levels of health (SAH) than GPs. For instance, 28.1% of nurses reported self-assessed health between very poor and reasonable levels, while 25.5% of GPs reported the same levels. It is worth to highlight that the average age of nurses was 43.5 and of GPs was 48.9 years old. Besides only 11% of nurses and 35% of GPs were men.
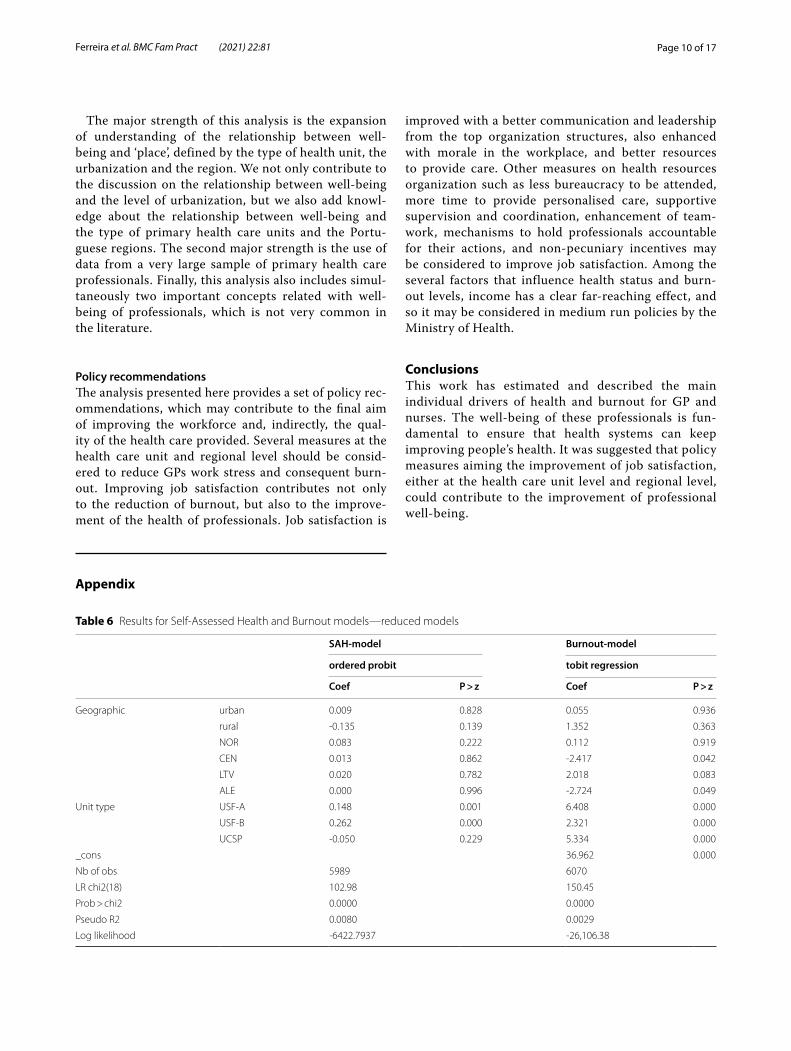
Reduced modelThe results obtained in the reduced model are presented in Tables 6 (in the Appendix). At first glance, these results showed that burnout is a phenomenon emerging both at unit (both types of USF) and regional levels (especially in Central and Alentejo regions), while good (or poor) health tends to be locally observed at unit type. The level of urbanization seems not to have a relationship neither with health nor with burnout.
Full modelSelf‑assessed health resultsThe results obtained for the self-assessed health full model are shown in Table 4.
In general, and considering all health care profession-als, SAH showed similar scores in all units. However, it was slightly higher in UCSP than in other units. Also, there were no significant differences across the vari-ous types of urbanization areas. Alentejo region had a significantly lower level of reported health status than Algarve. On the other hand, nurses reported somewhat lower levels of health than GPs and technicians tended to report better health status.
Also, individual characteristics provided predictors of SAH. Those who were leader, higher educated, with children, reporting sufficient income for family needs or reporting job satisfaction were more likely to report
Page 6 of 17Ferreira et al. BMC Fam Pract (2021) 22:81
Table 3 Baseline descriptive characteristics of independent variables
Variable Total GPs Nurses Technicians
Sample Healthcare professionals, N 9,079 2,162 3,688 533
USF-A, % 21.7 29.4 19.6 0.0
USF-B, % 29.7 39.2 28.0 0.0
UCSP, % 28.5 26.0 26.7 11.1
other PHU units, % 20.2 5.4 25.7 88.1
Socio-economic female, % 81.3 64.7 88.4 84.4
age, mean ± st. deviation 46.4 ± 9.8 48.9 ± 12.6 43.5 ± 7.7 44.0 ± 8.3
married, % 76.5 64.3 69.3 59.3
nb_children, mean 1.3 1.3 1.4 1.2
education, mean 16.5 16.6 16.4 16.4
income—insufficiency % 36.1 14.1 40.8 50.8
Professional and labour experience years, mean 21.3 22.7 20.6 19.7
tenure contract, 80.3 80.1 82.4 75.4
Health status SAH good and very good, % 71.4 74.5 71.9 67.7
burnout, mean 41.8 46.8 37.2 36.4
Job satisfaction OJS, mean 0.64 67.8 66.4 59.7
Table 4 Results for full self-assessed health-model
ALL GP NURSE
Coef P > z Coef P > z Coef P > z
Socio-economic male 0.074 0.070 -0.040 0.489 0.210 0.001
age -0.020 0.000 -0.020 0.000 -0.022 0.000
married -0.041 0.302 0.040 0.535 -0.076 0.169
nb_children 0.056 0.004 0.045 0.143 0.049 0.069
education 0.047 0.003 0.053 0.028 0.026 0.268
income 0.313 0.000 0.331 0.000 0.294 0.000
Professional and labour GP -0.174 0.019
nurse -0.220 0.001
tenure 0.032 0.444 -0.009 0.892 0.043 0.448
leader 0.110 0.007 0.174 0.004 0.066 0.269
Job Satisfaction OJS 0.017 0.000 0.018 0.000 0.017 0.000
Geographic urban 0.057 0.227 0.084 0.328 0.021 0.724
rural 0.006 0.955 0.025 0.885 -0.021 0.873
NOR -0.120 0.116 -0.314 0.030 -0.011 0.918
CEN -0.141 0.082 -0.326 0.033 -0.005 0.962
LTV -0.105 0.186 -0.348 0.019 0.057 0.606
ALE -0.201 0.033 -0.344 0.063 -0.052 0.679
Unit type USF-A 0.148 0.006 0.177 0.183 0.188 0.003
USF-B 0.142 0.006 0.238 0.070 0.118 0.054
UCSP 0.164 0.002 0.314 0.020 0.116 0.071
Nb of obs 5,017 1,751 2,845
LR chi2(18) 566.85 233.44 297.26
Prob > chi2 0.000 0.000 0.000
Pseudo R2 0.053 0.061 0.05
Log likelihood -5,069.396 -1,784.765 -2,856.997
Page 7 of 17Ferreira et al. BMC Fam Pract (2021) 22:81
higher levels of health, while older people tended to report lower levels of SAH.
On the other hand, when comparing GPs and nurses, results showed that SAH was reported differently according to the type of healthcare unit organization. GPs in UCSP reported higher health status than those in other units, and nurses in USF-A reported bet-ter health than those in other units. Despite the small differences of health across regions, GPs in Algarve reported higher scores while in LVT and Central reported lower health condition. There was no signifi-cant regional difference for SAH reported by nurses.
There were common determinants of SAH between GPs and nurses. Younger individuals, with a higher level of professional satisfaction and considering their income as sufficient to their needs, tended to assess better scores to their health.
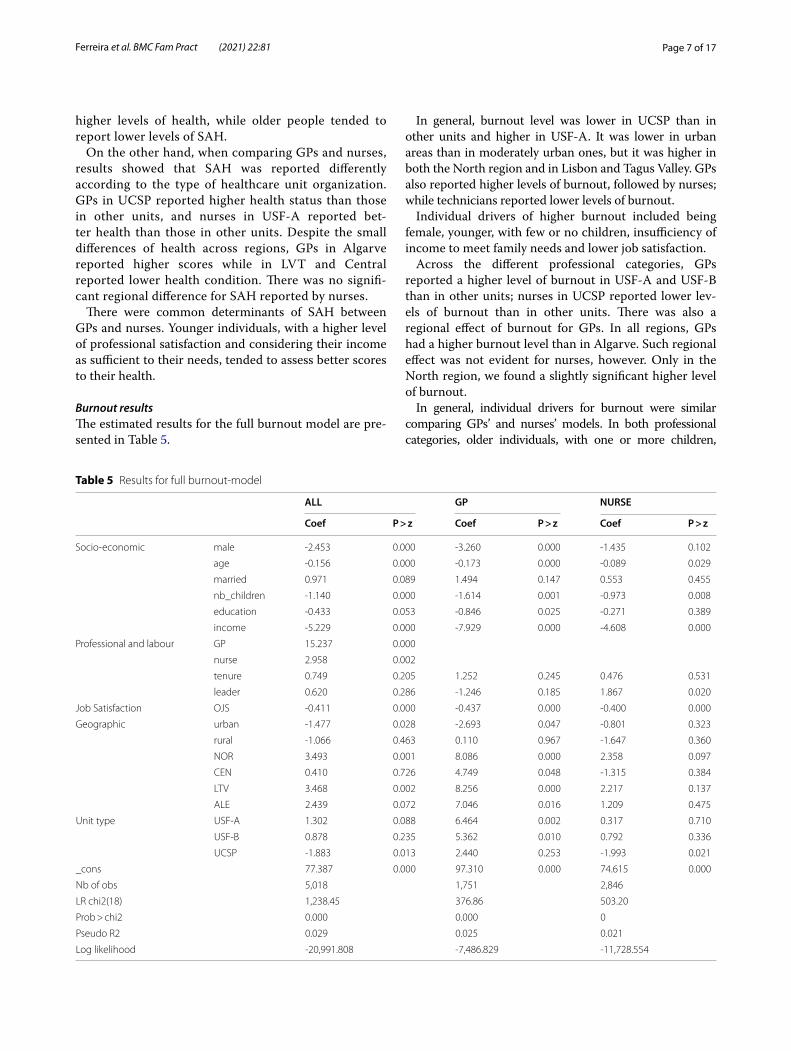
Burnout resultsThe estimated results for the full burnout model are pre-sented in Table 5.
In general, burnout level was lower in UCSP than in other units and higher in USF-A. It was lower in urban areas than in moderately urban ones, but it was higher in both the North region and in Lisbon and Tagus Valley. GPs also reported higher levels of burnout, followed by nurses; while technicians reported lower levels of burnout.
Individual drivers of higher burnout included being female, younger, with few or no children, insufficiency of income to meet family needs and lower job satisfaction.
Across the different professional categories, GPs reported a higher level of burnout in USF-A and USF-B than in other units; nurses in UCSP reported lower lev-els of burnout than in other units. There was also a regional effect of burnout for GPs. In all regions, GPs had a higher burnout level than in Algarve. Such regional effect was not evident for nurses, however. Only in the North region, we found a slightly significant higher level of burnout.
In general, individual drivers for burnout were similar comparing GPs’ and nurses’ models. In both professional categories, older individuals, with one or more children,
Table 5 Results for full burnout-model
ALL GP NURSE
Coef P > z Coef P > z Coef P > z
Socio-economic male -2.453 0.000 -3.260 0.000 -1.435 0.102
age -0.156 0.000 -0.173 0.000 -0.089 0.029
married 0.971 0.089 1.494 0.147 0.553 0.455
nb_children -1.140 0.000 -1.614 0.001 -0.973 0.008
education -0.433 0.053 -0.846 0.025 -0.271 0.389
income -5.229 0.000 -7.929 0.000 -4.608 0.000
Professional and labour GP 15.237 0.000
nurse 2.958 0.002
tenure 0.749 0.205 1.252 0.245 0.476 0.531
leader 0.620 0.286 -1.246 0.185 1.867 0.020
Job Satisfaction OJS -0.411 0.000 -0.437 0.000 -0.400 0.000
Geographic urban -1.477 0.028 -2.693 0.047 -0.801 0.323
rural -1.066 0.463 0.110 0.967 -1.647 0.360
NOR 3.493 0.001 8.086 0.000 2.358 0.097
CEN 0.410 0.726 4.749 0.048 -1.315 0.384
LTV 3.468 0.002 8.256 0.000 2.217 0.137
ALE 2.439 0.072 7.046 0.016 1.209 0.475
Unit type USF-A 1.302 0.088 6.464 0.002 0.317 0.710
USF-B 0.878 0.235 5.362 0.010 0.792 0.336
UCSP -1.883 0.013 2.440 0.253 -1.993 0.021
_cons 77.387 0.000 97.310 0.000 74.615 0.000
Nb of obs 5,018 1,751 2,846
LR chi2(18) 1,238.45 376.86 503.20
Prob > chi2 0.000 0.000 0
Pseudo R2 0.029 0.025 0.021
Log likelihood -20,991.808 -7,486.829 -11,728.554
Page 8 of 17Ferreira et al. BMC Fam Pract (2021) 22:81
with sufficient income and job satisfaction, tended to present lower levels of burnout. The difference in burnout between GPs and nurses only lied on gender and leader effects. While being a male GP decreased the odds of suffering from a high level of burnout, being a leader nurse increased those odds.
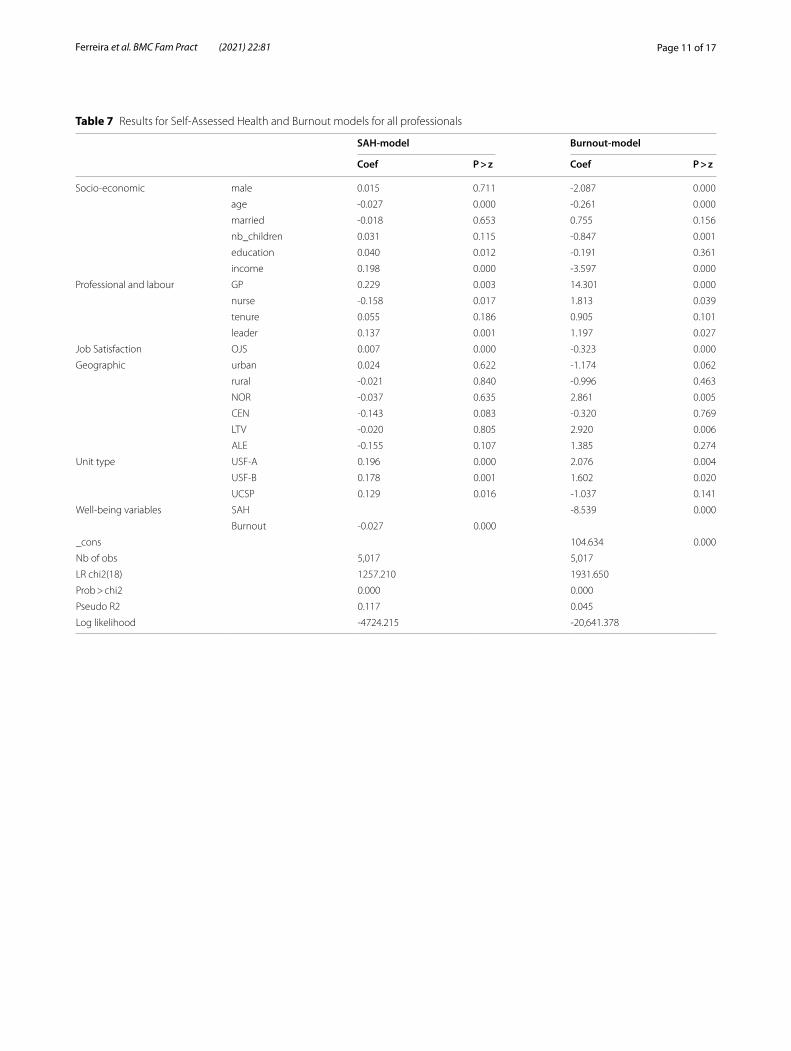
In Appendix, Table 7, presents the results for these models including both SAH and burnout indicators as simultaneous independent variables. Comparing the results across Tables 4, 5 and Table 7 in Appendix there are no significant differences worth to remark. Results, in general, show the same significance and sign for the esti-mated coefficient. The additional information obtained in Table 7 in Appendix is the inverse relationship between SAH and burnout levels, as expected.
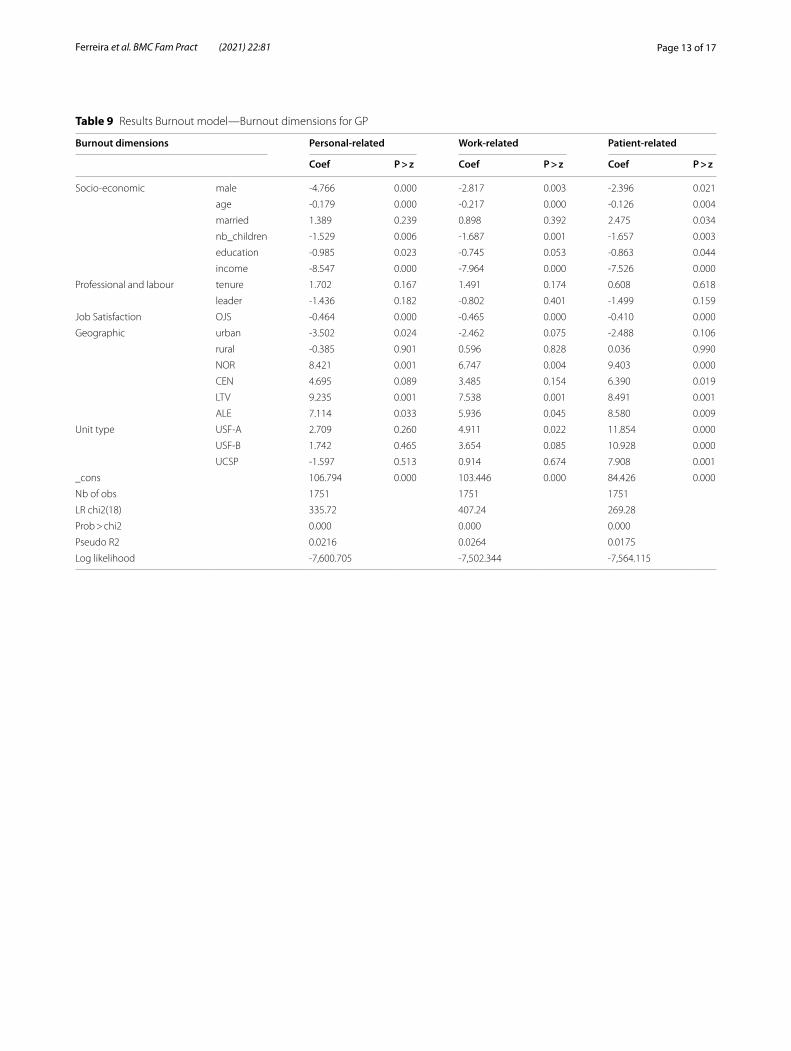
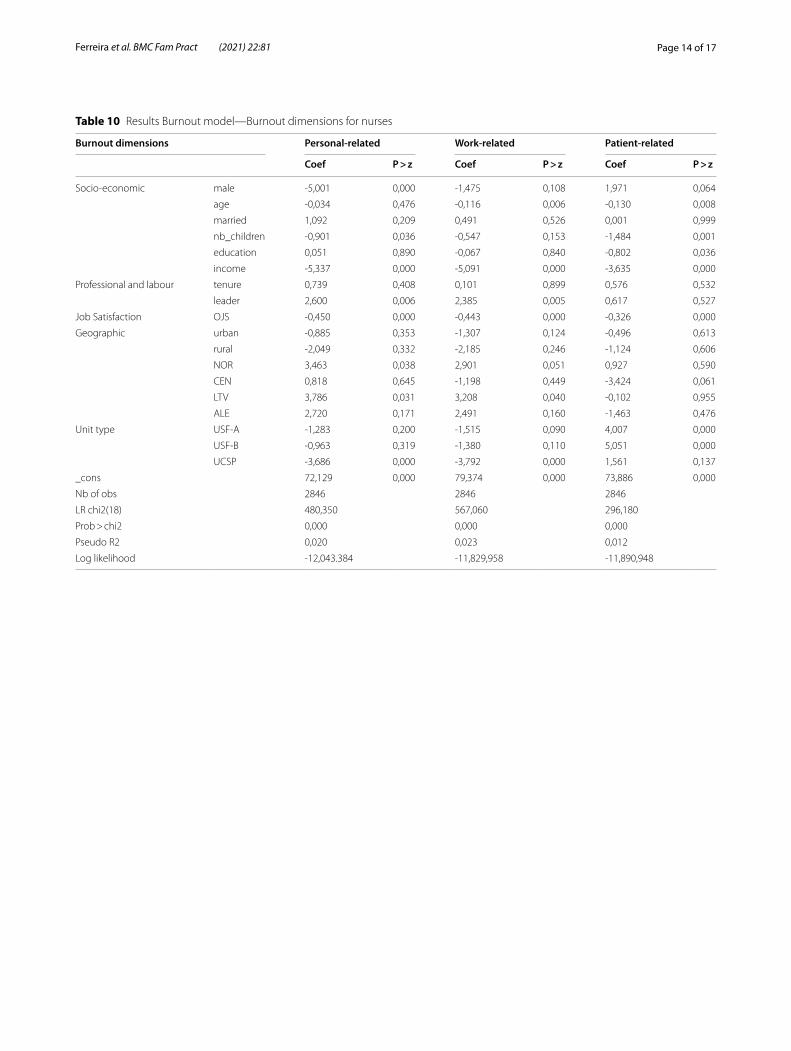
Also, in the Appendix, the results for the different dimensions of burnout are presented. Tables 8, 9 and 10 in Appendix display the results for the full model applied to the burnout dimensions: personal, work-related, and patient-related. These results are presented for all profes-sionals in the sample, and separately for GPs and nurses. A general first observation makes it clear that GPs had higher levels of burnout across health units and regions, but urbanization may mitigate these levels of burn-out. Burnout felt by nurses seems to be less sensitive to urbanization and regional effects.
DiscussionSummary of findingsThe well-being of professionals has fundamental impor-tance to guarantee that health systems can pursue their main goal of improving people’s health. The current anal-ysis aimed to determine individual drivers for well-being, measured by self-assessed health and by burnout, to verify whether there are ‘place’ determinants of well-being and whether there are differences between GPs and nurses.
The main results show that, firstly, nurses generally report slightly worse health than GPs, though suffering lower levels of burnout; secondly, ’place’ effects are more significant in GPs than in nurses.
Self‑assessed healthConcerning self-assessed health (SAH), we found that GPs tended to report higher health status in USF-B and in UCSP units; on the other hand, in Algarve we evi-denced higher scores. This region has pleasant climate and living conditions, which may contribute to a better reported SAH. Moreover, despite seasonal demographic fluctuations, these do not affect the demand for primary care of the national health service. The worst SAH was reported in Alentejo, where there is the highest suicide rate, and the lowest demographic density. These features may explain the no ’urbanization effect’. For nurses, in general, no significant ’place’ effects were found in SAH.
Burnout levelsConcerning burnout, results showed that GPs give higher scores in USF-A and USF-B. In addition, burnout lev-els were higher in all regions when compared to Algarve, and the most intense levels of burnout are found in North and Lisbon and Tagus Valley. These results did not sup-port previous evidence from Maroco et al. [39] who found that burnout syndrome among physicians was uniform across Portugal mainland regions. However, their sample [39] included physicians from different health care settings while our sample includes only primary healthcare physi-cians. Also, the burnout measurement scale was different. This may be a reason for the existing disparity of the results.
We also found that for GPs, ’urbanization effect’ tended to decrease burnout intensity. This is different from what was seen by Saijo et al. [34], but identical to Lavanchy et al. [35]. The majority of the cities in Portugal have a medium-small size and provide a set of services and social environment, which are useful for personal and family life without heavy levels of pollution, traffic or crime. In general, the quality of life in Portuguese cities is good and people rather live and/or work in urban areas than in rural ones or outskirts/semi-urban.
We found ’place effects’ for nurses in UCSP, where burnout levels tend to be low. Nurses in the Northern region suffer higher levels of burnout. This result is par-tially identical to the one found by the previous work [39] where it was identified higher burnout levels in the North and Centre of Portugal.
There was a tendency for nurses and GPs to suffer higher burnout in the Northern region and for GPs in Lisbon and Tagus Valley. This tendency may be related to the meas-ures and policies followed by Regional Health Authorities. Good governance and organization measures may lead to the development of work quality. Additionally, weak lead-ership traits, poor staff management, and resource inad-equacy of some of the Groups of Primary Care Centers do not boost work satisfaction. Therefore, these weak organi-zational and leadership attributes trigger burnout.
The case of GPs in Lisbon and Tagus Valley, where they tended to present higher levels of burnout, was also expected. In this region, the number of people not enrolled in a GP list is very large, due to the demographic pressure not timely addressed by the authorities, and by the consequent higher demand for consultations. Another fact that may explain this result comes from the tension arising from the lower levels of patient satisfac-tion in Lisbon and Tagus Valley [46], mainly caused by the difficult access to healthcare services [46].
Finally, in USF-B, GPs tended to report lower health status and higher levels of burnout, but this was not the case for nurses. One possible explanation for this result is related to the type of organization and contracting

Page 9 of 17Ferreira et al. BMC Fam Pract (2021) 22:81
mechanisms of these units, characterized by some level of autonomy, participative management and pay for performance incentives to GPs. It may be the case that the pressure from this type of organization is caus-ing chronic stress, anxiety, depression, and burnout feelings.
Individual drivers of well‑beingConcerning the individual drivers of well-being, our anal-ysis showed that there are common determinants of SAH and burnout level between GPs and nurses. In the case of SAH, we found that being older is correlated with lower levels of health, as expected from the conceptual model of health demand [52] while being professionally more satisfied and reporting sufficient income to face family needs contribute to better health status.
In the case of burnout, the common determinants of lower burnout intensity between GPs and nurses included being older, with children, with a sufficient household income, and being more satisfied with the job. Among the socioeconomic factors, age tended to have a signifi-cant relationship with burnout. As found in most studies, younger individuals tended to experience stronger symp-toms of burnout [25, 26, 38, 53]. Although this relation-ship may not be linear and so, higher levels of burnout in older ages may be found by other researchers [54].
Concerning the role of the sufficiency of the income for family needs, our findings suggest that higher income tended to be related with better health status and with lower burnout levels, both for GPs and nurses [26]. Sev-eral authors have identified a relationship between better payment or income earned and higher job satisfaction, which in turn decreases burnout level [54–56]. Despite this general view, Picquendar et al. [53] did not find such relation between payment and burnout syndrome and Linzer et al. [57] concluded that the relevant factor for physicians was rather the relationship with patients than the monetary compensation. The income variable used in our work, in fact, measures better the family well-being concern than the absolute value of income or the implicit relationship with job satisfaction. In a family-based soci-ety, our results are expected to be found.
Concerning job satisfaction, and as expected from pre-vious work [25, 26, 58–61], we found that higher levels of satisfaction were correlated with better health sta-tus and lower burnout. In fact, job satisfaction contrib-utes to the mitigation of the set of burnout dimensions, including lower emotional exhaustion and depersonaliza-tion. Simultaneously, job satisfaction is a consequence of good human resource policy (good leadership and com-munication), high levels of morale, good resources, as well as favourable attitudes towards the functioning and continuous quality improvement of the unit. These job
satisfaction features contribute to a sense of personal and professional accomplishment.
Differences between nurses and GPs and between gendersThe proportion of men and women in primary health care is unequal and the majority of professionals are women, about 90% of nurses and 65% of GPs. However, it can be noticed from other statistics [62–64] that the percentage of males in leader positions is higher that the percentage of males in the working place.
We found that nurses reported a slightly worst health than GPs, but these tended to suffer from higher levels of burnout, unlikely previous findings [38]. Male gender was correlated with better health, among nurses, and lower burnout intensity, among GPs. So, being male seems to be protective of lower health and from higher burnout. Our result is not coincident to the one discussed before [25], where it was stated that in Southern European countries, male GPs tended to have a higher level of burnout. The existing ratio between nurses and physicians may explain our finding. On the other hand, as the share of male lead-ers (about 23.8% of the sample) is larger than the share of males in workplace (about 19% of the sample) there is some male style of leadership which favours the smaller share of males in the workplace. This may be observed in the assessment professionals do about the human resources policy and the coordination of the health in the sample unit [46, 63]. On average, males tend to be more satisfied with these specific aspects of the workplace than females. These differences may contribute to the differ-ences found between genders. Finally, concerning self-assessed health, women tend to report worst health than men. But under the control of risk factors and socioeco-nomic factors, men and women may have identical health. In fact, this comparison may not be so clear [65, 66].
Study limitations and strengthsWell-being is measured by self-reported variables, which may yield to a self-reported bias [63]. However, due to the very large sample used, there is a trade-off between positive and negative biases, which may result in a strong mitigation of this bias.
Another limitation of our work is the possible bias of respondents’ decision not to fill the questionnaires. However, 46.4% response rate yields a large sample size of 9,094 professionals, a significant sample of all pri-mary healthcare professionals of mainland Portugal. On the other hand, analysing the sociodemographic characteristics we confirmed that the obtained sample is representative of the workforce employed in the pri-mary health care in mainland Portugal. Therefore, we tend to minimize this possible constraint.
Page 10 of 17Ferreira et al. BMC Fam Pract (2021) 22:81
The major strength of this analysis is the expansion of understanding of the relationship between well-being and ‘place’, defined by the type of health unit, the urbanization and the region. We not only contribute to the discussion on the relationship between well-being and the level of urbanization, but we also add knowl-edge about the relationship between well-being and the type of primary health care units and the Portu-guese regions. The second major strength is the use of data from a very large sample of primary health care professionals. Finally, this analysis also includes simul-taneously two important concepts related with well-being of professionals, which is not very common in the literature.
Policy recommendationsThe analysis presented here provides a set of policy rec-ommendations, which may contribute to the final aim of improving the workforce and, indirectly, the qual-ity of the health care provided. Several measures at the health care unit and regional level should be consid-ered to reduce GPs work stress and consequent burn-out. Improving job satisfaction contributes not only to the reduction of burnout, but also to the improve-ment of the health of professionals. Job satisfaction is
improved with a better communication and leadership from the top organization structures, also enhanced with morale in the workplace, and better resources to provide care. Other measures on health resources organization such as less bureaucracy to be attended, more time to provide personalised care, supportive supervision and coordination, enhancement of team-work, mechanisms to hold professionals accountable for their actions, and non-pecuniary incentives may be considered to improve job satisfaction. Among the several factors that influence health status and burn-out levels, income has a clear far-reaching effect, and so it may be considered in medium run policies by the Ministry of Health.
ConclusionsThis work has estimated and described the main individual drivers of health and burnout for GP and nurses. The well-being of these professionals is fun-damental to ensure that health systems can keep improving people’s health. It was suggested that policy measures aiming the improvement of job satisfaction, either at the health care unit level and regional level, could contribute to the improvement of professional well-being.
Table 6 Results for Self-Assessed Health and Burnout models—reduced models
SAH‑model Burnout‑model
ordered probit tobit regression
Coef P > z Coef P > z
Geographic urban 0.009 0.828 0.055 0.936
rural -0.135 0.139 1.352 0.363
NOR 0.083 0.222 0.112 0.919
CEN 0.013 0.862 -2.417 0.042
LTV 0.020 0.782 2.018 0.083
ALE 0.000 0.996 -2.724 0.049
Unit type USF-A 0.148 0.001 6.408 0.000
USF-B 0.262 0.000 2.321 0.000
UCSP -0.050 0.229 5.334 0.000
_cons 36.962 0.000
Nb of obs 5989 6070
LR chi2(18) 102.98 150.45
Prob > chi2 0.0000 0.0000
Pseudo R2 0.0080 0.0029
Log likelihood -6422.7937 -26,106.38
Appendix
Page 11 of 17Ferreira et al. BMC Fam Pract (2021) 22:81
Table 7 Results for Self-Assessed Health and Burnout models for all professionals
SAH‑model Burnout‑model
Coef P > z Coef P > z
Socio-economic male 0.015 0.711 -2.087 0.000
age -0.027 0.000 -0.261 0.000
married -0.018 0.653 0.755 0.156
nb_children 0.031 0.115 -0.847 0.001
education 0.040 0.012 -0.191 0.361
income 0.198 0.000 -3.597 0.000
Professional and labour GP 0.229 0.003 14.301 0.000
nurse -0.158 0.017 1.813 0.039
tenure 0.055 0.186 0.905 0.101
leader 0.137 0.001 1.197 0.027
Job Satisfaction OJS 0.007 0.000 -0.323 0.000
Geographic urban 0.024 0.622 -1.174 0.062
rural -0.021 0.840 -0.996 0.463
NOR -0.037 0.635 2.861 0.005
CEN -0.143 0.083 -0.320 0.769
LTV -0.020 0.805 2.920 0.006
ALE -0.155 0.107 1.385 0.274
Unit type USF-A 0.196 0.000 2.076 0.004
USF-B 0.178 0.001 1.602 0.020
UCSP 0.129 0.016 -1.037 0.141
Well-being variables SAH -8.539 0.000
Burnout -0.027 0.000
_cons 104.634 0.000
Nb of obs 5,017 5,017
LR chi2(18) 1257.210 1931.650
Prob > chi2 0.000 0.000
Pseudo R2 0.117 0.045
Log likelihood -4724.215 -20,641.378

Page 12 of 17Ferreira et al. BMC Fam Pract (2021) 22:81
Table 8 Results Burnout model—Burnout dimensions for all professionals
Burnout dimensions Personal‑related Work‑related Patient‑related
Coef P > z Coef P > z Coef P > z
Socio-economic male -4.916 0.000 -2.347 0.000 -0.245 0.725
age -0.135 0.000 -0.194 0.000 -0.148 0.000
married 1.212 0.068 0.647 0.273 1.118 0.099
nb_children -1.107 0.001 -0.976 0.001 -1.353 0.000
education -0.256 0.326 -0.261 0.261 -0.823 0.002
income -6.079 0.000 -5.622 0.000 -4.272 0.000
Professional and labour GP 14.693 0.000 14.466 0.000 17.321 0.000
nurse 2.766 0.011 3.208 0.001 3.258 0.004
tenure 1.041 0.130 0.661 0.281 0.530 0.450
leader 0.972 0.150 1.078 0.073 -0.176 0.799
Job Satisfaction OJS -0.456 0.000 -0.447 0.000 -0.352 0.000
Geographic urban -1.837 0.019 -1.705 0.015 -1.230 0.124
rural -1.597 0.345 -1.102 0.464 -0.760 0.660
NOR 4.686 0.000 3.679 0.001 2.311 0.077
CEN 2.298 0.092 0.352 0.771 -1.260 0.365
LTV 5.243 0.000 4.151 0.000 1.298 0.339
ALE 4.013 0.011 3.253 0.021 0.279 0.862
Unit type USF-A -0.741 0.404 -0.558 0.480 5.450 0.000
USF-B -1.133 0.188 -1.265 0.099 5.408 0.000
UCSP -4.178 0.000 -3.658 0.000 2.236 0.013
_cons 79.422 0.000 82.836 0.000 71.718 0.000
Nb of obs 5018 5018 5018
LR chi2(18) 1030.09 1210.69 1029.29
Prob > chi2 0.000 0.000 0.000
Pseudo R2 0.023 0.028 0.024
Log likelihood -21,457.36 -21,122.62 -21,226.267
Page 13 of 17Ferreira et al. BMC Fam Pract (2021) 22:81
Table 9 Results Burnout model—Burnout dimensions for GP
Burnout dimensions Personal‑related Work‑related Patient‑related
Coef P > z Coef P > z Coef P > z
Socio-economic male -4.766 0.000 -2.817 0.003 -2.396 0.021
age -0.179 0.000 -0.217 0.000 -0.126 0.004
married 1.389 0.239 0.898 0.392 2.475 0.034
nb_children -1.529 0.006 -1.687 0.001 -1.657 0.003
education -0.985 0.023 -0.745 0.053 -0.863 0.044
income -8.547 0.000 -7.964 0.000 -7.526 0.000
Professional and labour tenure 1.702 0.167 1.491 0.174 0.608 0.618
leader -1.436 0.182 -0.802 0.401 -1.499 0.159
Job Satisfaction OJS -0.464 0.000 -0.465 0.000 -0.410 0.000
Geographic urban -3.502 0.024 -2.462 0.075 -2.488 0.106
rural -0.385 0.901 0.596 0.828 0.036 0.990
NOR 8.421 0.001 6.747 0.004 9.403 0.000
CEN 4.695 0.089 3.485 0.154 6.390 0.019
LTV 9.235 0.001 7.538 0.001 8.491 0.001
ALE 7.114 0.033 5.936 0.045 8.580 0.009
Unit type USF-A 2.709 0.260 4.911 0.022 11.854 0.000
USF-B 1.742 0.465 3.654 0.085 10.928 0.000
UCSP -1.597 0.513 0.914 0.674 7.908 0.001
_cons 106.794 0.000 103.446 0.000 84.426 0.000
Nb of obs 1751 1751 1751
LR chi2(18) 335.72 407.24 269.28
Prob > chi2 0.000 0.000 0.000
Pseudo R2 0.0216 0.0264 0.0175
Log likelihood -7,600.705 -7,502.344 -7,564.115
Page 14 of 17Ferreira et al. BMC Fam Pract (2021) 22:81
Table 10 Results Burnout model—Burnout dimensions for nurses
Burnout dimensions Personal‑related Work‑related Patient‑related
Coef P > z Coef P > z Coef P > z
Socio-economic male -5,001 0,000 -1,475 0,108 1,971 0,064
age -0,034 0,476 -0,116 0,006 -0,130 0,008
married 1,092 0,209 0,491 0,526 0,001 0,999
nb_children -0,901 0,036 -0,547 0,153 -1,484 0,001
education 0,051 0,890 -0,067 0,840 -0,802 0,036
income -5,337 0,000 -5,091 0,000 -3,635 0,000
Professional and labour tenure 0,739 0,408 0,101 0,899 0,576 0,532
leader 2,600 0,006 2,385 0,005 0,617 0,527
Job Satisfaction OJS -0,450 0,000 -0,443 0,000 -0,326 0,000
Geographic urban -0,885 0,353 -1,307 0,124 -0,496 0,613
rural -2,049 0,332 -2,185 0,246 -1,124 0,606
NOR 3,463 0,038 2,901 0,051 0,927 0,590
CEN 0,818 0,645 -1,198 0,449 -3,424 0,061
LTV 3,786 0,031 3,208 0,040 -0,102 0,955
ALE 2,720 0,171 2,491 0,160 -1,463 0,476
Unit type USF-A -1,283 0,200 -1,515 0,090 4,007 0,000
USF-B -0,963 0,319 -1,380 0,110 5,051 0,000
UCSP -3,686 0,000 -3,792 0,000 1,561 0,137
_cons 72,129 0,000 79,374 0,000 73,886 0,000
Nb of obs 2846 2846 2846
LR chi2(18) 480,350 567,060 296,180
Prob > chi2 0,000 0,000 0,000
Pseudo R2 0,020 0,023 0,012
Log likelihood -12,043.384 -11,829,958 -11,890,948
Page 15 of 17Ferreira et al. BMC Fam Pract (2021) 22:81
Fig. 1 Regions in Portugal Mainland

Page 16 of 17Ferreira et al. BMC Fam Pract (2021) 22:81
AbbreviationsGP: General practitioner; SAH: Self-assessed health; OJS: Overall job satisfac-tion; USF-A: Family Health Units type A; USF-B: Family Health Units type B; UCSP: Traditional primary health care units; NOR: North Region; CEN: Central Region; LVT: Lisbon and Tagus Valley Region; ALE: Alentejo Region.
AcknowledgementsThe authors thank all respondents for their participation in this project.
Authors’ contributionsPF and VR were responsible for the protocol and contract with the Ministry of Health of Portugal. These authors were also responsible for the design of the study and coordinated the data collection. AIT and AP drafted the manuscript and performed the data analysis. All authors were involved in the interpretation of the results, and also they read, revised and approved the final manuscript.
FundingThis project was partially funded by the Ministry of Health of Portugal—ACSS Department contract number 36/2017. The funding body played no role in the design of the study nor of the collection, analysis, interpretation or writing of the manuscript. All stages of the study were entirely performed by the authors. See Author contributions for further details.CEISUC/CIBB is funded by national funds through FCT—Foundation for Science and Technology, I.P., under the Multiannual Financing of R&D Units 2020–2023.
Availability of data and materialsThe datasets used during the current study cannot be made available as stated in the funding contract with the Ministry of Health of Portugal.
Declarations
Ethics approval and consent to participateThe survey and the study has been approved by the ethical commission called the National Commission for Individual Data Protection and the approval number is 103/2018. All respondents gave an informed consent form by written online.
Consent for publicationNot applicable.
Competing interestsThe authors declare no competing interests.
Author details1 CEISUC - Centre for Health Studies and Research, University of Coimbra, Coimbra, Portugal. 2 FEUC - Faculty of Economics, University of Coimbra, Coimbra, Portugal. 3 ISEG -UL - Lisbon School of Economics and Management, University of Lisbon, Lisbon, Portugal. 4 FCTUC - Faculty of Science and Tech-nology, University of Coimbra, Coimbra, Portugal.
Received: 4 May 2020 Accepted: 29 March 2021
References 1. WHO. Everybody’s business - strengthening health systems to improve
health outcomes. WHO’s framework for action; 2007. ⟨https:// www. who. int/ healt hsyst ems/ strat egy/ every bodys_ busin ess. pdf ⟩ (Accessed 12 Jan 2020).
2. WHO. Key components of a well-functioning health system; 2010. Avail-able at: ⟨https:// www. who. int/ healt hsyst ems/ EN_ HSSke ycomp onents. pdf? ua=1⟩ (Accessed 30 Jan 2020).
3. Brand SL, Thompson Coon J, Fleming LE, Carroll L, Bethel A. Wyatt K Whole-system approaches to improving the health and well-being of healthcare workers: A systematic review. PLoS ONE. 2017;12(12):e0188418.
4. Dyrbye LN, Shanafelt TD, Sinsky CA, Cipriano PF, Bhatt J, Ommaya A, West CP, Meyers D. Burnout among health care professionals: A call to explore and address this underrecognized threat to safe, high-quality care. Wash-ington DC: NAM Perspectives; 2017.
5. Hall LH, Johnson J, Watt I, Tsipa A, O´Connor DB. Healthcare Staff Wellbe-ing, Burnout, and Patient Safety: A systematic Review. PLOS One. 2016; 11(7): 1–12.
6. Newman T. Relationships between coping self-efficacy and burnout in nurse practitioners and physician assistants. (PhD.) San Diego: California School of Professional. Psychology at Alliant International University; 2012.
7. Shanafelt TD, Bradley KA, Wipf JE, Back AL. Burnout and self-reported patient care in an internal medicine residency program. Ann Intern Med. 2002;136:358–67.
8. Yuguero O, Ramon Marsal J, Esquerda M, Vivanco L, Soler-González J. Association between low empathy and high burnout among primary care physicians and nurses in Lleida. Spain Eur J Gen Pract. 2016;23(1):4–10.
9. Stevens S. Five year forward view. London: NHS England; 2014. 10. APA. APA Dictionary of Psychology. 2020. Available at: ⟨ https:// dicti onary.
apa. org/ ⟩ (Accessed 20 Jan 2020). 11. Diener E, Ryan K. Subjective Well-Being: A General Overview. S Afr J
Psychol. 2009;39(4):391–406. 12. Jamal M, Baba VV. Job stress and burnout among Canadian manag-
ers and nurses: an empirical examination. Can J Public Health. 2000;91(6):454–8.
13. Lyubomirsky S, King LA, Diener E. The benefits of frequent positive affect: Does happiness lead to success? Psychol Bull. 2005;1(31):803–55.
14. Cotton P. Special issue on occupational stress and wellbeing. AustPsychol. 2003;38:79–80.
15. Levi L. Work, worker and wellbeing: An overview. Work Stress. 1995;8:79–83.
16. Silva S, Nunes M, Santana VR, Reis FP, Machado J, Lima SO. Burnout syndrome in professionals of the primary healthcare network in Aracaju. Brazil CienSaúde Colet. 2015;20:3011–20.
17. CDC. 2019. Well-being concepts. Available at: ⟨https:// www. cdc. gov/ hrqol/ wellb eing. htm⟩ (Accessed 13 Dec2019).
18. Ryff CD. Happiness is everything, or is it? Explorations on the meaning of psychological well-being. J PersSocPsychol. 1989;57(6):1069–81.
19. Linton MJ, Dieppe P, Medina-Lara A. Review of 99 self-report measures for assessing wellbeing in adults: exploring dimensions of well-being and developments over time. BMJ Open. 2016;6(7):1–16.
20. Shakir R, Rajakulendran S. The 11th Revision of the International Clas-sification of Diseases (ICD): The Neurological Perspective. JAMA Neurol. 2013;70(11):1353–4.
21. Kristensen TS, Borritz M, Villadsen E, Christensen KB. The Copenhagen Burnout Inventory: A new tool for the assessment of burnout. Work Stress. 2005;19(3):192–207.
22. Ayala E, Carnero AM. Determinants of Burnout in Acute and Critical Care Military Nursing Personnel: A Cross-Sectional Study from Peru. PLoS ONE. 2013;8(1):e54408.
23. Nowacka A, Piskorz A, Wolfshaut-Wolak R, Piątek J, Gniadek A. Selected Socio-Demographic and Occupational Factors of Burnout Syndrome in Nurses Employed in Medical Facilities in Małopolska—Preliminary Results. Int J Environ Res Public Health. 2018;15(10):2083.
24. Baban A, Bria M, Dumitrascu D. Systematic review of burnout risk factors among European healthcare professionals. Cogn Brain Behav. 2012; 16(3): 423–452.
25. Soler JK, Yaman H, Esteva M, Dobbs F, Asenova RS, Katic M, Ozvacic Z, Desgranges JP, Moreau A, Lionis C, Kotányi P, Carelli F, Nowak PR, de Aguiar Sá Azeredo Z, Marklund E, Churchill, D, Ungan M. Burnout in European family doctors: The EGPRN study. Fam Pract. 2008; 25: 245–265.
26. Tarcan GY, Tarcan TM, Top M. An analysis of relationship between burnout and job satisfaction among emergency health professionals. Total Qual-Manag Bus Excell. 2017;28(11–12):1339–56.
27. Health DC, Living U. Science. 2008;319(5864):766–9. 28. Kroneman M, Verheij R, Tacken M. Van der Zee J. Urban–rural health differ-
ences: primary care data and self-reported data render different results. Health Place. 2010; 16(5): 893–902.
Page 17 of 17Ferreira et al. BMC Fam Pract (2021) 22:81
• fast, convenient online submission
•
thorough peer review by experienced researchers in your field
• rapid publication on acceptance
• support for research data, including large and complex data types
•
gold Open Access which fosters wider collaboration and increased citations
maximum visibility for your research: over 100M website views per year •
At BMC, research is always in progress.
Learn more biomedcentral.com/submissions
Ready to submit your researchReady to submit your research ? Choose BMC and benefit from: ? Choose BMC and benefit from:
29. Nummela O, Sulander T, Karisto A, Uutela A. Self-rated Health and Social Capital Among Aging People Across the Urban-Rural Dimension. Int J Behav Med. 2009;16(2):189–94.
30. Pickett KE, Pearl M. Multilevel analyses of neighbourhood socioeconomic context and health outcomes: a critical review. J Epidemiol Community Health. 2001;55:111–22.
31. Verheij RA, van de Mheen HD, de Bakker DH, Groenewegen PP, Mackenbach JP. Urban-rural variations in health in The Netherlands: does selective migration play a part? J Epidemiol Community Health. 1998;52:487–93.
32. Vlahov D, Freudenberg N, Proietti F, Ompad D, Quinn A, Nandi V, Galea S. Urban as a Determinant of Health. J Urban Health. 2007;84(S1):16–26.
33. Voigtländer S, Berger U, Razum O. The impact of regional and neighbour-hood deprivation on physical health in Germany: a multilevel study. BMC Public Health. 2010;10(1):2–12.
34. Saijo Y, Chiba S, Yoshioka E Kawanishi Y, Nakagi Y, Ito T, Sugioka Y, Kitaoka-Higashiguchi K, Yoshida T. Job stress and burnout among urban and rural hospital physicians in Japan. Aust J Rural Health. 2013; 21(4): 225–231.
35. Lavanchy M, Connelly I, Gryzbowski S, Michalos AC, Berkowitz J, Thom-masen HV. Determinants of rural physicians’ life and job satisfaction. Soc Indic Res. 2004;69:93–101.
36. Baernholdt M, Mark BA. The nurse work environment, job satisfac-tion and turnover rates in rural and urban nursing units. J NursManag. 2009;17(8):994–1001.
37. Rothenberger DA. Physician Burnout and Well-Being. Dis Colon Rectum. 2017;60(6):567–76.
38. Sapilak B, Lach-Jeziorna G, Kurpas D, Hans-Wytrychowska A, Melon-Sapilak M, Steciwko A. Analysis of professional burnout in selected employees of the healthcare system in Kepno district. Fam Med Prim Care Rev. 2009;11(3):489–91.
39. Maroco J, Maroco AL, Leite E, Bastos C, Vazao MJ, Campos J. Burnout in Portuguese Healthcare Professionals: An Analysis at the National Level. Acta Med Port. 2016;29(1):24–30.
40. Houkes I, Winants Y, Twellaar M, Verdonk P. Development of burnout overtime the causal order of the three dimensions of burnout among male and female GPs. A three-wave panel study. BMC Public Health. 2011;11(1): 1–13.
41. Kumar S. Burnout and Doctors: Prevalence, Prevention and Intervention. Healthc (Amst). 2016;4(3):37.
42. Kringos D, Boerma W, Bourgueil Y, et al. The strength of primary care in Europe: an international comparative study. Br J Gen Pract. 2013;63(616):e742–50.
43. Biscaia AR, Heleno LC. Primary Health Care Reform in Portugal: Portu-guese, modern and innovative. CienSaúde Colet. 2017;22(3):701–12.
44. Simoes J, Augusto FG, Fronteira I, Hernandez-Quevedo C. Portugal: Health system review. Health Syst Transit. 2017; 19(2):1–184.
45. Ferreira PL, Passadouro R. Public health - The voice of professionals. Int J Qual Health Care. 2020 May 20;32(3):177–183.
46. Ferreira PL, Raposo V, Tavares AI. Primary health care patient satisfac-tion: explanatory factors and geographic characteristics. Int J Qual Health Care. 2020;32(2):93–8.
47. Nelson EC, Larson CO, Hays RD, Nelson SA, Ward D, Batalden PB. The physician and employee judgment system: reliability and validity of a hospital quality measurement method. Qual Rev Bull. 1992;18(9):284–92.
48. Paulo G. Satisfação dos profissionais de saúde–avaliação em dois mod-elos de gestão hospitalar: Adaptação e validação cultural do Hospital Employee Judgment System. Master thesis in Health Management and Economics. Coimbra: Faculty of Economics of the University of Coimbra; 2003.
49. Fonte CM. Adaptação e validação para português do questionário de Copenhagen Burnout Inventory (CBI). Master thesis in Health Manage-ment and Economics. Coimbra: Faculty of Economics of the University of Coimbra; 2011.
50. Lapa TA, Carvalho S, Viana J, Ferreira PL, Pinto-Gouveia JA, Cabete AB. Development and evaluation of a global burnout index from Copen-hagen Burnout Inventory in Portuguese physicians. Acta Med Port. 2018;31(10):534–41.
51. Maslach C. What have we learned about burnout and health? Psychol Health. 2001;16(5):607–11.
52. Dahlgren G, Withitehead M. Polices and Strategies to Promote Social Equity in Health. Stockholm: Institute for Future Studies; 1991.
53. Picquendar G, Guedon A, Moulinet F, Schuers M. Influence of medical shortage on GP burnout: a cross-sectional study. FamPract. 2019;36(3):291–6.
54. Kisa S, Kisa A, Younis MZ. A discussion of job dissatisfaction and burnout among public hospital physicians. Int J Health PromotEduc. 2009;47(4):104–11.
55. Maslach C, Leiter MP. The Truth About Burnout: How Organizations Cause Personal Stress and What to Do About It. San Francisco: Jossey-Bass, Wiley Brand; 1997.
56. McHugh MD, Kutney-Lee A, Cimiotti JP, Sloane DM, Aiken LH. Nurses’ widespread job dissatisfaction, burnout, and frustration with health benefits signal problems for patient care. Health Aff. 2011;30(2):202–10.
57. Linzer M, Manwell LB, Williams ES. MEMO (Minimizing Error. Maximizing Outcome) Investigators. Working conditions in primary care: physician reactions and care quality. Ann Intern Med. 2009; 151: 28–36.
58. Busis NA, Shanafelt TD, Keran CM, Levin KH, Schwarz HB, Molano JR, Vidic TR. Kass JS, Miyasaki JM, Sloan JA, Cascino TL . Burnout, career satisfaction, and well-being among US neurologists in 2016. Neurology. 2017; 88(8): 797–808.
59. Faragher EB, Cass M, Cooper CL. The Relationship between Job Satisfaction and Health: A Meta-Analysis. From Stress to Wellbeing. 2013;1:254–71.
60. Khamisa N, Oldenburg BK, IIic D. Work Related Stress, Burnout, Job Sat-isfaction and General Health of Nurses. Int. J. Environ. Res. Public Health. 2015 ; 12(1): 652–666.
61. Laschinger HK, Fida R. New nurses burnout and workplace wellbeing: The influence of authentic leadership and psychological capital. Burn Res. 2014;1(1):19–28.
62. WHO. Delivered by women, led by men: A gender and equity analysis of the global health and social workforce. Human Resources for Health Observer Series No. 24. Geneva, World Health Organization; 2019.
63. Ferreira PL, Passadouro R. Public Health: The voice of professionals. Int J Qual Health Care. 2020; 20; 32(3):177–183.
64. Boniol M, McIsaac M, Xu L, et al. Gender equity in the health workforce: analysis of 104 countries. World Health Organization; 2019. Available at https:// apps. who. int/ iris/ handle/ 10665/ 311314. Accessed 30 Dec 2020.
65. Matud MP. Gender and Health. In Alvinius A. Gender differences in differ-ent context. IntechOpen. 2017. DOI: https:// doi. org/ 10. 5772/ 65410.
66. Macintyre S, Hunt K, Sweeting H. Gender differences in health: are things really as simple as they seem? SocSci Med. 1996;42(4):617–24.
Publisher’s NoteSpringer Nature remains neutral with regard to jurisdictional claims in pub-lished maps and institutional affiliations.