Embed Size (px)
Citation preview

Bureaucratic Corruption and Income: Evidencefrom the Land Sector in Bangladesh
ASADUL ISLAM* & WANG-SHENG LEE**,†
*Department of Economics, Monash University, Melbourne, Australia, **Department of Economics, Deakin University,Burwood, Australia, †Institute for the Study of Labor (IZA), Bonn, Germany
(Final version received December 2015; final version accepted December 2015)
ABSTRACT We examine, for the first time, the effects of corruption on income using household survey data froma developing country. Estimating the effects of corruption on income is challenging because of the simultaneousrelationship between the two variables. We use a two-step instrumental variable approach to identify the effects ofcorruption on income. We find that after adjusting for simultaneity bias the act of bribery reduces income and thathigher bribes have a negative effect on income. Taken together, our results provide a possible explanation why avicious cycle between corruption and income inequality does not exist in the land sector in Bangladesh.
1. Introduction
Corruption can occur at many different levels in a country and can cause waste and a misallocation ofresources that results in inefficiency and inequality.1 Although difficult to define precisely, broadlyspeaking, corruption refers to illegal, or unauthorised, acts on the part of public officials who abusetheir positions of authority to make personal gains.2 The fact that the most corrupt countries in theworld also tend to have the highest incidence of poverty and inequality is unlikely to be due to chance.Many developing countries appear to be trapped in a vicious cycle of widespread poverty, incomeinequality, and misgovernance. This is suggested by the casual observation that many of the poorestand most corrupt countries of the past are among the poorest and most corrupt countries today (forexample, Bardhan, 1997). According to Uslaner (2008), people caught in these ‘cultures of corruption’or ‘inequality traps’ make payments even though they are not happy about it because there is no wayout (p. 10).
The empirical evidence supporting a positive relationship between corruption and income inequalityis well documented (for example, Andres & Ramlogan-Dobson, 2011; Foellmi & Oechslin, 2007;Gupta, Davoodi, & Alonso-Terme, 2002; You & Khagram, 2005). Much of this research is based onsubjective indices on corruption such as the International Country Risk Guide (ICRG) or theCorruption Perceptions Index (CPI). These studies rely on the cross-national variation in corruptionand income inequality, in which the latter is typically measured with the Gini coefficient. In a reviewof the literature on corruption in developing countries, Olken and Pande (2012) voice doubts about thereliability of making inferences regarding corruption based solely on such aggregate perceptionindices. Several researchers found, based on micro-level data, that perceived corruption as measured
Correspondence Address: Wang-Sheng Lee, Department of Economics, Monash University, Caulfield East, Victoria 3145,Australia. Email: [email protected] Online Appendix is available for this article which can be accessed via the online version of this journal available athttp://dx.doi.org/10.1080/00220388.2016.1146702
The Journal of Development Studies, 2016Vol. 52, No. 10, 1499–1516, http://dx.doi.org/10.1080/00220388.2016.1146702
© 2016 Informa UK Limited, trading as Taylor & Francis Group

by such indices is not correlated highly with citizens’ actual experiences with corruption (for example,Olken & Barron, 2009; Razafindrakoto & Roubaud, 2010). One possible reason for the divergencemight be that corruption perception indices measure some overall notion of corruption that includes allthree types, whereas micro-level measures tend to be concerned with bureaucratic corruption specifi-cally. As an alternative to aggregate corruption indices, Olken and Pande (2012) emphasise that theuse of surveys of bribe-payers to measure bribery is a more direct approach. A number of recentstudies used high-quality survey data at the individual, household, or firm level (see, for example,Choe, Dzhumashev, Islam, & Khan, 2013; Emran, Islam, & Shilpi, 2013; Hunt, 2008, 2010; Hunt &Laszlo, 2012; Mocan, 2008; Olken & Barron, 2009; Sulemana, 2015; Svensson, 2003).3 These studiesgenerally focused on the effects of income on the incidence of bribery or the amount paid in bribes.However, policy makers are potentially more interested in understanding the burden of corruption orhow corruption affects the distribution of income.
This paper contributes to the literature by examining the effects of bureaucratic corruption onincome. To the best of our knowledge, this is the first paper to use micro-level household survey datato examine empirically the link between corruption and income inequality. Estimating the effect ofcorruption on income is challenging because of the simultaneity between corruption and income.Empirical estimation requires that a suitable instrument for corruption be found – a variable that ishighly correlated with corruption but that does not directly influence income. The availability of alarge household-level dataset and local area rainfall data, which provides an exogenous variation ofincome, provides us with a method of dealing with the endogeneity problem. Our identificationstrategy for estimating the causal effect of corruption on income is to use a two-step instrumentalvariable (IV) approach. In the first step, we estimate the causal effect of income on corruption, inwhich we instrument for income. In the second step, based on a zero covariance restriction (Brückner,2013; Hausman & Taylor, 1983), we use the residual variation in corruption that is not driven byincome as an instrument to estimate the effect that corruption has on income. This two-step strategyprovides a better understanding of how income and corruption are related at the micro level. Our maincontribution to the literature lies in the second step, in which we provide estimates of the effect ofcorruption on income.
To better appreciate the link between income and corruption, we use corruption in transactions inthe agricultural land sector in Bangladesh as our empirical focus in this paper. The main advantage offocusing on the land sector is that in a developing country such as Bangladesh, agriculture is the mainsource of livelihood for people who live in rural areas and exogenous variation in rainfall is a majordeterminant of crop production levels. We use local area rainfall variation, which largely determinesthe crop production of rural households in Bangladesh.
There are many other reasons that studying the effects of corruption in the land sector in adeveloping country such as Bangladesh is important. First, according to the Global CorruptionBarometer 2013 (TI, 2013), around the world, one in five people report that they had paid a bribefor bureaucratic procedures related to land transactions. Corruption in the land sector is particularlycritical in post-conflict societies and countries in transition, in which land records are not digitalised,where transparent and efficient land management is necessary to rebuild and reconstruct the country.Although land is a common source of corruption and conflict among households in many developingcountries, the sector has surprisingly received no attention in the corruption literature.4 Second, landmarkets play a particularly important role in determining the ability of households to generatesubsistence as well as determining the distribution of income in developing countries. Insecureproperty rights and land corruption discourage long-term investment and hamper land productivity.For example, Banerjee, Gertler, and Ghatak (2002) find increased farm productivity due to agriculturaltenancy laws that offer security of tenure to tenants in West Bengal, India. Besley and Burgess (2000)find poverty decreased due to land reform across Indian states. Third, the rural economy in developingcountries that relies exclusively on land is the most important driver for stimulating income growthand thus a potential pathway out of poverty for the rural poor. Land markets play an important role infacilitating this transition.
1500 A. Islam & W.-S. Lee
Previewing our main findings, our ‘local effects’ stand in contrast with the general findings from themacro literature on corruption and income inequality. In particular, we find that higher levels ofcorruption are not associated with higher levels of income inequality. This is because we find that therich are more likely than the poor to pay bribes and because paying larger bribes has a negative effecton income. In other words, the rich are actually worse off (in terms of income) by engaging incorruption.
2. Background: Land and Corruption
Land ownership plays a significant role in the lives of rural people in South Asia. In Bangladesh, morethan 160 million people live in a total land area of 144,000 square km. About 70 per cent of thepopulation lives in rural areas, and agricultural land makes up 70 per cent of the total land area. In2012, 23.5 per cent of the country’s gross domestic product (GDP) came from the agricultural sector,which accounted for 62 per cent of employment in the country, emphasising the important role ofagriculture in the economy.
Corruption in the land sector is pervasive in South Asia. According to a survey conducted byTransparency International in Bangladesh in 2005 (TI, 2005a), 97 per cent of households that boughtland had to pay bribes for land registration, 85 per cent had to pay bribes for changes in ownership andland-related documents, 83 per cent paid bribes for land surveys, and 40 per cent of households whoreceived land had to pay bribes. A similar survey conducted in India also in 2005 (TI, 2005b) showedthat about 79 per cent of those interacting with the Land Administration Department in Indiaencountered corruption. Of those who paid bribes, more than 36 per cent had paid money todepartment officials, whereas 33 per cent had paid money to intermediaries such as document writersand property dealers to get the necessary documents. A household survey in Nepal (TI, 2003)concluded that the respondents perceived land administration was the most corrupt sector in thecountry.
Land is the major source of wealth and livelihood in rural Bangladesh. Often, demarcating landboundaries is a major source of conflict. Due to population growth and climate change, many rules,processes, and institutions that determine the allocation of scarce land resources have been put underconsiderable strain. People also need to pay for property registration, change or forge titles, acquireland information, process cadastral surveys, and generate favourable land use plans. The numerousadministrative processes in a typical land transaction in Bangladesh increase the likelihood that oneencounters a corrupt official.
Income plays a major role in the land markets in rural Bangladesh because of the large transactioncosts in the sector. The high prevalence of bribery in the land sector creates a substantial cost forfarmers trying to register or transfer land. Bribery can make land administration services inaccessible ifpeople are not able to afford these illegal payments. Sarap (1995) provides evidence from India thatdespite a preference for land-holding on the part of farm households, many households have had to sellland involuntarily in order to mobilise funds for consumption, bribes, repayment of debts, or paymentfor medical services. He found that of a sample of land transactions conducted from 1950 to 1993more than 50 per cent were distress sales since they occurred in the nine specific years during orpreceding drought years. In many developing countries, insecure property rights, poor contractenforcement, and stringent legal restrictions limit the performance of land markets. As noted byDeininger and Feder (2001), the importance of being able to transfer use or ownership rights toland increases with economic development.
Disputes relating to the registration of land titles in Bangladesh fall within the jurisdiction of theMinistry of Land. In 2006 alone, bribes worth about 83 billion Taka (US$1.25 billion) were paid forland-related services such as registration and record changes (Transparency International (TI), 2005a).Processing a land transaction in Bangladesh is an extremely long and bureaucratic process. Accordingto a 2010 report by the World Bank and the International Finance Corporation, registering a propertyin Bangladesh requires eight procedures, takes 245 days, and costs 10.24 per cent of the property’s
Bureaucratic corruption and income 1501

value. In comparison, it takes five days to register a property in Nepal, 44 days in India, and 50 days inPakistan. Given the absence of a transparent system, bribery and other irregularities are common.People in the administrative department who are responsible for creating and maintaining land recordsoften prepare incorrect records intentionally, and land owners are forced to pay bribes to officials to getthe records approved.
2.1 A Conceptual Framework: The Simultaneity between Corruption and Income
In this section, we describe a conceptual framework based on an ‘all-pay auction’ model to helpexplain why a simultaneous relationship between corruption and income can arise. Such a frameworkis widely used in economics to model political lobbying, rent seeking in regulated industries, andtechnological competition and R&D races (Baye, Kovenock, & De Vries, 1996). In an all-pay auction,each player submits a bid (a bribe in our context) and the player with the highest bid wins the contest.However, independent of success, all players bear the cost of their bids. Consider a sequential gamewith two types of agents: citizens and bureaucrats. Suppose that there are two citizens and onebureaucrat. Both the citizens want rights to a piece of land that is worth V dollars in the currentperiod. The rights are given to the citizen that spends the highest on bribes. In the event of a tie inbribe amounts offered, the official will randomly award the rights to one of the citizens.
Let B1 and B2 denote the amount of bribes offered by citizens 1 and 2 respectively. The payoffs tocitizen 1 are:
π ¼V � B1 if B1 > B2V2 � B1 if B1 ¼ B2�B1 if B1 < B2
8<:
The payoff to citizen 2 is similar to citizen 1. While the payoff to the citizens will depend on thebribery strategies they undertake, the payoff to the official is B1 + B2 and is unambiguously positive.
In this bribery game, the optimal bribe B* for each citizen under a mixed strategy equilibrium is B*/V, where B* takes on a value between 0 and V with equal probability. In equilibrium, the expectedpayoff is zero for citizens 1 and 2. Citizen 2 uses the randomisation device to make sure that citizen 1will always receive a zero payoff in equilibrium and vice versa.5 It is a standard result that there is noequilibrium in pure strategies in all-pay auctions (Baye et al., 1996).
Why is the mixed strategy B*/V an equilibrium? If citizen 1 bribes B* = B where B < V, then citizen2 can bid B + ε to win the rights to the land. In that case, citizen 1 should have placed a bid of B + 2εinstead. Therefore, this does not constitute an equilibrium. Both citizens choosing to bribe V is not anequilibrium as the payoff equals 0.5 V – V which is negative and they would have been better off notbribing in the first place. In addition, both citizens would also never bid more than V as they willreceive negative payoffs in all scenarios. Therefore, no pure strategy equilibrium exists.
Going back to the context of the land sector in Bangladesh, as land is a factor of production withvalue in future periods, V can be thought of as consisting of the present discounted value of a futureincome stream rather than a one-off payment. One case to consider is when the citizens have differentvaluations of V. Baye et al. (1996) show that when one ‘strong’ player competes against severalweaker (but equal) players, in an equilibrium, the strong player earns a positive payoff while theweaker players have expected payoffs equal to zero.6 Alternatively, V can be thought of as comprisinga relatively large sum of money, and it is possible that a citizen participating in the bribery game has abudget constraint and will not be able to afford a strategy that requires paying bribes that span therange between 0 and V with equal probability. Under such a scenario, the citizen with the higherincome or resources will win the bribery game most of the time. Kotowski and Li (2014) show thatwhen there are private budget constraints in all-pay auctions, more aggressive bidding from playerswith relatively large budgets and valuations occurs as the marginal return of a higher bribe hasincreased.
1502 A. Islam & W.-S. Lee
In both these scenarios above, it is no longer that only the corrupt official gets a positive payoff andthe citizens get a zero payoff in equilibrium. When there are heterogeneous valuations of the good orwhen there are private budget constraints, it is possible that both the corrupt official and the citizenwith more resources will end up with positive payoffs. The framework of the all-pay auction modeltherefore highlights how income can be associated with being able to make higher bribe amounts, andhow bribes can be positively correlated with income.
Kameir and Kursany (1985) describe how corruption helps to build up a chain of a small number offinanciers who control most of the agricultural produce in Sudan. The economic intuition outlined hereis a possible mechanism for why they describe corruption as ‘a mode of income generation for theparasitic section of the Sudanese capitalist class’ (p. 28). According to a recent report by TransparencyInternational Bangladesh (TI, 2015), bribery rates related to the leases of hat-bazars (markets) rangefrom 10,000 to 2,000,000 takas. The bribery rates related to hat-bazars are by far the highest amongstbribes paid for various land services.7 The report states that a huge amount of hat-bazar land has beengrabbed by some influential people with the connivance of land officials and local government bodies.This link between bribery and income generating activities is consistent with our argument that bribescan be positively correlated with income.8
The Transparency International (TI) (2015) report also highlights that there are numerous cases ofland disputes occurring, where currently, land is the source of 60 per cent legal disputes in the countryand the number of backlog cases for land disputes stands at 1.8 million (Transparency International(TI), 2015, p. 24). The high percentage of people paying bribes in the land sector suggests that thereare many participants who participate in the bribery game, although there can only be one winner. Thecompetitive nature of the bribery game in the land sector suggests there are likely many citizens whoengage in bribery but who do not reap the benefits from bribery. However, it is less clear if a parasiticsection of the capitalist class will dominate the bribery game in the land sector. In other words, itremains an empirical question what the association between bribery and income for households inBangladesh will be.
3. Data and Summary Statistics
The information on corruption and socio-economic data come from national household surveys oncorruption in Bangladesh conducted by Transparency International Bangladesh (TIB). The surveyaims to capture people’s experiences regarding corruption in selected public service sectors. Thisincludes land administration and management, agriculture, law enforcement agencies, justices, educa-tion, health, local government and relief, power, water, and sanitation service, natural gas supply, tax,bank and financial institutes, insurance, non-government organisations, and other sectors. The samplemodule includes various locations such as rural areas, urban areas, and metropolitan centres.
The survey focuses on factual information provided by households on how they have experiencedcorruption while receiving a service during a given period and the service’s nature, dimension, type,and implications. The survey measures actual corruption, is representative of the country’s entirepopulation, and primarily captures bribes paid during the course of daily life. The survey covershouseholds’ experiences with mostly bureaucratic corruption from July 2009 to June 2010. In thesurvey, corruption is defined as more than bribery: Corruption is the abuse of entrusted power forpersonal gain manifest in six common forms (bribery, negligence of duties, nepotism, embezzlement,deception, and extortion). We focus on corruption experienced with public officials involved in landadministration. Each household was asked to report any corruption experienced during the course ofobtaining land registration, land titles, land taxes, documents related to land, land surveys, and khas(state-owned) land management within the previous year. For each type of service, the survey asked ifhouseholds had paid a bribe or encountered any corruption, the amount paid in bribes, and the role/titleof the official involved in the transaction.
To select households for the survey, a three-stage stratified cluster sampling method was followed.The Integrated Multipurpose Sampling (IMPS) Frame developed by the Bangladesh Bureau of
Bureaucratic corruption and income 1503

Statistics was used as the sampling frame.9 A total of 6000 households were interviewed, 3481 fromrural areas and 2519 from urban areas. There were 300 Primary Sampling Units (PSUs): 174 for ruralareas and 126 for urban areas. Then, 300 PSUs were distributed in 16 strata according to the nationalpopulation weights of those strata. At the first stage, PSUs were selected randomly from each of the 16strata. Then, a block of 20 households was constructed randomly from each PSU. Since some PSUs inthe IMPS have fewer than 200 households, households from adjacent Mauzas (for example, village)were added to those PSUs. The PSUs covered all 64 districts in Bangladesh with divisional and rural–urban population representations.
The district level data were collected from the Bangladesh Bureau of Statistics. We obtained rainfalldata for Bangladesh from Bandyopadhyay and Skoufias (2015). The original source of the rainfall datais the Climate Research Unit (CRU) of the University of East Anglia. Bandyopadhyay and Skoufiasconverted data from the CRU, which had come in the form of geographic coordinates, to thana- (sub-district) level rainfall by using weighted averages, where the weights are the proportion of the area ofthe thana in each 2.5° × 2.5° latitude-longitude grid.
In this paper, we consider only rural households that have land used to generate their livelihood. Weexclude households from urban/metropolitan areas in the survey since very few households in urbanareas have agricultural land.10 Our final sample consists of 2223 rural households that had land oneyear before the survey.11
Table 1 presents the descriptive statistics on the basic socio-economic characteristics and outcomesfor households in rural Bangladesh. On average, about 22 per cent of households in our sample paid abribe for a land transaction. The average bribe amount paid within the previous year was 1087 Takas.Relative to an average annual total household expenditure of 9951 Takas and an average annual total
Table 1. Summary statistics
Variable Obs Mean Std. Dev. Min Max
Income and CorruptionPaid bribe in land 2223 0.22 0.41 0 1Bribe amount in Takas 2223 1087.40 4934.83 0 100000Bribe amount in Takas (conditional of making bribe) 490 4933.22 9573.18 10 100000Household expenditure in Takas 2223 9951.39 7967.87 1850 161000Household income in Takas 2223 13896.63 15772.04 1900 411000Log bribe amount (conditional of making bribe) 490 7.47 1.57 2.30 11.51Log household expenditure in Takas 2223 9.02 0.579 7.52 11.99Log household income in Takas 2223 9.28 0.666 7.55 12.93
Demographic and Local CharacteristicsHousehold size 2223 5.82 2.35 2 21Number of females 2223 2.76 1.41 0 11Age of head (years) 2223 51.13 13.91 2 115Sex of head (Male = 1) 2223 0.90 0.30 0 1Head Muslim (Muslim = 1) 2223 0.85 0.36 0 1Head’s occupation (professional = 1) 2223 0.06 0.23 0 1Head’s education > year 12 2223 0.23 0.42 0 1Total owned land (in decimals) 2223 245.88 271.51 50 2782Network 2221 0.67 0.47 0 1District population size (in 100,000s) 2159 21.50 14.80 2.93 85.76District crop value (in 100,000,000s of Takas) 2159 31.22 16.76 2.86 70.76
Rainfall VariablesRain percentage change 2008–2009 2223 −17.85 6.55 −26.59 −6.47Rain percentage change 2009–2010 2223 −17.94 19.61 −44.58 41.41Heavy rain 2000–2009 (4th quartile) 2223 0.23 0.42 0.00 1Low rain 2000–2009 (1st quartile) 2223 0.28 0.45 0.00 1Rainfall levels 2009 (in mm) 2223 1446.27 400.00 961 2972Rainfall levels 2010 (in mm) 2223 1192.29 489.32 508 2855
Notes: In 2010, one US$ was worth approximately 69 Takas.
1504 A. Islam & W.-S. Lee
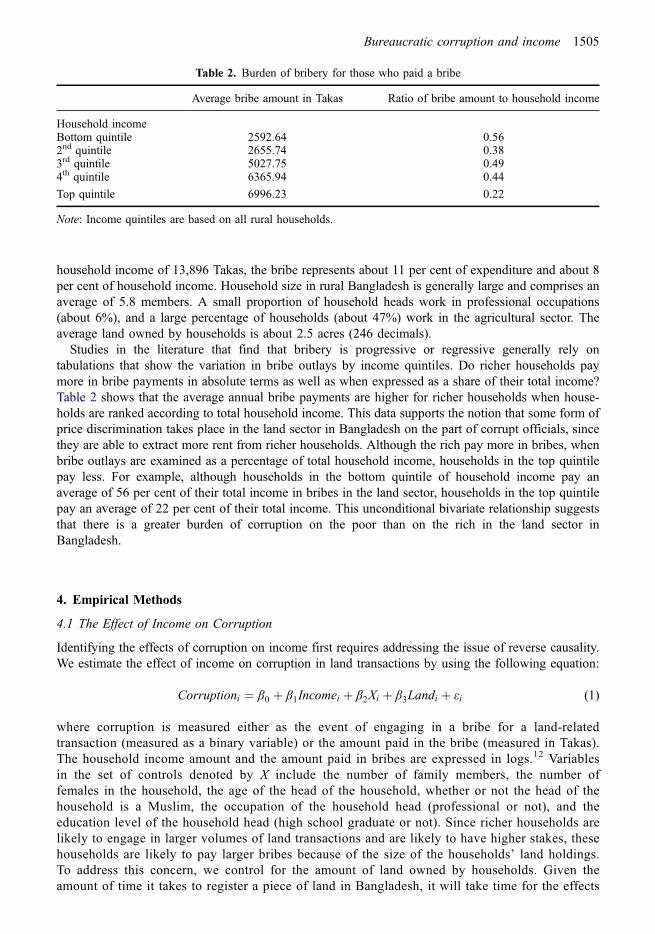
household income of 13,896 Takas, the bribe represents about 11 per cent of expenditure and about 8per cent of household income. Household size in rural Bangladesh is generally large and comprises anaverage of 5.8 members. A small proportion of household heads work in professional occupations(about 6%), and a large percentage of households (about 47%) work in the agricultural sector. Theaverage land owned by households is about 2.5 acres (246 decimals).
Studies in the literature that find that bribery is progressive or regressive generally rely ontabulations that show the variation in bribe outlays by income quintiles. Do richer households paymore in bribe payments in absolute terms as well as when expressed as a share of their total income?Table 2 shows that the average annual bribe payments are higher for richer households when house-holds are ranked according to total household income. This data supports the notion that some form ofprice discrimination takes place in the land sector in Bangladesh on the part of corrupt officials, sincethey are able to extract more rent from richer households. Although the rich pay more in bribes, whenbribe outlays are examined as a percentage of total household income, households in the top quintilepay less. For example, although households in the bottom quintile of household income pay anaverage of 56 per cent of their total income in bribes in the land sector, households in the top quintilepay an average of 22 per cent of their total income. This unconditional bivariate relationship suggeststhat there is a greater burden of corruption on the poor than on the rich in the land sector inBangladesh.
4. Empirical Methods
4.1 The Effect of Income on Corruption
Identifying the effects of corruption on income first requires addressing the issue of reverse causality.We estimate the effect of income on corruption in land transactions by using the following equation:
Corruptioni ¼ β0 þ β1Incomei þ β2Xi þ β3Landi þ εi (1)
where corruption is measured either as the event of engaging in a bribe for a land-relatedtransaction (measured as a binary variable) or the amount paid in the bribe (measured in Takas).The household income amount and the amount paid in bribes are expressed in logs.12 Variablesin the set of controls denoted by X include the number of family members, the number offemales in the household, the age of the head of the household, whether or not the head of thehousehold is a Muslim, the occupation of the household head (professional or not), and theeducation level of the household head (high school graduate or not). Since richer households arelikely to engage in larger volumes of land transactions and are likely to have higher stakes, thesehouseholds are likely to pay larger bribes because of the size of the households’ land holdings.To address this concern, we control for the amount of land owned by households. Given theamount of time it takes to register a piece of land in Bangladesh, it will take time for the effects
Table 2. Burden of bribery for those who paid a bribe
Average bribe amount in Takas Ratio of bribe amount to household income
Household incomeBottom quintile 2592.64 0.562nd quintile 2655.74 0.383rd quintile 5027.75 0.494th quintile 6365.94 0.44
Top quintile 6996.23 0.22
Note: Income quintiles are based on all rural households.
Bureaucratic corruption and income 1505

of a bribe to fully materialise. Therefore, a contemporaneous relationship between bribery andland holdings, conditional on other controls, is unlikely. We also examine whether geographiccharacteristics matter, such that people living in some areas are more vulnerable to corruptionbecause of factors such as population and soil fertility. We do so by controlling for populationsize and crop production at the district level (Bangladesh has 64 districts).
In general, much of the microeconomic evidence of how income affects bribery is based onordinary least square (OLS) regressions. An exception includes Hunt and Laszlo (2012), who useinformation on living standards such as type of dwelling, type of telephone, type of sanitationfacility, and type of household ownership as instruments for household expenditure to address themeasurement error issue in income and expenditure. However, if unobservable factors are asso-ciated with income and corruption (for example, unscrupulous people are more likely to bribe andattain business success), then the coefficients and estimated marginal effects will be biased. Inother words, if we estimate Equation (1) using OLS, the coefficient on income is a potentiallybiased measure of the effect of income on corruption, as there is the possibility of reversecausality: those who are corrupt might be rewarded and obtain higher levels of income for theircorrupt practices. Proper identification of the effect of income requires an exogenous source ofvariation for income.
In estimating the effect of income on corruption, we use local geographic variations in rainfall inBangladesh over the period 2000–2010 to help induce exogenous variation in income andexpenditure that would arise through changes in agricultural productivity. Our identificationstrategy is similar to others in the economics literature who have used rainfall as an instrumentfor income in a country where agriculture is the dominant sector (for example, Emran et al., 2013;Jayachandran, 2006; Miguel, Satyanath, & Sergenti, 2004; Paxson, 1992; Voors, Bulte, &Damania, 2011).
For our IV estimates, we use local geographic (thana) level rainfall data for Bangladesh that wereconstructed by Bandyopadhyay and Skoufias (2015).13 Table 1 provides descriptive statistics on therainfall variables we use as instruments, as well as the averages and variations in rainfall levels in 2009and 2010. We use two alternative measures of local rainfall variability to instrument for income inEquation (1). The first is the annual percentage change in rainfall for the two preceding years beforethe TIB 2010 household survey. In Bangladesh, income and consumption are highly dependent on theagricultural harvest. Much of the agricultural cultivation in South Asia depends on the monsoon rains,so that the pre-harvest lean season coincides with the late rainy season. Crop failure or a poor harvestcan lead to seasonal hardships. Irregular occurrences, such as floods or failure of the monsoon rains,can magnify the adverse seasonal effects to an extent that leaves irreversible adverse effects onlivelihood sustainability and can culminate in a famine-like situation (Khandker & Mahmud, 2012).Since the household survey was conducted in 2010, we take the percentage change in rainfall levelsbetween 2008–2009 and 2009–2010 to proxy for the expected agricultural harvest in 2010. Forexample, for the change between 2008 and 2009, this is computed as the simple difference in rainfalllevels between 2008 and 2009 divided by the rainfall levels in 2008. Using this measure of rainfallfollows Miguel et al. (2004), who use current and lagged rainfall growth to instrument for per-capitaeconomic growth.
The second rainfall measure captures positive and negative rainfall shocks. We first create a baselinerainfall measure for each area by taking area averages of the rainfall levels for 2000–2009.14 We thendefine two binary variables. First, we designate villages as heavy rainfall areas if they have an averagerainfall over the last 10 years that exceeds the 75th percentile of the average rainfall in the country.This binary variable can potentially help capture any negative shocks due to heavy rainfall. Since lowlevels of rainfall can also be problematic for crop production, we designate villages as low rainfallareas if they have an average rainfall over the last 10 years that is below the 25th percentile of averagerainfall in the country. Using rainfall shocks in this fashion is consistent with previous studies that userainfall as an instrument for crop yield and income (for example, Emran et al., 2013; Jayachandran,2006).
1506 A. Islam & W.-S. Lee
4.2 Validity of Rainfall as an Instrument
The key identifying assumptions that underlie the validity of rainfall as an instrument are that heavyrainfall reduces income and rainfall does not work through other channels in influencing bribery in theland sector in rural areas of Bangladesh. The exclusion restriction has several potential objections,which we discuss in turn.
First, heavy rainfall could induce higher migration of male members in search of work. This willlead to a higher proportion of households headed by female members, which have lower bargainingpower and which could be more likely to pay bribes. In the context of justifying the use of local-arearainfall as an instrument for the education sector in Bangladesh, Emran et al. (2013) find, using datafrom the 2010 Household Income and Expenditure survey in Bangladesh, that the proportion offemale-headed households is not different in heavy and non-heavy rainfall areas. This suggests thatmale migration from heavy rainfall areas to urban areas is not likely to be an issue. Second, people inflood-prone areas might be less risk averse. Emran et al. (2013) explore this issue using the size of ahousehold’s precautionary grain stock. They show that grain stocks due to the precautionary motiveare not different in heavy and non-heavy rainfall areas, suggesting no differences in the risk prefer-ences across areas. Third, long-term rainfall differences across districts may have affected localinstitutions. For example, if heavy rainfall leads to flooding and subsequent flood relief activity,more corruption might be induced with such activity. As a result, heavy rainfall areas might be morelikely to implement tougher laws against bribery. Since the legal and enforcement institutions aredesigned for the whole of Bangladesh and not at the district level, however, it is extremely unlikelythat heavy rainfall areas have different enforcement mechanisms against corruption compared to non-heavy rainfall areas. To substantiate our claims, we check whether people are more likely to pay abribe or have paid more money to the judiciary or faced extortion or harassment from law enforcementagencies for any services. The survey includes detailed information about receiving services from thepolice, the judiciary and other services such as local government, water and electricity supplies,education, and health services. We do not see any significant differences between high and lowrainfall areas.
We also conduct two falsification checks. The first test is a similar analysis of households in largeurban areas that do not depend on agriculture for their livelihood. Rainfall is less likely to affect theincome of these households. The second test involves dividing all districts in Bangladesh into disaster-prone and non-disaster-prone areas based on historical information regarding the districts’ suscept-ibility to flooding. Based on data on crop damage and loss of cultivable land due to floods at the sub-district level from 1981 to 2005, we identify a district as historically flood prone if more than 50 percent of the crops were damaged in a district at least five times during this 25-year period.15 Similar tothe logic used in Sarsons (2012), in districts that are not prone to flooding, the correlation betweenheavy rainfall and bribery should disappear or be weakened.16
When we perform our IV analysis on urban areas (n = 460) instead of rural areas, as would beexpected, we find that the instruments are weak. The corresponding first-stage F-statistics (based onmodel specifications we later use in Table 5) are 0.87, 1.87, 0.61, and 1.75, respectively. Similarly,when we perform the same regression for non-flood prone areas (n = 882), we find that the instrumentsare relatively weaker than in the flood-prone areas. The corresponding first-stage F-statistics for non-flood prone areas are 0.87, 0.76, 0.71, and 1.62, respectively. These results give us confidence thatrainfall does not influence corruption through means other than income.
4.3 The Effect of Corruption on Income
We estimate the effect of corruption on income using the following equation:
Incomei ¼ γ0 þ γ1Corruptioni þ γ2Xi þ γ3Landi þ γ4Zi þ ui (2)
Bureaucratic corruption and income 1507
where Zi are the excluded instruments used in the two-stage least squares estimation of Equation (1). Ifwe find that income has a significant effect on corruption in Equation (1), then the OLS estimation ofthe effect of corruption on income in Equation (2) will be biased becausecovðCorruptioni;uiÞ�0.
In the simultaneous equation system involving Equations (1) and (2), Equation (1) is identified ifγ4�0 but Equation (2) is not identified unless we make further assumptions or impose additionalrestrictions. Since Equation (2) is of interest in our application to address the issue of how corruptionaffects income, we assume a zero covariance restriction in order to achieve identification.Identification of such models is discussed in Hausman and Taylor (1983) and Wooldridge (2010,section 9.4.2). Instead of finding an exogenous variable as an instrument for corruption, we create ameasure of corruption that is adjusted for endogeneity and use this as an instrument for corruption.17
This adjusted measure of corruption is obtained by partialling out the response of corruption toincome:
Corruption� ¼ Corruption� ðβ1Incomei þ β2Xi þ β3LandiÞ¼ Corruption� Cobrruption (3)
where Cobrruption is the predicted value of corruption from Equation (1). By construction, Equation(2), estimated using two-stage least squares using Corruption� as an instrument for corruption, doesnot suffer from simultaneity bias. The IV estimator provides a consistent estimate of γ1, assuming thatεi and ui are uncorrelated. Since the estimation of the effect of corruption on income requires that aconsistent estimate of the effect of income on corruption ðβ1Þ is available as an input, the validity ofthe instrument and model specification in Equation (1) plays a key role in determining whether wecorrectly estimate the effect of corruption on income in Equation (2). As emphasised by Brückner(2013), although this approach solves the problem of simultaneity bias, there could still be omittedvariable bias if Equation (1) or (2) is mis-specified (see Brückner (2013) for more details).
5. Results
For each bribery outcome, we estimate two models. In the first model, we control for key socio-demographic variables, including the total amount of land owned by the household. In the secondmore extended model, we also control for district-level differences in population size (with the bottomquartile as the omitted reference group) and the value of the crops produced.18
5.1 OLS Results
Table 3 presents the OLS estimates of Equation (1). The results in Table 3 suggest that income issignificantly related to the propensity to pay a bribe at the 1 per cent level when district-level controlsare included. Columns 3 and 4 suggest that, conditional on making a bribe, the rich are likely to pay ahigher amount in bribe payments, as evident from the positive and significant coefficients of income.Thus, at the intensive margin, bribery is progressive. Comparing the results in columns (1) and (3)with the corresponding results in columns (2) and (4) respectively, we can see that adding theadditional district-level variables does not significantly affect the size, or significance, of the coeffi-cient on household income. The district-level controls, however, such as district population size, alsoaffect corruption. Thus, while geographic characteristics do not influence our estimates of the effectsof income on corruption, these characteristics affect the corruption experienced at the household level.
The estimated income elasticity of bribe amounts is about 0.37 to 0.39 based on the OLS model.This compares with income elasticities reported by Hunt (2010) and Hunt and Laszlo (2012) that arepositive in the range of 0.15 to 0.66.
In Table 4, we examine the reverse effect: how bribery affects the long-term income of a household.The OLS results suggest that the incidence of making a bribe has a positive effect on householdincome when district-level controls are included. Higher bribe payments in turn are associated with
1508 A. Islam & W.-S. Lee

higher household income levels, suggesting that there is a positive return to paying larger bribes. Mostof the other controls have the expected signs. In particular, we see that income increases withhousehold size, education, and the amount of land owned. Muslim households also have higherincomes.
The OLS results are subject to bias and suffer from endogeneity and a reverse causality problem.However, they provide a useful benchmark for our analysis and demonstrate the relevance ofaddressing these issues in our context. Below, we present results using IV estimates followingempirical strategies outlined in Sections 4.1 and 4.3 to estimate the effect of a household’s economicstatus on corruption and the effect of corruption on household economic status.
5.2 IV Results
IV estimates of the effect of household income on the extensive and intensive margins of bribery arereported in Tables 5 and 6. The IV estimates in Table 5 are based on using annual percentage changesin rainfall as the instrument, which is our preferred instrument. Results based on the binary instrumentdenoting rainfall shocks are weaker based on the first-stage F-statistics (see Appendix Table A.1). The2SLS results reported in Table 5 suggest that OLS estimates are biased downward. The IV estimates onthe income variable for both outcomes – the incidence and amount of bribery – are larger.
Results presented in columns 1 and 2 of Table 5 show that income is not related to the probability ofpaying a bribe (that is, richer households are not more likely to pay a bribe). However, the IV estimates
Table 3. OLS effects of household income on propensity to pay bribe/bribe amount
(1) Pay Bribe (2) Pay Bribe (3) Log Bribe Amount (4) Log Bribe Amount
Log household income 0.062*** 0.069*** 0.397*** 0.373**(0.018) (0.019) (0.149) (0.151)
Household size −0.001 −0.003 −0.100* −0.095*(0.007) (0.007) (0.053) (0.054)
Number of females 0.001 0.003 0.102 0.077(0.010) (0.010) (0.084) (0.086)
Age of head −0.001* −0.001* −0.000 −0.002(0.001) (0.001) (0.006) (0.006)
Sex of head 0.008 0.003 −0.376* −0.373*(0.029) (0.029) (0.224) (0.222)
Head Muslim 0.081*** 0.085*** −0.084 −0.026(0.023) (0.023) (0.233) (0.239)
Head’s occupation −0.016 −0.014 0.403 0.408(0.037) (0.037) (0.291) (0.303)
Head’s education > year 12 −0.018 −0.007 0.032 0.043(0.025) (0.024) (0.184) (0.182)
Total owned land/1000 0.085** 0.089** 0.523** 0.490*(0.041) (0.042) (0.262) (0.264)
District population quartile = 2 −0.037 0.299(0.040) (0.193)
District population quartile = 3 −0.062* 0.007(0.037) (0.259)
District population quartile = 4 −0.121** 0.173(0.047) (0.315)
District crop value 0.003*** −0.010(0.001) (0.007)
N 2223 2159 490 474adj. R2 0.031 0.037 0.067 0.067
Notes: All models include regional dummies. Standard errors in parentheses. Standard errors are clustered at theprimary sampling unit level. *** p < 0.01, ** p < 0.05, * p < 0.1.
Bureaucratic corruption and income 1509
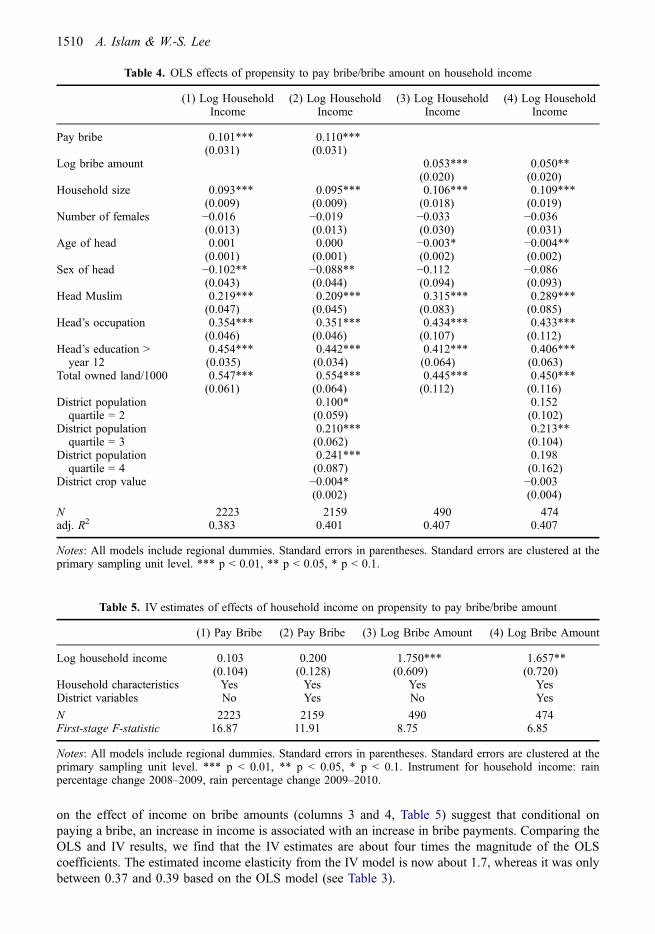
on the effect of income on bribe amounts (columns 3 and 4, Table 5) suggest that conditional onpaying a bribe, an increase in income is associated with an increase in bribe payments. Comparing theOLS and IV results, we find that the IV estimates are about four times the magnitude of the OLScoefficients. The estimated income elasticity from the IV model is now about 1.7, whereas it was onlybetween 0.37 and 0.39 based on the OLS model (see Table 3).
Table 4. OLS effects of propensity to pay bribe/bribe amount on household income
(1) Log HouseholdIncome
(2) Log HouseholdIncome
(3) Log HouseholdIncome
(4) Log HouseholdIncome
Pay bribe 0.101*** 0.110***(0.031) (0.031)
Log bribe amount 0.053*** 0.050**(0.020) (0.020)
Household size 0.093*** 0.095*** 0.106*** 0.109***(0.009) (0.009) (0.018) (0.019)
Number of females −0.016 −0.019 −0.033 −0.036(0.013) (0.013) (0.030) (0.031)
Age of head 0.001 0.000 −0.003* −0.004**(0.001) (0.001) (0.002) (0.002)
Sex of head −0.102** −0.088** −0.112 −0.086(0.043) (0.044) (0.094) (0.093)
Head Muslim 0.219*** 0.209*** 0.315*** 0.289***(0.047) (0.045) (0.083) (0.085)
Head’s occupation 0.354*** 0.351*** 0.434*** 0.433***(0.046) (0.046) (0.107) (0.112)
Head’s education >year 12
0.454***(0.035)
0.442***(0.034)
0.412***(0.064)
0.406***(0.063)
Total owned land/1000 0.547*** 0.554*** 0.445*** 0.450***(0.061) (0.064) (0.112) (0.116)
District populationquartile = 2
0.100*(0.059)
0.152(0.102)
District populationquartile = 3
0.210***(0.062)
0.213**(0.104)
District populationquartile = 4
0.241***(0.087)
0.198(0.162)
District crop value −0.004* −0.003(0.002) (0.004)
N 2223 2159 490 474adj. R2 0.383 0.401 0.407 0.407
Notes: All models include regional dummies. Standard errors in parentheses. Standard errors are clustered at theprimary sampling unit level. *** p < 0.01, ** p < 0.05, * p < 0.1.
Table 5. IV estimates of effects of household income on propensity to pay bribe/bribe amount
(1) Pay Bribe (2) Pay Bribe (3) Log Bribe Amount (4) Log Bribe Amount
Log household income 0.103 0.200 1.750*** 1.657**(0.104) (0.128) (0.609) (0.720)
Household characteristics Yes Yes Yes YesDistrict variables No Yes No Yes
N 2223 2159 490 474First-stage F-statistic 16.87 11.91 8.75 6.85
Notes: All models include regional dummies. Standard errors in parentheses. Standard errors are clustered at theprimary sampling unit level. *** p < 0.01, ** p < 0.05, * p < 0.1. Instrument for household income: rainpercentage change 2008–2009, rain percentage change 2009–2010.
1510 A. Islam & W.-S. Lee

Table 6 presents results that estimate the effects of bribery on income based on using the constructedinstrument given in Equation (3). The results are very different from those based on OLS estimates. Inparticular, the signs are the opposite of the corresponding OLS results presented in Table 4. The 2SLSestimates suggest that the act of paying a bribe has a significant negative effect on household income(columns 1 and 2). Larger bribe payments also lead to lower household income, implying that thereturn to paying larger bribes is actually negative and that richer households do not benefit frompaying larger bribes. The IV results in Table 6 imply that by choosing to pay a bribe, householdincome is expected to decrease by between 7 per cent and 21 per cent instead of increasing by between10 per cent and 11 per cent as suggested by the OLS results. Conditional on paying a bribe, the IVresults in Table 6 also suggest that doubling the bribe amount (that is, increasing it by 100 per cent)will decrease household income by about 19–20 percentage points. In other words, the OLS resultsgive very different and misleading implications compared to the IV results.
Since the effect of income on corruption is influenced by how much land one owns (for example,richer households are more likely to be involved in larger land transactions than poor households orhave more land to protect from primitive accumulation) and because larger bribes might need to bepaid for larger plots of land, we also tried including an interaction term between income and totalamount of land owned in Equation (1) and an interaction term between bribery and total amount ofland owned in Equation (2). In line with our IV strategy, we use the interaction between rainfall andtotal amount of land as the instrument for the interaction term in Equation (1) and the interactionbetween the relevant residual (given by Equation (3)) and total amount of land as the instrument forthe interaction term in Equation (2). Results corresponding to Tables 5 and 6 are presented in TablesA.2 and A.3 in the Appendix. Although the interaction terms are insignificant in Table A.2, theinteraction between bribe amount and total land owned is significant in Table A.3, suggesting that themore land one owns, the more positive the effect of the bribe amount on income will be. This impliesthat paying larger bribes when one owns more land has some positive returns.
5.3 Do Social Networks Influence Our Results?
In Equation (1), higher income can play a dual role. On the one hand, higher income represents thehousehold’s ability to pay. However, higher income is also an indicator of a household’s bargainingpower that captures, among other things, social and political connections. Families with access toinformal networks (for example, some connection with a political leader, elected local governmentrepresentative, or other influential person) might have more clout compared those who do not havesocial connections. For example, richer households might be able to avoid paying bribes and bypass
Table 6. IV estimates of effects of propensity to pay bribe/bribe amount on household income
(1) Log HouseholdIncome
(2) Log HouseholdIncome
(3) Log HouseholdIncome
(4) Log HouseholdIncome
Pay bribe −0.069** −0.214***(0.028) (0.030)
Log bribe amount −0.200*** −0.186***(0.027) (0.027)
Householdcharacteristics
Yes Yes Yes Yes
District variables No Yes No Yes
N 2223 2159 490 474First-stageF-statistic
119539 30595.7 781.78 843.38
Notes: All models include regional dummies. Standard errors in parentheses. Standard errors are clustered at theprimary sampling unit level. *** p < 0.01, ** p < 0.05, * p < 0.1. Instrument for propensity to pay bribe/bribeamount: residuals from corresponding columns in Table 5.
Bureaucratic corruption and income 1511

corrupt officials because of who the households happen to know. If richer households also happen tohave better networks, then income might simply be acting as a proxy measure for bargaining power. Inthe survey, households were asked whether they were involved with a political party, were a memberof a social/cultural organiSation, whether they have a household member living in the capital city,Dhaka, whether they listen to news on the radio or TV, or read newspapers regularly. We construct anindex of social network in which we assign a value of one if there was a positive response to any ofthese questions and a value of zero otherwise. The mean value of the network variable is 0.67, with astandard deviation of 0.47. By including networks as an extra covariate in Equation (1), we hope toobtain a ‘purged’ effect of income on bribery. These results are presented in Table 7. The new IVresults correspond to the results in Tables 5 and 6 with the district controls included. In Table 7, thecoefficients are not very different in magnitude from those in Table 5. The corresponding estimates ofthe reverse effects of bribery on income are also similar to the corresponding results found in Table 6.Therefore, these results increase our confidence that the relationships we found between income andbribery in Tables 5 and 6 are robust.
Since the network variable is potentially endogenous, we do not focus on its coefficient. We aremainly interested in whether our coefficients of income and corruption in the IV estimates are affectedby the inclusion of such a network variable. Choe et al. (2013) focus on examining the effects onnetworks on corruption in the education sector in Bangladesh. However, finding a credible instrumentthat could be an exogenous source of networks and that does not affect either income or corruption isvery difficult.
6. Discussion
Based on three agriculture and livestock censuses conducted over the past three decades in ruralBangladesh, Rahman and Rahman (2009) discuss interesting dynamics that have been taking place inthe land sector. Unlike the experience in East Asian countries such as Japan and Korea, where farmsizes are increasing at the same time that the total number of farms is decreasing, Bangladesh isexperiencing a rapid decline in farm sizes coupled with an increase in the number of operationalholdings.
Table 7. Robustness check of estimated IV effects including the network variable
(1) PayBribe
(2) Log BribeAmount
(3) Log HouseholdIncome
(4) Log HouseholdIncome
Log household income 0.208 2.038**(0.148) (0.958)
Pay bribe −0.223***(0.030)
Log bribe amount −0.231***(0.029)
Network −0.017 −0.629* 0.226*** 0.231***(0.041) (0.351) (0.028) (0.071)
Householdcharacteristics
Yes Yes Yes Yes
District variables Yes Yes Yes Yes
N 2157 474 2157 474First-stage F-statistic 10.04 4.78 28496.8 570.12
Notes: All models include regional dummies. Standard errors in parentheses. Standard errors are clustered at theprimary sampling unit level. *** p < 0.01, ** p < 0.05, * p < 0.1. Instrument for household income: rainpercentage change 2008–2009, rain percentage change 2009–2010. Instrument for propensity to pay bribe/bribeamount: residuals from columns 1 and 2, respectively.
1512 A. Islam & W.-S. Lee

An insight into the factors that may be preventing land purchases leading to the concentration ofland in the hands of richer and potentially more productive farmers is provided by Ullah’s (1996) studyof land transfers in Bangladesh. Looking at data in two villages from 1972 to 1986, he finds that theaggregate distribution of land remains remarkably stable over time in both villages, despite importantdifferences in the villages’ internal dynamics. Why has an asset-owning and productive capitalist classthat hires workers to work on the farms not been created in Bangladesh? Why has there been arepeated churning of small parcels of land and no capitalist farmers capturing more land over time? Ina country where a significant share of the total land belongs to an economically struggling and low-productivity peasantry, the emergence of a bigger capitalist sector should theoretically involve non-market dispossessions of some very poor peasants.
Khan (2004) suggests that this is not due to a badly working administrative structure and instabilityof land rights in Bangladesh. Far from opposing the instability of land rights, local landed elites trytheir best to exploit this instability for their own benefit, and often push and corrupt the bureaucracy,the police, and the courts in ways that further increase instability. At the village level, virtually all richpeasants of any standing are allied with one or another local political faction, and they are engagedintensely with the local bureaucracy and the police to further their strategies of accumulating landholdings. Any observer of these processes must conclude that landed classes are just as muchresponsible for the corruption and arbitrary interventions of bureaucrats and courts as they are victimsof these forces. Yet few rich farmers grow beyond a certain point because competitors are continuouslyand successfully challenging their growth. According to Khan (2004), the competition and balance ofpower between factions also means that those who are attacked today have a good chance ofreclaiming or resisting these encroachments tomorrow. The cyclical success or failure of individualfactions depends on an ongoing and chaotic political re-alignment of the mosaic of primary factions,each driven by calculations of how bargaining power can be maximised. The policy implication ofKhan’s (2004) analysis, if he is correct, is that no amount of loans from agencies such as the WorldBank to carry out institutional reforms to improve the land record systems, or to improve the quality ofdistrict-level courts, is likely to have any discernible effect on reforming Bangladesh’s land sector.
In this paper, our analysis provides an alternative possibility. Our explanation of the observed farmsize dynamics in Bangladesh involves the simultaneity between corruption and income. Using a two-step IV approach, we identify the effects of corruption in the land sector on income once the effects ofincome on corruption are accounted for. The IV estimates suggest that conditional on paying a bribe,an increase in income is associated with an increase in bribe payments. Conversely, we find that the actof bribery reduces income and that higher amounts paid in a bribe have a negative effect on income.
Taken together, our results provide a plausible explanation why a vicious cycle between corruptionand income does not exist in the land sector in Bangladesh. Substantial resources might be simplyexpended on protecting and retaining property rights. Since the rich are more likely than the poor topay larger bribes, and because paying larger bribes has a negative effect on income, the rich areactually worse off (in terms of income) by engaging in corruption. In other words, the rich do notexperience any immediate payoffs for corruption in the land sector. Thus, corruption in land transac-tions appears to effectively serve as a tax on the income of the rich and helps restrain their ability toacquire more land. This is consistent with the observed dynamics of farm sizes in rural Bangladeshwhere a larger capitalist agricultural sector has not emerged.
7. Conclusion
In this paper, we examine the simultaneous relationship between bureaucratic corruption and incomein the land sector in Bangladesh using an instrumental variable approach. The land sector is closelyconnected with the livelihoods and economic activities for a large fraction of the rural population inBangladesh. Yet, despite government efforts to streamline land administration, bribery, corruption andusurpation of state and private properties are commonplace. Bribery can be an integral part of an assetaccumulation strategy, in which the goal is to acquire income and wealth through land acquisition. It is
Bureaucratic corruption and income 1513

also possible that wealthier individuals will be more likely to engage in bribery because they have themeans to do so or because of higher valuation of their time and demand for services. For example, toget ahead in a processing queue for land transactions, wealthier individuals might pay a bribe to helpspeed up the processing of their applications. However, we find no evidence supporting theseviewpoints.
In this paper, we took a bottom-up approach based on micro-level data. This contrasts with theempirical literature on corruption and inequality, which is typically based on cross-country data.Although our results suggest that land corruption does not appear to worsen income inequality inBangladesh in the short run, this is no evidence that bribery has no adverse economic effects in allsectors of the economy or in the longer run.
Acknowledgement
We thank Zakir Khan, Iftekhrauzzaman, and Transparency International Bangladesh for access to thehousehold-level corruption survey data and Sushenjit Bandyopadhyay and Emmanuel Skoufias for thelocal rainfall data on Bangladesh used in this paper. We thank two anonymous referees, LutfunnaharBegum, Chongwoo Choe, Chris Doucouliagos, Shahe Emran, Pedro Gomis-Porqueras, and RussellSmyth for helpful comments and suggestions. Chau Nguyen provided excellent research assistance.All errors are our own.
Disclosure statement
No potential conflict of interest was reported by the authors.
Notes
1. An alternative and more positive viewpoint of corruption is that it can ‘grease the wheels’ of an economy, in whichbureaucrats accept bribes in return for by-passing cumbersome regulations that work against efficiency. However, Ades andDi Tella (1999) argue that corruption can more appropriately be described as ‘sand in the machine’ as they did not findbenefits associated with corruption.
2. Jain (2001) distinguishes between three main types of corruption that can occur in a society: grand corruption, bureaucraticor petty corruption, and legislative or political corruption. Grand corruption is corruption that affects the government on alarge scale. Bureaucratic or petty corruption refers to everyday abuse of entrusted power by low- and mid-level publicofficials in their interactions with ordinary citizens, who often are trying to access basic goods or services in places such ashospitals, schools, police departments, and other agencies. Finally, legislative or political corruption refers to corruption soprevalent that it is part of the everyday structure of society.
3. Svensson (2003) finds that firms with more ability pay larger bribes. Olken and Barron (2009) report that drivers withobservable characteristics that indicate a higher willingness to pay, such as those driving newer trucks or carrying valuablecargo, are charged higher prices by corrupt officials. Hunt (2008) finds that bribery is regressive in dealings with the policein Peru but progressive in dealings with the judiciary. Mocan (2008) finds that richer households are more likely to face ademand for bribe in developing countries but not so in developed countries. Hunt (2010) argues that richer clients are morelikely to bribe a public official, due to a higher valuation of their time and demand for services. Hunt and Laszlo (2012) findthat the rich bribe more frequently than the poor, but that the poor pay more in bribes as a share of their income. Choe et al.(2013) and Emran et al. (2013) find that rich people pay smaller bribes in the education sector in Bangladesh. Sulemana(2015) includes both corruption perception and experiences in an empirical model exploring the correlates of subjectivewell-being.
4. Studies that have used household survey data on corruption have previously focused on other sectors such as education(Choe et al., 2013; Emran et al., 2013), health (Hunt, 2010), and the police and the judiciary (Hunt, 2008). Glaeser,Scheinkman, and Shleifer (2003) examined the effects of unequal distribution of economic and political resources on theworkings of the legal system.
5. This result can also be generalised to the case where there are n citizens but we will focus on the case n = 2 for expositionand economic intuition.
6. See their Theorem 2.7. Hat-Bazars are the indigenous markets that work under the supervision of local government and owned by the local
government in Bangladesh. These markets play a vital economic role in the rural areas of Bangladesh.
1514 A. Islam & W.-S. Lee

8. See Table 1 in the TI (2015) report.9. The IMPS design consists of 1000 Mauzas distributed in 16 strata according to rural, municipality, and Statistical
Metropolitan Areas (SMA) throughout the country. There were six rural, six urban, and four SMA strata. These Mauzasconstitute the primary sampling units in this sampling frame.
10. We use the sample from urban/metropolitan areas to check the validity of our instruments.11. The survey includes the total land a household owns including homestead land. We restrict our analysis to households that
own at least 50 decimals of land since the very poor do not have the means to buy land. This cut-off has been used in theeconomics literature to identify the asset poor (for example, Davis & Baulch, 2011).
12. As the income and bribery amount variables tend to be highly skewed, we follow the convention in the literature and use thelog of each measure in our models.
13. Bandyopadhyay and Skoufias (2015) show that a large variation in the rainfall exists among different thanas in Bangladesh.Bangladesh, at present, has about 500 administrative thanas in rural and urban areas.
14. This assumes that the average level of rainfall over the period 2000–2009 is a good indication of conditions that are ideal forthe agricultural sector. The average for 2000–2009 is not very different from the average values constructed over alternativelonger periods of time such as 1950–2009.
15. The data are compiled by Iqbal and Roy (2014) from different sources of the Bangladesh Bureau of Statistics (BBS): (i)Yearbook of Agricultural Statistics, BBS, ii) Agriculture Census Report, BBS, and iii) Thana Statistics and UpazilaStatistics, BBS. The number of times crops and crop areas were damaged has been determined based on the flood data.According to this criterion, about 55 per cent of 64 districts are categorised as flood prone.
16. Sarson’s (2011) analysis is based on the fact that there are numerous dams in India that help insulate nearby downstreamdistricts from adverse weather conditions such as droughts.
17. This approach was adopted from a widely cited study by Blanchard and Perotti (2002) in the context of identifying theeffects of government spending and taxes on GDP. Brückner (2013) is a more recent application in the context of howforeign aid affects economic growth.
18. We do not use district fixed effects, since rainfall and corruption data are available only at the district level in many cases.Thus, using district fixed effects would remove the possibility of using variation in rainfall as an instrument.
References
Ades, A., & Di Tella, R. (1999). Rents, competition, and corruption. American Economic Review, 89(4), 982–993. doi:10.1257/aer.89.4.982
Andres, A., & Ramlogan-Dobson, C. (2011). Is corruption really bad for inequality? Evidence from Latin America. Journal ofDevelopment Studies, 47(7), 959–976. doi:10.1080/00220388.2010.509784
Bandyopadhyay, S., & Skoufias, E. (2015). Rainfall variability, occupational choice, and welfare in rural Bangladesh. Review ofEconomics of the Household, 13(3), 589–634. doi:10.1007/s11150-013-9203-z
Banerjee, A., Gertler, P., & Ghatak, M. (2002). Empowerment and efficiency: Tenancy reform in West Bengal. Journal ofPolitical Economy, 110(2), 239–280. doi:10.1086/338744
Bardhan, P. (1997). Corruption and development: A review of issues. Journal of Economic Literature, 35(3), 1320–1346.Baye, M., Kovenock, D., & De Vries, C. (1996). The all-pay auction with complete information. Economic Theory, 8(2), 291–
305. doi:10.1007/BF01211819Besley, T., & Burgess, R. (2000). Land reform, poverty reduction, and growth: Evidence from India. The Quarterly Journal of
Economics, 115(2), 389–430. doi:10.1162/003355300554809Blanchard, O., & Perotti, R. (2002). An empirical characterization of the dynamic effects of changes in government spending and
taxes on output. The Quarterly Journal of Economics, 117(4), 1329–1368. doi:10.1162/003355302320935043Brückner, M. (2013). On the simultaneity problem in the aid and growth debate. Journal of Applied Econometrics, 28(1), 126–
150. doi:10.1002/jae.1259Choe, C., Dzhumashev, R., Islam, A., & Khan, Z. (2013). The effect of informal networks on corruption in education: Evidence
from the household survey data in Bangladesh. Journal of Development Studies, 49(2), 238–250. doi:10.1080/00220388.2012.709620
Davis, P., & Baulch, B. (2011). Parallel realities: Exploring poverty dynamics using mixed methods in rural Bangladesh. Journalof Development Studies, 47(1), 118–142. doi:10.1080/00220388.2010.492860
Deininger, K., & Feder, G. (2001). Land institutions and land markets. In B. Gardner & G. Rausser (Eds.), Handbook ofagricultural economics (Vol. 1, 1st ed., pp. 287–331)). Amsterdam: Elsevier.
Emran, M., Islam, A., & Shilpi, F. (2013). Admission is free only if your dad is rich! Distributional effects of corruption inschools in developing countries (World Bank Policy Research Working Paper 6671). Washington, DC: World Bank.
Foellmi, R., & Oechslin, M. (2007). Who gains from non-collusive corruption? Journal of Development Economics, 82(1), 95–119. doi:10.1016/j.jdeveco.2005.10.002
Glaeser, E., Scheinkman, J., & Shleifer, A. (2003). The injustice of inequality. Journal of Monetary Economics, 50(1), 199–222.doi:10.1016/S0304-3932(02)00204-0
Gupta, S., Davoodi, H., & Alonso-Terme, R. (2002). Does corruption affect income inequality and poverty? Economics ofGovernance, 3(1), 23–45. doi:10.1007/s101010100039
Bureaucratic corruption and income 1515

Hausman, J. A., & Taylor, W. E. (1983). Identification in linear simultaneous equations models with covariance restrictions: Aninstrumental variables interpretation. Econometrica, 51(5), 1527–1549. doi:10.2307/1912288
Hunt, J. (2008). The contrasting distributional effects of police and judicial bribery (Working Paper). Montreal: McGillUniversity.
Hunt, J. (2010). Bribery in health care in Uganda. Journal of Health Economics, 29(5), 699–707. doi:10.1016/j.jhealeco.2010.06.004
Hunt, J., & Laszlo, S. (2012). Is bribery really regressive? Bribery’s costs, benefits, and mechanisms. World Development, 40(2),355–372. doi:10.1016/j.worlddev.2011.06.001
Iqbal, K., & Roy, P. (2014). Examining the impact of climate change on migration through the agricultural channel: Evidencefrom district level panel data from Bangladesh (Working Paper No. 84-14). Kathmandu: South Asian Network forDevelopment and Environmental Economics (SANDEE).
Jain, A. K. (2001). Corruption: A review. Journal of Economic Surveys, 15(1), 71–121. doi:10.1111/1467-6419.00133Jayachandran, S. (2006). Selling labor low: Wage responses to productivity shocks in developing countries. Journal of Political
Economy, 114(3), 538–575. doi:10.1086/503579Kameir, E., & Kursany, I. (1985). Corruption as the “fifth” factor of production in the Sudan (Research Report No. 72).
Uppsala: Scandinavian Institute of African Studies.Khan, M. H. (2004). Power, property rights and the issue of land reform: A general case illustrated with reference to Bangladesh.
Journal of Agrarian Change, 4(1–2), 73–106. doi:10.1111/j.1471-0366.2004.00073.xKhandker, S. R., & Mahmud, W. (2012). Seasonal hunger and public policies evidence from northwest Bangladesh. Washington,
DC: World Bank.Kotowski, M. H., & Li, F. (2014). On the continuous equilibria of affiliated-value, all-pay auctions with private budget
constraints. Games and Economic Behavior, 85, 84–108. doi:10.1016/j.geb.2014.01.014Miguel, E., Satyanath, S., & Sergenti, E. (2004). Economic shocks and civil conflict: An instrumental variables approach.
Journal of Political Economy, 112(4), 725–753. doi:10.1086/421174Mocan, N. (2008). What determines corruption? International evidence from microdata. Economic Inquiry, 46(4), 493–510.
doi:10.1111/j.1465-7295.2007.00107.xOlken, B. A., & Barron, P. (2009). The simple economics of extortion: Evidence from trucking in Aceh. Journal of Political
Economy, 117(3), 417–452. doi:10.1086/599707Olken, B. A., & Pande, R. (2012). Corruption in developing countries. Annual Review of Economics, 4, 479–509. doi:10.1146/
annurev-economics-080511-110917Paxson, C. H. (1992). Using weather variability to estimate the response of savings to transitory income in Thailand. American
Economic Review, 82(1), 15–33.Rahman, S., & Rahman, M. (2009). Impact of land fragmentation and resource ownership on productivity and efficiency: The
case of rice producers in Bangladesh. Land Use Policy, 26(1), 95–103. doi:10.1016/j.landusepol.2008.01.003Razafindrakoto, M., & Roubaud, F. (2010). Are international databases on corruption reliable? A comparison of expert opinion
surveys and household surveys in Sub-Saharan Africa. World Development, 38(8), 1057–1069. doi:10.1016/j.worlddev.2010.02.004
Sarap, K. (1995). Land sale transactions in an Indian village: Theories and evidence. Indian Economic Review, 30(2), 223–240.Sarsons, H. (2012). Rainfall, rupees and riots: Testing rainfall as an instrumental variable (Working paper). Vancouver:
University of British Columbia.Sulemana, I. (2015). An empirical investigation of the relationship between social capital and subjective well-being in Ghana.
Journal of Happiness Studies, 16(5), 1299–1321. doi:10.1007/s10902-014-9565-9Svensson, J. (2003). Who must pay bribes and how much? Evidence from a cross section of firms. The Quarterly Journal of
Economics, 118(1), 207–230. doi:10.1162/00335530360535180Transparency International (TI). (2003). Household survey Nepal. Kathmandu: Transparency International.Transparency International (TI). (2005a, April). Household survey Bangladesh. Dhaka: Transparency International Bangladesh.Transparency International (TI). (2005b, August). India corruption study 2005. New Delhi: Transparency International India.Transparency International (TI). (2013). The global corruption barometer 2013. Berlin: Transparency International.Transparency International (TI). (2015). Land management and services in Bangladesh: Governance challenges and way-
forward. Dhaka: Transparency International Bangladesh.Ullah, M. (1996). Land, livelihood and change in rural Bangladesh. Dhaka: University Press Ltd.Uslaner, E. M. (2008). Corruption, inequality, and the rule of law: The bulging pocket makes the easy life. Cambridge, UK:
Cambridge University Press.Voors, M. J., Bulte, E. H., & Damania, R. (2011). Income shocks and corruption in Africa: Does a virtuous cycle exist? Journal
of African Economies, 20(3), 395–418. doi:10.1093/jae/ejr011Wooldridge, J. M. (2010). Econometric analysis of cross section and panel data (2nd ed.). Cambridge, MA: MIT Press.You, J.-S., & Khagram, S. (2005). A comparative study of inequality and corruption. American Sociological Review, 70(1), 136–
157. doi:10.1177/000312240507000107
1516 A. Islam & W.-S. Lee