Embed Size (px)
Citation preview

•
•
U.S. Department of Justice Office of Justice Programs Bureau of Justice Statistics
Bureau of Justice Statistics Fiscal Year 1994 Program Plan
June 1994, NCJ-148138
U.S. Department of Justice National Institute of Justice
148138
This document has been reproduced exactly as received from the person or organization originating it. Points of view or opinions stated In this document are those of the authors and do not necessarily represent the official position or pOlicies of the National Institute of Justice.
Permission to reproduce this • ,; Is" d material has been granted by Public Domain/OJP/BJS U.S. Department of Justice
to the National Criminal Justice Reference Service (NCJRS),
Further reproduction outside of the NCJRS system requires permission of the~ owner •
L __ ~~_~ -~ ---------------~----'

--~--------------------------------------------
This Bureau of Justice Statistics report was prepared under the supervision of Lawrence A. Greenfeld. Maureen Henneberg wrote the report. Tom Hester and Yvonne Boston edited and produced it.
BJS staff are grateful to everyone who participates in our surveys: • the households who are interviewed in the National Crime Victimization Survey (NCVS) • the Federal, State, and local law enforcement, courts, and corrections personnel who take time from their schedules to answer our questionnaires, submit data tapes, or participate in data collection efforts • the inmates who are interviewed at sampled correctional institutions • the staff at State Statistical Analysis Centers • the staff of criminal history record repositories o the staff of the Bureau of the Census who conduct numerous interviews for our surveys.
ii Bureau of Justice Statistics
•
•
•
•
Contents
Message from the director v
BJS overview vi National Crime Victimization Survey 1 National Law Enforcement and Pretrial Statistics 3
Law Enforcement Management and Administrative Statistics 3 National Pretrial Reporting Program 5
National Prosecution and Adjudication Statistics 6 National Prosecutor Survey Program 6 National Judicial Reporting Program 8
National corrections statistics 10 Census of Probation and Parole Agencies 11 National Jail Census 12 Census of State Prisons 13 Survey of Jail Inmates 14
Annual corrections statistics 19 National Prisoner Statistics 19 National Corrections Reporting Program 20 Capital punishment 20 Annual Jail Sample Survey 21 National Probation and Parole Reporting Program
Federal Justice Statistics Program 22 Justice Expenditure and Employment 23 Criminal Records Data Quality Program 24
Justice Inf.ormation Policy Assistance Program 25
1994 initiatives 26 Leading Indicators Crime Information System 26 Firearms, Crime, and Criminal Justice 27 Intentional Injury Statistical Series 28 Survey of Adults on Probation 29 Firearms Inquiries Statistical System 31
State Statistical Analysis Centers 33 Distributing BJS statistics 36
Using BJS data 38
See page 15 for a chart
ofBJS statistical coverage
21
Fiscal Year 1994 Program Plan iii
__ ~~_~ __ ~ _________ ~ ____ ~ __ ~ ________________ _._J

•
•
The Bureau of Justice Statistics continues year after year to bring critical information to bear on crimina/justice issues that challenge the American society.
This report summarizes our activities for Fiscal Year 1994 partly by presenting pivotal findings that only BJS can provide. BJS reports count and describe the 34 million criminal victimizations that occur annually and the activities and operations of the 50,000 offices, agencies, and institutions that comprise the U.S. criminal justice system:
• The rate of victimization by offenders armed with a handgun hit a 20-year high in 1992, while the overall rate from rape, robbery, and aggravated assault was below the 1981 high. • Adults in jail, in State or Federal prison, or on probation or parole account for 3% of white men, 15% of black men, and 2% of all adults in the United States. • Drug offenders were 7% of persons entering State prison in 1980 but 30% of those entering in 1992. The number of violent offenders entering prison climbed from 63,000 to 95,000. • The average sentence to State prison for a violent felony is almost 10 years, of which the inmate is likely to serve about 4.
• Residents in cities of 1 million or larger pay on average $144 per person to operate their police departments - over 50% more than residents of cities or towns of less than 100,000.
A growing number of policymakers, journalists, and citizens discovers that BJS information, presented objectively and without jargon, permits complete comparisons across time and topics. As this program plan indicates, BJS will continue to serve the full range of requests for current criminal justice data while expanding to close gaps - as with the new Survey of Adults on Probation.
We accomplish this work almost solely within BJS and provide a limited grant program primarily funding State statistical and criminal justice agencies.
Lawrence A. Greenfeld Acting Director
Fiscal Year 1994 Program Plan v
L__ __________ _
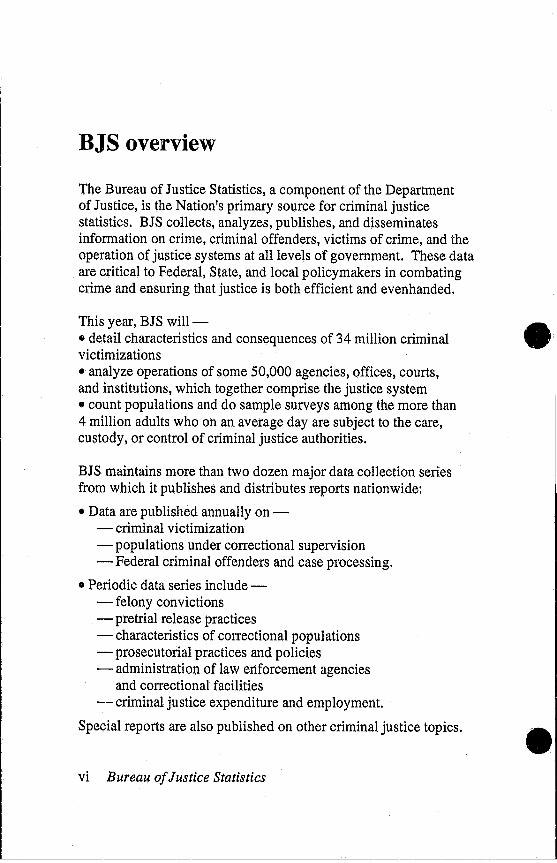
BJS overview
The Bureau of Justice Statistics, a component of the Department of Justice, is the Nation's primary source for criminal justice statistics. BJS collects, analyzes, publishes, and disseminates information on crime, criminal offenders, victims of crime, and the operation of justice systems at all levels of government. These data are critical to Federal, State, and local policymakers in combating crime and ensuring that justice is both efficient and evenhanded.
This year, BJS will-o detail characteristics and consequences of 34 million criminal victimizations • analyze operations of some 50,000 agencies, offices, courts, and institutions, which together comprise the justice system • count populations and do sample surveys among the more than 4 million adults who on an average day are subject to the care, custody, or control of criminal justice authorities.
BJS maintains more than two dozen major data collection series from which it publishes and distributes reports nationwide:
• Data are published annually on -- criminal victimization - populations under correctional supervision - Federal criminal offenders and case processing.
• Periodic data series include -- felony convictions - pretrial release practices - characteristics of correctional populations - prosecutorial practices and policies - administration of law enforcement agencies
and correctional facilities - criminal justice expenditure and employment.
Special reports are also published on other criminal justice topics .
vi Bureau of Justice Statistics
•
•
•
•
Data collection is coordinated with other Department of Justice statistical programs, such as the Uniform Crime Reporting program and the National Incident-Based Reporting System of the FBI. The BJS Federal Justice Statistics Program collects data from other Federal agencies, including the Executive Office for U.S. Attorneys, the Administrative Office of the U.S. Courts, the U.S. Sentencing Commission, and the Federal Bureau of Prisons.
BJS offers technical and financial support to agencies responsible for statistical activities in each State. We also administer the Criminal Records Data Quality Program, which supports nationwide improvement and sharing of criminal history records and information .
Fiscal Year 1994 Program Plan vii

Bureau of Justice Statistics BJS Statistical Coverage
Case or offender based information
National Crime Victimization Survey (NCVS)
National lncidentBased R!lllorting System (NIBRS)
Offender-Based Transaction Statistics (OBTS)
National Pretrial Reporting Program (NPRP)
~lational Judicial Reporting Program (NJRP)
Administrative statistics
Crime committed
BJS Dissemination programs
I
Criminal History Record Systems Statistics
Law Enforcement Management and Administrative Statistics (LEMAS)
Federal Justice Statistics
National Prosecutors Survey
Stlte Court Organization Project
Justice Expenditure and Employment Survey
u.s. Department of Justice Office of Justice Programs
National Prisoner Statistics (NPS) National Conections
Reporting Program (NCRP) Annual Jail Survey Survey of State Prison Inmates Survey of Jaillrimates
Capital Punishment
Annual Probaticm and Parole Surveys
Survey of Adults on Probation
I ~susofprObatiOn I and Parole Agencies
Census of State and Federal Prisons
Census of Jails
• Bureau of Justice Statistics Clearinghouse
Drugs & Crime Data Center & Clearinghouse Criminal Ju. ta
National Arc.· f Criminal Justice Information Systems Clearinghouse
Computerized Index to Data Sources
•
•
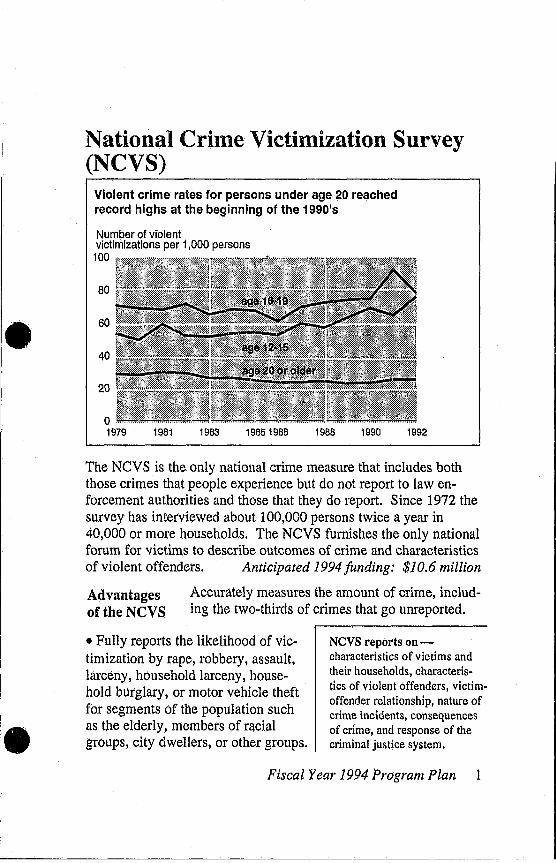
National Crime Victimization Survey (NCVS)
Violent crime rates for persons under age 20 reached record highs at the beginning of the 1990's
Number of violent victimizations per 1,000 persons
100
80
60
40
20
o· 1979 1981 1983 19851986 1988 1990 1992
The NCVS is the only national crime measure that includes both those crimes that people experience but do not report to law enforcement authorities and those that they do report. Since 1972 the survey has interviewed about 100,000 persons twice a year in 40,000 or more households. The NCVS furnishes the only national forum for victims to describe outcomes of crime and characteristics of violent offenders. Anticipated 1994 funding: $10.6 million
Advantages of the NCVS
Accurately measures the amount of crime, including the two-thirds of crimes that go unreported.
• Fully reports the likelihood of victimization by rape, robbery, assault, larceny, household larceny, household burglary, or motor vehicle theft for segments of the population such as the elderly, members of racial groups, city dwellers, or other groups.
NCVS reports oncharacteristics of victims and their households, characteristics of violent offenders, victimoffender relationship. nature of crime incidents, consequences of crime, and response of the criminal justice system.
Fiscal Year 1994 Program Plan 1

• Provides legislators and policymakers facts for informed decisions. Congress has used NCVS information in preparing the recent Violence Against Women Act, the Safe School Act, and the Violent Crime Control and Law Enforcement Act. • Provides researchers sufficient data to make meaningful analyses. For example, does calling the police in a domestic dispute reduce future abuse? NCVS data indicate that calling is effective.
• Contributes accurate, measurable information to the public discussion of crime and crime control.
New The NCVS just completed its lO-year redesign advances program. The screening procedure begun in July • for NCVS 1993 will yield better estimates of rape, sexual ,
assault, and family violence.
Information from the new questionnaire will be published for the first time in fall 1994. The improved measurement methods are expected to indicate substantially higher crime rates.
NCVS will analyze some findings according to the size and type of city where victims live rather than according to one urban category.
In 1994 BJS will study whether an increasing average age has masked certain crime trends. In the last few years crime rates have risen sharply for younger persons, while overall rates have fallen. We will be asking, "What would the crime rate be if today's age structure were that of 1973?"
BJS will explore adding new items on fear of crime, victim risk factors, and school crime, to meet new information demands while holding spending constant. BJS will also seek to cosponsor survey supplemrTlts with interested Federal agencies willing to share costs.
2 Bureau of Justice Statistics
In 1994 NCVS data will appear inCrimillal Victimization 1993 Crime and the Nation's Households, 1993 Response of Law Enforcement to Crime Violence Against Womell Violent Crime Elderly Crime Victim
New BJS series, Crime Data Briefs Carjacking Costs of Crime to Victims Guns and Crime •

•
• I
l __
National Law Enforcement and Pretrial Statistics
Expenditure and employment for local police departments In the United States, 1990
Population ~
1,000,000 or more 500,000-999,999 250,000-499,999 100,000-249,999 50,000-99,999 25,000-49,999 10,000-24,999 2,500·9,999 Under 2,500
Number of agencies
14 29 42
137 344 702
1,672 4,095 5,253
Number of full-time officers
74,775 36,163 30,862 37,330 40,651 40,342 47,640 40,515 14,722
Annual operating expenditure Per Per Per agency officer resident
$334,542,000 79,567,700 46,500,000 16,268,000 6,528,000 3,225,000 1,513,000
442,000 115,000
$62,600 63,400 62,600 59,600 54,400 55,200 51,600 39,800 31,500
$144 114 128 108 95 93 96 85 95
Law Enforcement Management and Administrative Statistics (LEMAS) LEMAS provides descriptive data on State and local law enforcement agencies. The survey is conducted every 3 years, collecting data from over 3,000 agencies, including all those that employ 100 or more sworn officers and a nationally representative sample of smaller agencies. Traditionally, LEMAS has produced a response rate of more than 94%, making it the Nation's foremost source of comprehensive data on law enforcement agencies. Anticipated 1994 funding: $145,000
Information acquired
Organization and administration of police and sheriffs' departments: agency responsibilities, operating expenditures, job functions of sworn
and civilian employees, officer salaries and special pay, demographic characteristics of officers, weapons and armor policies, education and training requirements, computer usage, vehicles, special units, drug enforcement activities, and employee drug testing policies .
Fiscal Year 1994 Program Plan 3

New advances forLEMAS
To provide an updated sampling frame for use with the 1993 LEMAS survey, a complete census of all State and local law enforcement agencies was completed in 1992. The data from this census
and the 1990 LEMAS survey were used to develop the President's Police Hiring Supplement program administered by the Bureau of Justice Assistance.
• The 1993 LEMAS survey will provide data on the complaint review policies and procedures of the Nation's law enforcement agencies .
• LEMAS data for agencies employing 100 or more officers can be downloaded from the electronic bulletin board of SEARCH Group, • Inc., and plans are under way to make LEMAS data available . on the IACP NET, an information resource for police chiefs and sheriffs.
Advantages ofLEMAS
Surveys a nationally representative sample of law enforcement agencies, providing a wide array of management and administrative statistics on agencies of all sizes.
• Tracks developments in the law enforcement field, such as the transition from revolvers to semiautomatic sidearms and the progression from basic to expanded 911 systems.
• Accounts for new technology, such as mobile digital computers and Automated Fingerprint Identification Systems.
e Provides data on the number and characteristics of sworn and civilian law enforcement employees and the operating costs of law enforcement agencies nationwide.
• Provides legislators and policymakers with facts for informed budgetary and policy decisions.
4 Bureau of Justice Statistics
1994 LEMAS reports -State and Local Police Departments, 1993 Sheriffs' Departments, 1993 Police Departments in Large Cities, 1987-93 Law Enforcement Management and
Administrative Statistics, 1993: Data for Individual State and Local Agencies with 100 or More Officers
Drug Enforcement by Police and Sheriffs' Departments, 1993 •

•
•
National Pretrial Reporting Program (NPRP)
Defendants detained until case disposition were more likely to have a prior criminal history than those placed on pretrial release
Percent of felony defendants
100% I 80% I 60% I 40% I 20% I
0% Prior arrest Prior Prior felony Prior violent
conviction conViction felony conviction
_ Released
Source: 1990 National Pretrial Reporting Program.
NPRP collects data on the pretrial status of persons charged with felonies in 40 jurisdictions representative of the 75 largest counties. These counties account for about half the serious crime nationwide. The next NPRP will track arrestees that enter local court systems during May 1994 until disposition of their cases or for a maximum of 12 months. Anticipated 1994 funding: $427,790
Information acquired
Felony arrest offense, demographic characteristics, prior criminal record, type of pretrial release, failure
to appear in court, rearrests while on pretrial release, adjudication outcome, and sentence type and length.
1994 NPRP reports -Pretrial Release of Felony
Defendants, 1992 Felony Defendants in Large
Urban Counties, 1992
Fiscal Year 1994 Program Plan 5
-- ---- ~---------------------------'

National Prosecution and Adjudication Statistics
National Prosecutor Survey Program (NPSP)
This biennial series collects data on the resources, policies, and practices of local prosecutors from a nationally representative sample of 290 chief litigating prosecutors in State court systems. Factors analyzed by NPSP directly influence the Nation·s response to crime. No additional funding required in FY 1994
New advances for NPSP
The most recent NPSP found prosecutors across the Nation responding to new challenges.
• Prosecutors devote increased attention to victims; many offices now maintain victim/witness assistance programs and routinely notify victims and witnesses of relevant case developments, including disposition decisions.
• About a third of pros-ecutors. offices had Cases closed and convictions obtained
per prosecutor's office and per attorney, July 1, 1991·June 30, 1992 special units to address
issues like drugs, asset seizure or forfeiture, juvenile offenders, child abuse, or sex crimes.
• At least three-fourths of prosecutors· offices had used videotapes
Median number of cases Misde-
Cases closed per-Prosecutor's office 840 Attorney' 233
Convictions per-Prosecutor's office 584 Attorney' 185
203 50
139 39
477 157
400 118
or polygraph tests • l' I . Note: Felony cases were those In which a felony was III Ie ony prosecutIOn, charged. Cases closed Included convictions. Convlc-and a fourth had used tlons for cases charged as felonies Included both
• felonies and misdemeanors. DNA eVIdence. "InclUdes chief prosecutors and all other prosecuting
attorneys on staff. • Prosecutors responded L--______________ .....J
to new State criminal
6 Bureau of Justice Statistics
•
•

•
• 1 ___ _
---------- -----
statutes. Based on statutes enacted in the previous 3 years, about half of the offices prosecuted cases addressing newly defined crimes related to such problems as drugs, child abuse, stalking, and hate crimes.
Advantages of NPSP
Trend data from this series allow analysis of how key criminal justice variables change in response to new prosecutorial policies and practices .
• Operations data from prosecutors' offices allow policymakers to analyze patterns in criminal justice systems. For example, how much impact does workload or method of case assignment have on case processing time or sentencing outcome? Does the means by which cases are normally filed (indictment versus information) have any impact? Analyses of NPSP data are useful in criminal justice planning and evaluation .
• NPSP data allow prosecutors to compare their operations with national averages. For example, is the workload of a particular office above or below the national average? How does a particular prosecutor's position on plea negotiations, method of case assignment, or use of criminal history data compare to the national picture? What types of services to victims are in general use?
Findings The survey reported new information on the risks associated with being a criminal prosecutor. In more
than a quarter of prosecutors' offices at least one staff member had experienced a work-related threat or assault during the year, and more than a third took special precautions for employee safety, such as authorizing firearms for staff or using metal detectors.
Prosecutors' offices were found to be generally small but very activein 1992, the median office had 7 staff members, including 3 prosecuting attorneys, and closed about 200 felony cases and nearly 500 misdemeanor cases, with an overall conviction rate of about 85%.
NPSP reports on -staffing patterns, methods of assigning cases, security issues, policies on plea negotiation, use of grand juries, problems associated with criminal history information, sentencing guidelines, and court organization! capacity/workload.
Fiscal Year 1994 Program Plan 7

National Judicial Reporting Program (NJRP)
In 1990 violent offenders received an average sentence to prison of about 10 years but were likely to serve about 4 years before release
Most serious conviction offense
Violent
Property .
Drugs.
Weapons:
Other
o 30
••••••••• Sentence Estimated time to be served
60 Months
90 120
NJRP, conducted every 2 years, surveys a nationwide sample of felony trial courts in 300 counties, collecting detailed information on demographic characteristics of felons, conviction offenses, type of sentences, sentence lengths, and amount of time from arrest to conviction and sentencing. Anticipated 1994 funding: $250,000
Information Felony sentencing in State courts (offenses, acquired sentence types, and sentence lengths), demo-
graphic characteristics of convicted felons, felons sentenced to probation, and felony case processing (conviction types and time to disposal).
Advantages ofNJRP
The NJRP database describes operations of the criminal justice system as it changes so that decisionmakers can determine what programs
and policies are needed and whether those adopted appear to be working.
8 Bureau of Justice Statistics
----_._--------- .. _-----
•
•

•
They can evaluate questions such as-- Is enough use made of incarceration versus probation
in cases of young offenders committing violent crimes? - What kinds of sentences are given to older offenders? - Is probation frequently combined with a jail term? - Are female offenders more likely than male offenders
to be sentenced to jail rather than to prison? - Are sentences to confinement long in cases of property
crime relative to cases of violent crime? - What are the sentences resulting from pleas versus trials?
• Using NJRP data, policymakers have better information to determine what policies and practices are responsible for historic changes in felony conviction rates and sentences .
• The program is a unique source of national estimates of the number of felony convictions; data on conviction offenses, sentences imposed, and types of proceedings used; and demographic information about felons. Prior to NJRP's establishment as a core statistical series in 1986, no national data existed on convicted felons and the courts' decision process before disposition.
Findings From 1986 to 1990 the number of felony convictions increased 42%, from about 583,000 to more than
829,000. About 92,000 additional felony drug trafficking offenders were sentenced in 1990 than in 1986, accounting for about 37% of the total increase during the 4-year period.
BJS is currently collecting and analyzing data on judicial sentencing practices for persons convicted of a felony in State courts during 1992.
1994 NJRP reportsFelony Sentencing in State
Courts. 1992 National Judicial Reporting
Program. 1992
Fiscal Year 1994 Program Plan 9
National corrections statistics
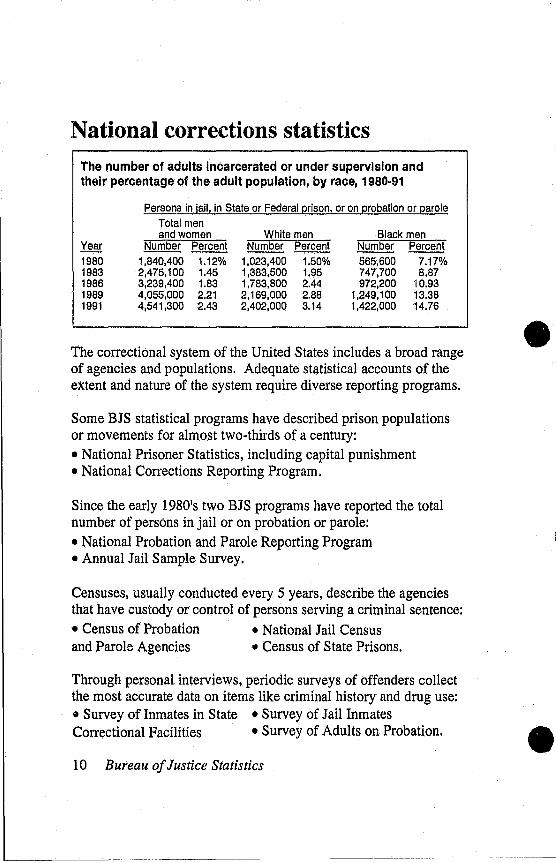
The l1umber of adults incarcerated or under supervision and their percentage of the adult population, by race, 1980-91
Persons In lail, In State or Federal prison, or on probation or parole Total men and women White men Black men
Year Number Percent Number Percent Number Percent 1980 1,840,400 1.12% 1,023,400 1.50% 565,600 7.17% 1983 2,475,100 1.45 1,383,500 1.95 747,700 8.87 1986 3,239,400 1.83 1,783,800 2.44 972,200 10.93 1989 4,055,000 2.21 2,169,000 2.88 1,249,100 13.38 1991 4,541,300 2.43 2,402,000 3.14 1,422,000 14.76
The correctional system of the United States includes a broad range of agencies and populations. Adequate statistical accounts of the extent and nature of the system require diverse reporting programs.
Some BJS statistical programs have described prison populations or movements for almost two-thirds of a century:
• National Prisoner Statistics, including capital punishment • National Corrections Reporting Program.
Since the early 1980's two BJS programs have reported the total number of persons in jail or on probation or parole:
• National Probation and Parole Reporting Program • Annual Jail Sample Survey.
Censuses, usually conducted every 5 years, describe the agencies that have custody or control of persons serving a criminal sentence:
• Census of Probation • National Jail Census and Parole Agencies • Census of State Prisons.
Through personal interviews, periodic surveys of offenders collect the most accurate data on items like criminal history and drug use: • Survey of Inmates in State • Survey of Jail Inmates Correctional Facilities • Survey of Adults on Probation.
10 Bureau of Justice Statistics
•
•

•
•
Census of Probation and Parole Agencies
This recently completed census will provide the first full description of the Nation's community supervision agencies. All types of agencies, whether administered by the State, county, city, court, or other jurisdiction, participated. Persons under either informal or formal supervision were counted. The census also furnishes the sampling frame for the upcoming national Survey of Adults on Probation described among the 1994 initiatives.
Information acquired
No additional funding required in FY 1994
Agency staffing and expenditures, caseload size and classification, AIDS awareness, weapons for staff, types and amounts of fees collected, the
contribution of the fees to the total budget, and drug testing and treatment for offenders and staff.
Advantages of the census
Although at yearend 1991 the Nation's probation and parole agencies supervised about three~fourths of all persons serving a court sentence, the census represents the first comprehensive national description of supervision policies .
• From the census findings, legislators and administrators will have empirical measures that can guide planning, allocation of resources, and evaluation.
New advances
Juveniles on probation comprised over a 10th of the population under supervision. The census affords the first nationwide profile of the agencies responsible for supervision of juvenile offenders .
Fiscal Year 1994 Program Plan 11
National lail Census
This census of the Nation's 3,341 local jails and 7 Federal detention centers is conducted every 5-6 years. It furnishes the sampling frame for the Survey of Jail Inmates described later.
Anticipated 1994 funding: $328,000
Information Number of inmates in each facility, admissions acquired and releases, court orders, programs that offer
alternatives to incarceration, amount charged to hold an inmate for other jurisdictions (including
the separate Federal law enforcement agencies), use of space and crowding, staffing, health care (including the prevalence of HIV/AIDS and tuberculosis), and drug testing policies and practices.
Advantages of the National Jail Census
Many issues that the jail census touches are also important outside of corrections. For example, health and safety concerns - smoking in the facility, negative-airflow or medical isolation rooms, and testing for tuberculosis _.- have consequences beyond the jail walls.
• The reporting of the census permits administrators, State legislators, and city or county governing boards to compare jail facilities and programs using a broad set of criteria. The comparisons may be made with neighboring jurisdictions or with jurisdictions of similar size and description across the Nation.
• Jails function as the central node in the correctional system, holding arrestees awaiting trial, convicted felons awaiting transfer to State prison, and persons serving a sentence to jail.
• The census information on issues like population density, expenditure, staff characteristics, and plans for building or renovation can help the user to understand the size and quality of locally operated correctional housing.
12 Bureau of Justice Statistics
•
•

,---------------------------... --
•
•
Census of State Prisons
This census, conducted every 5-6 years, will have a redesigned questionnaire in 1995. Covered by the census will be confinement and community-based facilities and private facilities under exclu-sive State contract. Anticipated 1994 funding; $50,000
Information acquired
Types of inmates housed, facility age and type, security level, court orders, programs, health and safety conditions, confinement space, employment, and operating costs .
The number and percentage of admissions to State prison from new convictions for drugs increased from1980 to 1992
Number of State prison Inmates entering with a new sentence
120,000
90,000
0=· llili 1980 1985 1990 1992.
50%
40%
0%
Percent of entering State Inmates
Fiscal Year 1994 Program Plan 13

II
Survey of Jail Inmates
The survey relies on personal interviews with a nationally representative sample of almost 6,000 inmates. Conducted three times since 1974, this set of interviews will be the first BJS survey administered with laptop computers. BJS is revising the questionnaire and the edit specifications in 1994, projecting a pretest and completion of the survey in 1995.
Information acquired
Advantages of the Survey of Jail Inmates
Anticipated 1994 funding: $550,000
Personal and family characteristics of jail inmates, past drug and alcohol use, history of physical abuse, and history of contact with the criminal justice system.
The local jail inmate population includes persons who belong to all parts of the criminal justice continuum - those awaiting trial, those sentenced to jail and serving their sentence, and those sentenced to prison and awaiting transfer. The survey will provide a current understanding
of the criminal histories and patterns of alcohol and drug abuse of the offenders who are incarcerated .
• The data from this survey will be archived with those of the new survey of probationers and with the results of the previous surveys of local jail inmates, of State prison inmates, and of Federal inmates. Criminal justice researchers will have immediately accessible the world's most comprehensive information about adult offenders - national in scope, covering more than 20 years of changes, and including every segment of the correctional population.
14 Bureau of Justice Statistics
Past surveys of jail inmates have served as sources for-Profile of Jail Inmates, 1989 Drunk Driving (1989) Survey of Inmates of Local Jails Women in Jail. 1989 Drugs and Jail Inmates Profile of Jail Inmates, 1978 Drunk Driving (1978)
•
•

r-------------------------
•
•
Bureau of Justice Statistics Statistical Coverage
Fiscal Year 1994 Program Plan 15

Bureau of Justice Statistics BJS Statistical Coverage
Case or offender based information
Administrative statistics
National Crime Victimization Survey (NCVS)
National IncidentBased Reporting System (NIBRS)
Offender-Bas .. Statistics (0.
Nationai Pretrial Reporting Program (NPRP)
Crime committed
11 ~ , I' I:' . '1' • • '_ •• ,
Criminal History Record Systems Statistics
Law Enforcement Management and Administrative Statistics (LEMAS)
Federal
Indictment T
National Prosecutors Survey
Guilt
Ju
BJS Dissemination programs • Bureau of Justice Statistics Clearinghouse
Drugs & Crime Data Center Clearinghouse
nsaction
National Judicial Reporting Program (NJRP)
..,s
a
Conviction and sentencing
e Court -anizatlon . ject
-. Expenditure and loyment Survey
Ie
U.S. Department of Justice Office of Justice Programs
National Prisoner Statistics (NPS) National Corrections
Reporting Program (NCRP) Annual Jail Survey Survey of State Prison Inmates Survey of Jail Inmates
Capital Punishment
Annual Probation and Parole Surveys
Survey of Adults on Probation
l---+--L---_Ca Jtal punishment
Incarceration Jail Parole I Prisoln
Probation Revocation
~ I Census of Probation and Parole Agencies
Census of State and Federal Prisons
Census of Jails
National Archive of Criminal Justice Data
Criminal Justice Information Systems Clearinghouse
Computerized Index to Data Sources

•
• l
Annual corrections statistics
In 1994 a variety of Bulletins, Special Reports, tomes or reference books, and press releases will present findings from National Prisoner Statistics (including a capital punishment series), National Corrections Reporting Program, Annual Jail Sample Survey, and National Probation and Parole Reporting Program.
Advantages of the annual collection series
Anticipated 1994 funding: $1,055,560
BJS data underscore the growth in jail and prison inmate populations and the pressure this growth places on States and local communities. These series document a changing offense composition of persons serving sentences, as well as variations among jurisdictions in correctional resources.
Such data enable States and localities to compare themselves to similar or contiguous jurisdictions and to the national profile.
National Prisoner Statistics (NPS)
This series produces annual and midyear national and State-level counts of prisoners in State and Federal prison facilities. NPS data, collected three times a year, belong to a series that began in 1927. Prison incarceration rates by State population and by reported serious crimes are usually based on NPS.
Information acquired
Findings
Number of prisoners by sex, race, and Hispanic origin; categories of admissions and releases; capacity estimates; and number of inmates held in local jails because of crowding elsewhere.
At midyear 1993 the number of men and women in State and Federal prison reached a record 925,247, a 5% increase from December 1992. For all SO States
and the District of Columbia, there were 316 sentenced prisoners per 100,000 residents.
Fiscal Year 1994 Program Plan 19

National Corrections Reporting Program (NCRP)
NCRP collects individual-level data on persons admitted to and released from prison and on parole entries and discharges in participating jurisdictions. The program covers about 90% of State prisoner movements nationwide each year.
Information acquired
For the four movements described in NCRP: sex, race, Hispanic origin, age, offense, sentence
length, minimum time to be served, credited jail time, type of admission, type of release, and time served.
Advantages of NCRP
Only NCRP includes enough States to compute a national estimate
of time served on prison sentences. Presented by offense, time served, including credited time in jail, can be accurately compared to sentence imposed. Dura
National Corrections Reporting Program, 1992
tion of parole supervision and time to revocation of parole can also be calculated.
Capital punishment
This series within NPS provides annual national and State-level data on persons sentenced to death, on persons whose capital sentence was removed, and on those executed. Prisons report on every inmate with a death sentence. In addition, each State attorney general's office reports on legislative changes or developments in case law affecting the death penalty in that State.
Information acquired since 1973
Demographic characteristics, criminal histories, criminal justice system status at the time of the capital offense, amount of time under sentence of death, and method of execution.
20 Bureau ojJustice Statistics
•
•

•
•
Annual Jail Sample Survey
Inquiring about the number of inmates on June 30 of each year, this survey includes every large jail jurisdiction in the United States and a sample of smaller jurisdictions.
Information acquired
Number of prisoners by sex, race, and whether an adult or juvenile; conviction status; average daily population; and for larger jurisdictions - court
orders relating to the operation of the facility, the number of inmates held for other authorities, inmate deaths, and inmate parti~ cipation in boot camps, work release, alternatives to incarceration, education, treatment of drug or alcohol addiction, and drug testing.
Findings Between 1987 and 1992, jail populations nationwide increased about 180% from 158,394 to 444,584. In 1978 jails operated at about 65% of rated capacity;
in 1992, at 99% of rated capacity.
National Probation and Parole Reporting Program
This series gathers annual data from Federal, State, and local probation and parole agencies.
Information acquired
Number of persons under supervision and entering and leaving supervision; types of sentences, offenses, entries, and exits; sex, race,
and Hispanic origin of persons under supervision; and intensive supervision and electronic monitoring.
Advantages of the program
Policymakers depend on this annual information to evaluate punishment policy and to estimate the staffing needs and costs of maintaining parole and probation. Among the 4.5 million adults being
incarcerated or supervised by correctional agencies, three~quarters live in the community.
Fiscal Year 1994 Program Plan 21

Federal Justice Statistics Program (FJSP)
FJSP provides annual data on workload, activities, and outcomes associated with Federal criminal cases.
Anticipated 1994 funding: $850,000
Information All aspects of processing in the Federal justice acquired system, including the number of persons prose-
cuted, convicted, incarcerated, sentenced to probation, released pretrial, and under parole or other supervision; initial prosecution decisions, referrals to magistrates, court disposi- • tions, sentencing outcomes, sentence length, and time served.
Before BJS created FJSP, annual and trend data tracing trans-Advantages actions across all components of the Federal ofFJSP justice system were unavailable. The agencies
did not agree on criminal offense classifications and counting periods. FJSP applies uniform crime categories, presenting data both nationally and by judicial district. The program collects data from the Executive Office for U.S. Attorneys, the Pretrial Services Agency, the Administrative Office of the U.S. Courts, the U.S. Sentencing Commission, and the Federal Bureau of Prisons .
• FJSP makes possible analysis of the flow of cases across the system and comparison with State transactions. Trends within a locality and among jurisdictions are accessible. The program allows for special studies addressing issues of particular interest, such as the impact of race on Federal sentencing.
1994 FJSP reports-Compendium of Federal Justice Statistics,
1991 Federal Criminal Case Processing,
1983-92, with Preliminary Data for 1993 Prosecuting Criminal Enterprises Pretrial Release of Federal Felony
Defendants Federal Justice Statistics Program, 1990 Federal Drug Case Processing, 1985-91,
with Preliminary Data for 1992 Sentencing in the Federal Courts: Does
Race Matter?
22 Bureau of Justice Statistics •
•
•
Justice Expenditure and Employment
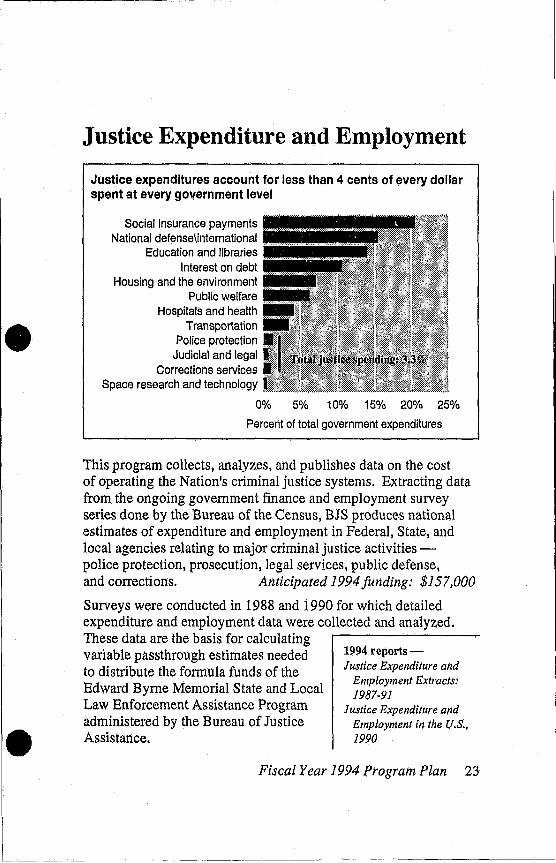
Justice expenditures account for less than 4 cents of every dollar spent at every government level
Social Insurance payments National defense\international
Education and libraries ... .. Interest on debt
Housing and the environment . Public welfare
Hospitals and health . Transportation
Police protection Judicial and legal
Corrections services Space research and technology
0% 5% 10% 15% 20% 25%
Percent of total government expenditures
This program collects, analyzes, and publishes data on the cost of operating the Nation's criminal justice systems. Extracting data from the ongoing government finance and employment survey series done by the Bureau of the Census, BJS produces national estimates of expenditure and employment in Federal, State, and local agencies relating to major criminal justice activities -police protection, prosecution, legal services, public defense, and corrections. Anticipated 1994 funding: $157,000
Surveys were conducted in 1988 and 1990 for which detailed expenditure and employment data were collected and analyzed. These data are the basis for calculating variable passthrough estimates needed to distribute the formula funds of the Edward Byrne Memorial State and Local Law Enforcement Assistance Program administered by the Bureau of Justice Assistance.
1994 reports -Justice Expenditure and
Employment Extracts: 1987-91
Justice Expenditure and Employment in the U.S., 1990
Fiscal Year 1994 Program Plan 23
··-1

Criminal Records Data Quality Program
Brady Handgun Violence Prevention Act
Effective February 28, 1994, the Brady Act established as-day waiting period for the purchase of a handgun, and a national instant background check system to identify felons who are prohibited by Federal law from purchasing firearms. To assist States in automating or improving their criminal history record systems, the act authorizes up to $200 million in Federal grants to be administered by BJS beginning in FY 1995.
The Brady Act and the National Child Protection Act of 1993 (Child Protection Act) both require the U.S. Attorney General to investigate each State's record system. She is to determine a timetable by which each can provide on-line records of felony convictions and histories of child abuse to the national criminal record background check system. The Attorney General has identified the FBI's Interstate Identification Index as the national background check system for both purposes.
BJS has been assigned responsibility for development of the timetable and has awarded a grant to SEARCH Group, Inc., to conduct a survey of criminal history record systems by State. BJS and SEARCH will work closely with staff at criminal history record repositories in each State to develop timetables for participation in the national system.
After the survey, the timetable will be used to establish criteria for State grants if funds are appropriated to support the criminal record upgrade grants under Brady and the Child Protection Act.
The Brady grants will build upon improvements of criminal history records under current and prior initiatives. In Fiscal Year 1993 BJS completed distribution of funds to all 50 States, the District of Columbia, and 2 territories under the Criminal History Record Improvement (CHRI) program, a $27 million multiyear effort funded by the Bureau of Justice Assistance and administered by
•
BJS. The CHRI program funded systemic improvements in quality •
24 Bureau of Justice Statistics

•
• I i I
I
and timeliness of State criminal history record information nationwide, with particular emphasis on disposition reporting.
Justice Information Policy Assistance Program
BJS also administers the Justice Information Policy Assistance Program, which supports surveys, studies, conferences, and technical assistance relating to data quality and the improvement of criminal justice records. Anticipated 1994 funding: $425,000
The activities of the National Task Force on Increasing the Utility of the Criminal History Record, sponsored by BJS, will continue. The task force is reviewing sufficiency and utility of data stored in criminal history records and examining the feasibility of developing common rap sheet formats among States. It may also propose strategies for implementing the formats.
SEARCH, the grantee under this program, will prepare a report for BJS, analyzing policy implications of providing on-line access to criminal history record information for users outside the criminal justice system. BJS will continue working with the FBI to establish procedures for interstate exchange of criminal history records for purposes such as firearm presale background checks.
BJS will also continue to provide technical assistance to Federal, State, and local agencies that need accurate, up-to-date information on a variety of criminal justice information law and policy issues .
In 1994 BJS will publish a comprehensive reportUse and Management of
Criminal History Record Information -
It will report on -Laws and policies New technologies Interstate Identification Index Federal initiatives and
legislation
Fiscal Year 1994 Program Plan 25
L ______ _

1994 initiatives
Leading Indicators Crime Information System (LICINS)
Attorney General Janet Reno requested BJS to develop a summary of indicators to measure emerging crime trends. LICINS will supplement existing statistical series, providing more useful, immediate information for combating crime, particularly violent crime.
These are major features of LICINS information:
Immediate
Geographically inclusive
Wherever possible, the reporting will have a 6-month reference period.
BJS and the staff of the FBI's Uniform Crime Reporting program selected 19 cities, towns, or counties that reliably report to the UCR program. Washington, D.C., was added at
the request of the Attorney General, who has proposed using the District as a demonstration site for programs to stem violent crime.
Varied in type The system will compile data from four tracks:
• statistics from BJS, the FBI, and the National Institute of Justice describing reported crime, police resources, and drug activity
• contextual information from a questionnaire completed by the FBI, the Drug Enforcement Administration, the Bureau of Alcohol, Tobacco and Firearms, and by local law enforcement officials, identifying major or emerging crime problems
• interpretations by State Statistical Analysis Centers of local contextual and statistical information
• information from other Federal departments or agencies on issues like health, housing, education, and employment.
26 Bureau of Justice Statistics
•
•

•
Firearms, Crime, and Criminal Justice
This comprehensive report on guns, crime, and the response of the criminal justice system will present information and statistics in a nontechnical format. With research and writing now under way, the report will cover issues related to firearms and crime, exclusive of suicide and accidents.
These are the topics to be addressed:
• How many guns are there? Numbers of guns available, sold, produced, imported, exported, or seized
• Who has guns and why? Legal and illegal possession, law enforcement agencies, juveniles
• How often are guns used as crime protection? Justifiable homicide trends, what victims report
• How often do criminals use guns? Types of crime, 20-year trend of gun use in crime, most likely victims of gun crimes, injuries and deaths from crimes committed with guns
• Who uses guns to commit crimes? Characteristics of offenders using guns, weapons violations, response by justice system
• What are the sanctions for offenders using a gun? Mandatory minimum sentences, preventing gun purchases
Sources for Firearms, Crime, and Criminal Justice
BJS statistical series-
National Crime Victimization Survey Survey of State Prison Inmates, 1991 Survey of Jail Inmates, 1989 Law Enforcement Management
and Administrative Statistics, 1991 National Judicial Reporting Program Federal Justice Statistics Program Criminal Records Data Quality
Program
Other Federal sources-
FBI Bureau of Alcohol, Tobacco,
and Firearms Drug Enforcement Administration Centers for Disease Control and
Prevention
Fiscal Year 1994 Program Plan 27

Intentional Injury Statistical Series (IISS)
Federal, State, and local policymakers need reliable information to determine policy and establish efforts to combat family violence and child abuse. The estimated prevalence of family violence, particularly child abuse, varies widely. To meet this critical need, BJS is creating a statistical program to measure intentional injuries serious enough to end in a visit to a hospital emergency room.
The Consumer Product Safety Commission's (CPS C) National Electronic Injury Surveillance System (NEISS) takes a national sample of hospital emergency rooms for monitoring consumer • product-related injuries and deaths. BJS will annually collect and analyze data from the NEISS, expanded to collect data on all intentional or possibly intentional injuries in the sample. CPSC began collecting data at 31 hospitals in October 1993.
Advantages ofIISS
This is the first national annual data collection on family violence using standardized methods to develop statistics that can be compared on a
year-to-year basis. Although this new program will not measure all family violence and child abuse, it improves the measurement of these victimizations as recommended by the Task Force on Family Violence.
Findings During the first 3 months of collection, the hospitals
in the study sample have obtained information on 18,666 patients with injuries treated -• 1,853 (10%) coded as intentional • 222 (1 %) coded as possibly intentional.
28 Bureau of Justice Statistics
IISS reports on -for intentional injury (all incidents of violence where an individual other than the patient is involved): date of treatment, age, sex, race and marital status of victim, injury diagnosis, disposition of case, injury locale, age and sex of perpetrator, relationship of victim to perpetrator, alcohol/drug involvement in incident, and narrative description of circumstances of injury .
•

•
•
Survey of Adults on Probation
BJS, preparing for this first national survey of probationers representative of 2.5 million adults, is revising a questionnaire after an extensive pretest. The survey will be conducted in October 1994.
Anticipated 1994 funding: $650,000
For the first time in a national survey, a sample of the Nation's largest component of sentenced offenders - adults under probationary supervision in the community - will respond to indepth interviews. The only other national count for probation, the annual National Probation and Parole Reporting Program, is limited to each State's aggregate number under supervision at yearend. (See page 21 for a description.)
The survey will have two parts: a check of probation records and interviews. The interviews with 7,500 persons will provide data on the criminal histories, drug use histories, demographic characteristics, and offense composition of probation and parole populations. Because available agency records often omit criminal and drug-use histories, interviews are the best means to collect such information.
The survey will yield a national estimate of how many offenders sentenced to probation used drugs or alcohol at the time of their current offense and in the month preceding the offense. Generally, persons sentenced to probation have less extensive conviction histories. These data will describe the amount of crime that is drug related and whether there has been treatment or intervention dealing with the use of drugs or alcohol.
Why the probation population is important-
More than 2.6 million persons, about 1 of every 62 adults, are on probation.
They account for nearly two-thirds of all persons under the care, custody, or control of correctional agencies on anyone day.
Over the last decade the number of probationers has more than doubled, increasing as rapidly as the incarcerated popUlation.
Fiscal Year 1994 Program Plan 29
Meeting urgent needs for guiding national policies
The data about persons on probation have been largely piecemeal and local. However,
pressures on the capacities of jails and prisons throughout the United States, primarily because of increased vigilance against illegal drugs, have made supervision in the community a more important issue. To answer what role probation should have in criminal justice requires a coherent set of facts that this survey will be the first to give: • a thorough understanding of the backgrounds of offenders receiving probation • for violent offenders, a profile of victims • estimates of probationers I level of drug and alcohol use • a measurement of the amount of drug treatment available/used • an examination of the effects of early application of probation on recidivism and on seriousness of crimes • a description of how probation is applied with other sentence elements like incarceration, fines, and program participation.
Understanding the workings of this alternative to jail
Administered by States and localities, probation programs vary widely. To make correct
decisions, policymakers need to have a grasp of the frequency of contacts between sentenced offenders and probation officers and the nature of offender program participation. Effective determination of public safety and adequacy of monitoring rely on knowing the likelihood of probationers to violate the conditions of their release and the most common agency responses to violations.
30 Bureau of Justice Statistics
•
•

•
•
-------~--- ----
Firearms Inquiries Statistical System (FIST)
The handgun crime rate in 1992 reached a record level, while the rate for violent victimization remained below the 1981 high
Number of victimizations per 1,000 population 20
16
12
8
4
0 1979 1983 1988 1992
6.6 violent victimizations per 1,000 persons age 12 or older
handgun victimizations per 1,000
As Federal, State, and local agencies implement the Brady Act, a uniform statistical program is needed to collect information on the functioning of the background check system and on the response by law enforcement.
FIST would-• measure the number and types of criminal justice transactions relating to firearm purchases under Brady across all States, using data from the State criminal history repositories • measure similar transactions under other approval processes existing in States exempt from Brady • gather statistics from other Federal agencies -
- from the FBI, firearm record-check traffic - from the Bureau of Alcohol, Tobacco and Firearms,
followups related to denials of purchase and prosecution of gun dealers who fail to seek background checks .
Fiscal Year 1994 Program Plan 31

------------------------------------------------------
Repository data will focus on the following items, many of which may have to be obtained from chief law enforcement officers (CLEO's) within the State: Number of-• CLEO's in State • CLEO's requesting criminal history record checks because of handgun purchases • applications received • applications rejected and returned because of incomplete identification information • applications denied and reason for denial • denied applications referred for arrest or prosecution for wanted persons or misrepresentation of background • • persons apprehended by law enforcement agencies as a result of referrals.
FIST will also collect information on outcomes of detecting misrepresentations after the 5-day waiting period.
Data will be collected from the FBI on the use of the Interstate Identification Index system to conduct name checks of prospective purchasers. The FBI will be consulted to identify appropriate data elements. Data will also be collected on denials of purchase and subsequent investigations by ATF, with its input in defining data elements.
BJS staff will design and implement FIST by --• testing the questionnaire . • gaining Office of Management and Budget clearance • mailing questionnaires, monitoring returns, and following up nonresponses • entering and verifying data • analyzing and reporting results.
32 Bureau of Justice Statistics •

•
•
State Statistical Analysis Centers
Since 1972 BJS has helped States to establish and operate Statistical Analysis Centers to collect, analyze, and report statistics on crime and justice, sharing information nationally. Specifically authorized by statute (42 U.S.C. 3732), BJS assists in developing State and local justice information systems, giving primary emphasis to the problems of those jurisdictions (42 U.S.C. 3731). Currently 48 States, the District of Columbia, Puerto Rico, and the Northern Mariana Islands have SAC's .
Advantages of SAC's
The SAes form a resource network of information critical to the success of State and local projects to combat drugs and crime .
• Most activities combating drugs and crime take place at State and local levels. Fulfilling its charter, BJS collects, analyzes, publishes, and disseminates statistics on these activities and on crime. State and local governments in turn use BJS data to analyze policies, as well as to plan, operate, and evaluate their justice systems.
Recent SAC Colorado analyzed why offenders in halfway advances houses were failing and found that offenders
were more likely to fail after losing their jobs. A halfway house thereupon initiated a job development program to reduce such failures.
Illinois conducted a cost-benefit study showing that criminal justice expenditures and other hidden social costl> of a proposed land-based casino in Chicago had not been adequately considered. The legislature declined to pass the legislation.
Iowa conducted a study of State substance abuse programs and recommended improvements. The contractor providing the services terminated the contract, and the guidelines were used in selecting a new provider.
Fiscal Year 1994 Program Plan 33

Massachusetts collected and analyzed data on sentences for violations of gun laws. The SAC study found that mandatory sentences were being applied and that no additional legislation was needed.
Missouri conducted a study to determine what proportion of drivers arrested for speeding had radar detectors and whether the arrested drivers who had detectors were traveling faster than those who did not. Results of this study influenced the regulations of two Federal agencies: • The Federal Communications Commission now allows law enforcement agencies to use a wider variety of radar devices . • The Federal Highway Administration banned the use of radar detectors by interstate commercial vehicle drivers.
New Jersey examined the frequency of police pursuits. Results were used to revise the State·s police pursuit guidelines. A data collection form was also developed to monitor the frequency of pursuits.
Tennessee assessed the training, information, and computer needs of local police and sheriffs· departments. In response to the assessment, the Tennessee Bureau oflnvestigation provided training in several areas and is developing on-line databases to fill information gaps.
Texas developed a simulation model that could assess the consequences of legislative proposals on State prison crowding, giving legislators empirical information for debate.
Virginia conducted research on gun control. The findings contributed to the legislation limiting the number of handguns a person could buy in a month.
34 Bureau of Justice Statistics
•
•

•
State Statistical Analysis Centers Only SAC's, as defined by the Catalog ofF ederal Domestic Assistance, are eligible to apply for funds under the SAC assistance program. The SAC's work may be performed by other organizations, such as State agencies, universities, nonprofit research firms, and private consultants. If work might be performed outside of the SAC and the identity of the organization is known, the application must include the qualifications of those performing the work.
Selection criterw
BJS will be the sole judge of whether the SAC meets applicable requirements and whether it is operating satisfactorily. The criteria for review include: • organizational integrity and technical competence • experience of applicant's personnel in similar work • technical soundness and completeness of the proposed approach • appropriateness of the project schedule and budget • record of applicant's performance with previous awards in this program, including quality of work, completeness, and adherence to schedules.
A ward period: 1 year
BJS may, with the concurrence of the applicant, make some awards for longer or shorter periods. In such cases, the award amounts may be prorated. No-cost extensions may be granted by BJS for good cause. Extensions should be requested in writing at least 30 days before the scheduled expiration date. BJS will not approve any extension of more than 1 year beyond the original expiration date of the award.
Anticipated 1994 funding: $2,200,000
A ward amount
The annual award amount establishing a new SAC will depend on the scope of activities and will not exceed $150,000 ($75,000 in the 4th year). Annual basic funding for established SAC's will not exceed $50,000.
At the option of BJS, continuation funding for a SAC may be awarded either as a supplement to the existing cooperative agreement or as a new cooperative agreement. However, no single award will be allowed to have more than two supplements. After the second supplementary award (or after 3 years have elapsed since the start of the initial award, if occurring sooner), the next award will be made as a new cooperative agreement to permit the current project to be closed for auditing purposes.
Due date
Applications should be submitted to BJS at least 90 days before the requested starting date for the first award to a SAC or for continuation funding. For funding in FY 1994, applications should be received by BJS no later than May 31, 1994. 1f the application is received after May 31, the award may be deferred until the next fiscal year.
For more information, contact Linda Ruder, Program Manager, at (202) 514·9056.
Fiscal Year 1994 Program Plan 35

Distributing BJS statistics BJS publishes a continuum of distinctive products suited to various subjects and to the users' purposes: - tables with attached press releases - Crime Data Briefs - Selected Findings -Bulletins - Special Reports - Technical Reports - Discussion Papers - mini tomes (books bound with staples) - tomes and compendia (books with a spine) - Reports to the Nation - Sourcebook of Criminal Justice Statistics -CD-ROM's.
Each week, on average, a BJS publication appears. BJS reports containing information with a wide potential readership have an advance release and a summary for the media. The more technical publications are sent directly to users requesting reports in 11 specified categories. At the end of 1993, over 31,000 persons and organizations were on the BJS mailing list.
• BJS data collection and, reports depend upon wide cooperation. Often local or State agencies provide the original data to be analyzed; many agencies also rely on the results of the analysis for budget projections and assessments of program effectiveness. Some respondents report having structured their information programs around BJS statistical series because they will share definitions with other jurisdictions and have the benefits of appropriate comparisons.
36 Bureau of Justice Statistics
•
•
• I
• I~_-
Distribution services
BJS statisticians daily interpret published findings for persons who require more detailed explanations. In addition, many of the calls to BJS asking for reports are referred to the BJS Clearinghouse, operated as part of the National Criminal Justice Reference Service. Not including the electronic bulletin board contacts, in Fiscal Year 1993 statistics specialists -• distributed more than 350 BJS titles • responded to more than 14,000 telephone requests • answered more than 128,000 mail requests.
The clearinghouse represents BJS at professional conferences and meetings to distribute publications and to enroll on the mailing list persons who use the kind of information that BJS supplies.
The Drugs & Crime Data Center & Clearinghouse (DCDCC) meets policymakers' urgent need for current data about illegal drugs. The clearinghouse disseminates BJS and other Department of Justice documents. In Fiscal Year 1993 DCDCC-• distributed 76,711 BJS publications • responded to 1,862 mail requests • answered 6,507 telephone requests.
The National Archive of Criminal Justice Data at the Interuniversity Consortium of Political and Social Research (ICPSR), University of Michigan, stores and distributes BJS data. The data from most BJS statistical series - more than 300 individual data sets - are stored on computer cassette tapes. Last year the archive distributed 11,000 data sets on tapes, CD-ROM's, or diskettes.
The National Clearinghouse for Criminal Justice Information Systems operates an automated index of more than 1,000 criminal justice information systems of State and local governments, issues technical publications, provides technical assistance and training for State and local government officials, and operates the Criminal Justice Information System Bulletin Board .
Fiscal Year 1994 Program Plan 37

Using BJS data
In 1993 BJS distributed about 1.5 million copies of its reports. BJS analysts and the specialists at the clearinghouses sponsored by BJS responded to a myriad of individual queries for information. The National Archive of Criminal Justice Data, funded by BJS at the University of Michigan, sent researchers and organizations billions of bytes of computer data. Thousands of library patrons use the Sourcebook o/Criminal Justice Statistics to find the criminal justice facts they need for a speech, report, or letter.
Those responsible for determining or operating the criminal justice process -legislators and their staff, judges, police, and correctional officials-rank among the most frequent users of BJS statistics. The following • represents a sampling of BJS statistics used in administration and policymaking at all levels of government:
BJS data reguestor T~Qe of data PU!:Qose
U.S. Supreme Data on case Empirical evidence of the Court justice processing contention that the longer the
time to prosecute, the less the benefit to society
The White House Data on firearms Provide overview of crime and violent crime trends and of reports by victims
and inmates about gun-related issues
Maine Department National corrections Proposing a new reintegration of Corrections statistics program for State inmates
Pennsylvania National corrections Preparing testimony before Department statistics the General Assembly on of Corrections funding 7 new correctional
facilities
New York State Capital punishment Investigating the deterrent senator data effect of the death penalty
The White House Drunk driving Developing an aspect of the statistics health care reform bill
Member of Data on drugs Drafting legislation Congress and crime • 38 Bureau of Justice Statistics

Using BJS data (continued)
BJS data reguestor Tn~e of data PU!J2ose
The White House Date on victimiza- Providing information for a tion of the elderly conference
New Castle, Statistics on rape Investigating rapes Delaware, victimizations and in their jurisdiction Police victim-offender Department profiles
Project Woman Domestic violence Establishing a domestic of Ohio statistics violence support agency
Member of Data on child Seeking support for legislation Congress molestation regarding pedophilia
Hickory Rape Statistics on Opening a community Crisis Center, female rape crisis center North Carolina victimization
Office of the Data on Evaluating the New York pro-Deputy Mayor domestic grams for battered women, for Public Safety, violence comparing their programs New York with similar ones elsewhere
Moscow Interpol Data on law Reorganizing their police Office enforcement sala- departments, using U.S. city
ries in cities departments as models under 10,000
In stitu te for the Information Researching drug Study of Drug on drug law dependency in Europe Dependence, enforcement London, England
Scottish Office Data on suicide Developing a suicide of Home and prevention in prevention strategy for Health Department correctional settings the Scottish prison system
Chief Justice Information on Enhancing the statistical and two associate U.S. crime, the reporting program of justices of the criminal justice the Mexican court system Supreme Court system, and of Mexico statistical records
Fiscal Year 1994 Program Plan 39

-i • ,
••
• -, .11'
r
~.
A -.'
., II
i
• , r
I
f
I
, ,
.. r r
• r •