Embed Size (px)
Citation preview
Ending the Epidemic and Older Adults:Case Counts and Care Data
December 9, 2015
Daniel Gordon, PhD
Bureau of HIV/AIDS Epidemiology
AIDS Institute
NYSDOH
2
Today’s Presentation
• Newly Diagnosed Cases
• Persons Living with Diagnosed HIV Infection (PLWDHI)
• Population Projection (2032)
• Measures of Linkage and Retention
• Observations
3
New diagnoses
4
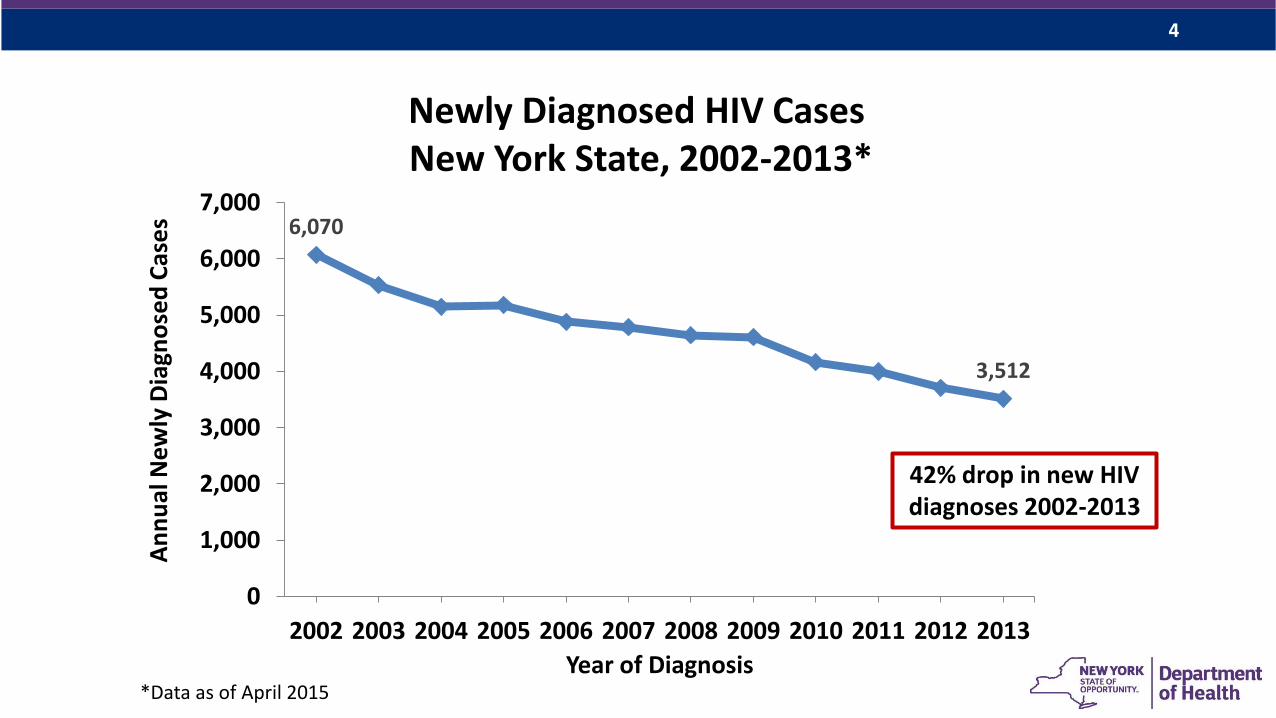
6,070
3,512
0
1,000
2,000
3,000
4,000
5,000
6,000
7,000
2002 2003 2004 2005 2006 2007 2008 2009 2010 2011 2012 2013
An
nu
al N
ewly
Dia
gno
sed
Cas
es
Year of Diagnosis
Newly Diagnosed HIV CasesNew York State, 2002-2013*
*Data as of April 2015
42% drop in new HIV diagnoses 2002-2013
5
0
500
1,000
1,500
2,000
2002 2004 2006 2008 2010 2012
Nu
mb
er
of
Cas
es
30-39
40-49
25-29
20-24
50-59
60+
13-19
12 & under
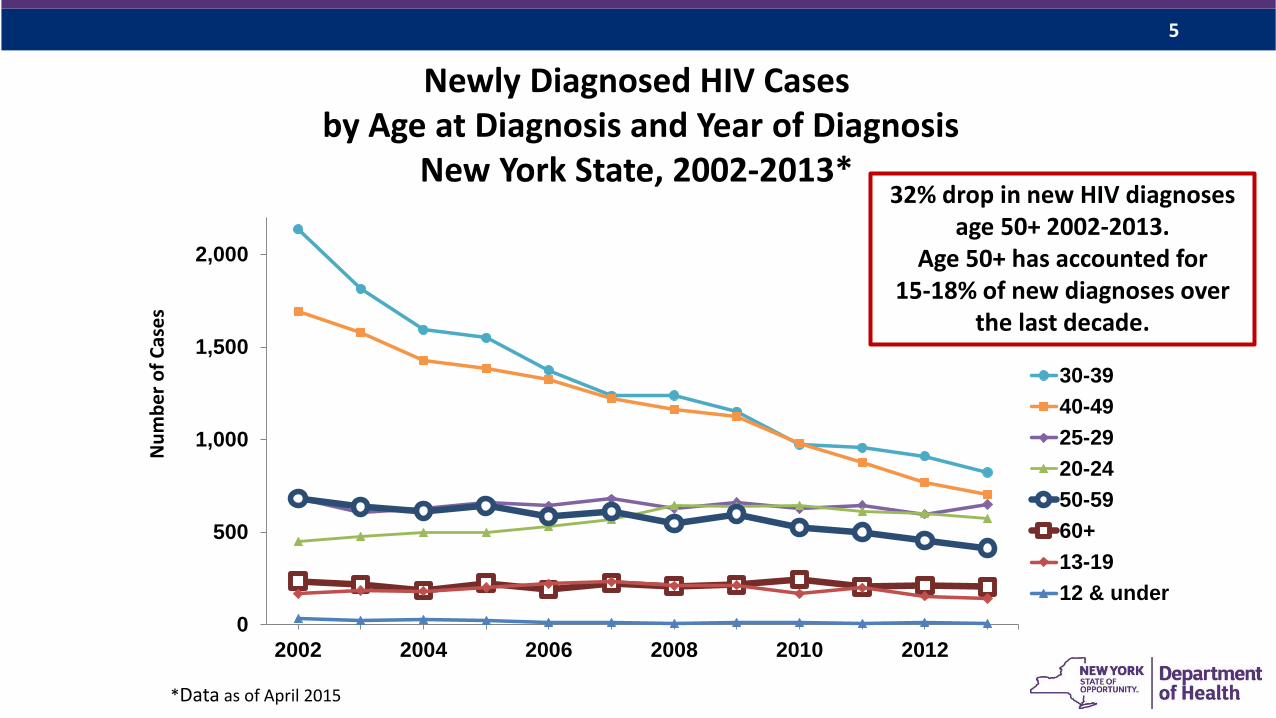
Newly Diagnosed HIV Casesby Age at Diagnosis and Year of Diagnosis
New York State, 2002-2013*
*Data as of April 2015
32% drop in new HIV diagnoses age 50+ 2002-2013.
Age 50+ has accounted for15-18% of new diagnoses over
the last decade.
6
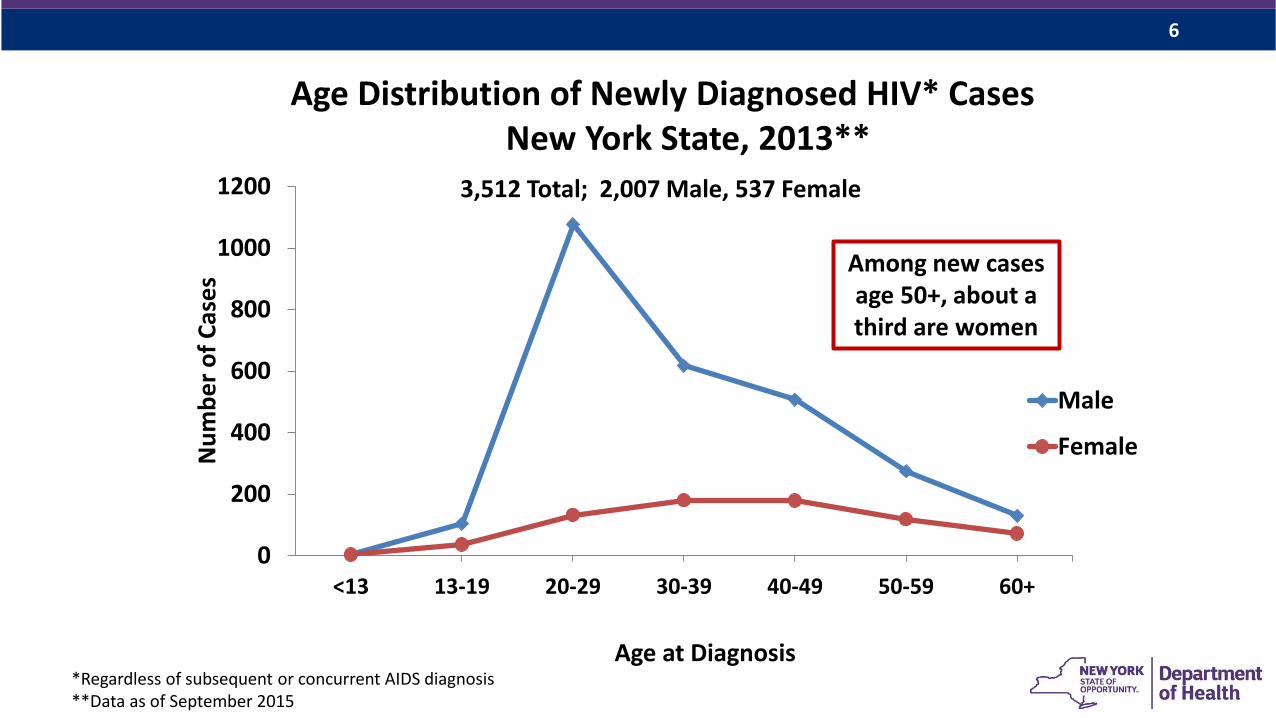
Age Distribution of Newly Diagnosed HIV* CasesNew York State, 2013**
0
200
400
600
800
1000
1200
<13 13-19 20-29 30-39 40-49 50-59 60+
Nu
mb
er
of
Cas
es
Age at Diagnosis
Male
Female
3,512 Total; 2,007 Male, 537 Female
*Regardless of subsequent or concurrent AIDS diagnosis**Data as of September 2015
Among new cases age 50+, about a third are women
7
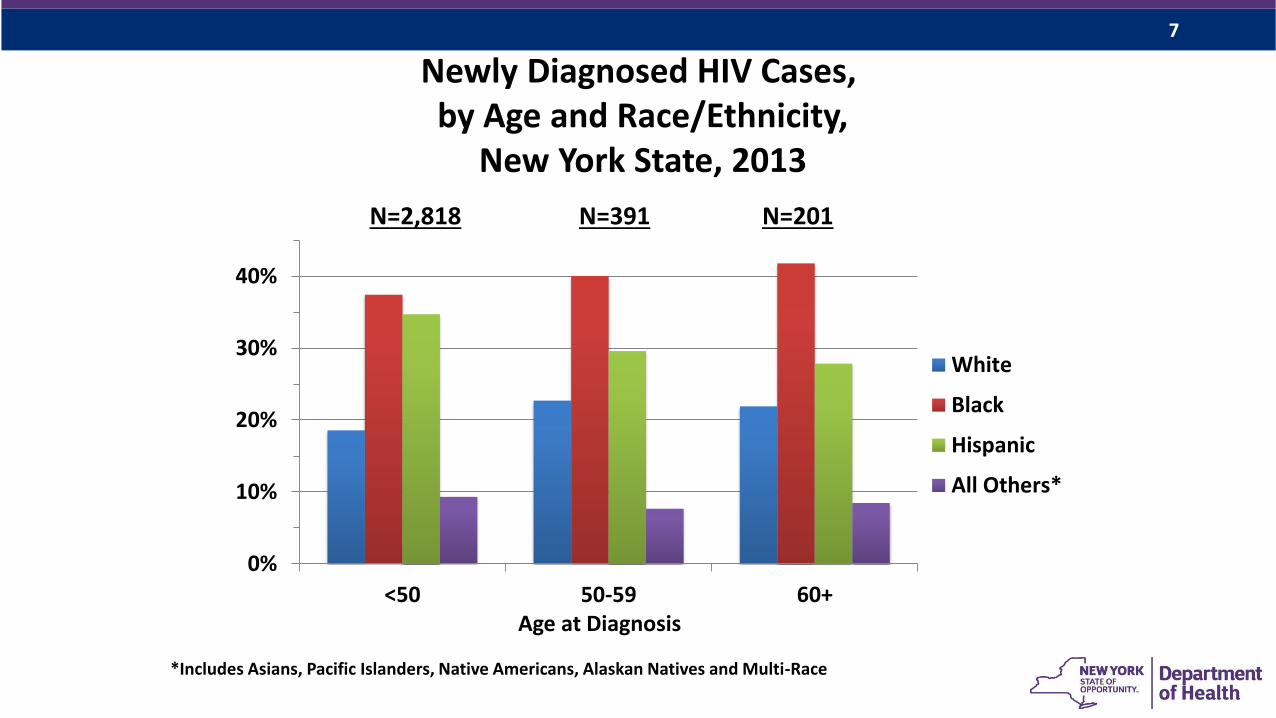
Newly Diagnosed HIV Cases,by Age and Race/Ethnicity,
New York State, 2013
0%
10%
20%
30%
40%
<50 50-59 60+Age at Diagnosis
White
Black
Hispanic
All Others*
N=2,818 N=391 N=201
*Includes Asians, Pacific Islanders, Native Americans, Alaskan Natives and Multi-Race
8
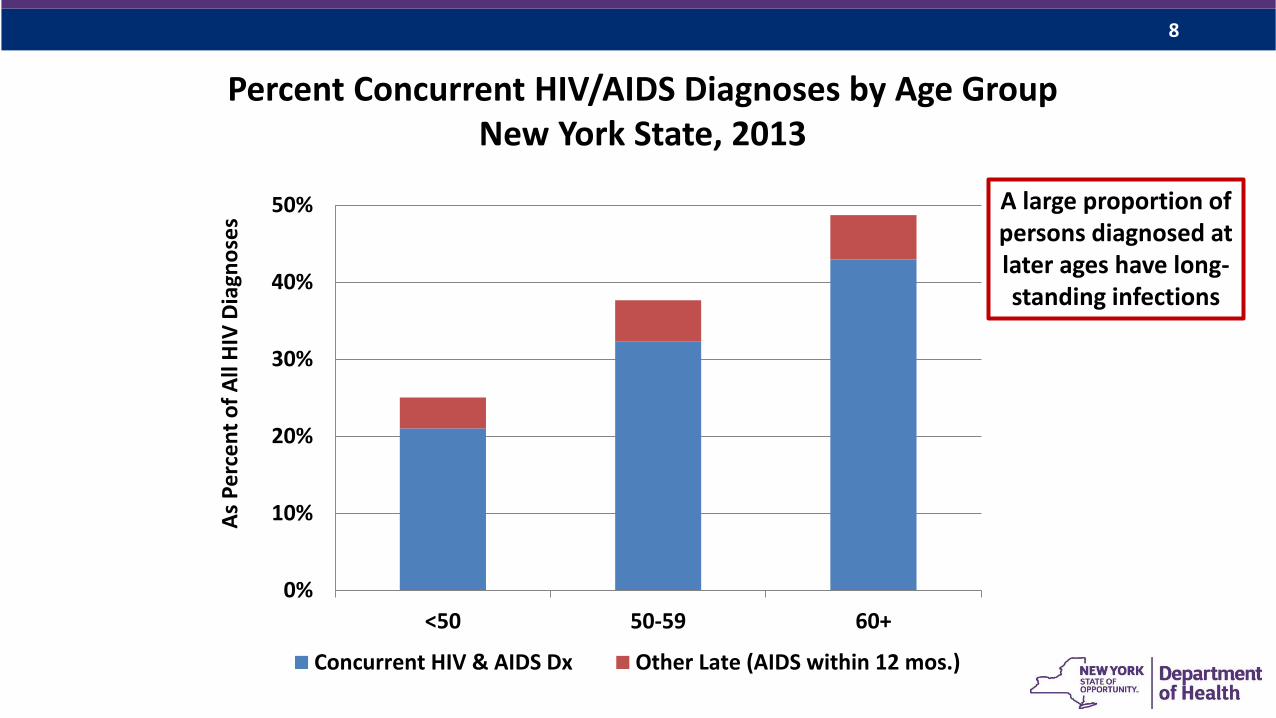
Percent Concurrent HIV/AIDS Diagnoses by Age GroupNew York State, 2013
0%
10%
20%
30%
40%
50%
<50 50-59 60+
As
Pe
rce
nt
of
All
HIV
Dia
gno
ses
Concurrent HIV & AIDS Dx Other Late (AIDS within 12 mos.)
A large proportion of persons diagnosed at later ages have long-standing infections
9
Persons Living with Diagnosed HIV Infection
10
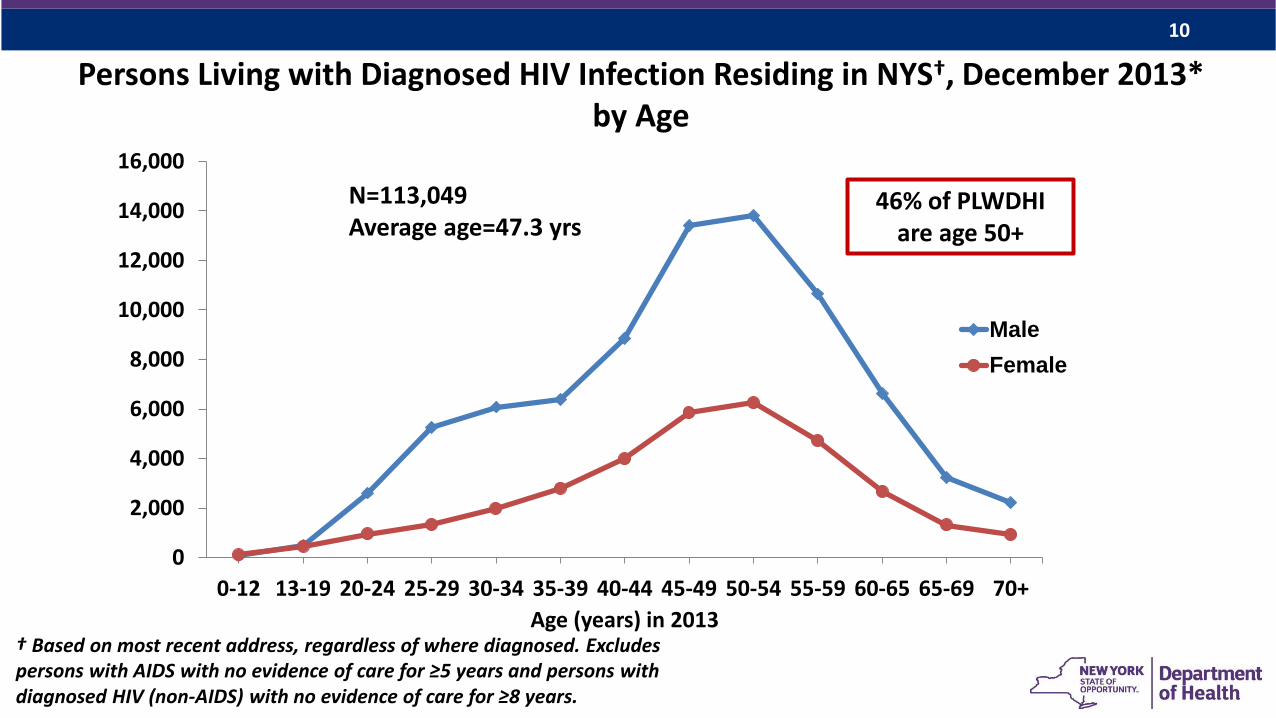
Persons Living with Diagnosed HIV Infection Residing in NYS†, December 2013*by Age
0
2,000
4,000
6,000
8,000
10,000
12,000
14,000
16,000
0-12 13-19 20-24 25-29 30-34 35-39 40-44 45-49 50-54 55-59 60-65 65-69 70+
Age (years) in 2013
Male
Female
N=113,049Average age=47.3 yrs
† Based on most recent address, regardless of where diagnosed. Excludes persons with AIDS with no evidence of care for ≥5 years and persons with diagnosed HIV (non-AIDS) with no evidence of care for ≥8 years.
46% of PLWDHI are age 50+
11
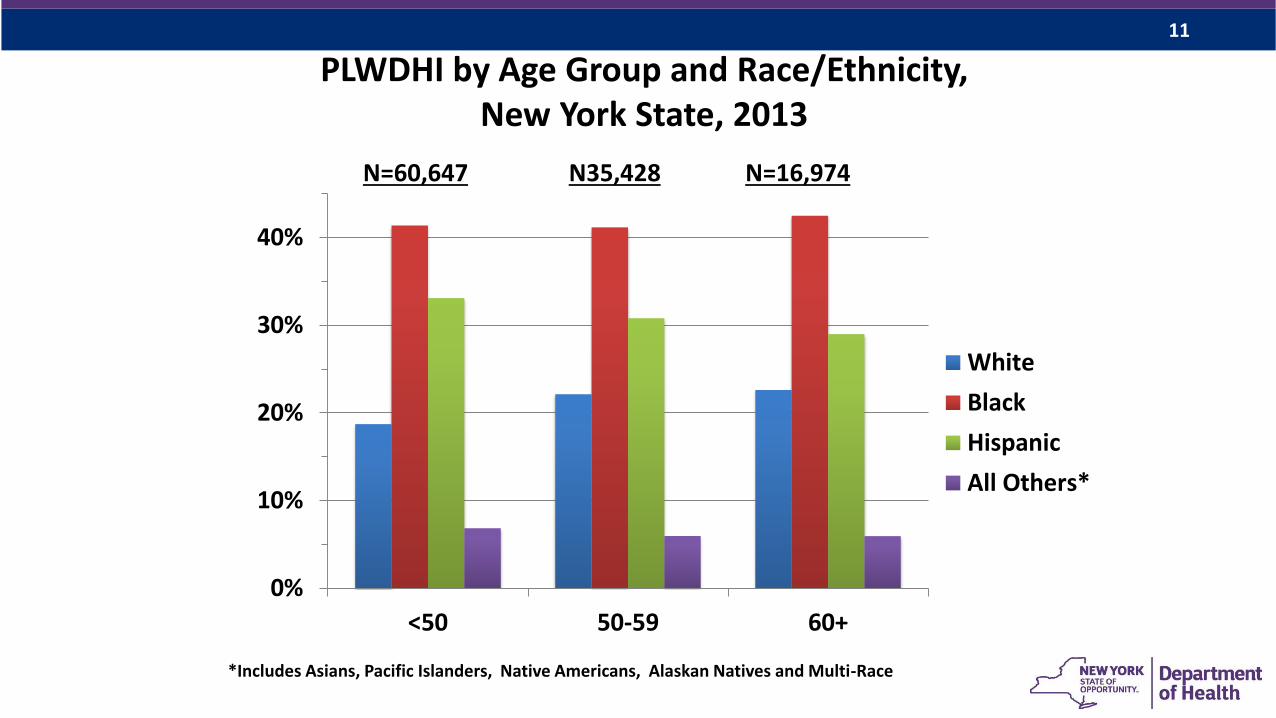
PLWDHI by Age Group and Race/Ethnicity,New York State, 2013
0%
10%
20%
30%
40%
<50 50-59 60+
White
Black
Hispanic
All Others*
N=60,647 N35,428 N=16,974
*Includes Asians, Pacific Islanders, Native Americans, Alaskan Natives and Multi-Race
12
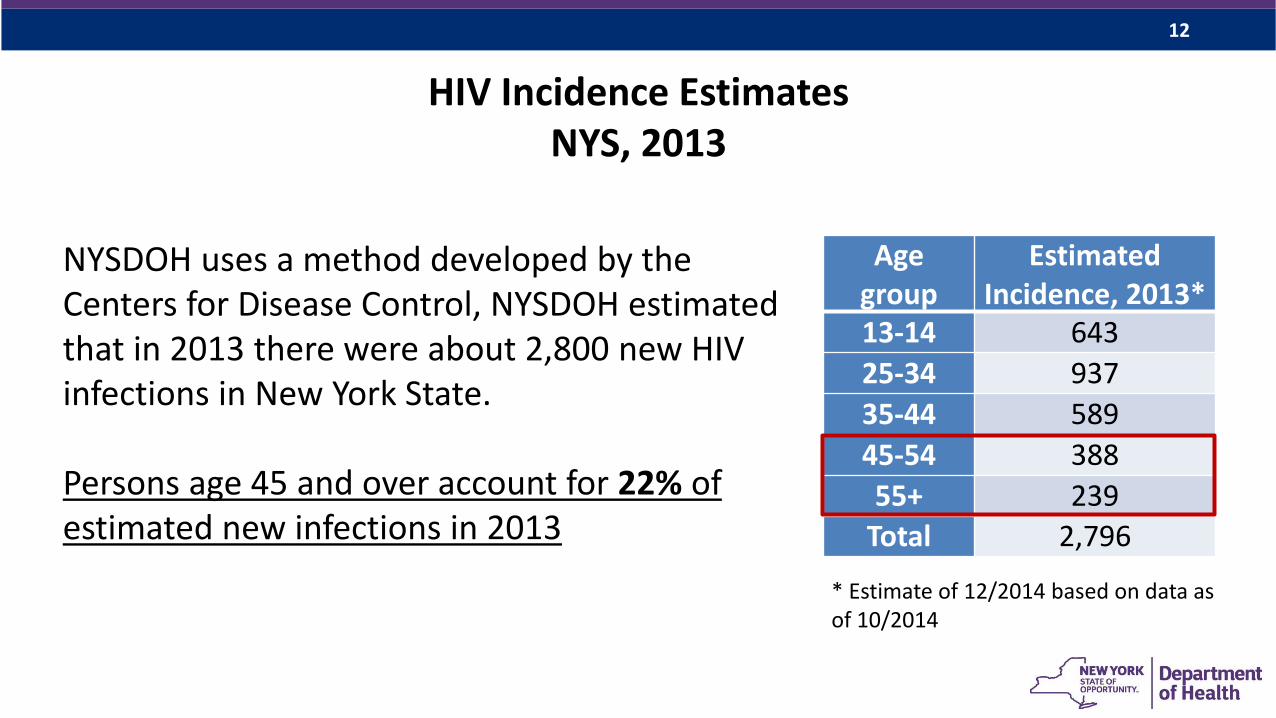
HIV Incidence EstimatesNYS, 2013
NYSDOH uses a method developed by the Centers for Disease Control, NYSDOH estimated that in 2013 there were about 2,800 new HIV infections in New York State.
Persons age 45 and over account for 22% of estimated new infections in 2013
Agegroup
Estimated Incidence, 2013*
13-14 643
25-34 937
35-44 589
45-54 388
55+ 239
Total 2,796
* Estimate of 12/2014 based on data as of 10/2014
13
Projection – PLWDH age 50+
14
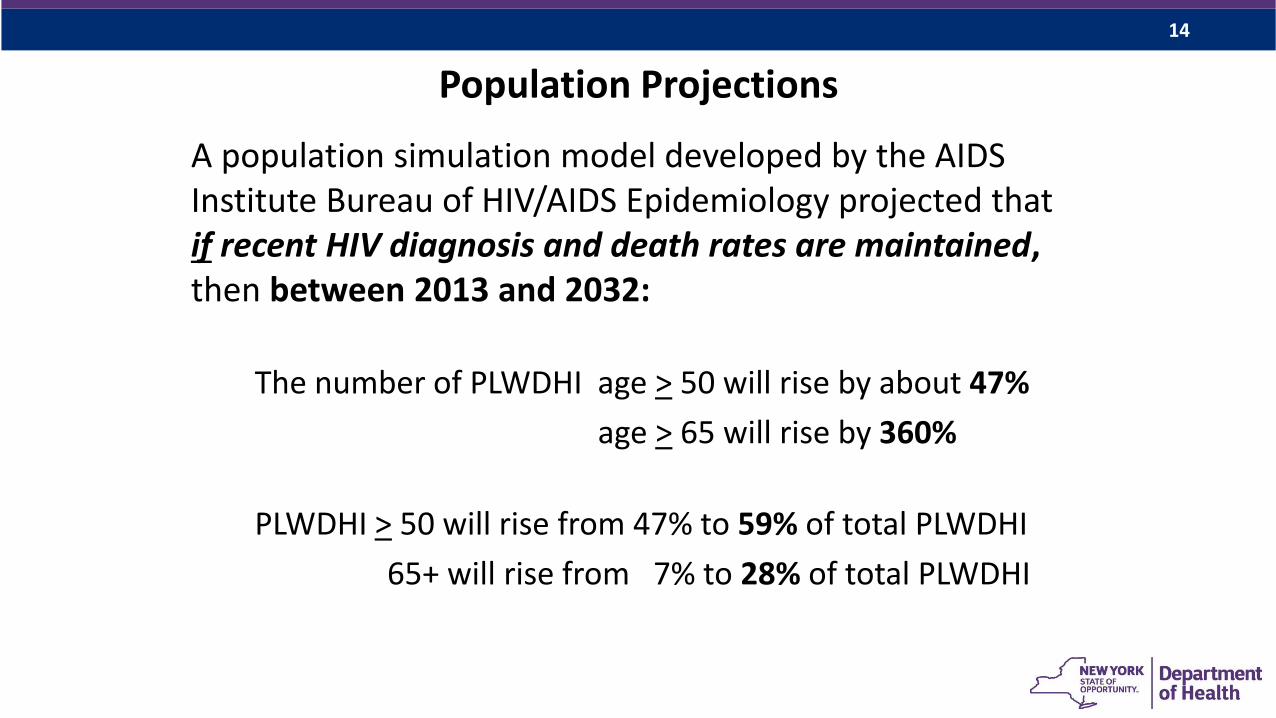
Population Projections
A population simulation model developed by the AIDS Institute Bureau of HIV/AIDS Epidemiology projected thatif recent HIV diagnosis and death rates are maintained, then between 2013 and 2032:
The number of PLWDHI age > 50 will rise by about 47%
age > 65 will rise by 360%
PLWDHI > 50 will rise from 47% to 59% of total PLWDHI
65+ will rise from 7% to 28% of total PLWDHI
15
Measures of Care
16
0%
20%
40%
60%
80%
<50 50-59 60+
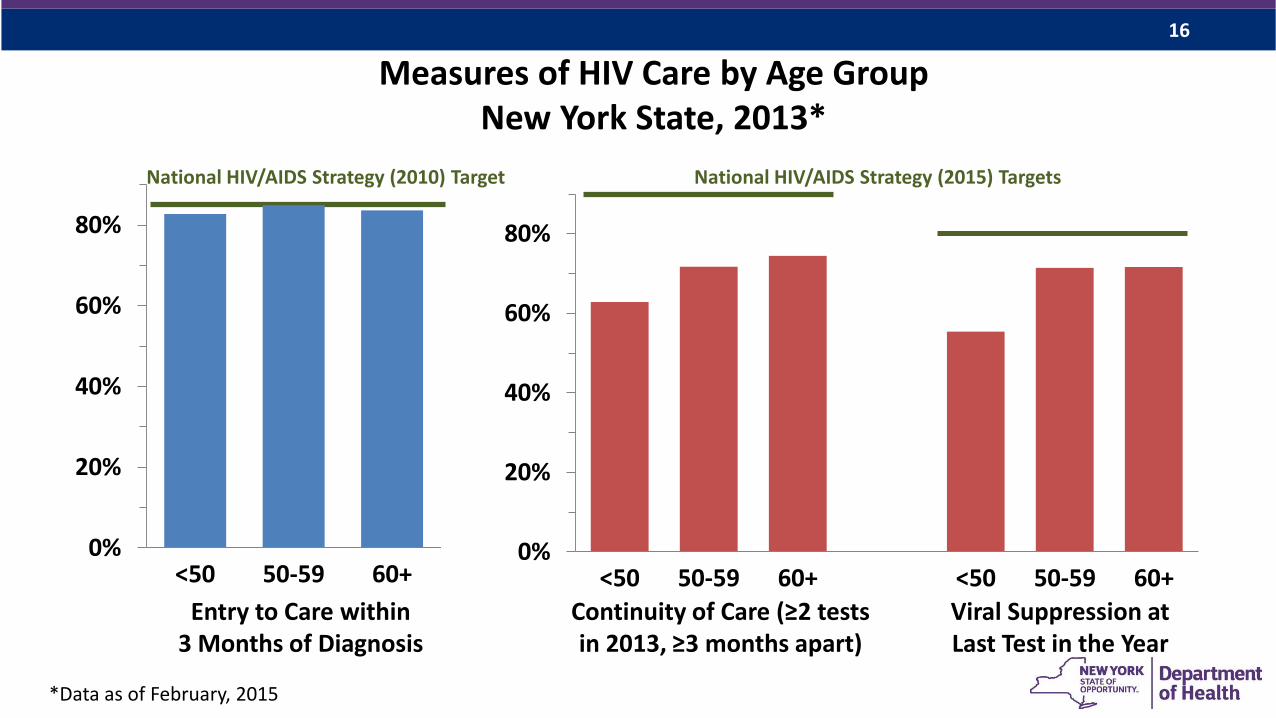
Measures of HIV Care by Age GroupNew York State, 2013*
0%
20%
40%
60%
80%
<50 50-59 60+ <50 50-59 60+
Entry to Care within 3 Months of Diagnosis
Continuity of Care (≥2 tests in 2013, ≥3 months apart)
Viral Suppression at Last Test in the Year
*Data as of February, 2015
National HIV/AIDS Strategy (2015) TargetsNational HIV/AIDS Strategy (2010) Target
17
Summary &Discussion
18
Observations/Discussion (1)
•Persons age 50+ accounted for 18% of the 3,500 new diagnoses in NYS in 2013, and a roughly similar proportion of the estimated 2,800 new infections.
•Prevention services must be directed to older persons as well as younger ones•The high proportion (1/3) of concurrent HIV/AIDS diagnoses indicate missed opportunities for diagnosis and need for outreach
• Currently, nearly half the 113,000 persons living with diagnosed HIV infection in New York State are age 50+
•Over the coming 20 years this group will increase substantially both in number and as proportion of total PLWDHI
19
Observations/Discussion (2)
•Entry to care after diagnosis is similar across age groups•The 2010 NHAS goal (85% within 3 months) is almost met, butthe 2015 NHAS goal (85% within 1 month) has not yet been met
• Continuity of care and viral suppression among those age 50+ are higher than among younger ages, but the 2015 NHAS goals have not yet been met.
•HIV in persons age 50+ presents a distinct challenge in terms of• prevention,•diagnosis outreach and• coordination of HIV-specific care with the normal increasing care needs of older persons in general
20
Contact Information:
Bureau of HIV/AIDS EpidemiologyAIDS Institute
New York State Department of HealthPhone (518) 474-4284
Email [email protected]