Embed Size (px)
Citation preview

Burden of DiseaseCost Benefit AnalysisWater, Sanitation and Health
Laurence Haller
June 2005

Burden of DiseaseCost Benefit AnalysisWhy is it important to undertake BoD analysis
and CBA?
• To compare W,S&H with other development priorities.
• To compare options to efficiently decrease WSH related diseases.
• To better support rational decision-making and policy development.

Objective of the guide
The objective of the guide is to provide practical information & better guidance to countries on how to assess the total benefit and cost of improving access to safe WS&S and good hygiene levels.
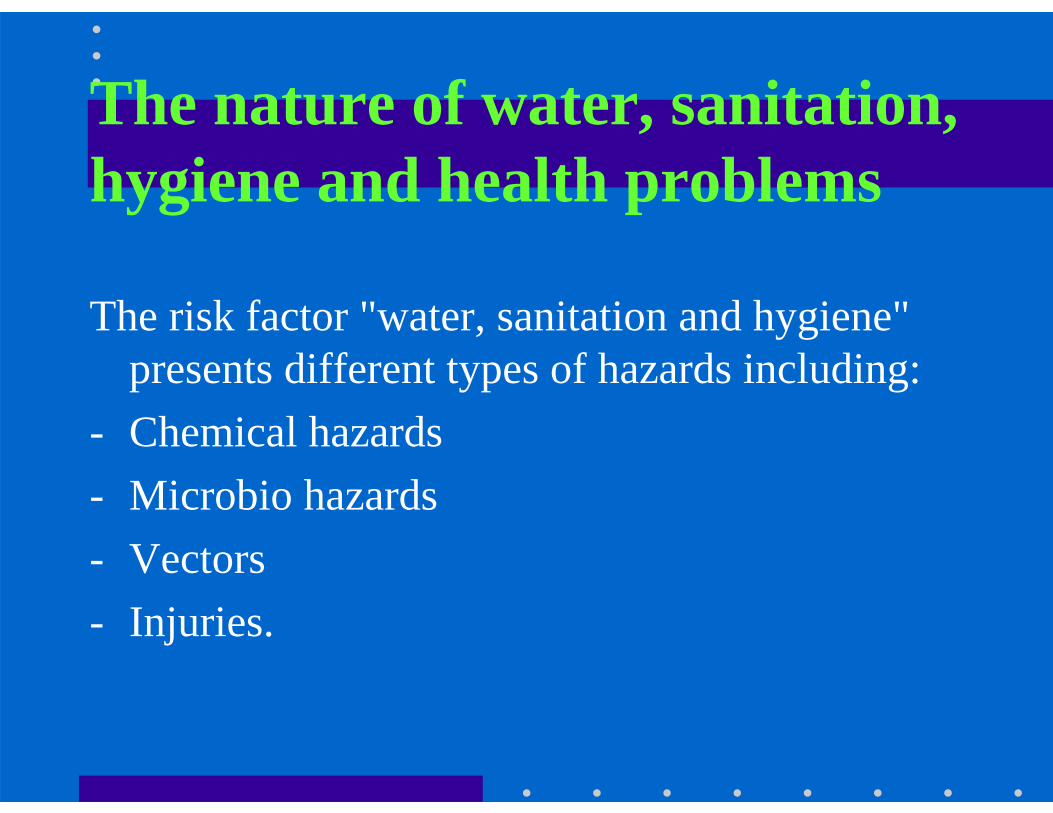
The nature of water, sanitation, hygiene and health problems
The risk factor "water, sanitation and hygiene" presents different types of hazards including:
- Chemical hazards- Microbio hazards- Vectors- Injuries.

Fecal-oral diseases –transmission pathways
Human excreta Water-borne
sewage
HandsSoil
Animal excreta
Surface water
Pathogen source
Medium Environment
Humans
Interface
FliesDry sanitation involving reuse
Food
Ground-water
Drinking water
Non-recycling latrines

General processPrincipal steps are:1. Identifying the problem.2. Defining the study population.3. Defining the levels of exposure and the distribution of
the population among the exposure levels.4. Specifying the baseline scenario.5. Defining the interventions to be evaluated.6. Assessing the health benefits due to each int.7. Assessing the additional benefits due to each int.8. Assessing the costs of each intervention.9. Evaluating the uncertainty surrounding the cost and
benefit estimations.

Identifying the problem
This includes a review of:- The human health problem to be addressed.- The distal and proximal causes of the disease
of interest and their interactions as a framework for assessment, which is defined as the causal framework.

Example of causal framework
Toilet Type
Poverty Diarrhea
Child’sage
WaterSource
Nutrition
Toilet Type
Toilet Type
PovertyPoverty DiarrheaDiarrhea
Child’sage
Child’sage
WaterSourceWaterSource
NutritionNutrition

Defining the study population
The analysis could be undertaken at national or sub-national level. The data required are:
- the population size and - the population structure of the chosen area.

Defining the levels of exposureThe risk of diarrhoea transmission depends on many
factors such as:- Quality & quantity of water available- Type of sanitation- Hygiene behaviour- Level of pathogens load in the environment.The type of WS&S infrastructure can be used as a
proxy indicator for WS,S&H levels. The exposure scenarios can be defined based on the type WS&S infrastructure.

JMP definitionImproved water sources Improved sanitation facilitiesHousehold connection Connection to a public sewerPublic standpipe Septic tankBorehole Simple pit latrineProtected dug well Ventilated improved pit latrineProtected springRainwater collection
Similar categories are likely to impact diarrhoea in a similar way.
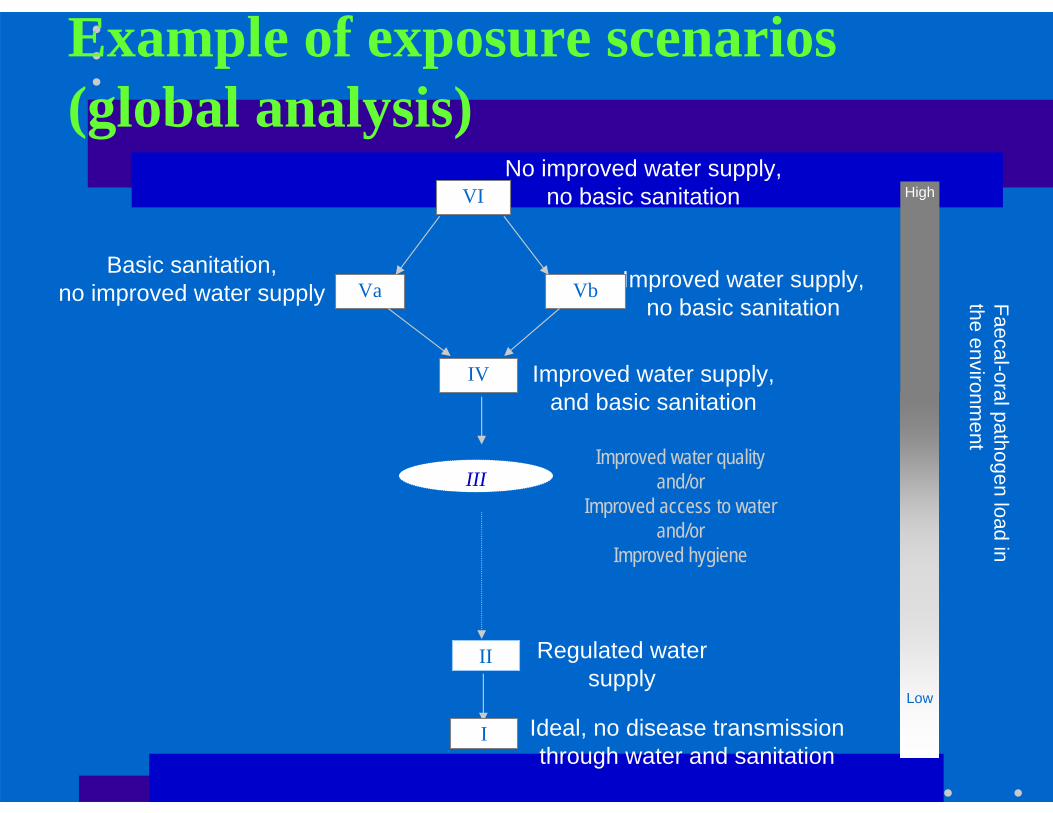
Example of exposure scenarios(global analysis)
Improved water supply, no basic sanitation
No improved water supply,no basic sanitationVI
VaBasic sanitation,
no improved water supply Vb
IV Improved water supply, and basic sanitation
II Regulated water supply
I Ideal, no disease transmission through water and sanitation
Faecal-oral pathogen load in the environm
ent
High
Low
IIIImproved water quality
and/orImproved access to water
and/orImproved hygiene

Distribution of the population in exposure scenarios
• The data required are the current levels of access to the different water supply and sanitation types of services in the chosen area.
• Household surveys are the most common surveys in which water, sanitation and hygiene behaviour are collected.
l

Defining the baseline scenario
• The baseline scenario is in general the existing level of WS&S services in a chosen area.
• Each potential intervention should be evaluated against the same baseline scenario.
l

Defining the intervention scenariosThe entire analysis is based on changes in water
and sanitation status for selected populations within a country. These changes are called "intervention scenarios".
l

Example of interventions (global analysis)
• Halving population w/o improved WS• Halving population w/o improved WS + S• To provide disinfection at point of use• Increasing access to improved water supply and
basic sanitation (98% coverage).• Increasing access to piped water in house as well
as sewage connection (98% coverage).
Estimating the health impacts
• It requires an assessment of the fatal and non-fatal health outcomes. Because WS&S interventions are preventive, the main outcome is first a reduction in the number of diarrhoea cases.
• The objective is to assess the reduction in the number of diarrhoea episodes when moving to a lower exposure category.
• Each exposure category has a different risk of diarrhoea transmission.

Estimating the health impacts
• In order to assign a relative risk to each exposure category, different approaches could be used based on either:• Published reviews, interventions studies• Household surveys• Implementation of new interventions studies.

Estimating the health impactsMeta-analysis results summary (using random effects model)Fewtrell et al. (2005)
0.59 – 0.760.675Multiple
0.65 – 0.850.745Household treatment – urban/periurban locations
0.39 – 0.940.616Household treatment – rural locations
0.46 - 0.810.608Household treatment – excluding poor qualitystudies
0.48 - 0.880.6512Household treatment only
0.42 - 1.900.893Source treatment only
0.53 - 0.890.6915Water quality
0.65 - 1.350.943Standpipe or community connection
0.43 - 1.930.902Household connection
0.62 - 0.910.756Water supply
0.53 - 0.870.682Sanitation
0.40 - 0.750.558Excluding poor quality studies
0.52 - 0.770.6311Hygiene
95% CIRelative risk
Number of studies
Intervention
Intervention studies• Randomized control trials provide strong evidence
for estimating health impacts / are considered "gold standards" for epidemiologic studies.
• Studies found in the literature were conducted in a specific population group at a specific time and place.
• The ability to generalise remains an issue. • How appropriate is a meta-analysis result for
national level policy consideration?
Cross-sectional surveys
• They can provide a more representative sample of the population at national level.
• Countries can take advantage of the collected population based data, such as the Demographic and Health Surveys (DHS).
• Results are potentially confounded by other factors.

Cross-sectional surveys• Based on the causal framework, potential
confounders have been identified as well as variable of convenience (e.g. region, urban / rural areas).
• Univariate / bivariate analyses and logistic regression should be used to identify confounders.
• Confounders are by definition associated with both exposure var. and health outcome var. They should be evenly distributed among the exposure categories.
• Logistic model is used to give predicted diarrhoea prevalence for each exposure group and adjusted for the selected confounders.

Example Nepal
Overall rates of diarrhoea according to sanitation, by rural / urban split
(1203/6205)(1111/5432)(92/593)
19.97%20.45%15.51%Total
(1105/5469)(1064/5169)(41/300)
20.20%20.58%13.67%Rural
(98/556)(47/263)(51/293)
17.63%17.87%17.41%Urban
TotalUnimprovedImproved
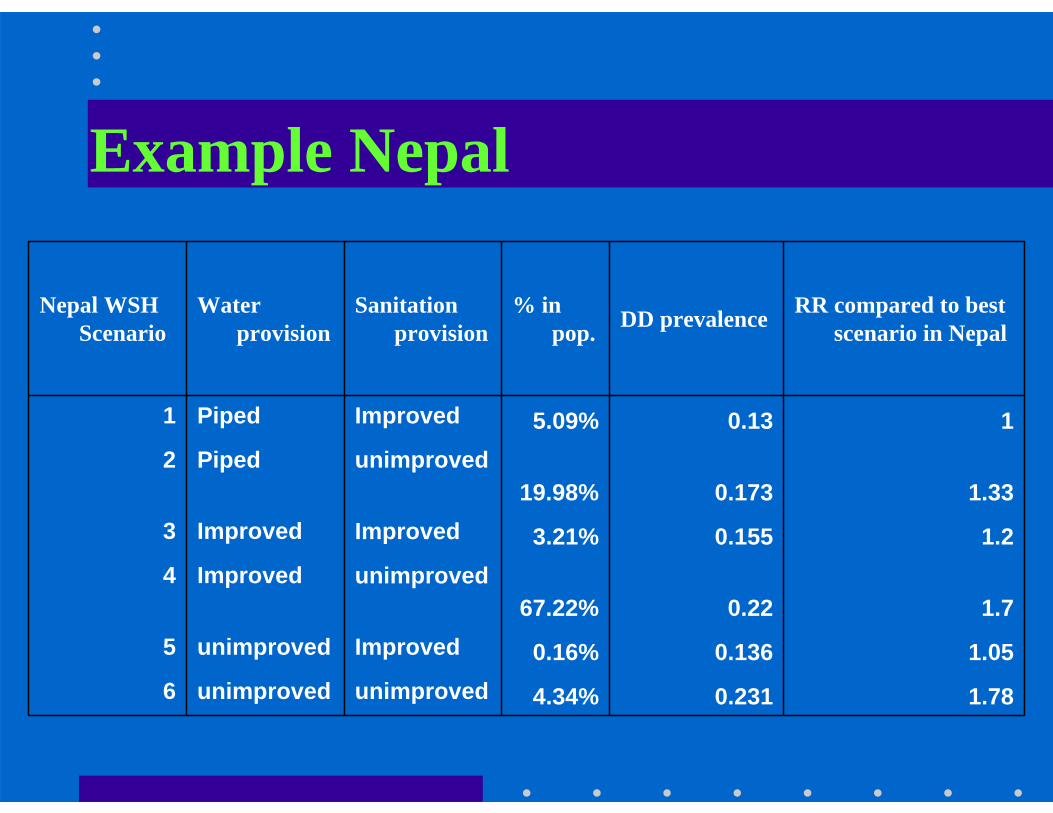
Example Nepal
1.780.2314.34%unimprovedunimproved61.050.1360.16%Improvedunimproved5
1.70.2267.22%unimprovedImproved4
1.20.1553.21%ImprovedImproved31.330.17319.98%
unimprovedPiped210.135.09%ImprovedPiped1
RR compared to best scenario in NepalDD prevalence % in
pop.Sanitation
provisionWater
provisionNepal WSH
Scenario

Estimating the Costs
Costs consist of all resources required to put in place and maintain the interventions. These are separated into:
• Recurrent costs• Capital costs

Estimating the Costs- Investment costs include:
planning, supervision, construction, etc. Investment costs are annualised based on the length of life of the equipment involved .
– Recurrent costs include:operation & maintenance, replacement of parts, regulation, monitoring, administration, etc.
– Final cost estimations will be presented in terms of US$ per technology per year. The unit cost will be x by the number of persons receiving the intervention to obtain a total annual cost per intervention.

Estimating the Costs
- Questionnaires to collect cost data include questions on the composition of investment costs and recurrent costs for each technology.
- Questionnaires allow a breakdown between urban and rural areas and take into account all factors that could influence the final costs of intervention (population density, water availability, environmental conditions, etc.).

Estimating the additional benefitsThe additional benefits included:
• The avoided direct expenditures due to less illness (health sector costs + patient costs saved).
• The avoided lost days from daily activities due to less illness and less deaths.
• The time gains due to better location of the water and sanitation facilities.
All these benefits should be valued in monetary terms (US$) using conventional economic methods for valuation.

Conclusion
FinalizedJ. encephalitisFinalizedlymphatic filariasisFinalizedschistoPublishedmalaria
Vector-borne diseases
FinalizedfluorideFinalizedarsenicChemical hazards
DraftAssessing the additional benefits
Final draftAssessing the costs / practical manual
DraftAssessing the health impacts / DHS analysis
PublishedAssessing the health impacts / Literature review
Final draftHow to define exposure categories
Final draftIntroductionDiarrhoeal diseases