Embed Size (px)
Citation preview
Journal of Agricultural and Resource Economics 40(2):325–345 ISSN 1068-5502Copyright 2015 Western Agricultural Economics Association
Bundled Adoption of Precision AgricultureTechnologies by Cotton Producers
Dayton M. Lambert, Krishna P. Paudel, and James A. Larson
This research analyzes the adoption patterns among cotton farmers for remote sensing, yieldmonitors, soil testing, soil electrical conductivity, and other precision agriculture technologiesusing a Multiple Indicator Multiple Causation regression model. Adoption patterns are analyzedusing principle component analysis to determine natural technology groupings. Identified bundlesare regressed on farm structure and operator characteristics. The propensity to adopt technologybundles was greater for producers managing relatively larger operations who used a variety ofinformation sources to learn about precision farming, irrigated cotton, practiced crop rotation, andparticipated in working land conservation programs.
Key words: adoption, cotton, Multiple Indicator Multiple Causation model, precision agriculture,technology bundles
Introduction
Despite the anticipated gains in input use efficiency and increased profit margins typically associatedwith knowledge about soil fertility, field topography, and other field characteristics, adoption ofsome precision agriculture information technologies remains relatively low in cotton production.Mooney et al. (2010) found that less than 1% of cotton producers used digital maps to aid inputuse decisions, and 4% used soil electrical conductivity devices. A national survey conducted by theUnited States Department of Agriculture Economic Research Service found that GPS devices wereused to develop soil maps on 5.2% of the planted cotton area in 2007 (United States Department ofAgriculture, Economic Research Service, 2007).
Use of soil survey maps has a long history, and grid and zone soil testing is considered anentry technology into precision agriculture (Schimmelpfennig and Ebel, 2011). Yield monitors arealso considered an entry-level technology into precision agriculture given farmers’ intense interestin yields on their farms (Lowenberg-DeBoer, 1999). However, the rate of yield monitor adoptionby cotton farmers lagged behind the adoption of yield monitoring by grain farmers because ofearly problems in developing reliable monitors for cotton (Larson et al., 2005). Yet according tosurveys of upland cotton producers, the adoption of yield monitors with GPS in cotton productionhas risen from 2.8% in 2001 to 19% in 2013 (Larson et al., 2005; Boyer et al., 2014). One factorinfluencing adoption of cotton yield monitors may be the 2007 introduction of on-board modulebuilders on cotton harvesters that are paired with yield monitoring technology (Reuters, 2008).Farmers may find value in combining the two technologies because of reduced equipment and
Dayton M. Lambert is an associate professor in the Department of Agricultural and Resource Economics at the Universityof Tennessee-Knoxville. Krishna P. Paudel is a professor in the Department of Agricultural Economics and Agribusinessat Louisiana State University (LSU) and LSU Agricultural Center. James A. Larson is a professor in the Department ofAgricultural and Resource Economics at the University of Tennessee-Knoxville.This research was funded by Cotton Incorporated and the agricultural research institutions at Louisiana State University andthe University of Tennessee. The authors thank the anonymous reviewers for providing useful comments and suggestions andtheir colleagues at their respective institutions for their encouragement and research support. The views expressed here arethose of the authors.
Review coordinated by Larry Makus.
326 May 2015 Journal of Agricultural and Resource Economics
labor expenses associated with the elimination of boll buggies and module builders in the harvestequipment complement (Martin and Varco, 2008).
Surveys of upland cotton producers provide further insight into how bundling technologies maybe an important factor influencing adoption of precision agriculture technologies by cotton farmers.In a 2009 survey of upland cotton producers, Walton et al. (2010b) found that 21% of producersused soil survey maps and that 22% and 11% of cotton producers used grid and zone soil sampling,respectively. In 2010, about 7% of cotton producers surveyed in the southern states used handheldGPS devices (Mooney et al., 2010). Decision support software such as COTMAN (ComputerizedCotton Management System) can be used to digitally document and record plant growth (i.e., plantmapping) using handheld GPS devices (Bange et al., 2004). About 5% of cotton growers surveyedby Mooney et al. (2010) used COTMAN. Using data from a 2005 survey of upland cotton producers,Walton et al. (2010a) found that farmers who used COTMAN, remote sensing (e.g., aerial andsatellite imagery), and grid soil sampling were more likely to have used handheld GPS devices.Pandit et al. (2011) indicated that of 1,800 cotton farmers surveyed in thirteen U.S. states, ninety-nine had adopted two precision farming technologies, fifty-five had adopted three precision farmingtechnologies, twenty-four had adopted four precision farming technologies, and nine had adoptedfive precision farming technologies. The aforementioned studies by Walton et al. (2010a) and Panditet al. (2011) support the idea that farmers tend to adopt precision technologies in bundles.
Marketing of information technology and analytic services by the agricultural support industrycontinues to increase, but adoption of technologies such as remote sensing, soil electricalconductivity, or digital maps by cotton producers remains comparatively low. Precision farmingtechnologies are attribute technologies (Tenkorang and Lowenberg-DeBoer, 2008). That is, theinformation generated by one technology ideally complements data recorded by other technologies.In their study of retail precision agriculture dealerships, Holland, Erickson, and Widmar (2013)found that yield monitoring services were provided by 23% of the businesses surveyed. The samesurvey reported that 33% of precision agriculture dealerships provided satellite/aerial imageryservices. Soil sampling with GPS was provided by 57% of the dealerships, with grid and zonesoil sampling services following closely at 54% and 35% of businesses, respectively. Bundlingtechnologies may reduce costs for some businesses because it is less expensive to sell severalgoods in a single package (Varian, 1999). In other words, bundling allows firms to charge customersdifferent prices for items they would not necessarily purchase if sold alone (Perloff, 2007).
This study analyzes the adoption of information and processing technologies associated withprecision agriculture based on a 2013 survey of cotton producers in thirteen southern states. Theresearch focus is on the bundling of these technologies as evidenced by their adoption. We estimatea Multiple Indicator Multiple Causation (MIMIC) model to generate adoption propensity scores.These scores are subsequently analyzed using principle component analysis (PCA) to identifybundles of technologies based on their use by producers. The bundles identified with PCA aresubsequently regressed on farm structure and operator characteristics to isolate which factors areassociated with specific technology bundle adoption, holding other variables constant. Ten discretetechnologies are considered in the analysis: yield monitors, grid soil sampling, zone soil sampling,soil electrical conductivity, digital map use, aerial imagery, satellite imagery, soil survey maps,handheld GPS devices, and the decision aid COTMAN. Identifying natural bundles of technologiescould be useful for agricultural service providers and industry professionals to lower marketing costsand increase revenue by selling bundled products. From the perspective of producers, understandingthe synergy potential among advanced information technologies can lower variable input costs andleverage on-farm scale economies.
Conceptual Model
Producers maximize returns from cotton production less variable costs by choosing optimal inputcombinations including fuel, fertilizer, labor, and land. Input quantity decisions are a function of
Lambert, Paudel, and Larson Bundled Adoption of Precision Agriculture 327
the relative price of cotton with respect to factor market prices and land rental costs as well asunobserved characteristics such as experience and ability. Cotton producers make decisions aboutinput use and land allocated to cotton production, but the effects of weather and random outbreaksof weed and pest infestations on plant growth are typically beyond the producer’s control.
Producers reduce production uncertainty by generating field-specific information about thespatial distribution of soil fertility with precision agriculture technologies including aerial imagery,electrical conductivity, grid and zone soil sampling, GPS, and other data-generating activities such asmap-making. Site-specific data collected at different spatial and temporal resolutions may be storedor analyzed using a variety of instruments, software, or technologies. A producer adopts one or acombination of technologies when the additional net revenue along with possibly nonmarket benefits(I) from adopting k technologies exceeds the cost of adopting the technology or technologies. Withk technology options available, there are M = 2k − 1 potential technology sets the researcher couldobserve in the population of adopters, counting sets that include adoption of only one technology.
In this analysis there are ten technologies considered with k = cotton yield monitors (CY M),grid soil sampling (GSS), zone soil sampling (ZSS), aerial imagery (AIM), satellite imagery (SIM),soil survey maps (SSM), handheld GPS devices (HGG), COTMAN (CT M), electrical conductivitydevices (ECM), and digital elevation maps (DGM), which correspond to M = 1,023 potentialbundles. The mth technology set is adopted when V (m, Im;X)>∪M−1
n V (n, In;X), where n indexestechnology bundles other than set m, V is an indirect utility function, I is income, ∪ the unionoperator, and X are variables specific to a producer and farm operation. The utility enjoyed bythe producer (V ∗, a latent variable) when V (m, Im;X)− ∪M−1
n V (n, In;X)> 0 is unobserved by theresearcher. This interpretation of latent utility differs from conventional applications. In other words,V ∗ represents the propensity to adopt precision agriculture technologies rather than the likelihoodof adopting any single technology. In the latter case, utility is typically modeled as a discrete 0/1choice, such that Vk = 1 if V ∗k > 0, 0 otherwise. We use this relationship between the adoption ofindividual technologies and the more general idea of adoption propensity to motivate the empiricalmodel as a Multiple Indicator Multiple Causation (MIMIC) regression.
Empirical Model
The combinatorial aspect of this discrete decision-making problem typically demands analysis usingmultinomial logit or multivariate probit regression presented as some permutation of McFadden’s(1974) random utility model. For example, when multiple technologies are considered, mosttechnology adoption analyses model discrete adoption decisions as linear functions of exogenouscovariates (typically operator characteristics or farm structure variables) and a stochastic errorcomponent (ε); for example, for the kth technology V ∗k = Xβk + εk. In this case, producer and farm-specific covariates are hypothesized to influence the adoption of technology k differently.
This analysis takes a different approach to analyzing the adoption of multiple precisionagriculture technologies. Instead, the focus is on the propensity of producers to adopt precisionagriculture technologies generally, recognizing that adoption of individual technologies may becorrelated. A MIMIC model is applied to this effect.
Early applications of MIMIC models are found in Zellner (1970) and Joreskog and Goldberger(1975). Maddala (1983) was an early application of the MIMIC model to agricultural technologyadoption. Richards and Jeffrey (2000) also applied a MIMIC model to analyze efficiency andeconomic performance of the Canadian dairy sector. We apply these adoption models, extendingSkrondal and Rabe-Heskath’s (2004) generalization of MIMIC models to the broad class of multi-factor latent variable models. Their generalization accommodates the simultaneous modeling ofdiscrete variables in a general linear model framework.
328 May 2015 Journal of Agricultural and Resource Economics
The propensity of the ith cotton producer to adopt precision agriculture technologies is anunobserved latent-index variable that is linear in terms:
(1) Z∗i = XXX iΓΓΓ + ui.
The propensity to adopt any technology (Z∗) is a function of farm structure, operator characteristics,and variables external to the farm (X) hypothesized to influence the likelihood of adopting one or acombination of technologies, and an unobserved random component ui, with Var(ui) = τ .
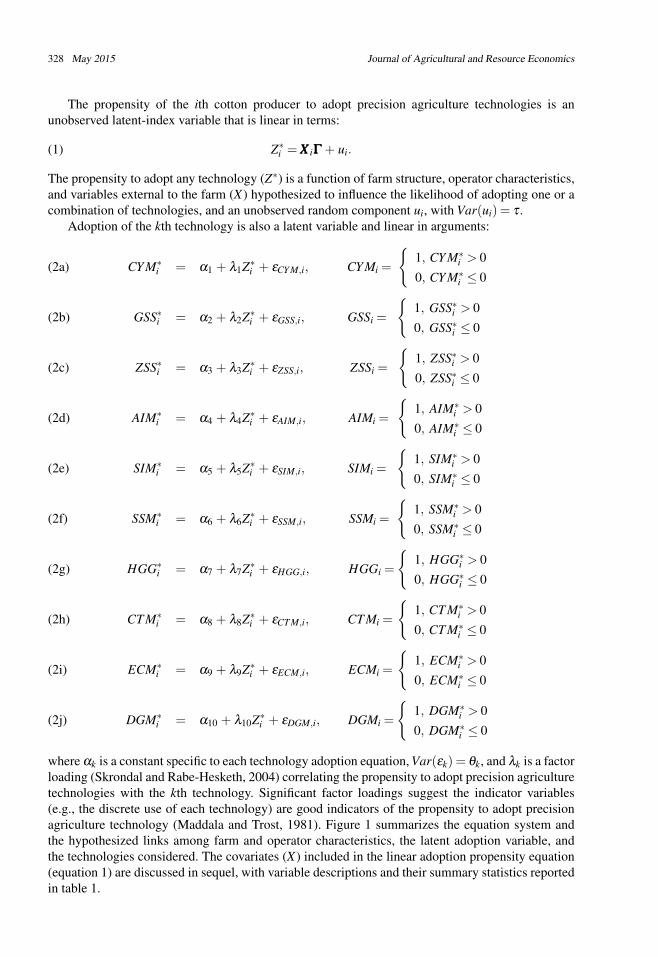
Adoption of the kth technology is also a latent variable and linear in arguments:
CY M∗i = α1 + λ1Z∗i + εCY M,i, CY Mi =
{1, CY M∗i > 00, CY M∗i ≤ 0
(2a)
GSS∗i = α2 + λ2Z∗i + εGSS,i, GSSi =
{1, GSS∗i > 00, GSS∗i ≤ 0
(2b)
ZSS∗i = α3 + λ3Z∗i + εZSS,i, ZSSi =
{1, ZSS∗i > 00, ZSS∗i ≤ 0
(2c)
AIM∗i = α4 + λ4Z∗i + εAIM,i, AIMi =
{1, AIM∗i > 00, AIM∗i ≤ 0
(2d)
SIM∗i = α5 + λ5Z∗i + εSIM,i, SIMi =
{1, SIM∗i > 00, SIM∗i ≤ 0
(2e)
SSM∗i = α6 + λ6Z∗i + εSSM,i, SSMi =
{1, SSM∗i > 00, SSM∗i ≤ 0
(2f)
HGG∗i = α7 + λ7Z∗i + εHGG,i, HGGi =
{1, HGG∗i > 00, HGG∗i ≤ 0
(2g)
CT M∗i = α8 + λ8Z∗i + εCT M,i, CT Mi =
{1, CT M∗i > 00, CT M∗i ≤ 0
(2h)
ECM∗i = α9 + λ9Z∗i + εECM,i, ECMi =
{1, ECM∗i > 00, ECM∗i ≤ 0
(2i)
DGM∗i = α10 + λ10Z∗i + εDGM,i, DGMi =
{1, DGM∗i > 00, DGM∗i ≤ 0
(2j)
where αk is a constant specific to each technology adoption equation, Var(εk) = θk, and λk is a factorloading (Skrondal and Rabe-Hesketh, 2004) correlating the propensity to adopt precision agriculturetechnologies with the kth technology. Significant factor loadings suggest the indicator variables(e.g., the discrete use of each technology) are good indicators of the propensity to adopt precisionagriculture technology (Maddala and Trost, 1981). Figure 1 summarizes the equation system andthe hypothesized links among farm and operator characteristics, the latent adoption variable, andthe technologies considered. The covariates (X) included in the linear adoption propensity equation(equation 1) are discussed in sequel, with variable descriptions and their summary statistics reportedin table 1.
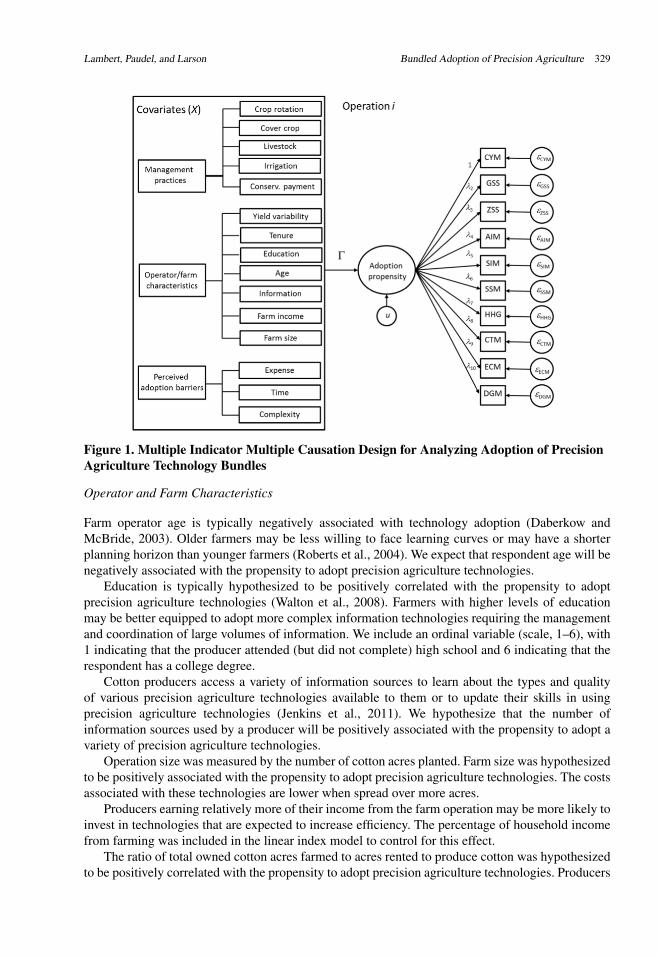
Lambert, Paudel, and Larson Bundled Adoption of Precision Agriculture 329
Figure 1. Multiple Indicator Multiple Causation Design for Analyzing Adoption of PrecisionAgriculture Technology Bundles
Operator and Farm Characteristics
Farm operator age is typically negatively associated with technology adoption (Daberkow andMcBride, 2003). Older farmers may be less willing to face learning curves or may have a shorterplanning horizon than younger farmers (Roberts et al., 2004). We expect that respondent age will benegatively associated with the propensity to adopt precision agriculture technologies.
Education is typically hypothesized to be positively correlated with the propensity to adoptprecision agriculture technologies (Walton et al., 2008). Farmers with higher levels of educationmay be better equipped to adopt more complex information technologies requiring the managementand coordination of large volumes of information. We include an ordinal variable (scale, 1–6), with1 indicating that the producer attended (but did not complete) high school and 6 indicating that therespondent has a college degree.
Cotton producers access a variety of information sources to learn about the types and qualityof various precision agriculture technologies available to them or to update their skills in usingprecision agriculture technologies (Jenkins et al., 2011). We hypothesize that the number ofinformation sources used by a producer will be positively associated with the propensity to adopt avariety of precision agriculture technologies.
Operation size was measured by the number of cotton acres planted. Farm size was hypothesizedto be positively associated with the propensity to adopt precision agriculture technologies. The costsassociated with these technologies are lower when spread over more acres.
Producers earning relatively more of their income from the farm operation may be more likely toinvest in technologies that are expected to increase efficiency. The percentage of household incomefrom farming was included in the linear index model to control for this effect.
The ratio of total owned cotton acres farmed to acres rented to produce cotton was hypothesizedto be positively correlated with the propensity to adopt precision agriculture technologies. Producers
330 May 2015 Journal of Agricultural and Resource Economics
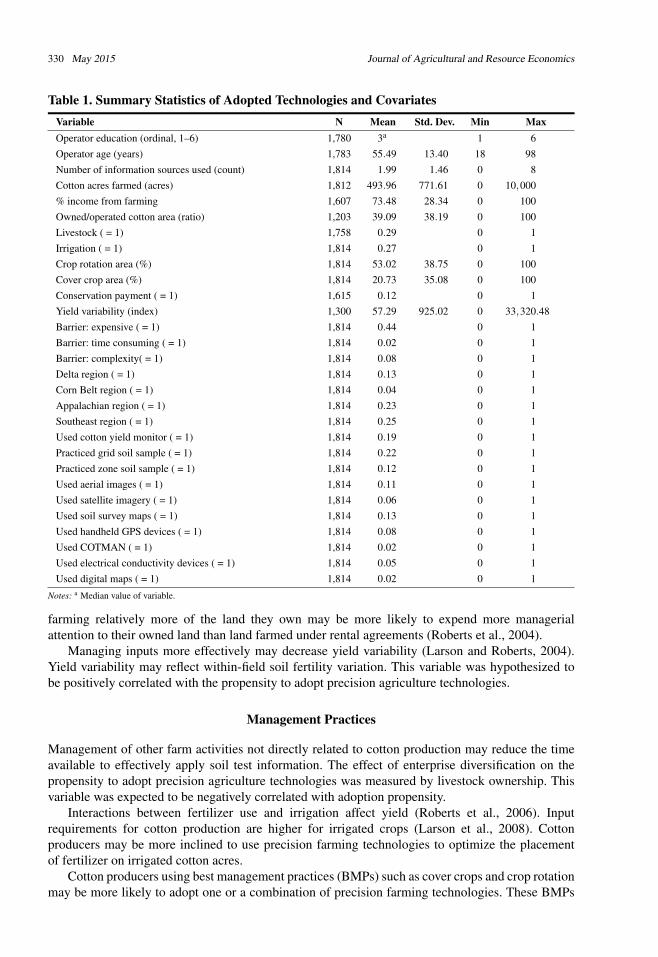
Table 1. Summary Statistics of Adopted Technologies and CovariatesVariable N Mean Std. Dev. Min MaxOperator education (ordinal, 1–6) 1,780 3a 1 6Operator age (years) 1,783 55.49 13.40 18 98Number of information sources used (count) 1,814 1.99 1.46 0 8Cotton acres farmed (acres) 1,812 493.96 771.61 0 10,000% income from farming 1,607 73.48 28.34 0 100Owned/operated cotton area (ratio) 1,203 39.09 38.19 0 100Livestock ( = 1) 1,758 0.29 0 1Irrigation ( = 1) 1,814 0.27 0 1Crop rotation area (%) 1,814 53.02 38.75 0 100Cover crop area (%) 1,814 20.73 35.08 0 100Conservation payment ( = 1) 1,615 0.12 0 1Yield variability (index) 1,300 57.29 925.02 0 33,320.48Barrier: expensive ( = 1) 1,814 0.44 0 1Barrier: time consuming ( = 1) 1,814 0.02 0 1Barrier: complexity( = 1) 1,814 0.08 0 1Delta region ( = 1) 1,814 0.13 0 1Corn Belt region ( = 1) 1,814 0.04 0 1Appalachian region ( = 1) 1,814 0.23 0 1Southeast region ( = 1) 1,814 0.25 0 1Used cotton yield monitor ( = 1) 1,814 0.19 0 1Practiced grid soil sample ( = 1) 1,814 0.22 0 1Practiced zone soil sample ( = 1) 1,814 0.12 0 1Used aerial images ( = 1) 1,814 0.11 0 1Used satellite imagery ( = 1) 1,814 0.06 0 1Used soil survey maps ( = 1) 1,814 0.13 0 1Used handheld GPS devices ( = 1) 1,814 0.08 0 1Used COTMAN ( = 1) 1,814 0.02 0 1Used electrical conductivity devices ( = 1) 1,814 0.05 0 1Used digital maps ( = 1) 1,814 0.02 0 1
Notes: a Median value of variable.
farming relatively more of the land they own may be more likely to expend more managerialattention to their owned land than land farmed under rental agreements (Roberts et al., 2004).
Managing inputs more effectively may decrease yield variability (Larson and Roberts, 2004).Yield variability may reflect within-field soil fertility variation. This variable was hypothesized tobe positively correlated with the propensity to adopt precision agriculture technologies.
Management Practices
Management of other farm activities not directly related to cotton production may reduce the timeavailable to effectively apply soil test information. The effect of enterprise diversification on thepropensity to adopt precision agriculture technologies was measured by livestock ownership. Thisvariable was expected to be negatively correlated with adoption propensity.
Interactions between fertilizer use and irrigation affect yield (Roberts et al., 2006). Inputrequirements for cotton production are higher for irrigated crops (Larson et al., 2008). Cottonproducers may be more inclined to use precision farming technologies to optimize the placementof fertilizer on irrigated cotton acres.
Cotton producers using best management practices (BMPs) such as cover crops and crop rotationmay be more likely to adopt one or a combination of precision farming technologies. These BMPs
Lambert, Paudel, and Larson Bundled Adoption of Precision Agriculture 331
improve soil structure, conserve water, enhance soil fertility, and control weed and pest infestations.The skill and ability needed to coordinate the establishment and management of cover crops androtating cotton with other crops may be indicative of a more general sense of farm planning and theproclivity to adopt precision farming technologies. The percentage of cotton acres planted with covercrops and the percentage of cotton acres rotated with other crops are included as farm managerialcovariates.
The USDA Natural Resources Conservation Service provides cost-share opportunities torow crop producers to develop soil nutrient management plans through programs such as theEnvironmental Quality Incentive Program and the Conservation Stewardship Program (United StatesDepartment of Agriculture, National Resources Conservation Services, 2011). It is hypothesized thatcotton producers who participate in these programs and receive cost-share payments to develop andimplement soil nutrient management plans will exhibit a higher propensity to adopt the precisionagriculture technologies examined here.
Perceived Barriers to Adoption
The perceived monetary and time opportunity costs that cotton producers associate with precisionagriculture technologies are likely barriers to their adoption. Producers may also believe thatmanaging multiple sources of data generated by various devices may generate confoundinginformation and complicate management.
Binary 0/1 variables indicating whether a respondent believed that monetary expense, time, orinstrument complexity were barriers impeding their adoption of precision agriculture technologieswere included in the adoption propensity equation. The expected relationships are negative.
Farm Production Regions
Regional trends in growing degree days, weather, and topography may influence the propensity toadopt specific precision agriculture technologies. Five regions were identified across the fourteenstates: the Mississippi Delta region (including Louisiana, Arkansas, and Mississippi), the CornBelt/grain-producing region (including Missouri and Kansas), the mid-southern region (includingTennessee, North Carolina, and Virginia), the southern plains region (Texas and Oklahoma), andthe southeastern states (South Carolina, Georgia, Alabama, and Florida). The regional dummyvariables were orthogonally restricted such that the coefficients are interpreted as differences fromthe population mean instead of a specific reference group (Neter et al., 1996).
Survey Data
The empirical analysis uses data from a 2013 survey of cotton producers in Alabama, Arkansas,Florida, Georgia, Kansas, Louisiana, Mississippi, Missouri, North Carolina, Oklahoma, SouthCarolina, Tennessee, Texas, and Virginia (Boyer et al., 2014). The Cotton Board (Memphis,Tennessee) provided a list frame of cotton producers who marketed cotton in 2011. After removinguniversity research and education centers and duplicate names, the mailing list comprised 13,566cotton producers.
Survey implementation followed Dillman’s (2001) tailored design survey method. A postcardwas sent to inform cotton producers about the survey. A week later, surveys were mailed with apostage-paid return envelope and a cover letter explaining the purpose of the survey. A reminderpostcard was mailed one week later. The second survey wave followed one week later, mailed toindividuals who had not responded to the first survey. Individuals who had not produced cottonbetween 2008 and 2012 were instructed to return the survey unanswered. The response rate was13.76%. For the regression analysis, there were 739 observations after eliminating records withmissing observations.
332 May 2015 Journal of Agricultural and Resource Economics
Post-stratification weights (expansion factors) were formulated using the method developed by(Lambert et al., 2014). The expansion factors were estimated based on the total cotton acres ineach of the states represented in the survey. These weights were used to estimate total cotton acresmanaged under each information technology.
Estimation Methods
The equation system is estimated as a general linear model with a logistic link function (Skrondaland Rabe-Hesketh, 2004). Identification of the system relies on the following restrictions. The firstrestriction requires an arbitrary normalization of either the variance term of equation (1) or oneof the factor loadings of equations (2a)–(2j) (Maddala, 1983). We restrict variance τ = 1. Second,the variance terms of equations (2a)–(2j) are constant and identical (i.e., θk = π2/3) because theadoption of each technology is observed as a 0/1 binary variable. Third, the off-diagonals of theerror covariance of each technology adoption equation and the adoption propensity equation are 0.Lastly, the covariance matrix between equations (2a)–(2j) is null.
The last restriction provides some intuition to the MIMIC model. Correlation betweentechnology adoption decisions is modeled through the factor loadings (the λks) and a singlelatent variable indexing the propensity to adopt precision agriculture technologies in general. It isimportant to note that the last assumption restricts the covariates used to explain the propensity toadopt precision agriculture technologies to be identical among the technologies. The difference in themagnitude a covariate has on the adoption of each technology considered separately is determinedby the factor loadings corresponding with the latent variable in each technology adoption equation.
The null model is that the loading factors of equations (2a)–(2j) and the respective coefficientsincluded in the adoption index (equation 1) are jointly not different from 0. This hypothesis istested using a likelihood ratio test with 28 degrees of freedom (10 factor loadings plus 18 covariatesincluded in equation 1).
Using the logistic distribution to examine the correlation between the propensity to adoptprecision farming technologies and each technology considered has practical advantages in termsof interpreting model results. For example, expressing equations (2a)–(2j) in log-odds form fortechnology k:
(3) ln(
P∗ik1− P∗ik
)= α̂k + λ̂kZ∗i ,
where P∗ik is the probability of adopting technology k and ˆ denotes estimates. From the standardexpression for log-odds proportions, exp(λ̂k · γ̂h), where γ̂h is an element of ΓΓΓ in equation (1), thepercentage change the hth covariate has on the odds of adopting technology k is calculated as100× [exp(λ̂k · γ̂h)− 1] (Long and Freese, 2006).
An ex post principal component analysis (PCA) of the predicted adoption patterns was conductedto identify conditional technology bundles. First, the adoption probabilities of each technology, giventhe propensity to adopt precision agriculture technologies in general, were estimated. In the secondstage, technology clusters were determined using PCA. Lastly, the first and second components wereplotted to graphically inspect natural groupings. Using logistic regression, identified bundles wereregressed on farm and farmer characteristics to examine the factors correlated with bundle adoption.
Results
The weighted sum of the 2012 cotton acres farmed in the survey region was 8,770,793 acres, whichcorresponds with 17,610 cotton acres managed by n = 1,812 respondents (table 2). Discussionof acres managed under the precision agriculture technologies analyzed focuses on the weightedaggregation, but the use patterns are nonetheless similar in terms of weighted and unweighted
Lambert, Paudel, and Larson Bundled Adoption of Precision Agriculture 333
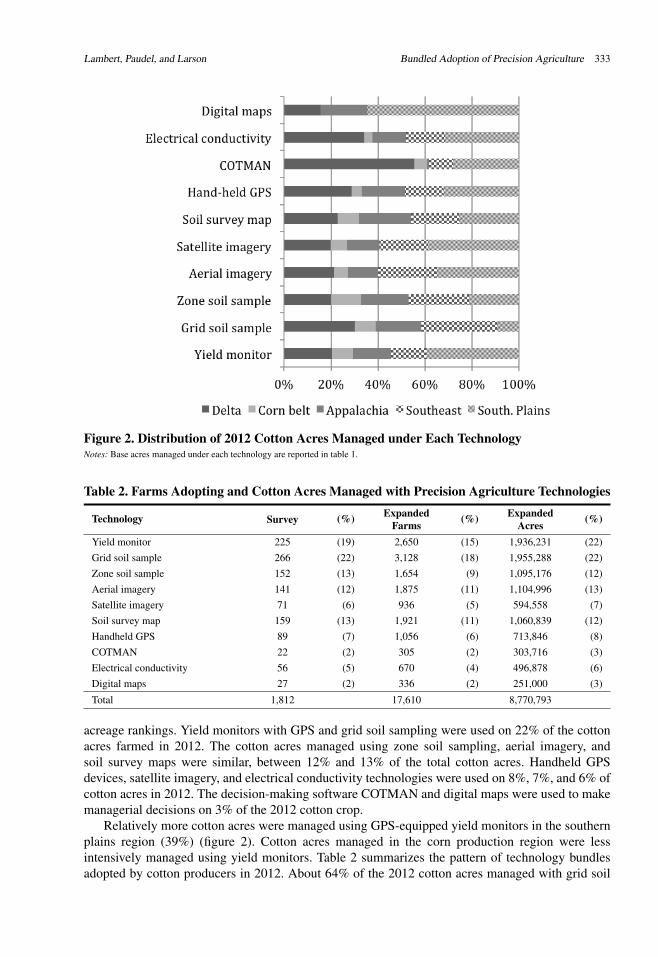
Figure 2. Distribution of 2012 Cotton Acres Managed under Each TechnologyNotes: Base acres managed under each technology are reported in table 1.
Table 2. Farms Adopting and Cotton Acres Managed with Precision Agriculture Technologies
Technology Survey (%) ExpandedFarms (%) Expanded
Acres (%)
Yield monitor 225 (19) 2,650 (15) 1,936,231 (22)Grid soil sample 266 (22) 3,128 (18) 1,955,288 (22)Zone soil sample 152 (13) 1,654 (9) 1,095,176 (12)Aerial imagery 141 (12) 1,875 (11) 1,104,996 (13)Satellite imagery 71 (6) 936 (5) 594,558 (7)Soil survey map 159 (13) 1,921 (11) 1,060,839 (12)Handheld GPS 89 (7) 1,056 (6) 713,846 (8)COTMAN 22 (2) 305 (2) 303,716 (3)Electrical conductivity 56 (5) 670 (4) 496,878 (6)Digital maps 27 (2) 336 (2) 251,000 (3)
Total 1,812 17,610 8,770,793
acreage rankings. Yield monitors with GPS and grid soil sampling were used on 22% of the cottonacres farmed in 2012. The cotton acres managed using zone soil sampling, aerial imagery, andsoil survey maps were similar, between 12% and 13% of the total cotton acres. Handheld GPSdevices, satellite imagery, and electrical conductivity technologies were used on 8%, 7%, and 6% ofcotton acres in 2012. The decision-making software COTMAN and digital maps were used to makemanagerial decisions on 3% of the 2012 cotton crop.
Relatively more cotton acres were managed using GPS-equipped yield monitors in the southernplains region (39%) (figure 2). Cotton acres managed in the corn production region were lessintensively managed using yield monitors. Table 2 summarizes the pattern of technology bundlesadopted by cotton producers in 2012. About 64% of the 2012 cotton acres managed with grid soil
334 May 2015 Journal of Agricultural and Resource Economics
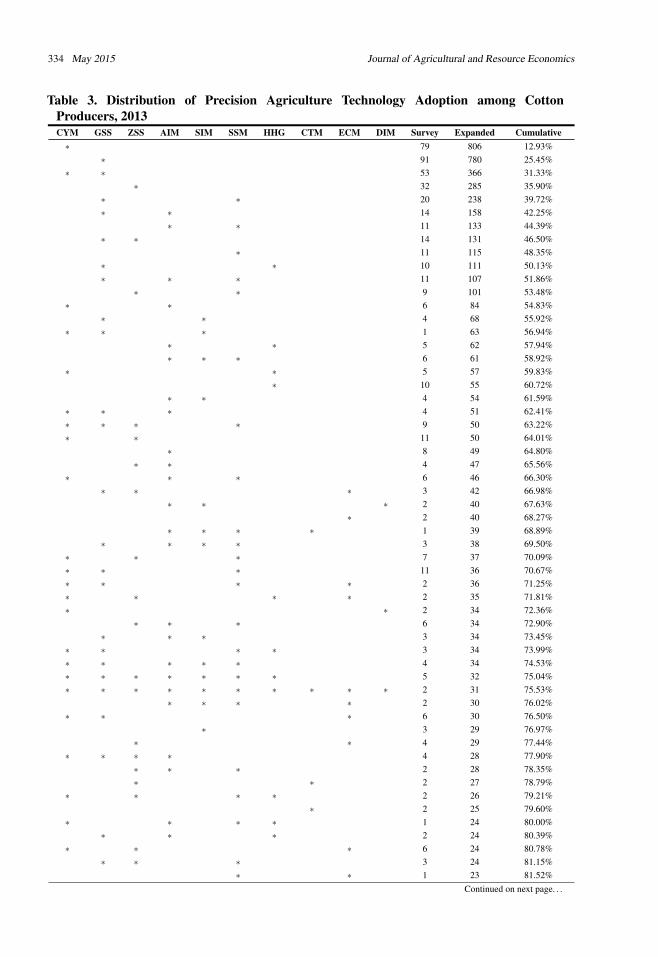
Table 3. Distribution of Precision Agriculture Technology Adoption among CottonProducers, 2013CYM GSS ZSS AIM SIM SSM HHG CTM ECM DIM Survey Expanded Cumulative∗ 79 806 12.93%
∗ 91 780 25.45%∗ ∗ 53 366 31.33%
∗ 32 285 35.90%∗ ∗ 20 238 39.72%∗ ∗ 14 158 42.25%
∗ ∗ 11 133 44.39%∗ ∗ 14 131 46.50%
∗ 11 115 48.35%∗ ∗ 10 111 50.13%∗ ∗ ∗ 11 107 51.86%
∗ ∗ 9 101 53.48%∗ ∗ 6 84 54.83%
∗ ∗ 4 68 55.92%∗ ∗ ∗ 1 63 56.94%
∗ ∗ 5 62 57.94%∗ ∗ ∗ 6 61 58.92%
∗ ∗ 5 57 59.83%∗ 10 55 60.72%
∗ ∗ 4 54 61.59%∗ ∗ ∗ 4 51 62.41%∗ ∗ ∗ ∗ 9 50 63.22%∗ ∗ 11 50 64.01%
∗ 8 49 64.80%∗ ∗ 4 47 65.56%
∗ ∗ ∗ 6 46 66.30%∗ ∗ ∗ 3 42 66.98%
∗ ∗ ∗ 2 40 67.63%∗ 2 40 68.27%
∗ ∗ ∗ ∗ 1 39 68.89%∗ ∗ ∗ ∗ 3 38 69.50%
∗ ∗ ∗ 7 37 70.09%∗ ∗ ∗ 11 36 70.67%∗ ∗ ∗ ∗ 2 36 71.25%∗ ∗ ∗ ∗ 2 35 71.81%∗ ∗ 2 34 72.36%
∗ ∗ ∗ 6 34 72.90%∗ ∗ ∗ 3 34 73.45%
∗ ∗ ∗ ∗ 3 34 73.99%∗ ∗ ∗ ∗ ∗ 4 34 74.53%∗ ∗ ∗ ∗ ∗ ∗ ∗ 5 32 75.04%∗ ∗ ∗ ∗ ∗ ∗ ∗ ∗ ∗ ∗ 2 31 75.53%
∗ ∗ ∗ ∗ 2 30 76.02%∗ ∗ ∗ 6 30 76.50%
∗ 3 29 76.97%∗ ∗ 4 29 77.44%
∗ ∗ ∗ ∗ 4 28 77.90%∗ ∗ ∗ 2 28 78.35%∗ ∗ 2 27 78.79%
∗ ∗ ∗ ∗ 2 26 79.21%∗ 2 25 79.60%
∗ ∗ ∗ ∗ 1 24 80.00%∗ ∗ ∗ 2 24 80.39%
∗ ∗ ∗ 6 24 80.78%∗ ∗ ∗ 3 24 81.15%
∗ ∗ 1 23 81.52%Continued on next page. . .
Lambert, Paudel, and Larson Bundled Adoption of Precision Agriculture 335
Table 3. – continued from previous pageCYM GSS ZSS AIM SIM SSM HHG CTM ECM DIM Survey Expanded Cumulative
∗ ∗ 1 23 81.89%∗ ∗ ∗ 1 23 82.25%
∗ ∗ ∗ 2 23 82.62%∗ ∗ ∗ ∗ 1 23 82.99%
∗ ∗ ∗ ∗ ∗ ∗ ∗ 1 23 83.35%∗ ∗ ∗ ∗ 1 23 83.72%
∗ ∗ ∗ ∗ 6 22 84.08%∗ ∗ ∗ 2 20 84.41%∗ ∗ ∗ ∗ 1 20 84.73%
∗ ∗ ∗ ∗ 2 20 85.06%∗ ∗ ∗ ∗ ∗ 2 20 85.39%
∗ ∗ 2 20 85.71%∗ ∗ ∗ ∗ ∗ 1 20 86.03%
∗ ∗ ∗ ∗ ∗ 1 20 86.35%∗ ∗ ∗ ∗ ∗ 2 20 86.67%
∗ ∗ ∗ ∗ ∗ 2 20 86.99%∗ ∗ ∗ 4 20 87.30%
∗ ∗ ∗ 1 19 87.61%∗ ∗ ∗ ∗ ∗ ∗ ∗ 1 19 87.92%∗ 2 18 88.21%
∗ ∗ 2 18 88.50%∗ ∗ ∗ ∗ 1 18 88.78%∗ ∗ ∗ ∗ ∗ ∗ ∗ 1 18 89.07%∗ ∗ ∗ ∗ ∗ 3 18 89.35%
∗ ∗ 1 17 89.63%∗ ∗ 6 17 89.90%
Notes: CYM = cotton yield monitor; GSS = grid soil sampling; ZSS = zone soil sampling; AIM = aerial imagery; SIM = satellite imagery;SSM = survey soil map; HHG = handheld GPS; CTM = COTMAN; ECM = electrical conductivity map; DIM = digital elevation map.Cumulative percentages based on expanded cotton farm population.
sampling information were located in the Delta and southeastern states. Cotton acres managedusing zone soil sampling information were more uniformly distributed across the survey region.The distribution of cotton acres managed using satellite or aerial imagery were concentrated inthe southeastern and southern plains states, with a majority of these acres located in Texas andOklahoma (35% and 39% for aerial and satellite imagery). Most (64%) of the cotton acres managedusing data generated from digital maps were also located in these states. Cotton acres managed byproducers using the software support system COTMAN were concentrated in Mississippi, Arkansas,and Louisiana (55%), while cotton acres managed using data generated by electrical conductivitydevices were mostly located in the Delta states, Texas, and Oklahoma (combined, 66% of all cottonacres managed under this technology). The use of soil maps to make managerial decisions for cottonproduction was uniformly distributed across the regions, excluding Kansas and Missouri; only 9% ofthe total acres managed using soil survey maps were located in these states. A majority of the 2012cotton acres managed using handheld GPS devices were located in Texas and Oklahoma (39%)followed closely by Louisiana, Mississippi, and Arkansas (29%).
There were 154 technology combinations used by cotton producers in the survey region.The predominant, unconditional technology combinations adopted by 90% of cotton growers arereported in table 3. Of the top eighty-four technology sets, the most common combination was GPS-equipped yield monitors and grid soil sampling (53 respondents, with a corresponding expandedpopulation of 366 cotton farms). Common technology combinations tended to exclude the use ofdigital elevation maps, electrical conductivity devices, and COTMAN. Combinations that includedthese technologies begin appearing at the sixty-seventh percentile of the distribution of cottongrowers. Adoption of all ten technologies considered was a rare event (n = 2 respondents), butadoption of single technologies—such as yield monitors, grid soil sampling, or zone soil sampling—was relatively common.
336 May 2015 Journal of Agricultural and Resource Economics
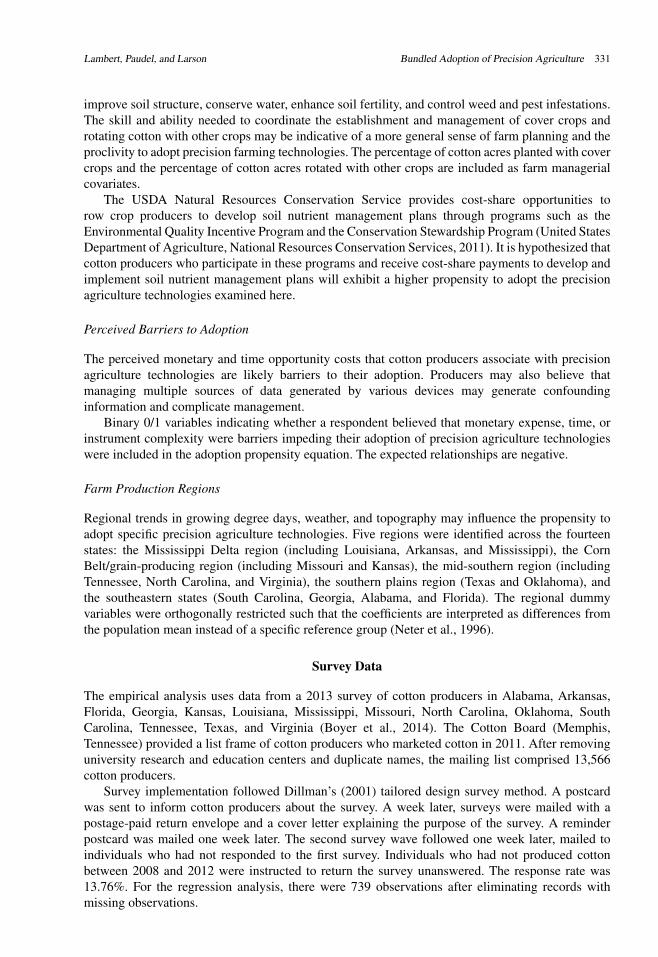
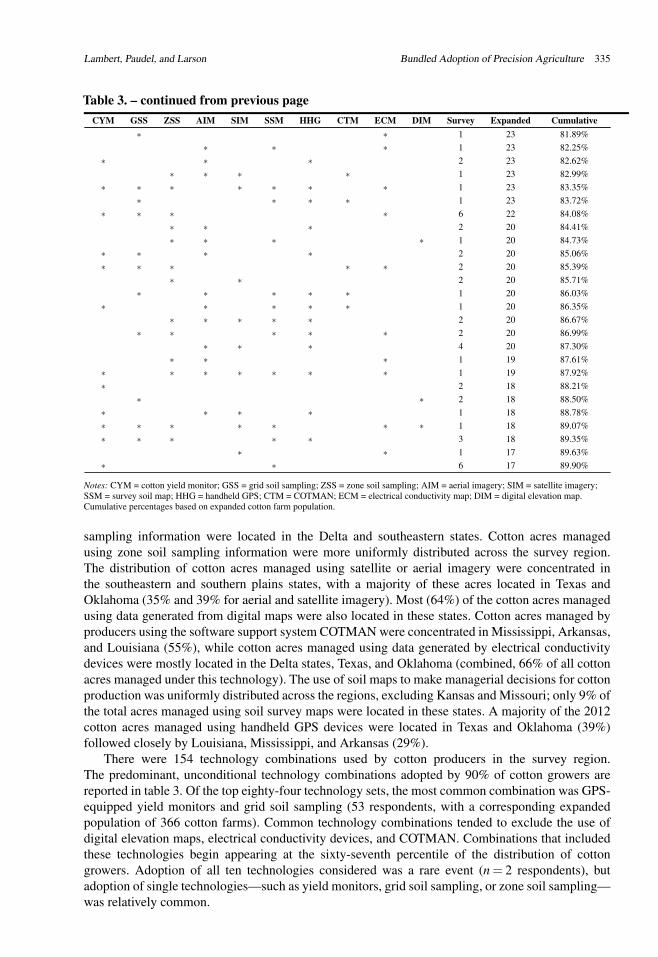
Figure 3. Adoption Curves and the Propensity to Adopt Precision Agriculture Technologiesamong Cotton Producers
MIMIC Regression Results
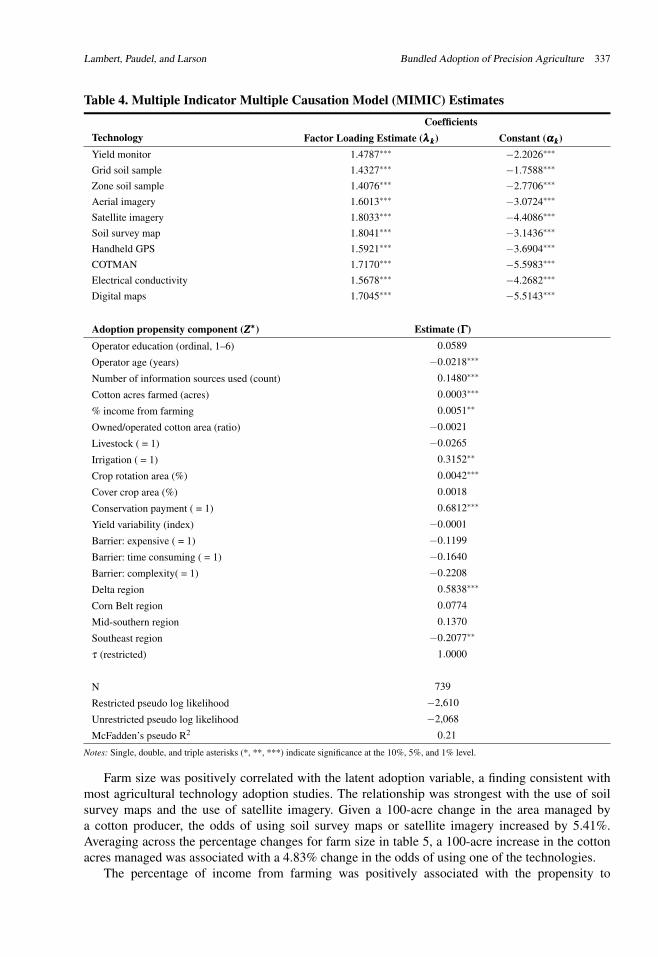
The likelihood ratio statistic was −2[−2,610− (−2,067)] = 1,086(df = 28), which suggests thatthe unrestricted model is preferred to the null model at P < 0.0001 (table 4). The factor-loadingscores were significant at the 1% level, suggesting that these technologies are strong indicators ofthe latent variable “propensity to adopt precision agriculture technologies.” The factor loading onthe propensity to adopt precision agriculture technologies was largest for soil survey maps, followedby use of satellite imagery. The weakest (but significant) factor loading association was observedwith zone soil sampling. These patterns are evidenced by the adoption curves of each technologyover the distribution of adoption propensity scores (figure 3). Discussion of the covariates explainingthe propensity to adopt these technologies follows table 5, which calculates the percentage changesin the log odds associated with each technology adopted.
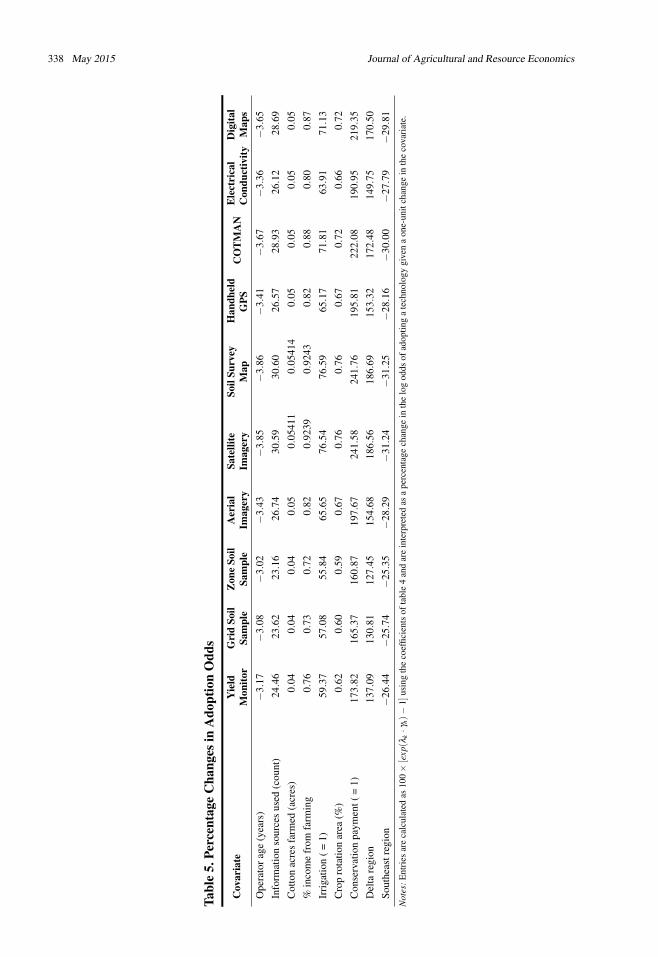
Operator age was negatively associated with the propensity to adopt these technologies, afinding commensurate with previous literature and technology adoption (table 5). The associationwas strongest with soil survey map technology: an additional year in age was associated with a100× [exp(−0.0218× 1.804)− 1] =−3.86% decrease in the odds of using satellite imagery tomake input management decisions. Averaging across the percentage changes in log odds across alltechnologies, an additional year in age was associated with a 3.45% decrease in the odds of adoptingany of the ten technologies considered.
Cotton growers using relatively more information sources to update their knowledge aboutprecision farming were more likely to adopt the technologies examined. The association betweenadoption propensity and the number of information sources used was strongest for the use of soilsurvey maps. For example, a one-unit increase in the number of information sources used wasassociated with a 30.60% increase in the odds that a cotton producer used soil survey maps to makeinput management decisions. On average, use of an additional source of information was associatedwith a 26.95% increase in the odds of using soil survey maps.
Lambert, Paudel, and Larson Bundled Adoption of Precision Agriculture 337
Table 4. Multiple Indicator Multiple Causation Model (MIMIC) EstimatesCoefficients
Technology Factor Loading Estimate (λλλ kkk) Constant (αααkkk)Yield monitor 1.4787∗∗∗ −2.2026∗∗∗
Grid soil sample 1.4327∗∗∗ −1.7588∗∗∗
Zone soil sample 1.4076∗∗∗ −2.7706∗∗∗
Aerial imagery 1.6013∗∗∗ −3.0724∗∗∗
Satellite imagery 1.8033∗∗∗ −4.4086∗∗∗
Soil survey map 1.8041∗∗∗ −3.1436∗∗∗
Handheld GPS 1.5921∗∗∗ −3.6904∗∗∗
COTMAN 1.7170∗∗∗ −5.5983∗∗∗
Electrical conductivity 1.5678∗∗∗ −4.2682∗∗∗
Digital maps 1.7045∗∗∗ −5.5143∗∗∗
Adoption propensity component (ZZZ∗∗∗) Estimate (ΓΓΓ)Operator education (ordinal, 1–6) 0.0589
Operator age (years) −0.0218∗∗∗
Number of information sources used (count) 0.1480∗∗∗
Cotton acres farmed (acres) 0.0003∗∗∗
% income from farming 0.0051∗∗
Owned/operated cotton area (ratio) −0.0021
Livestock ( = 1) −0.0265
Irrigation ( = 1) 0.3152∗∗
Crop rotation area (%) 0.0042∗∗∗
Cover crop area (%) 0.0018
Conservation payment ( = 1) 0.6812∗∗∗
Yield variability (index) −0.0001
Barrier: expensive ( = 1) −0.1199
Barrier: time consuming ( = 1) −0.1640
Barrier: complexity( = 1) −0.2208
Delta region 0.5838∗∗∗
Corn Belt region 0.0774
Mid-southern region 0.1370
Southeast region −0.2077∗∗
τ (restricted) 1.0000
N 739
Restricted pseudo log likelihood −2,610
Unrestricted pseudo log likelihood −2,068
McFadden’s pseudo R2 0.21
Notes: Single, double, and triple asterisks (*, **, ***) indicate significance at the 10%, 5%, and 1% level.
Farm size was positively correlated with the latent adoption variable, a finding consistent withmost agricultural technology adoption studies. The relationship was strongest with the use of soilsurvey maps and the use of satellite imagery. Given a 100-acre change in the area managed bya cotton producer, the odds of using soil survey maps or satellite imagery increased by 5.41%.Averaging across the percentage changes for farm size in table 5, a 100-acre increase in the cottonacres managed was associated with a 4.83% change in the odds of using one of the technologies.
The percentage of income from farming was positively associated with the propensity to
338 May 2015 Journal of Agricultural and Resource Economics
Tabl
e5.
Perc
enta
geC
hang
esin
Ado
ptio
nO
dds
Cov
aria
teY
ield
Mon
itor
Gri
dSo
ilSa
mpl
eZ
one
Soil
Sam
ple
Aer
ial
Imag
ery
Sate
llite
Imag
ery
Soil
Surv
eyM
apH
andh
eld
GPS
CO
TM
AN
Ele
ctri
cal
Con
duct
ivity
Dig
ital
Map
sO
pera
tora
ge(y
ears
)−
3.17
−3.
08−
3.02
−3.
43−
3.85
−3.
86−
3.41
−3.
67−
3.36
−3.
65In
form
atio
nso
urce
sus
ed(c
ount
)24.4
623
.62
23.1
626
.74
30.5
930.6
026.5
728
.93
26.1
228
.69
Cot
ton
acre
sfa
rmed
(acr
es)
0.04
0.04
0.04
0.05
0.05
411
0.05
414
0.05
0.05
0.05
0.05
%in
com
efr
omfa
rmin
g0.
760.
730.
720.
820.
9239
0.92
430.
820.
880.
800.
87Ir
riga
tion
(=1)
59.3
757
.08
55.8
465
.65
76.5
476.5
965.1
771
.81
63.9
171
.13
Cro
pro
tatio
nar
ea(%
)0.
620.
600.
590.
670.
760.
760.
670.
720.
660.
72C
onse
rvat
ion
paym
ent(
=1)
173.
8216
5.37
160.
8719
7.67
241.
5824
1.76
195.
8122
2.08
190.
9521
9.35
Del
tare
gion
137.
0913
0.81
127.
4515
4.68
186.
5618
6.69
153.
3217
2.48
149.
7517
0.50
Sout
heas
treg
ion
−26
.44
−25
.74
−25
.35
−28.2
9−
31.2
4−
31.2
5−
28.1
6−
30.0
0−
27.7
9−
29.8
1
Not
es:E
ntri
esar
eca
lcul
ated
as10
0×[e
xp(λ
k·γ
h)−
1]us
ing
the
coef
ficie
nts
ofta
ble
4an
dar
ein
terp
rete
das
ape
rcen
tage
chan
gein
the
log
odds
ofad
optin
ga
tech
nolo
gygi
ven
aon
e-un
itch
ange
inth
eco
vari
ate.
Lambert, Paudel, and Larson Bundled Adoption of Precision Agriculture 339
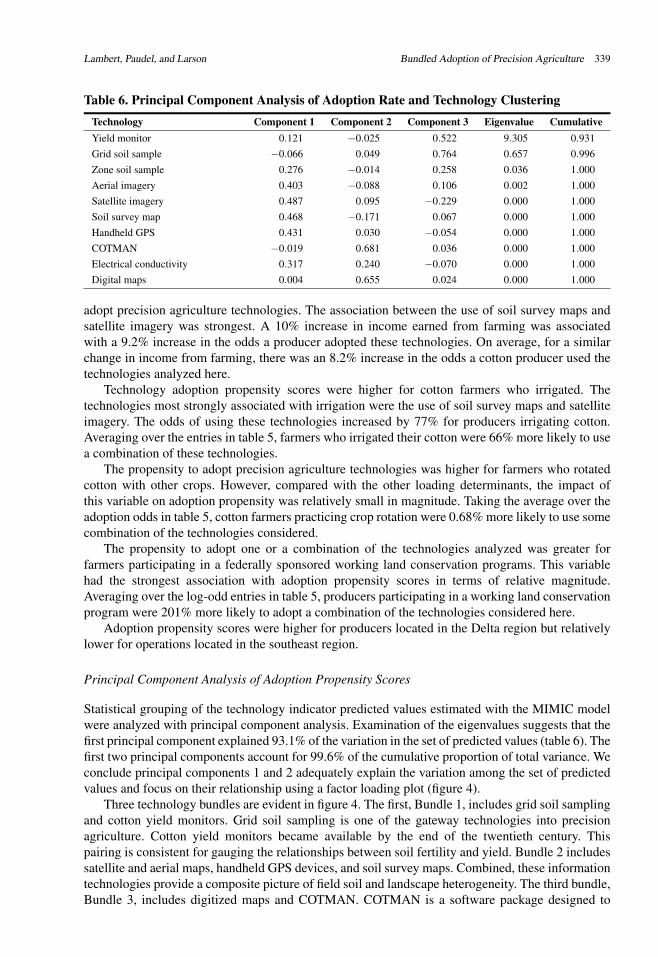
Table 6. Principal Component Analysis of Adoption Rate and Technology ClusteringTechnology Component 1 Component 2 Component 3 Eigenvalue CumulativeYield monitor 0.121 −0.025 0.522 9.305 0.931Grid soil sample −0.066 0.049 0.764 0.657 0.996Zone soil sample 0.276 −0.014 0.258 0.036 1.000Aerial imagery 0.403 −0.088 0.106 0.002 1.000Satellite imagery 0.487 0.095 −0.229 0.000 1.000Soil survey map 0.468 −0.171 0.067 0.000 1.000Handheld GPS 0.431 0.030 −0.054 0.000 1.000COTMAN −0.019 0.681 0.036 0.000 1.000Electrical conductivity 0.317 0.240 −0.070 0.000 1.000Digital maps 0.004 0.655 0.024 0.000 1.000
adopt precision agriculture technologies. The association between the use of soil survey maps andsatellite imagery was strongest. A 10% increase in income earned from farming was associatedwith a 9.2% increase in the odds a producer adopted these technologies. On average, for a similarchange in income from farming, there was an 8.2% increase in the odds a cotton producer used thetechnologies analyzed here.
Technology adoption propensity scores were higher for cotton farmers who irrigated. Thetechnologies most strongly associated with irrigation were the use of soil survey maps and satelliteimagery. The odds of using these technologies increased by 77% for producers irrigating cotton.Averaging over the entries in table 5, farmers who irrigated their cotton were 66% more likely to usea combination of these technologies.
The propensity to adopt precision agriculture technologies was higher for farmers who rotatedcotton with other crops. However, compared with the other loading determinants, the impact ofthis variable on adoption propensity was relatively small in magnitude. Taking the average over theadoption odds in table 5, cotton farmers practicing crop rotation were 0.68% more likely to use somecombination of the technologies considered.
The propensity to adopt one or a combination of the technologies analyzed was greater forfarmers participating in a federally sponsored working land conservation programs. This variablehad the strongest association with adoption propensity scores in terms of relative magnitude.Averaging over the log-odd entries in table 5, producers participating in a working land conservationprogram were 201% more likely to adopt a combination of the technologies considered here.
Adoption propensity scores were higher for producers located in the Delta region but relativelylower for operations located in the southeast region.
Principal Component Analysis of Adoption Propensity Scores
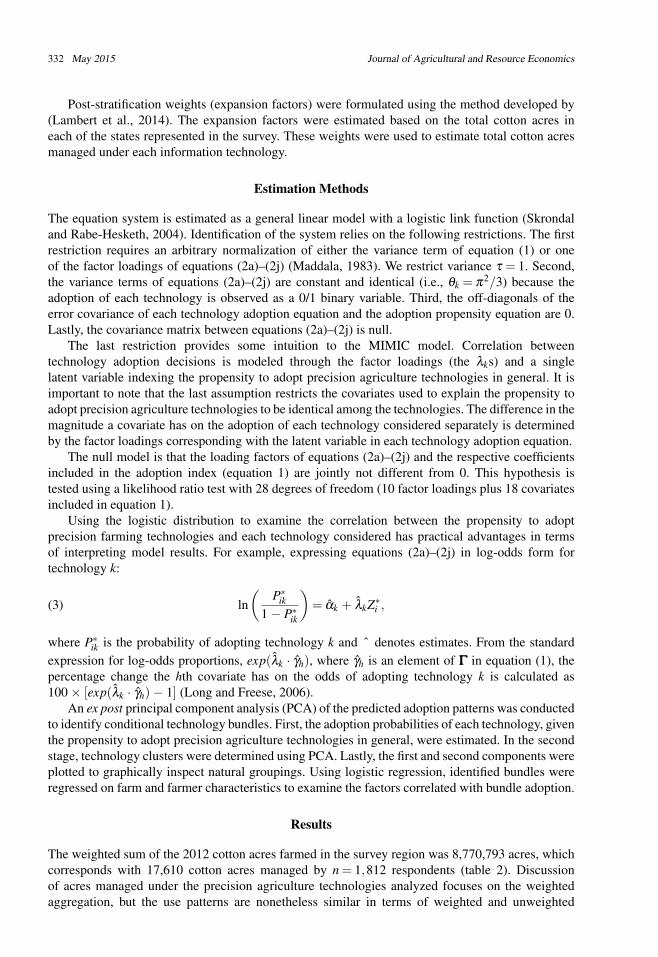
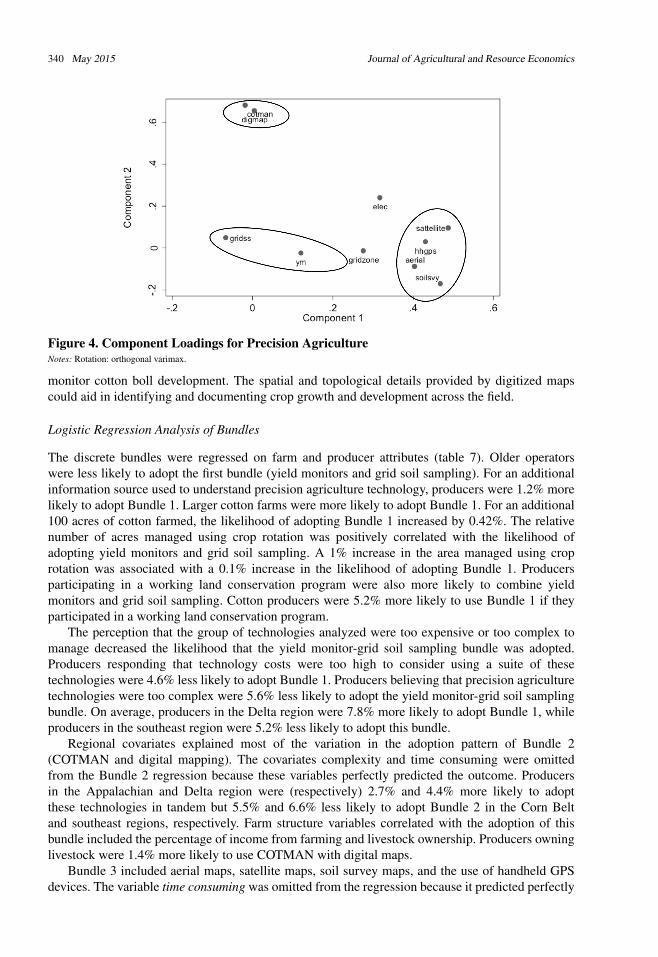
Statistical grouping of the technology indicator predicted values estimated with the MIMIC modelwere analyzed with principal component analysis. Examination of the eigenvalues suggests that thefirst principal component explained 93.1% of the variation in the set of predicted values (table 6). Thefirst two principal components account for 99.6% of the cumulative proportion of total variance. Weconclude principal components 1 and 2 adequately explain the variation among the set of predictedvalues and focus on their relationship using a factor loading plot (figure 4).
Three technology bundles are evident in figure 4. The first, Bundle 1, includes grid soil samplingand cotton yield monitors. Grid soil sampling is one of the gateway technologies into precisionagriculture. Cotton yield monitors became available by the end of the twentieth century. Thispairing is consistent for gauging the relationships between soil fertility and yield. Bundle 2 includessatellite and aerial maps, handheld GPS devices, and soil survey maps. Combined, these informationtechnologies provide a composite picture of field soil and landscape heterogeneity. The third bundle,Bundle 3, includes digitized maps and COTMAN. COTMAN is a software package designed to
340 May 2015 Journal of Agricultural and Resource Economics
Figure 4. Component Loadings for Precision AgricultureNotes: Rotation: orthogonal varimax.
monitor cotton boll development. The spatial and topological details provided by digitized mapscould aid in identifying and documenting crop growth and development across the field.
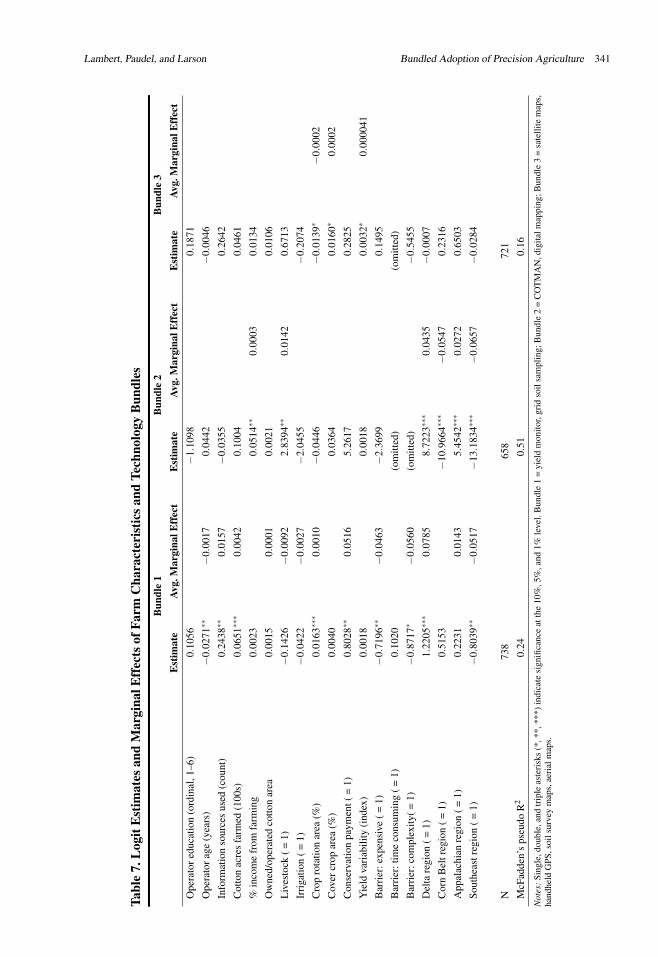
Logistic Regression Analysis of Bundles
The discrete bundles were regressed on farm and producer attributes (table 7). Older operatorswere less likely to adopt the first bundle (yield monitors and grid soil sampling). For an additionalinformation source used to understand precision agriculture technology, producers were 1.2% morelikely to adopt Bundle 1. Larger cotton farms were more likely to adopt Bundle 1. For an additional100 acres of cotton farmed, the likelihood of adopting Bundle 1 increased by 0.42%. The relativenumber of acres managed using crop rotation was positively correlated with the likelihood ofadopting yield monitors and grid soil sampling. A 1% increase in the area managed using croprotation was associated with a 0.1% increase in the likelihood of adopting Bundle 1. Producersparticipating in a working land conservation program were also more likely to combine yieldmonitors and grid soil sampling. Cotton producers were 5.2% more likely to use Bundle 1 if theyparticipated in a working land conservation program.
The perception that the group of technologies analyzed were too expensive or too complex tomanage decreased the likelihood that the yield monitor-grid soil sampling bundle was adopted.Producers responding that technology costs were too high to consider using a suite of thesetechnologies were 4.6% less likely to adopt Bundle 1. Producers believing that precision agriculturetechnologies were too complex were 5.6% less likely to adopt the yield monitor-grid soil samplingbundle. On average, producers in the Delta region were 7.8% more likely to adopt Bundle 1, whileproducers in the southeast region were 5.2% less likely to adopt this bundle.
Regional covariates explained most of the variation in the adoption pattern of Bundle 2(COTMAN and digital mapping). The covariates complexity and time consuming were omittedfrom the Bundle 2 regression because these variables perfectly predicted the outcome. Producersin the Appalachian and Delta region were (respectively) 2.7% and 4.4% more likely to adoptthese technologies in tandem but 5.5% and 6.6% less likely to adopt Bundle 2 in the Corn Beltand southeast regions, respectively. Farm structure variables correlated with the adoption of thisbundle included the percentage of income from farming and livestock ownership. Producers owninglivestock were 1.4% more likely to use COTMAN with digital maps.
Bundle 3 included aerial maps, satellite maps, soil survey maps, and the use of handheld GPSdevices. The variable time consuming was omitted from the regression because it predicted perfectly
Lambert, Paudel, and Larson Bundled Adoption of Precision Agriculture 341
Tabl
e7.
Log
itE
stim
ates
and
Mar
gina
lEff
ects
ofFa
rmC
hara
cter
istic
sand
Tech
nolo
gyB
undl
esB
undl
e1
Bun
dle
2B
undl
e3
Est
imat
eAv
g.M
argi
nalE
ffec
tE
stim
ate
Avg.
Mar
gina
lEff
ect
Est
imat
eAv
g.M
argi
nalE
ffec
tO
pera
tore
duca
tion
(ord
inal
,1–6
)0.
1056
−1.
1098
0.18
71O
pera
tora
ge(y
ears
)−
0.02
71∗∗
−0.
0017
0.04
42−
0.00
46In
form
atio
nso
urce
sus
ed(c
ount
)0.
2438∗∗
0.01
57−
0.03
550.
2642
Cot
ton
acre
sfa
rmed
(100
s)0.
0651∗∗∗
0.00
420.
1004
0.04
61%
inco
me
from
farm
ing
0.00
230.
0514∗∗
0.00
030.
0134
Ow
ned/
oper
ated
cotto
nar
ea0.
0015
0.00
010.
0021
0.01
06L
ives
tock
(=1)
−0.
1426
−0.
0092
2.83
94∗∗
0.01
420.
6713
Irri
gatio
n(=
1)−
0.04
22−
0.00
27−
2.04
55−
0.20
74C
rop
rota
tion
area
(%)
0.01
63∗∗∗
0.00
10−
0.04
46−
0.01
39∗
−0.
0002
Cov
ercr
opar
ea(%
)0.
0040
0.03
640.
0160∗
0.00
02C
onse
rvat
ion
paym
ent(
=1)
0.80
28∗∗
0.05
165.
2617
0.28
25Y
ield
vari
abili
ty(i
ndex
)0.
0018
0.00
180.
0032∗
0.00
0041
Bar
rier
:exp
ensi
ve(=
1)−
0.71
96∗∗
−0.
0463
−2.
3699
0.14
95B
arri
er:t
ime
cons
umin
g(=
1)0.
1020
(om
itted
)(o
mitt
ed)
Bar
rier
:com
plex
ity(=
1)−
0.87
17∗
−0.
0560
(om
itted
)−
0.54
55D
elta
regi
on(=
1)1.
2205∗∗∗
0.07
858.
7223∗∗∗
0.04
35−
0.00
07C
orn
Bel
treg
ion
(=1)
0.51
53−
10.9
664∗∗∗
−0.
0547
0.23
16A
ppal
achi
anre
gion
(=1)
0.22
310.
0143
5.45
42∗∗∗
0.02
720.
6503
Sout
heas
treg
ion
(=1)
−0.
8039∗∗
−0.
0517
−13.1
834∗∗∗
−0.
0657
−0.
0284
N73
865
872
1M
cFad
den’
sps
eudo
R2
0.24
0.51
0.16
Not
es:S
ingl
e,do
uble
,and
trip
leas
teri
sks
(*,*
*,**
*)in
dica
tesi
gnifi
canc
eat
the
10%
,5%
,and
1%le
vel.
Bun
dle
1=
yiel
dm
onito
r,gr
idso
ilsa
mpl
ing;
Bun
dle
2=
CO
TM
AN
,dig
italm
appi
ng;B
undl
e3
=sa
telli
tem
aps,
hand
held
GPS
,soi
lsur
vey
map
s,ae
rial
map
s.
342 May 2015 Journal of Agricultural and Resource Economics
the outcome variable. Only three covariates were correlated with the adoption of this bundle, andthe associations were relatively weak in magnitude and statistical significance (at the 10% level ofsignificance).
Discussion and Conclusions
This study isolated discrete bundles of precision agriculture information technologies based onthe adoption patterns of ten technologies by cotton producers. A three-step approach was usedto statistically determine which precision information technologies cotton producers appear to beusing in concert. In the first step, adoption patterns were analyzed using a MIMIC model. Next,the set of predicted patterns was analyzed using Principal Component Analysis (PCA) to isolateclusters of technologies used together. In the third step, the bundles identified were regressed onoperator characteristics and farm structure attributes. Three discrete bundles were identified afterconditioning adoption decisions on farm operator and structure covariates, which included 1) yieldmonitors and grid soil sampling; 2) COTMAN and digital maps; and 3) aerial, satellite imagery,handheld devices with GPS, and soil survey maps. Adoption of technology bundles was more likelyfor cotton growers managing relatively larger operations that used a variety of information sourcesto learn about precision farming. These producers also tended to irrigate their cotton, practice croprotation, and participate in federally sponsored working land conservation programs. Operations inthe Delta region exhibit a higher propensity to adopt precision information technologies.
Precision agriculture technologies may be adopted piecemeal or in bundles. Farmers adoptingprecision agriculture technologies may adjust their use of a technology as new informationabout complementary techniques becomes available. Positive experiences with so-called “gateway”precision agriculture technologies such as soil testing or use of soil survey maps may reducethe perceived risk associated with more complicated devices, eventually leading to what canbe described as technology stacking (for example, see Paxton et al., 2011). The precisionagriculture technology bundles analyzed here result from individual producers mixing and matchingtechnologies and practices to maximize profit. When a producer can leverage synergies betweeninformation technologies, scale economies of information emerge, thereby lowering the costs ofsite-specific information needed to make important managerial decisions.
From the perspective of agribusinesses, the ability to bundle goods lowers cost and increasesrevenue. Other reasons agribusinesses might sell precision agriculture technologies as a packagerelate to the purchasing behavior of farmers. In bundling goods, the price is determined by theconsumer who has the lowest willingness to pay for a good or service. When buyer markets arerelatively differentiated, businesses will likely have to lower prices to remain competitive. Bundlingtechnologies into a single package decreases preference variability. The market success of a newtechnology partly depends on how complementary the technology is to other aspects of the farmoperation but also on the adoption rate and complexity of the technology package, which in turnincreases the service provider’s market share.
The approach developed in this research is novel in terms of identifying and characterizingtechnology adoption patterns, but other approaches could be used to analyze bundling patternsresulting from the adoption of multiple technologies. Indeed, a limitation of the MIMIC modelapplied here is that the coefficients associated with operator attributes and farm characteristics thatdetermine adoption propensity are restricted to be similar across all technologies. Variation betweenthe relationship between covariates and technologies is permitted but manifests as a difference bya scalar constant. A case-by-case analysis of the unconditional bundles using logistic or probitregression would relax this restriction. Yet correlation between the adoption choices would becompromised. Alternatively, with an additional set of assumptions, most common bundles couldbe analyzed using, for example, multivariate probit regression.
[Received November 2014; final revision received May 2015.]
Lambert, Paudel, and Larson Bundled Adoption of Precision Agriculture 343
References
Bange, M. P., S. A. Deutscher, D. Larsen, D. Linsley, and S. Whiteside. “A HandheldDecision Support System to Facilitate Improved Insect Pest Management in AustralianCotton Systems.” Computers and Electronics in Agriculture 43(2004):131–147. doi:10.1016/j.compag.2003.12.003.
Boyer, C. N., B. C. English, R. Roberts, J. Larson, D. M. Lambert, M. M. Velandia, V. Zhou,S. L. Larkin, M. C. Marra, R. M. Rejesus, L. L. Falconer, S. W. Martin, A. K. Mishra,K. P. Paudel, C. Wang, J. Johnson, E. Segarra, and J. M. Reeves. “Results from aCotton Precision Farming Survey Across Fourteen Southern States.” New Orleans, LA:National Cotton Council of America, 2014. Available online at https://ncc.confex.com/ncc/2014/webprogram/Paper14957.html.
Daberkow, S. G., and W. D. McBride. “Farm and Operator Characteristics Affecting theAwareness and Adoption of Precision Agriculture Technologies in the US.” Precision Agriculture4(2003):163–177. doi: 10.1023/A:1024557205871.
Dillman, D. A. Mail and Telephone Surveys: The Total Design Method. New York: Wiley, 2001.Holland, J. K., B. Erickson, and D. A. Widmar. 2013 Precision Agricultural Services
Dealership Survey Results. West Lafayette, IN: Purdue University, Department ofAgricultural Economics, Center for Food and Agricultural Business, 2013. Availableonline at http://agribusiness.purdue.edu/files/resources/rs-11-2013-holland-erickson-widmar-d-croplife.pdf.
Jenkins, A., M. M. Velandia, D. M. Lambert, R. K. Roberts, J. A. Larson, B. C. English, and S. W.Martin. “Factors Influencing the Selection of Precision Farming Information Sources by CottonProducers.” Agricultural and Resource Economics Review 40(2011):1–14.
Joreskog, K. G., and A. S. Goldberger. “Estimation of a Model with Multiple Indicators andMultiple Causes of a Single Latent Variable.” Journal of the American Statistical Association70(1975):631–639. doi: 10.2307/2285946.
Lambert, D. M., B. C. English, D. C. Harper, S. L. Larkin, J. A. Larson, D. F. Mooney, R. K.Roberts, M. Velandia, and J. M. Reeves. “Adoption and Frequency of Precision Soil Testing inCotton Production.” Journal of Agricultural and Resource Economics 39(2014):115–132.
Larson, J. A., and R. K. Roberts. “Farmers’ Perceptions of Yield Variability as Influenced byPrecision Farming Information Gathering Technologies.” In Proceedings of the 26th AnnualMeeting, February 14–18, Tulsa, OK: Southern Agricultural Economics Association, 2004.Available online at http://ageconsearch.umn.edu/bitstream/34600/1/sp04la01.pdf.
Larson, J. A., R. K. Roberts, B. C. English, R. L. Cochran, and B. S. Wilson. “A Computer DecisionAid for the Cotton Yield Monitor Investment Decision.” Computers and Electronics in Agriculture48(2005):216–234. doi: 10.1016/j.compag.2005.04.001.
Larson, J. A., R. K. Roberts, B. C. English, S. L. Larkin, M. C. Marra, S. W. Martin, K. W.Paxton, and J. M. Reeves. “Factors Affecting Farmer Adoption of Remotely Sensed Imageryfor Precision Management in Cotton Production.” Precision Agriculture 9(2008):195–208. doi:10.1007/s11119-008-9065-1.
Long, J. S., and J. Freese. Regression Models for Categorical Dependent Variables Using Stata.College Station, TX: StataCorp, 2006, 2nd ed.
Lowenberg-DeBoer, J. “Adoption of GPS Based Guidance Systems in Agriculture.” In Successesin Precision Agriculture: The Proceedings of the 4th Annual Conference, Brandon, Manitoba:ASA-CSSA-SSSA, 1999. Available online at http://dynamo.ecn.purdue.edu/∼biehl/SiteFarmin/publications.html.
Maddala, G. S. Limited-Dependent and Qualitative Variables in Econometrics. Cambridge:Cambridge University Press , 1983.
344 May 2015 Journal of Agricultural and Resource Economics
Maddala, G. S., and R. P. Trost. “Alternative Formulations of the Nerlove-Press Models.” Journalof Econometrics 16(1981):35–49. doi: 10.1016/0304-4076(81)90074-9.
Martin, S. W., and T. D. Varco. “Economic Comparison of On-Board Module Builder HarvestMethods.” In Proceedings of 2008 Beltwide Cotton Conferences, Memphis, TN: National CottonCouncil, 2008, 802–804.
McFadden, D. “Conditional Logit Analysis of Qualitative Choice Behavior.” In P. Zarembka, ed.,Frontiers of Econometrics, New York: Academic Press, 1974, 105–142.
Mooney, D. F., R. K. Roberts, B. English, D. M. Lambert, J. Larson, M. Velandia, S. Larkin,M. C. Marra, S. W. Martin, A. Mishra, K. W. Paxton, R. M. Rejesus, E. Segarra, C. Wang,and J. M. Reeves. “Precision Farming by Cotton Producers in Twelve Southern States: Resultsfrom the 2009 Southern Cotton Precision Farming Survey.” Research Series 10-02, Universityof Tennessee, Knoxville, Department of Agricultural and Resource Economics, 2010. Availableonline at http://ageconsearch.umn.edu/bitstream/91333/2/2009
Neter, J., M. H. Kutner, C. J. Nachtsheim, and W. Wasserman. Applied Linear Statistical Models.Chicago: Irwin, 1996.
Pandit, M., K. Paudel, A. Mishra, and E. Segarra. “Precision Farming Technology Adoption inCotton Farming: Duration Analysis.” Selected poster presented at the 2011 Annual Meeting ofthe Agricultural and Applied Economics Association, Pittsburgh, PA, July 24-26, Agriculturaland Applied Economics Association, 2011.
Paxton, K. W., A. K. Mishra, S. Chintawar, R. K. Roberts, J. A. Larson, B. C. English, D. M.Lambert, M. C. Marra, S. L. Larkin, J. M. Reeves, and S. W. Martin. “Intensity of PrecisionAgriculture Technology Adoption by Cotton Producers.” Agricultural and Resource EconomicsReview 40(2011):133–144.
Perloff, J. M. Microeconomics. Boston: Pearson Addison-Wesley, 2007.Reuters. “Case IH Module Express 625 Streamlines Cotton Harvest.” Reuters (2008). Available
online at http://www.reuters.com/article/2008/01/08/idUS130336+08-Jan-2008+MW20080108.Richards, T. J., and S. R. Jeffrey. “Efficiency and Economic Performance: An Application of the
MIMC Model.” Journal of Agricultural and Resource Economics 25(2000):232–251.Roberts, R. K., B. C. English, J. A. Larson, R. L. Cochran, W. R. Goodman, S. L. Larkin, M. C.
Marra, S. W. Martin, W. D. Shurley, and J. M. Reeves. “Adoption of Site-Specific Information andVariable-Rate Technologies in Cotton Precision Farming.” Journal of Agricultural and AppliedEconomics 36(2004):143–158. doi: 10.1017/S107407080002191X.
———. “The Variable-Rate Input Application Decision for Multiple Inputs with Interactions.”Journal of Agricultural and Resource Economics 31(2006):391–413. Available online athttp://econpapers.repec.org/article/agsjlaare/8616.htm.
Schimmelpfennig, D., and R. Ebel. “On the Doorstep of the Information Age: Recent Adoptionof Precision Agriculture.” Economic Information Bulletin, U.S. Deptartment of Agriculture,Economic Research Service, Washington, DC, 2011. Available online at http://purl.fdlp.gov/GPO/gpo15242.
Skrondal, A., and S. Rabe-Hesketh. Generalized Latent Variable Modeling: Multilevel,Longitudinal, and Structural Equation Models. Boca Raton: Chapman & Hall/CRC Press, 2004.
Tenkorang, F., and J. Lowenberg-DeBoer. “On-Farm Profitability of Remote Sensing inAgriculture.” Journal of Terrestrial Observation 1(2008):50–59.
United States Department of Agriculture, Economic Research Service. “Agricultural and ResourceManagement Survey.” 2007. Available online at http://www.ers.usda.gov/data-products/arms-farm-financial-and-crop-production-practices.aspx.
United States Department of Agriculture, National Resources Conservation Services. “EQIPNutrient Management Options.” 2011. Available online at http://www.nrcs.usda.gov/Internet/FSE_DOCUMENTS/ nrcs142p2_006212.pdf.
Varian, H. R. Intermediate Microeconomics: A Modern Approach. New York: W.W. Norton & Co.,1999.

Lambert, Paudel, and Larson Bundled Adoption of Precision Agriculture 345
Walton, J. C., D. M. Lambert, R. K. Roberts, J. A. Larson, B. C. English, S. L. Larkin, S. W. Martin,M. C. Marra, K. W. Paxton, and J. M. Reeves. “Adoption and Abandonment of Precision SoilSampling in Cotton Production.” Journal of Agricultural and Resource Economics 33(2008):428–448.
Walton, J. C., J. A. Larson, R. K. Roberts, D. M. Lambert, B. C. English, S. L. Larkin, M. C. Marra,S. W. Martin, K. W. Paxton, and J. M. Reeves. “Factors Influencing Farmer Adoption of PortableComputers for Site-Specific Management: A Case Study for Cotton Production.” Journal ofAgricultural and Applied Economics 42(2010a):193–209. doi: 10.1017/S1074070800003400.
Walton, J. C., R. K. Roberts, D. M. Lambert, J. A. Larson, B. C. English, S. L. Larkin, S. W. Martin,M. C. Marra, K. W. Paxton, and J. M. Reeves. “Grid Soil Sampling Adoption and Abandonment inCotton Production.” Precision Agriculture 11(2010b):135–147. doi: 10.1007/s11119-009-9144-y.
Zellner, A. “Estimation of Regression Relationships Containing Unobservable IndependentVariables.” International Economic Review 11(1970):441–454. doi: 10.2307/2525323.