Embed Size (px)
Citation preview

Questions from Edexcel’s Exam Wizard compiled by JustMaths – this is definitely NOT a prediction paper and should not be used as such!
BUMPER “BETWEEN PAPERS” PRACTICE PAPERS
SET 1 (of 3)
Foundation Tier (Summer 2017)
EXAMINERS REPORTS & MARKSCHEME
Not A “best” Guess paper.
Neither is it a “prediction” ... only the examiners know what is going to come up! Fact!
You also need to REMEMBER that just because a topic came up on paper 1 it may still come up on papers 2 or 3 …
We know how important it is to practise, practise, practise …. so we’ve
collated a load of questions that weren’t examined in the pearson/edexcel NEW 9-1 GCSE Maths paper 1 but we cannot guarantee how a topic will be
examined in the next papers …
Enjoy!
Mel & Seager

Questions from Edexcel’s Exam Wizard compiled by JustMaths – this is definitely NOT a prediction paper and should not be used as such!
EXAMINERS COMMENTS
Q1 There were many correct responses to part (a) but many wrote 0.37, 0.46, 0.401, 0.439
often because they were trying to order 37, 46, 401 and 439 In part (b) many students tried to convert all the numbers to decimals but then struggled to
convert to a decimal and often wrote that was 0.6 when written as a decimal.
Q2. All parts of this question were answered well.
Q3. Part (a) of this question was not well done by most students. Common errors
included drawing a line from −2 to the left, using a filled in circle at −2 and indicating a line of finite length which ended at 4. Not all students attempted part (b) of the
question. Of those students who did attempt this part, a fair proportion of them got
as far as obtaining the value and used this value in their final answer giving
on the answer line. Only a small number of students gave an integer
answer with some of these students giving 3 as their answer. Some students
employed a trial and error approach. A surprising number of these higher tier students made basic errors in the manipulation of the inequality. For example, "4y − y < 7 −
1" was commonly seen. Q4. Part (a) was well answered. Most candidates were able successfully to write down the
coordinates of G and many also found the coordinates of H correctly.
In part (b), candidates who had drawn a line between the two points were generally more successful at finding the midpoint. Many gained part marks by either indicating on the diagram
or by writing one correct coordinate. The most common answers that scored no marks were (1,0) where candidates had not made any mark on the diagram.
Q5 Part (a) was successfully answered by about 80% of candidates. Others generally involved indices in their answers with not only d4 commonly seen but also 4d.
Candidates could be reminded of the need for clear writing in their answers so that 4d never looks more like 4d.
In part (b) the negative sign associated with the 2f term caused difficulties. Some candidates ignored it and added 2f to 3f instead. Others linked it with the preceding
4 instead and often gave f – 10 as their final answer. It may be helpful to encourage students to circle or underline each like term together with its preceding sign. Many
candidates who gave the correct expression f + 10 in their working spoilt their final
answer by further incorrect simplification to 11f.
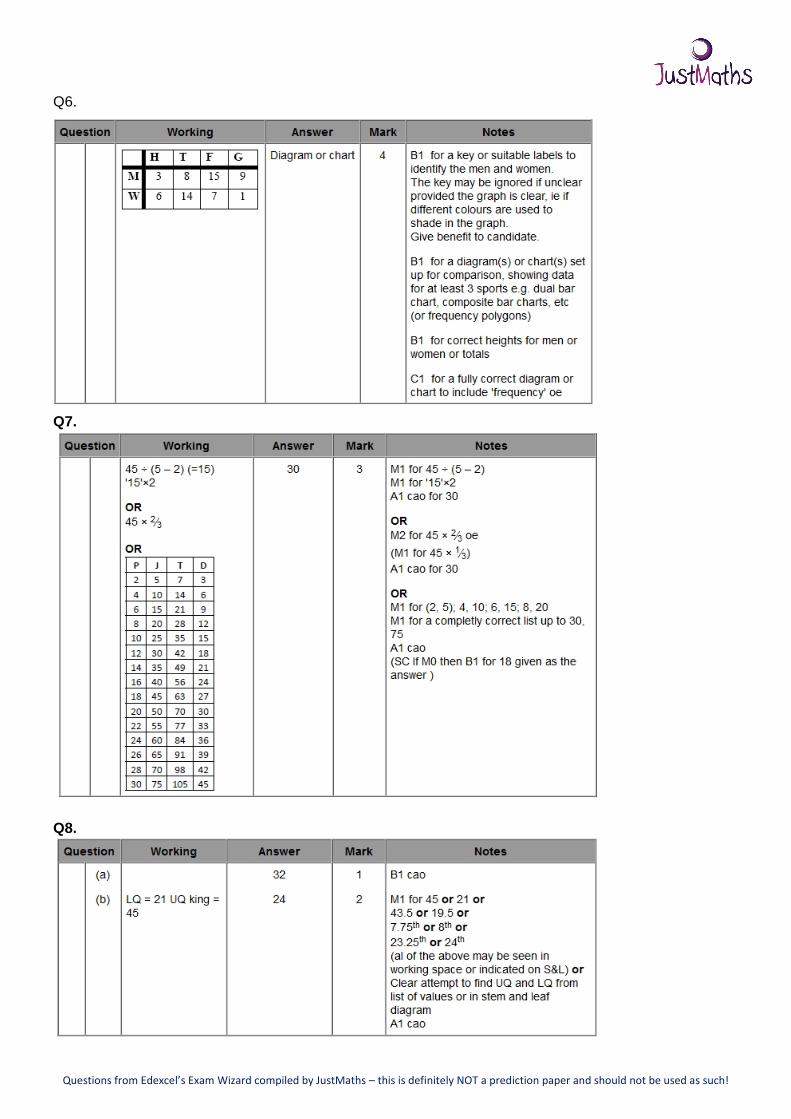
Q6. Many students were able to produce a suitable diagram to score at least 3 marks. The most common error was to omit the labelling on the frequency axis. Words such
as ' Frequency' or 'Number of students' were allowed for this label. Some candidates
forgot to put a key but this tended to be rare. By far the greatest number of answers were dual bar charts. Most candidate were able to give a linear scale and to plot the
8 heights correctly.
Q7. This question was found challenging as it was not making the common demand of sharing an amount in a given ratio. There were three successful strategies used.
Firstly, some candidates turned it into a problem they were more used to and looked for a number which when shared in the ration 2:5 gave a difference of 45. As they
Questions from Edexcel’s Exam Wizard compiled by JustMaths – this is definitely NOT a prediction paper and should not be used as such!
had calculators this could be done fairly quickly. Secondly, some candidates started with the ratio 2:5 and built up through 4:10, 6:15 and so on until
they reached 30:75. Thirdly, some candidates carried out the most efficient method
of dividing 45 by 3 and then multiplying the resulting value by 2. Many candidates treated the question as a 'divide in the ratio' and scored no marks. Others gave an
answer of 18 obtained from 45 ÷ 5 × 2.
Q8. Part (a) was well answered although some candidates failed to interpret the diagram correctly and gave 2 rather than 32 as the median.
In part (b) 49 was a common incorrect answer from those candidates who worked out the range rather than, as requested, the interquartile range. Others attempted to work
out the interquartile range by halving the range. Some candidates worked out that the lower and upper quartiles would come from the 7.75th and 23.25th (or 8th and
24th) values but then went onto subtract 7.75 from 23.25 rather than use the values
of the variable associated with them.
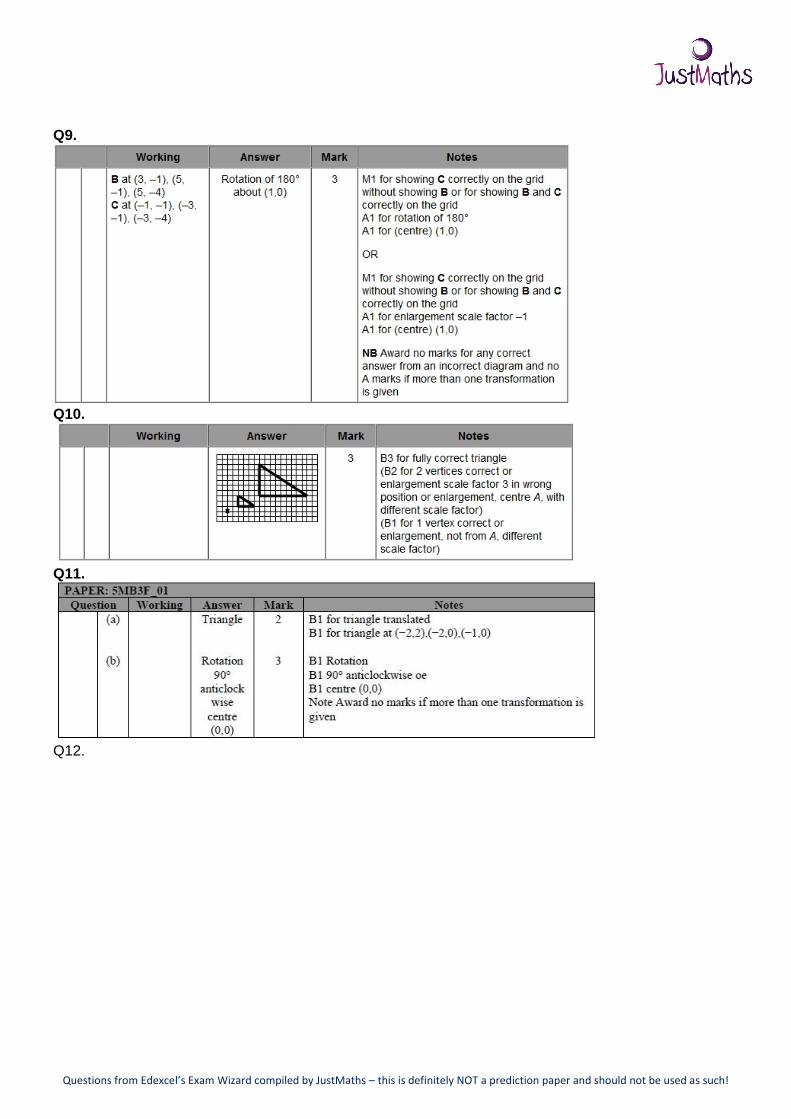
Q9. Most candidates attempted to draw triangles B and C with a majority placing them correctly on the grid. Errors in the correct positioning of triangle B or triangle C were
sometimes due to candidates not being able to identify the line x = 1 and some
confused the x- and y-axes. In some cases it was difficult to determine how the candidate had come up with their images. The majority of the candidates who drew
triangles B and C in the correct positions were able to give a correct description of the transformation, although a common mistake was to give the centre of rotation as (0,
1) instead of (1, 0). A small number of candidates lost a mark because their description of the rotation did not include an angle or because they wrote the centre
of rotation as a vector. Fewer candidates than in the past gave more than one transformation.
Q10. Many fully correct enlargements were seen and those candidates who didn't get
full marks often gained two marks for an enlargement with scale factor 3 but in the wrong position. A substantial number of candidates did not seem to understand the
significance of the centre of enlargement. A common wrong answer was to use the centre of enlargement as one of the vertices in the enlarged shape. Candidates using
the ray method rather than 'counting squares' sometimes misplaced the vertices
through inaccurate line drawing. It was disappointing to see some candidates lose marks through carelessness and be up to half a square out with some of their vertices.
Q11. In part (a) too many students failed to understand the term "translate"; this
was evidenced by examples of rotations and reflections. Part (b) was answered with greater success. Many noted it was a rotation, and this was usually followed by a
description of direction and angle, with only a minority making errors in this statement. Missing out a reference to the centre of rotation was a common error.
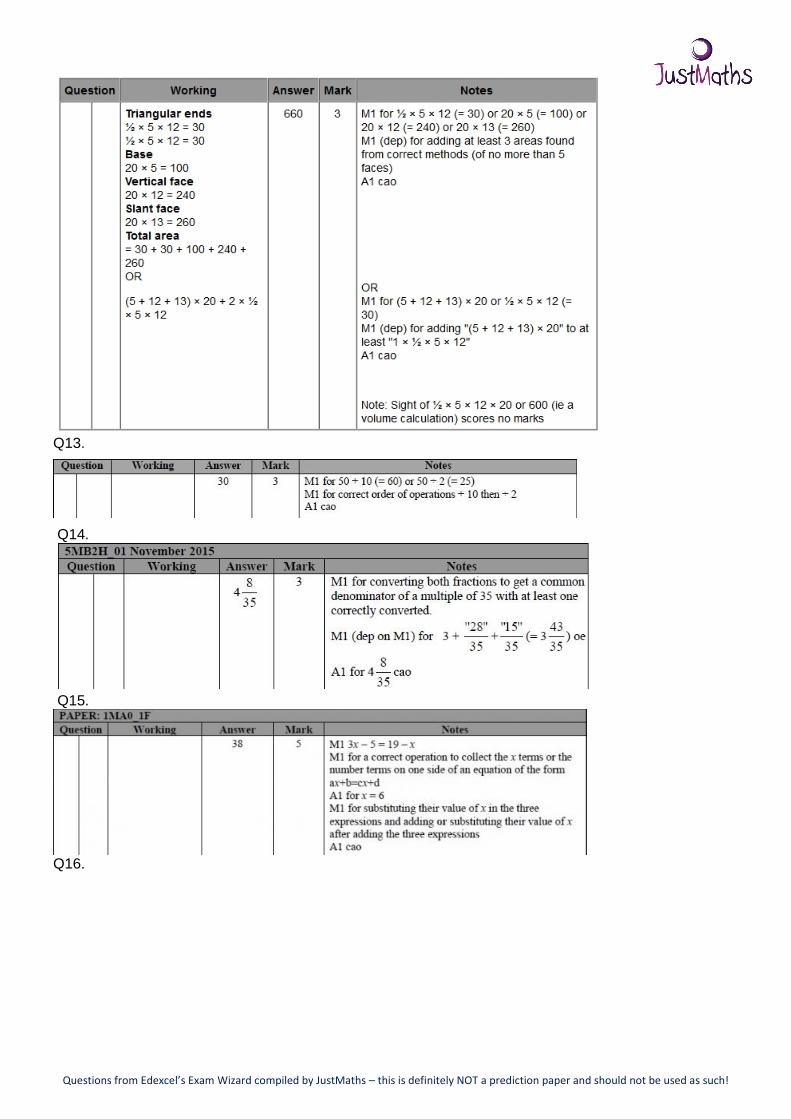
Q12. A great many candidates, even at this level, still do not know how to find the
area of a triangle; 12 × 5 = 60 cm2 was often seen, and candidates would repeat this for the second triangular end. Many candidates again did not read the question
carefully and attempted to find volume. Some candidates who did correctly work out the area of the front triangular end at 30 cm2 then worked out ½ × 13 × 5 for the
triangular end at the back. Other errors were often made by candidates not attempting to find the area of all of the 5 faces. Many candidates made the incorrect assumption
that all three of the rectangular faces were identical, usually 20cm by 13cm.
Questions from Edexcel’s Exam Wizard compiled by JustMaths – this is definitely NOT a prediction paper and should not be used as such!
Q13. This standard question was well understood by the candidates. They were able
to invert the process and the order and so end up with the correct answer of 30. Several candidates selected the wrong number (usually 50) from an equation in which
the correct answer was embedded and a few subtracted 10 from 50 and then divided by 2 giving an answer of 20
Q14. Many students did attempt to make a common denominator but often they only managed to get one of the two fractions correctly converted so could only access two
of the three marks available. Others added the fractions correctly but forgot to add the whole number. Some started by converting the mixed number into an improper
fraction but then could not cope with 19 × 7. Others left their answer as an improper fraction.
Q15. Fully correct algebraic solutions were rare and where sometimes attempted with
an assumption that the question would involve a perimeter or even angle total equation.
Some candidates set up a correct equation and found x = 6 from incorrect algebra so failed to gain maximum marks. Many candidates used trial and improvement to find
x = 6 and proceeded to gain full marks following correct substitution in individual side
lengths that were then added
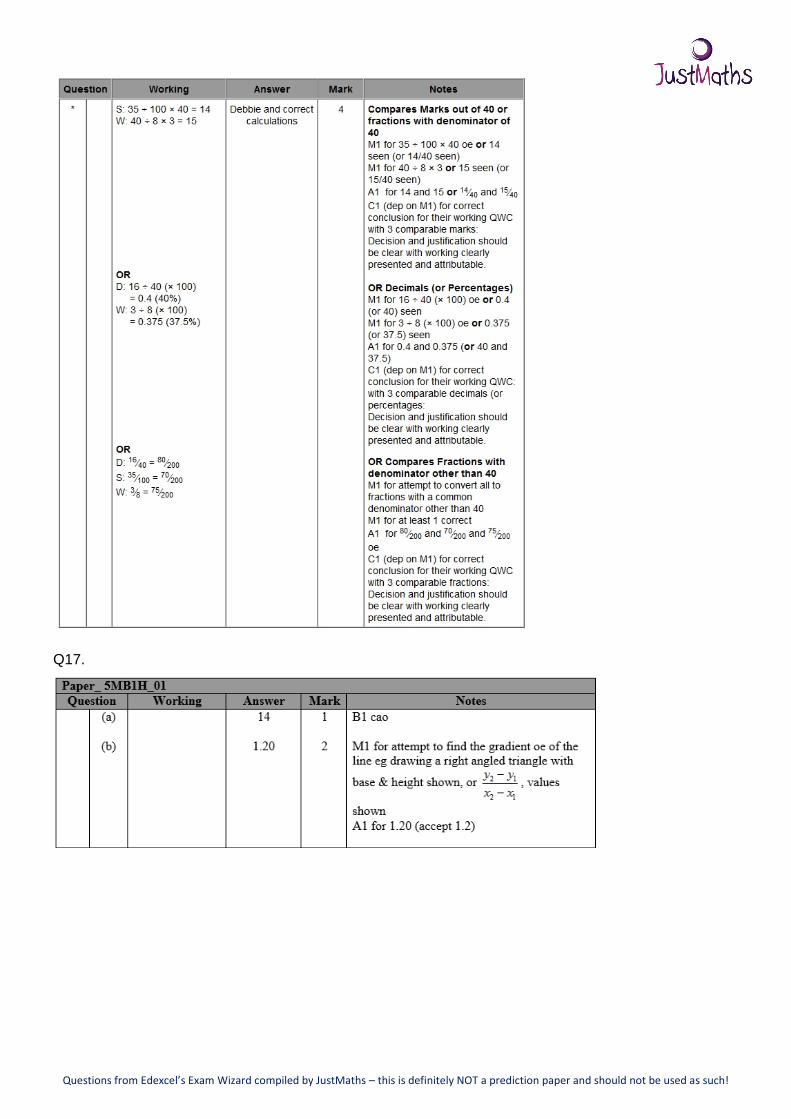
Q16. Candidates seemed to be aware that they needed to convert to a common
format, with the most common method being to convert all the marks to 'out of 40'. Many candidates found either the 14 or 15. The most problematic conversion was
finding 3⁄8 of 40 with the common error seen being 3 × 8, giving Wendy a winning score of 24. Errors in calculating 35% of 40 came from attempting to multiply by 35
then divide by 100. More popular, and for many it proved easier, was to calculate 35% by doing 10% + 10% + 10% + 5%. Any errors here were in finding the 5%.
Percentage comparison was the least seen method, and was done with little success.
Working and conclusions were generally well presented, although some did not make
clear which mark went with which person. In some instances candidates found the marks for Salma or Wendy, failing to realise that a comparison could only be made
when all three had been converted into the same form.
Overall, 24% scored all 4 marks and 50% failed to score. 11% of candidates scored
1 mark for showing a correct method for one conversion.
Q17. Perhaps surprisingly, it is disappointing to report that many students were
unable to identify what they needed to do in this question, particularly in part (b). Those students who did realise that they needed to divide cost by number of cubic
metres of water often took the readings from one point and divided the y coordinate by the x coordinate rather than the increase in cost divided by the increase in volume,
that is they failed to find the gradient of the line. Methods were often not made clear and relatively few students showed a triangle drawn on the line to help them work out
the gradient. Where students did draw triangles and use an appropriate method for finding the gradient, they often did not interpret the scales on the axes correctly and
so obtained an incorrect answer. Thus relatively few students were awarded 1 mark for a correct method (but an incorrect answer). Some students answered part (b) in
the working space for part (a).
Questions from Edexcel’s Exam Wizard compiled by JustMaths – this is definitely NOT a prediction paper and should not be used as such!
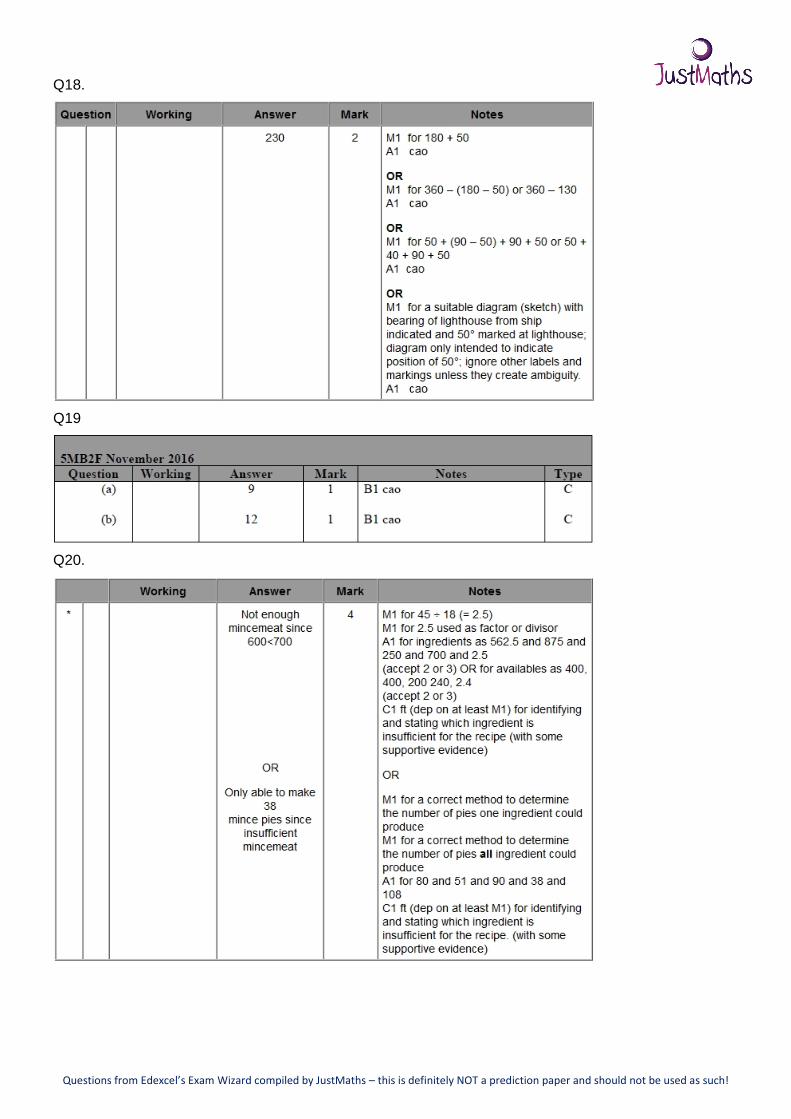
Q18. Some candidates attempted this question with a diagram, either a sketch or
scaled. In very few cases did this approach help them, since there was clearly little
understanding of bearings as drawn clockwise from a north line. It was also common to see reflex angles drawn as obtuse, and vice versa. The most common incorrect
answer was 310°, from 360° – 50°. Other common errors involved confusion of the relative location of the ship and the lighthouse.
Overall, this was a poorly answered question showing bearings as a general weakness.
Q19. Both parts of this questions were answered well by most students. Almost all were able to read the distance from home for part (a), and again many achieved the
mark in part (b) for recognising the flat part of the graph represented no movement and interpreted the graph correctly.
Q20.Candidates employed a variety of methods to solve this question. One method
involved finding the scale factor (2.5) and scaling up the ingredients, a second involved finding the number of pies one ingredient could produce, whilst a third
method involved finding the number of times batches of 18 could be produced (ie 2
½ )
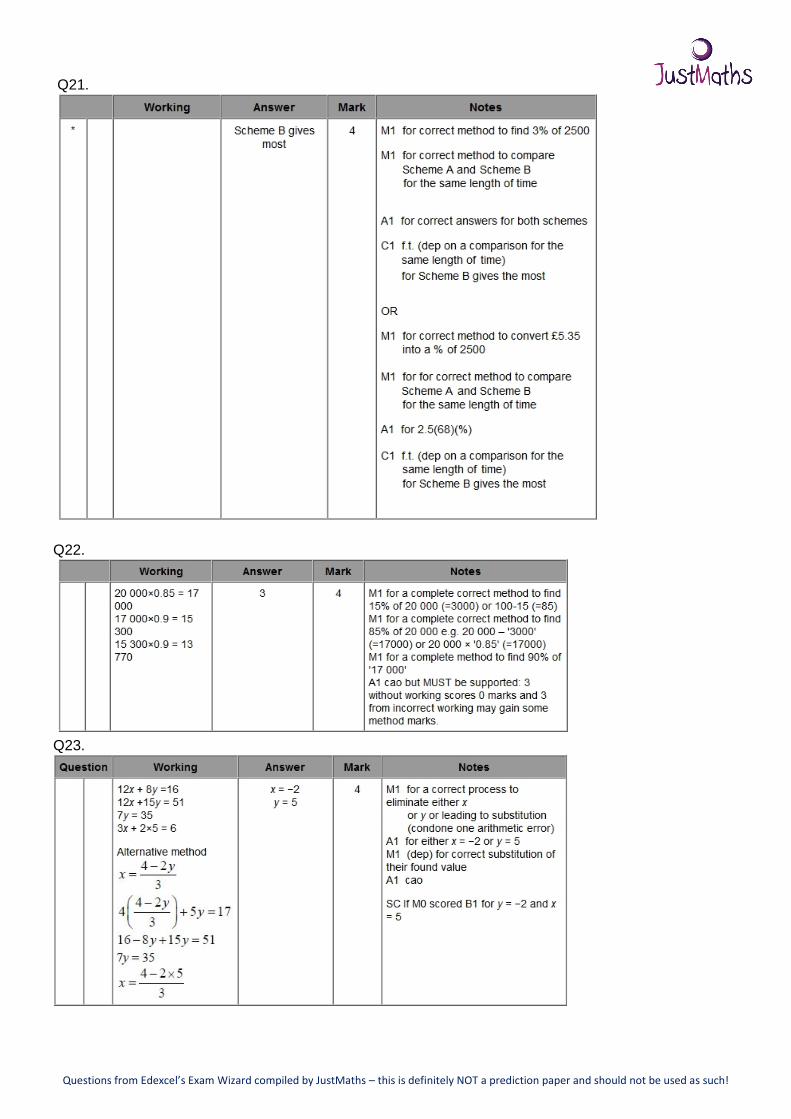
Q21. It was pleasing to note that over 40% of candidates scored all four marks. Many of those candidates who scored no marks were able to calculate the value of 192.6 or
2692.6 for scheme A, but then failed to negotiate the percentage element of scheme B. Many candidates used a chunking method to find 3% of 2500, mostly with success.
Some candidates used a compound interest method correctly and some gained two marks as they then correctly compared both schemes using the same time scale. One
common error was for candidates to add £5.35 and 2500, then multiplying this by 36.
Q22. Some candidates found this question more challenging. They could often find 10% and/or 5% but not always of the correct figures. A sizeable number calculated
all their percentages from £20,000, either thinking the question was asking for simple interest, or just in error. Thus subtracting £3000 and then £2000 gaining the correct
number of years by an incorrect method, this did not gain full marks.
Some candidates stopped after correctly calculating £15,300 and stated 3 years, this was deemed sufficient for full marks.
Q23. There were many instances where arithmetic errors spoilt otherwise sound
method. Rearrangement usually led to error, but there were very few trial and improvement approaches. The elimination method was used by nearly all candidates,
though 7x = 14 was the common error.
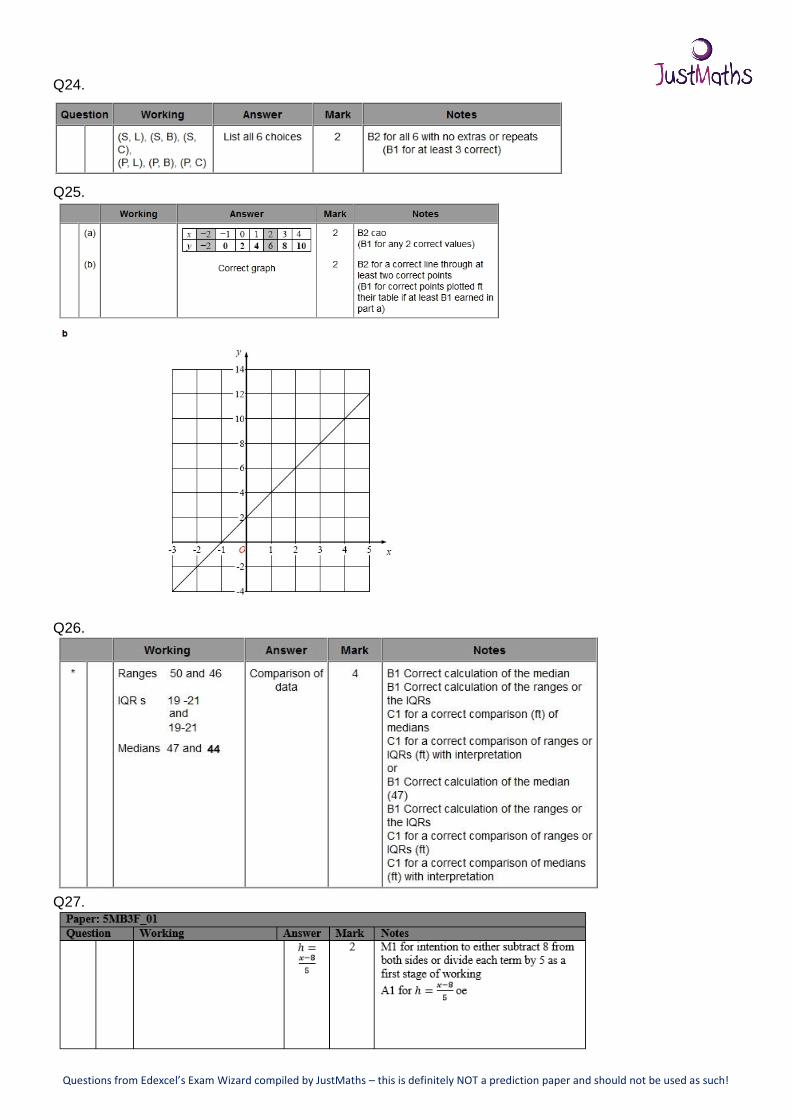
Q24. The vast majority of candidates were able to score full marks. Some used the full words but obvious abbreviations were also allowed. There were a few responses
where the candidate showed a misunderstanding of the nature of the task and gave two starters, for example, as a combination.
Q25.
Q26 For a question such as this, candidates have to decide which (simple) statistics they can and are able to calculate in order for a comparison to be made. Some were

Questions from Edexcel’s Exam Wizard compiled by JustMaths – this is definitely NOT a prediction paper and should not be used as such!
unaware of this and worked out the mean.
Many other candidates worked out the median and the values of the lower quartile
and upper quartile as these were given for the distribution of heights of the unfertilised
plants. This gained one mark (for the median).
To get further marks, candidates had to work out a measure of spread and then
comment on the relationship between the medians and between the interquartile ranges (IQRs) or the ranges. This could be as simple as 'The median of the heights of
the fertilised plants is greater than the heights of the unfertilised plants'.
For full marks, it was expected that there would be some simple interpretation, for
example, 'Since the median of the fertilised plants is bigger than the median of the unfertilised plants, on average the fertilised plants grew taller'. This sort of response
was not frequently seen.
It was very important in this question that the results of calculations were identified,
for example, the median had to be stated as 47 (cm). It was not sufficient simply to
circle 47 in the list of heights.
Q27. Students had little success with changing the subject of this formula with a few managing the first step, invariably to subtract 8 from both sides. Errors with algebraic
manipulation were common with addition of 8 or even subtraction of 5 from both sides
seen.
Q28. Most students approached this question by adding 9 minutes many times to
6.45 and then adding 12 minutes to 6.45. There were some arithmetic errors found
when using this approach. Those that were able to do this accurately tended to get the correct answer of 7.21 am. Some students approached this by trying to find the
LCM of 9 and 12 but many of these who found the LCM was 36 then failed to add this on to 6.45 am.
Q29. A variety of diagrams were seen. Some candidates insist on joining the first to
last points forming an enclosed shape. This may come from their interpretation of the word polygon in this question. Centres should ensure candidates are aware this is not
correct when drawing a frequency polygon. Another common error is to plot the heights at the end of the intervals. If candidates did this consistently they were
awarded one mark. Some candidates draw the histogram first and then add the frequency polygon, this is an acceptable method and full marks can be awarded.
Q30. Also a good discriminator, there were some completely correct solutions to this
geometry question and where a solution was not complete, it was often possible for
examiners to award partial credit to students who had made some progress.
The most common error made was in the calculation of the size of angle PTR. Some
students worked out the size of the angle QRD then stated that angle PTR was the same size. This was without foundation as there was no indication that the line PT was
parallel to the line QR.
Q31. Part (a) was fairly well answered being based essentially on knowledge. Part (b)
was less successfully answered as it was clear that many students could not use standard form on their calculator. The most common approach was to convert the
standard form into ordinary numbers and then use a calculator (or not) to perform the division. This worked often, but many of these students left their answer as 500

Questions from Edexcel’s Exam Wizard compiled by JustMaths – this is definitely NOT a prediction paper and should not be used as such!
or 'five hundred' rather than as 5 × 10². A few students worked out 3 ÷ 6 = 0.5 and 107 ÷ 104 = 103 all of which is correct but then missed the second mark
because they wrote their answer as 0.5 × 10³.
Q32 Most candidates scored either 1 mark (for AB = 5 cm), or full marks for finding the length of AD correctly. It was very common to see the sine rule being used in the
right angled triangle ABD, sometimes involving the right angle and sometimes the 54°. A few candidates used tan and Pythagoras in triangle ABD. Providing all the steps
involved were logically correct, they were awarded the two method marks. Often this approach led to an answer outside the acceptable range, due to accumulation of
rounding errors.
Q33. Many candidates drew a net rather than a plan in part (a) and gained no marks. The fact that nets were so common suggests that candidates were not as familiar with
the topic of plans and elevation as they should have been. When a rectangular plan was drawn, it was not uncommon for at least one dimension to be wrong.
Candidates were more successful in part (b) with many able to draw a correct sketch of the prism. Some candidates attempted to display more faces than could be seen
from any one angle, thus distorting the sketch. Triangular prisms and pentagonal
prisms were quite common among the responses awarded no marks.
Q34, This question was very poorly attempted with around three-quarters failing to
score. Candidates commonly mixed the methods for finding interior and exterior angles, and only about a fifth of candidates actually arrived at the answer 144 from
fully correct working. A very common incorrect answer was 216, where candidates had found each interior angle to be 360 ÷ 5 = 72, doubled 72 to get a sum of 144
and then subtracted this from 360, giving an answer 216.
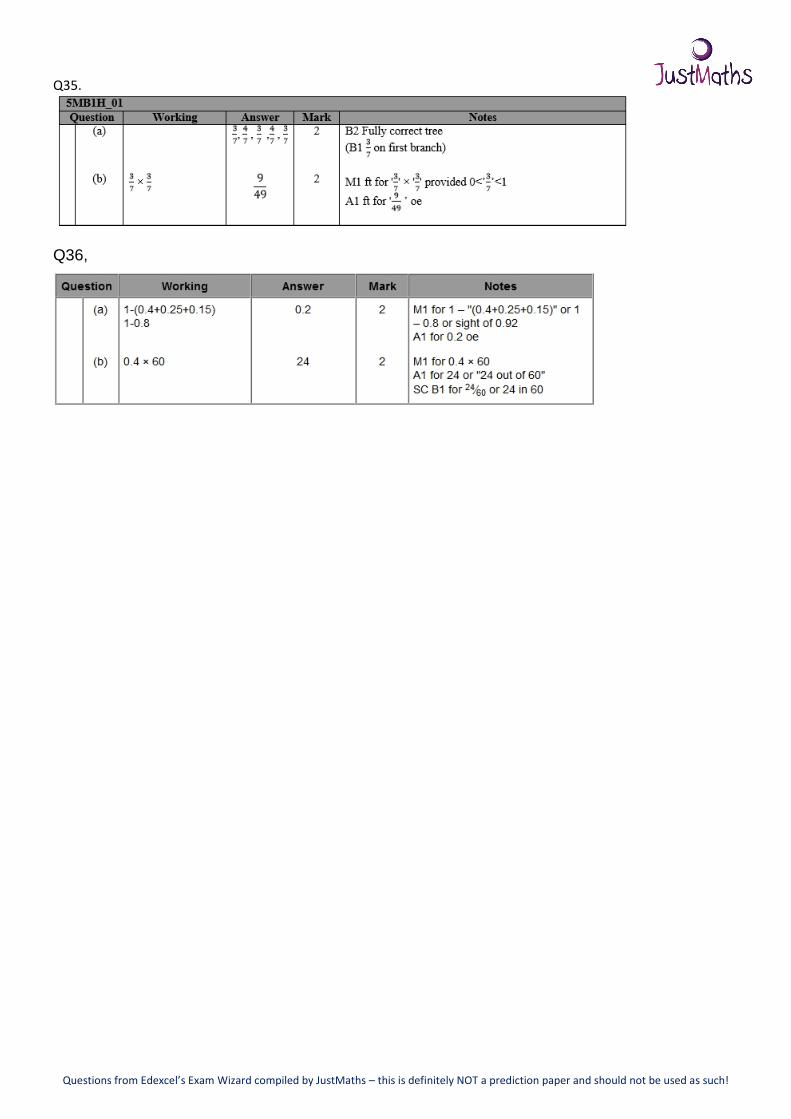
Q35. In part (a), the tree diagram was generally very well done with the majority of candidates gaining full marks. For those that did not, marks were lost by some
candidates who did not read the question and answered it as if there was no replacement.
In part (b), many candidates went on to calculate correct probabilities from their tree diagrams even those with mistakes. Some added rather than multiplied the
probabilities and arithmetic skills were mixed in this part.
Q36. A familiar style of question that was well answered. In part (a) it was usually only the inability of candidates to process the decimal calculations correctly that
prevented them from gaining full marks.
In part (b) candidates should be more careful when picking out the decimal from the
table to use; in this case the one for red was needed. Some incorrectly gave their
answer as a probability rather than as a number.

Questions from Edexcel’s Exam Wizard compiled by JustMaths – this is definitely NOT a prediction paper and should not be used as such!
MARK SCHEME
Q1.
Q2.
Q3.
Q4.
Q5
Questions from Edexcel’s Exam Wizard compiled by JustMaths – this is definitely NOT a prediction paper and should not be used as such!
Q6.
Q7.
Q8.
Questions from Edexcel’s Exam Wizard compiled by JustMaths – this is definitely NOT a prediction paper and should not be used as such!
Q9.
Q10.
Q11.
Q12.
Questions from Edexcel’s Exam Wizard compiled by JustMaths – this is definitely NOT a prediction paper and should not be used as such!
Q13.
Q14.
Q15.
Q16.
Questions from Edexcel’s Exam Wizard compiled by JustMaths – this is definitely NOT a prediction paper and should not be used as such!
Q17.
Questions from Edexcel’s Exam Wizard compiled by JustMaths – this is definitely NOT a prediction paper and should not be used as such!
Q18.
Q19
Q20.
Questions from Edexcel’s Exam Wizard compiled by JustMaths – this is definitely NOT a prediction paper and should not be used as such!
Q21.
Q22.
Q23.
Questions from Edexcel’s Exam Wizard compiled by JustMaths – this is definitely NOT a prediction paper and should not be used as such!
Q24.
Q25.
Q26.
Q27.

Questions from Edexcel’s Exam Wizard compiled by JustMaths – this is definitely NOT a prediction paper and should not be used as such!
Q28.
Q29.
Q30.
Q31.

Questions from Edexcel’s Exam Wizard compiled by JustMaths – this is definitely NOT a prediction paper and should not be used as such!
Q32
Q33.
Q34.
Questions from Edexcel’s Exam Wizard compiled by JustMaths – this is definitely NOT a prediction paper and should not be used as such!
Q35.
Q36,