Embed Size (px)
Citation preview
Bullying in England, April 2013 to March 2018 Analysis on 10 to 15 year olds from the Crime Survey for England & Wales
Ad-hoc notice
November 2018
2
Contents Background 4
Incidence of bullying 5
Bullying rate by characteristics 6
Gender 6
Age 6
Ethnicity 7
Religion 8
Long term illness or disability 8
Receive extra help at school 9
Deprivation 9
Household income 10
Other factors 11
Regional breakdown 11
Types of bullying 12
Frequency of bullying 14
Where bullying takes place 15
Whether bullied by the same people 16
Cyber bullying 17
How well schools deal with bullying 19
Other information on bullying 20
3
Bullying in England, April 2013 to March 2018
November 2018
One in six young people reported being bullied in the previous 12 months
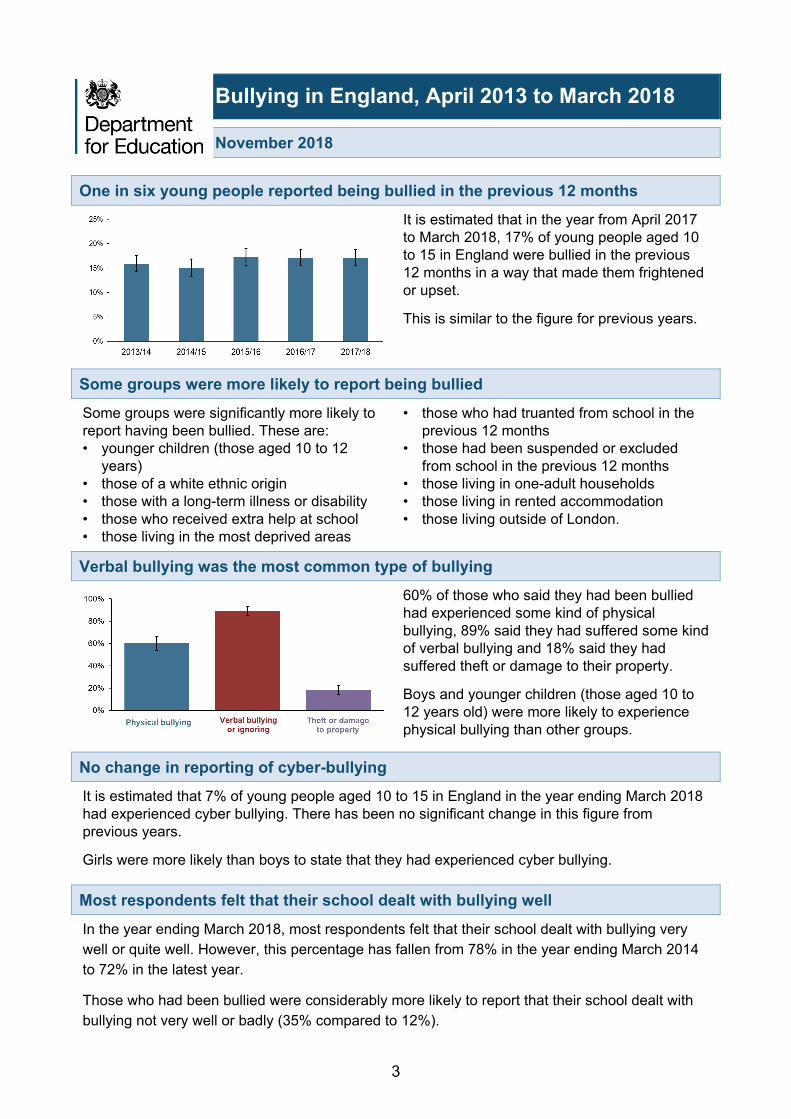
It is estimated that in the year from April 2017 to March 2018, 17% of young people aged 10 to 15 in England were bullied in the previous 12 months in a way that made them frightened or upset.
This is similar to the figure for previous years.
Some groups were more likely to report being bullied Some groups were significantly more likely to report having been bullied. These are: • younger children (those aged 10 to 12
years) • those of a white ethnic origin • those with a long-term illness or disability • those who received extra help at school • those living in the most deprived areas
• those who had truanted from school in the previous 12 months
• those had been suspended or excluded from school in the previous 12 months
• those living in one-adult households • those living in rented accommodation • those living outside of London.
Verbal bullying was the most common type of bullying
60% of those who said they had been bullied had experienced some kind of physical bullying, 89% said they had suffered some kind of verbal bullying and 18% said they had suffered theft or damage to their property.
Boys and younger children (those aged 10 to 12 years old) were more likely to experience physical bullying than other groups.
No change in reporting of cyber-bullying It is estimated that 7% of young people aged 10 to 15 in England in the year ending March 2018 had experienced cyber bullying. There has been no significant change in this figure from previous years.
Girls were more likely than boys to state that they had experienced cyber bullying.
Most respondents felt that their school dealt with bullying well In the year ending March 2018, most respondents felt that their school dealt with bullying very well or quite well. However, this percentage has fallen from 78% in the year ending March 2014 to 72% in the latest year.
Those who had been bullied were considerably more likely to report that their school dealt with bullying not very well or badly (35% compared to 12%).
4
Background The Crime Survey for England and Wales (CSEW) is conducted by the Office for National Statistics. Around 35,000 households across England and Wales are invited to participate in the survey each year. The sample is designed to be representative of the population living in households in England and Wales. Households are selected using the small users’ Postcode Address File (PAF), which lists all postal delivery points in England and Wales.
Since 2009, the CSEW has included a separate survey to record the experiences of young people aged 10 to 15. A single young person, where applicable, is selected to take part from the households included in the adult survey.
In the year ending March 2014, the survey of young people was extended to include additional questions on behalf of the Department for Education (DfE) on respondent’s experiences of bullying. As bullying is a sensitive topic, and respondents could feel uncomfortable talking about their experiences of bullying to an interviewer, these questions are answered through a self-completion module. Respondents complete them on the interviewer’s tablet by themselves and, when finished, their answers are hidden.
The raw results of the sample are weighted to compensate for unequal probabilities of selection involved in the sample design and to adjust for differential non-response. These weighted results are then used to give estimates for the population. More information on the sample design and weightings used can be found on the ONS crime and justice methodology website.
The main questions on bullying are presented in the box below. The full set of questions can be found in section 8 of the questionnaire for the 10 to 15 year olds survey.
Bullying questions In the last 12 months, has anyone bullied you in a way that frightened or upset you? 1. Yes 2. No 3. Don’t know 4. Don’t want to answer Have you experienced cyber bullying in the last 12 months? For example has anyone sent you unwanted and nasty emails, texts or messages or posted something nasty about you on a website? 1. Yes 2. No 3. Don’t know 4. Don’t want to answer
Fieldwork for the survey takes place throughout the year and asks about bullying in the previous 12 months. Our findings are reported for the survey year but the bullying referred to may have taken place prior to that period.
5
We have excluded responses from Wales in order to present findings for England only. In the year ending March 2018, 2,793 children in England (un-weighted base) answered the self-completion module of the CSEW 10 to 15 year olds survey. This compares to 2,824 in the year ending March 2017, 2,580 in the year ending March 2016, 2,181 in the year ending March 2015 and 2,674 in the year ending March 2014.
As the results are based on a sample survey, small differences between sub-groups of the population or over time may not reflect true differences. All differences quoted in this report are statistically significant at the 95% level. All charts have been produced using unrounded data but labelled to the nearest whole percentage for ease of reading. 95% confidence intervals are shown in charts as error bars and in tables in brackets.
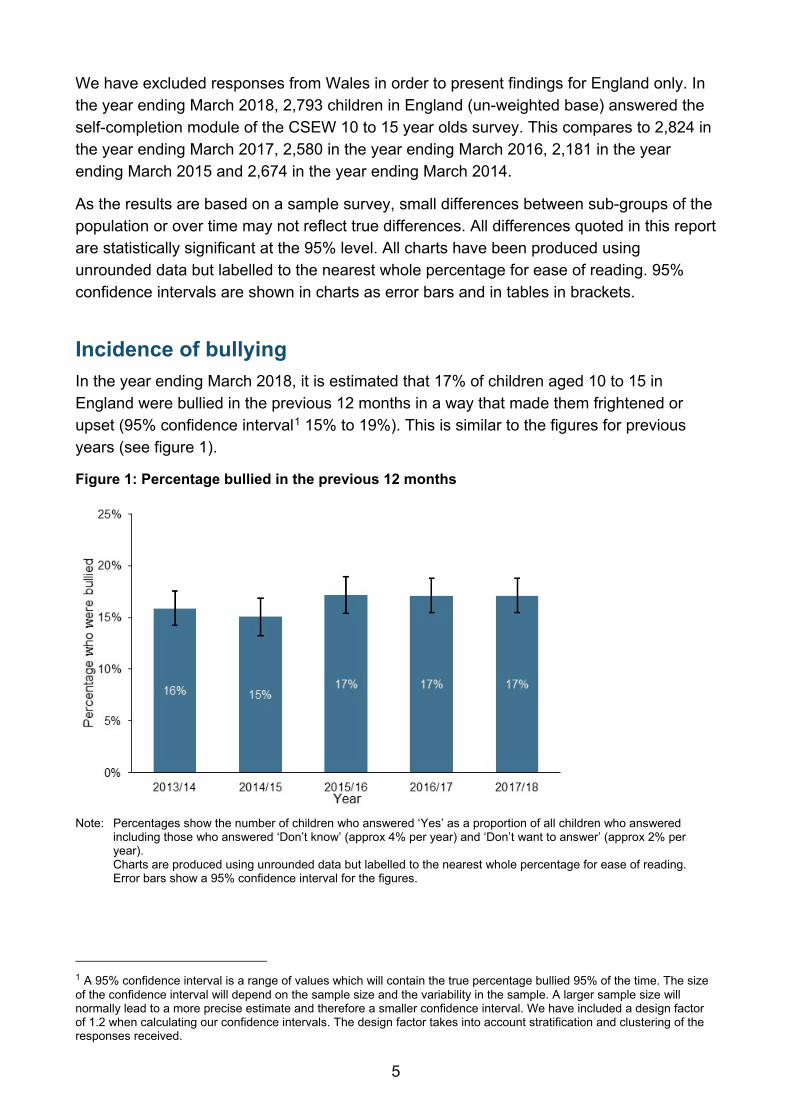
Incidence of bullying In the year ending March 2018, it is estimated that 17% of children aged 10 to 15 in England were bullied in the previous 12 months in a way that made them frightened or upset (95% confidence interval1 15% to 19%). This is similar to the figures for previous years (see figure 1).
Figure 1: Percentage bullied in the previous 12 months
Note: Percentages show the number of children who answered ‘Yes’ as a proportion of all children who answered
including those who answered ‘Don’t know’ (approx 4% per year) and ‘Don’t want to answer’ (approx 2% per year).
Charts are produced using unrounded data but labelled to the nearest whole percentage for ease of reading. Error bars show a 95% confidence interval for the figures.
1 A 95% confidence interval is a range of values which will contain the true percentage bullied 95% of the time. The size of the confidence interval will depend on the sample size and the variability in the sample. A larger sample size will normally lead to a more precise estimate and therefore a smaller confidence interval. We have included a design factor of 1.2 when calculating our confidence intervals. The design factor takes into account stratification and clustering of the responses received.
6
Bullying rate by characteristics
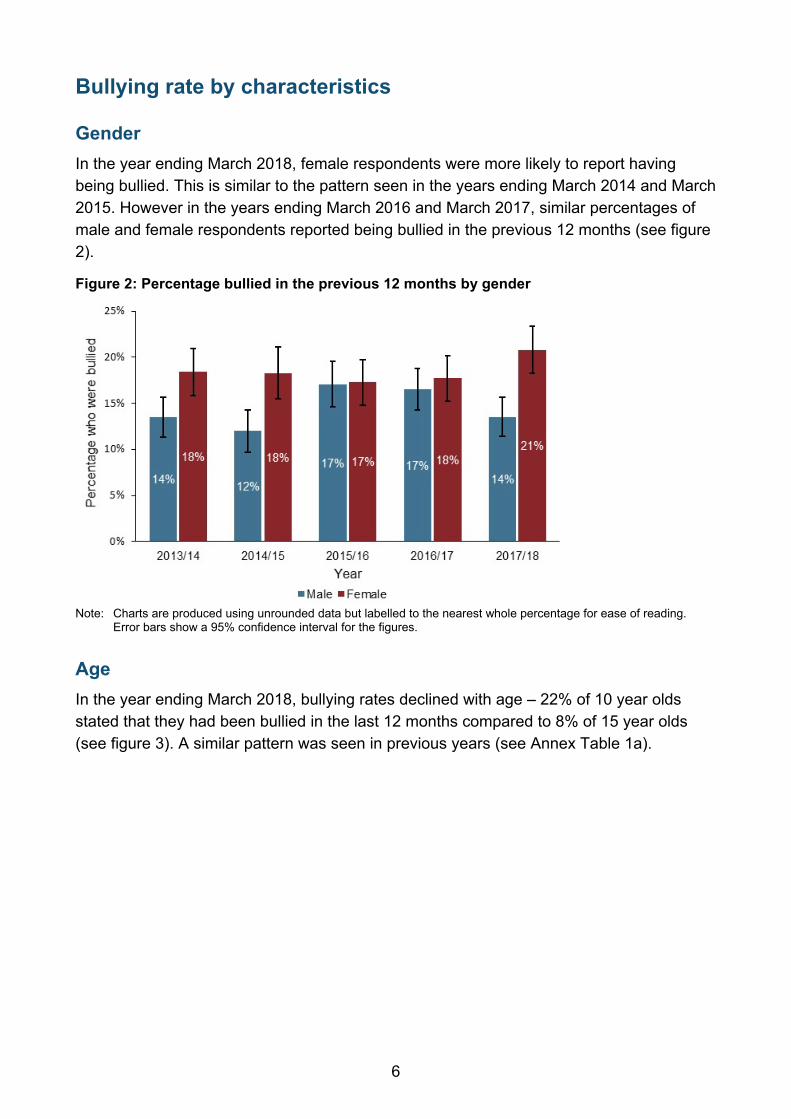
Gender In the year ending March 2018, female respondents were more likely to report having being bullied. This is similar to the pattern seen in the years ending March 2014 and March 2015. However in the years ending March 2016 and March 2017, similar percentages of male and female respondents reported being bullied in the previous 12 months (see figure 2).
Figure 2: Percentage bullied in the previous 12 months by gender
Note: Charts are produced using unrounded data but labelled to the nearest whole percentage for ease of reading.
Error bars show a 95% confidence interval for the figures.
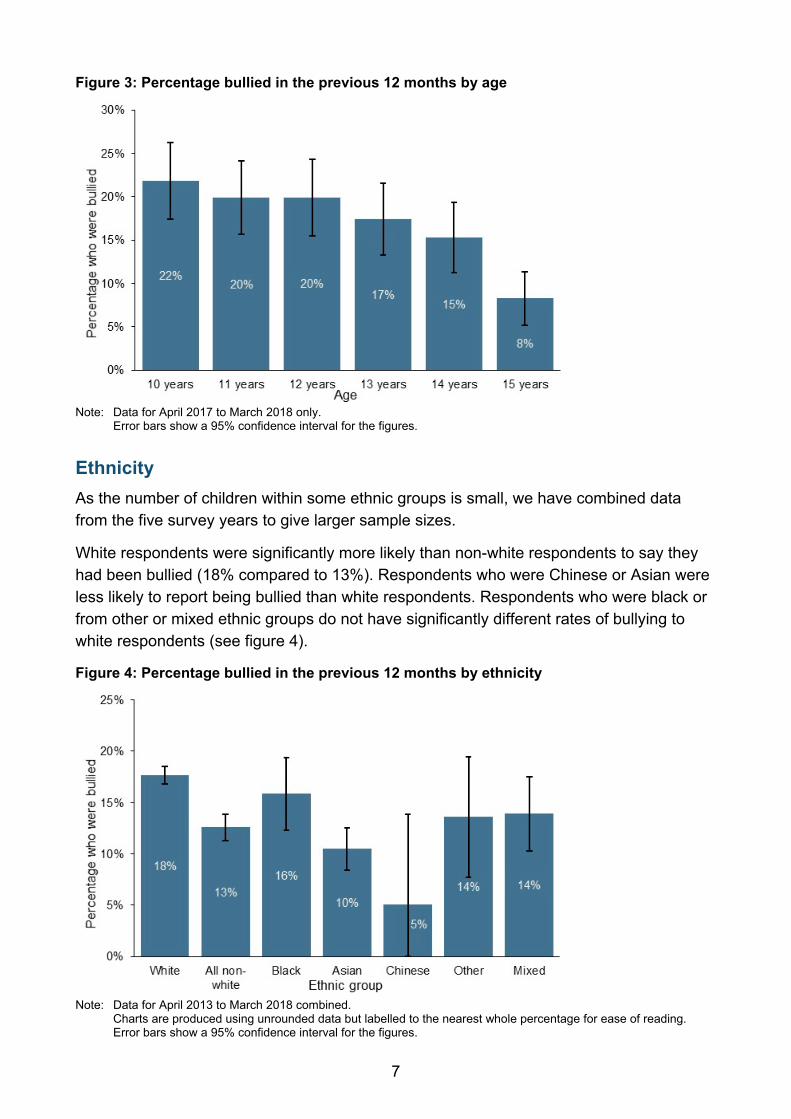
Age In the year ending March 2018, bullying rates declined with age – 22% of 10 year olds stated that they had been bullied in the last 12 months compared to 8% of 15 year olds (see figure 3). A similar pattern was seen in previous years (see Annex Table 1a).
7
Figure 3: Percentage bullied in the previous 12 months by age
Note: Data for April 2017 to March 2018 only. Error bars show a 95% confidence interval for the figures.
Ethnicity As the number of children within some ethnic groups is small, we have combined data from the five survey years to give larger sample sizes.
White respondents were significantly more likely than non-white respondents to say they had been bullied (18% compared to 13%). Respondents who were Chinese or Asian were less likely to report being bullied than white respondents. Respondents who were black or from other or mixed ethnic groups do not have significantly different rates of bullying to white respondents (see figure 4).
Figure 4: Percentage bullied in the previous 12 months by ethnicity
Note: Data for April 2013 to March 2018 combined.
Charts are produced using unrounded data but labelled to the nearest whole percentage for ease of reading. Error bars show a 95% confidence interval for the figures.
8
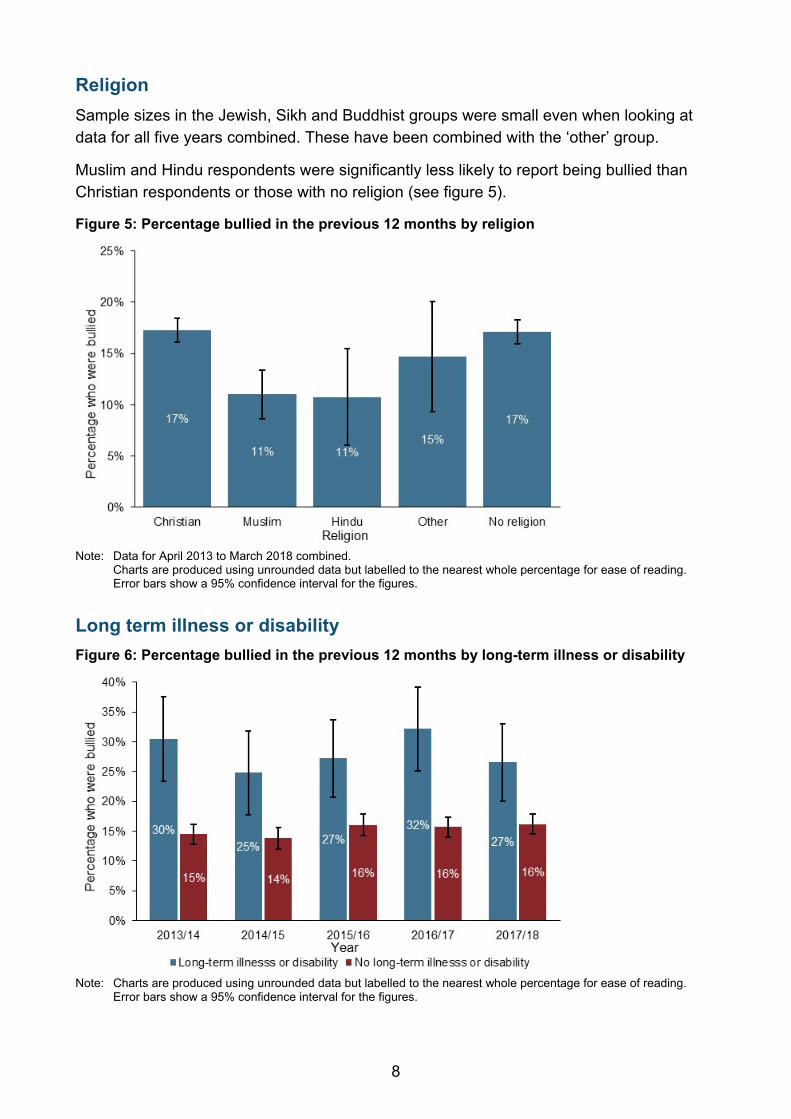
Religion Sample sizes in the Jewish, Sikh and Buddhist groups were small even when looking at data for all five years combined. These have been combined with the ‘other’ group.
Muslim and Hindu respondents were significantly less likely to report being bullied than Christian respondents or those with no religion (see figure 5).
Figure 5: Percentage bullied in the previous 12 months by religion
Note: Data for April 2013 to March 2018 combined.
Charts are produced using unrounded data but labelled to the nearest whole percentage for ease of reading. Error bars show a 95% confidence interval for the figures.
Long term illness or disability Figure 6: Percentage bullied in the previous 12 months by long-term illness or disability
Note: Charts are produced using unrounded data but labelled to the nearest whole percentage for ease of reading.
Error bars show a 95% confidence interval for the figures.
9
Around one in ten respondents (9% in the year ending March 2018) reported that they had a long term illness or disability. Those with a long-term illness or disability were much more likely to say they had been bullied than those without a long-term illness or disability (see figure 6).
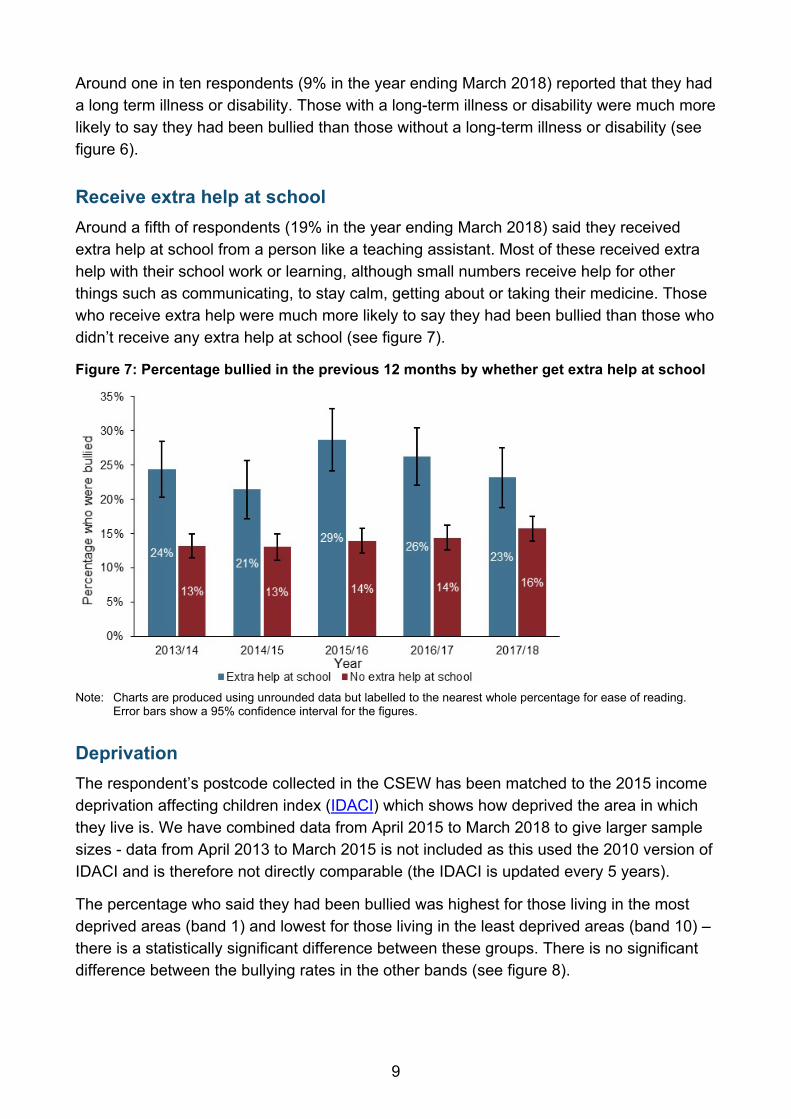
Receive extra help at school Around a fifth of respondents (19% in the year ending March 2018) said they received extra help at school from a person like a teaching assistant. Most of these received extra help with their school work or learning, although small numbers receive help for other things such as communicating, to stay calm, getting about or taking their medicine. Those who receive extra help were much more likely to say they had been bullied than those who didn’t receive any extra help at school (see figure 7).
Figure 7: Percentage bullied in the previous 12 months by whether get extra help at school
Note: Charts are produced using unrounded data but labelled to the nearest whole percentage for ease of reading.
Error bars show a 95% confidence interval for the figures.
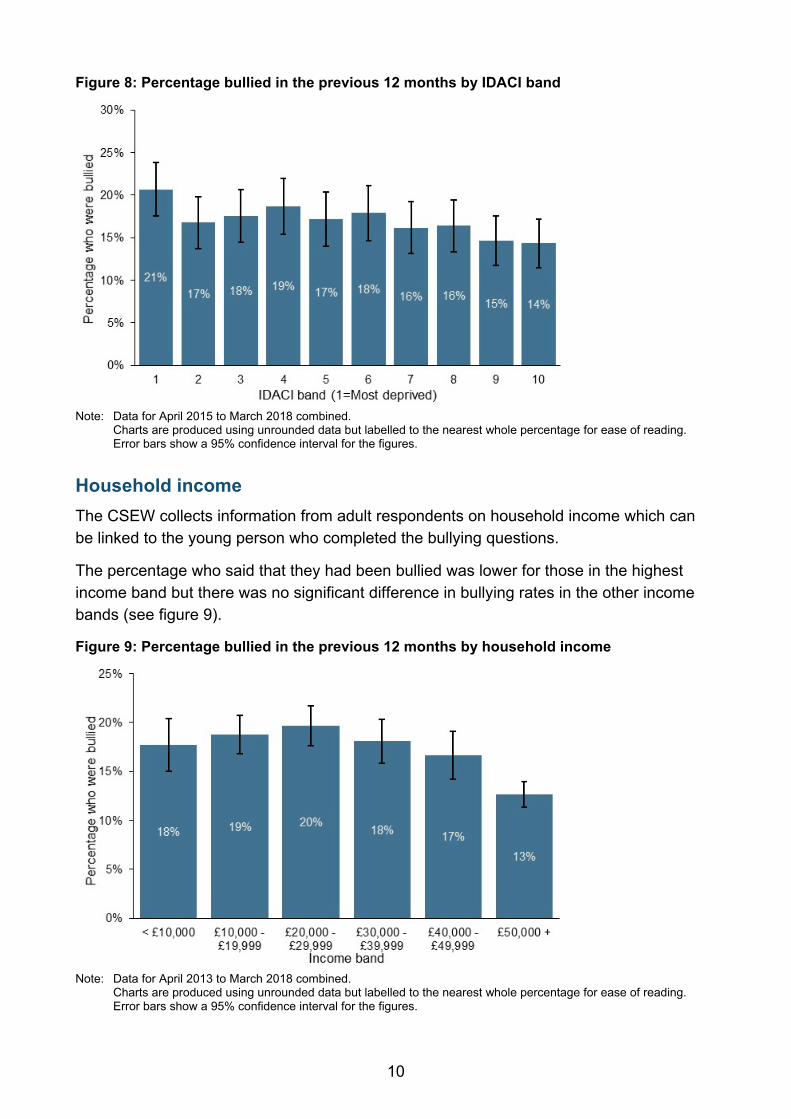
Deprivation The respondent’s postcode collected in the CSEW has been matched to the 2015 income deprivation affecting children index (IDACI) which shows how deprived the area in which they live is. We have combined data from April 2015 to March 2018 to give larger sample sizes - data from April 2013 to March 2015 is not included as this used the 2010 version of IDACI and is therefore not directly comparable (the IDACI is updated every 5 years).
The percentage who said they had been bullied was highest for those living in the most deprived areas (band 1) and lowest for those living in the least deprived areas (band 10) – there is a statistically significant difference between these groups. There is no significant difference between the bullying rates in the other bands (see figure 8).
10
Figure 8: Percentage bullied in the previous 12 months by IDACI band
Note: Data for April 2015 to March 2018 combined.
Charts are produced using unrounded data but labelled to the nearest whole percentage for ease of reading. Error bars show a 95% confidence interval for the figures.
Household income The CSEW collects information from adult respondents on household income which can be linked to the young person who completed the bullying questions.
The percentage who said that they had been bullied was lower for those in the highest income band but there was no significant difference in bullying rates in the other income bands (see figure 9).
Figure 9: Percentage bullied in the previous 12 months by household income
Note: Data for April 2013 to March 2018 combined.
Charts are produced using unrounded data but labelled to the nearest whole percentage for ease of reading. Error bars show a 95% confidence interval for the figures.
11
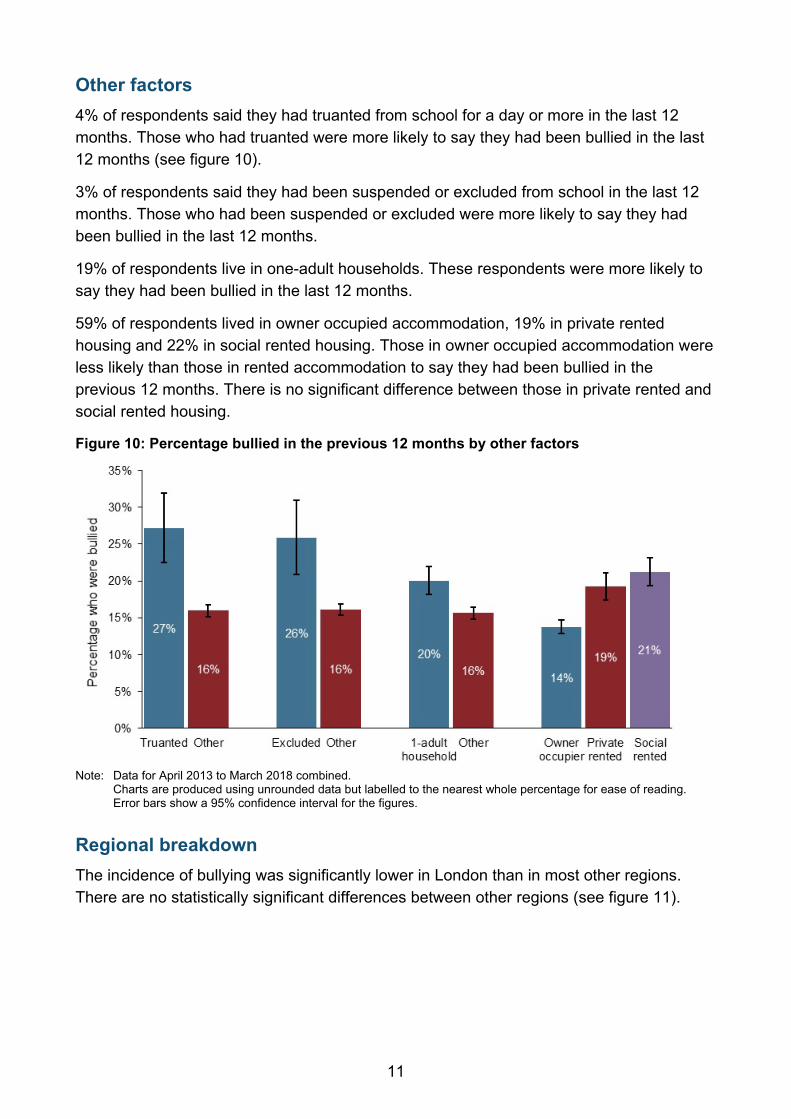
Other factors 4% of respondents said they had truanted from school for a day or more in the last 12 months. Those who had truanted were more likely to say they had been bullied in the last 12 months (see figure 10).
3% of respondents said they had been suspended or excluded from school in the last 12 months. Those who had been suspended or excluded were more likely to say they had been bullied in the last 12 months.
19% of respondents live in one-adult households. These respondents were more likely to say they had been bullied in the last 12 months.
59% of respondents lived in owner occupied accommodation, 19% in private rented housing and 22% in social rented housing. Those in owner occupied accommodation were less likely than those in rented accommodation to say they had been bullied in the previous 12 months. There is no significant difference between those in private rented and social rented housing.
Figure 10: Percentage bullied in the previous 12 months by other factors
Note: Data for April 2013 to March 2018 combined.
Charts are produced using unrounded data but labelled to the nearest whole percentage for ease of reading. Error bars show a 95% confidence interval for the figures.
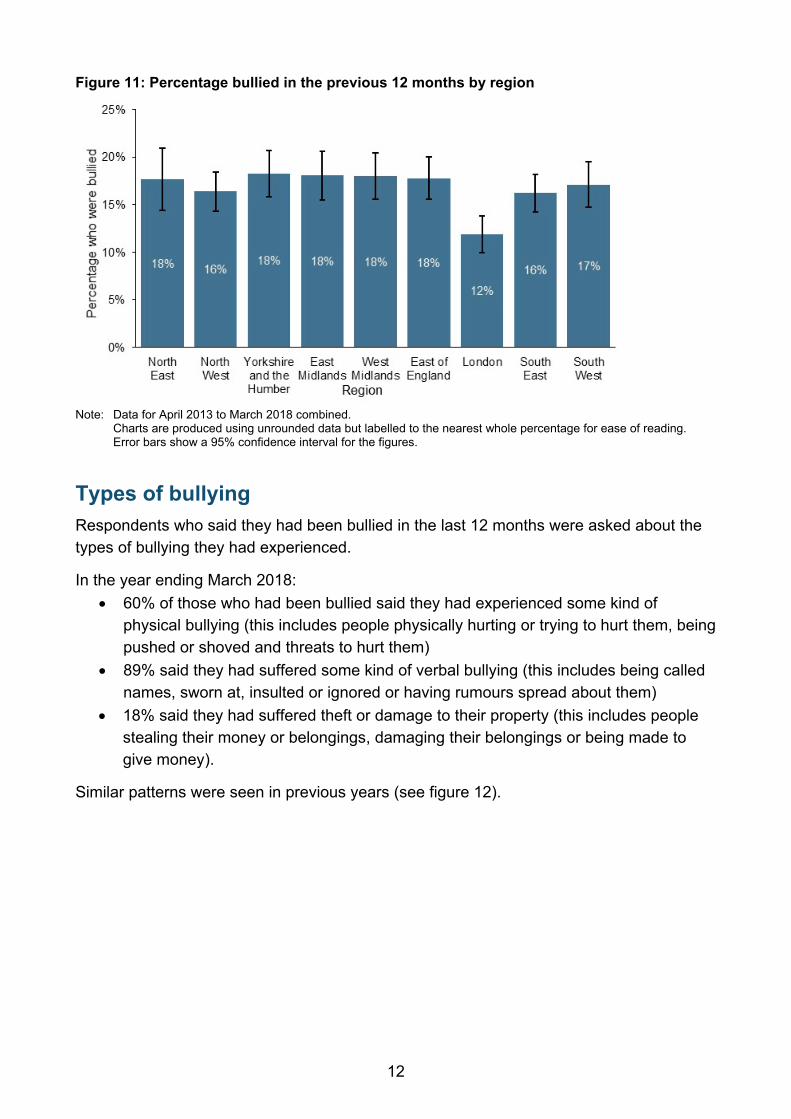
Regional breakdown The incidence of bullying was significantly lower in London than in most other regions. There are no statistically significant differences between other regions (see figure 11).
12
Figure 11: Percentage bullied in the previous 12 months by region
Note: Data for April 2013 to March 2018 combined.
Charts are produced using unrounded data but labelled to the nearest whole percentage for ease of reading. Error bars show a 95% confidence interval for the figures.
Types of bullying Respondents who said they had been bullied in the last 12 months were asked about the types of bullying they had experienced.
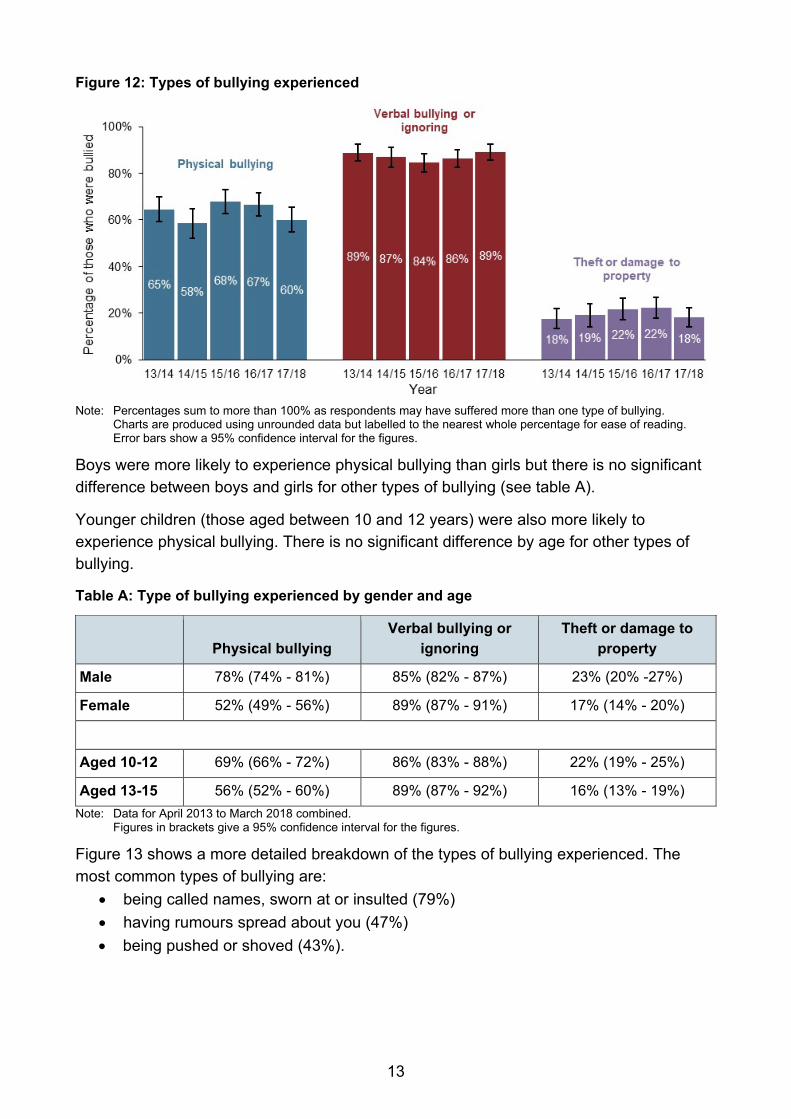
In the year ending March 2018: • 60% of those who had been bullied said they had experienced some kind of
physical bullying (this includes people physically hurting or trying to hurt them, being pushed or shoved and threats to hurt them)
• 89% said they had suffered some kind of verbal bullying (this includes being called names, sworn at, insulted or ignored or having rumours spread about them)
• 18% said they had suffered theft or damage to their property (this includes people stealing their money or belongings, damaging their belongings or being made to give money).
Similar patterns were seen in previous years (see figure 12).
13
Figure 12: Types of bullying experienced
Note: Percentages sum to more than 100% as respondents may have suffered more than one type of bullying. Charts are produced using unrounded data but labelled to the nearest whole percentage for ease of reading.
Error bars show a 95% confidence interval for the figures.
Boys were more likely to experience physical bullying than girls but there is no significant difference between boys and girls for other types of bullying (see table A).
Younger children (those aged between 10 and 12 years) were also more likely to experience physical bullying. There is no significant difference by age for other types of bullying.
Table A: Type of bullying experienced by gender and age
Physical bullying Verbal bullying or
ignoring Theft or damage to
property
Male 78% (74% - 81%) 85% (82% - 87%) 23% (20% -27%)
Female 52% (49% - 56%) 89% (87% - 91%) 17% (14% - 20%)
Aged 10-12 69% (66% - 72%) 86% (83% - 88%) 22% (19% - 25%)
Aged 13-15 56% (52% - 60%) 89% (87% - 92%) 16% (13% - 19%) Note: Data for April 2013 to March 2018 combined. Figures in brackets give a 95% confidence interval for the figures.
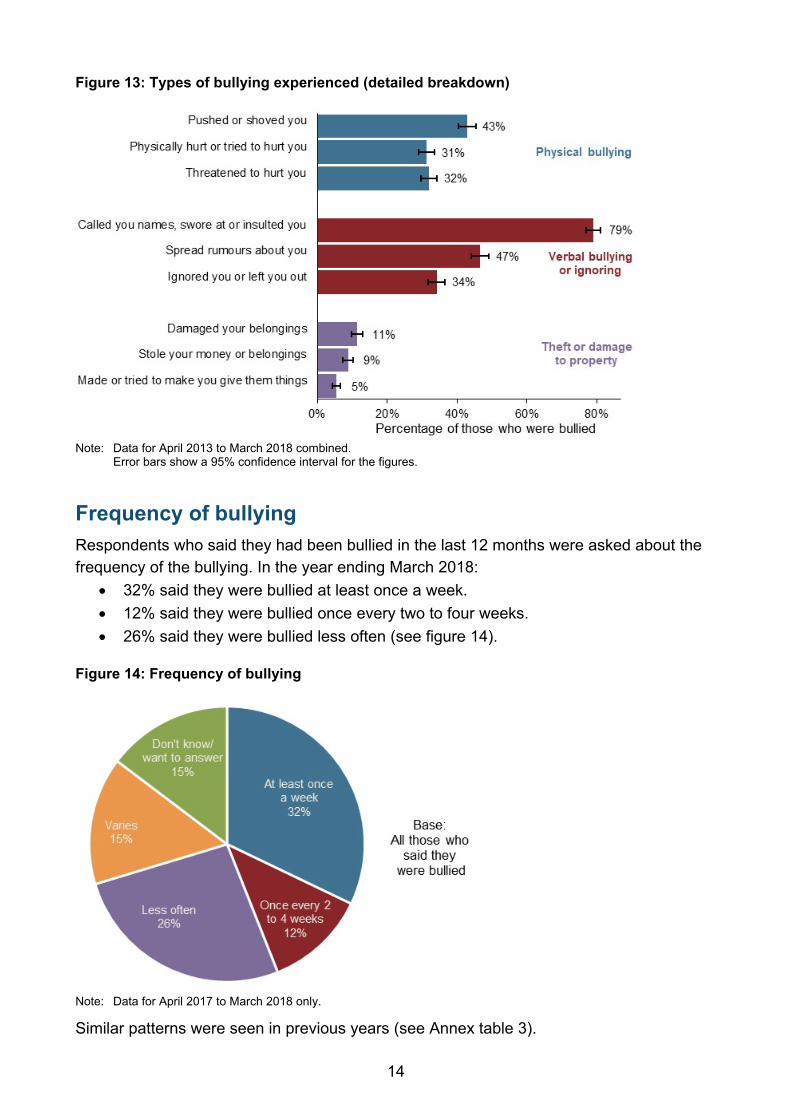
Figure 13 shows a more detailed breakdown of the types of bullying experienced. The most common types of bullying are:
• being called names, sworn at or insulted (79%) • having rumours spread about you (47%) • being pushed or shoved (43%).
14
Figure 13: Types of bullying experienced (detailed breakdown)
Note: Data for April 2013 to March 2018 combined.
Error bars show a 95% confidence interval for the figures.
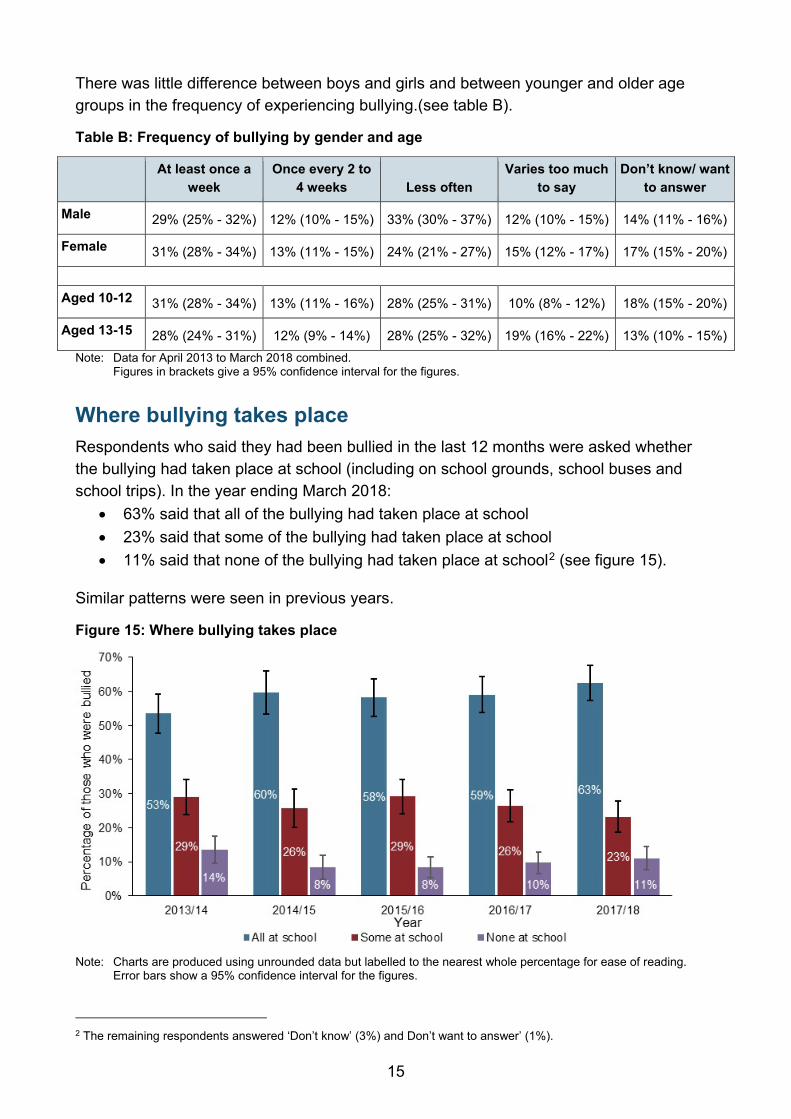
Frequency of bullying Respondents who said they had been bullied in the last 12 months were asked about the frequency of the bullying. In the year ending March 2018:
• 32% said they were bullied at least once a week. • 12% said they were bullied once every two to four weeks. • 26% said they were bullied less often (see figure 14).
Figure 14: Frequency of bullying
Note: Data for April 2017 to March 2018 only.
Similar patterns were seen in previous years (see Annex table 3).
15
There was little difference between boys and girls and between younger and older age groups in the frequency of experiencing bullying.(see table B).
Table B: Frequency of bullying by gender and age
At least once a
week Once every 2 to
4 weeks Less often Varies too much
to say Don’t know/ want
to answer
Male 29% (25% - 32%) 12% (10% - 15%) 33% (30% - 37%) 12% (10% - 15%) 14% (11% - 16%)
Female 31% (28% - 34%) 13% (11% - 15%) 24% (21% - 27%) 15% (12% - 17%) 17% (15% - 20%)
Aged 10-12 31% (28% - 34%) 13% (11% - 16%) 28% (25% - 31%) 10% (8% - 12%) 18% (15% - 20%)
Aged 13-15 28% (24% - 31%) 12% (9% - 14%) 28% (25% - 32%) 19% (16% - 22%) 13% (10% - 15%) Note: Data for April 2013 to March 2018 combined. Figures in brackets give a 95% confidence interval for the figures.
Where bullying takes place Respondents who said they had been bullied in the last 12 months were asked whether the bullying had taken place at school (including on school grounds, school buses and school trips). In the year ending March 2018:
• 63% said that all of the bullying had taken place at school • 23% said that some of the bullying had taken place at school • 11% said that none of the bullying had taken place at school2 (see figure 15).
Similar patterns were seen in previous years.
Figure 15: Where bullying takes place
Note: Charts are produced using unrounded data but labelled to the nearest whole percentage for ease of reading.
Error bars show a 95% confidence interval for the figures.
2 The remaining respondents answered ‘Don’t know’ (3%) and Don’t want to answer’ (1%).
16
There was little difference between boys and girls and different age groups in whether they said the bullying took place at school or elsewhere (see Annex table 4).
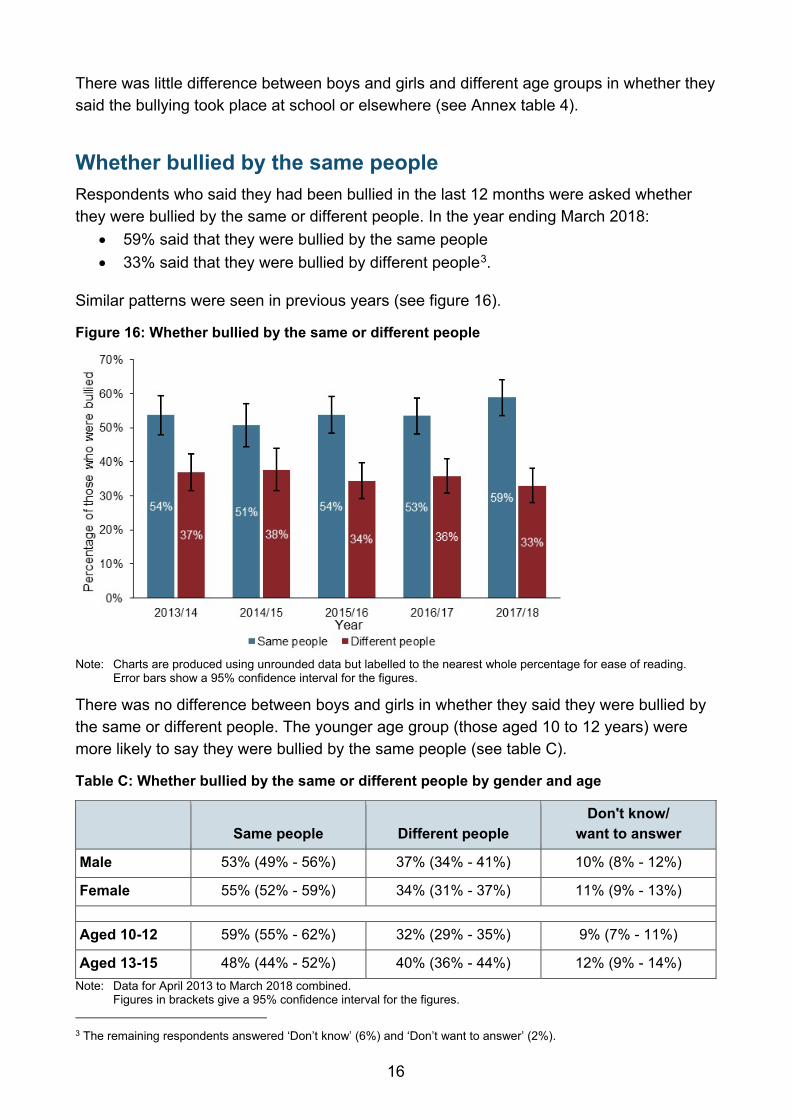
Whether bullied by the same people Respondents who said they had been bullied in the last 12 months were asked whether they were bullied by the same or different people. In the year ending March 2018:
• 59% said that they were bullied by the same people • 33% said that they were bullied by different people3.
Similar patterns were seen in previous years (see figure 16).
Figure 16: Whether bullied by the same or different people
Note: Charts are produced using unrounded data but labelled to the nearest whole percentage for ease of reading.
Error bars show a 95% confidence interval for the figures.
There was no difference between boys and girls in whether they said they were bullied by the same or different people. The younger age group (those aged 10 to 12 years) were more likely to say they were bullied by the same people (see table C).
Table C: Whether bullied by the same or different people by gender and age
Same people Different people Don't know/
want to answer
Male 53% (49% - 56%) 37% (34% - 41%) 10% (8% - 12%)
Female 55% (52% - 59%) 34% (31% - 37%) 11% (9% - 13%)
Aged 10-12 59% (55% - 62%) 32% (29% - 35%) 9% (7% - 11%)
Aged 13-15 48% (44% - 52%) 40% (36% - 44%) 12% (9% - 14%) Note: Data for April 2013 to March 2018 combined. Figures in brackets give a 95% confidence interval for the figures. 3 The remaining respondents answered ‘Don’t know’ (6%) and ‘Don’t want to answer’ (2%).
17
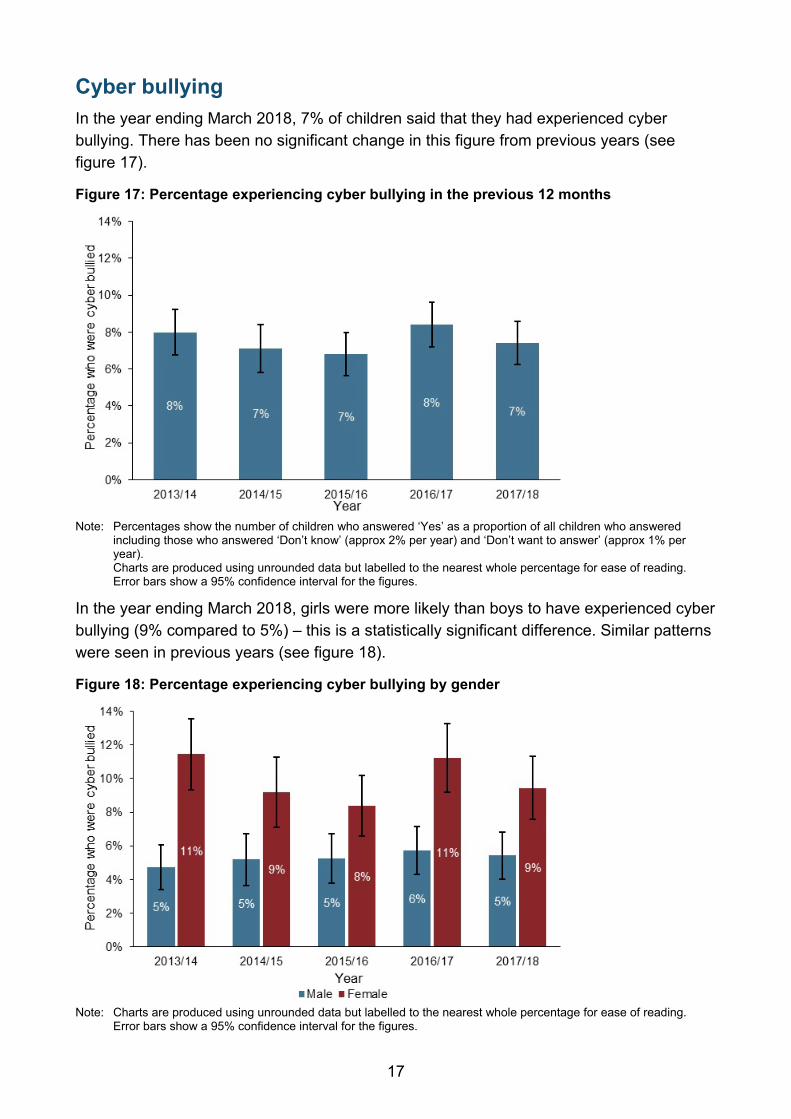
Cyber bullying In the year ending March 2018, 7% of children said that they had experienced cyber bullying. There has been no significant change in this figure from previous years (see figure 17).
Figure 17: Percentage experiencing cyber bullying in the previous 12 months
Note: Percentages show the number of children who answered ‘Yes’ as a proportion of all children who answered
including those who answered ‘Don’t know’ (approx 2% per year) and ‘Don’t want to answer’ (approx 1% per year).
Charts are produced using unrounded data but labelled to the nearest whole percentage for ease of reading. Error bars show a 95% confidence interval for the figures.
In the year ending March 2018, girls were more likely than boys to have experienced cyber bullying (9% compared to 5%) – this is a statistically significant difference. Similar patterns were seen in previous years (see figure 18).
Figure 18: Percentage experiencing cyber bullying by gender
Note: Charts are produced using unrounded data but labelled to the nearest whole percentage for ease of reading.
Error bars show a 95% confidence interval for the figures.
18
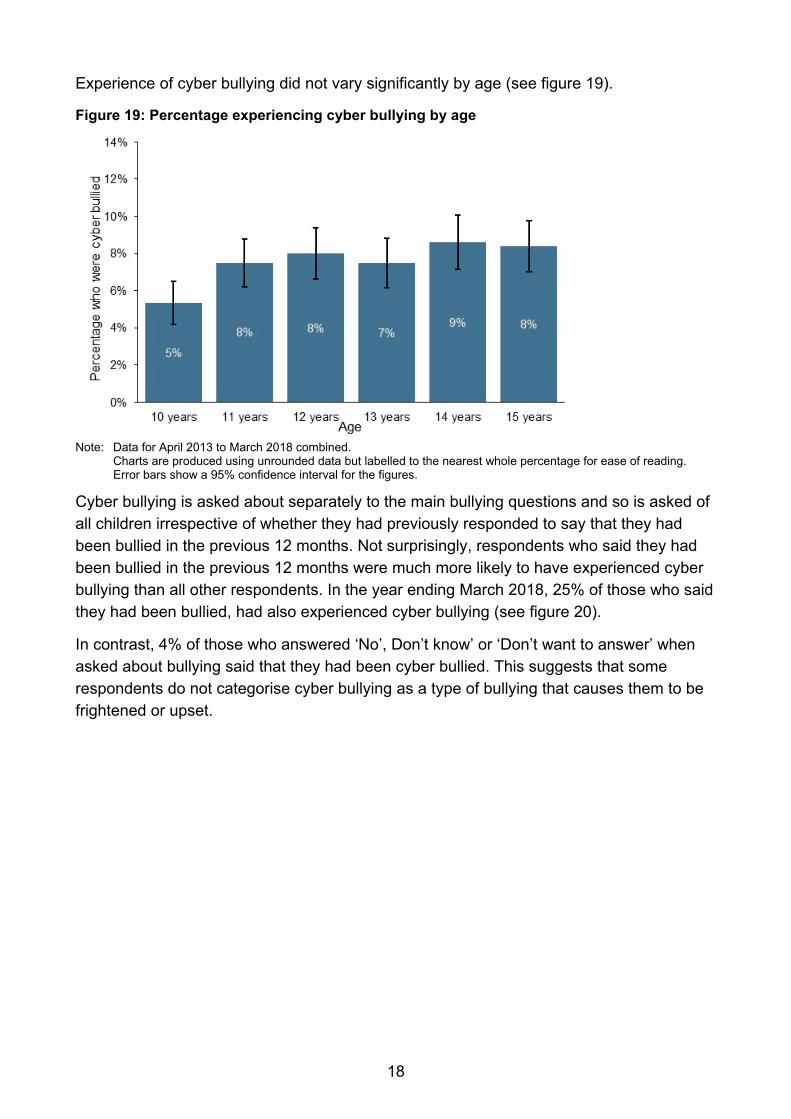
Experience of cyber bullying did not vary significantly by age (see figure 19).
Figure 19: Percentage experiencing cyber bullying by age
Note: Data for April 2013 to March 2018 combined. Charts are produced using unrounded data but labelled to the nearest whole percentage for ease of reading.
Error bars show a 95% confidence interval for the figures.
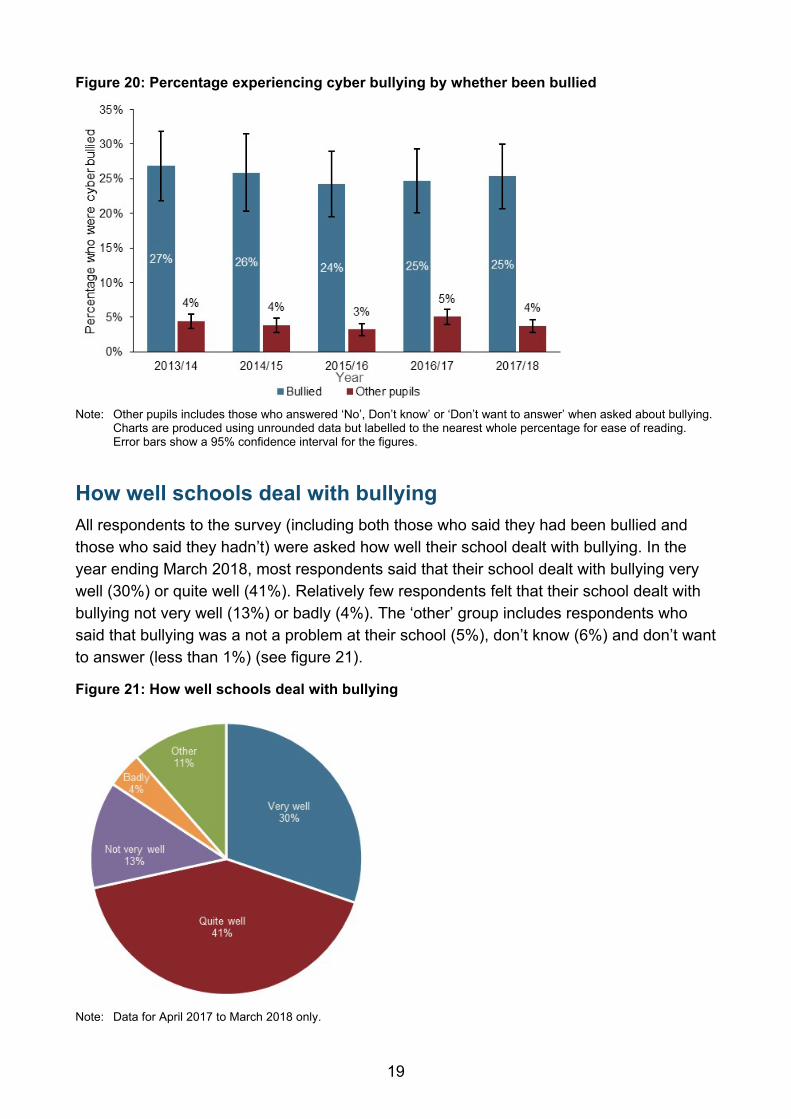
Cyber bullying is asked about separately to the main bullying questions and so is asked of all children irrespective of whether they had previously responded to say that they had been bullied in the previous 12 months. Not surprisingly, respondents who said they had been bullied in the previous 12 months were much more likely to have experienced cyber bullying than all other respondents. In the year ending March 2018, 25% of those who said they had been bullied, had also experienced cyber bullying (see figure 20).
In contrast, 4% of those who answered ‘No’, Don’t know’ or ‘Don’t want to answer’ when asked about bullying said that they had been cyber bullied. This suggests that some respondents do not categorise cyber bullying as a type of bullying that causes them to be frightened or upset.
19
Figure 20: Percentage experiencing cyber bullying by whether been bullied
Note: Other pupils includes those who answered ‘No’, Don’t know’ or ‘Don’t want to answer’ when asked about bullying. Charts are produced using unrounded data but labelled to the nearest whole percentage for ease of reading.
Error bars show a 95% confidence interval for the figures.
How well schools deal with bullying All respondents to the survey (including both those who said they had been bullied and those who said they hadn’t) were asked how well their school dealt with bullying. In the year ending March 2018, most respondents said that their school dealt with bullying very well (30%) or quite well (41%). Relatively few respondents felt that their school dealt with bullying not very well (13%) or badly (4%). The ‘other’ group includes respondents who said that bullying was a not a problem at their school (5%), don’t know (6%) and don’t want to answer (less than 1%) (see figure 21).
Figure 21: How well schools deal with bullying
Note: Data for April 2017 to March 2018 only.
20
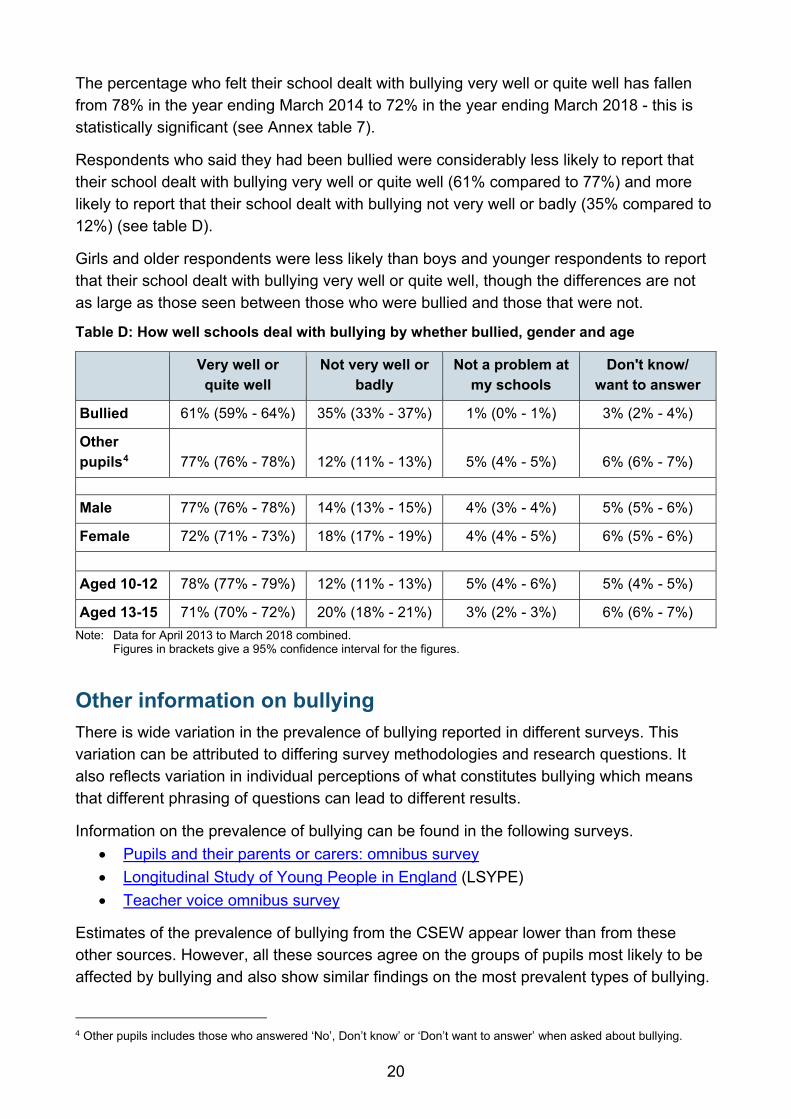
The percentage who felt their school dealt with bullying very well or quite well has fallen from 78% in the year ending March 2014 to 72% in the year ending March 2018 - this is statistically significant (see Annex table 7).
Respondents who said they had been bullied were considerably less likely to report that their school dealt with bullying very well or quite well (61% compared to 77%) and more likely to report that their school dealt with bullying not very well or badly (35% compared to 12%) (see table D).
Girls and older respondents were less likely than boys and younger respondents to report that their school dealt with bullying very well or quite well, though the differences are not as large as those seen between those who were bullied and those that were not.
Table D: How well schools deal with bullying by whether bullied, gender and age
Very well or quite well
Not very well or badly
Not a problem at my schools
Don't know/ want to answer
Bullied 61% (59% - 64%) 35% (33% - 37%) 1% (0% - 1%) 3% (2% - 4%)
Other pupils4 77% (76% - 78%) 12% (11% - 13%) 5% (4% - 5%) 6% (6% - 7%)
Male 77% (76% - 78%) 14% (13% - 15%) 4% (3% - 4%) 5% (5% - 6%)
Female 72% (71% - 73%) 18% (17% - 19%) 4% (4% - 5%) 6% (5% - 6%)
Aged 10-12 78% (77% - 79%) 12% (11% - 13%) 5% (4% - 6%) 5% (4% - 5%)
Aged 13-15 71% (70% - 72%) 20% (18% - 21%) 3% (2% - 3%) 6% (6% - 7%) Note: Data for April 2013 to March 2018 combined. Figures in brackets give a 95% confidence interval for the figures.
Other information on bullying There is wide variation in the prevalence of bullying reported in different surveys. This variation can be attributed to differing survey methodologies and research questions. It also reflects variation in individual perceptions of what constitutes bullying which means that different phrasing of questions can lead to different results.
Information on the prevalence of bullying can be found in the following surveys. • Pupils and their parents or carers: omnibus survey • Longitudinal Study of Young People in England (LSYPE) • Teacher voice omnibus survey
Estimates of the prevalence of bullying from the CSEW appear lower than from these other sources. However, all these sources agree on the groups of pupils most likely to be affected by bullying and also show similar findings on the most prevalent types of bullying.
4 Other pupils includes those who answered ‘No’, Don’t know’ or ‘Don’t want to answer’ when asked about bullying.
21
© Crown copyright 2018
This publication (not including logos) is licensed under the terms of the Open Government Licence v3.0 except where otherwise stated. Where we have identified any third party copyright information you will need to obtain permission from the copyright holders concerned.
To view this licence: visit www.nationalarchives.gov.uk/doc/open-government-licence/version/3 email [email protected] write to Information Policy Team, The National Archives, Kew, London, TW9 4DU
About this publication:
Enquiries: Jayne Middlemas, Early Years, Schools and SEND Analysis and Research Division, Department for Education, St Paul’s Place, Sheffield, S1 2FJ
Email: [email protected]
Download: www.gov.uk/government/publications Reference: DFE-00329-2018
Follow us on Twitter: @educationgovuk
Like us on Facebook: facebook.com/educationgovuk