Embed Size (px)
Citation preview

Produced and Published by
BU
LL
ET
IN
FEATURESProfile of the Economy
Financial OperationsInternational Statistics
Special Reports
DECEMBER 2009

Additional Financial Management Service Releases on Federal Finances
Sold on a subscription basis only (exceptions noted) by the Superintendent of
Documents, U.S. Government Printing Office, Washington, D.C. 20402.†
Combined Statement of Receipts, Outlays, and Balances of the United States Government. This statement presents budget results and the cash-related assets and liabilities of the Federal Government with supporting details. Single copy price: $67.00 (domestic), $93.80 (foreign).
Financial Report of the United States Government. This annual report provides information about Government financial operations on the accrual basis. Single copy price: $26.00 (domestic), $36.40 (foreign).
† Subscription order form on inside back cover.

BU
LL
ET
IN
The Treasury Bulletin is for saleby the Superintendent of Documents
U.S. Government Printing OfficeWashington, D.C. 20402.

The Treasury Bulletin is issued quarterly in March, June, September, and December by the Financial Management Service. The Budget Reports Division, Governmentwide Accounting,
compiles statistical data from sources within Treasury departmental offices and bureaus, as well as various other Federal program agencies. Readers can contact the publication staff at (202) 874-9938/9939 to inquire about any of the published information. Suggestions are welcome.
The publication staff can also be reached by electronic mail.
Internet service subscribers can access the Treasury Bulletin in Microsoft Word or PDF format
through the Financial Management Service’s home page.
www.fms.treas.gov/

December 2009
Contents
FINANCIAL OPERATIONS PROFILE OF THE ECONOMY Analysis.—Summary of Economic Indicators....................................................................................................................... 3 FEDERAL FISCAL OPERATIONS Introduction.—Federal Fiscal Operations.............................................................................................................................. 8 Analysis.—Budget Results and Financing of the U.S. Government and Fourth-Quarter Receipts by Source ...................... 9 FFO-A.—Chart: Monthly Receipts and Outlays ................................................................................................................ 11 FFO-B.—Chart: Budget Receipts by Source....................................................................................................................... 11 FFO-1.—Summary of Fiscal Operations ............................................................................................................................. 12 FFO-2.—On-Budget and Off-Budget Receipts by Source .................................................................................................. 13 FFO-3.—On-Budget and Off-Budget Outlays by Agency .................................................................................................. 15 FFO-4.—Summary of U.S. Government Receipts by Source and Outlays by Agency....................................................... 17 FFO-5 —Internal Revenue Receipts by State...................................................................................................................... 18 FFO-6 —Customs and Border Protection Collection of Duties, Taxes, and Fees by Districts and Ports............................ 20 ACCOUNT OF THE U.S. TREASURY Introduction.— Source and Availability of the Balance in the Account of the U.S. Treasury ............................................ 26 UST-1.—Elements of Change in Federal Reserve and Tax and Loan Note Account Balances .......................................... 26 FEDERAL DEBT Introduction.—Federal Debt................................................................................................................................................ 28 FD-1.—Summary of Federal Debt ...................................................................................................................................... 29 FD-2.—Debt Held by the Public ......................................................................................................................................... 30 FD-3.—Government Account Series................................................................................................................................... 31 FD-4.—Interest-Bearing Securities Issued by Government Agencies................................................................................. 32 FD-5.—Maturity Distribution and Average Length of Marketable Interest-Bearing Public Debt Held by Private Investors .................................................................................................................................................... 33 FD-6.—Debt Subject to Statutory Limit.............................................................................................................................. 34 FD-7.—Treasury Holdings of Securities Issued by Government Corporations and Other Agencies .................................. 35 PUBLIC DEBT OPERATIONS Introduction.—Public Debt Operations ............................................................................................................................... 37 TREASURY FINANCING ................................................................................................................................................. 37 PDO-1.—Offerings of Regular Weekly Treasury Bills ....................................................................................................... 44 PDO-2.—Offerings of Marketable Securities Other than Regular Weekly Treasury Bills ................................................. 45 OWNERSHIP OF FEDERAL SECURITIES Introduction.—Ownership of Federal Securities ................................................................................................................. 46 OFS-1.—Distribution of Federal Securities by Class of Investors and Type of Issues ....................................................... 47 OFS-2.—Estimated Ownership of U.S. Treasury Securities ............................................................................................... 48 MARKET YIELDS Introduction.—Market Yields.............................................................................................................................................. 49 MY-1.—Treasury Market Bid Yields at Constant Maturities: Bills, Notes, and Bonds...................................................... 49

December 2009
IV
Contents
U.S. CURRENCY AND COIN OUTSTANDING AND IN CIRCULATION Introduction.—U.S. Currency and Coin Outstanding and in Circulation ............................................................................ 50 USCC-1.—Amounts Outstanding and in Circulation; Currency, Coins.............................................................................. 50 USCC-2.—Amounts Outstanding and in Circulation; by Denomination, Per Capita Comparative Totals ......................... 51 INTERNATIONAL STATISTICS INTERNATIONAL FINANCIAL STATISTICS Introduction.—International Financial Statistics ................................................................................................................. 55 IFS-1.—U.S. Reserve Assets ............................................................................................................................................... 55 IFS-2.—Selected U.S. Liabilities to Foreigners .................................................................................................................. 56 IFS-3.—Nonmarketable U.S. Treasury Bonds and Notes Issued to Official Institutions and Other Residents of Foreign Countries.............................................................................................................................. 57 CAPITAL MOVEMENTS Introduction.—Capital Movements ..................................................................................................................................... 58 SECTION I.—Liabilities to Foreigners Reported by Banks in the United States CM-I-1.—Total Liabilities by Type and Holder.................................................................................................................. 61 CM-I-2.—Total Liabilities by Country................................................................................................................................ 62 CM-I-3.—Total Liabilities by Type and Country................................................................................................................ 64 CM-A.—Chart: U.S. Liabilities to Foreigners Reported by U.S. Banks, Brokers, and Dealers with Respect to Selected Countries...................................................................................................................... 66 SECTION II.—Claims on Foreigners Reported by Banks in the United States CM-II-1.—Total Claims by Type ........................................................................................................................................ 67 CM-II-2.—Total Claims by Country ................................................................................................................................... 68 CM-II-3.—Total Claims on Foreigners by Type and Country ............................................................................................ 70 CM-B.—Chart: U.S. Claims on Foreigners Reported by U.S. Banks, Brokers, and Dealers with Respect to Selected Countries ...................................................................................................................... 72 SECTION III.—Liabilities to, and Claims on, Foreigners Reported by Nonbanking Business Enterprises in the United States CM-III-1.—Total Liabilities and Claims by Type............................................................................................................... 73 CM-III-2.—Total Liabilities to Unaffiliated Foreigners by Country................................................................................... 74 CM-III-3.—Total Claims on Unaffiliated Foreigners by Country....................................................................................... 76 CM-III-4.—Total Liabilities to, and Claims on, Unaffiliated Foreigners, by Type and Country ........................................ 78 SECTION IV.—U.S. International Transactions in Long-Term Securities CM-IV-1.—U.S. Transactions with Foreigners in Long-Term Domestic Securities by Type ............................................ 80 CM-IV-2.—U.S. Transactions with Foreigners in Long-Term Foreign Securities by Type ............................................... 81 CM-IV-3.—Net Foreign Transactions in Long-Term Domestic Securities by Type and Country...................................... 82 CM-IV-4.—U.S. Transactions with Foreigners in Long-Term Domestic and Foreign Securities, by Type and Country, during (third quarter)................................................................................................................... 84 CM-IV-5.—U.S. Transactions with Foreigners in Long-Term Domestic and Foreign Securities, by Type and Country, during (calendar year) ................................................................................................................. 86 CM-C.—Chart: Net Purchases of Long-Term Domestic Securities by Foreigners, Selected Countries ............................. 88 CM-D.—Chart: Net Purchases of Long-Term Foreign Securities by U.S. Investors .......................................................... 89

December 2009
V
Contents
SECTION V.—Holdings of, and Transactions in, Derivatives Contracts with Foreigners Reported by Businesses in the United States CM-V-1.—Gross Totals of Holdings with Positive and Negative Fair Values by Type of Contract .................................. 90 CM-V-2. —Gross Total of Holdings with Negative Fair Values, by Country .................................................................... 91 CM-V-3. —Gross Total of Holdings with Positive Fair Values, by Country...................................................................... 92 CM-V-4. —Net Cash Settlements Received by U.S. Residents from Foreign Residents, by Type of Contract.................. 93 CM-V-5. —Net Cash Settlements Received by U.S. Residents from Foreign Residents, by Type of Country ................. 94 FOREIGN CURRENCY POSITIONS Introduction.—Foreign Currency Positions......................................................................................................................... 95 SECTION I.—Canadian Dollar Positions FCP-I-1.—Weekly Report of Major Market Participants.................................................................................................... 96 FCP-I-2.—Monthly Report of Major Market Participants .................................................................................................. 97 FCP-I-3.—Quarterly Report of Large Market Participants ................................................................................................. 97 SECTION II.—Japanese Yen Positions FCP-II-1.—Weekly Report of Major Market Participants................................................................................................... 98 FCP-II-2.—Monthly Report of Major Market Participants ................................................................................................. 99 FCP-II-3.—Quarterly Report of Large Market Participants ................................................................................................ 99 SECTION III.—Swiss Franc Positions FCP-III-1.—Weekly Report of Major Market Participants ............................................................................................... 100 FCP-III-2.—Monthly Report of Major Market Participants.............................................................................................. 101 FCP-III-3.—Quarterly Report of Large Market Participants............................................................................................. 101 SECTION IV.—Sterling Positions FCP-IV-1.—Weekly Report of Major Market Participants ............................................................................................... 102 FCP-IV-2.—Monthly Report of Major Market Participants.............................................................................................. 103 FCP-IV-3.—Quarterly Report of Large Market Participants............................................................................................. 103 SECTION V.—U.S. Dollar Positions FCP-V-1.—Weekly Report of Major Market Participants ................................................................................................ 104 FCP-V-2.—Monthly Report of Major Market Participants ............................................................................................... 105 FCP-V-3.—Quarterly Report of Large Market Participants.............................................................................................. 105 SECTION VI.—Euro Positions FCP-VI-1.—Weekly Report of Major Market Participants ............................................................................................... 106 FCP-VI-2.—Monthly Report of Major Market Participants.............................................................................................. 107 FCP-VI-3.—Quarterly Report of Large Market Participants............................................................................................. 107 EXCHANGE STABILIZATION FUND Introduction.—Exchange Stabilization Fund..................................................................................................................... 108 ESF-1.—Balance Sheet ..................................................................................................................................................... 108 ESF-2.—Income and Expense ........................................................................................................................................... 109

December 2009
VI
Contents
SPECIAL REPORTS TRUST FUNDS Introduction.—Highway Trust Fund ................................................................................................................................. 113 TF-6A.—Highway Trust Fund; Highway Account, Mass Transit Account ...................................................................... 113 RESEARCH PAPER SERIES........................................................................................................................................... 114 GLOSSARY ...................................................................................................................................................................... 116 ORDER FORM FOR TREASURY PUBLICATIONS ............................................................................... Inside back cover NOTES: Definitions for words shown in italics can be found in the glossary; Figures may not add to totals because ofrounding; p = Preliminary; n.a. = Not available; r = Revised.

December 2009
VII
Nonquarterly Tables and Reports
For the convenience of the “Treasury Bulletin” user, nonquarterly tables and reports are listed below along with the issues in which they appear.
Issues March June Sept. Dec.
Federal Fiscal Operations
FFO-5.—Internal Revenue Receipts by State........................................................... √ FFO-6.—Customs and Border Protection Collection of Duties, Taxes and Fees
by Districts and Ports............................................................................... √
Special Reports
Financial Report of the United States Government excerpt...................................... √ Trust Fund Reports:
Airport and Airway Trust Fund ........................................................................ √ Black Lung Disability Trust Fund .................................................................... √ Harbor Maintenance Trust Fund....................................................................... √ Hazardous Substance Superfund....................................................................... √ Highway Trust Fund ......................................................................................... √ Inland Waterways Trust Fund........................................................................... √ Leaking Underground Storage Tank Trust Fund .............................................. √ Nuclear Waste Fund.......................................................................................... √ Oil Spill Liability Trust Fund ........................................................................... √ Reforestation Trust Fund .................................................................................. √ Sport Fish Restoration and Boating Trust Fund................................................ √ Uranium Enrichment Decontamination and Decommissioning Fund............... √ Vaccine Injury Compensation Trust Fund ........................................................ √ Wool Research, Development, and Promotion Trust Fund............................... √

O P E R A T I O N S
Profile of the EconomyFederal Fiscal Operations
Account of the U.S. TreasuryFederal Debt
Public Debt OperationsU.S. Savings Bonds and Notes
Ownership of Federal SecuritiesMarket Yields
U.S. Currency and Coin Outstandingand in Circulation

December 2009
3
Growth of Real GDP
3.8
1.3
4.8
2.7
0.81.5
4.8
-0.2
0.9
-5.4-6.4
3.5
-0.7-0.5
4.8
3.0 2.8
0.1
2.6
-8.0
-6.0
-4.0
-2.0
0.0
2.0
4.0
6.0
8.0
2005 2006 2007 2008 2009
(Quarterly percent change at annual rate)
Profile of the Economy [Source: Office of Macroeconomic Analysis]
As of November 12, 2009
Introduction Economic activity picked up substantially in the third
quarter of 2009, after the pace of economic contraction slowed noticeably in the second quarter. Although the economy has stabilized and there are clear signs of recovery in some sectors, improvements to date are modest compared to the declines during the recession. As of November 2009, the recession has lasted 2 years, using the December 2007 business cycle peak chosen by the National Bureau of Economic Research (NBER). The recession became the longest in the post-war period as of April, 2009.
Headline consumer prices were down on 12-month basis in 7 of the 9 months through September, reflecting the substantial decline in oil and commodity prices from peak levels reached in summer 2008. Core inflation (a measure excluding food and energy prices) has remained contained for the past several months, and fell to the lower end of recent ranges in September. Conditions in housing and financial markets have continued to improve from the start made earlier this year. Stock market indexes have trended notably higher since early March while Treasury bond yields have remained fairly steady. Most economists predict continued growth in the fourth quarter of 2009, and moderate growth through 2010. The economy has been supported by a wide variety of measures implemented under the American Recovery and Reinvestment Act of 2009 (ARRA, or the “Recovery Act”), as well as efforts to restore financial stability and improve conditions in housing markets.
Growth The U.S. economy experienced its first four-quarter
contraction since 1991 during the four quarters of 2008, as real gross domestic product (GDP) fell by 1.9 percent. Although the contraction intensified in the last quarter of 2008 and the first quarter of 2009—the fourth quarter decline in real GDP of 6.4 percent was the largest quarterly contraction since 1982–the pace of contraction slowed dramatically in the second quarter, with a contraction of 0.7 percent, the smallest in a year. Real GDP rose 3.5 percent in the third quarter, the first increase in over a year. Government spending gave a solid boost to growth, but private spending increased for the first time since the second quarter of 2008. Residential fixed investment grew after 14 straight quarterly declines, and inventory investment, personal consumption expenditures and government spending all rose. Nonresidential fixed investment fell, but less dramatically than in the previous quarter, and net exports detracted from growth for the first time in a year.
In 2008, consumer spending-which accounts for about 70
percent of GDP–registered its largest four-quarter drop since 1974, falling by 1.8 percent. After rising by 0.6 percent in the first quarter of 2009, and declining by 0.9 percent in the second, consumer spending rose by 3.4 percent in the third quarter, adding 2.4 percentage points to real GDP growth.
Residential investment–mostly residential homebuilding– now accounts for only about 3-1/2 percent of GDP after declining sharply since early 2006. After plunging 38 percent in the first quarter of 2009, residential investment fell by a somewhat more moderate 23 percent in the second quarter. Residential investment then surged by more than 23 percent in the third quarter. A number of monthly housing measures have shown marked improvement. Single-family housing starts rose 3.9 percent in September, continuing an upward trend begun in March. Sales of existing single family homes surged 9.4 percent in September and are now 24 percent above January’s record lows, even as they remain 23 percent below their late 2005 peak. After 5 months of uninterrupted growth, new single family home sales fell 3.6 percent in September, but are still up about 8 percent from their early January lows. The inventories of unsold new and existing homes continued to shrink in September, and are at their lowest levels since early 2007, but both remain high relative to sales.

4 Profile of the Economy
December 2009
Payroll Employment
-208 -226
-553
-691
-428
-153-113
8071105109151
255
88
206
-800-700-600-500-400-300-200-100
0100200300400
I II III IV I II III IV I II III IV I II III
(Average monthly change in thousandsfrom end of quarter to end of quarter)
2007 20082006 2009
Unemployment Rate
3.54.04.55.05.56.06.57.07.58.08.59.09.5
10.010.511.0
00 01 02 03 04 05 06 07 08 09
(Percent)
Oct. 200910.2%
Rising home sales and declining inventories have helped stabilize house prices; 12-month declines in prices have slowed. The Federal Housing Financing Authority (FHFA) purchase-only house price index has been stable since November 2008 and edged down 0.3 percent in August (the first decline since April). This measure is down 3.6 percent in the 12 months through August but is roughly unchanged since November 2008. The 10-city Standard & Poor’s (S&P)/Case-Shiller composite home price index rose 1.3 percent in August, and the comparable 20-city index rose 1.2 percent in August, the fourth straight monthly increases for both measures. Year-over-year declines in both measures have moderated to about 11 percent (from around 19 percent in early 2009).
The decline in business activity outside of homebuilding in 2008 and earlier this year began to moderate in the second quarter of 2009 and moderated further in the third quarter. Nonresidential fixed investment–about 10 percent of GDP–plunged by nearly 40 percent at an annual rate during the first quarter (a record decline) and by nearly 10 percent in the second quarter, but fell by a more modest 2.5 percent in the third quarter. Outlays for equipment and software edged up in the third quarter after falling sharply during the first half of the year. Altogether, the drop in business investment subtracted 0.2 percentage point from real GDP growth in the third quarter, posing much less drag than in the first or second quarters.
Export growth was a key driver of overall economic growth in 2007 and most of 2008, but in the three quarters prior to the third quarter exports were a significant drag. As exports declined, imports also declined sharply. Exports account for about 12 percent of GDP, while imports, which
are subtracted from GDP, account for about 17 percent. In the third quarter, exports grew by 14.7 percent and imports grew faster, by 16.4 percent. As a result, net exports subtracted 0.5 percentage point from third quarter growth in real GDP.
Although the U.S. trade balance (which measures trade in goods and services) and the current account (which also includes investment income flows and unilateral transfers) remains in deficit, both deficits have narrowed appreciably in recent years. The merchandise trade deficit reached $828 billion in 2006, but declined to $794 billion in 2007, then widened a bit to $816 billion in 2008. The current account balance has been in deficit almost continuously since the early 1980s, and in 2006, reached a record $804 billion, equivalent to 6.0 percent of GDP. In 2007, the deficit narrowed to $727 billion, or 5.2 percent of GDP, and in 2008, the current account narrowed further to $706 billion, equivalent to 4.9 percent of GDP.
Public sector purchases–which account for roughly 20 percent of GDP–rose 2.3 percent at an annual rate in the third quarter, adding 0.5 percentage point to real GDP growth. Federal spending jumped almost 8 percent in the third quarter, after an 11.4 percent surge in the second quarter. State and local government spending fell 1.1 percent, after growing by 5.2 percent in the second quarter.
Labor Markets Labor market conditions deteriorated throughout 2008
and conditions worsened during the first part of 2009, although the pace of job loss has moderated during the year. From the beginning of the recession in December 2007 through October 2009, 7.3 million jobs have been lost,

Profile of the Economy 5
December 2009
-3
-2
-1
0
1
23
4
5
6
7
98 99 00 01 02 03 04 05 06 07 08 09
Excluding food and energy Total
Consumer Prices(Percent change from a year earlier)
Food
including over 4.2 million jobs during the first 10 months of this year alone. Nonfarm payrolls fell by an average of nearly 700,000 per month during the first quarter of 2009. Job declines started to slow in the second quarter, and in October, the decline in payrolls was roughly one-third of the 557,000 average monthly job loss during the first 6 months of 2009, and below the average monthly loss of 226,000 in the third quarter. The unemployment rate has generally trended higher through October, rising above the 10 percent mark to 10.2 percent, a 26-year high and 5.8 percentage points above the March 2007 low of 4.4 percent. A measure of unemployment that includes workers who are underemployed and those who are only marginally attached to the labor force reached a record high of 17.5 percent in October 2009 (series dates from 1994)–more than double its level of 8.7 percent in December 2007.
Job losses have been spread broadly across most sectors. Since the start of the recession, manufacturing payrolls have declined by 2.1 million, and construction payrolls have declined by 1.6 million. However, a few sectors have continued to see job growth, including health care and education, which together added more than 800,000 jobs to payrolls between December 2007 and October 2009.
Inflation Headline inflation peaked at 5.6 percent in the year
through July 2008, boosted by surging food and energy prices. Since then, the headline measure has retreated noticeably on a 12 month basis, mainly due to declines in energy prices (down 22 percent in the year through September) as well as increasing economic slack and to a
lesser extent, slowing food price inflation. Headline consumer prices have fallen on a 12-month basis in 7 of the last 9 months, including a decline of 1.3 percent in the year ending in September 2009, a sharp contrast from the 4.9 percent rise in the previous year. More recently, headline prices have turned up. For the 3 months ending in September 2009, headline consumer prices rose at an annual rate of 2.5 percent (energy prices rose nearly 21 percent at an annual rate over that same period) and so far in 2009, headline inflation is 2.7 percent (annualized). Core consumer prices (excluding food and energy) rose by 1.5 percent in the year through September 2009, well-below the year-earlier pace of 2.5 percent and still close to 2004 lows. In the 3 months ending in September 2009, core prices increased at a 1.3 percent annual rate.
Energy prices have risen since late 2008, but are well-below the record highs reached in mid-summer 2008. The retail price of regular gasoline hit a record of $4.11 per gallon in early July 2008, then dropped to $1.61 in late December 2008. At the end of October the price had risen to $2.67 per gallon, more than $1.00 higher than the December low and unchanged from a year ago. The front-month futures price for West Texas Intermediate (WTI) crude oil traded to a record $147 per barrel in mid-July 2008, but has since dropped, and averaged $76 per barrel in October.
Food prices rose rapidly over much of 2007 and 2008, remaining above the overall inflation rate, but have since declined. In September, consumer food prices edged 0.1 percent lower and fell 0.2 percent over the year, contrasting sharply with the 6.2 percent rate of the preceding year.
Federal Budget The federal budget deficit widened to $1.4 trillion in
fiscal year 2009 (10 percent of GDP), well above the $459 billion in fiscal year 2008 (3.2 percent of GDP). This deterioration followed 3 years of improvement that had trimmed the deficit to $162 billion (1.2 percent of GDP) in fiscal year 2007. Outlays grew by over 18 percent in fiscal year 2009 compared with fiscal year 2008, and included expenditures under the Troubled Asset Relief Program (TARP) and for Housing and Economic Recovery Programs (HERA). Weak economic growth weighed on receipts, which fell by nearly 17 percent.
The Mid-Session Review of the Budget, released in August, projects the budget deficit will be $1.5 trillion (10.4 percent of GDP) in fiscal year 2010. Expenditures are expected to grow by 3.1 percent, and receipts are projected to rise by 9.2 percent, reflecting rising growth and incomes. The budget deficit will narrow in subsequent years, averaging 4.5 percent of GDP from fiscal year 2011 to fiscal year 2019. New economic and budget projections will be released early in 2010.

6 Profile of the Economy
December 2009
Economic Policy Key policy actions taken over the past year have kept the
economy from contracting even further, and continue to set the stage for recovery in the remainder of 2009 and beyond. The ARRA puts $787 billion toward stimulating domestic demand; through the end of September, the Federal Government had paid out more than $85 billion in Recovery Act funds to the fifty states plus the District of Columbia, with a total of about $204 billion either already paid out or obligated to be paid out in the near future. This spending will provide an important boost to economic activity through the remainder of this year and in 2010. Specifically, the Recovery Act is expected to create or save an estimated 3.5 million jobs in a range of industries from clean energy to health care. The ARRA is also helping to bolster incomes and support consumer spending: government estimates suggest that as of May, nominal disposable personal income was about $207 billion (nearly 2 percent) higher than it otherwise would have been without the Making Work Pay tax cuts or the one-time payments to eligible recipients (mostly Social Security recipients).
Financial Markets Financial markets came under unprecedented stress in
the fall of 2008, but a wide range of financial stability measures and the boost to the economy through the ARRA have helped to support more normal functioning. Since early this year, credit flows have picked up and measures of financial risk have since improved substantially, with some returning to pre-crisis levels.
Partly in response to rising financial market stress, as well as, signs of more slowing in the broader economy, the Federal Reserve began easing monetary policy in August 2007, and has since cut the rate to a range of 0 percent to 0.25 percent set at the December 2008 Federal Open Market Committee (FOMC) meeting, which brought the target to its lowest level in history. The target range was maintained at the FOMC’s most recent meeting in early November, when the Committee observed a pick up in economic activity, general stabilization in financial market conditions, and subdued inflation. The Federal Reserve has greatly expanded its tools to increase liquidity in credit markets and ease lending terms to sectors that need a temporary injection. These include a variety of facilities and funds directed at specific financial markets, including commercial paper and money market funds. Purchases of about $300 billion of Treasury securities were completed by the end of October 2009. The expiration date of the Term Asset-Backed Securities Loan Facility (TALF) remains December 31, 2009, and other liquidity facilities, such as the Term Auction
Facility (TAF) do not have a fixed expiration date. At the November meeting, the FOMC reaffirmed its support of mortgage lending and housing markets through purchases of agency mortgage-backed securities ($1.25 trillion) and agency debt (about $175 billion). It noted that agency debt purchases were less than the previously announced maximum of $200 billion, but were consistent with plans to slow the pace of such purchases as well as the limited availability of agency debt. Both types of purchases will finish by the end of the first quarter of 2010, a quarter later than first announced.
Equity market indexes fell very sharply in 2008, and volatility rose to record levels. The S&P 500 index declined 38.5 percent in 2008, compared with a 3.5 percent gain the previous year. The loss was the largest since 1931, when an earlier version of the index (containing only 90 stocks) dropped 47 percent. This year, the S&P 500 reached a 12-year low in mid-March and since then has risen by about 60 percent. Year-to-date, the index is about 20 percent higher. The S&P stock market volatility index (VIX), often used as a measure of financial market uncertainty, surged to an all-time high of 80 percent in late October 2008, after hovering in a range of 20 to 30 percent for most of 2008. The VIX has since retreated to about 28 percent as of early November.
Long-term Treasury interest rates have responded to a variety of factors, including flight-to-quality flows in response to financial market pressures, as well as concerns about the increase in supply that will be necessary to fund the government’s emergency support programs. After trading between 3.5 percent and 4.5 percent for most of 2008, the yield dropped off sharply starting in mid-November 2008, reaching a low of 2.1 percent in late December. Since then, the 10-year note yield has generally trended higher, and in recent months has traded in a more stable range. The yield stood at about 3.6 percent as of early November. The 3-month Treasury bill yield, by contrast, generally trended lower throughout 2008 under the relatively steady influence of safe-haven demand for short-term liquid assets. The yield reached an all-time low of slightly above zero by the end of December, but rose during the first half of 2009, trading in the range of 0.2 percent. Since late August, however, the 3-month yield has declined, falling to 0.05 percent as of early November. The 2- to 10-year Treasury yield spread, one measure of the steepness of the yield curve, has widened noticeably since mid-2007, when it was roughly 20 basis points. This spread has steepened to an average 250 basis points in October. A steepening yield curve may suggest rising uncertainty about long-term prospects.

Profile of the Economy 7
December 2009
Long-Term Interest Rate Spreads
-1.0
0.0
1.0
2.0
3.0
4.0
5.0
6.0
7.0
2006 2007 2008 2009
(Percent)
Corporate Baa toTreasury Ten-Year Yield Spread
Treasury Two-Yearto Ten-Year Yield Spread
Short-Term Interest Rate Spreads
0.0
1.0
2.0
3.0
4.0
5.0
6.0
2006 2007 2008 2009
(Percent)
TED Spread
Libor-OIS Spread
Key interest rates on private securities, which spiked in response to financial market turbulence late last year, have retraced in 2009 as conditions have stabilized. The spread between the 3-month London Inter-bank Offered Rate (LIBOR) and the 3-month Treasury bill rate (the TED spread, a measure of inter-bank liquidity and credit risk) had averaged less than 50 basis points before the crisis began to worsen in August 2007 and rose to an all-time high of nearly 460 basis points in early October 2008. Improvements in short-term credit availability narrowed the spread to about 15 basis points in late September, but the spread had widened to about 25 basis points in early November. The spread between the Baa corporate bond yield and the 10-year Treasury yield averaged 170 basis points through most of 2007, before the financial market turmoil emerged. It peaked at nearly 620 basis points last December and has narrowed since then, but has remained in the range of about 290 basis points over the past 3 months–still very high by historical standards.
Rates for conforming mortgages have remained relatively stable in recent months, and jumbo mortgage rates have started to trend lower. The interest rate for a 30-year conforming fixed-rate mortgage rose to about 5.3 percent as of early November. The jumbo-conforming spread had widened to 160 basis points by the end of last year, well up from the more typical 20 to 25 basis point spread seen prior
to the onset of the housing and credit market problems. Although this spread had widened again to about 160 basis points in mid-May, it has since narrowed to just under 100 basis points as of early November.
Foreign Exchange Rates The value of the U.S. dollar compared with the
currencies of seven major trading partners (the euro area countries, Japan, Canada, the United Kingdom, Australia, Sweden, and Switzerland) has depreciated significantly from its peak in February 2002, but most recently, has begun to stabilize. Between February 2002 and January 2009, the exchange value of the dollar compared to an index of these currencies fell by about 16 percent. Between October 2007 and October 2009, however, the dollar appreciated by 2.0 percent against these currencies. Over the longer timeframe, the dollar depreciated by about 33 percent against the yen, and by 34 percent against the euro. Over the past 2 years, the dollar has depreciated by about 22 percent against the yen and by 4.0 percent against the euro. The dollar has appreciated against an index of currencies of 19 other important trading partners (including China, India, and Mexico). Between February 2002 and January 2009, the dollar firmed by about 1 percent against this basket of currencies, and over the past 2 years, appreciated by about 4.0 percent.

December 2009
8
INTRODUCTION: Federal Fiscal Operations Budget authority usually takes the form of appropriations
that allow obligations to be incurred and payments to be made. Reappropriations are Congressional actions that extend the availability of unobligated amounts that have expired or would otherwise expire. These are counted as new budget authority in the fiscal year of the legislation in which the reappropriation act is included, regardless of when the amounts were originally appropriated or when they would otherwise lapse.
Obligations generally are liquidated by the issuance of checks or the disbursement of cash—outlays. Obligations may also be liquidated (and outlays recorded) by the accrual of interest on public issues of Treasury debt securities (including an increase in redemption value of bonds outstanding); or by the issuance of bonds, debentures, notes, monetary credits, or electronic payments.
Refunds of collections generally are treated as reductions of collections, whereas payments for earned-income tax credits in excess of tax liabilities are treated as outlays. Outlays during a fiscal year may be for payment of obligations incurred in prior years or in the same year. Outlays, therefore, flow in part from unexpended balances of prior year budget authority and from budget authority provided for the year in which the money is spent. Total outlays include both budget and off-budget outlays and are stated net of offsetting collections.
Receipts are reported in the tables as either budget receipts or offsetting collections. They are collections from the public, excluding receipts offset against outlays. These, also called governmental receipts, consist mainly of tax receipts (including social insurance taxes), receipts from court fines, certain licenses, and deposits of earnings by the Federal Reserve system. Refunds of receipts are treated as deductions from gross receipts. Total Government receipts are compared with total outlays in calculating the budget surplus or deficit.
Offsetting collections from other Government accounts or the public are of a business-type or market-oriented nature. They are classified as either collections credited to appropriations or fund accounts, or offsetting receipts (i.e., amounts deposited in receipt accounts). The former normally can be used without an appropriation act by Congress. These occur in two instances: (1) when authorized by law, amounts collected for materials or services are treated as reimbursements to appropriations. For accounting purposes, earned reimbursements are also known as revenues. These offsetting collections are netted against gross outlays in determining net outlays from such appropriations; and (2) in the three types of revolving funds (public enterprise, intragovernmental, and trust); offsetting collections are netted against spending, and outlays are reported as the net amount.
Offsetting receipts in receipt accounts cannot be used without appropriation. They are subdivided into three categories: (1) proprietary receipts, or collections from the public, offset against outlays by agency and by function; (2) intragovernmental transactions, or payments into receipt accounts from governmental appropriation or fund accounts. They finance operations within and between Government agencies and are credited with collections from other Government accounts; and (3) offsetting governmental receipts that include foreign cash contributions.
Intrabudgetary transactions are subdivided into three categories: (1) interfund transactions—payments are from one fund group (either Federal funds or trust funds) to a receipt account in the other fund group; (2) Federal intrafund transactions—payments and receipts both occur within the Federal fund group; and (3) trust intrafund transactions—payments and receipts both occur within the trust fund group.
Offsetting receipts are generally deducted from budget authority and outlays by function, subfunction, or agency. There are four types of receipts, however, that are deducted from budget totals as undistributed offsetting receipts. They are: (1) agencies’ payments (including payments by off-budget Federal entities) as employers into employees’ retirement funds; (2) interest received by trust funds; (3) rents and royalties on the Outer Continental Shelf lands; and (4) other interest (i.e., that collected on Outer Continental Shelf money in deposit funds when such money is transferred into the budget).
The Government has used the unified budget concept set forth in the “Report of the President’s Commission on Budget Concepts” as a foundation for its budgetary analysis and presentation since 1969. The concept calls for the budget to include all of the Government’s fiscal transactions with the public. Since 1971, however, various laws have been enacted removing several Federal entities from (or creating them outside of) the budget. Other laws have moved certain off-budget Federal entities onto the budget. Under current law, the off-budget Federal entities consist of the two Social Security trust funds, Federal Old-Age and Survivors Insurance and the Federal Disability Insurance Trust Fund, and the Postal Service.
Although an off-budget Federal entity’s receipts, outlays, and surplus or deficit ordinarily are not subject to targets set by the Congressional resolution, the Balanced Budget and Emergency Deficit Control Act of 1985 [commonly known as the Gramm-Rudman-Hollings Act as amended by the Budget Enforcement Act of 1990 (2 United States Code 900-922)] included off-budget surplus or deficit in calculating deficit targets under that act and in calculating excess deficit. Partly for this reason, attention has focused on both on- and off-budget receipts, outlays and deficit of the Government.

FEDERAL FISCAL OPERATIONS
December 2009
9
Tables FFO-1, FFO-2, and FFO-3 are published quarterly and cover 5 years of data, estimates for 2 years, detail for 13 months, and fiscal year-to-date data. They provide a summary of data relating to Federal fiscal operations reported by Federal entities and disbursing officers, and daily reports from the FRBs. They also detail accounting transactions affecting receipts and outlays of the Government and off-budget Federal entities and their related effect on assets and liabilities of the Government. Data are derived from the “Monthly Treasury Statement of Receipts and Outlays of the United States Government.”
• Table FFO-1 summarizes the amount of total receipts, outlays, and surplus or deficit, as well as transactions in Federal securities, monetary assets, and balances in Treasury operating cash.
• Table FFO-2 includes on- and off-budget receipts by source. Amounts represent income taxes, social insurance taxes, net contributions for other insurance and retirement, excise taxes, estate and gift taxes, customs duties, and net miscellaneous receipts.
• Table FFO-3 details on- and off-budget outlays by agency.
• Table FFO-4 summarizes on- and off-budget receipts by source and outlays by function as reported to each major fund group classification for the current fiscal year to date and prior fiscal year to date.
• Table FFO-5 summarizes internal revenue receipts by states and by type of tax. Amounts reported are collections made in a fiscal year. They span several tax liability years because they consist of prepayments (estimated tax payments and taxes withheld by employers for individual income and Social Security taxes), payments made with tax returns and subsequent payments made after tax returns are due or are filed (that is, payments with delinquent returns or on delinquent accounts).
Amounts are reported based on the primary filing address provided by each taxpayer or reporting entity. For multistate corporations, the address may reflect only the district where such a corporation reported its taxes from a principal office rather than other districts where income was earned or where individual income and Social Security taxes were withheld. In addition, an individual may reside in one district and work in another.
• Table FFO-6 includes customs collection of duties, taxes, and fees by districts and ports.
Budget Results and Financing of the U.S. Government and Fourth-Quarter Receipts by Source
[Source: Office of Tax Analysis, Office of Tax Policy]
Fourth-Quarter Receipts The following capsule analysis of budget
receipts, by source, for the fourth quarter of fiscal year 2009 supplements fiscal data reported in the September issue of the “Treasury Bulletin.” At the time of that issue’s release, not enough data were available to analyze adequately collections for the quarter.
Individual income taxes—Individual income tax receipts, net of refunds, were $229.8 billion for the fourth quarter of fiscal year 2009. This is a decrease of $38.2 billion over the comparable prior year quarter. Withheld receipts decreased by $32.3 billion and non-withheld receipts decreased by $20.5 billion during this period. Refunds decreased by $14.7 billion over the comparable fiscal year 2008 quarter. There was an increase of $0.7 billion in accounting adjustments between individual income tax receipts and the Social Security and Medicare trust funds over the comparable quarter in fiscal year 2008.
Corporate income taxes—Net corporate income tax receipts were $36.3 billion for the fourth quarter of fiscal year 2009. This is a decrease of $31.5 billion compared to
the prior year fourth quarter. The $31.5 billion change is comprised of a decrease of $27.3 billion in estimated and final payments, and an increase of $4.2 billion in corporate refunds.
Employment taxes and contributions—Employment taxes and contributions receipts for the fourth quarter of fiscal year 2009 were $195.8 billion, a decrease of $6.2 billion over the comparable prior year quarter. Receipts to the Federal Old-Age and Survivors Insurance, Federal Disability Insurance, and Federal Hospital Insurance trust funds changed by -$3.2 billion, -$0.5 billion, and -$2.3 billion respectively. There was a -$3.4 billion accounting adjustment for prior years’ employment tax liabilities made in the fourth quarter of fiscal year 2009, while there was a -$2.6 billion adjustment in the fourth quarter of fiscal year 2008.
Unemployment insurance—Unemployment insurance receipts, net of refunds, for the fourth quarter of fiscal year 2009 were $7.6 billion, an increase of $0.1 billion over the comparable quarter of fiscal year 2008. Net State taxes deposited in the U.S. Treasury increased by $0.3 billion to $6.7 billion. Net Federal Unemployment Tax Act taxes decreased by $0.1 billion to $1.0 billion.

FEDERAL FISCAL OPERATIONS
December 2009
10
Budget Results and Financing of the U.S. Government and Fourth-Quarter Receipts by Source, con.
Contributions for other insurance and retirement—Contributions for other retirement were $1.0 billion for the fourth quarter of fiscal year 2009. This was a negligible change from the comparable quarter of fiscal year 2008.
Excise taxes—Net excise tax receipts for the fourth quarter of fiscal year 2009 were $16.0 billion, a decrease of $3.0 billion over the comparable prior year quarter. Total excise tax refunds for the quarter were $6.3 billion, an increase of $5.6 billion over the comparable prior year quarter.
Estate and gift taxes—Net estate and gift tax receipts were $5.0 billion for the fourth quarter of fiscal year 2009.
These receipts represent a decrease of $1.5 billion over the same quarter in fiscal year 2008.
Customs duties—Customs duties net of refunds were $5.5 billion for the fourth quarter of fiscal year 2009. This is a decrease of $1.9 billion over the comparable prior year quarter.
Miscellaneous receipts—Net miscellaneous receipts for the fourth quarter of fiscal year 2009 were $19.0 billion, an increase of $8.2 billion over the comparable prior year quarter. This change is due to deposits of earnings by Federal Reserve banks increasing by $8.2 billion.
Total On- and Off-Budget Results and Financing of the U.S. Government [In millions of dollars. Source: “Monthly Treasury Statement of Receipts and Outlays of the United States Government”]
Fourth quarter
July - Sept.
Fiscal year 2009
Total on- and off-budget results: Total receipts ............................................................... 515,943 2,104,613
On-budget receipts .................................................. 364,666 1,450,603Off-budget receipts .................................................. 151,277 654,010
Total outlays................................................................. 846,783 3,521,734On-budget outlays.................................................... 684,328 3,004,716Off-budget outlays.................................................... 162,455 517,018
Total surplus or deficit (-) ............................................. -330,840 -1,417,121On-budget surplus or deficit (-) ................................ -319,662 -1,554,113Off-budget surplus or deficit (-) ................................ -11,178 136,992
Means of financing: Borrowing from the public ............................................ 378,638 1,743,352Reduction of operating cash........................................ 42,597 96,343Other means ................................................................ -82,547 -422,575
Total on- and off-budget financing........................... 338,688 1,417,121
Fourth-Quarter Net Budget Receipts by Source, Fiscal Year 2009 [In billions of dollars. Source: “Monthly Treasury Statement of Receipts and Outlays of the United States Government”]
Source
July Aug. Sept. Individual income taxes...................................................... 64.9 62.5 102.4 Corporate income taxes..................................................... 2.6 5.0 28.8 Employment and general retirement.................................. 64.0 63.6 68.2 Unemployment insurance .................................................. 3.2 3.9 0.5 Contributions for other insurance and retirement .............. 0.3 0.3 0.3 Excise taxes ....................................................................... 7.1 1.9 7.0 Estate and gift taxes .......................................................... 1.9 1.4 1.6 Customs duties .................................................................. 2.1 1.5 2.0 Miscellaneous receipts....................................................... 5.4 5.5 8.1
Total budget receipts ..................................................... 151.5 145.5 218.9
Note.—Detail may not add to totals due to independent rounding.

FEDERAL FISCAL OPERATIONS
December 2009
11
CHART FFO-A.—Monthly Receipts and Outlays, 2008-2009(In billions of dollars)
-50
0
50
100
150
200
250
300
350
S O N D J F M A M J J A S
On-budgetreceipts
Off-budgetreceipts
On-budgetoutlays
Off-budgetoutlays
0100200300400500600700800900
100011001200
Individualincometaxes
Socialinsurance
andretirementreceipts
Corporateincometaxes
Excisetaxes
Misc. receipts
Estate/gifttaxes
Customduties
* Prior-year data are for the comparable year.
20092008 *
CHART FFO-B.—Budget Receipts by Fiscal Year to Date, 2008-2009(In billions of dollars)

FEDERAL FISCAL OPERATIONS
December 2009
12
TABLE FFO-1.—Summary of Fiscal Operations [In millions of dollars. Source: “Monthly Treasury Statement of Receipts and Outlays of the United States Government”]
Total on-budget and off-budget results
Fiscal year or month
Total receipts (1)
On-budget
receipts (2)
Off-budget receipts
(3)
Total outlays
(4)
On-budget outlays
(5)
Off-budget outlays
(6)
Total surplus or deficit (-)
(7)
On-budget surplus or deficit (-)
(8)
Off-budget surplus or deficit (-)
(9)
Means of financing
– net transactions Borrowing from
the public– Federal securities
Public debt securities
(10) 2005 ............................ 2,153,350 1,575,874 577,475 2,471,647 2,069,437 402,210 -318,298 -493,562 175,265 551,329 2006 ............................ 2,406,675 1,798,293 608,382 2,654,873 2,232,804 422,069 -248,197 -434,510 186,313 546,436 2007 ............................ 2,567,672 1,932,584 635,088 2,729,199 2,275,562 453,636 -161,527 -342,978 181,452 499,976 2008 ............................ 2,523,642 1,865,597 658,045 2,978,440 2,503,689 474,751 -454,798 -638,092 183,294 1,035,015 2009 ............................ 2,104,614 1,450,603 654,011 3,521,738 3,004,719 517,017 -1,417,124 -1,554,115 136,993 1,890,021 2009 - Est .................... 2,073,735 1,420,995 652,740 3,653,290 3,133,440 519,850 -1,579,555 -1,712,445 132,890 2,226,439 2010 - Est .................... 2,264,362 1,603,024 661,338 3,766,012 3,214,586 551,426 -1,501,650 -1,611,562 109,912 1,875,559 2008 - Sept.................. 272,228 218,144 54,083 226,494 169,541 56,953 45,734 48,604 -2,870 376,498
Oct................... 164,847 117,998 46,849 r 320,378 r 272,921 47,457 r -155,531 r -154,923 -608 546,654 Nov .................. 144,782 94,377 50,405 269,983 219,480 50,503 -125,201 -125,103 -98 88,115 Dec .................. 237,811 191,039 46,772 289,566 296,073 -6,507 -51,755 -105,034 53,279 41,709
2009 - Jan ................... 226,109 161,462 64,647 289,567 241,802 47,765 -63,457 -80,339 16,882 -64,215 Feb .................. 87,328 34,133 53,195 281,188 226,552 54,635 -193,860 -192,419 -1,440 245,229 Mar .................. 128,957 71,507 57,450 320,545 266,461 54,084 -191,589 -194,954 3,365 249,178 Apr................... 266,232 195,849 70,383 287,139 237,834 49,305 -20,907 -41,985 21,078 114,465 May.................. 117,241 64,098 53,143 306,892 250,801 56,090 -189,651 -186,703 -2,947 82,882 June................. 215,364 155,474 59,890 r 309,697 r 308,467 1,230 r -94,333 r -152,993 58,660 221,645 July .................. 151,503 101,818 49,685 332,183 282,233 49,950 -180,680 -180,415 -265 123,452 Aug .................. 145,538 96,166 49,372 249,093 194,024 55,069 -103,555 -97,857 -5,697 142,701 Sept ................. 218,902 166,682 52,220 265,507 208,071 57,436 -46,605 -41,390 -5,216 98,206
Fiscal year 2009............... 2,104,614 1,450,603 654,011 3,521,734 3,004,716 517,017 -1,417,121 -1,554,113 136,993 1,890,021
Means of financing—net transactions, con. Borrowing from the public-
Federal securities, con. Cash and monetary assets (deduct)
Fiscal year or month
Agency securities
(11)
Investments of
Government accounts
(12)
Total 10+11-12
(13)
U.S. Treasury operating
cash (14)
Special drawing rights (15)
Other (16)
Reserve position on the U.S. quota in
the IMF (deduct)
(17) Other (18)
Transactions not applied
to year’s surplus or
deficit (19)
Total Financing
(20) 2005 ...................................... -547 254,096 296,687 -669 -4,537 -182 -6,195 9,250 778 318,298 2006 ...................................... -245 309,215 236,975 16,447 410 196 -6,626 20,983 666 248,197 2007 ...................................... -433 293,218 206,325 23,110 646 1,314 -2,157 -22,667 782 161,527 2008 ...................................... 145 267,438 767,722 296,371 117 1,552 286 -15,354 759 454,795 2009 ...................................... 98 146,783 1,743,337 -96,343 45,527 574 8,719 -360,349 440 1,424,951
2009 - Est.............................. -177 173,392 2,052,869 -101,608 - - - -574,923 - 1,579,555 2010 - Est.............................. -278 156,218 1,719,063 - - - - -217,413 - 1,501,650
2008 - Sept ........................... -139 41,472 334,887 364,735 -77 509 -25 -15,777 295 -45,737
Oct............................. 2,465 54,614 494,505 243,350 -417 440 -314 -95,921 - 155,525 Nov............................ -2,317 -5,478 91,276 -112,502 23 -28 2,908 -75,674 - 125,201 Dec............................ 100 66,695 -24,887 -135,809 317 577 339 -58,124 190 51,755
2009 - Jan ............................. -265 -15,667 -48,813 -170,896 -293 444 -2 -58,477 - 63,457 Feb ............................ -337 -15,802 260,695 30,572 -134 361 -64 -36,100 - 193,860 Mar ............................ -196 -4,552 253,534 42,503 168 -661 584 -19,351 - 191,589 Apr............................. -145 17,030 97,290 69,302 16 -137 51 -7,151 - 20,907 May ........................... -145 -4,312 87,049 -120,986 314 -642 3,791 -14,921 - 189,651 June .......................... 12 67,607 154,050 100,720 25 75 71 41,159 - 94,318 July............................ 212 -37,157 160,822 -22,982 7 -201 457 -2,861 - 180,680 Aug............................ -151 -5,464 148,014 336 43,216 195 124 7,260 - 111,403 Sept........................... 865 29,269 69,802 -19,951 2,285 151 774 -40,188 250 46,605
Fiscal year 2009.................... 98 146,766 1,743,352 -96,343 45,527 574 8,719 -360,349 440 1,417,121
Note.—These estimates are based on the Mid-Session Review of the Budget for Fiscal Year 2010, released by the Office of Management and Budget on August 25, 2009.
* Less than $500,000. - No Transactions Detail may not add to totals due to rounding.

FEDERAL FISCAL OPERATIONS
December 2009
13
TABLE FFO-2.—On-Budget and Off-Budget Receipts by Source [In millions of dollars. Source: “Monthly Treasury Statement of Receipts and Outlays of the United States Government”]
Income taxes Individual Corporation
Social insurance and retirement receipts
Employment and general retirement Old-age, disability, and
hospital insurance
Fiscal year or month
Withheld (1)
Other (2)
Refunds (3)
Net (4)
Gross (5)
Refunds (6)
Net (7)
Net income taxes
(8) Gross
(9)
Refunds (10)
Net (11)
2005 .................. 786,559 320,942 180,279 927,222 307,095 28,814 278,281 1,205,503 746,129 2,585 743,544 2006 .................. 848,954 387,307 192,354 1,043,908 380,925 27,010 353,915 1,397,823 788,024 2,213 785,810 2007 .................. 928,583 437,668 202,779 1,163,472 395,534 25,292 370,243 1,533,715 822,216 2,220 819,996 2008 .................. 970,195 455,398 279,845 1,145,748 354,293 49,947 304,346 1,450,093 854,485 2,461 852,024 2009 .................. 861,775 312,475 258,941 915,307 225,892 87,662 138,229 1,053,536 847,185 2,511 844,674 2009 - Est .......... 903,525 - - 903,525 121,233 - 121,233 1,024,758 842,954 - 842,954 2010 - Est .......... 1,027,798 - - 1,027,798 163,782 - 163,782 1,191,580 850,323 - 850,323 2008 - Sept........ 76,035 59,089 3,527 131,597 58,537 4,906 53,631 185,228 73,309 2,461 70,848
Oct......... 79,525 14,554 7,756 86,323 9,926 9,845 81 86,404 61,916 - 61,916 Nov ........ 67,870 3,663 11,437 60,095 4,209 2,215 1,994 62,089 66,825 - 66,825 Dec ........ 103,431 8,187 2,738 108,880 51,345 3,052 48,293 157,173 63,790 - 63,790
2009 - Jan ......... 75,792 54,612 5,945 124,459 9,734 5,202 4,532 128,991 82,939 - 82,939 Feb ........ 74,704 4,120 70,107 8,717 4,696 6,751 -2,056 6,661 67,267 - 67,267 Mar ........ 83,889 8,792 51,455 41,227 22,315 18,923 3,392 44,619 72,657 - 72,657 Apr......... 62,502 130,795 56,629 136,668 27,519 12,974 14,545 151,213 90,637 - 90,637 May........ 58,335 4,082 36,198 26,218 6,211 7,615 -1,404 24,814 67,367 - 67,367 June....... 64,528 33,930 5,523 92,935 40,772 8,243 32,529 125,464 76,604 - 76,604 July ........ 67,013 4,774 6,928 64,859 8,034 5,457 2,577 67,436 63,610 - 63,610 Aug ........ 62,305 3,927 3,742 62,489 4,135 -818 4,953 67,442 63,181 - 63,181 Sept ....... 61,881 41,039 483 102,437 36,996 8,203 28,793 131,230 70,392 2,511 67,881
Fiscal year 2009... 861,775 312,475 258,941 915,307 225,892 87,662 138,229 1,053,536 847,185 2,511 844,674
Social insurance and retirement receipts, con. Employment and general retirement, con. Unemployment insurance Net for other insurance and retirement
Railroad retirement Fiscal year or month
Gross (12)
Refunds (13)
Net (14)
Net employment and general retirement
(15) Gross (16)
Refunds (17)
Net un- employment insurance
(18)
Federal employees retirement
(19)
Other retirement
(20) Total (21)
2005 ............................ 4,123 3 4,119 747,663 42,120 119 42,001 4,409 50 4,460 2006 ............................ 4,234 2 4,231 790,042 43,559 139 43,420 4,308 50 4,358 2007 ............................ 4,263 2 4,261 824,257 41,216 125 41,091 4,207 51 4,258 2008 ............................ 4,445 12 4,433 856,457 39,642 115 39,527 4,121 44 4,165 2009 ............................ 4,215 1 4,213 848,887 37,996 107 37,890 4,103 37 4,141
2009 - Est.................... 4,256 - 4,256 847,210 39,511 - 39,511 4,435 26 4,461 2010 - Est.................... 4,241 - 4,241 854,564 51,396 - 51,396 4,311 26 4,337
2008 - Sept ................. 459 * 459 71,307 2 9 -7 323 4 327
Oct................... 388 - 388 62,304 2,014 6 2,007 391 3 394 Nov.................. 383 * 383 67,208 2,980 4 2,976 319 3 322 Dec.................. 369 * 368 64,158 245 3 242 391 3 394
2009 - Jan ................... 353 * 353 83,292 1,154 6 1,149 316 4 320 Feb .................. 538 * 538 67,805 3,349 1 3,348 320 2 323 Mar .................. 425 * 425 73,081 348 11 338 321 3 324 Apr................... 352 5 348 90,985 7,078 20 7,058 320 4 323 May ................. 410 -2 412 67,779 12,694 9 12,685 387 3 390 June ................ -112 * -113 76,491 424 -23 447 366 3 369 July.................. 392 -1 393 64,003 3,286 51 3,235 334 3 338 Aug.................. 387 -1 388 63,569 3,957 10 3,947 313 3 315 Sept................. 330 * 330 68,212 467 9 458 325 3 329
Fiscal year 2009 ................ 4,215 1 4,213 848,887 37,996 107 37,890 4,103 37 4,141
See footnote at end of table.

FEDERAL FISCAL OPERATIONS
December 2009
14
Net miscellaneous receipts
Estate and gift taxes Customs duties Total receipts Fiscal year or month
Excise taxes, con. Net excise
taxes (35)
Gross (36)
Refunds (37)
Net (38)
Gross (39)
Refunds (40)
Net (41)
Deposits of earnings by
Federal Reserve banks
(42)
Universal service
fund and all other (43)
Total (44)
On-budget (45)
Off-budget (46)
2005 ....................... 73,093 25,606 841 24,764 24,198 820 23,378 19,297 13,190 32,487 1,575,874 577,475 2006 ....................... 73,962 28,688 811 27,877 25,701 891 24,810 29,945 14,439 44,384 1,798,293 608,382 2007 ....................... 65,069 26,978 934 26,044 27,548 1,538 26,010 32,043 15,185 47,228 1,932,584 635,088 2008 ....................... 67,334 29,824 980 28,844 28,537 969 27,568 33,598 16,049 49,647 1,865,593 658,045 2009 ....................... 62,484 24,675 1,197 23,482 23,544 1,091 22,455 34,318 17,419 51,739 1,450,603 654,011 2009 -Est................ 65,280 26,341 - 26,341 22,552 - 22,552 27,406 16,216 43,622 1,420,995 652,740 2010 -Est................ 68,068 19,429 - 19,429 20,464 - 20,464 38,648 15,876 54,524 1,603,024 661,338 2008 - Sept ............ 7,684 2,140 96 2,044 2,585 102 2,483 1,917 1,241 3,158 218,141 54,083
Oct.............. 3,911 2,181 85 2,097 2,727 94 2,633 3,607 1,489 5,097 117,998 46,849 Nov............. 5,321 2,387 112 2,274 2,310 85 2,225 1,333 1,033 2,366 94,377 50,405 Dec............. 5,185 2,293 107 2,186 2,165 127 2,038 4,826 1,609 6,435 191,039 46,772
2009 - Jan .............. 5,042 2,432 46 2,387 2,134 50 2,085 1,361 1,483 2,844 161,462 64,647 Feb ............. 4,248 1,438 195 1,244 1,743 61 1,682 192 1,826 2,018 34,133 53,195 Mar ............. 4,994 2,048 130 1,919 1,636 114 1,522 652 1,507 2,159 71,507 57,450 Apr.............. 5,642 4,060 84 3,976 1,960 82 1,878 4,005 1,153 5,158 195,849 70,383 May ............ 5,427 1,549 92 1,457 1,459 76 1,383 1,959 1,346 3,305 64,098 53,143 June ........... 6,735 1,051 68 983 1,614 116 1,498 1,992 1,385 3,378 155,474 59,890 July............. 7,057 2,030 105 1,926 2,108 35 2,073 3,727 1,708 5,435 101,818 49,685 Aug............. 1,944 1,494 98 1,396 1,649 195 1,455 4,140 1,330 5,470 96,166 49,372 Sept............ 6,978 1,712 75 1,637 2,039 56 1,983 6,524 1,550 8,074 166,682 52,220
Fiscal year 2009......... 62,484 24,675 1,197 23,482 23,544 1,091 22,455 34,318 17,419 51,739 1,450,603 654,011
Note.—These estimates are based on the Mid-Session Review of the Budget for Fiscal Year 2010, released by the Office of Management and Budget on August 25, 2009.
* Less than $500,000. - No transactions. Detail may not add to totals due to rounding.
TABLE FFO-2.—On-Budget and Off-Budget Receipts by Source, con. [In millions of dollars. Source: “Monthly Treasury Statement of Receipts and Outlays of the United States Government”]
Excise taxes
Airport and Airway Trust Fund Black Lung Disability
Trust Fund Highway Trust Fund Miscellaneous
Fiscal year or month
Social insurance
and retirement receipts, con.
Net social insurance and
retirement receipts
(22) Gross (23)
Refunds (24)
Net (25)
Gross (26)
Refunds (27)
Net (28)
Gross (29)
Refunds (30)
Net (31)
Gross (32)
Refunds (33)
Net (34)
2005.............................. 794,123 10,415 101 10,314 610 - 610 38,897 1,007 37,890 25,272 994 24,2782006.............................. 837,820 10,531 105 10,425 607 - 607 39,433 891 38,543 25,509 1,123 24,3862007.............................. 869,607 11,535 67 11,468 639 - 639 40,402 1,040 39,362 18,734 5,134 13,6002008.............................. 900,150 12,048 56 11,992 653 - 653 37,441 1,057 36,385 19,742 1,438 18,3042009.............................. 890,918 10,679 110 10,569 645 - 645 36,006 1,046 34,960 23,408 7,101 16,309 2009 - Est ..................... 891,182 10,450 - 10,450 371 - 371 35,271 - 35,271 19,188 - 19,1882010 - Est ..................... 910,297 10,600 - 10,600 670 - 670 35,990 - 35,990 20,808 - 20,808 2008 - Sept ................... 71,626 1,764 5 1,759 100 - 100 5,574 138 5,436 515 126 389
Oct .................... 64,706 265 - 265 14 - 14 912 - 912 2,782 63 2,720Nov.................... 70,506 942 - 942 53 - 53 3,171 - 3,171 1,293 137 1,155Dec.................... 64,794 898 - 898 50 - 50 3,021 - 3,021 1,384 169 1,216
2009 - Jan..................... 84,760 876 - 876 49 - 49 2,946 - 2,946 1,192 21 1,171Feb.................... 71,476 928 71 857 59 - 59 2,830 355 2,475 1,023 166 857Mar.................... 73,743 854 - 854 48 - 48 2,736 - 2,736 1,504 148 1,356Apr .................... 98,366 955 - 955 53 - 53 3,055 - 3,055 1,695 116 1,579May ................... 80,854 1,092 10 1,082 74 - 74 3,141 300 2,842 1,589 160 1,430June .................. 77,307 1,167 - 1,167 61 - 61 3,364 - 3,364 2,349 207 2,142July.................... 67,576 1,323 - 1,323 69 - 69 3,821 - 3,821 1,927 84 1,843Aug.................... 67,831 694 21 673 58 - 58 2,754 256 2,498 3,140 4,425 -1,285Sept................... 68,999 685 8 677 57 - 57 4,255 135 4,119 3,530 1,405 2,125
Fiscal year 2009 ................ 890,918 10,679 110 10,569 645 - 645 36,006 1,046 34,960 23,408 7,101 16,309

FEDERAL FISCAL OPERATIONS
December 2009
15
TABLE FFO-3.—On-Budget and Off-Budget Outlays by Agency [In millions of dollars. Source: “Monthly Treasury Statement of Receipts and Outlays of the United States Government”]
Fiscal year or month
Legisla- tive
branch (1)
Judicial branch
(2)
Depart- ment of Agricul-
ture (3)
Depart- ment of
Commerce (4)
Depart- ment of
Defense, military
(5)
Depart- ment of Education
(6)
Depart- ment of Energy
(7)
Depart- ment of Health
and Human
Services (8)
Depart- ment of Home- land
Security (9)
Depart- ment of Housing
and Urban
Develop-ment (10)
Depart- ment of
the Interior
(11)
Depart-ment of Justice
(12)
Depart- ment of Labor (13)
2005 ....................... 3,995 5,543 85,333 6,147 474,374 72,857 21,274 581,463 38,717 42,448 9,288 22,366 46,9432006 ....................... 4,129 5,820 93,533 6,374 499,350 93,427 19,653 614,313 69,100 42,434 9,063 23,320 43,1392007 ....................... 4,307 6,008 84,427 6,479 528,590 66,372 20,117 672,036 39,172 45,559 10,497 23,351 47,5432008 ....................... 4,429 6,345 90,786 7,726 594,680 65,957 21,404 700,501 40,683 49,086 9,880 26,544 58,8402009 ....................... 4,714 6,645 114,437 10,720 636,793 53,387 23,684 796,323 51,720 61,024 11,809 27,712 138,156 2009 - Est ............... 4,890 6,810 120,837 11,774 641,158 49,486 27,166 813,896 49,915 62,775 11,701 29,075 138,7082010 - Est ............... 5,791 7,210 133,698 16,326 692,397 102,397 46,364 879,594 50,833 53,047 13,072 31,420 160,573 2008 - Sept............. 389 550 6,271 671 52,024 5,549 4,522 46,577 4,169 3,411 978 2,296 5,528
Oct .............. 378 706 14,704 748 66,078 5,609 r 2,190 76,469 5,060 3,884 889 2,292 6,492Nov ............. 343 473 8,064 745 45,627 4,286 1,620 44,875 4,419 3,685 880 2,262 5,566Dec ............. 706 528 11,518 1,119 60,484 6,042 r 2,026 63,502 5,907 4,145 988 2,570 r 11,408
2009 - Jan .............. 343 503 10,852 777 47,009 5,921 1,601 73,151 4,210 3,737 793 1,890 9,750Feb ............. 324 497 10,278 1,235 48,258 6,591 r 1,616 61,628 3,631 3,510 835 1,895 9,625Mar ............. 357 535 9,057 655 49,428 5,351 1,907 60,167 4,333 3,828 866 2,141 12,388Apr.............. 362 527 7,884 1,035 51,704 5,653 1,909 72,707 3,989 3,507 1,088 1,774 13,000May............. 356 639 8,026 978 50,490 8,689 2,217 67,703 3,525 3,811 902 2,466 12,194June............ 437 564 8,881 1,124 53,691 -12,422 1,907 68,526 4,748 20,752 1,597 2,887 14,477July ............. 365 599 7,270 809 58,041 6,639 2,078 88,975 4,161 3,791 1,025 2,454 14,688Aug ............. 371 502 8,743 723 45,633 8,016 1,432 51,918 3,361 3,333 935 2,607 13,887Sept ............ 372 572 9,160 772 60,350 3,012 3,181 66,702 4,376 3,041 1,011 2,474 14,681
Fiscal year 2009........ 4,714 6,643 114,437 10,720 636,793 53,387 23,684 796,323 51,720 61,024 11,809 27,712 138,156
Fiscal year or month
Depart- ment of State (14)
Depart- ment of
Transpor- tation (15)
Department of the
Treasury, interest on Treasury
debt securities
(gross) (16)
Depart- ment of the
Treasury, other (17)
Depart- ment of
Veterans Affairs (18)
Corps of Engineers
(19)
Other Defense,
civil programs
(20)
Environ- mental
Protection Agency
(21)
Executive Office of the
President (22)
General Services Admin-istration
(23)
Inter- national
Assistance Program
(24) 2005 ....................... 12,754 56,597 352,350 57,927 69,844 4,720 43,484 7,911 7,689 17 15,034 2006 ....................... 12,957 60,141 405,872 58,873 69,808 6,946 44,435 8,322 5,378 22 13,945 2007 ....................... 13,749 61,701 429,978 60,623 72,820 3,918 47,112 8,258 2,957 32 12,764 2008 ....................... 17,505 64,945 451,154 97,665 84,783 5,077 45,784 7,938 1,172 342 11,403 2009 ....................... 21,434 73,007 383,365 319,806 95,489 6,840 57,277 8,072 742 319 14,827 2009 - Est............... 21,317 80,496 394,433 407,119 96,438 12,632 48,494 8,421 755 1,423 15,140 2010 - Est............... 28,952 91,089 465,444 168,869 109,527 9,744 48,568 10,760 748 2,290 23,588 2008 - Sept ............ 1,347 6,881 19,883 -5,771 4,284 487 3,875 695 -130 -34 2,282
Oct.............. 2,372 6,606 18,984 35,082 11,568 634 3,922 645 82 20 2,344 Nov............. 1,697 5,318 18,559 52,089 4,059 629 5,238 653 40 -73 2,215 Dec............. 2,037 6,253 97,775 r 19,399 10,969 906 5,683 743 55 65 -175
2009 - Jan .............. 1,482 4,245 3,133 29,357 7,499 369 6,957 581 71 16 810 Feb ............. 1,384 4,182 10,311 37,178 7,672 402 5,469 647 50 -52 924 Mar ............. 1,465 4,451 19,830 63,135 4,383 501 4,613 689 58 306 613 Apr.............. 1,368 4,748 24,847 13,539 8,017 447 3,235 617 57 -8 3,122 May ............ 1,330 5,382 20,600 21,968 8,827 538 4,599 634 65 -66 1,006 June ........... 1,765 6,645 106,612 38,133 8,331 544 4,562 838 48 49 2,549 July............. 1,879 7,502 19,813 23,564 11,447 707 4,668 639 78 81 526 Aug............. 972 7,438 27,375 -585 4,388 566 3,429 695 82 -24 -238 Sept............ 3,683 10,237 15,526 -13,053 8,329 597 4,902 691 56 5 1,131
Fiscal year 2009........ 21,434 73,007 383,365 319,806 95,489 6,840 57,277 8,072 742 319 14,827 See footnote at end of table.

FEDERAL FISCAL OPERATIONS
December 2009
16
TABLE FFO-3.—On-Budget and Off-Budget Outlays by Agency, con. [In millions of dollars. Source: “Monthly Treasury Statement of Receipts and Outlays of the United States Government”]
Undistributed offsetting receipts
Total outlays
Fiscal year or month
National Aeronautics
and Space
Adminis- tration (25)
National Science Foun- dation (26)
Office of Personnel Manage-
ment (27)
Small Business Adminis- tration (28)
Social Security Adminis- tration (29)
Indepen-dent
agencies (30)
Employer share,
employee retire- ment (31)
Interest received by trust funds (32)
Rents and
royalties on the Outer
Continen- tal Shelf
lands (33)
Other (34)
On-budget
(35)
Off-budget
(36) 2005 .................. 15,600 5,432 59,500 2,503 561,333 14,419 -58,919 -160,992 -6,144 -160 2,069,437 402,210
2006 .................. 15,125 5,541 62,400 905 585,742 12,351 -60,856 -169,295 -7,282 -113 2,232,803 422,069
2007 .................. 15,861 5,529 58,431 1,175 621,761 18,271 -61,774 -177,963 -6,762 -13,700 2,275,562 453,636
2008 .................. 17,834 5,848 64,393 527 657,799 45,196 -66,178 -191,537 -18,285 -1,790 2,503,689 474,751
2009 .................. 19,169 6,004 72,303 2,247 727,549 50,364 -70,657 -181,560 -5,293 -16,690 3,004,716 517,017
2009 - Est.......... 19,358 6,687 68,256 2,304 727,364 50,598 -69,141 -186,439 -5,103 -15,453 3,133,440 519,850
2010 - Est.......... 18,759 8,143 71,618 1,320 755,265 34,543 -75,809 -200,449 -6,664 6,985 3,214,586 551,426
2008 - Sept ....... 1,872 570 400 75 52,131 11,560 -4,407 -1,030 -1,413 * 169,541 56,953
Oct......... 1,483 477 6,008 82 59,153 6,380 -18,701 -1,906 -357 * r 272,921 47,457
Nov........ 1,426 492 5,604 81 52,073 10,777 -4,260 52 -144 -9,389 219,480 50,503
Dec........ 1,810 452 5,335 101 58,693 304 -4,968 -86,222 -594 - r 296,072 -6,507
2009 - Jan ......... 1,185 437 6,624 74 60,358 7,095 -4,211 3,196 -248 * 241,802 47,765
Feb ........ 1,345 432 5,870 1,285 59,839 5,677 -4,894 483 -364 -6,577 r 226,551 54,635
Mar ........ 1,677 450 6,730 72 56,394 10,012 -4,569 -864 -414 - 266,461 54,084
Apr......... 1,518 458 6,868 73 59,854 1,560 -4,346 -3,658 -317 - 237,834 49,305
May ....... 1,631 449 5,627 86 73,473 5,953 -5,325 -667 -488 -724 250,801 56,090
June ...... 1,750 562 5,459 89 64,869 r -6,098 -4,903 -88,313 -963 * r 308,466 1,230
July........ 1,570 597 6,632 96 64,625 2,894 -4,644 -940 -443 - 282,233 49,950
Aug........ 1,584 667 6,320 94 56,982 5,921 -4,712 -2,896 -427 - 194,024 55,069
Sept....... 2,190 531 5,226 114 61,236 -111 -5,124 175 -534 - 208,071 57,436
Fiscal year 2009.... 19,169 6,004 72,303 2,247 727,549 50,361 -70,657 -181,560 -5,293 -16,690 3,004,716 517,017
Note.—These estimates are based on the Mid-Session Review of the Budget for Fiscal Year 2010, released by the Office of Management and Budget on August 25, 2009. * Less than $500,000.
- No transactions. Detail may not add to totals due to rounding.

FEDERAL FISCAL OPERATIONS
December 2009
17
TABLE FFO-4.—Summary of U.S. Government Receipts by Source and Outlays by Agency, September 2009 and Other Periods
[In millions of dollars. Source: Financial Management Service]
This fiscal year to date Prior fiscal year to date
Classification
General funds
(1)
Management, consolidated, revolving and special funds
(2)
Trust funds
(3)
Total funds
(4)
General funds
(5)
Management, consolidated, revolving and special funds
(6)
Trust funds
(7)
Total funds
(8) Budget receipts: Individual income taxes............................................... 915,253 55 - 915,308 1,145,685 63 - 1,145,748Corporation income taxes ........................................... 138,229 - - 138,229 304,346 - - 304,346Social insurance and retirement receipts:
Employment and general retirement (off-budget)... - - 654,010 654,010 - - 658,045 658,045Employment and general retirement (on-budget)... - - 194,876 194,876 - - 198,412 198,412Unemployment insurance ....................................... - - 37,889 37,889 - - 39,527 39,527Other retirement ...................................................... - - 4,142 4,142 - - 4,169 4,169
Excise taxes ................................................................ 12,838 1,016 48,630 62,484 14,950 777 51,608 67,334Estate and gift taxes ................................................... 23,482 - - 23,482 28,844 - - 28,844Customs duties ........................................................... 13,663 7,601 1,189 22,454 17,027 9,002 1,539 27,568Miscellaneous receipts................................................ 36,564 13,865 1,310 51,738 35,600 12,979 1,068 49,647
Total receipts....................................................... 1,140,030 22,537 942,047 2,104,613 1,546,453 22,821 954,368 2,523,642(On-budget) ..................................................... 1,140,030 22,537 288,037 1,450,603 1,546,453 22,821 296,323 1,865,597(Off-budget) ..................................................... - - 654,010 654,010 - - 658,045 658,045
Budget outlays: Legislative branch ....................................................... 4,377 313 23 4,713 4,204 199 27 4,429Judicial branch ............................................................ 6,424 235 -15 6,643 6,318 31 -4 6,345Department of Agriculture ........................................... 96,752 16,628 1,057 114,436 80,160 9,628 1,001 90,789Department of Commerce........................................... 9,491 1,229 * 10,721 7,202 523 * 7,726Department of Defense-military .................................. 633,562 3,111 119 636,793 589,677 4,884 119 594,680Department of Education ............................................ 54,151 -773 9 53,387 66,684 -749 22 65,957Department of Energy................................................. 25,256 -1,572 - 23,684 22,461 -1,057 * 21,404Department of Health and Human Services ............... 575,513 -134 220,944 796,323 502,564 39 197,899 700,501Department of Homeland Security.............................. 50,402 1,016 302 51,721 43,379 -2,962 267 40,683Department of Housing and Urban Development....... 62,475 -1,449 -2 61,024 50,947 -1,863 * 49,086Department of the Interior ........................................... 11,554 -272 528 11,810 9,944 -543 479 9,880Department of Justice ................................................. 25,893 1,834 -15 27,713 24,638 1,896 10 26,544Department of Labor ................................................... 42,334 315 95,507 138,156 10,256 1,497 47,088 58,840Department of State .................................................... 20,986 -123 572 21,435 17,196 -160 469 17,506Department of Transportation..................................... 23,718 -346 49,634 73,006 17,338 -197 47,803 64,945Department of the Treasury:
Interest on the public debt....................................... 383,365 - - 383,365 451,154 - - 451,154Other ....................................................................... 320,230 -347 -76 319,806 98,730 -980 -85 97,665
Department of Veterans Affairs .................................. 97,182 -2,787 1,095 95,490 86,171 -2,436 1,048 84,783Corps of Engineers ..................................................... 6,142 -220 918 6,840 4,531 -220 766 5,077Other defense civil programs...................................... 61,894 -3,396 -1,221 57,277 59,227 -12,861 -582 45,784Environmental Protection Agency............................... 8,478 -31 -376 8,070 7,909 -19 48 7,938Executive Office of the President................................ 743 * * 743 1,172 * * 1,172General Services Administration ................................ 307 13 * 320 201 140 * 342International Assistance Program............................... 18,756 -934 -2,995 14,827 17,197 -1,164 -4,630 11,403National Aeronautics and Space Administration ........ 19,169 -2 1 19,168 17,841 -9 1 17,834National Science Foundation...................................... 5,859 96 50 6,005 5,738 74 36 5,848Office of Personnel Management ............................... 40,598 -2,888 34,592 72,302 39,792 -7,003 31,604 64,393Small Business Administration ................................... 2,255 -9 * 2,246 551 -24 * 528Social Security Administration .................................... 78,679 -24 648,894 727,549 58,608 -7 599,197 657,799Other independent agencies....................................... 10,278 29,724 10,358 50,361 8,851 28,148 8,198 45,196Undistributed offsetting receipts:
Interest .................................................................... - - -181,561 -181,561 - - -191,537 -191,537Other ....................................................................... -3,992 -28,635 -60,012 -92,638 -16,973 -14,598 -54,682 -86,253
Total outlays........................................................ 2,692,829 10,572 818,332 3,521,734 2,293,670 207 684,563 2,978,440(On-budget) ..................................................... 2,692,576 10,522 301,618 3,004,716 2,293,670 -2,210 212,230 2,503,689(Off-budget) ..................................................... 253 51 516,714 517,018 - 2,417 472,334 474,751
Surplus or deficit (-)............................................. -1,552,800 11,965 123,714 -1,417,121 -747,217 22,614 269,805 -454,798(On-budget) ..................................................... -1,552,547 12,016 -13,582 -1,554,113 -747,217 25,031 84,094 -638,092(Off-budget) ..................................................... -253 -51 137,296 136,992 - -2,417 185,711 183,294
- No transactions. * Less than $500,000.
Note.—Detail may not add to totals due to rounding.

FEDERAL FISCAL OPERATIONS
December 2009
18
TABLE FFO-5.—Internal Revenue Receipts by State, 2009 [In thousands of dollars. Source: Chief Financial Officer, Revenue Financial Management OS:CFO:R]
Individual income and employment taxes
State
Total Internal
Revenue collections
(1)
Corporation income tax 1
(2) Total (3)
Income tax not withheld and SECA
tax 2, 3 (4)
Income tax withheld and FICA
tax 2 (5)
Railroad
retirement tax (6)
Unemploy- ment
insurance tax (7)
Estate tax (8)
Gift tax (9)
Excise taxes (10)
United States, total 4 ................... 2,345,337,178 225,481,588 2,048,546,621 364,073,379 1,672,997,777 4,710,453 6,765,012 21,583,131 3,094,192 46,631,646 Alabama ........................................ 20,093,422 690,741 19,053,914 3,758,622 15,218,090 2,805 74,396 204,275 32,438 112,055 Alaska............................................ 4,670,157 222,515 4,387,073 1,019,760 3,350,707 1,777 14,828 16,978 91 43,500 Arizona .......................................... 32,372,226 2,471,398 28,564,174 5,172,402 23,267,499 1,750 122,524 209,951 20,209 1,106,494 Arkansas ....................................... 25,727,268 5,524,663 19,431,278 2,293,283 16,989,868 2,124 146,003 84,012 55,826 631,489 California ....................................... 264,868,391 27,095,063 230,209,894 47,999,999 181,431,700 7,846 770,349 4,072,265 429,024 3,062,144 Colorado........................................ 38,484,608 2,856,472 34,005,912 6,403,331 27,483,580 11,745 107,256 290,309 52,409 1,279,506 Connecticut ................................... 44,684,141 4,800,755 39,059,563 8,620,898 30,351,139 4,112 83,414 356,361 81,155 386,307 Delaware ....................................... 13,683,353 2,725,766 10,832,715 1,388,202 9,418,102 32 26,378 97,427 13,413 14,033 District of Columbia ....................... 19,487,689 1,466,547 17,896,573 1,422,826 16,043,213 415,193 15,341 97,661 15,627 11,281 Florida ........................................... 110,156,809 4,426,304 102,968,650 24,677,272 77,258,273 656,021 377,085 1,742,496 313,100 706,259 Georgia.......................................... 59,486,251 5,671,371 51,636,705 7,789,692 43,616,892 2,201 227,921 392,509 35,182 1,750,485 Hawaii............................................ 6,747,592 423,772 6,134,814 1,334,210 4,778,720 [5] 21,883 67,301 6,777 114,929 Idaho ............................................. 6,859,632 501,992 6,249,425 1,296,892 4,920,516 1,003 31,015 85,015 7,075 16,125 Illinois ............................................ 116,130,852 12,991,659 100,734,255 18,091,514 82,165,107 155,382 322,253 807,157 109,784 1,487,997 Indiana........................................... 42,108,854 2,883,236 38,686,817 4,597,156 33,968,701 13,870 107,091 249,491 21,314 267,996 Iowa............................................... 17,614,407 1,427,436 15,963,661 2,873,082 13,027,713 5,381 57,486 114,710 4,780 103,820 Kansas .......................................... 20,374,354 1,267,195 17,803,520 3,120,008 13,726,781 889,434 67,298 131,621 21,564 1,150,454 Kentucky........................................ 23,313,696 1,446,147 21,512,933 2,877,224 18,549,489 9,655 76,565 134,635 4,643 215,337 Louisiana....................................... 34,882,848 1,326,230 32,971,179 5,816,545 27,068,053 4,465 82,116 278,455 23,669 283,315 Maine............................................. 6,105,799 177,487 5,692,584 1,010,443 4,655,688 3,071 23,382 49,689 3,693 182,346 Maryland........................................ 44,484,984 2,186,965 41,674,214 6,966,298 34,578,449 15,704 113,764 439,308 86,449 98,048 Massachusetts .............................. 70,108,079 5,014,595 63,808,820 10,631,713 52,949,497 58,282 169,327 652,577 70,521 561,567 Michigan........................................ 56,050,689 3,429,151 52,053,616 6,820,114 44,946,212 94,889 192,402 311,650 138,800 117,472 Minnesota...................................... 67,646,589 8,850,168 57,135,872 5,534,072 51,349,111 63,783 188,906 295,775 202,196 1,162,578 Mississippi ..................................... 9,603,121 554,850 8,738,012 1,971,346 6,728,925 1,025 36,716 63,994 11,173 235,092 Missouri ......................................... 44,310,000 3,861,265 39,048,966 5,462,043 33,381,605 64,929 140,390 560,301 30,584 808,884 Montana ........................................ 4,136,011 177,339 3,864,272 1,001,462 2,827,815 18,868 16,127 40,038 5,399 48,963 Nebraska....................................... 16,200,400 3,941,704 12,121,294 1,927,204 9,151,055 1,001,201 41,834 71,577 13,205 52,620 Nevada.......................................... 13,770,576 728,916 12,802,614 3,530,890 9,216,494 91 55,139 117,542 16,780 104,724 New Hampshire............................. 8,739,838 467,026 8,118,357 1,563,751 6,529,298 126 25,182 101,868 4,282 48,304 New Jersey ................................... 103,548,696 14,950,946 87,095,421 13,265,999 73,482,062 122,535 224,824 483,034 60,920 958,376 New Mexico................................... 8,188,815 284,268 7,713,273 1,636,948 6,046,363 531 29,431 81,270 8,965 101,040 New York....................................... 193,446,916 18,213,230 171,565,629 34,383,573 136,468,421 331,953 381,681 2,342,343 369,050 956,664 North Carolina ............................... 63,348,252 9,039,509 53,783,272 7,084,679 46,484,462 5,249 208,882 341,501 80,981 102,990 North Dakota ................................. 4,115,943 261,179 3,816,679 1,059,714 2,739,527 4,149 13,288 16,533 3,759 17,793 Ohio............................................... 103,638,344 8,826,533 91,350,121 8,400,504 82,638,467 19,679 291,471 664,998 54,977 2,741,714 Oklahoma...................................... 24,297,410 2,387,976 17,936,398 4,604,861 13,257,886 3,044 70,607 182,627 10,982 3,779,428 Oregon .......................................... 21,736,643 1,147,789 20,196,879 3,420,525 16,701,037 665 74,652 174,889 33,948 183,139 See footnotes at end of table.

FEDERAL FISCAL OPERATIONS
December 2009
19
TABLE FFO-5.—Internal Revenue Receipts by State, 2009, con. [In thousands of dollars. Source: Chief Financial Officer, Revenue Financial Management OS:CFO:R]
Individual income and employment taxes
State
Total Internal
Revenue collections
(1)
Corporation income tax 1
(2) Total (3)
Income tax not withheld and SECA
tax 2, 3 (4)
Income tax withheld and FICA
tax 2 (5)
Railroad
retirement tax (6)
Unemploy- ment
insurance tax (7)
Estate tax (8)
Gift tax (9)
Excise taxes (10)
Pennsylvania............................ 106,613,979 10,612,832 92,949,541 12,783,695 79,809,018 56,815 300,014 745,977 60,576 2,245,053 Rhode Island ............................ 10,909,205 2,745,130 8,063,988 1,049,469 6,982,925 14 31,580 83,025 10,217 6,845 South Carolina ......................... 17,806,603 937,804 16,524,564 3,007,867 13,448,793 1,537 66,368 197,902 18,553 127,780 South Dakota ........................... 4,888,826 171,290 4,664,408 1,759,322 2,873,256 17,501 14,328 27,542 2,022 23,564 Tennessee ............................... 44,047,939 3,651,310 39,436,002 5,036,613 34,218,714 1,831 178,844 195,345 8,569 756,713 Texas........................................ 200,521,512 24,235,172 158,798,111 34,220,816 123,995,690 17,012 564,593 1,780,030 242,918 15,465,279 Utah.......................................... 14,270,839 686,104 12,906,483 2,319,181 10,526,001 3,304 57,997 34,201 8,919 635,132 Vermont.................................... 3,366,627 209,377 3,066,551 645,516 2,408,321 2,157 10,558 72,808 956 16,936 Virginia ..................................... 58,598,281 7,229,899 50,669,866 9,039,113 40,875,271 592,451 163,032 501,374 59,684 137,458 Washington .............................. 48,587,720 5,161,652 42,552,023 8,645,142 33,738,292 5,744 162,844 328,734 84,452 460,859 West Virginia ............................ 6,332,264 370,444 5,852,802 1,192,854 4,638,334 449 21,166 26,179 1,113 81,726 Wisconsin................................. 38,642,363 3,288,051 34,662,866 5,260,909 29,260,384 4,856 136,716 250,149 48,862 392,435 Wyoming .................................. 3,833,691 214,410 3,407,743 1,275,372 2,121,261 670 10,440 83,743 13,551 114,244 U.S. Armed Services
overseas and Territories other than Puerto Rico ........ 601,822 1,630 574,724 140,091 432,339 - 2,294 9,364 4,039 12,065 Puerto Rico .......................... 3,742,730 183,108 3,558,007 320,839 3,198,739 3 38,425 570 17 1,027 International ......................... 11,061,106 2,055,407 8,508,466 2,881,642 5,614,491 769 11,564 123,340 7,608 366,284
Undistributed 4 .......................... 6,288,017 -992,188 5,731,128 3,665,881 2,089,432 10,771 -34,956 698,710 67,392 782,975
1 Includes tax-exempt business income taxes from "unrelated business income" (Form 990-T) and farmer's cooperatives (Form 990-C). 2 Collections of individual income tax are not reported by payers separately from Old-Age, Survivors, Disability, and Hospital Insurance (OASDHI) taxes on salaries and wages (under the Federal Insurance Contributions Act or FICA), and on self-employment income (under the Self-Employment Insurance Contributions Act or SECA). 3 Includes estate and trust income tax collections of $14.7 billion. 4 Includes tax and excess withholding payments not classified by State as of the end of the fiscal year because they had not been applied to taxpayer accounts. 5 Less than $500. Notes: Gross collections exclude excise taxes paid to the Customs Service and the Alcohol and Tobacco Tax and Trade Bureau. Collection and refund data by State may not be comparable for a given fiscal year, because payments made in prior years may be refunded in the current fiscal year. Adjustments to prior years made in fiscal year 2009 may result in negative amounts when such adjustments exceed current year collections. See Table 8 for refund data.
Classification by State is based on the individual's address (or, in the case of businesses, the location of the principal office or place of business). However, some individuals may use the address of a tax attorney or accountant. Sole proprietors, partners in a partnership, or shareholders in an S corporation may use their business address. Such addresses could have been located in a State other than the State in which the individual resided. Similarly, taxes withheld reported by employers located near a State boundary might include substantial amounts withheld from salaries of employees who reside in a neighboring State. Also, while taxes of corporations may be paid from the principal office, the operations of these corporations may be located in one or more other State(s). Detail may not add to totals because of rounding

FEDERAL FISCAL OPERATION
December 2009
20
TABLE FFO-6.—Customs and Border Protection Collection of Duties, Taxes, and Fees by Districts and Ports
[Source: U. S. Customs and Border Protection]
District and Port of Collection
Port Code
Collection Fiscal Year
2009 District and Port
of Collection Port Code
Collection Fiscal Year
2009 Headquarters:
Revenue Division ........................................................... $1,492,447,692.42 Portland, Maine:
Portland, ME .................................. 10101.................... 37,691,934.31 Bangor, ME .................................... 10102.................... 140,976.25 Eastport, ME .................................. 10103.................... 58,323.09 Jackman, ME ................................. 10104.................... 441,347.56 Vanceboro, ME .............................. 10105.................... 4,885,659.38 Houlton, ME ................................... 10106.................... 4,649,134.18 Fort Fairfield, ME............................ 10107.................... 53,091.69 Van Buren, ME............................... 10108.................... 89,330.57 Madawaska, ME............................. 10109.................... 66,546.31 Fort Kent, ME ................................. 10110.................... 20,385.00 Calais, ME...................................... 10115.................... 3,530,448.88 Limestone, ME ............................... 10118.................... 5,884.58 Bridgewater, ME............................. 10127.................... 9,597.26 Portsmouth, NH.............................. 10131.................... 2,057,457.42 Belfast, ME..................................... 10132.................... 3,076,127.13 Manchester, NH User Fee Airport.... 10182.................... 246,869.44
Total District ............................................................. 57,023,113.05 St. Albans, Vermont:
St. Albans, VT ..................................... 10201.................... 702,862.61 Richford, VT ........................................ 10203.................... 23,103.32 Beecher Falls, VT ............................... 10206.................... 680,227.86 Burlington, VT ..................................... 10207.................... 65,348.89 Derby Line, VT.................................... 10209.................... 6,508,366.69 Norton, VT........................................... 10211.................... 542,195.93 Highgate Springs, VT ......................... 10212.................... 34,774,619.32
Total District ............................................................. 43,296,724.62 Boston, Massachusetts:
Boston, MA..................................... 10401.................... 244,902,421.10 Springfield, MA............................... 10402.................... 229,118.73 Worchester, MA ............................. 10403.................... 54,880,465.72 Glouchester, MA ............................ 10404.................... 4,822.68 New Bedford, MA........................... 10405.................... 4,339,055.18 Plymouth, MA................................. 10406.................... 1,263.52 Salem, MA...................................... 10408.................... 3,257,917.59 Bridgeport, CT................................ 10410.................... 2,567,976.92 Hartford, CT ................................... 10411.................... 5,153,702.80 New Haven, CT.............................. 10412.................... 12,508,927.02 New London, CT ............................ 10413.................... 34,684.16 Lawrence, MA ................................ 10416.................... 21,608.76 Logan Airport, MA .......................... 10417.................... 72,422,750.93 Hanscom Field User Fee Airport ... 10481.................... 278,181.63
Total District ............................................................. 400,602,896.74 Providence, Rhode Island:
Newport, RI .................................... 10501.................... 78,885.97 Providence, RI................................ 10502.................... 75,711,225.18
Total District ............................................................. 75,790,111.15
Ogdensburg, New York:
Ogdensburg, NY ............................ 10701.................... 2,563,813.52 Massena, NY.................................. 10704.................... 1,939,661.84 Alexandria Bay, NY........................ 10708.................... 20,186,977.00 Champlain, NY ............................... 10712.................... 91,270,399.14 Trout River, NY .............................. 10715.................... 2,298,892.76
Total District ............................................................. 118,259,744.26 Buffalo, New York:
Buffalo, NY ..................................... 10901.................... 236,965,812.77 Rochester, NY................................ 10903.................... 5,599,899.54 Oswego, NY ................................... 10904.................... 103,929.59 Syracuse, NY ................................. 10906.................... 2,480,980.31 Binghamton, NY ............................ 10981.................... 128,203.22
Total District .............................................................. 245,278,825.43 New York, New York:
New York, NY................................. 21001.................... 728,780,101.41 Albany, NY ..................................... 21002.................... 899,052.58 UPS, Newark, NJ ........................... 24670.................... 14,658,350.56 Federal Express, Newark, NJ ........ 24671.................... 23,995,043.81 Newark, NJ..................................... 24601.................... 3,266,492,711.56 Perth Amboy, NJ ............................ 24602.................... 12,684,176.92 Morristown, NJ User Fee Airport ... 24681.................... 174,054.95 JFK ................................................. 24701.................... 854,687,859.75 NYACC, Jamaica, NY .................... 24771.................... 1,131,360.74 DHL Airways, Jamaica, NY............ 24772.................... 7,419,749.96 Dworkin/Cosell Courier,
Jamaica, NY............................... 24775.................... 2,183.70 TNT Skypak (JFK).......................... 24778.................... 2,027,410.84
Total District ............................................................. 4,912,952,056.78 Philadelphia, Pennsylvania:
Philadelphia, PA............................. 11101.................... 243,678,951.63 Chester, PA.................................... 11102.................... 46,768,635.12 Wilmington, DE .............................. 11103.................... 7,650,213.02 Pittsburgh, PA ................................ 11104.................... 43,865,104.52 Wilkes-Barre/Scranton, PA ............ 11106.................... 11,744,434.86 Philadelphia, PA............................. 11107.................... 471.86 Philadelphia Int'l. Airport ................ 11108.................... 33,124,288.46 Harrisburg, PA................................ 11109.................... 24,024,101.06 Allentown, PA................................. 11119.................... 8,163,538.98 Atlantic City, NJ User Fee
Airport......................................... 11182.................... 139,869.18 Trenton/Mercer User Fee Airport ... 11183.................... 151,799.29 UPS (Philadelphia, PA).................. 11195.................... 36,485,651.30
Total District .............................................................. 455,797,059.28 Baltimore, Maryland:
Baltimore, MD ................................ 11303.................... 522,774,090.73 BWI Airport ..................................... 11305.................... 30,265,174.55
Total District .............................................................. 553,039,265.28

FEDERAL FISCAL OPERATIONS
December 2009
21
TABLE FFO-6.—Customs and Border Protection Collection of Duties, Taxes, and Fees by Districts and Ports, con.
[Source: U. S. Customs and Border Protection]
District and Port of Collection
Port Code
Collection Fiscal Year
2009 District and Port of Collection
Port Code
Collection Fiscal Year
2009 Norfolk, Virginia:
Norfolk, VA ..................................... 41401.................... 590,786,669.57 Newport News, VA......................... 41402.................... 18,306,088.39 Norfolk Subport, VA ...................... 41403.................... 1,555.62 Richmond-Petersburg, VA ............. 41404.................... 17,214,032.60 Charleston, WV .............................. 41409.................... 9,617,929.70 Front Royal, VA.............................. 41410.................... 3,050.35 New River Valley Airport ................ 41412.................... 1,507,018.66
Total District ............................................................. 637,436,344.89 Charlotte, North Carolina:
Wilmington, NC .............................. 41501.................... 93,062,703.34 Winston Salem, NC........................ 41502.................... 21,419,446.76 Durham, NC ................................... 41503.................... 11,344,467.02 Beaufort-Morehead, NC................. 41511.................... 556,400.10 Charlotte, NC ................................. 41512.................... 143,994,648.47
Total District ............................................................. 270,377,665.69 Charleston, South Carolina:
Charleston, SC............................... 41601.................... 727,625,636.21 Georgetown, SC............................. 41602.................... 196,688.35 Greenville-Spartanburg, SC ............. 41603.................... 86,077,269.21 Columbia, SC ................................. 41604.................... 8,880,806.86 Myrtle Beach User Fee Airport....... 41681.................... 126,301.93
Total District ............................................................. 822,906,702.56 Savannah, Georgia:
Brunswick, GA................................ 41701.................... 93,876,217.60 Savannah, GA................................ 41703.................... 868,270,254.56 Atlanta, GA..................................... 41704.................... 452,655,156.57
Total District ............................................................. 1,414,801,628.73 Tampa, Florida:
Tampa, FL...................................... 41801.................... 62,271,828.80 Jacksonville, FL.............................. 41803.................... 230,174,562.39 Fernandina, FL............................... 41805.................... 139,938.30 Orlando, FL .................................... 41808.................... 13,796,365.01 Orlando/Sanford, FL ...................... 41809.................... 28,550.14 St. Petersburg, FL .......................... 41814.................... 46,889.33 Port Canaveral, FL ......................... 41816.................... 2,710,444.94 Panama City, FL ............................ 41818.................... 42,005,147.37 Pensacola, FL ................................ 41819.................... 20,436.01 Manatee, FL ................................... 41821.................... 10,946,873.57 Ft. Myers, FL .................................. 41822.................... 171,944.87 Sarasota, FL User Fee Airport ....... 41883.................... 165,389.12 Daytona Beach, FL User Fee
Airport........................................ 41884.................... 339,622.98 Melbourne, FL User Fee Airport .... 41885.................... 201,110.11 Leesburg Regional User Fee
Airport ........................................ 41887.................... 132,571.40 Orlando Executive Airport .............. 41888.................... 140,287.69 St. Augustine, User Fee Airport ..... 41889.................... 89,095.32
Total District ............................................................. 363,381,057.35
Mobile, Alabama:
Mobile, AL ...................................... 51901.................... 50,215,300.09 Gulfport, MS ................................... 51902.................... 17,915,156.68 Pascagoula, MS............................. 51903.................... 1,930,419.55 Birmingham, AL.............................. 51904.................... 36,716,478.36 Huntsville, AL ................................. 51910.................... 53,337,742.68
Total District ............................................................. 160,115,097.36 New Orleans, Louisiana:
Morgan City, LA ............................. 52001.................... 7,736,785.27 New Orleans, LA ............................ 52002.................... 187,016,819.22 Little Rock, AR ............................... 52003.................... 3,688,573.55 Baton Rouge, LA............................ 52004.................... 18,944,305.06 Memphis, TN.................................. 52006.................... 460,725,364.25 Nashville, TN.................................. 52007.................... 53,277,152.09 Chattanooga, TN............................ 52008.................... 284,636.75 Gramercy, LA ................................. 52010.................... 17,620,669.64 Vicksburg, MS ................................ 52015.................... 2,832,904.77 Knoxville, TN .................................. 52016.................... 31,251,371.26 Lake Charles, LA............................ 52017.................... 6,816,041.30 Shrevesport/Bossler, LA ................ 52018.................... 71,619.18 Port of Tri-Cities Blountville, TN .... 52027.................... 2,544,516.68 Tri City User Fee Airport ................ 52082.................... 9,972.56 Rogers User Fee Airport ................ 52084.................... 133,928.76 Federal Express (Memphis, TN).... 52095.................... 155,153,024.68
Total District ............................................................. 948,107,685.02 Port Arthur, Texas:
Port Arthur, TX ............................... 62101.................... 22,193,555.98 Beaumont, TX ................................ 62104.................... 11,482,568.96 Yuma, AZ ....................................... 62150.................... 19,366.12
Total District ............................................................. 33,695,491.06 Laredo, Texas:
Brownsville, TX .............................. 62301.................... 45,345,291.05 Del Rio, TX..................................... 62302.................... 2,016,328.45 Eagle Pass, TX .............................. 62303.................... 70,856,186.03 Laredo, TX ..................................... 62304.................... 257,230,091.22 Hidalgo, TX .................................... 62305.................... 46,576,748.24 Rio Grande City, TX....................... 62307.................... 444,475.88 Progresso, TX ................................ 62309.................... 1,127,242.48 Roma, TX ....................................... 62310.................... 889,652.65 Border Patrol HQ Del Rio, TX........ 62350.................... 2,333.01 Comstock,TX BP............................ 62351.................... 400.00 Carrizo Springs, TX BP.................. 62352.................... 17,099.83 Del Rio, TX BP ............................... 62353.................... 8,269.00 Eagle Pass, TX BP......................... 62354.................... 10,805.00 Brackettville, TX BP ....................... 62355.................... 3,177.00 Uvalde, TX BP................................ 62356.................... 4,800.00 Abilene Border Patrol, TX ............. 62360.................... 100.00 Valley International User Fee
Airport......................................... 62383.................... 152,640.20 Total District ......................................................... 424,685,640.04

FEDERAL FISCAL OPERATION
December 2009
22
TABLE FFO-6.—Customs and Border Protection Collection of Duties, Taxes, and Fees by Districts and Ports, con.
[Source: U. S. Customs and Border Protection]
District and Port of Collection
Port Code
Collection Fiscal Year
2009 District and Port of Collection
Port Code
Collection Fiscal Year
2009 El Paso, Texas:
El Paso, TX .................................... 62402.................... 139,577,690.51 Presidio, TX.................................... 62403.................... 558,898.13 Fabens, TX..................................... 62404.................... 43,333.08 Columbus, TX ................................ 62406.................... 277,003.90 Albuquerque, NM ........................... 62407.................... 714,223.64 Santa Teresa, NM.......................... 62408.................... 2,720,528.49
Total District ............................................................. 143,891,677.75 San Diego, California:
San Diego, CA ............................... 72501.................... 116,842,968.69 Andrade, CA................................... 72502.................... 345,315.70 Calexico, CA .................................. 72503.................... 1,288,023.39 San Ysidro, CA............................... 72504.................... 3,811,891.24 Tecate, CA ..................................... 72505.................... 19,179,999.03 Otay Mesa, CA............................... 72506.................... 65,535,917.77 Calexico East, CA .......................... 72507.................... 17,530,138.04 McClellan -Palomar Airport ........... 72581.................... 505,250.34
Total District ............................................................. 225,039,504.20 Nogales, Arizona:
Douglas, AZ ................................... 62601.................... 1,464,261.55 Lukeville, AZ................................... 62602.................... 187,093.61 Naco, AZ ........................................ 62603.................... 89,065.80 Nogales, AZ ................................... 62604.................... 50,701,546.63 Phoenix, AZ.................................... 62605.................... 22,988,477.41 Sasabe, AZ .................................... 62606.................... 20,614.00 San Luis, AZ................................... 62608.................... 2,781,183.23 Tucson, AZ..................................... 62609.................... 1,561,263.96 Border Patrol HQ Tucson, AZ........ 62650.................... 55,463.12 Nogales, AZ Border Patrol ............. 62653.................... 330.48 Douglas, AZ Border Patrol ............. 62655.................... 3.47 Scottsdale User Fee Airport........... 62681.................... 130,028.46 Williams Gateway User Fee
Airport......................................... 62682.................... 156,119.01 Total District ......................................................... 80,135,450.73
Los Angeles, California:
Los Angeles, CA ............................ 72704.................... 6,993,185,342.33 Port San Luis Harbor, CA ............. 72707.................... 218.60 Long Beach, CA............................. 72709.................... 38,875.03 Port Hueneme, CA......................... 72713.................... 6,304,139.18 LAX................................................. 72720.................... 422,398,989.28 Las Vegas, NV ............................... 72722.................... 35,990,665.05 DHL (LAX)...................................... 72770.................... 38,439.02 Virgin Atlantic Cargo (LAX) ............ 72774.................... 750.75 TNT Express Worldwide ................ 72775.................... 170,384.25 Int'l Bonded Couriers...................... 72776.................... 83,725.32 Micom, Ingelwood, CA ................... 72777.................... 252,710.52 Palm Springs User Fee Airport ...... 72781.................... 163,803.24 San Bernardino U.F. Airport, CA ... 72782.................... 409,322.15
Los Angeles, California, con.:
So. California Logistics Airport, CA.... 72783.................... 1,719,634.71 Santa Marie Airport, CA ................. 72784.................... 113,261.68 March Inland, Riverside, CA .......... 72785.................... 157,682.62 Meadows Field Airport ................... 72786.................... 906,845.05 DHL HUB Los Angeles, CA ........... 72791.................... 7,310,421.58 DHL Hub Riverside, CA ................. 72792.................... 343,814.02 UPS Ontario ................................... 72795.................... 13,133,122.21
Total District ............................................................. 7,482,722,146.59 San Francisco, California:
San Francisco Int'l Airport .............. 72801.................... 102,878,457.54 Eureka, CA..................................... 72802.................... 3,887.00 Fresno, CA ..................................... 72803.................... 401,401.30 San Francisco, CA ......................... 72809.................... 912,542,186.77 Oakland, CA................................... 72811.................... 18,987.69 Sacramento, CA............................. 72816.................... 158,171.59 Reno, NV........................................ 72833.................... 2,030,202.36 San Jose, CA ................................. 72834.................... 256,162.56 Sacramento Int'l Airport, CA .......... 72835.................... 27,953.49 DHL (SFO) ..................................... 72870.................... 1,437,389.04 Fresno Yosemite User Fee
Airport......................................... 72882.................... 1,328,877.94 Federal Express (SFO) .................. 72895.................... 18,904,671.71
Total District ............................................................. 1,039,988,348.99 Great Falls, Montana:
Raymond, MT................................. 33301.................... 209,100.09 Eastport, ID .................................... 33302.................... 7,833,374.56 Salt Lake City, UT .......................... 33303.................... 38,447,023.42 Great Falls, MT .............................. 33304.................... 851,452.41 Turner, MT ..................................... 33306.................... 26,554.95 Denver, CO .................................... 33307.................... 75,685,515.32 Porthill, ID....................................... 33308.................... 1,944,645.65 Scoby, MT ...................................... 33309.................... 3,114.02 Sweetgrass, MT ............................. 33310.................... 12,103,224.34 Whitetail, MT .................................. 33312.................... 307.00 Piegan, MT..................................... 33316.................... 63,344.86 Ophiem, MT ................................... 33317.................... 1,750.60 Roosville, MT ................................. 33318.................... 78,679.28 Morgan, MT.................................... 33319.................... 116,257.41 Whitlash, MT .................................. 33321.................... 1,419.40 Del Bonita, MT ............................... 33322.................... 8,343.20 Wildhorse, MT ................................ 33323.................... 99,025.01 Willow Creek, MT ........................... 33325.................... 977.25 Jefferson County Airport ................ 33383.................... 141,810.45 Arapahoe County Airport ............... 33384.................... 161,435.58 Eagle County User Fee Airport ...... 33385.................... 140,014.80
Total District ............................................................. 137,917,369.60

FEDERAL FISCAL OPERATIONS
December 2009
23
TABLE FFO-6.—Customs and Border Protection Collection of Duties, Taxes, and Fees by Districts and Ports
[Source: U. S. Customs and Border Protection]
District and Port of Collection
Port Code
Collection Fiscal Year
2009 District and Port of Collection
Port Code
Collection Fiscal Year
2009 Pembina, North Dakota:
Pembina, ND.................................. 33401.................... 16,234,848.77 Portal, ND....................................... 33403.................... 5,199,026.41 Neche, ND...................................... 33404.................... 19,752.48 St John, ND.................................... 33405.................... 3,192.60 Northgate, ND ................................ 33406.................... 21,589.85 Walhalla, ND .................................. 33407.................... 28,529.05 Hannah, ND ................................... 33408.................... 154.25 Sarles, ND...................................... 33409.................... 1,640.31 Ambrose, ND.................................. 33410.................... 367.00 Antler, ND....................................... 33413.................... 2,945.34 Sherwood, ND................................ 33414.................... 737,114.50 Hansboro, ND ................................ 33415.................... 4,406.42 Maida, ND ...................................... 33416.................... 1,884.00 Fortuna, ND.................................... 33417.................... 6,956.20 Westhope, ND................................ 33419.................... 9,594.06 Noonan, ND ................................... 33420.................... 9,215.45 Carbury, ND ................................... 33421.................... 4,891.61 Dunseith, ND.................................. 33422.................... 499,536.00 Warroad, MN.................................. 33423.................... 75,793.54 Baudette, MN ................................. 33424.................... 65,790.73 Pinecreek, MN................................ 33425.................... 997.85 Roseau, MN ................................... 33426.................... 120,781.08 Grand Forks Airport, ND ................ 33427.................... 3,953.84 Lancaster, MN................................ 33430.................... 30,433.75 Minot Airport, ND............................ 33434.................... 90.00 Hector User Fee Airport ................. 33481.................... 20,277.17
Total District ............................................................. 23,103,762.26 Minneapolis, Minnesota:
Minneapolis, MN ............................ 33501.................... 132,812,752.94 Sioux Falls, SD............................... 33502.................... 59,543.46 Duluth, MN ..................................... 33510.................... 2,197,043.60 Omaha, NE ................................... 33512.................... 29,241,550.31 Des Moines, IA............................... 33513.................... 1,492,236.46 Rochester User Fee Airport ........... 33581.................... 143,629.01
Total District ............................................................. 165,946,755.78 Duluth, Minnesota:
Duluth, MN ..................................... 33601.................... 470.10 Int’l Falls/Ranier, MN...................... 33604.................... 4,378,455.45 Grand Portage, MN........................ 33613.................... 1,814,328.75
Total District ............................................................. 6,193,254.30 Milwaukee, Wisconsin:
Milwaukee, WI................................ 33701.................... 25,363,711.93 Green Bay, WI................................ 33703.................... 216,959.40 Racine, WI...................................... 33708.................... 215,868.25
Total District ............................................................. 25,796,539.58 Portland, Oregon:
Astoria, OR..................................... 72901.................... 516,229.38 Newport, OR .................................. 72902.................... 38.00 Coos Bay, OR ................................ 72903.................... 63,254.35 Portland, OR .................................. 72904.................... 305,489,331.83 Longview, WA ................................ 72905.................... 12,973,278.11 Boise, ID......................................... 72907.................... 283,044.40
Portland, Oregon, con.:
Vancouver, WA .............................. 72908.................... 1,208.87 Kalama, WA ................................... 72909.................... 1,236.70 Portland Int'l Airport........................ 72910.................... 938.97 Hillsboro Airport.............................. 72983.................... 288,404.23
Total District ............................................................. 319,616,955.84 Detroit, Michigan:
Detroit, MI....................................... 33801.................... 326,433,001.86 Port Huron, MI................................ 33802.................... 65,384,305.08 Sault St. Marie, MI.......................... 33803.................... 2,039,796.74 Saginaw/Bay City/Flint, MI ............. 33804.................... 81,584.52 Battle Creek, MI ............................. 33805.................... 7,657,693.46 Grand Rapids, MI ........................... 33806.................... 11,479,721.41 Detroit Airport, MI ........................... 33807.................... 37,523,993.06 Algonac, MI .................................... 33814.................... 8,257.97 Oakland County User Fee Airport ..... 33881.................... 298,367.20 Willow Run User Fee Airport.......... 33882.................... 371,973.86 Capital City Airport UFA
Lansing, MI................................. 33883.................... 357,563.60 Total District ......................................................... 451,636,258.76
Chicago, Illinois:
Chicago, IL ..................................... 33901.................... 1,353,807,789.35 Peoria, IL ........................................ 33902.................... 17,803,428.91 Omaha, NE .................................... 33903.................... 90,600.99 Gary, IN .......................................... 33905.................... 335.00 Davenport/Rock Island/Moline, IL .... 33908.................... 12,657,254.14 Rockford Airport, IL ........................ 33909.................... 26,880,773.98 Midway Int'l Airport ......................... 33910.................... 111,277.17 Waukegan User Fee Airport .......... 33981.................... 144,756.93 Pal-waukee User Fee Airport......... 33983.................... 161,024.56 Dupage User Fee Airport ............... 33984.................... 140,010.70 Decatur User Fee Airport ............... 33985.................... 128,894.03
Total District ............................................................. 1,411,926,145.76 Cleveland, Ohio:
Cleveland, OH................................ 34101.................... 121,072,784.32 Cincinnati, OH /Lawrenceburg, IN ... 34102.................... 98,758,408.25 Columbus, OH................................ 34103.................... 516,744,157.78 Dayton, OH .................................... 34104.................... 1,865,978.23 Toledo/Sandusky, OH.................... 34105.................... 4,253,001.31 Erie, PA .......................................... 34106.................... 271,703.34 Indianapolis, IN .............................. 34110.................... 96,976,125.96 Louisville, KY.................................. 34115.................... 231,185,381.95 Owensboro, KY .............................. 34116.................... 4,698,979.16 Ashtabula/Conneaut, OH ............... 34122.................... 287,488.54 Airbourne Airpark User Fee Airport ... 34181.................... 99,059.00 Ft Wayne User Fee Airport ............ 34183.................... 163,988.02 Bluegrass User Fee Airport............ 34184.................... 468,639.58 Airbourne Express.......................... 34191.................... 195.22 BAX Global Emery Worldwide ....... 34192.................... 4,359,917.62 DHL Express .................................. 34194.................... 29,067,123.22 Emery Courier ................................ 34195.................... 23,732.44 UPS ................................................ 34196.................... 159,520,420.55 DHL (Cincinnati)............................. 34197.................... 5,369,752.03 Federal Express (Indianapolis) ...... 34198.................... 16,562,686.14
Total District ............................................................. 1,291,749,522.66

FEDERAL FISCAL OPERATION
December 2009
24
TABLE FFO-6.—Customs and Border Protection Collection of Duties, Taxes, and Fees by Districts and Ports
[Source: U. S. Customs and Border Protection]
District and Port of Collection
Port Code
Collection Fiscal Year
2008 District and Port of Collection
Port Code
Collection Fiscal Year
2008 St. Louis, Missouri:
Kansas City, MO ............................ 34501.................... 123,677,893.56 St. Louis, MO ................................. 34503.................... 115,357,500.52 Wichita, KS..................................... 34504.................... 33,524,939.51 Springfield, MO .............................. 34505.................... 2,794,700.09 Spirit of St. Louis Airport, MO ........ 34506.................... 618.35 MidAmerica Airport......................... 34581.................... 391,515.65
Total District ............................................................. 275,747,167.68 Preclearance-Canada:
Vancouver, Canada Preclearance .... 37922.................... 706,382.01 Calgary, Canada Preclearance...... 37923.................... 1,092,481.93 Edmondton, Canada Preclearance... 37924.................... 504,823.45 Montreal, Canada Preclearance .... 37925.................... 655,106.13 Toronto, Canada Preclearance...... 37926.................... 2,544,679.16 Winnipeg, Canada Preclearance ... 37928.................... 233,191.00 Ottawa, Canada Preclearance....... 37929.................... 204,993.47 Victoria, Canada Preclearance ...... 37930.................... 39,925.00 Halifax, Canada Preclearance ....... 37931.................... 95,220.00
Total District ............................................................. 6,076,802.15 San Juan, Puerto Rico:
Aguadilla, PR ................................. 44901.................... 383,106.42 Fajardo, PR .................................... 44904.................... 1,538,450.29 Mayaguez, PR................................ 44907.................... 1,063,421.57 Ponce, PR ...................................... 44908.................... 10,343,687.15 San Juan, PR ................................. 44909.................... 94,798,920.86 Old San Juan Int'l Airport ............... 44913.................... 8,326,573.37
Total District ............................................................. 116,454,159.66 Virgin Islands of the United States:
Charlotte Amalie, VI ....................... 45101.................... 8,395,018.11 Cruz Bay, VI ................................... 45102.................... 247,825.49 Christiansted, VI............................. 45104.................... 6,374,272.03 St. Thomas, VI ............................... 45107.................... 265.33
Total District ............................................................. 15,017,380.96 Miami, Florida:
Miami, FL........................................ 45201.................... 344,964,959.08 Key West, FL.................................. 45202.................... 70,279.16 Port Everglades, FL ....................... 45203.................... 112,908,503.05 West Palm Beach, FL .................... 45204.................... 6,381,888.19 Fort Pierce, FL ............................... 45205.................... 89,048.85 Miami Int'l Airport ........................... 45206.................... 74,313,805.57 Fort Lauderdale Int'l ....................... 45210.................... 239,303.59 Miami Int'l Courier Association....... 45270.................... 230.64 DHL Worldwide Express ................ 45271.................... 1,122,439.03 MIA/CFS ECCF.............................. 45272.................... 1,646.68 UPS (Miami Int'l Airport)................. 45273.................... 7,604.66 UPS Courier Hub ........................... 45295.................... 94,978.71 FED EX Courier Hub...................... 45297.................... 956,048.43 IBC Courier Hub............................. 45298.................... 171,971.94 Miami Seaport ................................ 45299.................... 2,391,824.24
Total District ............................................................. 543,714,531.82
Washington, DC:
Dulles Int'l Airport ........................... 45401.................... 23,039,560.70 Total District ............................................................. 23,039,560.70
Bahamas Preclearance:
Southeast Region Miami, FL.......... 47400.................... -50.00 Preclearance-Christiansted, VI ...... 47401.................... 435,085.49 Preclearance-St. Croix, VI ............. 47404.................... 3,978.21 Kindley Field, Bermuda.................. 47421.................... 12,553.95 Freeport, Bahamas ........................ 47422.................... 10,506.00 Nassau, Bahamas.......................... 47423.................... 90,735.26 Aruba.............................................. 47424.................... 33,747.62
Total District ............................................................. 586,556.53 Ireland Preclearance:
Dublin, IE Preclearance ................. 57541.................... 12,290.00 Shannon, IE Preclearance ............. 57542.................... 1,370.00
Total District ............................................................. 13,660.00 Houston, Texas:
Houston, TX ................................... 65301.................... 673,400,649.09 Houston Intercontinental ................ 65309.................... 42,694,008.57 Galveston, TX ................................ 65310.................... 11,290,289.14 Freeport, TX ................................... 65311.................... 19,384,791.46 Corpus Christi, TX.......................... 65312.................... 21,782,525.39 Port Lavaca, TX ............................. 65313.................... 519,214.44 Sugarland User Fee Airport ........... 65381.................... 135,658.32
Total District ............................................................. 769,207,136.41 Dallas-Ft. Worth, Texas:
Dalllas/Ft Worth, TX....................... 65501.................... 392,636,451.04 Amarillo, TX.................................... 65502.................... 4,282.96 Lubbock, TX ................................... 65503.................... 5,861.98 Oklahoma City, TX......................... 65504.................... 4,615,305.94 Tulsa, OK ....................................... 65505.................... 3,035,600.04 Austin, TX....................................... 65506.................... 2,897,566.44 San Antonio, TX ............................. 65507.................... 10,816,276.29 Lubbock, TX ................................... 65551.................... 1,718.00 Amarillo, TX.................................... 65552.................... 500.00 Presidio, TX.................................... 65553.................... 750.00 Marfa, TX BC ................................. 65554.................... 2,823.75 Sanderson, TX ............................... 65557.................... 3,657.50 Alpine, TX....................................... 65558.................... 6,242.50 Sierra Blanca, TX BC..................... 65560.................... 21,366.75 Van Horn, TX ................................. 65561.................... 1,330.00 Midland User Fee Airport ............... 65562.................... 14,960.50 Midland User Fee Airport User
Fee ............................................. 65582.................... 133,759.54 Fort Worth Alliance User Fee
Airport......................................... 65583.................... 132,462.62 Addison User Fee Airport............... 65584.................... 155,184.48 McKinney User Fee Airport............ 65585.................... 127,356.37
Total District ............................................................. 414,613,456.70

FEDERAL FISCAL OPERATIONS
December 2009
25
TABLE FFO-6.—Customs and Border Protection Collection of Duties, Taxes, and Fees by Districts and Ports
[Source: U. S. Customs and Border Protection]
District and Port of Collection
Port Code
Collection Fiscal Year
2008 District and Port of Collection
Port Code
Collection Fiscal Year
2008 Seattle, Washington:
Seattle, WA .................................... 73001.................... 610,485,452.45 Tacoma, WA .................................. 73002.................... 443,699,415.17 Aberdeen, WA................................ 73003.................... 1,489,068.94 Blaine, WA ..................................... 73004.................... 25,810,043.86 Bellingham, WA.............................. 73005.................... 1,794,893.16 Everett, WA .................................... 73006.................... 2,564,587.25 Port Angeles, WA........................... 73007.................... 92,991.93 Port Townsend, WA ....................... 73008.................... 16,110.44 Sumas, WA .................................... 73009.................... 3,223,499.62 Anacortes, WA ............................... 73010.................... 654,793.87 Nighthawk, WA............................... 73011.................... 314.25 Danville, WA................................... 73012.................... 5,991.00 Ferry, WA ....................................... 73013.................... 1,280.25 Friday Harbor, WA ......................... 73014.................... 76,002.05 Boundary, WA ................................ 73015.................... 15,016.21 Laurier, WA .................................... 73016.................... 11,575.92 Point Roberts, WA.......................... 73017.................... 181,726.87 Oroville, WA ................................... 73019.................... 1,403,870.34 Frontier, WA ................................... 73020.................... 22,833.39 Spokane, WA ................................. 73022.................... 160,275.90 Lynden, WA.................................... 73023.................... 248,183.55 Metaline Falls, WA ......................... 73025.................... 14,517.51 Olympia, WA .................................. 73026.................... 22,011.52 Seattle-Tacoma Airport .................. 73029.................... 32,238,719.93 UPS (SEATAC) .............................. 73071.................... 1,430,423.11 Moses Lake Grant County User
Fee Airport ................................. 73082.................... 177,635.26 Border Patrol Spokane, WA........... 75750.................... 53.71
Total District ............................................................. 1,125,841,287.46
Anchorage, Alaska:
Juneau, AK..................................... 73101.................... 99,499.59 Ketchikan, AK................................. 73102.................... 143,802.46 Skagway, AK.................................. 73103.................... 52,370.69 Alcan, AK........................................ 73104.................... 515,459.57 Wrangell, AK .................................. 73105.................... 6,365.30 Dalton Cache, AK........................... 73106.................... 18,113.52 Valdez, AK ..................................... 73107.................... 11,764.68 Fairbanks, AK................................. 73111.................... 19,311.89 Sitka, AK......................................... 73115.................... 5,835.23 Anchorage, AK ............................... 73126.................... 7,622,059.64 Kodiak, AK ..................................... 73127.................... 146.92 Federal Express ............................. 73195.................... 92,470,969.94 UPS ................................................ 73196.................... 327,651.53
Total District ............................................................. 101,293,350.96 Honolulu, Hawaii:
Honolulu, HI ................................... 73201.................... 27,470,015.46 Hilo, HI............................................ 73202.................... 76,044.83 Kahului, HI...................................... 73203.................... 78,128.39 Nawiliwili-Port Allen, HI .................. 73204.................... 2,124.50 Honolulu Int'l Airport....................... 73205.................... 5,974,821.35 Kailua-Kona, HI .............................. 73206.................... 198,452.44
Total District ............................................................. 33,799,595.97 Total Customs and Border Protection Collections
for fiscal year 2009..................................................... $29,661,063,141.51

December 2009
26
INTRODUCTION: Source and Availability of the Balance in the Account of the U.S. Treasury
The Department of the Treasury’s (Treasury’s) operating cash is maintained in accounts with the Federal Reserve banks (FRBs) and branches, as well as in tax and loan accounts in other financial institutions. Major information sources include FRBs, Treasury Regional Financial Centers, Internal Revenue Service Centers, Bureau of the Public Debt, and various electronic systems. As the FRB accounts are depleted, funds are called in (withdrawn) from thousands of tax and loan accounts at financial institutions throughout the country.
Under authority of Public Law 95-147 (codified at 31 United States Code 323), Treasury implemented a program on November 2, 1978, to invest a portion of its operating cash in obligations of depositaries maintaining tax and loan accounts. Under the Treasury tax and loan (TT&L) investment program, depositary financial institutions select the manner in which they will participate. Financial institutions wishing to retain funds deposited into their tax
and loan accounts in interest-bearing obligations can participate. The program permits Treasury to collect funds through financial institutions and to leave the funds in TT&L depositaries and in the financial communities in which they arise until Treasury needs the funds for its operations. In this way, Treasury is able to neutralize the effect of its fluctuating operations on TT&L financial institution reserves and on the economy. Likewise, those institutions wishing to remit the funds to the Treasury account at FRBs do so as collector depositaries.
Deposits to tax and loan accounts occur as customers of financial institutions deposit tax payments that the financial institutions use to purchase Government securities. In most cases, this involves a transfer of funds from a customer’s account to the tax and loan account in the same financial institution. Also, Treasury can direct the FRBs to invest excess funds in tax and loan accounts directly from the Treasury account at the FRBs.
TABLE UST-1.—Elements of Change in Federal Reserve and Tax and Loan Note Account Balances 1
[In millions of dollars. Source: Financial Management Service]
Credits and withdrawals Federal Reserve accounts Credits 2 Tax and loan note accounts
Fiscal year or month Received directly
(1)
Received through remittance option tax and loan depositaries
(2) Withdrawals 3
(3) Taxes 4
(4)
Withdrawals (transfers to Federal Reserve accounts)
(5)
2005 ................................................ 7,485,532 468,563 7,955,702 1,339,363 1,338,425 2006 ................................................ 7,839,784 501,945 8,340,659 1,478,945 1,463,568 2007 ................................................ 8,455,356 528,724 8,983,992 1,571,322 1,548,300 2008 ................................................ 9,947,954 530,425 10,151,438 1,602,823 1,633,393 2009 ................................................ 11,577,153 482,146 12,118,510 1,398,542 1,435,675
2008 - Sept...................................... 1,248,995 48,868 970,065 152,727 115,790
Oct....................................... 1,513,643 40,509 1,283,783 108,703 135,722 Nov ...................................... 801,868 35,649 939,874 101,651 111,797 Dec ...................................... 799,185 55,150 989,379 161,413 162,177
2009 - Jan ....................................... 912,889 40,310 1,124,877 120,405 119,623 Feb ...................................... 828,709 34,888 833,021 108,724 108,729 Mar ...................................... 1,010,666 41,716 1,009,644 133,781 134,015 Apr....................................... 1,053,394 44,467 1,028,822 125,868 125,604 May...................................... 830,049 33,823 984,841 95,184 95,201 June..................................... 1,071,115 41,660 1,012,006 130,518 130,566 July ...................................... 1,038,765 37,981 1,099,764 99,192 99,156 Aug ...................................... 910,038 33,639 943,317 94,114 94,138 Sept ..................................... 808,315 42,353 870,664 118,991 118,946
See footnotes at end of table.

ACCOUNT OF THE U.S. TREASURY
December 2009
27
TABLE UST-1.—Elements of Change in Federal Reserve and Tax and Loan Note Account Balances, con. 1
[In millions of dollars. Source: Financial Management Service]
Balances During period End of period High Low Average
Fiscal year or month
Federal Reserve
(6)
Tax and loan note
accounts (7)
Federal Reserve
(8)
Tax and loan note
accounts (9)
Federal Reserve
(10)
Tax and loan note
accounts (11)
Federal Reserve
(12)
Tax and loan note
accounts (13)
2005 ...................................... 4,381 31,300 9,849 78,251 3,159 30 5,025 19,819
2006 ...................................... 5,451 46,676 7,507 93,784 2,637 78 5,019 20,614
2007 ...................................... 5,539 69,698 29,504 98,264 3,239 75 5,216 23,961
2008 ...................................... 32,988 39,129 32,988 135,752 2,973 - 5,181 17,751
2009 ...................................... 108,324 1,996 136,672 79,897 3,987 284 52,381 4,161
2008 - Sept............................ 32,988 39,129 32,988 39,129 3,899 1,177 5,757 16,359
Oct............................. 43,998 12,109 136,672 79,897 3,987 8,172 33,898 24,884
Nov ............................ 66,385 1,964 91,193 12,109 17,355 1,722 55,834 5,209
Dec ............................ 106,123 1,199 132,738 2,181 41,646 1,199 90,197 1,912
2009 - Jan ............................. 23,548 1,981 106,123 2,043 23,548 1,199 46,983 1,927
Feb ............................ 23,502 1,976 75,506 2,124 20,266 1,756 36,532 1,960
Mar ............................ 67,151 1,742 114,510 2,114 23,502 1,206 62,945 1,917
Apr............................. 136,194 2,005 136,194 2,027 23,684 1,830 59,078 1,973
May............................ 15,222 1,988 84,855 2,076 11,048 1,746 51,840 1,961
June........................... 115,984 1,940 132,837 2,140 7,384 1,691 64,483 1,965
July ............................ 92,971 1,976 92,971 2,016 17,168 1,862 50,429 1,959
Aug ............................ 93,333 1,951 93,333 2,021 8,802 1,915 39,934 1,978
Sept ........................... 108,324 1,996 108,324 2,168 4,500 284 35,050 1,894 1 This report does not include Supplementary Financing Program balances. 2 Represents transfers from tax and loan note accounts, proceeds from sales of securities other than Government account series, and taxes. 3 Represents checks paid, wire transfer payments, drawdowns on letters of credit, redemptions of securities other than Government account series, and investment (transfer) of excess funds out of this account to the tax and loan note accounts.
4 Taxes eligible for credit consist of those deposited by taxpayers in the tax and loan depositaries as follows: withheld income taxes beginning March 1948; taxes on employers and employees under the Federal Insurance Contributions Act beginning January 1950 and under the Railroad Retirement Tax Act beginning July 1951; a number of excise taxes beginning July 1953; estimated corporation income taxes beginning April 1967; all corporation income taxes due on or after March 15, 1968; Federal Unemployment Tax Act taxes beginning April 1970; and individual estimated income taxes beginning October 1988.

December 2009
28
INTRODUCTION: Federal Debt Treasury securities (i.e., public debt securities) comprise
most of the Federal debt, with securities issued by other Federal agencies accounting for the rest. Tables in this section of the “Treasury Bulletin” reflect the total. Further detailed information is published in the “Monthly Statement of the Public Debt of the United States.” Likewise, information on agency securities and on investments of Federal Government accounts in Federal securities is published in the “Monthly Treasury Statement of Receipts and Outlays of the United States Government.”
Treasury’s Financial Management Service (FMS) compiles data in the “Treasury Bulletin” tables FD-2 and FD-6 from the “Monthly Statement of the Public Debt of the United States.”
• Table FD-1 summarizes the Federal debt by listing public debt and agency securities held by the public, including the Federal Reserve. It also includes debt held by Federal agencies, largely by the Social Security and other Federal retirement trust funds. The net unamortized premium and discount also are listed by total Federal securities, securities held by Government accounts and securities held by the public. The difference between the outstanding face value of the Federal debt and the net unamortized premium and discount is classified as the accrual amount. (For greater detail on holdings of Federal securities by particular classes of investors, see the ownership tables, OFS-1 and OFS-2.)
• Table FD-2 categorizes by type, that is, marketable and nonmarketable, the total public debt securities outstanding that are held by the public.
• In table FD-3, nonmarketable Treasury securities held by U.S. Government accounts are summarized by issues to particular funds within Government. Many of the funds invest in par value special series nonmarketables at interest rates determined by law. Others invest in market-based special Treasury securities whose terms mirror those of marketable securities.
• Table FD-4 presents interest-bearing securities issued by Government agencies. Federal agency borrowing
has declined in recent years, in part because the Federal Financing Bank has provided financing to other Federal agencies. (Federal agency borrowing from Treasury is presented in the “Monthly Treasury Statement of Receipts and Outlays of the United States Government.”)
• Table FD-5 illustrates the average length of marketable interest-bearing public debt held by private investors and the maturity distribution of that debt.
In March 1971, Congress enacted a limited exception to the amount of bonds with rates greater than 4-1/4 percent that could be held by the public. This permitted Treasury to offer securities maturing in more than 7 years at current market interest rates for the first time since 1965. In March 1976, the definition of a bond was changed to include those securities longer than 10 years to maturity. This exception has expanded since 1971, authorizing Treasury to continue to issue long-term securities. The ceiling on Treasury bonds was repealed on November 10, 1988.
The volume of privately held Treasury marketable securities by maturity class reflects the remaining period to maturity of Treasury bills, notes and bonds. The average length is comprised of an average of remaining periods to maturity, weighted by the amount of each security held by private investors. In other words, computations of average length exclude Government accounts and the FRBs.
• In table FD-6, the debt ceiling is compared with the outstanding debt subject to limitation by law. The other debt category includes Federal debt Congress has designated as being subject to the debt ceiling.
• Table FD-7 details Treasury holdings of securities issued by Government corporations and other agencies. Certain Federal agencies are authorized to borrow money from the Treasury, largely to finance direct loan programs. In addition, agencies such as the Bonneville Power Administration are authorized to borrow from the Treasury to finance capital projects. Treasury, in turn, finances these loans by selling Treasury securities to the public.

FEDERAL DEBT
December 2009
29
TABLE FD-1.—Summary of Federal Debt
[In millions of dollars. Source: “Monthly Treasury Statement of Receipts and Outlays of the United States Government”]
Securities held by Amount outstanding Government accounts The public
End of fiscal year or month
Total (1)
Public debt securities
(2)
Agency securities
(3) Total (4)
Public debt securities
(5)
Agency securities
(6) Total (7)
Public debt securities
(8)
Agency securities
(9) 2005............................... 7,956,346 7,932,710 23,637 3,331,333 3,331,332 1 4,625,013 4,601,378 23,636 2006............................... 8,530,366 8,506,974 23,392 3,663,773 3,663,766 7 4,866,593 4,843,208 23,385 2007............................... 9,030,612 9,007,653 22,959 3,958,417 3,958,411 6 5,072,195 5,049,242 22,953 2008............................... 10,047,828 10,024,725 23,104 4,210,491 4,210,485 6 5,837,337 5,814,240 23,098 2009............................... 11,933,031 11,909,828 23,203 4,355,292 4,355,291 1 7,577,739 7,554,537 23,202 2008 - Sept .................... 10,047,828 10,024,725 23,104 4,210,491 4,210,485 6 5,837,337 5,814,240 23,098
Oct ..................... 10,599,663 10,574,094 25,569 4,266,386 4,266,380 6 6,333,277 6,307,714 25,563 Nov..................... 10,684,427 10,661,175 23,252 4,260,586 4,260,581 6 6,423,841 6,400,594 23,246 Dec..................... 10,723,156 10,699,805 23,352 4,327,160 4,327,154 6 6,395,996 6,372,651 23,346
2009 - Jan...................... 10,655,167 10,632,080 23,087 4,311,381 4,311,375 6 6,343,786 6,320,705 23,081 Feb..................... 10,899,894 10,877,144 22,750 4,295,278 4,295,273 6 6,604,615 6,581,871 22,744 Mar..................... 11,149,495 11,126,941 22,554 4,290,609 4,290,603 6 6,858,886 6,836,338 22,548
Apr ..................... 11,261,000 11,238,592 22,409 4,305,333 4,305,326 6 6,955,667 6,933,266 22,403 May .................... 11,343,863 11,321,599 22,264 4,301,352 4,301,350 2 7,042,511 7,020,249 22,262 June ................... 11,567,551 11,545,275 22,276 4,368,813 4,368,811 2 7,198,738 7,176,464 22,274 July..................... 11,691,765 11,669,276 22,489 4,331,562 4,331,561 1 7,360,203 7,337,715 22,488 Aug..................... 11,835,208 11,812,870 22,338 4,326,507 4,326,506 1 7,508,701 7,486,364 22,337 Sept.................... 11,933,031 11,909,828 23,203 4,355,292 4,355,291 1 7,577,739 7,554,537 23,202
Federal debt securities Securities held by Government accounts Securities held by the public
End of fiscal year or month
Amount outstanding face value
(10)
Net unamortized
premium and discount
(11)
Accrual amount
(12)
Amount outstanding face value
(13)
Net unamortized
premium and discount
(14)
Accrual amount
(15)
Amount outstanding face value
(16)
Net unamortized
premium and discount
(17)
Accrual amount
(18)
2005 ............................... 7,956,346 53,546 7,902,800 3,331,333 18,145 3,313,188 4,625,013 35,401 4,589,612 2006 ............................... 8,530,366 81,375 8,448,991 3,663,773 41,370 3,622,403 4,866,593 40,005 4,826,588 2007 ............................... 9,030,612 82,078 8,948,534 3,958,417 42,796 3,915,621 5,072,195 39,282 5,032,913 2008 ............................... 10,047,828 64,135 9,983,694 4,210,491 27,432 4,183,059 5,837,337 36,703 5,800,635 2009 ............................... 11,933,031 59,219 11,873,812 4,355,292 25,467 4,329,825 7,577,739 33,752 7,543,987 2008 - Sept .................... 10,047,828 64,135 9,983,694 4,210,491 27,432 4,183,059 5,837,337 36,703 5,800,635
Oct...................... 10,599,663 66,851 10,532,813 4,266,386 28,713 4,237,672 6,333,277 38,138 6,295,140 Nov..................... 10,684,427 65,816 10,618,610 4,260,586 28,392 4,232,194 6,423,841 37,424 6,386,416 Dec..................... 10,723,156 62,737 10,660,419 4,327,160 28,271 4,298,889 6,395,996 34,466 6,361,529
2009 - Jan ...................... 10,655,167 59,228 10,595,939 4,311,381 28,158 4,283,222 6,343,786 31,070 6,312,717 Feb ..................... 10,899,894 59,063 10,840,831 4,295,278 27,859 4,267,420 6,604,616 31,204 6,573,411 Mar ..................... 11,149,495 59,682 11,089,813 4,290,609 27,741 4,262,868 6,858,886 31,941 6,826,945 Apr...................... 11,261,000 56,868 11,204,133 4,305,333 25,434 4,279,898 6,955,667 31,434 6,924,234 May .................... 11,343,863 56,993 11,286,870 4,301,352 25,766 4,275,585 7,042,511 31,227 7,011,284 June ................... 11,567,551 59,024 11,508,527 4,368,813 25,620 4,343,192 7,198,738 33,404 7,165,335 July..................... 11,691,765 59,573 11,632,192 4,331,562 25,542 4,306,020 7,360,203 34,031 7,326,172 Aug..................... 11,835,208 60,466 11,774,742 4,326,507 25,951 4,300,556 7,508,701 34,515 7,474,185 Sept.................... 11,933,031 59,219 11,873,812 4,355,292 25,467 4,329,825 7,577,739 33,752 7,543,987

FEDERAL DEBT
December 2009
30
Nonmarketable, con.
End of fiscal year or month
U.S. savings securities
(8)
Depositary compensation
securities (9)
Foreign series (10)
Government account series
(11)
State and local government series
(12)
Domestic series (13)
Other (14)
2005 ....................................... 203,645 - 3,086 67,961 225,283 29,995 5,214 2006 ....................................... 203,656 - 2,986 78,129 238,835 29,995 5,715 2007 ....................................... 197,126 - 2,986 88,153 296,513 29,995 6,126 2008 ....................................... 194,253 - 2,986 107,498 260,238 29,995 3,569 2009 ....................................... 192,452 - 4,886 118,636 216,488 29,995 1,466 2008 - Sept ............................ 194,253 - 2,986 107,498 260,238 29,995 3,569
Oct.............................. 194,236 - 3,986 112,814 254,564 29,995 3,058 Nov............................. 194,216 - 3,986 113,884 253,455 29,995 2,618 Dec............................. 194,075 - 3,986 115,117 249,318 29,995 2,637
2009 - Jan .............................. 193,810 - 4,986 115,508 244,800 29,995 2,037 Feb ............................. 194,057 - 4,986 117,375 241,929 29,995 1,846 Mar ............................. 193,975 - 5,986 119,543 240,096 29,995 1,594 Apr.............................. 193,998 - 6,986 119,871 238,195 29,995 1,628 May ............................ 193,871 - 6,486 119,353 235,523 29,995 1,540 June ........................... 193,592 - 5,986 119,112 232,965 29,995 1,522 July............................. 193,267 - 5,486 119,570 223,901 29,995 1,574 Aug............................. 192,822 - 4,486 118,945 218,336 29,995 1,556 Sept............................ 192,452 - 4,886 118,636 216,488 29,995 1,466
TABLE FD-2.—Debt Held by the Public
[In millions of dollars. Source: “Monthly Statement of the Public Debt of the United States”]
Marketable
End of fiscal year or month
Total public debt securities
outstanding (1)
Total (2)
Bills (3)
Notes (4)
Bonds (5)
Treasury inflation-protected
securities (6)
Non-marketable
Total (7)
2005 .................................. 4,601,239 4,066,053 910,323 2,328,213 520,507 307,011 535,186 2006 .................................. 4,843,121 4,283,804 908,474 2,445,307 534,473 395,550 559,317 2007 .................................. 5,049,306 4,428,405 954,607 2,456,100 560,922 456,776 620,900 2008 .................................. 5,808,692 5,210,151 1,484,332 2,623,364 578,504 523,951 598,540 2009 .................................. 7,551,862 6,987,937 1,986,173 3,772,964 677,491 551,308 563,924 2008 - Sept ....................... 5,808,692 5,210,151 1,484,332 2,623,364 578,504 523,951 598,540
Oct......................... 6,302,794 5,704,139 1,904,060 2,685,691 578,915 535,472 598,655 Nov........................ 6,396,591 5,798,435 1,998,226 2,673,928 591,492 534,789 598,156 Dec........................ 6,369,319 5,774,190 1,861,187 2,791,514 591,867 529,622 595,129
2009 - Jan ......................... 6,317,299 5,726,162 1,792,889 2,825,174 591,890 516,209 591,137 Feb ........................ 6,579,163 5,988,974 1,979,787 2,891,334 606,670 511,183 590,189 Mar ........................ 6,833,543 6,242,353 2,027,691 3,084,283 617,628 512,751 591,190
Apr......................... 6,930,825 6,340,151 1,988,380 3,204,051 618,353 529,367 590,674 May ....................... 7,019,322 6,432,553 2,059,387 3,210,872 631,734 530,561 586,768 June ...................... 7,174,912 6,591,740 2,000,458 3,417,319 642,050 531,913 583,173 July........................ 7,335,598 6,761,806 2,014,176 3,546,950 653,069 547,611 573,793 Aug........................ 7,484,145 6,918,004 2,062,265 3,638,049 665,744 551,947 566,141 Sept....................... 7,551,862 6,987,937 1,986,173 3,772,964 677,491 551,308 563,924

FEDERAL DEBT
December 2009
31
End of fiscal year or month
Federal Savings and
Loan Corporation, Resolution
Fund (11)
Federal Supplementary
Medical Insurance Trust
Fund (12)
Highway Trust Fund
(13)
National Service Life Insurance
Fund (14)
Postal Service Fund
(15)
Railroad Retirement
Account (16)
Treasury deposit funds (17)
Unemploy- ment Trust
Fund (18)
Other (19)
2005 ..................... 3,123 17,204 8,271 10,597 1,218 570 - 54,806 427,868 2006 ..................... 3,029 33,061 10,998 10,189 4,233 477 - 66,213 484,104 2007 ..................... 3,182 39,248 12,205 9,752 979 596 - 74,923 555,118 2008 ..................... 3,320 59,090 12,811 9,272 1,605 624 - 72,432 614,991 2009 ..................... 3,313 61,764 11,484 8,735 4,239 405 - 19,628 683,808 2008 - Sept.......... 3,320 59,090 12,811 9,272 1,605 624 - 72,432 614,991 Oct............ 3,320 54,795 10,906 9,186 1,200 561 - 68,300 697,150 Nov........... 3,319 59,364 10,804 9,119 1,200 367 - 67,362 691,988 Dec........... 3,325 59,850 10,386 9,294 1,200 364 - 61,805 689,981
2009 - Jan ............ 3,325 56,323 9,886 9,205 1,000 469 - 53,958 682,586 Feb ........... 3,326 57,782 9,545 9,123 1,000 501 - 48,370 682,383 Mar ........... 3,327 63,639 9,738 9,020 1,200 525 - 38,252 683,460
Apr............ 3,327 62,801 10,208 8,921 1,000 452 - 30,292 685,674 May .......... 3,317 63,006 9,102 8,841 1,200 431 - 38,141 686,004 June ......... 3,317 64,716 8,695 8,995 1,200 450 - 30,099 684,649 July........... 3,317 56,833 7,207 8,910 1,009 600 - 22,744 683,601 Aug........... 3,318 61,516 12,160 8,828 1,009 410 - 22,762 684,875 Sept.......... 3,313 61,764 11,484 8,735 4,239 405 - 19,628 683,808
Note.—Detail may not add to totals due to rounding.
TABLE FD-3.—Government Account Series
[In millions of dollars. Source: “Monthly Statement of the Public Debt of the United States”]
End of fiscal year or month
Total (1)
Airport and Airway
Trust Fund (2)
Deposit Insurance
Fund (3)
Employees Life
Insurance Fund (4)
Exchange Stabili-zation Fund (5)
Federal Disability Insurance Trust Fund
(6)
Federal employees retirement
funds (7)
Federal Hospital
Insurance Trust Fund
(8)
Federal Housing Adminis-
tration (9)
Federal Old-Age and
Survivors Insurance Trust
Fund (10)
2005 .................. 3,380,605 10,047 32,733 29,485 15,238 193,263 660,109 277,268 22,646 1,616,159 2006 .................. 3,722,747 7,893 46,216 31,282 15,711 202,178 689,812 302,186 22,036 1,793,129 2007 .................. 4,026,772 7,931 47,515 32,965 16,436 213,830 702,043 319,377 22,410 1,968,262 2008 .................. 4,297,677 7,674 29,937 34,397 16,847 216,487 729,705 318,741 19,093 2,150,651 2009 .................. 4,454,316 7,829 16,076 36,146 18,615 207,932 757,656 309,702 10,668 2,296,316 2008 - Sept ....... 4,297,677 7,674 29,937 34,397 16,847 216,487 729,705 318,741 19,093 2,150,651 Oct......... 4,358,403 8,432 29,519 34,494 17,184 214,667 726,483 310,991 19,244 2,151,971 Nov........ 4,353,747 7,593 24,611 34,963 17,179 213,094 722,953 316,700 19,379 2,153,752 Dec........ 4,421,658 7,855 25,496 35,032 17,661 215,810 738,870 321,910 19,415 2,203,404 2009 - Jan ......... 4,406,044 7,362 24,355 35,079 14,107 216,320 734,906 318,373 19,475 2,219,315 Feb ........ 4,391,447 7,357 22,681 35,278 14,652 214,514 731,109 314,163 19,698 2,219,965 Mar ........ 4,388,682 7,186 23,739 35,294 15,004 212,929 727,303 314,082 19,741 2,224,243 Apr......... 4,403,906 6,848 21,598 35,298 15,106 213,778 723,442 321,142 19,916 2,244,103 May ....... 4,399,423 7,371 17,589 35,773 15,102 211,735 720,053 317,045 20,058 2,244,655 June ...... 4,468,613 7,803 20,675 35,806 15,104 215,111 737,529 324,823 9,974 2,299,667 July........ 4,431,781 8,068 20,144 35,822 15,106 212,878 733,688 310,462 10,027 2,301,365 Aug........ 4,425,942 8,108 13,099 36,116 15,359 210,285 729,854 309,906 10,245 2,298,092 Sept....... 4,454,316 7,829 16,076 36,146 18,615 207,932 757,656 309,702 10,668 2,296,316

FEDERAL DEBT
December 2009
32
TABLE FD-4.—Interest-Bearing Securities Issued by Government Agencies
[In millions of dollars. Source: “Monthly Treasury Statement of Receipts and Outlays of the United States Government”]
End of fiscal year or month
Total outstanding
(1)
Department of Housing and
Urban Development
Federal Housing Administration
(2)
Architect of the
Capitol (3)
Other independent Tennessee
Valley Authority (4)
National Archives and Records
Administration (5)
Federal Communications
Commission (6)
2005 ............................ 23,637 146 160 23,097 235 1
2006 ............................ 23,392 112 156 22,899 225 *
2007 ............................ 22,959 85 152 22,506 215 -1
2008 ............................ 23,104 69 150 22,680 204 *
2009 ............................ 23,203 33 144 22,834 193 *
2008 - Sept ................. 23,104 69 150 22,680 204 *
Oct................... 25,569 69 149 25,146 204 *
Nov.................. 23,252 69 150 22,828 204 -1
Dec.................. 23,352 69 151 22,926 204 *
2009 - Jan ................... 23,087 69 152 22,661 204 *
Feb .................. 22,750 69 145 22,337 199 *
Mar .................. 22,554 33 146 22,177 199 *
Apr................... 22,409 33 147 22,031 199 *
May ................. 22,264 33 148 21,884 199 *
June ................ 22,276 33 149 21,896 199 *
July.................. 22,489 33 150 22,107 199 *
Aug.................. 22,338 33 143 21,970 193 *
Sept................. 23,203 33 144 22,834 193 * Note.—Detail may not add to totals due to rounding. * Less than $500,000.

FEDERAL DEBT
December 2009
33
TABLE FD-5.—Maturity Distribution and Average Length of Marketable Interest-Bearing Public Debt Held by Private Investors
[In millions of dollars. Source: Office of Debt Management, Office of the Under Secretary for Domestic Finance]
Maturity classes
End of fiscal year or month
Amount outstanding privately held
(1)
Within 1 year
(2) 1-5 years
(3) 5-10 years
(4) 10-20 years
(5)
20 years or more
(6) Average length
(7) 2005 ............................... 3,334,411 1,100,783 1,279,646 499,386 281,229 173,367 4 yrs. 10 mos.
2006 ............................... 3,496,359 1,140,553 1,295,589 589,748 290,733 179,736 4 yrs. 11 mos.
2007 ............................... 3,634,666 1,176,510 1,309,871 677,905 291,963 178,417 4 yrs. 10 mos.
2008 ............................... 4,745,256 2,042,003 1,468,455 719,347 352,430 163,022 4 yrs. 1 mo.
2009 ............................... 6,228,565 2,604,676 2,074,723 994,689 350,550 203,928 4 yrs. 1 mo.
2008 - Sept..................... 4,745,256 2,042,003 1,468,455 719,347 352,430 163,022 4 yrs. 1 mo.
Oct...................... 5,238,827 2,462,352 1,496,698 764,782 352,076 162,919 3 yrs. 10 mos.
Nov ..................... 5,312,125 2,540,826 1,490,667 761,948 355,148 163,536 3 yrs. 10 mos.
Dec ..................... 5,307,633 2,406,537 1,607,484 776,147 354,202 163,262 3 yrs. 10 mos.
2009 - Jan ...................... 5,260,475 2,331,996 1,631,789 773,548 360,402 162,741 3 yrs. 11 mos.
Feb ..................... 5,505,532 2,543,867 1,659,368 776,956 358,570 166,771 3 yrs. 11 mos.
Mar ..................... 5,759,709 2,601,162 1,790,274 833,981 357,716 176,575 3 yrs. 11 mos.
Apr...................... 5,800,248 2,601,043 1,792,321 875,653 376,004 155,227 3 yrs. 11 mos.
May..................... 5,815,094 2,660,151 1,762,962 856,289 367,080 168,611 3 yrs. 11 mos.
June.................... 5,943,636 2,611,596 1,891,559 900,239 361,806 178,436 3 yrs. 11 mos.
July ..................... 6,065,512 2,636,005 1,964,000 916,972 360,698 187,837 4 yrs. 0 mos.
Aug ..................... 6,179,984 2,669,428 2,014,501 951,363 352,756 191,935 4 yrs. 0 mos.
Sept. ................... 6,228,565 2,604,676 2,074,723 994,689 350,550 203,928 4 yrs. 1 mo.
Note.—Detail may not add to totals due to rounding.

FEDERAL DEBT
December 2009
34
TABLE FD-6.—Debt Subject to Statutory Limit
[In millions of dollars. Source: “Monthly Statement of the Public Debt of the United States”]
Debt subject to limit Securities outstanding
End of fiscal year or month
Statutory debt limit (1)
Total (2)
Public debt (3)
Other debt 1
(4) Public debt
(5) Other debt
(6)
Securities not subject
to limit (7)
2005 ................................................ 8,184,000 7,871,040 7,870,911 130 7,932,710 130 61,799
2006 ................................................ 8,965,000 8,420,278 8,420,183 96 8,506,974 96 86,792
2007 ................................................ 9,815,000 8,921,343 8,921,274 69 9,007,653 69 86,379
2008 ................................................ 10,615,000 9,959,850 9,959,799 51 10,024,725 51 64,926
2009 ................................................ 12,104,000 11,853,434 11,853,420 14 11,909,829 14 56,408
2009 - Sept...................................... 10,615,000 9,959,850 9,959,799 51 10,024,725 51 64,926
Oct....................................... 11,315,000 10,504,702 10,504,651 51 10,574,094 51 69,444
Nov ...................................... 11,315,000 10,595,725 10,595,674 51 10,661,175 51 65,502
Dec ...................................... 11,315,000 10,640,274 10,640,223 51 10,699,805 51 59,583
2009 - Jan ....................................... 11,315,000 10,569,310 10,569,296 14 10,632,080 14 62,784
Feb ...................................... 12,104,000 10,814,630 10,814,616 14 10,877,145 14 62,529
Mar ...................................... 12,104,000 11,066,217 11,066,203 14 11,126,941 14 60,738
Apr....................................... 12,104,000 11,178,827 11,178,813 14 11,238,592 14 59,779
May...................................... 12,104,000 11,260,445 11,260,430 14 11,321,600 14 61,170
June..................................... 12,104,000 11,487,470 11,487,456 14 11,545,275 14 57,819
July ...................................... 12,104,000 11,611,178 11,611,163 14 11,669,277 14 58,113
Aug ...................................... 12,104,000 11,755,205 11,755,191 14 11,812,870 14 57,678
Sept ..................................... 12,104,000 11,853,434 11,853,420 14 11,909,829 14 56,408 1 Consists of guaranteed debt issued by the Federal Housing Administration.

FEDERAL DEBT
December 2009
35
TABLE FD-7.—Treasury Holdings of Securities Issued by Government Corporations and Other Agencies
[In millions of dollars. Source: “Monthly Treasury Statement of Receipts and Outlays of the United States Government”]
Department of Agriculture
End of fiscal year or month
Total (1)
Farm-Service Agency
(2)
Rural Utilities Service
(3)
Rural Housing and Community
Development Service (4)
Rural Business and Cooperative
Development Service
(5)
Foreign Agricultural
Service (6)
2005 ................................................ 211,763 26,851 18,489 12,608 461 1,979 2006 ................................................ 228,065 22,578 20,432 12,911 485 1,358 2007 ................................................ 219,079 10,662 22,803 13,803 420 1,448 2008 ................................................ 252,783 9,691 24,789 14,780 479 1,456 2009 ................................................ 747,566 11,617 26,074 16,675 481 778 2008 - Sept ..................................... 252,783 9,691 24,789 14,780 479 1,456
Oct....................................... 298,445 16,067 25,003 14,908 484 1,456 Nov...................................... 326,003 18,862 25,155 15,022 488 1,456 Dec...................................... 357,973 9,673 25,659 15,171 490 1,456
2009 - Jan ....................................... 410,516 12,043 25,921 15,291 494 1,456 Feb ...................................... 432,532 12,499 26,194 15,407 495 1,456 Mar ...................................... 479,064 13,567 26,761 15,533 497 1,456 Apr....................................... 691,504 11,393 27,145 15,685 499 1,461 May ..................................... 706,075 11,625 27,584 15,834 502 1,461 June .................................... 748,498 11,023 26,084 16,599 497 1,461 July...................................... 774,408 10,581 26,084 16,599 497 1,461 Aug...................................... 789,194 10,360 25,912 17,026 477 730 Sept..................................... 747,566 11,617 26,074 16,675 481 778
Department of Energy
Department of Housing and Urban Development
Department of the Treasury
End of fiscal year or month
Department of Education
(7)
Bonneville Power Administration (8)
Federal Housing Administration
(9)
Other Housing programs
(10)
Federal Financing Bank
(11) 2005 ................................................ 104,471 2,777 7,548 239 12,413 2006 ................................................ 105,522 2,482 6,258 - 16,618 2007 ................................................ 103,973 2,241 4,573 - 17,609 2008 ................................................ 128,331 2,186 4,832 - 21,957 2009 ................................................ 234,918 2,130 4,420 - 47,107 2008 - Sept ..................................... 128,331 2,186 4,832 - 21,957
Oct....................................... 144,402 2,186 4,832 - 23,148 Nov...................................... 145,018 2,151 4,832 - 22,948 Dec...................................... 145,131 2,151 4,832 - 22,868
2009 - Jan....................................... 167,659 2,246 4,832 - 27,938 Feb...................................... 168,602 2,246 4,832 - 31,124 Mar...................................... 174,838 2,161 4,832 - 40,926 Apr ...................................... 178,690 2,221 4,932 - 39,815
May ..................................... 188,280 2,111 5,107 - 41,481 June .................................... 209,413 2,151 5,107 - 41,884 July...................................... 214,585 2,042 5,107 - 41,651 Aug...................................... 224,647 2,042 5,107 - 41,703
Sept..................................... 234,918 2,130 4,420 - 47,107

FEDERAL DEBT
December 2009
36
TABLE FD-7.—Treasury Holdings of Securities Issued by Government Corporations and Other Agencies, con.
[In millions of dollars. Source: “Monthly Treasury Statement of Receipts and Outlays of the United States Government”]
End of fiscal year or month
Export-Import Bank of the
United States (12)
Railroad Retirement
Board (13)
Small Business Administration
(14) Other (15)
2005 ...................................... 5,848 2,973 7,695 7,411
2006 ...................................... 4,911 2,958 9,303 22,249
2007 ...................................... 4,364 2,945 11,366 22,872
2008 ...................................... 2,929 3,096 9,463 28,793
20009 .................................... 3,805 3,359 10,873 385,328
2008 - Sept ........................... 2,929 3,096 9,463 28,793
Oct............................. 2,929 3,394 9,463 50,174
Nov............................ 2,929 3,683 9,463 73,996
Dec............................ 3,151 3,990 9,463 113,939
2009 - Jan ............................. 3,309 4,294 9,463 135,570
Feb ............................ 3,309 4,555 8,310 153,501
Mar ............................ 3,309 4,857 8,902 181,425
Apr............................. 3,479 5,160 8,902 392,121
May ........................... 3,943 5,463 9,632 393,053
June .......................... 4,028 2,400 10,124 417,727
July............................ 4,355 2,734 10,124 438,587
Aug............................ 3,664 3,029 10,656 443,841
Sept........................... 3,805 3,359 10,873 385,328 Note.—Detail may not add to totals due to rounding.

December 2009
37
INTRODUCTION: Public Debt OperationsChapter 31 of Title 31 of the United States Code allows the
Secretary of Treasury to borrow money by issuing Treasury securities. The Secretary determines the terms and conditions of issue, conversion, maturity, payment, and interest rate. New issues of Treasury notes mature in 2 to 10 years. Bonds mature in more than 10 years from the issue date. Each outstanding marketable security is listed in the “Monthly Statement of the Public Debt of the United States.” The information in this section of the “Treasury Bulletin” pertains only to marketable Treasury securities.
Table PDO-1 presents the results of weekly auctions of 4-,
13-, and 26-week bills. Treasury bills mature each Thursday. Issues of 4- and 13-week bills are reopenings of 26-week bills. High yields on accepted tenders and the dollar value of total bids are presented, with the dollar value of awards made on both competitive and noncompetitive bases.
To encourage the participation of individuals and smaller institutions, Treasury accepts noncompetitive tenders of up to $5 million for bills and $5 million for notes and bonds in each auction of securities.
• Table PDO-2 lists the results of auctions of marketable securities, other than weekly bills, in chronological order over the past 2 years. Issues of cash management bills also are presented.
Note: Additional information, including maturity
schedules of interest-bearing marketable public debt securities other than regular weekly and 52-week Treasury bills outstanding, can now be found on the Bureau of Public Debt’s website at http://www.treasurydirect.gov/govt/ reports/pd/pd_ pdotables_downloadable_files.htm.
Note: On April 30, 2008, Treasury announced the reintroduction of the 52-week bill. The first auction of this security took place on June 3, 2008.
Note: Cash managements bills that are identified below are issued as part of the Supplementary Financing Program (SFP). For more details about the SFP, visit www.treasury.gov/ press/releases/hp1144.htm or call 202-622-2960.
Note: On February 4, 2009, Treasury announced the reintroduction of the 7-year note. The first auction of this security took place on February 26, 2009.
TREASURY FINANCING: JULY-SEPTEMBER
[Source: Bureau of the Public Debt, Office of Financing]
J U L Y
Cash Management Bills
On June 29, 2009, Treasury announced it would auction $30,000 million of 339-day bills. They were issued July 6 and will mature June 10, 2010. The issue was to raise new cash. Treasury auctioned the bills on July 1. Tenders totaled $82,191 million; Treasury accepted $30,000 million. The high bank discount rate was 0.540 percent.
On July 13, Treasury announced it would auction $35,000 million of 70-day bills. They were issued July 16 and matured September 24. The issue was part of the SFP. Treasury auctioned the bills on July 15. Tenders totaled $111,875 million; Treasury accepted $35,000 million. The high bank discount rate was 0.185 percent.
On July 20, Treasury announced it would auction $35,000 million of 70-day bills. They were issued July 23 and will mature October 1. The issue was part of the SFP. Treasury auctioned the bills on July 22. Tenders totaled $126,162 million; Treasury accepted $35,000 million. The high bank discount rate was 0.180 percent.
On July 20, Treasury announced it would auction $30,000 million of 70-day bills. They were issued July 30 and will mature October 8. The issue was part of the SFP. Treasury auctioned the bills on July 24. Tenders totaled $126,704 million; Treasury accepted $30,000 million. The high bank discount rate was 0.185 percent.
52-Week Bills
On June 25, 2009, Treasury announced it would auction $27,000 million of 364-day Treasury bills. They were issued July 2, and will mature July 1, 2010. The issue was to refund $150,006 million of all maturing bills and pay down approximately $26,006 million. Treasury auctioned the bills on June 30. Tenders totaled $79,361 million; Treasury accepted $27,000 million. That included $152 million of noncompetitive tenders from the public. The high bank discount rate was 0.545 percent.
Auction of 3-Year Notes
On July 2, 2009, Treasury announced it would auction $35,000 million of 3-year notes. The issue was to refund

38 PUBLIC DEBT OPERATIONS
TREASURY FINANCING: JULY-SEPTEMBER, con.
December 2009
$13,771 million of securities maturing July 15 and to raise new cash of approximately $59,229 million.
The 3-year notes of Series AA-2012 were dated and issued July 15. They are due July 15, 2012, with interest payable on January 15 and July 15 until maturity. Treasury set an interest rate of 1-1/2 percent after determining which tenders were accepted on a yield auction basis.
Treasury received tenders for the notes before 12:00 noon Eastern Time (e.t.) for noncompetitive tenders and before 1:00 p.m. e.t. for competitive tenders on July 7. Tenders totaled $91,572 million; Treasury accepted $35,000 million. All noncompetitive and successful competitive bidders were allotted securities at the high yield of 1.519 percent with the equivalent price of $99.944485. Treasury accepted in full all competitive tenders at yields lower than 1.519 percent. Tenders at the high yield were allotted 76.31 percent. The median yield was 1.430 percent, and the low yield was 1.370 percent. Noncompetitive tenders totaled $73 million. Competitive tenders accepted from private investors totaled $34,927 million.
In addition to the $35,000 million of tenders accepted in the auction process, Treasury accepted $592 million from Federal Reserve banks (FRBs) for their own accounts. The minimum par amount required for Separate Trading of Registered Interest and Principal Securities (STRIPS) of notes of Series AA-2012 is $100.
Auction of 9-Year 10-Month 3-1/8 Percent Notes
On July 2, 2009, Treasury announced that it would auction $19,000 million of 9-year 10-month 3-1/8 percent notes. The issue was to refund $13,771 million of securities maturing July 15 and to raise new cash of approximately $59,229 million.
The 9-year 10-month notes of series C-2019 were dated May 15 and issued July 15. They are due May 15, 2019, with interest payable on November 15 and May 15 until maturity.
Treasury received tenders for the notes before 12:00 noon e.t. for noncompetitive tenders and before 1:00 p.m. e.t. for competitive tenders on July 8. Tenders totaled $62,396 million; Treasury accepted $19,000 million. All noncompetitive and successful competitive bidders were allotted securities at the high yield of 3.365 percent with an equivalent adjusted price of $97.998772. Treasury accepted in full all competitive tenders at yields lower than 3.365. Tenders at the high yield were allotted 86.72 percent. The median yield was 3.340 percent, and the low yield was 3.282 percent. Noncompetitive tenders totaled $43 million. Competitive tenders accepted from private investors totaled $18,908 million. Accrued interest of 5.18003 per $1,000 must be paid for the period from May 15 to July 15.
In addition to the $19,000 million of tenders accepted in the auction process, Treasury accepted $321 million from FRBs for their own accounts. The minimum par amount required for STRIPS of notes of series C-2019 is $100.
Auction of 10-Year Treasury Inflation Protected Security (TIPS)
On July 2, 2009, Treasury announced that it would auction $8,000 million of 10-year TIPS. The issue was to refund $13,771 million of securities maturing July 15 and to raise new cash of approximately $59,229 million.
The 10-year TIPS of Series D-2019 were dated and issued July 15. They are due July 15, 2019, with interest payable on January 15 and July 15 until maturity. Treasury set an interest rate of 1-7/8 percent after determining which tenders were accepted on a yield auction basis.
Treasury received tenders for the TIPS before 12:00 noon e.t. for noncompetitive tenders and before 1:00 p.m. e.t. for competitive tenders on July 6. Tenders totaled $20,090 million; Treasury accepted $8,000 million. All noncompetitive and successful competitive bidders were allotted securities at the high yield of 1.920 percent with an equivalent adjusted price of $99.592335. Treasury accepted in full all competitive tenders at yields lower than 1.920 percent. Tenders at the high yield were allotted 23.38 percent. The median yield was 1.799 percent, and the low yield was 1.630 percent. Noncompetitive tenders totaled $259 million. Competitive tenders accepted from private investors totaled $7,741 million.
In addition to the $8,000 million of tenders accepted in the auction process, Treasury accepted $135 million from FRBs for their own accounts. The minimum par amount required for STRIPS of TIPS of Series D-2019 is $100.
Auction of 29-Year 10-Month 4-1/4 Percent Bonds
On July 2, 2009, Treasury announced it would auction $11,000 million of 29-year 10-month 4-1/4 percent bonds. The issue was to refund $13,771 million of securities maturing July 15 and to raise new cash of approximately $59,229 million.
The 29-year 10-month bonds of May 2039 were dated May 15 and issued July 15. They are due May 15, 2039, with interest payable on November 15 and May 15 until maturity.
Treasury received tenders for the bonds before 12:00 noon e.t. for noncompetitive tenders and before 1:00 p.m. e.t. for competitive tenders on July 9. Tenders totaled $25,934 million; Treasury accepted $11,000 million. All noncompetitive and successful competitive bidders were allotted securities at the high yield of 4.303 percent with an equivalent price of $99.104142. Treasury accepted in full all competitive tenders at yields lower than 4.303 percent. Tenders at the high yield were allotted 67.88 percent. The median yield was 4.230 percent, and the low yield was 4.150 percent. Noncompetitive tenders totaled $6 million. Competitive tenders accepted from private investors totaled $10,994 million. Accrued interest of $7.04484 per $1,000 must be paid for the period from May 15 to July 15.

PUBLIC DEBT OPERATIONS
TREASURY FINANCING: JULY-SEPTEMBER, con.
December 2009
39
In addition to the $11,000 million of tenders accepted in the auction process, Treasury accepted $186 million from FRBs for their own accounts. The minimum par amount required for STRIPS of bonds of May 2039 is $100.
52-Week Bills
On July 23, 2009, Treasury announced it would auction $27,000 million of 364-day Treasury bills. They were issued July 30 and will mature July 29, 2010. The issue was to refund $176,005 million of all maturing bills and to pay down approximately $26,005 million. Treasury auctioned the bills on July 28. Tenders totaled $106,748 million; Treasury accepted $27,000 million. That included $214 million of noncompetitive tenders from the public. The high bank discount rate was 0.470 percent.
Auction of 2-Year Notes
On July 23, 2009, Treasury announced it would auction $42,000 million of 2-year notes. The issue was to refund $19,007 million of securities maturing July 31 and to raise new cash of approximately $95,993 million.
The 2-year notes of Series AA-2011 were dated and issued July 31. They are due July 31, 2011, with interest payable on January 31 and July 31 until maturity. Treasury set an interest rate of 1 percent after determining which tenders were accepted on a yield auction basis.
Treasury received tenders for the notes before 12:00 noon e.t. for noncompetitive tenders and before 1:00 p.m. e.t. for competitive tenders on July 28. Tenders totaled $115,612 million; Treasury accepted $42,000 million. All noncompetitive and successful competitive bidders were allotted securities at the high yield of 1.080 percent with an equivalent price of $99.842137. Treasury accepted in full all competitive tenders at yields lower than 1.080 percent. Tenders at the high yield were allotted 21.59 percent. The median yield was 1.039 percent, and the low yield was 0.950 percent. Noncompetitive tenders totaled $441 million. Competitive tenders accepted from private investors totaled $41,534 million.
In addition to the $42,000 million of tenders accepted in the auction process, Treasury accepted $1,052 million from FRBs for their own accounts. The minimum par amount required for STRIPS of notes of Series AA-2011 is $100.
Auction of 5-Year Notes
On July 23, 2009, Treasury announced it would auction $39,000 million of 5-year notes. The issue was to refund $19,007 million of securities maturing July 31 and to raise new cash of approximately $95,993 million.
The 5-year notes of Series P-2014 were dated and issued July 31. They are due July 31, 2014, with interest payable on January 31 and July 31 until maturity. Treasury set an interest rate of 2-5/8 percent after determining which tenders were accepted on a yield auction basis.
Treasury received tenders for the notes before 12:00 noon e.t. for noncompetitive tenders and before 1:00 p.m. e.t. for competitive tenders on July 29. Tenders totaled $75,015 million; Treasury accepted $39,000 million. All noncompetitive and successful competitive bidders were allotted securities at the high yield of 2.689 percent with an equivalent price of $99.702444. Treasury accepted in full all competitive tenders at yields lower than 2.689 percent. Tenders at the high yield were allotted 31.16 percent. The median yield was 2.590 percent, and the low yield was 2.000 percent. Noncompetitive tenders totaled $130 million. Competitive tenders accepted from private investors totaled $38,845 million.
In addition to the $39,000 million of tenders accepted in the auction process, Treasury accepted $977 million from FRBs for their own accounts. The minimum par amount required for STRIPS of notes of Series P-2014 is $100.
Auction of 7-Year Notes
On July 23, 2009, Treasury announced it would auction $28,000 million of 7-year notes. The issue was to refund $19,007 million of securities maturing July 31 and to raise new cash of approximately $95,993 million.
The 7-year notes of Series M-2016 were dated and issued July 31. They are due July 31, 2016, with interest payable on January 31 and July 31 until maturity. Treasury set an interest rate of 3-1/4 percent after determining which tenders were accepted on a yield auction basis.
Treasury received tenders for the notes before 12:00 noon e.t. for noncompetitive tenders and before 1:00 p.m. e.t. for competitive tenders on July 30. Tenders totaled $73,586 million; Treasury accepted $28,000 million. All noncompetitive and successful competitive bidders were allotted securities at the high yield of 3.369 percent with an equivalent price of $99.263422. Treasury accepted in full all competitive tenders at yields lower than 3.369 percent. Tenders at the high yield were allotted 91.73 percent. The median yield was 3.287 percent, and the low yield was 3.210 percent. Noncompetitive tenders totaled $50 million. Competitive tenders accepted from private investors totaled $27,935 million.
In addition to the $28,000 million of tenders accepted in the auction process, Treasury accepted $701 million from FRBs for their own accounts. The minimum par amount required for STRIPS of notes of Series M-2016 is $100.
Auction of 19-Year 6-Month 2-1/2 Percent TIPS
On July 23, 2009, Treasury announced it would auction $6,000 million of 19-year 6-month 2-1/2 percent TIPS. The issue was to refund $19,007 million of securities maturing July 31 and to raise new cash of approximately $95,993 million.
The 19-year 6-month TIPS of January 2029 were dated July 15 and issued July 31. They are due January 15, 2029, with interest payable on January 15 and July 15 until maturity.

40 PUBLIC DEBT OPERATIONS
TREASURY FINANCING: JULY-SEPTEMBER, con.
December 2009
Treasury received tenders for the TIPS before 12:00 noon e.t. for noncompetitive tenders and before 1:00 p.m. e.t. for competitive tenders on July 27. Tenders totaled $13,598 million; Treasury accepted $6,000 million. All noncompetitive and successful competitive bidders were allotted securities at the high yield of 2.387 percent with an equivalent adjusted price of $101.340316. Treasury accepted in full all competitive tenders at yields lower than 2.387 percent. Tenders at the high yield were allotted 97.30 percent. The median yield was 2.300 percent, and the low yield was 2.199 percent. Noncompetitive tenders totaled $100 million. Competitive tenders accepted from private investors totaled $5,900 million. Adjusted accrued interest of $1.08259 per $1,000 must be paid for the period from July 15 to July 31. Both the unadjusted price of $101.749348 and the unadjusted accrued interest of $1.08696 were adjusted by an index ratio of 0.99598, for the period from January 15 to July 31.
In addition to the $6,000 million of tenders accepted in the auction process, Treasury accepted $150 million from FRBs for their own accounts. The minimum par amount required for STRIPS of TIPS of January 2029 is $100.
A U G U S T
Cash Management Bills
On August 3, 2009, Treasury announced it would auction $35,000 million of 70-day bills. They were issued August 6 and will mature October 15. The issue was part of the SFP. Treasury auctioned the bills on August 5. Tenders totaled $115,997 million; Treasury accepted $35,000 million. The high bank discount rate was 0.185 percent.
On August 3, Treasury announced it would auction $35,000 million of 70-day bills. They were issued August 13 and will mature October 22. The issue was part of the SFP. Treasury auctioned the bills on August 7. Tenders totaled $135,930 million; Treasury accepted $35,000 million. The high bank discount rate was 0.185 percent.
On August 10, Treasury announced it would auction $36,000 million of 303-day bills. They were issued August 18 and will mature June 17, 2010. The issue was to raise new cash. Treasury auctioned the bills on August 13. Tenders totaled $118,250 million; Treasury accepted $36,001 million. The high bank discount rate was 0.445 percent.
On August 17, Treasury announced it would auction $30,000 million of 70-day bills. They were issued August 20 and will mature October 29. The issue was part of the SFP. Treasury auctioned the bills on August 19. Tenders totaled $142,306 million; Treasury accepted $30,000 million. The high bank discount rate was 0.145 percent.
August Quarterly Financing
On August 5, 2009, Treasury announced it would auction $37,000 million of 3-year notes, $23,000 million of 10-year
notes and $15,000 million of 30-year bonds to refund $60,919 million of securities maturing on August 15 and to raise new cash of approximately $14,081 million.
The 3-year notes of Series AB-2012 were dated August 15 and issued August 17. They are due August 15, 2012, with interest payable on February 15 and August 15 until maturity. Treasury set an interest rate of 1-3/4 percent after determining which tenders were accepted on a yield auction basis.
Treasury received tenders for the notes before 12:00 noon e.t. for noncompetitive tenders and before 1:00 p.m. e.t. for competitive tenders on August 11. Tenders totaled $106,992 million; Treasury accepted $37,000 million. All noncompetitive and successful competitive bidders were allotted securities at the high yield of 1.780 percent with an equivalent price of $99.912808. Treasury accepted in full all competitive tenders at yields lower than 1.780. Tenders at the high yield were allotted 13.08 percent. The median yield was 1.727 percent, and the low yield was 1.600 percent. Noncompetitive tenders totaled $205 million. Competitive tenders accepted from private investors totaled $36,745 million. Accrued interest of $0.09511 per $1,000 must be paid for the period from August 15 to August 17.
In addition to the $37,000 million of tenders accepted in the auction process, Treasury accepted $5,715 million from FRBs for their own accounts. The minimum par amount required for STRIPS of Series AB-2012 is $100.
The 10-year notes of Series E-2019 were dated August 15 and issued August 17. They are due August 15, 2019, with interest payable on February 15 and August 15 until maturity. Treasury set an interest rate of 3-5/8 percent after determining which tenders were accepted on a yield auction basis.
Treasury received tenders for the notes before 12:00 noon e.t. for noncompetitive tenders and before 1:00 p.m. e.t. for competitive tenders on August 12. Tenders totaled $57,263 million; Treasury accepted $23,000 million. All noncompetitive and successful competitive bidders were allotted securities at the high yield of 3.734 percent with an equivalent price of $99.097347. Treasury accepted in full all competitive tenders at yields lower than 3.734. Tenders at the high yield were allotted 20.93 percent. The median yield was 3.636 percent, and the low yield was 3.550 percent. Noncompetitive tenders totaled $138 million. Competitive tenders accepted from private investors totaled $22,762 million. Accrued interest of $0.19701 per $1,000 must be paid for the period from August 15 to August 17.
In addition to the $23,000 million of tenders accepted in the auction process, Treasury accepted $3,552 million from FRBs for their own accounts. The minimum par amount required for STRIPS of Series E-2019 is $100.
The 30-year bonds of August 2039 were dated August 15 and issued August 17. They are due August 15, 2039, with interest payable on February 15 and August 15 until maturity. Treasury set an interest rate of 4-1/2 percent after determining which tenders were accepted on a yield auction basis.

PUBLIC DEBT OPERATIONS
TREASURY FINANCING: JULY-SEPTEMBER, con.
December 2009
41
Treasury received tenders for the bonds before 12:00 noon e.t. for noncompetitive tenders and before 1:00 p.m. e.t. for competitive tenders on August 13. Tenders totaled $38,032 million; Treasury accepted $15,000 million. All noncompetitive and successful competitive bidders were allotted securities at the high yield of 4.541 percent with an equivalent price of $99.331386. Treasury accepted in full all competitive tenders at yields lower than 4.541. Tenders at the high yield were allotted 16.77 percent. The median yield was 4.480 percent, and the low yield was 4.392 percent. Noncompetitive tenders totaled $22 million. Competitive tenders accepted from private investors totaled $14,978 million. Accrued interest of $0.24457 per $1,000 must be paid for the period from August 15 to August 17.
In addition to the $15,000 million of tenders accepted in the auction process, Treasury accepted $2,317 million from FRBs for their own accounts. The minimum par amount required for STRIPS of bonds of August 2039 is $100.
52-Week Bills
On August 20, 2009, Treasury announced it would auction $27,000 million of 364-day Treasury bills. They were issued August 27, and will mature August 26, 2010. The issue was to refund $111,007 million of all maturing bills and to raise new cash of approximately $6,993 million. Treasury auctioned the bills on August 25. Tenders totaled $92,950 million; Treasury accepted $27,000 million. That included $248 million of noncompetitive tenders from the public. The high bank discount rate was 0.460 percent.
Auction of 2-Year Notes
On August 20, 2009, Treasury announced it would auction $42,000 million of 2-year notes. The issue was to refund $19,002 million of securities maturing August 31 and to raise new cash of approximately $89,998 million.
The 2-year notes of Series AB-2011 were dated and issued August 31. They are due August 31, 2011, with interest payable on February 28 and August 31 until maturity. Treasury set an interest rate of 1 percent after determining which tenders were accepted on a yield auction basis.
Treasury received tenders for the notes before 12:00 noon e.t. for noncompetitive tenders and before 1:00 p.m. e.t. for competitive tenders on August 25. Tenders totaled $112,655 million; Treasury accepted $42,000 million. All noncompetitive and successful competitive bidders were allotted securities at the high yield of 1.119 percent with an equivalent price of $99.765292. Treasury accepted in full all competitive tenders at yields lower than 1.119 percent. Tenders at the high yield were allotted 92.32 percent. The median yield was 1.060 percent, and the low yield was 0.950 percent. Noncompetitive tenders totaled $530 million. Competitive tenders accepted from private investors totaled $41,420 million.
In addition to the $42,000 million of tenders accepted in the auction process, Treasury accepted $1,264 million from FRBs for their own accounts. The minimum par amount required for STRIPS of notes of Series AB-2011 is $100.
Auction of 5-Year Notes
On August 20, 2009, Treasury announced it would auction $39,000 million of 5-year notes. The issue was to refund $19,002 million of securities maturing August 31 and to raise new cash of approximately $89,998 million.
The 5-year notes of Series Q-2014 were dated and issued August 31. They are due August 31, 2014, with interest payable on the last calendar day of February and August 31 until maturity. Treasury set an interest rate of 2-3/8 percent after determining which tenders were accepted on a yield auction basis.
Treasury received tenders for the notes before 12:00 noon e.t. for noncompetitive tenders and before 1:00 p.m. e.t. for competitive tenders on August 26. Tenders totaled $97,696 million; Treasury accepted $39,000 million. All noncompetitive and successful competitive bidders were allotted securities at the high yield of 2.494 percent with an equivalent price of $99.443852. Treasury accepted in full all competitive tenders at yields lower than 2.494 percent. Tenders at the high yield were allotted 16.55 percent. The median yield was 2.419 percent, and the low yield was 2.310 percent. Noncompetitive tenders totaled $136 million. Competitive tenders accepted from private investors totaled $38,864 million.
In addition to the $39,000 million of tenders accepted in the auction process, Treasury accepted $1,174 million from FRBs for their own accounts. The minimum par amount required for STRIPS of notes of Series Q-2014 is $100.
Auction of 7-Year Notes
On August 20, 2009, Treasury announced it would auction $28,000 million of 7-year notes. The issue was to refund $19,002 million of securities maturing August 31 and to raise new cash of approximately $89,998 million.
The 7-year notes of Series N-2016 were dated and issued August 31. They are due August 31, 2016, with interest payable on the last calendar day of February and August 31 until maturity. Treasury set an interest rate of 3 percent after determining which tenders were accepted on a yield auction basis.
Treasury received tenders for the notes before 12:00 noon e.t. for noncompetitive tenders and before 1:00 p.m. e.t. for competitive tenders on August 27. Tenders totaled $76,722 million; Treasury accepted $28,000 million. All noncompetitive and successful competitive bidders were allotted securities at the high yield of 3.092 percent with an equivalent price of $99.424898. Treasury accepted in full all competitive tenders at yields lower than 3.092 percent. Tenders at the high yield were

42 PUBLIC DEBT OPERATIONS
TREASURY FINANCING: JULY-SEPTEMBER, con.
December 2009
allotted 46.29 percent. The median yield was 3.014 percent, and the low yield was 2.970 percent. Noncompetitive tenders totaled $53 million. Competitive tenders accepted from private investors totaled $27,947 million.
In addition to the $28,000 million of tenders accepted in the auction process, Treasury accepted $843 million from FRBs for their own accounts. The minimum par amount required for STRIPS of notes of Series N-2016 is $100.
S E P T E M B E R
Cash Management Bills
On August 31, 2009, Treasury announced it would auction $29,000 million of 308-day bills. They were issued September 10 and will mature July 15, 2010. The issue was to raise new cash. Treasury auctioned the bills on September 3. Tenders totaled $110,662 million; Treasury accepted $29,000 million. The high bank discount rate was 0.385 percent.
Auction of 3-Year Notes
On September 3, 2009 Treasury announced it would auction $38,000 million of 3-year notes. The issue was to refund $14,857 million of securities maturing September 15 and to raise new cash of approximately $55,143 million.
The 3-year notes of Series AC-2012 were dated and issued September 15. They are due September 15, 2012, with interest payable on March 15 and September 15 until maturity. Treasury set an interest rate of 1-3/8 percent after determining which tenders were accepted on a yield auction basis.
Treasury received tenders for the notes before 12:00 noon e.t. for noncompetitive tenders and before 1:00 p.m. e.t. for competitive tenders on September 8. Tenders totaled $114,937 million; Treasury accepted $38,000 million. All noncompetitive and successful competitive bidders were allotted securities at the high yield of 1.487 percent with the equivalent price of $99.672573. Treasury accepted in full all competitive tenders at yields lower than 1.487 percent. Tenders at the high yield were allotted 54.60 percent. The median yield was 1.430 percent, and the low yield was 1.350 percent. Noncompetitive tenders totaled $81 million. Competitive tenders accepted from private investors totaled $37,819 million.
In addition to the $38,000 million of tenders accepted in the auction process, Treasury accepted $80 million from FRBs for their own accounts. The minimum par amount required for STRIPS of notes of Series AC-2012 is $100.
Auction of 9-Year 11-Month 3-5/8 Percent Notes
On September 3, 2009, Treasury announced that it would auction $20,000 million of 9-year 11-month 3-5/8 percent notes. The issue was to refund $14,857 million of securities maturing September 15 and to raise new cash of approximately $55,143 million.
The 9-year 11-month notes of Series E-2019 were dated August 15 and issued September 15. They are due August 15, 2019, with interest payable on February 15 and August 15 until maturity.
Treasury received tenders for the notes before 12:00 noon e.t. for noncompetitive tenders and before 1:00 p.m. e.t. for competitive tenders on September 9. Tenders totaled $55,416 million; Treasury accepted $20,000 million. All noncompetitive and successful competitive bidders were allotted securities at the high yield of 3.510 percent with an equivalent price of $100.951686. Treasury accepted in full all competitive tenders at yields lower than 3.510 percent. Tenders at the high yield were allotted 78.40 percent. The median yield was 3.450 percent, and the low yield was 3.340 percent. Noncompetitive tenders totaled $46 million. Competitive tenders accepted from private investors totaled $19,854 million. Accrued interest of $3.05367 per $1,000 must be paid for the period from August 15 to September 15.
In addition to the $20,000 million of tenders accepted in the auction process, Treasury accepted $42 million from FRBs for their own accounts. The minimum par amount required for STRIPS of notes of Series E-2019 is $100.
Auction of 29-Year 11-Month 4-1/2 Percent Bonds
On September 3, 2009, Treasury announced that it would auction $12,000 million of 29-year 11-month 4-1/2 percent bonds. The issue was to refund $14,857 million of securities maturing September 15 and to raise new cash of approximately $55,143 million.
The 29-year 11-month bonds of August 2039 were dated August 15 and issued September 15. They are due August 15, 2039, with interest payable on February 15 and August 15 until maturity.
Treasury received tenders for the bonds before 12:00 noon e.t. for noncompetitive tenders and before 1:00 p.m. e.t. for competitive tenders on September 10. Tenders totaled $34,992 million; Treasury accepted $12,000 million. All noncompetitive and successful competitive bidders were allotted securities at the high yield of 4.238 percent with an equivalent price of $104.412534. Treasury accepted in full all competitive tenders at yields lower than 4.238 percent. Tenders at the high yield were allotted 85.35 percent. The median yield was 4.210 percent, and the low yield was 4.100 percent. Noncompetitive tenders totaled $20 million. Competitive tenders accepted from private investors totaled $11,980 million. Accrued interest of $3.79076 per $1,000 must be paid for the period from August 15 to September 15.
In addition to the $12,000 million of tenders accepted in the auction process, Treasury accepted $25 million from FRBs for their own accounts. The minimum par amount required for STRIPS of Bonds of August 2039 is $100.

PUBLIC DEBT OPERATIONS
TREASURY FINANCING: JULY-SEPTEMBER, con.
December 2009
43
52-Week Bills
On September 17, 2009, Treasury announced it would auction $27,000 million of 364-day Treasury bills. They were issued September 24, and will mature September 23, 2010. The issue was to refund $144,998 million of all maturing bills and to pay down approximately $43,998 million. Treasury auctioned the bills on September 22. Tenders totaled $84,435 million; Treasury accepted $27,000 million. That included $203 million of noncompetitive tenders from the public. The high bank discount rate was 0.405 percent.
Auction of 2-Year Notes
On September 17, 2009, Treasury announced it would auction $43,000 million of 2-year notes. The issue was to refund $19,985 million of securities maturing September 30 and to raise new cash of approximately $92,015 million.
The 2-year notes of Series AC-2011 were dated and issued September 30. They are due September 30, 2011, with interest payable on March 31 and September 30 until maturity. Treasury set an interest rate of 1 percent after determining which tenders were accepted on a yield auction basis.
Treasury received tenders for the notes before 12:00 noon e.t. for noncompetitive tenders and before 1:00 p.m. e.t. for competitive tenders on September 22. Tenders totaled $138,840 million; Treasury accepted $43,000 million. All noncompetitive and successful competitive bidders were allotted securities at the high yield of 1.034 percent with an equivalent price of $99.932870. Treasury accepted in full all competitive tenders at yields lower than 1.034 percent. Tenders at the high yield were allotted 27.16 percent. The median yield was 0.990 percent, and the low yield was 0.920 percent. Noncompetitive tenders totaled $434 million. Competitive tenders accepted from private investors totaled $42,466 million.
In addition to the $43,000 million of tenders accepted in the auction process, Treasury accepted $762 million from FRBs for their own accounts. The minimum par amount required for STRIPS of notes of Series AC-2011 is $100.
Auction of 5-Year Notes
On September 17, 2009, Treasury announced it would auction $40,000 million of 5-year notes. The issue was to refund $19,985 million of securities maturing September 30 and to raise new cash of approximately $92,015 million.
The 5-year notes of Series R-2014 were dated and issued September 30. They are due September 30, 2014, with interest
payable on March 31 and September 30 until maturity. Treasury set an interest rate of 2-3/8 percent after determining which tenders were accepted on a yield auction basis.
Treasury received tenders for the notes before 12:00 noon e.t. for noncompetitive tenders and before 1:00 p.m. e.t. for competitive tenders on September 23. Tenders totaled $95,982 million; Treasury accepted $40,000 million. All noncompetitive and successful competitive bidders were allotted securities at the high yield of 2.470 percent with an equivalent price of $99.555732. Treasury accepted in full all competitive tenders at yields lower than 2.470 percent. Tenders at the high yield were allotted 39.82 percent. The median yield was 2.390 percent, and the low yield was 2.295 percent. Noncompetitive tenders totaled $117 million. Competitive tenders accepted from private investors totaled $39,833 million.
In addition to the $40,000 million of tenders accepted in the auction process, Treasury accepted $709 million from FRBs for their own accounts. The minimum par amount required for STRIPS of notes of Series R-2014 is $100.
Auction of 7-Year Notes
On September 17, 2009, Treasury announced it would auction $29,000 million of 7-year notes. The issue was to refund $19,985 million of securities maturing September 30 and to raise new cash of approximately $92,015 million.
The 7-year notes of Series P-2016 were dated and issued September 30. They are due September 30, 2016, with interest payable on March 31 and September 30 until maturity. Treasury set an interest rate of 3 percent after determining which tenders were accepted on a yield auction basis.
Treasury received tenders for the notes before 12:00 noon e.t. for noncompetitive tenders and before 1:00 p.m. e.t. for competitive tenders on September 24. Tenders totaled $80,819 million; Treasury accepted $29,000 million. All noncompetitive and successful competitive bidders were allotted securities at the high yield of 3.005 percent with an equivalent price of $99.968647. Treasury accepted in full all competitive tenders at yields lower than 3.005 percent. Tenders at the high yield were allotted 30.22 percent. The median yield was 2.937 percent, and the low yield was 2.850 percent. Noncompetitive tenders totaled $40 million. Competitive tenders accepted from private investors totaled $28,960 million.
In addition to the $29,000 million of tenders accepted in the auction process, Treasury accepted $514 million from FRBs for their own accounts. The minimum par amount required for STRIPS of notes of Series P-2016 is $100.

PUBLIC DEBT OPERATIONS
December 2009
44
TABLE PDO-1.—Offerings of Regular Weekly Treasury Bills [In millions of dollars. Source: Bureau of the Public Debt, Office of Financing]
On total competitive bids accepted Description of new issue Amounts of bids accepted
Issue date Maturity date
(1)
Number of days to maturity 1
(2)
Amount of bids
tendered (3)
Total amount 2
(4)
On competitive
basis (5)
On non- competitive
basis 3
(6)
High price per hundred
(7)
High discount
rate (percent)
(8)
High invest- ment rate
(percent) 4 (9)
Regular weekly: (4 week, 13 week, and 26 week) 2009 - July 02................... 2009 July 30 28 113,102.5 40,938.4 34,696.5 304.0 99.987556 0.160 0.162
Oct. 01 91 112,946.8 32,000.7 30,484.6 1,295.5 99.950708 0.195 0.198 Dec. 31 182 84,740.7 30,000.3 28,951.6 898.7 99.823056 0.350 0.355July 09 ................. Aug. 06 28 119,425.5 37,782.1 33,615.9 279.6 99.987556 0.160 0.162 Oct. 08 91 92,735.1 32,000.1 30,495.6 1,304.5 99.951972 0.190 0.193 2010 Jan. 07 182 101,616.8 31,000.1 29,729.2 970.8 99.855917 0.285 0.289July 16 ................. 2009 Aug. 13 28 124,541.3 40,285.4 33,505.3 295.0 99.987944 0.155 0.157 Oct. 15 91 118,035.2 32,000.9 30,494.6 1,306.3 99.954500 0.180 0.183 2010 Jan. 14 182 92,255.9 30,000.0 28,634.2 1,005.9 99.863500 0.270 0.274July 23 ................. 2009 Aug. 20 28 120,649.3 33,418.7 30,689.5 311.2 99.988333 0.150 0.152 Oct. 22 91 107,230.0 32,000.6 30,191.3 1,459.3 99.951972 0.190 0.193 2010 Jan. 21 182 111,720.6 31,000.1 29,576.3 1,123.8 99.855917 0.285 0.289July 30 ................. 2009 Aug. 27 28 112,015.7 35,938.0 28,744.6 298.1 99.989889 0.130 0.132 Oct. 29 91 108,949.9 32,001.3 29,581.7 1,465.1 99.951972 0.190 0.193 2010 Jan. 28 182 120,027.4 31,000.1 29,121.8 996.7 99.860972 0.275 0.279Aug. 06 ................ 2009 Sept. 03 28 120,796.5 34,782.1 30,740.4 260.1 99.988722 0.145 0.147 Nov. 05 91 120,009.5 31,000.3 29,295.7 1,404.4 99.954500 0.180 0.183 2010 Feb. 04 182 101,690.0 31,000.3 29,677.9 1,097.4 99.860972 0.275 0.279Aug. 13 ................ 2009 Sept. 10 28 125,602.4 41,285.7 34,714.0 286.7 99.988333 0.150 0.152 Nov. 12 91 117,039.1 33,001.0 31,538.6 1,362.3 99.953236 0.185 0.188 2010 Feb. 11 182 108,180.7 31,000.4 29,583.1 1,017.3 99.855917 0.285 0.289Aug. 20 ................ 2009 Sept. 17 28 117,159.3 34,418.1 31,574.0 326.1 99.990278 0.125 0.127 Nov. 19 91 114,398.1 31,000.5 29,300.7 1,449.9 99.954500 0.180 0.183 2010 Feb. 18 182 111,061.6 30,000.4 28,510.8 1,064.6 99.863500 0.270 0.274Aug. 27 ................ 2009 Sept. 24 28 114,408.7 35,938.4 28,688.8 311.7 99.990667 0.120 0.122 Nov. 27 92 120,545.2 31,000.4 28,710.2 1,290.2 99.959111 0.160 0.162 2010 Feb. 25 182 104,675.6 30,000.1 28,096.0 907.5 99.871083 0.255 0.259Sept. 03 ............... 2009 Oct. 01 28 109,723.7 29,781.9 25,507.4 293.0 99.993389 0.085 0.086 Dec. 03 91 118,063.7 30,000.8 28,455.5 1,245.3 99.962083 0.150 0.152 2010 Mar. 04 182 111,227.1 29,000.5 27,459.8 1,065.7 99.878667 0.240 0.244Sept. 10 ............... 2009 Oct. 08 28 104,985.1 28,285.6 21,741.5 259.0 99.993000 0.090 0.091 Dec. 10 91 104,381.5 29,000.5 27,545.2 1,252.1 99.964611 0.140 0.142 2010 Mar. 11 182 101,420.9 29,000.3 27,933.4 867.0 99.886250 0.225 0.228Sept. 17 ............... 2009 Oct. 15 28 87,762.4 17,418.4 14,676.5 323.9 99.997667 0.030 0.030 Dec. 17 91 124,406.7 29,000.1 27,617.6 1,282.5 99.965875 0.135 0.137 2010 Mar. 18 182 124,346.5 29,000.6 27,515.9 1,034.7 99.893833 0.210 0.213Sept. 24 ............... 2009 Oct. 22 28 88,753.9 21,938.2 14,684.7 315.4 99.996889 0.040 0.041 Dec. 24 91 119,470.6 29,000.2 26,751.9 1,329.3 99.974722 0.100 0.101 2010 Mar. 25 182 109,179.7 29,000.5 27,052.3 948.2 99.903944 0.190 0.193
1 All 4-week and 13-week bills represent additional issues of bills with an original maturity of 26 weeks or 52 weeks. Certain 26-week bills represent additional issues of bills with an original maturity of 52 weeks. 2 Includes amount awarded to the Federal Reserve System.
3 Tenders for $1 million or less from any one bidder are accepted in full at the high price of accepted competitive bids. However, as of September 21, 2004, the limit was raised to $5 million. All Treasury marketable auctions are conducted in a single-price format as of November 2, 1998. 4 Equivalent coupon-issue yield.

PUBLIC DEBT OPERATIONS
December 2009
45
TABLE PDO-2.—Offerings of Marketable Securities Other than Regular Weekly Treasury Bills
[In millions of dollars. Source: Bureau of the Public Debt, Office of Financing]
Auction date Issue date
(1) Description of securities 1
(2)
Period to final maturity (years, months, days) 2
(3)
Amount tendered
(4)
Amount accepted 3, 4
(5)
Accepted yield and equivalent price
for notes and bonds
(6)
06/30/09 07/02/09 0.545% bill—07/01/10 364d 79,361 27,000 07/01/09 07/06/09 0.540% bill—06/10/10 339d 82,191 30,000 07/06/09 07/15/09 1-7/8% TIPS—07/15/19-D 10y 20,226 8,135 1.920 - 99.592335 07/07/09 07/15/09 1-1/2% note—07/15/12-AA 3y 92,164 35,592 1.519 - 99.944485 07/08/09 07/15/09 3-1/8% note—05/15/19-C 9y 10m 62,717 19,322 3.365 - 97.998772 07/09/09 07/15/09 4-1/4% bond—05/15/39 29y 10m 26,120 11,186 4.303 - 99.104142 07/15/09 07/16/09 0.185% bill—09/24/09 70d 111,875 35,000 07/22/09 07/23/09 0.180% bill—10/01/09 70d 126,162 35,000 07/24/09 07/30/09 0.185% bill—10/08/09 70d 126,704 30,000 07/28/09 07/30/09 0.470% bill—07/29/10 364d 106,748 27,000 07/27/09 07/31/09 2-1/2% TIPS—01/15/29 19y 6m 13,748 6,150 2.387 - 101.340316 07/28/09 07/31/09 1% note—07/31/11-AA 2y 116,664 43,052 1.080 - 99.842137 07/29/09 07/31/09 2-5/8% note—07/31/14 -P 5y 75,992 39,977 2.689 - 99.702444 07/30/09 07/31/09 3-1/4% note—07/31/16-M 7y 74,287 28,701 3.369 - 99.263422 08/05/09 08/06/09 0.185% bill—10/15/09 70d 115,997 35,000 08/07/09 08/13/09 0.185% bill—10/22/09 70d 135,930 35,000 08/11/09 08/17/09 1-3/4% note—08/15/12-AB 3y 112,706 42,715 1.780 - 99.912808 08/12/09 08/17/09 3-5/8% note—08/15/19-E 10y 60,815 26,552 3.734 - 99.097347 08/13/09 08/17/09 4-1/2% bond—08/15/39 30y 40,349 17,317 4.541 - 99.331386 08/13/09 08/18/09 0.445% bill—06/17/10 303d 118,250 36,001 08/19/09 08/20/09 0.145% bill—10/29/09 70d 142,306 30,000 08/25/09 08/27/09 0.460% bill—08/26/10 364d 92,950 27,000 08/25/09 08/31/09 1% note—08/31/11-AB 2y 113,918 43,264 1.119 - 99.765292 08/26/09 08/31/09 2-3/8% note—08/31/14-Q 5y 98,869 40,174 2.494 - 99.443852 08/27/09 08/31/09 3% note—08/31/16-N 7y 77,565 28,843 3.092 - 99.424898 09/03/09 09/10/09 0.385% bill—07/15/10 308d 110,662 29,000 09/08/09 09/15/09 1-3/8% note—09/15/12-AC 3y 115,018 38,080 1.487 - 99.672573 09/09/09 09/15/09 3-5/8% note—08/15/19-E 9y 11m 55,459 20,042 3.510 - 100.951686 09/10/09 09/15/09 4-1/2% bond—08/15/39 29y 11m 35,017 12,025 4.238 - 104.412534 09/22/09 09/24/09 0.405% bill—09/23/10 364d 84,435 27,000 09/22/09 09/30/09 1% note—09/30/11-AC 2y 139,601 43,762 1.034 - 99.932870 09/23/09 09/30/09 2-3/8% note—09/30/14-R 5y 96,690 40,709 2.470 - 99.555732 09/24/09 09/30/09 3% note—09/30/16-P 7y 81,333 29,514 3.005 - 99.968647
1 Currently, all issues are sold at auction. For bill issues, the rate shown is the high bank discount rate. For note and bond issues, the rate shown is the interest rate. For details of bill offerings, see table PDO-2. As of October 1, 1997, all Treasury issues of notes and bonds are eligible for STRIPS. 2 From date of additional issue in case of a reopening. 3 In reopenings, the amount accepted is in addition to the amount of original offerings.
4 Includes securities issued to the Federal Reserve System; and to foreign and international monetary authorities, whether in exchange for maturing securities or for new cash. Note.—Amounts listed as tendered and accepted are amounts tendered and awarded on auction day.

December 2009
46
INTRODUCTION: Ownership of Federal Securities Federal securities presented in the following tables are
public debt securities such as savings bonds, bills, notes, and bonds that the Treasury issues. The tables also detail debt issued by other Federal agencies under special financing authorities. [See the Federal debt (FD) tables for a more complete description of the Federal debt.]
Effective January 1, 2001, Treasury’s Bureau of the Public Debt revised formats, titles, and column headings in the “Monthly Statement of the Public Debt of the United States,” Table I: Summary of Treasury Securities Outstanding and Table II: Statutory Debt Limit. These changes should reduce confusion and bring the publication more in line with the public’s use of terms.
Treasury’s Financial Management Service (FMS) compiles data in the “Treasury Bulletin” table OFS-1 from the “Monthly Statement of the Public Debt of the United States.” Effective June 2001, FMS revised procedures and categories in this table to agree with the Bureau of the Public Debt’s publication changes.
• Table OFS-1 presents Treasury marketable and nonmarketable securities and debt issued by other Federal agencies held by Government accounts, the FRBs, and private investors. Social Security and Federal retirement trust fund investments comprise much of the Government account holdings.
The FRBs acquire Treasury securities in the market as a means of executing monetary policy.
• Table OFS-2 presents the estimated ownership of U.S. Treasury securities. Information is primarily obtained from the Federal Reserve Board of Governors Flow of Funds data, Table L209. State, local, and foreign holdings include special issues of nonmarketable securities to municipal entities and foreign official accounts. They also include municipal, foreign official, and private holdings of marketable Treasury securities. (See footnotes to the table for description of investor categories.)
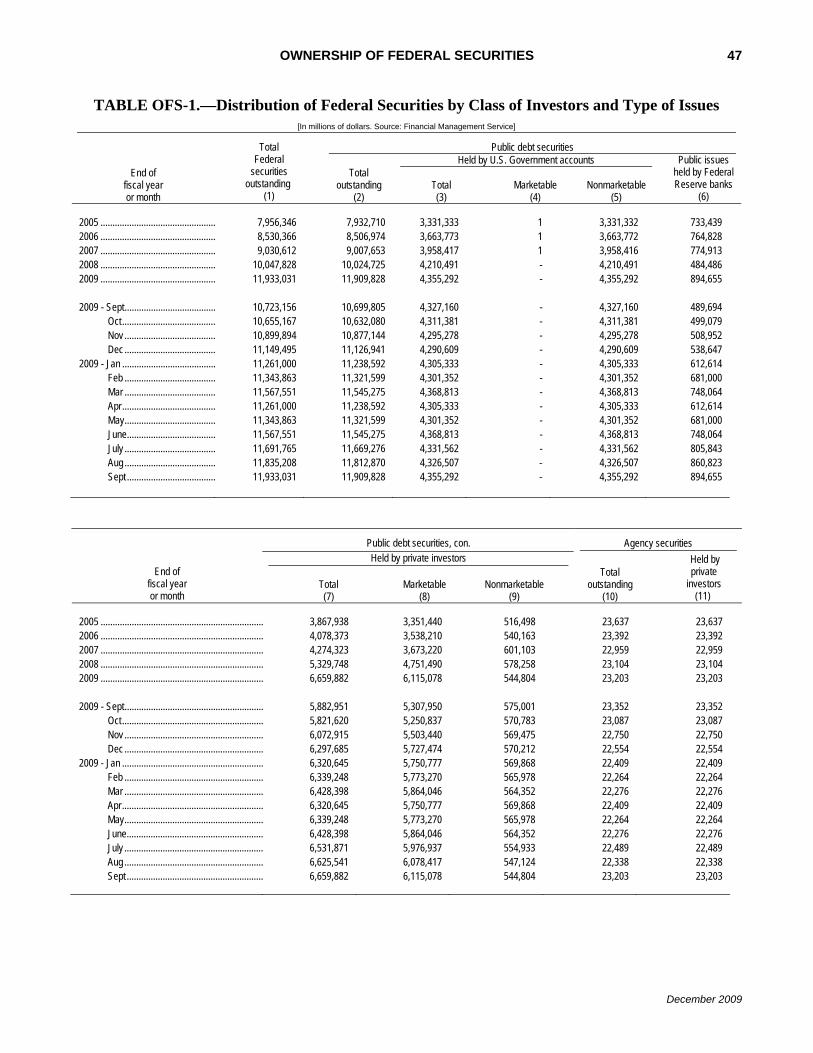
OWNERSHIP OF FEDERAL SECURITIES
December 2009
47
TABLE OFS-1.—Distribution of Federal Securities by Class of Investors and Type of Issues [In millions of dollars. Source: Financial Management Service]
Public debt securities Held by U.S. Government accounts
End of fiscal year or month
Total Federal
securities outstanding
(1)
Total outstanding
(2)
Total (3)
Marketable
(4)
Nonmarketable
(5)
Public issues held by Federal Reserve banks
(6) 2005 ................................................ 7,956,346 7,932,710 3,331,333 1 3,331,332 733,439 2006 ................................................ 8,530,366 8,506,974 3,663,773 1 3,663,772 764,828 2007 ................................................ 9,030,612 9,007,653 3,958,417 1 3,958,416 774,913 2008 ................................................ 10,047,828 10,024,725 4,210,491 - 4,210,491 484,486 2009 ................................................ 11,933,031 11,909,828 4,355,292 - 4,355,292 894,655 2009 - Sept...................................... 10,723,156 10,699,805 4,327,160 - 4,327,160 489,694
Oct....................................... 10,655,167 10,632,080 4,311,381 - 4,311,381 499,079 Nov ...................................... 10,899,894 10,877,144 4,295,278 - 4,295,278 508,952 Dec ...................................... 11,149,495 11,126,941 4,290,609 - 4,290,609 538,647
2009 - Jan ....................................... 11,261,000 11,238,592 4,305,333 - 4,305,333 612,614 Feb ...................................... 11,343,863 11,321,599 4,301,352 - 4,301,352 681,000 Mar ...................................... 11,567,551 11,545,275 4,368,813 - 4,368,813 748,064 Apr....................................... 11,261,000 11,238,592 4,305,333 - 4,305,333 612,614 May...................................... 11,343,863 11,321,599 4,301,352 - 4,301,352 681,000 June..................................... 11,567,551 11,545,275 4,368,813 - 4,368,813 748,064 July ...................................... 11,691,765 11,669,276 4,331,562 - 4,331,562 805,843 Aug ...................................... 11,835,208 11,812,870 4,326,507 - 4,326,507 860,823 Sept ..................................... 11,933,031 11,909,828 4,355,292 - 4,355,292 894,655
Public debt securities, con. Agency securities Held by private investors
End of fiscal year or month
Total (7)
Marketable (8)
Nonmarketable (9)
Total outstanding
(10)
Held by private
investors (11)
2005 .................................................................... 3,867,938 3,351,440 516,498 23,637 23,637 2006 .................................................................... 4,078,373 3,538,210 540,163 23,392 23,392 2007 .................................................................... 4,274,323 3,673,220 601,103 22,959 22,959 2008 .................................................................... 5,329,748 4,751,490 578,258 23,104 23,104 2009 .................................................................... 6,659,882 6,115,078 544,804 23,203 23,203 2009 - Sept.......................................................... 5,882,951 5,307,950 575,001 23,352 23,352
Oct........................................................... 5,821,620 5,250,837 570,783 23,087 23,087 Nov .......................................................... 6,072,915 5,503,440 569,475 22,750 22,750 Dec .......................................................... 6,297,685 5,727,474 570,212 22,554 22,554
2009 - Jan ........................................................... 6,320,645 5,750,777 569,868 22,409 22,409 Feb .......................................................... 6,339,248 5,773,270 565,978 22,264 22,264 Mar .......................................................... 6,428,398 5,864,046 564,352 22,276 22,276 Apr........................................................... 6,320,645 5,750,777 569,868 22,409 22,409 May.......................................................... 6,339,248 5,773,270 565,978 22,264 22,264 June......................................................... 6,428,398 5,864,046 564,352 22,276 22,276 July .......................................................... 6,531,871 5,976,937 554,933 22,489 22,489 Aug .......................................................... 6,625,541 6,078,417 547,124 22,338 22,338 Sept ......................................................... 6,659,882 6,115,078 544,804 23,203 23,203

OWNERSHIP OF FEDERAL SECURITIES
December 2009
48
TABLE OFS-2.—Estimated Ownership of U.S. Treasury Securities [In billions of dollars. Source: Office of Debt Management, Office of the Under Secretary for Domestic Finance]
Pension funds 3
End of month
Total public debt 1
(1)
Federal Reserve and Intragovern-
mental Holdings 2
(2)
Total privately
held (3)
Depository institutions 3, 4 (4)
U.S. savings bonds 5
(5) Private 6
(6)
State and local
governments (7)
Insurance compa- nies 3 (8)
Mutual funds 3, 7
(9)
State and local
govern- ments 3
(10)
Foreign and inter- national 8 (11)
Other investors 9
(12) 2000 - Mar......... 5,773.4 2,590.6 3,182.8 237.7 185.3 150.2 196.9 120.0 222.3 306.3 1,106.9 657.2 June ....... 5,685.9 2,698.6 2,987.3 222.2 184.6 149.0 194.9 116.5 205.4 309.3 1,082.0 523.5 Sept ........ 5,674.2 2,737.9 2,936.3 220.5 184.3 147.9 185.5 113.7 207.8 307.9 1,057.9 510.8 Dec......... 5,662.2 2,781.8 2,880.4 201.5 184.8 145.0 179.1 110.2 225.7 310.0 1,034.2 490.0 2001 - Mar......... 5,773.7 2,880.9 2,892.8 188.0 184.8 153.4 177.3 109.1 225.3 316.9 1,029.9 508.1 June ....... 5,726.8 3,004.2 2,722.6 188.1 185.5 148.5 183.1 108.1 221.0 324.8 1,000.5 363.1 Sept ........ 5,807.5 3,027.8 2,779.7 189.1 186.4 149.9 166.8 106.8 234.1 321.2 1,005.5 419.8 Dec......... 5,943.4 3,123.9 2,819.5 181.5 190.3 145.8 155.1 105.7 261.9 328.4 1,051.2 399.6 2002 - Mar......... 6,006.0 3,156.8 2,849.2 187.6 191.9 152.7 163.3 114.0 266.1 327.6 1,067.1 378.9 June ....... 6,126.5 3,276.7 2,849.8 204.7 192.7 152.1 153.9 122.0 253.8 333.6 1,135.4 301.5 Sept ........ 6,228.2 3,303.5 2,924.8 209.3 193.3 154.5 156.3 130.4 256.8 338.6 1,200.8 284.8 Dec......... 6,405.7 3,387.2 3,018.5 222.6 194.9 153.8 158.9 139.7 281.0 354.7 1,246.8 266.2 2003 - Mar......... 6,460.8 3,390.8 3,069.9 153.6 196.9 165.8 162.1 139.5 296.6 350.0 1,286.3 319.1 June ....... 6,670.1 3,505.4 3,164.7 145.4 199.1 170.2 161.3 138.7 302.3 347.9 1,382.8 317.0
Sept ........ 6,783.2 3,515.3 3,268.0 147.0 201.5 167.7 155.5 137.4 287.1 357.7 1,454.2 360.0 Dec......... 6,998.0 3,620.1 3,377.9 153.3 203.8 172.1 148.6 136.5 280.8 364.2 1,533.0 385.4 2004 - Mar......... 7,131.1 3,628.3 3,502.8 162.9 204.4 169.8 143.6 141.0 280.8 374.1 1,677.1 349.1 June ....... 7,274.3 3,742.8 3,531.5 158.7 204.6 173.3 134.9 144.1 258.7 381.2 1,739.6 336.3 Sept........ 7,379.1 3,772.0 3,607.0 138.5 204.1 173.9 140.8 147.4 255.0 381.7 1,798.7 366.9 Dec......... 7,596.1 3,905.6 3,690.6 125.0 204.4 173.7 151.0 149.7 254.1 389.1 1,853.4 390.1
2005 - Mar......... 7,776.9 3,921.6 3,855.4 141.8 204.2 177.4 158.0 152.4 261.1 412.0 1,956.3 392.2 June ....... 7,836.5 4,033.5 3,803.0 127.0 204.2 181.0 171.3 155.0 248.7 444.0 1,879.6 392.3 Sept........ 7,932.7 4,067.8 3,864.9 125.4 203.6 184.4 164.8 159.0 244.7 467.6 1,930.6 384.8 Dec......... 8,170.4 4,199.8 3,970.6 117.2 205.1 184.9 153.8 160.4 251.3 481.4 2,036.0 380.4
2006 - Mar......... 8,371.2 4,257.2 4,114.0 115.4 206.0 186.6 153.0 161.3 248.7 486.1 2,084.5 472.4 June ....... 8,420.0 4,389.2 4,030.8 117.4 205.5 192.1 150.9 161.2 244.2 499.4 1,979.8 480.2 Sept ........ 8,507.0 4,432.8 4,074.2 113.8 203.7 202.0 155.6 160.6 235.7 502.1 2,027.3 473.4 Dec......... 8,680.2 4,558.1 4,122.1 115.1 202.4 207.5 157.1 159.0 250.7 516.9 2,105.0 408.4 2007 - Mar......... 8,849.7 4,576.6 4,273.1 119.9 200.3 221.8 159.2 150.8 264.5 535.0 2,196.7 424.9 June ....... 8,867.7 4,715.1 4,152.6 110.6 198.6 232.5 160.2 142.1 267.7 550.3 2,193.9 296.6 Sept........ 9,007.7 4,738.0 4,269.7 119.8 197.1 246.4 165.6 133.4 306.3 541.4 2,237.2 322.3 Dec......... 9,229.2 4,833.5 4,395.7 129.9 196.5 257.6 168.8 123.3 362.9 531.5 2,352.9 272.2
2008 - Mar......... 9,437.6 4,694.7 4,742.9 127.4 195.4 270.3 169.4 129.2 484.4 523.6 2,507.5 335.6 June ....... 9,492.0 4,685.8 4,806.2 114.9 195.0 276.7 169.1 135.1 477.2 522.2 2,587.2 328.8 Sept ........ 10,024.7 4,692.7 5,332.0 130.5 194.3 291.7 171.6 140.6 656.1 535.7 2,799.5 412.1 Dec......... 10,699.8 4,806.4 5,893.4 107.6 194.1 297.2 174.6 145.5 768.8 522.7 3,076.3 606.6 2009 - Mar......... 11,126.9 4,785.2 6,341.7 130.9 194.0 306.0 173.2 154.7 715.9 526.3 3,264.7 876.0 June ....... 11,545.3 5,026.8 6,518.5 145.4 193.6 312.5 177.7 162.2 694.5 528.3 3,382.1 922.2 Sept ........ 11,909.8 5,127.1 6,782.7 n.a. 192.5 n.a. n.a. n.a. n.a. n.a. 3,497.0 n.a.
1 Source: “Monthly Statement of the Public Debt of the United States (MSPD).” Face value. 2 Sources: Federal Reserve Bulletin, table 1.18, Federal Reserve banks, statement of condition, for System Open Market Accounts; and the U. S. Treasury MSPD for intragovernmental holdings. Federal Reserve holdings exclude Treasury securities held under repurchase agreements. 3 Source: Federal Reserve Board of Governors, Flow of Funds Table L.209. 4 Includes commercial banks, savings institutions, and credit unions. 5 Source: “Monthly Statement of the Public Debt of the United States.” Current accrual value. 6 Includes U.S. Treasury securities held by the Federal Employees Retirement System Thrift Savings Plan "G Fund."
7 Includes money market mutual funds, mutual funds, and closed-end investment companies. 8 Source: Federal Reserve Board Treasury International Capital Survey. Includes nonmarketable foreign series, Treasury securities, and Treasury deposit funds. Excludes Treasury securities held under repurchase agreements in custody accounts at the Federal Reserve Bank of New York. For additional information see: http://www.treas.gov/tic/ticsec2.shtml. 9 Includes individuals, Government-sponsored enterprises, brokers and dealers, bank personal trusts and estates, corporate and non-corporate businesses, and other investors.

December 2009
49
INTRODUCTION: Market YieldsThe table in this section presents yields on Treasury
marketable securities for maturities ranging from 1 month to 30 years.
Table MY-1 lists Treasury market bid yields at constant maturities for bills, notes, and bonds. These Constant Maturity Treasury rates (CMTs) are interpolated from the Treasury yield curve and published daily at Treasury’s Domestic Finance web site, www.ustreas.gov/offices/domestic-finance/debt-management/interest-rate/yield.shtml. The yield curve is fitted daily using a hermite cubic spline. For inputs, Treasury primarily uses the bid yields of the on-the-run securities (most recently auctioned Treasury securities in all maturity tranches that Treasury currently auctions) as
quoted in the secondary bond market as of approximately 3:30 p.m. each trading day. CMT yields are based on semiannual interest payments and are read at constant maturity points to develop a consistent data series.
The quotations used by Treasury to calculate the bid yields and fit the yield curve are obtained by the Federal Reserve Bank of New York. The Board of Governors of the Federal Reserve System also publishes the Treasury constant maturity data series in its weekly Statistical Release H.15.
Treasury discontinued the 30-year constant maturity yield during the time period February 18, 2002, through February 8, 2006. Thus, 30-year yields for that time frame are not available.
TABLE MY-1.—Treasury Market Bid Yields at Constant Maturities: Bills, Notes, and Bonds*
[In percentages. Source: Office of Debt Management, Office of the Under Secretary for Domestic Finance]
Period 1-mo.
(1) 3-mo.
(2) 6-mo.
(3) 1-yr. (4)
2-yr. (5)
3-yr. (6)
5-yr. (7)
7-yr. (8)
10-yr. (9)
20-yr. (10)
30-yr. (11)
Monthly average: 2008 - Oct ...................................... 0.29 0.69 1.23 1.42 1.61 1.86 2.73 3.19 3.81 4.45 4.17
Nov .................................... 0.09 0.19 0.74 1.07 1.21 1.51 2.29 2.82 3.53 4.27 4.00 Dec .................................... 0.03 0.03 0.26 0.49 0.82 1.07 1.52 1.89 2.42 3.18 2.87
2009 - Jan...................................... 0.05 0.13 0.30 0.44 0.81 1.13 1.60 1.98 2.52 3.46 3.13 Feb..................................... 0.22 0.30 0.46 0.62 0.98 1.37 1.87 2.30 2.87 3.83 3.59 Mar..................................... 0.10 0.22 0.43 0.64 0.93 1.31 1.82 2.42 2.82 3.78 3.64 Apr ..................................... 0.10 0.16 0.35 0.55 0.93 1.32 1.86 2.47 2.93 3.84 3.76 May .................................... 0.14 0.18 0.30 0.50 0.93 1.39 2.13 2.81 3.29 4.22 4.23 June ................................... 0.10 0.18 0.31 0.51 1.18 1.76 2.71 3.37 3.72 4.51 4.52 July .................................... 0.15 0.18 0.28 0.48 1.02 1.55 2.46 3.14 3.56 4.38 4.41 Aug .................................... 0.12 0.17 0.27 0.46 1.12 1.65 2.57 3.21 3.59 4.33 4.37 Sept ................................... 0.06 0.12 0.21 0.40 0.96 1.48 2.37 3.02 3.40 4.14 4.19
End of month: 2008 - Oct ...................................... 0.12 0.46 0.94 1.34 1.56 1.80 2.80 3.29 4.01 4.74 4.35
Nov .................................... 0.02 0.01 0.44 0.90 1.00 1.27 1.93 2.35 2.93 3.71 3.45 Dec .................................... 0.11 0.11 0.27 0.37 0.76 1.00 1.55 1.87 2.25 3.05 2.69
2009 - Jan...................................... 0.15 0.24 0.36 0.51 0.94 1.32 1.85 2.27 2.87 3.86 3.58 Feb..................................... 0.16 0.26 0.45 0.72 1.00 1.40 1.99 2.69 3.02 3.98 3.71 Mar..................................... 0.17 0.21 0.43 0.57 0.81 1.15 1.67 2.28 2.71 3.61 3.56 Apr ..................................... 0.04 0.14 0.29 0.49 0.91 1.38 2.02 2.70 3.16 4.10 4.05 May .................................... 0.14 0.14 0.30 0.47 0.92 1.42 2.34 3.06 3.47 4.34 4.34 June ................................... 0.17 0.19 0.35 0.56 1.11 1.64 2.54 3.19 3.53 4.30 4.32 July .................................... 0.14 0.18 0.26 0.48 1.13 1.62 2.53 3.14 3.52 4.29 4.31 Aug .................................... 0.11 0.15 0.24 0.43 0.97 1.49 2.39 3.03 3.40 4.14 4.18 Sept ................................... 0.06 0.14 0.18 0.40 0.95 1.45 2.31 2.93 3.31 4.02 4.03
* Rates are from the Treasury yields curve.

December 2009
50
INTRODUCTION: U.S. Currency and Coin Outstanding and in Circulation The U.S. Currency and Coin Outstanding and in
Circulation (USCC) statement informs the public of the total face value of currency and coin used as a medium of exchange that is in circulation at the end of a given accounting month. The statement defines the total amount of currency and coin outstanding and the portion deemed to be in circulation. It includes some old and current rare issues that do not circulate or that may do so to a limited extent. Treasury includes them in the statement because the issues were originally intended for general circulation.
The USCC statement provides a description of the various issues of paper money. It also gives an estimated average of currency and coin held by each individual, using estimates of population from the Bureau of the Census. USCC information has been published by Treasury since 1888, and was published separately until 1983, when it was incorporated into the “Treasury Bulletin.” The USCC comes from monthly reports compiled by Treasury offices, U.S. Mint offices, the Federal Reserve banks (FRBs), and the Federal Reserve Board.
TABLE USCC-1.—Amounts Outstanding and in Circulation, September 30, 2009 [Source: Financial Management Service]
Currency
Total currency and coin
(1) Total currency
(2) Federal Reserve notes 1
(3) U.S. notes
(4)
Currency no longer issued
(5)
Amounts outstanding .............................. $1,105,601,624,832 $1,063,523,306,425 $1,063,038,084,744 $240,938,066 $244,283,615
Less amounts held by:
The Treasury....................................... 260,719,879 15,054,981 15,000,855 7,505 46,621
FRBs ................................................... 191,522,540,294 189,541,066,612 189,541,047,461 - 19,151
Amounts in circulation............................. $913,818,364,659 $873,967,184,832 $873,482,036,428 $240,930,561 $244,217,843
Coins 2 Total (1)
Dollars 3 (2)
Fractional coins
(3)
Amounts outstanding .............................. $42,078,318,407 $5,344,749,008 $36,733,569,399
Less amounts held by:
The Treasury....................................... 245,664,898 191,190,816 54,474,082
FRBs ................................................... 1,981,473,682 808,161,919 1,173,311,763
Amounts in circulation............................. $39,851,179,827 $4,345,396,273 $35,505,783,554
See footnotes following table USCC-2.
U.S. CURRENCY AND COIN OUTSTANDING AND IN CIRCULATION
December 2009
51
TABLE USCC-2.—Amounts Outstanding and in Circulation, September 30, 2009 [Source: Financial Management Service]
Currency in circulation by denomination Total (1)
Federal Reserve notes 1 (2)
U.S. notes (3)
Currency no longer issued
(4)
$1 ................................................................................ $9,308,810,593 $9,166,172,556 $143,503 $142,494,534
$2 ................................................................................ 1,694,299,784 1,562,201,642 132,085,518 12,624
$5 ................................................................................ 10,654,731,615 10,519,499,600 108,680,310 26,551,705
$10 .............................................................................. 15,362,212,350 15,341,308,060 6,300 20,897,990
$20 .............................................................................. 121,927,743,540 121,907,635,020 3,840 20,104,680
$50 .............................................................................. 63,110,297,150 63,098,796,150 500 11,500,500
$100 ............................................................................ 651,595,932,700 651,573,936,400 -6 21,996,300
$500 ............................................................................ 142,262,500 142,056,000 5,500 201,000
$1,000 ......................................................................... 165,604,000 165,361,000 5,000 238,000
$5,000 ......................................................................... 1,780,000 1,710,000 - 70,000
$10,000 ....................................................................... 3,510,000 3,360,000 - 150,000
Fractional notes 4 ........................................................ 600 - 90 510
Total currency ......................................................... $873,967,184,832 $873,482,036,428 $240,930,561 $244,217,843
Comparative totals of currency and coins in circulation—selected dates Amounts (in millions)
(1) Per capita 5
(2)
Sept. 30, 2009...................................................................................... 913,818 $2,969
Aug. 31, 2009....................................................................................... 910,284 2,961
July 31, 2009........................................................................................ 909,731 2,961
Sept. 30, 2005...................................................................................... 766,487 2,578
Sept. 30, 2000...................................................................................... 568,614 2,061
Sept. 30, 1995...................................................................................... 409,272 1,553
Sept. 30, 1990...................................................................................... 278,903 1,105
Sept. 30, 1985...................................................................................... 187,337 782
Sept. 30, 1980...................................................................................... 129,916 581
June 30, 1975 ...................................................................................... 81,196 380
June 30, 1970 ...................................................................................... 54,351 265
June 30, 1965 ...................................................................................... 39,719 204
June 30, 1960 ...................................................................................... 32,064 177
June 30, 1955 ...................................................................................... 30,229 183 1 Issued on or after July 1, 1929. 2 Excludes coins sold to collectors at premium prices. 3 Includes $481,781,898 in standard silver dollars.
4 Represents value of certain fractional denominations not presented for redemption. 5 Based on Bureau of the Census’ estimates of population. 6 Represents prior month adjustment.
International Financial StatisticsCapital Movements
Foreign Currency PositionsExchange Stabilization Fund

December 2009
55
INTRODUCTION: International Financial StatisticsThe tables in this section provide statistics on U.S.
Government reserve assets, liabilities to foreigners, and its international financial position. All monetary figures are in dollars or dollar equivalents.
• Table IFS-1 shows reserve assets of the United States, including its gold stock, special drawing rights held in the Special Drawing Account in the International Monetary Fund (IMF), holdings of convertible foreign currencies and reserve position in the IMF.
• Table IFS-2 contains statistics on liabilities to foreign official institutions, and selected liabilities to all other foreigners, which are used in the U.S. balance of payments statistics.
• Table IFS-3 shows nonmarketable bonds and notes that the Treasury issues to official institutions and other residents of foreign countries.
TABLE IFS-1.—U.S. Reserve Assets [In millions of dollars. Source: Treasury International Capital Reporting System]
End of calendar year or month
Total reserve assets 1
(1) Gold stock 2
(2)
Special drawing rights 1, 3
(3)
Foreign currencies 4
(4)
Reserve position in
International Monetary Fund 1, 5
(5)
2004 ................................................................................... 86,824 11,045 13,582 42,718 19,479 2005 ................................................................................... 65,127 11,043 8,210 37,838 8,036 2006 ................................................................................... 65,895 11,041 8,870 40,943 5,040 2007 ................................................................................... 70,565 11,041 9,476 45,804 4,244
2008 - Oct .......................................................................... 69,763 11,041 9,001 45,288 4,433
Nov ......................................................................... 73,378 11,041 9,023 45,970 7,344 Dec ......................................................................... 77,648 11,041 9,340 49,584 7,683
2009 - Jan .......................................................................... 75,364 11,041 9,047 47,595 7,680 Feb ......................................................................... 73,199 11,041 8,913 45,628 7,616 Mar ......................................................................... 74,958 11,041 9,082 46,634 8,201 Apr.......................................................................... 75,115 11,041 9,098 46,725 8,250 May......................................................................... 81,738 11,041 9,412 49,247 12,037 June........................................................................ 81,489 11,041 9,437 48,897 12,113 July ......................................................................... 82,931 11,041 9,444 49,876 12,571 Aug ......................................................................... 126,846 11,041 52,660 50,453 12,692 Sept ........................................................................ 134,296 11,041 57,945 51,840 13,470 Oct.......................................................................... 134,690 11,041 58,147 51,903 13,599
1 Beginning July 1974, the International Monetary Fund (IMF) adopted a technique for valuing the special drawing right (SDR) based on a weighted average of exchange rates for the currencies of selected member countries. The U.S. SDR holdings and reserve position in the IMF also are valued on this basis beginning July 1974. 2 Treasury values its gold stock at $42.2222 per fine troy ounce and pursuant to 31 United States Code 5117 (b) issues gold certificates to the Federal Reserve at the same rate against all gold held. 3 Includes allocations of SDRs in the Special Drawing Account in the IMF, plus or minus transactions in SDRs. Recent allocations are as follows: August 2009—$43,069 million and September 2009—$4,529 million.
4 Includes holdings of Treasury and Federal Reserve System; beginning November 1978, these are valued at current market exchange rates or, where appropriate, at such other rates as may be agreed upon by the parties to the transactions. Excludes outstanding reciprocal currency swaps with foreign central banks. At end-October 2009 swaps outstanding were $31.884 billion: $24.665 billion with the European Central Bank, $0.013 billion with the Bank of England, $0.935 billion with the Bank of Japan, $3.221 billion with the Bank of Mexico and $3.050 billion with the Bank of Korea. 5 The United States has the right to purchase foreign currencies equivalent to its reserve position in the IMF automatically if needed. Under appropriate conditions, the United States could purchase additional amounts related to the U.S. quota. Note.—Detail may not add to totals due to rounding.

INTERNATIONAL FINANCIAL STATISTICS
December 2009
56
TABLE IFS-2.—Selected U.S. Liabilities to Foreigners [In millions of dollars. Source: Treasury International Capital Reporting System]
Liabilities to foreign countries Official institutions 1
Liabilities to other foreigners
End of calendar year or month
Total (1)
Total (2)
Liabilities reported
by banks in United States
(3)
Marketable U.S.
Treasury bonds and
notes 2 (4)
Non-marketable
U.S. Treasury
bonds and
notes 3 (5)
Other readily
marketable liabilities 2, 4
(6)
Liabilities to
banks 5 (7)
Total (8)
Liabilities reported by banks
in the United States
(9)
Marketable U.S.
Treasury bonds and
notes 2, 6 (10)
Liabilities to non-
monetary interna-
tional and regional
organiza- tions 7 (11)
2000 ....................... 2,565,942 916,095 297,603 475,866 5,348 137,278 1,049,619 581,302 228,332 352,970 18,926 2001 ....................... 2,724,292 923,501 282,290 479,340 3,411 158,460 1,125,812 653,367 284,671 368,696 21,612 2002 - June 8 ......... 3,002,222 981,627 328,090 476,197 3,000 174,340 1,299,551 696,781 296,705 400,076 24,263 Series Break........... 3,003,380 1,039,702 328,090 556,603 3,000 152,009 1,299,551 642,437 296,705 345,732 21,690 2002 ....................... 3,235,231 1,075,034 335,090 566,895 2,769 170,280 1,382,628 750,877 325,764 425,113 26,692 2003 - June 8 .......... 3,586,765 1,169,600 379,114 601,767 2,876 185,843 1,431,589 957,712 452,617 505,095 27,864 Series Break........... 3,603,925 1,233,261 379,114 650,336 2,876 200,935 1,431,589 911,398 452,617 458,781 27,677 2003 ....................... 3,863,508 1,340,497 401,856 719,302 2,613 216,726 1,439,484 1,057,446 518,962 538,484 26,081 2004 - June 8 ......... 4,469,769 1,559,686 483,415 844,444 1,569 230,258 1,559,518 1,326,934 666,476 660,458 23,631 Series Break........... 4,407,294 1,648,167 483,415 910,456 1,569 252,727 1,559,518 1,169,285 666,476 502,809 30,324 2004 ....................... 4,819,747 1,775,080 515,586 986,454 1,630 271,409 1,677,951 1,336,538 805,483 531,055 30,178 2005 - June 8 ........ 5,071,533 1,821,338 493,704 1,030,763 911 295,960 1,791,611 1,424,082 776,836 647,246 34,502 Series Break .......... 5,066,404 1,957,191 493,704 1,077,953 911 384,623 1,791,611 1,272,697 776,836 495,861 44,905 2005 ....................... 5,371,689 2,012,633 498,510 1,102,333 948 410,842 1,895,920 1,415,705 769,564 646,141 47,431 2006 - June 8 ......... 6,067,606 2,070,222 493,689 1,112,617 986 462,930 2,189,215 1,747,236 1,041,237 705,999 60,933 Series Break .......... 6,056,316 2,275,684 493,689 1,211,819 986 569,190 2,189,215 1,536,930 1,041,237 495,693 54,487 2006 ....................... 6,500,815 2,372,146 461,656 1,271,174 1,026 638,290 2,415,205 1,663,272 1,102,362 560,910 50,192 2007 - June 8.......... 7,095,223 2,515,167 495,176 1,281,070 1,067 737,854 2,607,127 1,922,800 1,257,884 664,916 50,129 Series Break .......... 7,206,880 2,795,998 495,176 1,450,593 1,067 849,161 2,607,127 1,756,192 1,257,884 498,308 47,563 2007 ....................... 7,676,097 2,960,682 596,660 1,443,691 1,111 919,220 2,769,850 1,901,789 1,311,466 590,323 43,776 2008 - June ............ 7,983,481 3,098,974 573,913 1,523,888 1,155 1,000,017 2,581,158 2,260,912 1,544,903 716,009 42,437 Series Break .......... 8,009,073 3,330,189 573,913 1,683,160 1,155 1,071,960 2,581,158 2,053,862 1,544,903 508,959 43,864 2008 - Sept ............ 7,987,576 3,371,378 634,690 1,703,020 1,179 1,032,489 2,610,533 1,963,983 1,387,624 576,359 41,681
Oct .............. 8,215,945 3,386,622 667,018 1,701,936 1,187 1,016,481 2,879,987 1,907,363 1,296,528 610,835 41,972 Nov ............. 8,187,640 3,378,919 698,082 1,675,731 1,194 1,003,911 2,865,070 1,892,934 1,282,268 610,666 50,717 Dec ............. 8,107,066 3,383,242 707,875 1,679,582 1,203 994,582 2,764,608 1,905,528 1,283,039 622,489 53,688
2009 - Jan .............. 8,101,428 3,394,372 728,505 1,677,642 1,211 987,014 2,807,727 1,844,271 1,209,087 635,184 55,057 Feb ............. 7,977,035 3,407,591 746,910 1,675,683 1,218 983,780 2,693,158 1,822,866 1,164,080 658,786 53,419 Mar ............. 8,006,370 3,428,321 742,004 1,704,709 1,227 980,381 2,681,234 1,849,155 1,163,632 685,523 47,660 Apr .............. 8,009,907 3,440,561 739,177 1,721,834 1,234 978,315 2,668,678 1,858,208 1,147,898 710,310 42,460 May............. 8,037,879 3,463,565 785,472 1,700,071 1,243 976,779 2,680,848 1,853,487 1,143,520 709,967 39,978 June............ 7,949,982 3,465,693 771,374 1,722,569 1,251 970,499 2,544,814 1,903,101 1,115,500 787,601 36,373 July ............. 7,983,135 3,502,412 800,682 1,738,377 1,259 962,094 2,528,516 1,917,904 1,115,659 802,245 34,302 Aug. p ......... 8,052,147 3,503,601 790,416 1,751,561 1,268 960,356 2,597,436 1,917,714 1,100,021 817,693 33,395 Sept. p ........ 8,160,298 3,493,622 769,799 1,770,527 1,276 952,020 2,671,749 1,962,564 1,119,749 842,815 32,362
1 Includes Bank for International Settlements. 2 Derived by applying reported transactions to benchmark data. 3 Includes current value of zero-coupon Treasury bond issues to foreign governments as follows: Mexico, beginning March 1990, 30-year maturity issue; Venezuela, beginning December 1990, 30-year maturity issue; Argentina, beginning April 1993, 30-year maturity issue. Also, see footnotes to table IFS-3. 4 Includes debt securities of U.S. Government corporations, federally-sponsored agencies and private corporations. 5 Includes liabilities payable in dollars to foreign banks and liabilities payable in foreign currencies to foreign banks and to “other foreigners.” 6 Includes marketable U.S. Government bonds and notes held by foreign banks. 7 Principally the International Bank for Reconstruction and Development, the Inter-American Development Bank, and the Asian Development Bank.
8 Data on the two lines shown for this date reflect different benchmark bases for foreigners’ holdings of selected U.S. long-term securities. Figures on the first line are comparable to those for earlier dates; figures on the second line are based in part on benchmark surveys as of end-June 2002, end-June 2003, end-June 2004, end-June 2005, end-June 2006, end-June 2007, and end-June 2008 respectively, and are comparable to those shown for the following dates. Note.—Table is based on Treasury data and on data reported to the Treasury by banks, other depository institutions, and brokers in the United States. Data generally correspond to statistics following in this section and in the “Capital Movements” section. Table excludes International Monetary Fund “holdings of dollars” and holdings of U.S. Treasury letters of credit and nonnegotiable noninterest-bearing special U.S. notes held by international and regional organizations.

INTERNATIONAL FINANCIAL STATISTICS
December 2009
57
TABLE IFS-3.—Nonmarketable U.S. Treasury Bonds and Notes Issued to Official Institutions and Other Residents of Foreign Countries
[In millions of dollars. Source: Treasury International Capital Reporting System]
Payable in dollars
End of calendar year or month
Grand total (1)
Total (2)
Argentina 1 (3)
Venezuela 2 (4)
2004 .............................................................................. 1,630 1,630 825 805
2005 .............................................................................. 948 948 77 871
2006 .............................................................................. 1,026 1,026 82 944
2007 .............................................................................. 1,111 1,111 88 1,022
2008 - Sept.................................................................... 1,179 1,179 93 1,086
Oct ..................................................................... 1,187 1,187 94 1,093
Nov .................................................................... 1,194 1,194 94 1,100
Dec .................................................................... 1,203 1,203 95 1,108
2009 - Jan ..................................................................... 1,211 1,211 96 1,115
Feb..................................................................... 1,218 1,218 96 1,122
Mar..................................................................... 1,227 1,227 97 1,130
Apr ..................................................................... 1,234 1,234 97 1,137
May .................................................................... 1,243 1,243 98 1,145
June ................................................................... 1,251 1,251 98 1,152
July .................................................................... 1,259 1,259 99 1,160
Aug .................................................................... 1,268 1,268 100 1,168
Sept ................................................................... 1,276 1,276 100 1,176
1 Beginning April 1993, includes current value (principal and accrued interest) of zero-coupon, 30-year maturity Treasury bond issue to the government of Argentina. Remaining face value of issue is $264 million.
2 Beginning December 1990, indicates current value of zero-coupon, 30-year maturity Treasury bond issue to the Republic of Venezuela. Remaining face value of issue is $2,721 million.

December 2009
58
INTRODUCTION: Capital Movements Background
Data relating to U.S. international transactions in financial instruments and to other portfolio capital movements between the United States and foreign countries have been collected in some form since 1935. This information is necessary for compiling the U.S. balance of payments accounts, for calculating the U.S. international investment position, and for use in formulating U.S. international financial and monetary policies.
From the beginning, reporting under the Treasury data collection program has been mandatory. Under the current Treasury International Capital (TIC) reporting system, an assortment of monthly and quarterly reports are filed with district Federal Reserve banks by commercial banks, securities dealers, other financial institutions, and nonbanking enterprises in the United States. These data are centrally processed and maintained at the Federal Reserve Bank of New York, which, along with the district banks, acts as fiscal agent for Treasury. Beginning in late 1998, the Federal Reserve Board also undertakes services on behalf of Treasury in support of the TIC data collection system. The TIC reports of individual respondents are treated as confidential, and access to the respondent level data is strictly limited to specific staff of Treasury and the Federal Reserve System.
Data derived from Treasury reports are published in the Capital Movements section of this quarterly Treasury Bulletin and are posted monthly on the TIC website, http://www.ustreas.gov/tic. (See NOTE at the end of the INTRODUCTION text for additional website information.)TIC data aggregates are also published in the Federal Reserve Bulletin and are used in the U.S. international transactions and investment position compilations published by the Department of Commerce in the Survey of Current Business.
Forms and instructions are developed with the cooperation of other Government agencies and the Federal Reserve System and in consultation with representatives of banks, securities firms, and nonbanking enterprises. Requests for public comments on proposed changes are published in the Federal Register, and any further modifications are based on the comments received. The most recent revisions to selected reporting forms and instructions were effective June 30, 2006. The reporting forms and instructions may be downloaded from the TIC website. Copies of the reporting forms and instructions also may be obtained from the Global Economics Group, Office of the Assistant Secretary for International Affairs, Treasury, Washington, D.C. 20220; the International Finance Division, Board of Governors of the Federal Reserve System, Washington, D.C. 20551; or district Federal Reserve banks.
Basic definitions The term “foreigner” as used in TIC reporting covers all
institutions and individuals resident outside the United States, including: U.S. citizens domiciled abroad; the foreign branches, subsidiaries and offices of U.S. banks and business concerns; the central governments, central banks, and other official institutions of foreign countries, wherever located; and international and regional organizations, wherever located. The term “foreigner” also includes persons in the United States to the extent that they are known by reporting institutions to be acting on behalf of foreigners.
In general, information is reported opposite the country or geographical area where the foreigner is located, as shown on records of reporting institutions. This information may not always reflect the ultimate ownership of assets. Reporting institutions are not required to go beyond addresses shown on their records and may not be aware of the actual country of domicile of the ultimate beneficiary.
Transactions with branches or agencies of foreign official institutions, wherever located, are reported opposite the country that has sovereignty over the institutions. Transactions with international and regional organizations are not reported opposite any single country, but are accounted for in regional groupings of such organizations. Effective beginning with data for June 2006, information pertaining to the Bank for International Settlements is now included with data for international organizations, and information for the European Central Bank is distributed across the individual euro-area countries. For prior dates, information for these organizations is included in “Other Europe”.
“Short-term” refers to obligations payable on demand or having an original maturity of one year or less. “Long-term” refers to obligations having an original maturity of more than one year and includes securities having no maturity.
Reporting coverage TIC reports are required from banks and other depository
institutions, bank/financial holding companies (BHCs/FHCs), securities brokers and dealers, and nonbanking concerns in the United States, including the branches, agencies, subsidiaries, and other affiliates in the United States of foreign banking and nonbanking firms. Institutions with total reportable liabilities, claims, or securities transactions below specified reporting thresholds are exempt from reporting.
Beginning in February 2003, substantial revisions to the coverage and formats of the TIC B-series and C-series forms were introduced. The reasons for the changes were to comply with new and expanded international standards for reporting data on portfolio investment; to reduce reporting burden; to clarify reporting concepts and instructions; and to improve the quality of the series by closing known gaps in the data.

CAPITAL MOVEMENTS
December 2009
59
Banks, other depository institutions, and securities brokers and dealers file monthly B-series reports covering their dollar liabilities to and dollar claims on foreigners in a number of countries. Quarterly reports are filed for liabilities and claims denominated in foreign currencies and for claims on foreigners held for respondents’ domestic customers. All positions are exclusive of long-term securities. Beginning January 2001, the exemption level applicable to the banking reports was raised from $15 million to $50 million. This exemption level is also subject to the provision that reportable amounts for any one country do not exceed $25 million.
Banks and other depository institutions, securities brokers and dealers, and other entities report their transactions with foreigners by country in long-term securities on monthly Form S. Respondents must report securities transactions with foreigners if their aggregate purchases or their aggregate sales amount to at least $50 million during the covered month.
TIC Form D is filed quarterly by all U.S. resident banks, securities dealers, and other firms with worldwide holding of derivatives in their own and in their customers’ accounts exceeding $100 billion in notional value. Data from this information collection was first released on May 15, 2007, with data on holdings beginning from end-December 2005, and data on net settlements beginning from the first quarter of 2006.
Quarterly reports are also filed by exporters, importers, industrial and commercial concerns, financial institutions (other than banks, other depository institutions, and securities firms), and other nonbanking enterprises on their liabilities and claims positions with unaffiliated foreigners. Separate reports are filed for financial balances and for commercial balances. Effective for reports filed as of March 31, 2003, the threshold applicable to Form CQ-1 for reporting financial liabilities to, and claims on, foreigners is $50 million, up from $10 million. At the same time, the reporting threshold for Form CQ-2, which covers commercial liabilities and claims positions with foreigners, was raised from $10 million to $25 million.
Effective with the reports filed for June 2006, the country coverage of the monthly TIC forms was expanded significantly and the semiannual reports, which covered the smaller market economies, were discontinued. Country coverage was also expanded for the quarterly banking forms, the Form S, the Form D, and the Forms CQ-1 and CQ-2, effective with reports filed for June 2006.
The data in these tables do not cover all types of reported capital movements between the United States and other countries. Except as noted in Section IV in “Description of statistics” below, the principal exclusions are the intercompany capital transactions of nonbanking business enterprises in the United States with their own branches and subsidiaries abroad or with their foreign parent companies (own foreign offices) and capital transactions of the U.S. Government. Consolidated data on all types of international
capital transactions are published by the Department of Commerce in its regular reports on the U.S. balance of payments.
Effective with the December 2009 Treasury Bulletin, a number of data reporters were reclassified in the TIC system as bank holding companies, beginning with the reports as of the third quarter of 2008. These data reporters are now included in the monthly bank-reported statistics and are no longer reporting as nonbanks.
Description of statistics Data collected on the TIC forms are published in the
“Capital Movements” tables in four sections. Each section contains all the data relevant to the same statistical series, with tables showing time series by type and country, and detailed breakdowns of the latest available data. The expansion of the country coverage on the standard report forms allows for publication of additional country detail for data beginning as of June 2006. As a result, the former Capital Movements Section III, which listed bank-reported claims and liabilities of selected countries from the semiannual reports, has been discontinued.
• Section I covers liabilities to foreigners reported by banks, other depository institutions, and securities brokers and dealers in the United States. BHCs/FHCs also report for all domestic nonbank, non-securities firm affiliates, other than their insurance affiliates, which report separately on the C-series forms. Dollar-denominated liabilities are reported monthly on Forms BL-1 and BL-2. Liabilities denominated in foreign currencies are reported quarterly on Form BQ-2. Respondents report certain of their own liabilities and a wide range of their custody liabilities to foreigners. Effective with reports filed as of February 28, 2003, coverage was broadened to cover the positions of U.S. broker-dealer respondents with their affiliated foreign offices. (Depository institutions and BHCs/FHCs already reported such positions.) The scope of the reports was also extended to include cross-border brokerage balances as well as offshore sweep accounts and loans to U.S. residents in “managed” foreign offices of U.S. reporting institutions. Additionally, in a new Part 2, Form BQ-2 was expanded to include the foreign currency-denominated liabilities held by respondents for their domestic customers. Further, banks’ own positions have been defined to be consistent with regulatory reports such as the FR 2950/2951 to include all amounts in the respondent’s “due to/due from” accounts, unless in an instrument that is specifically excluded. Finally, the columns for demand deposits and non-transactions accounts are now combined, as are short-term U.S. agency securities and other negotiable and readily transferable instruments.
• Section II presents claims on foreigners reported by banks, other depository institutions, and securities brokers and dealers in the United States. BHCs/FHCs also report for their domestic nonbank and non-securities firm affiliates, other than their insurance affiliates, which report

CAPITAL MOVEMENTS
December 2009
60
separately on the C-series forms. Data on respondents’ own dollar claims are collected monthly on Form BC. Information on claims held for domestic customers as well as on claims denominated in foreign currencies is collected on a quarterly basis only on Forms BQ-1 and BQ-2, respectively. Effective with reports filed as of February 28, 2003, reporting coverage was expanded as outlined in Section I. Additionally, columns were added for separate reporting of issued by foreigners. Further, the foreigner category, negotiable CDs and other short-term negotiable instruments issued by foreigners. Further, the foreigner category, “foreign official institutions,” replaced the former, broader category, “foreign public borrowers,” for consistency with the liabilities reporting on this sector.
• Section III (formerly reported as Section IV) shows the liabilities to, and claims on, unaffiliated foreigners of exporters, importers, industrial and commercial concerns, financial institutions (other than banks, other depository institutions, and securities brokers and dealers), and other nonbanking enterprises in the United States. Data exclude claims on foreigners held by banks in the United States.
Historically, the TIC reports CQ-1 and CQ-2 exclude accounts of nonbanking enterprises in the United States with their own branches and subsidiaries abroad or with their foreign parent companies. Such accounts with foreign affiliates are reported by business enterprises to Commerce on its direct investment forms. There was an exception when reporting of foreign affiliate positions of insurance underwriting subsidiaries and financial intermediaries was included in Section B of Form CQ-1 for reports between end-March 2003 and end-March 2006. That reporting requirement was discontinued with the reports beginning as of June 2006.
• Section IV (formerly Section V) contains information on transactions with foreigners in long-term domestic and foreign securities as reported by banks, securities brokers and dealers, and other entities in the United States. The data cover transactions executed in the United States for the accounts of foreigners and transactions executed abroad for the accounts of reporting institutions and their domestic customers. This includes transactions in newly-issued securities as well as transactions in, and redemptions of, outstanding issues. However, the data do not include nonmarketable Treasury bonds and notes shown in Table IFS-3.
The geographical allocation of the transactions data indicates the country of location of the foreign buyers and sellers who deal directly with reporting institutions in the United States. The data do not necessarily indicate the country of beneficial owner or issuer, or the currency of denomination of securities. For instance, a U.S. purchaser’s order for Japanese securities may be placed directly with an intermediary in London. In this instance, the transaction for Form S reporting purposes would be recorded opposite the
United Kingdom and not opposite Japan. Similarly, purchases and sales of U.S. securities for the account of an Italian resident may be placed, for example, in the Swiss market. In that case, the trades would be reported opposite Switzerland and not opposite Italy.
• Section V presents quarterly data on holdings and net cash settlements of cross-border derivatives contracts reported by banks, securities brokers, dealers, and nonfinancial companies in the U.S. with sizable holdings of derivatives contracts. Total holdings are divided between those contracts with positive fair values and those contracts with negative fair values from the perspective of the reporter. The fair (market) value is generally defined as the amount for which a derivative contract could be exchanged in a current transaction between willing parties, other than in a forced or liquidation sale.
The data on U.S. net settlements with foreign residents include all cash receipts and payments made during the quarter for the acquisition, sale, or final closeout of derivatives, including all settlement payments under the terms of derivatives contracts such as the periodic settlement under a swap agreement and the daily settlement of an exchange-traded contract. In calculating net settlements, U.S. receipts of cash from foreign persons are positive amounts (+), and U.S. payments of cash to foreign persons are negative amounts (-). Items excluded from net settlements are: (a) collateral including initial and maintenance margins, whether or not in the form of cash; and (b) purchases of underlying commodities, securities, or other noncash assets. (e.g., the purchase/sale by foreigners of a long-term security is reported on TIC Form S).
The gross fair (market) values and net settlement payments on derivatives are reported by type of derivative and by country based on the residence of the direct foreign counterparty. Positions of foreign customers on U.S. exchanges are reported opposite the country in which the foreign counterparty resides. In the case of U.S. residents’ futures contracts on foreign exchanges, the country of the exchange is reported as the country of the foreign counterparty.
NOTE: Current and historical data on United States transactions with foreigners in long-term securities on the gross foreign liabilities and claims reported by banks and nonbanks in the United States and on derivatives contracts with foreigners are available on the TIC website: http://www.ustreas.gov/tic. These data may be downloaded as separate time series for each country or geographical area regularly shown in the capital movements tables. Also available on this website are other series, including a table on “Major Foreign Holders of Treasury Securities,” showing estimated total holdings of U.S. Treasury bills, bonds and notes for current and recent periods. All data series on the TIC website are updated monthly.

CAPITAL MOVEMENTS
December 2009
61
SECTION I.—Liabilities to Foreigners Reported by Banks in the United States
Table CM-I-1.—Total Liabilities by Type and Holder [Position at end of period in millions of dollars. Source: Treasury International Capital Reporting System]
2009
Type of Liability
Calendar Year
2008 r Mar. r Apr. r May r June July Aug. Sept. p
Total liabilities to all foreigners............................... 4,792,785 4,618,692 4,582,395 4,634,444 4,452,290 4,462,711 4,505,452 4,577,244 Payable in dollars............................................... 4,527,250 4,391,075 4,354,778 4,406,827 4,224,511 4,234,932 4,277,673 4,349,465
Foreign official institutions ............................. 707,875 742,004 739,177 785,472 771,374 800,682 790,416 769,799 Deposits, excluding negotiable CDs.......... 60,834 45,866 48,559 45,159 41,132 43,829 44,404 43,265 U.S. Treasury bills and certificates ............ 457,876 542,706 530,566 586,150 571,876 606,570 607,284 597,722 Other short-term negotiable securities,
negotiable CDs, and other custody liabilities...................................................
62,665
47,942
52,190
49,108
44,260
35,548
29,010
23,358
Other liabilities............................................ 126,500 105,490 107,862 105,055 114,106 114,735 109,718 105,454 Foreign banks (including own foreign offices) and other foreigners ....................
3,783,145
3,617,965
3,589,675
3,597,467
3,433,414
3,417,275
3,470,557
3,564,598
Deposits, excluding negotiable CDs.......... 1,710,746 1,558,817 1,540,607 1,558,603 1,448,366 1,440,693 1,527,134 1,571,329 U.S. Treasury bills and certificates ............ 282,482 299,820 272,331 269,985 276,732 257,504 254,306 264,602 Other short-term negotiable securities,
negotiable CDs, and other custody liabilities...................................................
529,442
547,305
546,165
518,333
496,673
487,509
478,419
472,644
Other liabilities............................................ 1,260,475 1,212,023 1,230,572 1,250,546 1,211,643 1,231,569 1,210,698 1,256,023 International and regional organizations 1 ..... 36,230 31,106 25,926 23,888 19,723 16,975 16,700 15,068
Deposits, excluding negotiable CDs.......... 9,075 8,082 10,131 7,845 9,272 8,299 8,431 8,023 U.S. Treasury bills and certificates ............ 16,196 14,838 9,951 9,765 6,314 5,005 4,967 3,965 Other short-term negotiable securities,
negotiable CDs, and other custody liabilities...................................................
5,939
4,584
3,856
3,183
2,169
1,839
1,526
1,386
Other liabilities............................................ 5,020 3,602 1,988 3,095 1,968 1,832 1,776 1,694 Payable in foreign currencies 2 .......................... 265,535 227,617 227,617 227,617 227,779 227,779 227,779 227,779
Sector: Banks and other foreigners........................ 264,502 226,901 226,901 226,901 226,900 226,900 226,900 226,900 International and regional organizations 1...... 1,033 716 716 716 879 879 879 879
Major currencies: Canadian dollars ........................................ 10,370 10,673 10,673 10,673 11,430 11,430 11,430 11,430 Euro............................................................ 126,245 113,303 113,303 113,303 118,876 118,876 118,876 118,876 United Kingdom pounds sterling................ 14,630 14,426 14,426 14,426 11,637 11,637 11,637 11,637 Japanese yen............................................. 74,417 56,826 56,826 56,826 50,726 50,726 50,726 50,726
Memoranda: Respondents’ own liabilities payable in
dollars........................................................
3,172,650
2,933,880
2,939,719
2,970,303
2,826,487
2,840,957
2,902,161
2,985,788 Liabilities to own foreign offices..................... 2,123,510 2,023,747 2,021,017 2,063,416 1,908,023 1,928,477 2,004,445 2,088,299 Liabilities collaterized by repurchase
agreements ............................................
584,152
582,452
601,468
605,464
583,311
587,091
567,710
555,730 Foreign official institutions ..................... 116,275 90,245 94,816 86,964 96,407 96,297 91,259 88,217 Foreign banks and other foreigners....... 464,701 489,333 505,359 516,324 485,946 489,372 475,452 466,471 International and regional organizations 1..... 3,176 2,874 1,293 2,176 958 1,422 999 1,042
Reported by IBFs ....................................... 608,884 547,997 509,669 525,304 486,219 477,968 480,637 505,541 Respondents’ own liabilities payable in foreign currencies 2 .....................................
255,327
218,925
218,925
218,925
220,920
220,920
220,920
220,920
Reported by IBFs ....................................... 62,009 50,619 50,619 50,619 42,906 42,906 42,906 42,906 Liabilities held in custody for domestic customers and selected other liabilities 3 ....
1,364,808
1,465,887
1,423,751
1,445,216
1,404,883
1,400,834
1,382,371
1,370,536
Payable in dollars....................................... 1,354,600 1,457,195 1,415,059 1,436,524 1,398,024 1,393,975 1,375,512 1,363,677 of which: other short-term negotiable
securities and negotiable CDs............
340,510
314,051
313,612
297,072
282,902
265,709
251,219
243,743 of which: short-term U.S. Government
agency securities ................................
102,088
92,482
100,752
93,995
86,623
78,863
69,789
63,261 of which: negotiable CDs ...................... 87,853 78,188 75,516 71,361 67,489 63,501 65,606 65,709
Payable in foreign currencies 2 .................. 10,208 8,692 8,692 8,692 6,859 6,859 6,859 6,859
1 Principally the International Bank for Reconstruction and Development (World Bank) and the Inter-American Development Bank.
2 Data may be as of preceding quarter-end for most recent month shown in table. 3 Selected other liabilities are primarily the liabilities of the customers of banks to U.S. managed foreign offices and other foreign institutions.

CAPITAL MOVEMENTS
December 2009
62
TABLE CM-I-2.—Total Liabilities by Country [Position at end of period in millions of dollars. Source: Treasury International Capital Reporting System]
Calendar year 2009 Country 2006 2007 2008 r May r June July Aug. Sept.
Europe:
Austria ............................................... 3,934 3,575 2,716 2,222 2,228 2,266 2,195 2,271Belgium ............................................ 15,595 22,437 16,254 15,995 16,754 14,743 15,838 16,680Bulgaria ............................................. 88 148 118 503 461 431 420 410Cyprus 1 ............................................ 634 1,068 775 929 1,374 1,272 1,141 1,423Czech Republic ................................. 1,353 1,433 681 546 961 705 727 726Denmark............................................ 969 791 4,502 3,322 3,522 3,082 2,638 3,151Finland............................................... 3,362 1,456 1,606 1,727 2,303 1,849 1,537 1,505France ............................................... 83,606 73,355 58,783 56,105 51,676 54,034 53,549 58,409Germany............................................ 92,815 145,955 158,324 143,260 152,072 147,252 149,016 147,597Greece............................................... 1,488 1,357 1,998 1,293 985 1,137 1,013 1,213Hungary............................................. 820 1,219 781 695 1,638 1,406 1,431 1,357Iceland 1 ............................................ 431 667 1,089 762 640 605 760 614Ireland ............................................... 84,414 123,913 177,970 161,188 160,137 148,561 148,827 145,832Italy.................................................... 9,301 10,421 8,570 9,177 11,152 10,740 11,633 10,364Kazakhstan 1 ..................................... 6,145 5,945 13,761 10,451 10,720 10,364 9,851 9,087Luxembourg ..................................... 73,989 108,463 118,175 94,425 101,885 88,795 86,197 94,953Monaco 1 .......................................... 380 206 314 373 279 320 232 147Netherlands....................................... 26,781 26,125 35,908 39,706 32,618 32,980 30,837 34,069Norway .............................................. 42,401 48,309 17,933 10,391 9,594 9,414 3,836 3,689Poland ............................................... 7,475 19,651 4,731 6,749 7,996 7,886 6,116 5,446Portugal ............................................. 2,720 2,999 2,166 1,215 2,061 1,371 1,378 1,767Romania............................................ 492 581 643 3,232 2,839 3,952 3,845 2,475Russia .............................................. 62,736 104,741 73,118 74,829 75,442 70,917 75,578 77,957Serbia and Montenegro .................... 295 532 182 445 280 253 337 397Spain ................................................. 9,805 13,022 17,320 14,242 13,120 13,605 13,476 14,654Sweden ............................................. 3,890 7,723 3,913 2,606 5,912 4,773 5,116 6,321Switzerland........................................ 63,546 58,468 57,484 58,629 69,197 66,728 64,269 63,215Turkey ............................................... 10,457 12,139 20,280 19,010 18,214 19,056 20,528 19,196Ukraine 1 ............................................ 919 1,392 4,058 3,670 3,100 5,317 3,379 4,011United Kingdom................................. 926,069 1,051,764 746,778 706,821 641,270 702,531 686,485 719,003Channel Islands ............................... 33,857 25,391 11,937 14,351 20,806 20,944 24,912 41,445All other Europe 1 .............................. 3,852 4,897 7,934 6,383 6,845 7,044 7,329 7,250
Total Europe.................................. 1,574,620 1,880,143 1,570,803 1,465,252 1,428,080 1,454,332 1,434,425 1,496,633Memo: Euro Area 2 .......................................... 407,811 533,078 600,896 542,022 548,853 519,164 517,299 531,371Memo: European Union 3 ................ 1,349,799 1,619,013 1,363,971 1,267,004 1,214,093 1,244,556 1,224,958 1,271,276
Canada.................................................. 49,396 68,274 78,140 72,567 72,711 71,291 73,578 82,572Latin America:
Argentina........................................... 10,628 12,090 12,894 14,164 14,210 13,254 13,110 13,405Belize 4 .............................................. 484 307 299 335 352 379 366 336Bolivia 4 ............................................ 2,123 2,559 4,544 3,611 3,616 3,117 3,109 3,197Brazil ................................................. 16,271 24,887 17,728 30,594 57,470 57,500 55,606 59,057Chile .................................................. 16,926 15,731 15,871 14,271 13,230 11,879 10,745 10,194Colombia ........................................... 11,702 11,038 10,372 11,957 11,613 15,927 18,333 18,970Costa Rica 4 ..................................... 2,967 2,502 2,005 2,546 2,366 2,284 2,069 1,950Ecuador............................................. 3,431 3,296 3,600 4,007 4,004 3,860 3,941 3,734El Salvador 4 ..................................... 1,964 2,352 2,927 3,163 2,959 2,881 2,994 2,699Guatemala......................................... 1,444 1,851 1,873 2,171 2,470 2,284 2,317 2,148Guyana 4 .......................................... 98 141 276 220 207 216 228 358Honduras 4 ....................................... 2,594 2,162 1,546 1,741 1,817 1,706 1,322 1,455Mexico ............................................... 45,846 53,234 70,963 66,024 60,838 54,948 50,527 56,686Nicaragua 4 ....................................... 238 215 301 376 479 429 492 506Panama............................................. 7,183 7,062 10,868 10,681 9,247 8,880 9,197 9,886Paraguay 4 ........................................ 672 693 667 818 819 813 804 818Peru................................................... 4,281 5,286 4,710 5,639 5,392 6,607 5,779 5,525Suriname 4 ........................................ 128 128 157 144 155 156 278 262Uruguay............................................. 6,139 6,503 7,505 6,818 6,808 6,752 6,813 6,617Venezuela ......................................... 22,883 23,588 26,815 22,722 23,574 23,565 24,955 25,049All other Latin America 4.................... 8 15 48 52 58 58 64 62
Total Latin America ....................... 158,010 175,640 195,969 202,054 221,684 217,495 213,049 222,914Caribbean:
Anguilla 5 .......................................... 3,149 13,065 10,914 8,139 7,748 8,503 8,686 8,838Antigua and Barbuda 5 ..................... 186 217 115 99 96 94 93 96Aruba 5............................................... 408 265 737 605 612 670 688 663Bahamas ........................................... 257,200 286,669 336,492 250,198 251,661 242,567 254,910 275,188Barbados 5 ........................................ 18,680 21,602 17,056 13,019 12,849 13,615 11,888 11,446Bermuda............................................ 55,502 49,865 54,348 46,974 47,189 44,983 44,075 43,426British Virgin Islands 5 ...................... 22,082 35,092 44,473 42,440 40,886 40,988 41,024 35,041Cayman Islands ............................... 1,316,517 1,488,182 1,511,520 1,559,704 1,479,985 1,461,475 1,528,837 1,534,647Cuba.................................................. 82 80 89 88 91 93 99 104Dominican Republic 5 ....................... 3,895 3,813 3,088 3,705 3,625 3,598 3,487 3,337French West Indies 5 ........................ 19 35 26 31 29 26 41 30Haiti 5 ................................................. 495 555 540 744 464 467 479 530Jamaica............................................. 1,056 1,358 1,016 861 934 927 944 937Netherlands Antilles .......................... 8,503 10,131 8,523 7,507 7,177 7,264 6,356 7,214
See footnotes at end of table.

CAPITAL MOVEMENTS
December 2009
63
TABLE CM-I-2.—Total Liabilities by Country, con. [Position at end of period in millions of dollars. Source: Treasury International Capital Reporting System]
Calendar year 2009 Country 2006 2007 2008 r May r June July Aug. Sept.
Caribbean, con.
St. Kitts and Nevis 5 ....................... 90 122 138 131 134 108 98 142Trinidad and Tobago...................... 3,354 3,389 3,955 3,824 3,447 3,849 3,848 3,836Turks and Caicos Islands 5 ............ 165 213 227 153 344 112 116 199All other Caribbean 5 ...................... 157 189 170 177 228 141 119 125
Total Caribbean.......................... 1,691,540 1,914,842 1,993,427 1,938,398 1,857,499 1,829,480 1,905,788 1,925,799Asia:
Bangladesh 6 .................................. 824 889 3,479 3,753 4,633 4,730 5,244 5,173China, Mainland ............................ 44,474 94,369 225,800 252,835 190,627 205,672 178,297 162,164Hong Kong ..................................... 44,639 47,133 54,479 75,527 82,225 92,595 95,148 100,498India................................................ 18,813 18,257 28,819 40,858 41,078 37,433 38,025 35,947Indonesia........................................ 4,386 5,223 9,987 18,377 17,924 17,552 17,164 18,580Israel............................................... 7,327 7,812 20,852 23,357 22,250 19,195 23,147 20,697Japan.............................................. 141,655 190,122 241,810 197,548 184,048 188,344 194,342 196,223Jordan 6 ......................................... 2,146 1,179 2,243 2,083 2,100 2,509 2,612 2,327Korea, South .................................. 28,099 35,215 16,057 16,766 15,535 14,618 12,981 12,356Laos 6 ............................................ 120 380 66 155 135 127 159 182Lebanon ......................................... 1,168 1,032 1,434 1,565 1,560 1,508 1,514 1,426Malaysia ......................................... 3,847 2,852 2,222 5,425 4,117 3,647 3,162 2,935Pakistan.......................................... 1,282 1,464 4,186 4,484 4,469 4,081 5,805 5,759Philippines...................................... 3,857 4,927 9,557 6,562 4,523 3,752 5,165 4,223Singapore....................................... 30,831 38,704 45,158 45,611 43,883 42,671 41,667 38,083Syria ............................................... 25 24 65 38 37 35 34 34Taiwan............................................ 22,952 25,952 30,614 35,546 34,595 36,386 35,256 32,443Thailand.......................................... 8,319 14,189 18,746 15,809 17,506 18,289 20,472 16,654Yemen 6 ......................................... 179 202 212 732 583 598 672 579Oil exporting countries 7 ................. 70,314 80,593 118,665 105,765 104,345 105,828 105,290 102,874All other Asia 6 ............................... 5,893 5,052 7,132 5,036 5,454 6,427 5,625 5,608
Total Asia ................................... 441,150 575,570 841,583 857,832 781,627 805,997 791,781 764,765Africa:
Botswana 8 .................................... 236 925 376 361 336 447 284 982Egypt .............................................. 2,252 3,683 9,398 10,753 10,070 10,031 11,726 11,965Ghana............................................. 389 346 316 333 317 470 366 313Kenya 8 .......................................... 234 612 342 488 441 441 564 636Liberia............................................. 469 422 453 1,008 993 1,007 1,020 1,057Mauritius 8 ...................................... 641 6,436 1,050 1,806 1,898 1,461 1,550 1,438Morocco.......................................... 198 180 379 803 675 632 782 713Mozambique 8 ............................... 87 126 141 132 115 105 87 118South Africa.................................... 1,565 1,649 3,088 3,024 2,325 2,767 2,771 1,831Tanzania 8 ..................................... 363 407 682 285 351 352 358 383Uganda 8 ....................................... 926 1,233 329 377 440 445 479 436Zambia 8 ........................................ 143 190 141 147 158 161 125 167Zimbabwe 8 ................................... 78 105 88 113 119 115 127 127Oil exporting countries 9 ................ 4,457 6,131 4,380 4,857 4,152 3,686 4,636 5,196All other Africa 8 ............................. 2,981 3,443 6,604 7,414 8,686 8,418 9,339 9,579
Total Africa ................................. 15,019 25,888 27,767 31,901 31,076 30,538 34,214 34,941Other countries:
Australia ......................................... 26,178 14,891 33,008 26,204 25,273 22,956 21,951 20,329New Zealand ................................. 4,543 3,190 3,838 5,925 5,838 4,864 5,217 5,540French Polynesia 10 ....................... 63 83 143 157 162 148 160 170All other 10 ...................................... 18,704 19,455 10,844 9,550 7,738 7,756 7,710 7,634
Total other ................................. 49,488 37,619 47,833 41,836 39,011 35,724 35,038 33,673All countries........................................ 3,979,223 4,677,976 4,755,522 4,609,840 4,431,688 4,444,857 4,487,873 4,561,297International and regional orgs:
International organizations............ 26,862 24,236 32,571 19,768 15,987 13,861 13,339 11,844Regional organizations 11 ............. 4,274 4,098 4,692 4,836 4,615 3,993 4,240 4,103
Total international and regional organizations............... 31,136 28,334 37,263 24,604 20,602 17,854 17,579 15,947
Grand total ............................. 4,010,359 4,706,310 4,792,785 4,634,444 4,452,290 4,462,711 4,505,452 4,577,244
1 Before June 2006, data for Cyprus, Iceland, Kazakhstan, Monaco, and Ukraine are included in “All other Europe.” 2 Includes Austria, Belgium, Finland, France, Germany, Greece, Ireland, Italy, Luxembourg, the Netherlands, Portugal, and Spain. For data as of January 2008, also includes Cyprus, Malta, and Slovenia. For data as of January 2009, also includes Slovakia. 3 As of May 2004, the European Union includes Austria, Belgium, Cyprus, the Czech Republic, Denmark, Estonia, Finland, France, Germany, Greece, Hungary, Ireland, Italy, Latvia, Lithuania, Luxembourg, Malta, the Netherlands, Poland, Portugal, Slovakia, Slovenia, Spain, Sweden, and the United Kingdom. Data available beginning June 2006. As of January 2007, also includes Bulgaria and Romania. 4 Before June 2006, data for the Belize, Bolivia, Costa Rica, El Salvador, Guyana, Honduras, Nicaragua, Paraguay, and Suriname are included in “All other Latin America.”
5 Before June 2006, data for Anguilla, Antigua and Barbuda, Aruba, Barbados, the British Virgin Islands, the Dominican Republic, the French West Indies (primarily Guadeloupe and Martinique), Haiti, St. Kitts and Nevis, and the Turks and Caicos Islands are included in “All other Caribbean.” 6 Before June 2006, data for Bangladesh, Jordan, Laos, and Yemen are included in “All other Asia.” 7 Includes Bahrain, Iran, Iraq, Kuwait, Oman, Qatar, Saudi Arabia, and United Arab Emirates (Trucial States). 8 Before June 2006, data for Botswana, Kenya, Mauritius, Mozambique, Tanzania, Uganda, Zambia, and Zimbabwe are included in “All other Africa.” 9 Includes Algeria, Gabon, Libya, and Nigeria. 10 Before June 2006, data for French Polynesia are included in “All other.” 11 Includes European, Latin American, Caribbean, Asian, African, and Middle East regional organizations.

CAPITAL MOVEMENTS
December 2009
64
TABLE CM-I-3.—Total Liabilities by Type and Country, September 30, 2009, Preliminary [Position at end of period in millions of dollars. Source: Treasury International Capital Reporting System]
Liabilities payable in dollars
Non-negotiable deposits and
brokerage balances 1 Negotiable CDs and short-term
securities
Other Miscellaneous
liabilities 2
Country
Total liabilities
payable in dollars and
foreign currency
(1)
Total liabilities
payable in dollars
(2)
Total own liabilities
payable in dollars
(3)
Total custody liabilities
payable in dollars
(4)
Held by foreign official
institutions and foreign
banks (5)
Held by all other
foreigners (6)
Of which: short-term
U.S. Treasury obligations
(7)
Of which: other short-
term negotiable securities
(excl. CDs) (8)
Of which: negotiable
CDs (9)
Held by foreign official
institutions and foreign
banks (10)
Held by all other
foreigners (11)
Total liabilities
payable in foreign
currency 3 (12)
Europe:
Austria .............................. 2,271 2,261 1,367 894 668 363 440 310 9 448 22 10Belgium............................. 16,680 16,533 6,327 10,206 4,314 371 2,692 2,668 4,846 1,612 30 147Cyprus .............................. 1,423 1,423 1,391 32 673 624 32 - - 4 90 -Czech Republic................. 726 724 123 601 30 59 601 - - 33 1 2Denmark ........................... 3,151 3,144 1,067 2,077 410 130 1,842 93 42 623 4 7Finland.............................. 1,505 1,394 211 1,183 54 78 413 298 429 119 3 111France .............................. 58,409 52,189 46,056 6,134 14,042 1,563 5,495 165 341 12,826 17,758 6,220Germany........................... 147,597 84,960 73,131 11,829 29,287 2,750 7,619 2,269 765 41,815 455 62,637Greece.............................. 1,213 1,181 903 278 181 617 267 2 9 95 10 32Hungary ............................ 1,357 1,320 353 967 221 69 952 - 6 71 1 37Ireland............................... 145,832 143,764 42,037 101,727 15,856 3,249 20,899 56,691 20,498 9,720 16,851 2,068Italy................................... 10,364 9,658 4,724 4,934 3,220 1,082 4,712 5 25 570 44 706Kazakhstan....................... 9,087 8,814 2,736 6,078 2,689 26 6,078 - - - 21 273Luxembourg...................... 94,953 93,730 16,371 77,359 5,256 5,662 34,835 24,618 16,709 2,282 4,368 1,223Monaco............................. 147 146 58 88 20 38 87 - 1 - - 1Netherlands ...................... 34,069 32,939 22,285 10,654 3,834 4,551 7,521 1,803 353 12,362 2,515 1,130Norway ............................. 3,689 3,658 3,321 337 265 149 264 50 23 2,897 10 31Poland .............................. 5,446 5,437 1,264 4,173 320 212 2,816 1,355 2 731 1 9Portugal ............................ 1,767 1,747 1,432 315 664 275 274 38 3 490 3 20Romania ........................... 2,475 2,474 628 1,846 84 61 1,845 - 1 475 8 1Russia............................... 77,957 77,329 12,433 64,896 10,194 821 63,351 1,539 6 1,037 381 628Spain ................................ 14,654 14,009 9,109 4,900 4,732 2,212 4,768 10 63 2,148 75 645Sweden............................. 6,321 6,162 2,844 3,318 409 275 2,158 395 345 1,841 739 159Switzerland ....................... 63,215 61,155 27,015 34,140 9,239 2,834 26,776 7,191 163 13,753 1,199 2,060Turkey............................... 19,196 19,132 2,899 16,233 1,791 207 16,225 1 4 894 10 64Ukraine ............................. 4,011 3,995 3,983 12 2,499 85 12 - - 1,388 11 16United Kingdom ................ 719,003 669,592 648,246 21,346 210,114 20,892 14,003 1,563 2,357 223,238 197,425 49,411Channel Islands ................ 41,445 41,273 7,768 33,505 3,779 1,473 31,632 1,516 218 91 2,564 172All other Europe.................. 8,671 8,322 6,465 1,857 2,203 1,181 1,683 152 13 3,030 60 349
Total Europe .................. 1,496,633 1,368,464 946,547 421,917 327,049 51,909 260,290 102,732 47,231 334,594 244,659 128,169
Memo: Euro Area 4 ........ 531,371 456,385 225,663 230,722 82,903 23,552 90,132 88,985 44,053 84,532 42,228 74,986
Canada ................................... 82,572 76,622 57,474 19,148 5,776 7,512 10,819 4,221 3,253 37,943 7,098 5,950Latin America:
Argentina ............................ 13,405 13,234 11,523 1,711 494 10,605 1,300 85 323 243 184 171Belize.................................. 336 336 268 68 49 148 20 - 48 70 1 -Bolivia ................................. 3,197 3,169 1,406 1,763 219 1,170 1,106 436 221 15 2 28Brazil................................... 59,057 58,726 15,917 42,809 3,829 5,454 42,064 534 125 5,334 1,386 331Chile ................................... 10,194 10,024 6,866 3,158 2,719 3,073 1,466 1,595 53 1,053 65 170Colombia ............................ 18,970 18,919 6,085 12,834 1,469 4,228 11,958 601 267 349 47 51Costa Rica.......................... 1,950 1,945 1,242 703 634 493 619 22 61 112 4 5Ecuador .............................. 3,734 3,685 3,324 361 664 2,557 141 59 85 54 125 49El Salvador ......................... 2,699 2,694 1,180 1,514 314 647 494 539 481 203 16 5Guatemala.......................... 2,148 2,104 1,629 475 271 1,130 410 31 34 214 14 44Honduras............................ 1,455 1,452 1,363 89 592 748 14 8 67 18 5 3Mexico ................................ 56,686 53,350 46,432 6,918 16,842 20,396 4,929 1,202 769 8,065 1,147 3,336Panama.............................. 9,886 9,800 7,531 2,269 3,965 3,157 1,850 203 212 358 55 86Paraguay............................ 818 816 793 23 230 511 5 6 12 43 9 2Peru.................................... 5,525 5,436 3,143 2,293 1,092 1,426 1,172 1,044 74 623 5 89Uruguay.............................. 6,617 6,569 4,840 1,729 1,080 2,210 1,092 269 359 1,390 169 48Venezuela .......................... 25,049 24,093 22,595 1,498 3,475 16,773 284 554 660 2,014 333 956All other Latin America....... 1,188 1,188 1,151 37 307 498 1 9 27 344 2 -
Total Latin America........ 222,914 217,540 137,288 80,252 38,245 75,224 68,925 7,197 3,878 20,502 3,569 5,374
See footnotes at end of table.

CAPITAL MOVEMENTS
December 2009
65
TABLE CM-I-3.—Total Liabilities by Type and Country, September 30, 2009, Preliminary, con. [Position at end of period in millions of dollars. Source: Treasury International Capital Reporting System]
Liabilities payable in dollars
Non-negotiable deposits and
brokerage balances 1 Negotiable CDs and short-term
securities
Other
Miscellaneous liabilities 2
Country
Total liabilities
payable in dollars and
foreign currency
(1)
Total liabilities
payable in dollars
(2)
Total own liabilities
payable in dollars
(3)
Total custody liabilities
payable in dollars
(4)
Held by foreign official
institutions and foreign
banks (5)
Held by all other
foreigners (6)
Of which: short-term
U.S. Treasury obligations
(7)
Of which: other short-
term negotiable securities
(excl. CDs) (8)
Of which: negotiable
CDs (9)
Held by foreign official
institutions and foreign
banks (10)
Held by all other
foreigners (11)
Total liabilities
payable in foreign
currency 3 (12)
Caribbean:
Aruba........................................ 663 663 607 56 79 436 14 8 34 4 88 -Bahamas.................................. 275,188 274,834 272,560 2,274 227,215 5,463 1,420 430 291 38,148 1,867 354Barbados.................................. 11,446 11,425 1,628 9,797 1,088 529 7,399 877 1,512 6 14 21Bermuda .................................. 43,426 41,595 16,688 24,907 369 11,915 16,072 7,923 712 231 4,373 1,831British Virgin Islands ................ 35,041 34,296 19,716 14,580 41 18,606 12,501 1,200 582 - 1,366 745Cayman Islands ....................... 1,534,647 1,513,636 1,207,888 305,748 541,401 118,630 49,516 16,601 2,515 667,203 117,770 21,011Dominican Republic................. 3,337 3,287 2,682 605 481 2,048 379 202 24 140 13 50Haiti 7........................................ 530 530 504 26 149 284 2 6 18 68 3 -Jamaica.................................... 937 870 838 32 264 430 16 10 6 131 13 67Netherlands Antilles................. 7,214 7,208 5,971 1,237 1,448 2,674 772 409 54 366 1,485 6Trinidad and Tobago................ 3,836 3,633 2,485 1,148 1,369 643 1,015 69 31 467 39 203All other Caribbean 9,534 8,455 8,222 233 139 7,579 127 51 55 7 497 1,079
Total Caribbean.................. 1,925,799 1,900,432 1,539,789 360,643 774,043 169,237 89,233 27,786 5,834 706,771 127,528 25,367Asia:
China, Mainland....................... 162,164 162,095 20,652 141,443 11,324 4,379 139,797 467 806 5,204 118 69Hong Kong............................... 100,498 99,501 24,162 75,339 8,569 5,882 68,131 6,763 357 9,273 526 997India ......................................... 35,947 35,874 9,567 26,307 2,263 2,001 15,215 10,991 13 5,141 250 73Indonesia ................................. 18,580 18,569 5,522 13,047 3,070 294 11,504 1,527 15 2,064 95 11Israel ........................................ 20,697 20,649 8,475 12,174 1,134 2,097 11,950 85 139 5,216 28 48Japan ....................................... 196,223 147,564 67,252 80,312 28,815 8,048 74,506 3,984 298 30,544 1,369 48,659Jordan ...................................... 2,327 2,327 1,085 1,242 750 56 1,130 1 111 275 4 -Korea, South ............................ 12,356 11,719 6,946 4,773 3,080 688 992 2,650 500 3,631 178 637Malaysia................................... 2,935 2,932 1,906 1,026 1,190 156 907 100 17 549 13 3Pakistan ................................... 5,759 5,759 5,284 475 703 198 420 27 1 4,369 41 -Philippines................................ 4,223 4,209 2,752 1,457 1,621 502 1,408 3 46 337 292 14Singapore................................. 38,083 37,267 29,210 8,057 25,620 1,718 7,224 686 115 1,818 86 816Taiwan...................................... 32,443 32,381 29,341 3,040 5,906 6,409 2,472 126 420 16,764 284 62Thailand ................................... 16,654 16,650 1,882 14,768 1,018 305 14,691 52 13 560 11 4All other Asia............................ 115,876 115,824 44,575 71,249 11,439 2,245 62,526 6,456 2,257 29,277 1,624 52
Total Asia............................. 764,765 713,320 258,611 454,709 106,502 34,978 412,873 33,918 5,108 115,022 4,919 51,445Africa:
Egypt ........................................ 11,965 11,962 3,050 8,912 1,170 153 8,864 1 47 1,725 2 3Ghana ...................................... 313 313 313 - 117 52 - - - 144 - -Kenya....................................... 636 636 396 240 300 75 238 - 2 20 1 -Liberia ...................................... 1,057 1,029 391 638 5 279 587 50 - 107 1 28Morocco ................................... 713 713 696 17 298 60 13 1 2 338 1 -South Africa ............................. 1,831 1,747 1,735 12 811 199 6 2 4 639 86 84All other Africa.......................... 18,426 18,015 13,610 4,405 7,087 1,565 4,352 52 1 4,860 98 411
Total Africa........................... 34,941 34,415 20,191 14,224 9,788 2,383 14,060 106 56 7,833 189 526Other countries:
Australia ................................... 20,329 17,255 12,958 4,297 9,173 1,787 3,195 747 84 1,380 889 3,074New Zealand............................ 5,540 5,456 2,491 2,965 233 221 2,927 27 10 2,013 25 84All other .................................... 7,804 893 722 171 251 283 2 126 43 177 11 6,911
Total other........................... 33,673 23,604 16,171 7,433 9,657 2,291 6,124 900 137 3,570 925 10,069All countries.................................. 4,561,297 4,334,397 2,976,071 1,358,326 1,271,060 343,534 862,324 176,860 65,497 1,226,235 388,887 226,900International and regional
orgs: International organizations....... 11,844 11,050 6,847 4,203 - 5,927 3,232 795 176 - 920 794Regional organizations 5.......... 4,103 4,018 2,870 1,148 - 2,096 733 379 36 - 774 85
Total International and regional organizations ...... 15,947 15,068 9,717 5,351 - 8,023 3,965 1,174 212 - 1,694 879
Grand total ...................... 4,577,244 4,349,465 2,985,788 1,363,677 1,271,060 351,557 866,289 178,034 65,709 1,226,235 390,581 227,779
1 Excludes negotiable certificates of deposit. 2 Includes both banks' own liabilities and banks' customer liabilities to foreigners primarily in the form of loans, including loans associated with repurchase agreements, and non-negotiable short-term securities. 3 Foreign currency data are as of the previous quarter-end.
4 Includes Austria, Belgium, Finland, France, Germany, Greece, Ireland, Italy, Luxembourg, the Netherlands, Portugal, and Spain. For data as of January 2008, also includes Cyprus, Malta, and Slovenia. For data as of January 2009, also includes Slovakia. 5 Includes European, Latin American, Caribbean, Asian, African, and Middle East regional organizations.

CAPITAL MOVEMENTS
December 2009
66
CHART CM-A.—U.S. Liabilities to Foreigners Reported by U.S. Banks, Brokers, and Dealers with Respect to Selected Countries
[In millions of dollars. Source: Treasury International Capital Reporting System]
Calendar years Country 2005 2006 2007 2008 Sept. 2009
United Kingdom........................ 590,505 926,069 1,051,764 746,778 719,003 All other Europe ....................... 691,138 648,551 828,379 824,025 777,630 Caribbean banking centers 1 ..... 1,200,444 1,666,987 1,877,001 1,966,224 1,905,402 Japan........................................ 161,951 141,655 190,122 241,810 196,223 All other Asia ............................ 256,934 299,495 385,448 599,773 568,542 Subtotal .................................. 2,900,972 3,682,757 4,332,714 4,378,610 4,166,800
All other countries .................... 285,773 327,602 373,596 414,175 410,444 Grand total.............................. 3,186,745 4,010,359 4,706,310 4,792,785 4,577,244
1 Includes Bahamas, Bermuda, Cayman Islands, Netherlands Antilles, and Panama. For data beginning June 2006, also includes the British Virgin Islands.
U.S. liabilities to foreigners reported by U.S. banks were recorded at $4.6 trillion in September 2009, a decrease of $215 billion from yearend 2008. U.S. banking liabilities include foreign holdings of U.S. short-term securities but exclude foreign holdings of U.S. long-term securities. U.S. banking liabilities increased about $86 billion in 2008. However, that increase is primarily attributable to the addition of several new bank holding companies to the reporter panel. U.S. banking liabilities increased about $696 billion in 2007 and about $824 billion in 2006. However, much of the increase in liabilities to foreigners in 2006 reflects changes in coverage in the bank-reported data in the first and second quarters of 2006. Between June and December of 2006, when data were reported on a consistent basis, banking liabilities increased about $250 billion.
U.S. banking liabilities are concentrated in international financial centers. The data on this page show that almost 60 percent of U.S. banking liabilities is currently recorded against the United Kingdom and banking centers in the Caribbean. These financial centers recorded most of the growth in banking liabilities in recent years up through 2007. Since 2007, however, U.S. banking liabilities recorded against the United Kingdom have declined sharply. Meanwhile banking liabilities to Asia grew at a rapid pace up through 2008. In the first 9 months of 2009, banking liabilities to all geographic areas in the table declined.
0
500
1000
1500
2000
2500
2005 2006 2007 2008 Sept. 2009
United Kingdom All other Europe Caribbean banking centers
Japan All other Asia All other countries
(In billions of dollars)

CAPITAL MOVEMENTS
December 2009
67
SECTION II.—Claims on Foreigners Reported by Banks in the United States TABLE CM-II-1.—Total Claims by Type
[Position at end of period in millions of dollars. Source: Treasury International Capital Reporting System]
2008 2009 Type of Claim
Calendar Year
2007 r June r Sept. r Dec. r Mar. June p Total claims.............................................................. 3,811,848 3,936,787 3,792,562 3,598,139 3,630,025 3,697,092
Payable in dollars.................................................. 3,567,042 3,694,895 3,580,691 3,291,062 3,368,085 3,419,569
Own claims on foreigners................................... 2,795,389 2,960,407 2,886,647 2,530,515 2,619,722 2,658,374
Foreign official institutions ............................... 110,093 98,854 79,750 47,272 32,061 32,083
Foreign banks, including own foreign offices ........................................................... 2,068,427 2,182,201 2,169,609 2,004,447 2,092,446 2,112,190
All other foreigners .......................................... 616,869 679,352 637,288 478,796 495,215 514,101
Claims of domestic customers.............................. 771,653 734,488 694,044 760,547 748,363 761,195
Payable in foreign currencies .................................. 244,806 241,892 211,871 307,077 261,940 277,523
Own claims on foreigners ..................................... 170,113 161,328 142,848 264,358 225,477 231,356
of which:
Canadian dollars .............................................. 32,718 27,761 22,939 21,311 25,171 28,354
Euros................................................................ 75,137 62,854 52,191 149,212 114,357 102,466
United Kingdom pounds sterling...................... 15,804 12,515 10,703 14,179 19,942 25,739
Japanese yen................................................... 23,911 29,677 28,976 46,028 38,781 38,135
Claims of domestic customers.............................. 74,693 80,564 69,023 42,719 36,463 46,167
of which:
Canadian dollars .............................................. 3,008 3,019 4,637 4,597 4,653 5,367
Euros................................................................ 60,501 60,000 52,844 31,132 25,172 31,934
United Kingdom pounds sterling...................... 3,160 5,959 3,618 1,137 1,882 3,186
Japanese yen................................................... 2,817 5,975 2,799 2,655 1,785 2,050
Memoranda:
Total own claims on foreigners ............................. 2,965,502 3,121,735 3,029,495 2,794,873 2,845,199 2,889,730
Non-negotiable deposits .................................... 1,059,631 1,217,106 1,110,779 1,205,929 1,278,302 1,346,237
Short-term negotiable instruments (payable in dollars) ........................................ 48,082 38,721 31,990 15,256 15,190 15,894
Resale agreements ............................................ 770,703 750,369 754,280 474,689 553,702 538,600
Other................................................................... 1,087,086 1,115,539 1,132,446 1,098,999 998,005 988,999
Claims on own foreign offices............................... 1,929,030 1,987,662 1,961,297 1,755,620 1,827,196 1,880,004
Claims reported by IBFs ....................................... 686,623 527,208 520,314 514,225 572,127 552,975
Payable in dollars ............................................... 644,202 488,712 493,385 468,962 530,704 516,335
Payable in foreign currencies............................. 42,421 38,496 26,929 45,263 41,423 36,640
Total claims held for domestic customers ............ 846,346 815,052 763,067 803,266 784,826 807,362
Non-negotiable deposits .................................... 457,828 424,296 398,408 486,473 419,690 369,574
Short-term negotiable instruments (payable in dollars) ........................................ 340,734 343,831 319,091 286,752 339,838 406,765
Other ..................................................................... 47,784 46,925 45,568 30,041 25,298 31,023

CAPITAL MOVEMENTS
December 2009
68
TABLE CM-II-2.—Total Claims by Country [Position at end of period in millions of dollars. Source: Treasury International Capital Reporting System]
2007 2008 2009 Country
Calendar year 2006 Dec. r Mar. r June r Sept. r Dec. r Mar. June p
Europe:
Austria .................................................... 8,563 8,083 8,017 9,377 8,684 5,133 4,800 5,686Belgium................................................... 20,258 26,646 28,005 36,454 24,424 16,729 20,448 14,352Bulgaria .................................................. 38 30 52 56 55 36 18 29Czech Republic ...................................... 3,546 4,049 2,666 2,276 273 226 107 156Denmark................................................. 2,770 10,314 10,986 10,789 8,461 9,775 9,748 12,296Finland.................................................... 10,360 30,533 27,748 32,299 29,104 25,139 26,234 23,714France .................................................... 165,030 204,433 237,869 227,520 208,995 184,616 188,197 198,175Germany................................................. 45,429 81,120 94,873 98,472 88,380 76,779 99,424 125,645Greece.................................................... 1,081 1,658 1,967 1,837 1,469 1,229 958 1,207Hungary .................................................. 157 378 249 241 336 413 268 290Ireland..................................................... 62,881 80,906 101,304 107,731 92,845 86,300 64,748 59,756Italy ......................................................... 41,462 51,856 63,532 63,965 61,599 52,085 52,181 55,813Kazakhstan 1 .......................................... 510 688 732 665 544 544 504 420Luxembourg ........................................... 16,033 27,017 25,387 22,512 20,891 18,497 15,460 15,234Netherlands ............................................ 38,723 63,711 72,611 75,681 67,911 71,696 70,348 74,707Norway ................................................... 35,117 29,105 27,315 25,063 31,117 18,769 14,614 14,995Poland .................................................... 1,115 8,242 17,109 17,276 11,678 1,712 1,543 2,246Portugal .................................................. 1,988 3,113 3,672 2,988 2,392 1,881 4,206 4,017Romania ................................................. 290 195 179 204 160 155 150 128Russia..................................................... 4,254 1,869 1,639 2,437 2,776 2,199 1,896 1,640Spain ...................................................... 15,969 32,753 56,322 62,338 55,674 59,302 49,887 52,044Sweden................................................... 29,377 34,964 28,652 36,430 30,472 17,144 17,744 22,663Switzerland............................................. 112,020 201,003 184,176 133,985 123,180 112,001 118,030 95,965Turkey..................................................... 5,429 3,735 3,989 4,055 4,159 3,694 3,869 4,358United Kingdom...................................... 938,123 1,111,135 1,186,193 1,080,469 1,141,194 966,445 1,010,231 1,071,137Channel Islands...................................... 45,533 35,468 20,776 18,367 16,167 19,461 18,480 19,545All other Europe 1 ................................... 4,193 3,632 3,421 3,185 3,216 2,828 3,362 3,051
Total Europe ........................................ 1,610,249 2,056,636 2,209,439 2,076,671 2,036,157 1,754,788 1,797,454 1,879,269Memo: Euro Area 2 .............................. 427,777 611,829 722,764 742,487 663,429 600,028 597,858 631,655Memo: European Union 3 .................... 1,404,001 1,782,800 1,968,885 1,890,251 1,856,149 1,596,024 1,637,678 1,740,609
Canada...................................................... 106,662 140,166 160,826 141,640 147,164 151,037 143,637 147,610Latin America:
Argentina ................................................ 2,977 4,251 4,349 4,550 5,087 4,224 3,896 6,504Bolivia 4 .................................................. 157 169 172 166 190 141 139 139Brazil....................................................... 20,454 31,500 28,283 38,986 32,071 33,544 28,808 30,929Chile ....................................................... 7,152 9,829 10,270 11,379 11,884 10,163 9,972 11,231Colombia ................................................ 2,915 4,972 4,955 4,781 4,658 4,232 3,405 3,108Costa Rica 4............................................ 733 1,028 1,217 1,304 1,234 1,305 1,214 1,041Ecuador .................................................. 612 993 939 812 852 805 716 627El Salvador 4........................................... 872 831 797 772 801 900 856 754Guatemala.............................................. 1,055 1,348 1,358 1,433 1,411 1,273 1,319 1,162Honduras 4.............................................. 433 494 493 484 506 527 560 465Mexico .................................................... 17,936 24,582 26,865 26,011 27,060 27,336 27,365 25,832Nicaragua ............................................... 89 83 93 131 112 134 112 92Panama .................................................. 2,556 4,118 4,813 5,301 5,210 4,820 3,734 3,307Paraguay 4.............................................. 41 108 130 158 174 152 121 114Peru ........................................................ 1,474 3,092 4,487 4,978 4,964 4,589 3,684 3,338Uruguay.................................................. 361 415 406 396 419 413 381 414Venezuela .............................................. 2,477 2,580 2,153 2,109 2,082 1,634 1,558 1,568All other Latin America 4......................... 37 70 194 52 70 92 103 75
Total Latin America.............................. 62,331 90,463 91,974 103,803 98,785 96,284 87,943 90,700Caribbean:
Anguilla 5 ................................................ 5,281 6,493 8,151 8,248 13,151 10,375 7,785 7,639Bahamas ................................................ 194,510 238,924 275,145 212,868 219,149 286,358 244,821 198,061Barbados 5.............................................. 471 445 557 595 696 1,324 903 773
See footnotes at end of table.

CAPITAL MOVEMENTS
December 2009
69
TABLE CM-II-2.—Total Claims by Country, con. [Position at end of period in millions of dollars. Source: Treasury International Capital Reporting System]
2007 2008 2009 Country
Calendar year 2006 Dec. r Mar. r June r Sept. r Dec. r Mar. June p
Caribbean, con.
Bermuda...................................... 21,721 12,378 22,207 18,220 17,426 15,764 16,049 10,705British Virgin Islands 5.................. 4,270 4,857 17,010 16,675 18,814 6,744 7,997 8,848Cayman Islands........................... 835,646 972,317 1,037,505 1,074,223 999,004 1,051,856 1,060,174 1,042,355Dominican Republic 5 .................. 650 686 720 796 763 782 782 769Haiti 5............................................ 50 46 52 76 76 92 58 53Jamaica ....................................... 695 687 751 850 832 805 471 447Netherlands Antilles .................... 2,686 4,624 9,826 6,594 6,468 5,980 8,127 7,803Trinidad and Tobago ................... 1,055 673 725 810 607 730 535 683All other Caribbean 5 ................... 383 770 786 676 555 455 501 438
Total Caribbean ........................ 1,067,418 1,242,900 1,373,435 1,340,631 1,277,541 1,381,265 1,348,203 1,278,574Asia:
China, Mainland. ......................... 15,915 19,359 17,655 21,230 11,162 3,339 3,128 5,110Hong Kong .................................. 8,300 10,263 10,591 10,040 14,755 12,932 7,685 7,297India............................................. 3,209 4,588 4,620 5,984 6,182 6,203 6,471 6,845Indonesia..................................... 559 1,030 1,089 1,243 1,168 1,119 1,098 999Israel............................................ 6,568 5,031 4,912 4,907 3,595 2,604 2,151 1,832Japan........................................... 157,671 97,856 124,194 98,861 91,210 93,756 132,546 170,495Jordan 6........................................ 21 54 21 25 30 23 32 24Korea, South ............................... 25,258 28,247 28,428 22,063 16,459 13,595 12,308 12,537Lebanon....................................... 20 51 52 48 66 56 68 62Malaysia ...................................... 947 1,989 1,634 1,586 1,235 517 641 471Pakistan....................................... 29 164 64 115 195 76 51 45Philippines ................................... 1,020 1,271 1,835 1,517 930 1,080 759 821Singapore .................................... 5,519 6,662 8,176 7,758 7,306 9,566 8,554 9,483Taiwan......................................... 3,607 1,641 4,036 2,992 3,032 1,343 1,459 2,069Thailand....................................... 6,585 5,978 2,483 1,194 203 180 143 283Asian oil exporters 7 .................... 11,789 23,932 14,672 13,998 11,437 10,670 11,425 9,817All other Asia 6 ............................. 424 799 1,475 937 954 726 2,481 650
Total Asia.................................. 247,441 208,915 225,937 194,498 169,919 157,785 191,000 228,840Africa:
Cameroon 8.................................. 20 11 9 10 10 33 33 22Egypt ........................................... 1,833 1,488 1,773 1,940 2,014 1,288 852 1,034Ghana.......................................... 13 30 42 53 62 18 60 74Liberia.......................................... 296 331 341 270 328 355 380 370Morocco....................................... 84 50 45 55 30 33 9 21South Africa................................. 640 730 624 525 1,022 720 775 641African oil exporters 9 .................. 414 453 1,301 834 1,123 923 363 382All other Africa 8 ........................... 251 6,570 13,669 16,915 1,443 3,123 2,273 6,315
Total Africa ............................... 3,551 9,663 17,804 20,602 6,032 6,493 4,745 8,859Other countries:
Australia....................................... 26,600 43,465 36,869 44,099 40,826 35,746 41,296 51,299New Zealand ............................... 4,147 4,541 6,125 6,104 6,170 5,962 6,688 6,410All other ....................................... 242 316 486 425 526 598 593 546
Total other countries................. 30,989 48,322 43,480 50,628 47,522 42,306 48,577 58,255Total foreign countries ........... 3,128,641 3,797,065 4,122,895 3,928,473 3,783,120 3,589,958 3,621,559 3,692,107
International and regional orgs: International organizations .......... 11,279 13,581 13,921 7,592 7,227 5,016 6,107 4,226Regional organizations 10 ............ 644 1,202 1,043 722 2,215 3,165 2,359 759
Total international and regional organizations............ 11,923 14,783 14,964 8,314 9,442 8,181 8,466 4,985
Grand total ............................. 3,140,564 3,811,848 4,137,859 3,936,787 3,792,562 3,598,139 3,630,025 3,697,092 1 Before June 2006, data for Kazakhstan are included in “All other Europe.” 2 Includes Austria, Belgium, Finland, France, Germany, Greece, Ireland, Italy, Luxembourg, the Netherlands, Portugal, and Spain. For data as of January 2008, also includes Cyprus, Malta, and Slovenia. For data as of January 2009, also includes Slovakia. 3 As of May 2004, the European Union includes Austria, Belgium, Cyprus, the Czech Republic, Denmark, Estonia, Finland, France, Germany, Greece, Hungary, Ireland, Italy, Latvia, Lithuania, Luxembourg, Malta, the Netherlands, Poland, Portugal, Slovakia, Slovenia, Spain, Sweden, and the United Kingdom. Data available beginning June 2006. As of January 2007, also includes Bulgaria and Romania. 4 Before June 2006, data for Bolivia, Costa Rica, El Salvador, Honduras, and Paraguay are included in “All other Latin America.”
5 Before June 2006, data for Anguilla, Barbados, the British Virgin Islands, Dominican Republic, and Haiti are included in “All other Caribbean.” 6 Before June 2006, data for Jordan are included in “All other Asia.” 7 Includes Bahrain, Iran, Iraq, Kuwait, Oman, Qatar, Saudi Arabia, and United Arab Emirates (Trucial States). 8 Before June 2006, data for Cameroon are included in “All other Africa.” 9 Includes Algeria, Gabon, Libya, and Nigeria. 10 Includes European, Latin American, Caribbean, Asian, African, and Middle East organizations.

CAPITAL MOVEMENTS
December 2009
70
TABLE CM-II-3.—Total Claims on Foreigners by Type and Country, June 30, 2009 [Position at end of period in millions of dollars. Source: Treasury International Capital Reporting System]
Respondents’ own claims
Claims of domestic customers
Country
Total claims
(1)
Total own
claims (2)
Total own claims
payable in dollars
(3)
Foreign official
institutions and foreign
banks (4)
Claims on all other
foreigners (5)
Payable in foreign
currencies (6)
Total customer
claims (7)
Payable in
dollars (8)
Payable in foreign
currencies (9)
Europe:
Austria ............................................... 5,686 3,339 3,304 836 2,468 35 2,347 1,699 648Belgium.............................................. 14,352 11,976 11,514 10,409 1,105 462 2,376 1,267 1,109Czech Republic ................................. 156 155 118 117 1 37 1 - 1Denmark............................................ 12,296 668 554 325 229 114 11,628 11,363 265Finland............................................... 23,714 22,581 22,125 22,058 67 456 1,133 691 442France ............................................... 198,175 152,202 139,506 115,370 24,136 12,696 45,973 39,569 6,404Germany............................................ 125,645 100,638 88,583 63,112 25,471 12,055 25,007 17,282 7,725Greece............................................... 1,207 550 143 33 110 407 657 1 656Hungary ............................................. 290 283 265 53 212 18 7 - 7Ireland................................................ 59,756 54,067 53,010 39,415 13,595 1,057 5,689 4,840 849Italy .................................................... 55,813 46,120 43,926 43,770 156 2,194 9,693 5,421 4,272Kazakhstan........................................ 420 420 420 339 81 - - - -Luxembourg ...................................... 15,234 9,274 7,827 3,521 4,306 1,447 5,960 5,402 558Netherlands ....................................... 74,707 54,715 51,553 18,866 32,687 3,162 19,992 18,055 1,937Norway .............................................. 14,995 4,108 4,074 3,468 606 34 10,887 10,696 191Poland ............................................... 2,246 2,230 2,205 2,200 5 25 16 - 16Portugal ............................................. 4,017 2,506 2,502 2,068 434 4 1,511 927 584Romania ............................................ 128 128 121 2 119 7 - - -Russia................................................ 1,640 1,524 1,480 1,249 231 44 116 116 -Spain ................................................. 52,044 42,293 37,115 36,631 484 5,178 9,751 6,909 2,842Sweden.............................................. 22,663 5,172 4,716 3,610 1,106 456 17,491 17,166 325Switzerland........................................ 95,965 83,360 74,167 66,180 7,987 9,193 12,605 12,497 108Turkey................................................ 4,358 4,334 3,280 2,640 640 1,054 24 6 18United Kingdom................................. 1,071,137 893,352 805,420 645,352 160,068 87,932 177,785 171,718 6,067Channel Islands .................................. 19,545 8,496 8,084 2,534 5,550 412 11,049 10,040 1,009All other Europe ................................ 3,080 1,946 1,497 958 539 449 1,134 613 521
Total Europe ................................... 1,879,269 1,506,437 1,367,509 1,085,116 282,393 138,928 372,832 336,278 36,554Memo: Euro Area 1 ............................... 631,655 500,830 461,501 356,368 105,133 39,329 130,825 102,391 28,434Canada................................................. 147,610 111,788 87,119 68,462 18,657 24,669 35,822 30,020 5,802Latin America:
Argentina ........................................... 6,504 3,995 3,871 706 3,165 124 2,509 2,495 14Bolivia ................................................ 139 139 126 5 121 13 - - -Brazil.................................................. 30,929 30,833 29,536 14,211 15,325 1,297 96 63 33Chile .................................................. 11,231 11,226 10,739 5,427 5,312 487 5 4 1Colombia ........................................... 3,108 3,108 2,562 934 1,628 546 - - -Costa Rica ........................................ 1,041 1,041 1,029 163 866 12 - - -Ecuador ............................................. 627 614 614 59 555 - 13 13 -El Salvador ....................................... 754 754 754 296 458 - - - -Guatemala......................................... 1,162 1,162 1,122 571 551 40 - - -Honduras .......................................... 465 465 464 188 276 1 - - -Mexico ............................................... 25,832 25,712 24,624 821 23,803 1,088 120 6 114Panama ............................................. 3,307 3,307 3,224 1,944 1,280 83 - - -Peru ................................................... 3,338 3,326 3,256 1,084 2,172 70 12 9 3Uruguay............................................. 414 414 396 29 367 18 - - -Venezuela ......................................... 1,568 1,563 1,479 232 1,247 84 5 5 -All other Latin America ..................... 281 281 281 85 196 - - - -
Total Latin America......................... 90,700 87,940 84,077 26,755 57,322 3,863 2,760 2,595 165 See footnotes at end of table.

CAPITAL MOVEMENTS
December 2009
71
TABLE CM-II-3.—Total Claims on Foreigners by Type and Country, June 30, 2009, con. [Position at end of period in millions of dollars. Source: Treasury International Capital Reporting System]
Respondents’ own claims
Claims of domestic customers
Country
Total claims
(1)
Total own
claims (2)
Total own claims
payable in dollars
(3)
Foreign official
institutions and foreign
banks (4)
Claims on all other
foreigners (5)
Payable in foreign
currencies (6)
Total customer
claims (7)
Payable in
dollars (8)
Payable in foreign
currencies (9)
Caribbean:
Bahamas ........................................... 198,061 140,904 140,278 135,755 4,523 626 57,157 57,117 40 Bermuda............................................ 10,705 10,402 7,646 85 7,561 2,756 303 303 - British Virgin Islands ......................... 8,848 8,789 7,829 475 7,354 960 59 59 - Cayman Islands................................. 1,042,355 748,809 719,598 637,377 82,221 29,211 293,546 292,143 1,403 Dominican Republic ......................... 769 769 767 204 563 2 - - - Jamaica ............................................. 447 447 425 38 387 22 - - - Netherlands Antilles .......................... 7,803 7,796 7,590 940 6,650 206 7 7 - Trinidad and Tobago ......................... 683 683 683 108 575 - - - - All other Caribbean ........................... 8,903 8,902 6,937 214 6,723 1,965 1 1 -
Total Caribbean .............................. 1,278,574 927,501 891,753 775,196 116,557 35,748 351,073 349,630 1,443 Asia:
China, Mainland ................................ 5,110 5,022 3,947 3,483 464 1,075 88 59 29 Hong Kong ........................................ 7,297 7,177 6,635 4,725 1,910 542 120 18 102 India................................................... 6,845 6,497 6,249 5,226 1,023 248 348 348 - Indonesia........................................... 999 946 914 688 226 32 53 23 30 Israel.................................................. 1,832 1,820 1,776 1,545 231 44 12 2 10 Japan................................................. 170,495 160,514 140,209 125,835 14,374 20,305 9,981 9,279 702 Korea, South ..................................... 12,537 12,305 10,974 10,390 584 1,331 232 192 40 Malaysia ............................................ 471 448 408 135 273 40 23 2 21 Pakistan............................................. 45 44 42 39 3 2 1 - 1 Philippines ......................................... 821 797 776 682 94 21 24 3 21 Singapore .......................................... 9,483 9,368 8,148 6,464 1,684 1,220 115 5 110 Taiwan............................................... 2,069 1,912 1,718 1,422 296 194 157 4 153 Thailand............................................. 283 273 231 172 59 42 10 4 6 All other Asia ..................................... 10,553 10,390 10,178 8,409 1,769 212 163 157 6
Total Asia........................................ 228,840 217,513 192,205 169,215 22,990 25,308 11,327 10,096 1,231 Africa:
Egypt ................................................. 1,034 798 795 307 488 3 236 3 233 Ghana................................................ 74 72 52 39 13 20 2 2 - Liberia................................................ 370 370 370 1 369 - - - - Morocco............................................. 21 20 18 17 1 2 1 - 1 South Africa....................................... 641 374 326 278 48 48 267 - 267 All other Africa ................................... 6,719 6,621 6,289 256 6,033 332 98 98 -
Total Africa ..................................... 8,859 8,255 7,850 898 6,952 405 604 103 501 Other countries:
Australia............................................. 51,299 24,275 23,115 18,009 5,106 1,160 27,024 26,573 451 New Zealand ..................................... 6,410 2,082 808 621 187 1,274 4,328 4,308 20 All other ............................................. 546 546 545 1 544 1 - - -
Total other countries....................... 58,255 26,903 24,468 18,631 5,837 2,435 31,352 30,881 471 Total foreign countries ................. 3,692,107 2,886,337 2,654,981 2,144,273 510,708 231,356 805,770 759,603 46,167
International and regional orgs: International organizations ................ 4,226 2,809 2,809 - 2,809 - 1,417 1,417 - Regional organizations 2.................... 759 584 584 - 584 - 175 175 -
Total international and regional organizations .................................. 4,985 3,393 3,393 - 3,393 - 1,592 1,592 -
Grand total ................................... 3,697,092 2,889,730 2,658,374 2,144,273 514,101 231,356 807,362 761,195 46,167 1 Includes Austria, Belgium, Finland, France, Germany, Greece, Ireland, Italy, Luxembourg, the Netherlands, Portugal, and Spain. For data as of January 2008, also includes Cyprus, Malta, and Slovenia. For data as of January 2009, also includes Slovakia.
2 Includes European, Latin American, Caribbean, Asian, African, and Middle East regional organizations.

CAPITAL MOVEMENTS
December 2009
72
[In millions of dollars. Source: Treasury International Capital Reporting System]
Calendar years
Country 2005 2006 2007 2008 June 2009 United Kingdom ............................. 627,105 938,123 1,111,135 966,445 1,071,137 All other Europe ............................. 604,908 672,126 945,501 788,343 808,132 Caribbean banking centers 1 ......... 870,441 1,061,389 1,237,218 1,371,522 1,271,079 Japan ............................................. 114,713 157,671 97,856 93,756 170,495 All other Asia.................................. 92,387 89,770 111,059 64,029 58,345 Subtotal ........................................ 2,309,554 2,919,079 3,502,769 3,284,095 3,379,188
All other countries .......................... 190,845 221,485 309,079 314,044 317,904 Grand total ................................... 2,500,399 3,140,564 3,811,848 3,598,139 3,697,092
1 Includes Bahamas, Bermuda, Cayman Islands, Netherlands Antilles, and Panama. For data beginning June 2006, also includes the British Virgin Islands.
CHART CM-B.—U.S. Claims on Foreigners Reported by U.S. Banks, Brokers, and Dealers with Respect to Selected Countries
In June 2009, U.S. claims on foreigners reported by U.S. banks amounted to about $3.7 trillion, an increase of $99 billion from that recorded at yearend 2008. U.S. banking claims include holdings of foreign short-term securities but exclude holdings of foreign long-term securities. U.S. banking claims decreased $214 billion in 2008, but increased $671 billion in 2007 and $640 billion in 2006. Part of the 2006 increase reflects changes in coverage in the bank-reported data in the first and second quarters of 2006. Between June and December of 2006, when data were reported on a consistent basis, banking claims increased about $209 billion.
As with U.S. banking liabilities, U.S. banking claims on foreigners are concentrated in international financial centers. More than 60 percent of these claims are reported opposite the United Kingdom and banking centers in the Caribbean. Despite the turmoil in financial markets over the past 2 years, the geographic distribution of U.S. banking claims on foreigners is similar now to that of 2006.
0
200
400
600
800
1000
1200
1400
1600
2005 2006 2007 2008 June 2009
United Kingdom All other Europe Caribbean banking centers
Japan All other Asia All other countries
(In billions of dollars)

CAPITAL MOVEMENTS
December 2009
73
SECTION III.—Liabilities to, and Claims on, Unaffiliated Foreigners Reported by Nonbanking Business Enterprises
in the United States
TABLE CM-III-1.—Total Liabilities and Claims by Type [Position at end of period in millions of dollars. Source: Treasury International Capital Reporting System]
Calendar year 2008 2009 Type of liability or claim 2005 2006 2007 June Sept. r Dec. r Mar. June p
Total liabilities ................................................... 76,710 89,217 103,835 107,738 108,356 78,552 70,124 83,313
Payable in dollars.......................................... 58,728 72,331 79,161 86,917 92,313 69,128 61,241 60,419Financial.................................................... 24,003 35,033 26,474 21,646 26,589 18,654 16,146 13,910
Short-term negotiable securities........... 3,248 8,266 1,983 3,338 3,020 2,740 2,869 1,872Other ..................................................... 20,755 26,767 24,491 18,308 23,569 15,914 13,277 12,038
Commercial ............................................... 34,725 37,298 52,687 65,271 65,724 50,474 45,095 46,509Trade payables ..................................... 21,751 24,101 26,261 36,280 32,599 18,811 18,990 20,852Advance receipts and other .................. 12,974 13,197 26,426 28,991 33,125 31,663 26,105 25,657
Payable in foreign currencies ....................... 17,982 16,886 24,674 20,821 16,043 9,424 8,883 22,894By major foreign currency:
Canadian dollars ................................... 2,525 3,536 2,162 1,790 1,910 2,118 1,947 3,461Euros..................................................... 5,041 5,239 9,075 9,624 6,010 3,048 2,223 6,542United Kingdom pounds sterling........... 3,640 4,494 4,267 4,589 3,395 1,361 1,403 1,557Japanese yen........................................ 2,326 1,770 3,908 2,597 2,955 962 949 889Other ..................................................... 4,450 1,847 5,262 2,221 1,773 1,935 2,361 10,445
By type of liability: Financial................................................ 15,246 13,679 21,445 17,639 13,037 6,550 5,706 17,403
Short-term negotiable securities....... 5,802 3,351 2,940 3,036 3,143 2,108 1,294 3,893Other ................................................. 9,444 10,328 18,505 14,603 9,894 4,442 4,412 13,510
Commercial ........................................... 2,736 3,207 3,229 3,182 3,006 2,874 3,177 5,491Trade payables ................................. 1,299 1,572 1,605 1,515 1,364 1,334 1,277 3,628Advance receipts and other .............. 1,437 1,635 1,624 1,667 1,642 1,540 1,900 1,863
Total claims....................................................... 144,950 126,032 136,416 156,463 166,815 107,657 93,826 107,542Payable in dollars.......................................... 105,700 100,031 110,070 133,269 143,981 92,376 84,626 83,743
Financial.................................................... 75,802 66,871 66,726 85,051 98,399 51,789 40,290 39,928Non-negotiable deposits ....................... 42,140 28,380 28,393 51,361 34,979 15,674 12,616 13,095Negotiable CDs and short-term negotiable instruments.......................... 12,888 2,624 1,168 1,276 857 1,133 945 1,023Other ..................................................... 20,774 35,867 37,165 32,414 62,563 34,982 26,729 25,810
Commercial ............................................... 29,898 33,160 43,344 48,218 45,582 40,587 44,336 43,815Trade receivables ................................. 26,080 29,388 37,108 41,111 39,565 31,161 32,638 32,107Advance payments and other ............... 3,818 3,772 6,236 7,107 6,017 9,426 11,698 11,708
Payable in foreign currencies ....................... 39,250 26,001 26,346 23,194 22,834 15,281 9,200 23,799By major foreign currency:
Canadian dollars ................................... 9,829 9,194 5,371 4,911 5,546 4,168 1,892 2,398Euros..................................................... 10,643 6,951 10,833 9,846 8,310 3,432 2,656 5,264United Kingdom pounds sterling........... 8,341 4,675 4,210 4,036 3,701 1,526 1,300 1,754Japanese yen........................................ 3,724 1,027 1,378 1,064 1,117 340 543 669Other ..................................................... 6,713 4,154 4,554 3,337 4,160 5,815 2,809 13,714
By type of claim: Financial................................................ 35,592 21,775 21,305 20,059 19,661 11,466 5,320 18,661
Non-negotiable deposits ................... 8,009 3,529 1,498 1,464 1,566 1,623 1,743 2,002Short-term negotiable securities....... 292 120 77 111 93 65 111 133Other ................................................. 27,291 18,126 19,730 18,484 18,002 9,778 3,466 16,526
Commercial ........................................... 3,658 4,226 5,041 3,135 3,173 3,815 3,880 5,138Trade receivables ............................. 3,151 3,414 4,684 2,900 2,910 3,595 3,647 4,952Advance payments and other ........... 507 812 357 235 263 220 233 186

CAPITAL MOVEMENTS
December 2009
74
TABLE CM-III-2.—Total Liabilities to Unaffiliated Foreigners by Country [Position at end of period in millions of dollars. Source: Treasury International Capital Reporting System]
Calendar year 2008 2009 Country 2004 2005 2006 2007 June Sept. r Dec. r Mar. June p
Europe:
Austria.................................. 146 68 91 230 115 79 95 97 83 Belgium ................................... 74 73 181 492 1,194 873 427 389 375 Bulgaria ................................... 2 - 44 36 6 4 1 2 4 Czech Republic....................... 34 17 14 25 48 34 45 49 41 Denmark.................................. 41 78 132 937 156 164 90 82 149 Finland .................................... 38 20 140 63 160 192 52 109 108 France ..................................... 2,368 2,631 2,562 3,165 2,173 3,185 2,842 2,434 3,272 Germany ................................. 3,935 3,646 12,391 4,977 2,912 3,613 3,325 3,102 4,521 Greece .................................... 248 401 182 187 348 300 241 250 220 Hungary................................... 14 12 18 46 21 24 30 22 25 Ireland ..................................... 1,070 1,636 316 1,569 1,315 1,579 1,344 1,186 1,690 Italy.......................................... 795 1,174 1,040 1,196 448 1,398 481 374 518 Luxembourg ............................ 824 378 977 235 168 369 250 249 652 Netherlands............................. 668 895 1,709 1,194 1,417 1,162 1,255 1,012 1,125 Norway .................................... 1,365 3,537 545 721 1,129 475 385 380 543 Poland ..................................... 151 229 330 385 359 350 269 240 239 Portugal................................... 22 39 27 205 41 43 35 35 46 Romania.................................. 33 4 9 6 42 57 71 85 84 Russia ..................................... 74 64 110 306 498 523 524 424 337 Serbia and Montenegro
(formerly Yugoslavia).......... 2 4 1 3 2 1 6 5 4 Spain ....................................... 591 399 269 533 692 787 772 635 550 Sweden ................................... 800 747 952 438 271 264 274 247 242 Switzerland ............................. 1,078 1,237 1,070 1,705 2,834 2,984 1,442 1,560 1,838 Turkey ..................................... 180 137 261 754 749 757 709 769 908 United Kingdom ...................... 32,878 15,093 17,339 23,350 22,946 19,578 12,000 9,856 13,775 Channel Islands and
Isle of Man .......................... 2 501 15 208 117 120 95 82 95 Other Europe .......................... 286 250 421 539 466 628 435 534 598
Total Europe ....................... 47,720 33,271 41,146 43,505 40,627 39,543 27,495 24,209 32,042
Canada........................................ 4,578 4,905 7,694 7,767 7,237 7,376 5,600 5,574 7,185 Latin America:
Argentina................................. 59 148 138 156 158 114 89 83 158 Brazil ....................................... 321 288 264 940 1,113 1,109 626 643 590 Chile ........................................ 91 387 406 546 605 437 353 378 390 Colombia................................. 84 106 208 356 360 393 332 456 575 Ecuador................................... 26 10 89 33 140 142 30 74 40 Guatemala .............................. 10 23 25 10 8 10 8 11 10 Mexico..................................... 1,968 2,234 2,150 2,848 4,200 2,655 1,579 1,663 2,102 Panama................................... 7 56 57 85 87 105 166 119 201 Peru......................................... 17 8 6 36 113 57 34 36 42 Uruguay................................... 2 2 13 20 26 13 12 14 5 Venezuela ............................... 451 681 353 575 1,187 1,338 413 575 825 Other Latin America................ 113 105 24 106 73 50 50 61 64
Total Latin America ................ 3,149 4,048 3,733 5,711 8,070 6,423 3,692 4,113 5,002 Caribbean:
Bahamas................................. 32 70 70 89 163 111 49 58 127 Bermuda...................................... 9,230 1,704 777 707 1,103 783 723 758 1,583 Cayman Islands ...................... 7,279 6,522 12,804 15,969 13,494 14,495 10,303 8,337 8,559 Cuba........................................ - - - - - - - 10 - Jamaica................................... 24 14 20 18 26 35 37 30 29 Netherlands Antilles ................ 14 13 2 4 5 5 6 2 10 Trinidad and Tobago............... 15 44 25 74 93 72 60 45 59 Other Caribbean ..................... 729 936 761 803 894 778 444 762 899
Total Caribbean .................. 17,323 9,303 14,459 17,664 15,778 16,279 11,622 10,002 11,266 See footnotes at end of table.

CAPITAL MOVEMENTS
December 2009
75
TABLE CM-III-2.—Total Liabilities to Unaffiliated Foreigners by Country, con. [Position at end of period in millions of dollars. Source: Treasury International Capital Reporting System]
Calendar year 2008 2009 Country 2004 2005 2006 2007 June Sept. r Dec. r Mar. June p
Asia:
China, Mainland. ....................... 3,983 3,825 1,297 857 4,746 5,437 4,769 4,587 4,511 Hong Kong ................................ 668 746 564 981 922 989 593 567 706 India........................................... 103 158 418 1,447 1,289 1,263 1,083 1,113 1,093 Indonesia................................... 74 89 57 172 253 414 366 369 377 Israel.......................................... 302 613 385 293 280 315 292 244 218 Japan......................................... 5,869 7,354 7,210 6,888 6,579 7,578 5,996 5,995 6,275 Korea, South ............................. 723 1,743 1,350 1,213 1,237 1,585 1,314 764 813 Lebanon .................................... 35 42 11 9 18 11 15 6 8 Malaysia .................................... 256 335 471 562 555 348 363 462 477 Pakistan..................................... 171 230 171 172 62 71 28 45 25 Philippines................................. 117 109 95 89 91 117 107 87 81 Singapore.................................. 822 1,823 2,839 4,255 2,279 4,488 3,767 1,754 1,912 Syria .......................................... 21 4 8 8 8 9 3 3 3 Taiwan....................................... 491 1,010 1,093 1,019 877 815 722 676 801 Thailand..................................... 79 212 599 380 341 396 295 271 301 Oil-exporting countries1............. 2,946 4,159 3,955 7,158 12,304 10,382 6,380 5,718 6,712 Other Asia ................................. 303 298 156 377 245 302 460 258 291
Total Asia .............................. 16,963 22,750 20,679 25,880 32,086 34,520 26,553 22,919 24,604 Africa:
Congo (formerly Zaire).............. - - - - - - - - - Egypt ......................................... 132 119 132 280 291 297 293 289 338 Ghana........................................ 2 1 6 12 18 2 5 4 3 Liberia........................................ 14 1 3 6 75 85 64 65 67 Morocco..................................... 44 42 42 190 124 120 112 102 81 South Africa............................... 36 950 35 52 68 296 54 74 273 Oil-exporting countries 2............ 518 590 283 655 1,108 919 764 773 784 Other Africa ............................... 332 210 379 294 332 529 341 379 263
Total Africa ............................ 1,078 1,913 880 1,489 2,016 2,248 1,633 1,686 1,809 Other countries:
Australia .................................... 1,047 397 560 1,658 1,784 1,810 1,794 1,482 1,246 New Zealand ............................. 51 38 36 91 75 78 92 97 126 All other ..................................... 98 83 15 25 31 33 30 31 31
Total other countries ............. 1,196 518 611 1,774 1,890 1,921 1,916 1,610 1,403 Total foreign countries ...... 92,007 76,708 89,202 103,790 107,704 108,310 78,511 70,113 83,311
International and regional orgs: International organizations........ - - - 2 - - 7 2 - Regional organizations 3 ........... 2 2 15 43 34 46 34 9 2
Total international and regional organizations........... 2 2 15 45 34 46 41 11 2
Grand total ........................ 92,009 76,710 89,217 103,835 107,738 108,356 78,552 70,124 83,313 1 Includes Bahrain, Iran, Iraq, Kuwait, Oman, Qatar, Saudi Arabia and the United Arab Emirates (Trucial States). 2 Includes Algeria, Gabon, Libya, and Nigeria.
3 Includes European, Latin American, Caribbean, Asian, African, and Middle East regional organizations.

CAPITAL MOVEMENTS
December 2009
76
TABLE CM-III-3.—Total Claims on Unaffiliated Foreigners by Country [Position at end of period in millions of dollars. Source: Treasury International Capital Reporting System]
Calendar year 2008 2009 Country 2004 2005 2006 2007 June Sept. r Dec. r Mar. June p
Europe: Austria .......................................... 1,816 2,159 2,031 2,039 1,998 2,495 1,950 1,914 1,856 Belgium ........................................ 2,307 1,822 419 807 2,683 3,059 394 675 668 Bulgaria ........................................ 37 29 3 6 7 6 15 4 4 Czech Republic............................ 64 49 50 134 93 93 85 94 105 Denmark....................................... 494 341 149 184 677 287 136 104 80 Finland ......................................... 617 336 591 805 1,724 442 543 641 597 France .......................................... 3,713 5,063 3,420 6,061 6,979 14,539 2,878 2,592 2,204 Germany ...................................... 6,787 4,238 10,148 4,926 13,704 5,903 8,468 4,841 4,655 Greece ......................................... 199 380 163 250 260 244 195 191 210 Hungary........................................ 46 57 45 153 165 107 95 95 87 Ireland .......................................... 1,672 795 858 968 3,821 3,544 924 1,065 2,125 Italy............................................... 2,434 3,702 2,337 2,515 2,217 1,680 1,308 1,897 1,900 Luxembourg ................................. 127 391 352 919 577 547 218 188 220 Netherlands.................................. 7,883 3,387 3,570 3,989 4,674 3,145 2,209 2,328 2,072 Norway ......................................... 229 402 366 325 602 413 273 322 302 Poland .......................................... 57 58 99 153 167 165 135 123 151 Portugal........................................ 146 60 64 89 116 82 76 89 69 Romania....................................... 47 22 36 60 41 57 54 53 67 Russia .......................................... 157 359 774 1,326 664 714 694 616 819 Serbia and Montenegro
(formerly Yugoslavia)............... 14 17 10 15 17 13 14 15 17 Spain ............................................ 1,242 2,032 1,425 1,625 2,070 2,227 1,284 969 1,010 Sweden ........................................ 648 503 652 689 553 514 494 490 558 Switzerland .................................. 2,506 1,876 1,424 2,143 2,100 1,743 1,846 1,679 1,692 Turkey .......................................... 594 638 420 732 604 589 595 548 579 United Kingdom ........................... 27,699 24,772 17,483 23,662 25,837 34,893 11,754 9,858 18,063 Channel Islands and
Isle of Man ............................... 25 16 19 109 102 91 85 70 507 Other Europe ............................... 607 1,315 1,267 1,465 931 2,166 1,033 554 472
Total Europe ............................ 62,171 54,820 48,175 56,149 73,383 79,758 37,755 32,015 41,089
Canada............................................. 8,429 16,122 17,520 16,418 16,044 16,214 13,185 8,864 10,651 Latin America:
Argentina...................................... 406 350 470 463 596 506 479 434 415 Brazil ............................................ 2,758 2,972 2,927 2,682 2,823 2,729 2,614 2,106 2,068 Chile ............................................. 346 303 299 404 641 644 575 497 473 Colombia...................................... 295 299 349 449 497 558 463 453 378 Ecuador........................................ 86 95 119 160 250 250 173 132 101 Guatemala ................................... 90 100 116 200 218 189 180 152 163 Mexico.......................................... 3,756 4,108 3,242 3,505 4,360 4,095 3,374 2,887 3,269 Panama........................................ 177 198 266 323 463 441 408 420 373 Peru.............................................. 95 117 164 196 278 349 271 232 182 Uruguay........................................ 13 5 12 33 74 110 106 88 89 Venezuela .................................... 474 539 481 669 671 608 657 732 1,676 Other Latin America..................... 504 485 376 431 480 453 438 366 374
Total Latin America ...................... 9,000 9,571 8,821 9,515 11,351 10,932 9,738 8,499 9,561 Caribbean:
Bahamas...................................... 1,631 1,631 3,949 2,200 1,725 6,703 353 1,108 400 Bermuda............................................ 5,358 2,238 1,734 1,704 1,793 2,477 1,722 1,790 2,843 Cayman Islands ........................... 36,320 36,416 26,051 16,987 26,742 24,338 22,658 16,709 18,532 Cuba............................................. 8 12 2 10 - - - 2 -Jamaica........................................ 67 70 60 106 82 86 80 78 58 Netherlands Antilles ..................... 37 42 30 118 46 62 112 92 88 Trinidad and Tobago.................... 120 119 125 172 111 92 111 110 79 Other Caribbean .......................... 1,085 1,721 1,264 1,518 1,711 1,272 1,013 1,122 1,041
Total Caribbean ....................... 44,626 42,249 33,215 22,815 32,210 35,030 26,049 21,011 23,041 See footnotes at end of table.

CAPITAL MOVEMENTS
December 2009
77
TABLE CM-III-3.—Total Claims on Unaffiliated Foreigners by Country, con. [Position at end of period in millions of dollars. Source: Treasury International Capital Reporting System]
Calendar year 2008 2009 Country 2004 2005 2006 2007 June Sept. r Dec. r Mar. June p
Asia:
China, Mainland. ....................... 3,688 4,958 1,772 1,913 2,156 2,165 1,896 2,545 1,577 Hong Kong ................................ 701 941 1,009 8,762 1,205 1,220 827 826 961 India .......................................... 643 413 654 812 824 891 695 634 692 Indonesia................................... 393 445 231 206 259 332 275 342 562 Israel ......................................... 482 403 360 601 610 586 590 431 328 Japan ........................................ 2,848 2,696 3,349 5,518 5,526 5,300 4,352 4,126 3,455 Korea, South ............................. 1,569 1,244 1,143 1,272 1,229 1,247 1,017 2,108 2,428 Lebanon .................................... 15 22 19 19 26 34 44 28 23 Malaysia .................................... 549 536 270 362 311 271 421 234 234 Pakistan .................................... 43 57 86 115 67 48 33 49 30 Philippines................................. 503 275 109 109 131 89 67 66 60 Singapore.................................. 1,600 1,944 1,811 2,809 2,187 2,253 1,478 3,607 3,552 Syria .......................................... 14 6 10 1 2 - 12 4 14 Taiwan....................................... 892 853 972 1,240 1,174 1,100 995 998 1,596 Thailand .................................... 326 295 312 416 441 373 330 351 351 Oil-exporting countries 1............ 1,208 1,800 1,814 2,552 2,081 2,846 3,392 3,159 3,168 Other Asia ................................. 309 408 328 513 174 197 179 135 169
Total Asia .............................. 15,783 17,296 14,249 27,220 18,403 18,952 16,603 19,643 19,200 Africa:
Congo (formerly Zaire).............. 1 1 11 6 5 5 5 - -Egypt ......................................... 159 194 165 296 302 267 363 178 216 Ghana ....................................... 4 16 3 8 10 3 7 2 6 Liberia ....................................... 102 98 73 54 51 53 54 51 49 Morocco .................................... 33 23 21 21 30 23 24 13 23 South Africa .............................. 193 1,075 221 254 320 331 356 330 324 Oil-exporting countries 2............ 162 295 332 350 396 396 300 316 367 Other Africa............................... 281 419 411 400 736 717 495 498 506
Total Africa ............................ 935 2,121 1,237 1,389 1,850 1,795 1,604 1,388 1,491 Other countries:
Australia .................................... 1,588 2,144 2,365 2,467 2,710 3,748 2,485 2,202 2,294 New Zealand............................. 441 420 351 145 152 167 103 67 90 All other ..................................... 245 207 76 37 17 17 13 14 12
Total other countries ............. 2,274 2,771 2,792 2,649 2,879 3,932 2,601 2,283 2,396 Total foreign countries ...... 143,218 144,950 126,009 136,155 156,120 166,613 107,535 93,703 107,429
International and regional orgs: International organizations........ 3 - 4 150 231 28 21 46 38 Regional organizations 3 ........... 11 - 19 111 112 174 101 77 75
Total international and regional organizations........... 14 - 23 261 343 202 122 123 113
Grand total ........................ 143,232 144,950 126,032 136,416 156,463 166,815 107,657 93,826 107,542
1 Includes Bahrain, Iran, Iraq, Kuwait, Oman, Qatar, Saudi Arabia, and the United Arab Emirates (Trucial States). 2 Includes Algeria, Gabon, Libya, and Nigeria.
3 Includes European, Latin American, Caribbean, Asian, African, and Middle East regional organizations.

CAPITAL MOVEMENTS
December 2009
78
TABLE CM-III-4.—Total Liabilities to, and Claims on, Unaffiliated Foreigners, by Type and Country, June 30, 2009, Preliminary
[Position at end of period in millions of dollars. Source: Treasury International Capital Reporting System]
Liabilities Claims
Country Total liabilities
(1) Financial
(2) Commercial
(3) Total claims
(4) Financial
(5) Commercial
(6)
Europe: Austria ........................................... 83 36 47 1,856 1,783 73 Belgium ......................................... 375 76 299 668 526 142 Bulgaria ......................................... 4 - 4 4 - 4 Czech Republic ............................. 41 - 41 105 4 101 Denmark........................................ 149 11 138 80 12 68 Finland........................................... 108 52 56 597 155 442 France ........................................... 3,272 1,493 1,779 2,204 476 1,728 Germany........................................ 4,521 3,007 1,514 4,655 2,096 2,559 Greece........................................... 220 27 193 210 108 102 Hungary......................................... 25 8 17 87 42 45 Ireland ........................................... 1,690 796 894 2,125 1,744 381 Italy................................................ 518 1 517 1,900 9 1,891 Luxembourg .................................. 652 458 194 220 127 93 Netherlands................................... 1,125 460 665 2,072 1,033 1,039 Norway .......................................... 543 58 485 302 197 105 Poland ........................................... 239 1 238 151 22 129 Portugal ......................................... 46 5 41 69 1 68 Romania........................................ 84 - 84 67 34 33 Russia ........................................... 337 74 263 819 292 527 Serbia and Montenegro
(formerly Yugoslavia) ................ 4 - 4 17 - 17 Spain ............................................. 550 191 359 1,010 412 598 Sweden ......................................... 242 6 236 558 221 337 Switzerland.................................... 1,838 188 1,650 1,692 1,039 653 Turkey ........................................... 908 29 879 579 424 155 United Kingdom............................. 13,775 10,582 3,193 18,063 12,508 5,555 Channel Islands and
Isle of Man................................. 95 94 1 507 499 8 Other Europe................................. 598 57 541 472 244 228
Total Europe.............................. 32,042 17,710 14,332 41,089 24,008 17,081
Canada.............................................. 7,185 2,615 4,570 10,651 6,968 3,683 Latin America:
Argentina....................................... 158 10 148 415 26 389 Brazil ............................................. 590 29 561 2,068 1,098 970 Chile .............................................. 390 15 375 473 79 394 Colombia ....................................... 575 104 471 378 22 356 Ecuador......................................... 40 2 38 101 9 92 Guatemala..................................... 10 1 9 163 49 114 Mexico ........................................... 2,102 63 2,039 3,269 1,012 2,257 Panama......................................... 201 15 186 373 221 152 Peru............................................... 42 - 42 182 34 148 Uruguay......................................... 5 - 5 89 1 88 Venezuela ..................................... 825 14 811 1,676 151 1,525 Other Latin America ...................... 64 1 63 374 115 259
Total Latin America........................ 5,002 254 4,748 9,561 2,817 6,744 Caribbean:
Bahamas ....................................... 127 - 127 400 365 35 Bermuda ............................................. 1,583 634 949 2,843 1,806 1,037 Cayman Islands................................ 8,559 7,859 700 18,532 18,157 375 Cuba.............................................. - - - - - - Jamaica......................................... 29 6 23 58 11 47 Netherlands Antilles ...................... 10 - 10 88 - 88 Trinidad and Tobago..................... 59 3 56 79 37 42 Other Caribbean............................ 899 203 696 1,041 392 649
Total Caribbean......................... 11,266 8,705 2,561 23,041 20,768 2,273 See footnotes at end of table.

CAPITAL MOVEMENTS
December 2009
79
TABLE CM-III-4.—Total Liabilities to, and Claims on, Unaffiliated Foreigners, by Type and Country, June 30, 2009, Preliminary, con.
[Position at end of period in millions of dollars. Source: Treasury International Capital Reporting System]
Liabilities Claims
Country Total liabilities
(1) Financial
(2) Commercial
(3) Total claims
(4) Financial
(5) Commercial
(6)
Asia: China, Mainland ............................ 4,511 56 4,455 1,577 120 1,457 Hong Kong .................................... 706 37 669 961 109 852 India............................................... 1,093 20 1,073 692 172 520 Indonesia....................................... 377 18 359 562 169 393 Israel.............................................. 218 2 216 328 19 309 Japan............................................. 6,275 938 5,337 3,455 424 3,031 Korea, South ................................. 813 50 763 2,428 315 2,113 Lebanon ........................................ 8 1 7 23 2 21 Malaysia ........................................ 477 4 473 234 34 200 Pakistan......................................... 25 3 22 30 - 30 Philippines..................................... 81 3 78 60 10 50 Singapore...................................... 1,912 150 1,762 3,552 109 3,443 Syria .............................................. 3 - 3 14 - 14 Taiwan........................................... 801 2 799 1,596 101 1,495 Thailand......................................... 301 5 296 351 207 144 Other Asia ..................................... 291 45 246 169 21 148 Total Asia .................................... 24,604 1,426 23,178 19,200 2,008 17,192
Africa: Congo (formerly Zaire).................. - - - - - - Egypt ............................................. 338 - 338 216 7 209 Ghana............................................ 3 1 2 6 1 5 Liberia............................................ 67 58 9 49 44 5 Morocco......................................... 81 1 80 23 1 22 South Africa................................... 273 239 34 324 192 132 Other Africa ................................... 263 21 242 506 152 354
Total Africa ................................ 1,809 320 1,489 1,491 462 1,029 Other countries:
Australia ........................................ 1,246 279 967 2,294 1,524 770 New Zealand ................................. 126 2 124 90 16 74 All other ......................................... 31 2 29 12 3 9
Total other countries ................. 1,403 283 1,120 2,396 1,543 853 Total foreign countries .......... 83,311 31,313 51,998 107,429 58,574 48,855
International and regional orgs: International organizations............ - - - 38 15 23 Regional organizations 1 ............... 2 - 2 75 - 75
Total international and regional organizations............... 2 - 2 113 15 98
Grand total ............................ 83,313 31,313 52,000 107,542 58,589 48,953
1 Includes European, Latin American, Caribbean, Asian, African, and Middle East regional organizations.

CAPITAL MOVEMENTS
December 2009
80
SECTION IV.—U.S. International Transactions in Long-Term Securities TABLE CM-IV-1.—U.S. Transactions with Foreigners in Long-Term Domestic Securities by Type
[In millions of dollars; negative figures indicate net sales by foreigners to U.S. residents or a net outflow of capital from the United States. Source: Treasury International Capital Reporting System]
Marketable Treasury bonds and notes Net foreign purchases
Foreign countries U.S. Government corporations and
federally-sponsored agencies
Calendar year or month
Total (1)
Official institutions
(2)
Other foreigners
(3)
International and regional
(4)
Gross foreign purchases (5)
Gross foreign sales
(6)
Net foreign purchases
(7)
Gross foreign purchases
(8)
Gross foreign sales
(9)
2005 …………………………… 338,112 68,689 266,471 2,952 10,051,248 9,713,136 219,256 1,097,458 878,202 2006 ......................................... 195,536 69,639 125,075 822 10,957,936 10,762,400 286,464 1,572,160 1,285,696 2007 ......................................... 197,967 2,994 196,021 -1,048 15,127,526 14,929,559 218,979 2,050,451 1,831,472 2008 ......................................... 315,391 76,619 239,216 -444 14,627,522 14,312,131 -39,434 2,588,397 2,627,831 2009 - Jan. - Sept. p ................ 311,261 90,945 220,326 -10 8,119,939 7,808,678 -15,964 833,500 849,464 2008 - Sept............................... 20,116 4,944 14,896 276 1,628,400 1,608,284 4,497 190,617 186,120
Oct................................ 32,872 -1,084 34,476 -520 1,179,175 1,146,303 -50,216 201,719 251,935 Nov ............................... -25,815 -26,205 -169 559 689,317 715,132 -22,492 140,861 163,353 Dec ............................... 14,970 3,851 11,823 -704 667,627 652,657 -37,444 112,314 149,758
2009 - Jan ................................ 10,720 -1,940 12,695 -35 620,678 609,958 -15,500 105,082 120,582 Feb ............................... 21,551 -1,959 23,602 -92 702,057 680,506 1,091 119,101 118,010 Mar ............................... 55,303 29,026 26,737 -460 903,855 848,552 -15,596 91,200 106,796 Apr................................ 41,892 17,125 24,787 -20 733,555 691,663 -2,480 104,037 106,517 May............................... -22,550 -21,763 -343 -444 786,779 809,329 12,810 90,765 77,955 June ............................. 100,529 22,498 77,634 397 1,256,557 1,156,028 5,061 99,122 94,061 July ............................... 31,129 15,808 14,644 677 942,687 911,558 -4,637 73,261 77,898 Aug. p ........................... 28,000 13,184 15,448 -632 1,065,654 1,037,654 5,058 76,973 71,915 Sept. p .......................... 44,687 18,966 25,122 599 1,108,117 1,063,430 -1,771 73,959 75,730
Corporate and other securities Bonds * Stocks
Calendar year or month
Net foreign purchases
(10)
Gross foreign purchases (11)
Gross foreign sales (12)
Net foreign purchases
(13)
Gross foreign purchases
(14)
Gross foreign sales (15)
2005 .............................................................................. 372,222 1,277,006 904,784 81,950 4,731,749 4,649,799 2006 .............................................................................. 510,806 1,678,464 1,167,658 150,415 6,868,571 6,718,156 2007 .............................................................................. 393,355 1,913,307 1,519,952 195,521 10,639,315 10,443,794 2008 ............................................................................. 93,487 1,466,954 1,373,467 40,736 11,990,535 11,949,799 2009 - Jan. – Sept. p..................................................... -28,679 928,976 957,655 105,143 4,871,110 4,765,967
2008 - Sept.................................................................... -8,439 93,859 102,298 11,512 1,168,886 1,157,374
Oct..................................................................... -13,064 91,136 104,200 -6,212 1,019,890 1,026,102 Nov .................................................................... -16,206 81,420 97,626 4,430 634,851 630,421 Dec .................................................................... 40,964 139,166 98,202 3,872 561,120 557,248
2009 - Jan ..................................................................... -8,280 92,939 101,219 1,407 507,335 505,928 Feb .................................................................... 3,331 134,001 130,670 -5,143 491,529 496,672 Mar .................................................................... 6,669 131,109 124,440 13,150 620,646 607,496 Apr..................................................................... -9,727 86,226 95,953 4,579 550,925 546,346 May.................................................................... 927 103,345 102,418 16,731 563,801 547,070 June................................................................... -1,039 109,269 110,308 19,051 561,766 542,715 July .................................................................... -11,060 90,724 101,784 28,611 534,161 505,550 Aug. p ................................................................ -6,614 87,102 93,716 11,082 502,412 491,330 Sept. p ............................................................... -2,886 94,261 97,147 15,675 538,535 522,860
* Data include transactions in directly placed issues abroad by U.S. corporations and issues of States and municipalities.

CAPITAL MOVEMENTS
December 2009
81
TABLE CM-IV-2.—U.S. Transactions with Foreigners in Long-Term Foreign Securities by Type [In millions of dollars; negative figures indicate net sales by foreigners to U.S. residents or a net outflow of capital from the United States.
Source: Treasury International Capital Reporting System]
Foreign bonds Foreign stocks
Calendar year or month
Net foreign pur- chases of for- eign securities
from U.S. (1)
Net foreign purchases from
U.S. (2)
Gross foreign purchases from
U.S. (3)
Gross foreign sales to U.S.
(4)
Net foreign purchases from
U.S. (5)
Gross foreign purchases from
U.S. (6)
Gross foreign sales to U.S.
(7)
2005 ..................................................... -172,391 -45,095 1,459,882 1,504,977 -127,296 2,240,104 2,367,400
2006 ..................................................... -250,907 -144,452 1,879,713 2,024,165 -106,455 3,636,185 3,742,640
2007 ..................................................... -229,223 -133,923 2,971,803 3,105,726 -95,300 5,215,764 5,311,064
2008 ..................................................... 86,307 66,218 2,270,426 2,204,208 20,089 5,430,972 5,410,883
2009 - Jan. - Sept. p ............................ -155,523 -98,268 1,336,591 1,434,859 -57,255 2,273,510 2,330,765
2008 - Sept........................................... 31,413 33,885 227,068 193,183 -2,472 482,935 485,407
Oct............................................ 27,550 5,855 177,827 171,972 21,695 468,005 446,310
Nov ........................................... 31,388 10,075 123,475 113,400 21,313 288,690 267,377
Dec ........................................... 12,254 12,174 105,233 93,059 80 248,822 248,742
2009 - Jan ............................................ -25,125 -27,881 115,197 143,078 2,756 233,221 230,465
Feb ........................................... 1,217 -463 103,330 103,793 1,680 210,043 208,363
Mar ........................................... -1,034 -527 127,178 127,705 -507 250,246 250,753
Apr............................................ -22,752 -13,805 130,961 144,766 -8,947 248,276 257,223
May........................................... -27,367 -16,178 144,033 160,211 -11,189 253,856 265,045
June.......................................... -33,421 -19,597 191,863 211,460 -13,824 289,163 302,987
July ........................................... -28,721 -14,248 182,453 196,701 -14,473 254,073 268,546
Aug. p ....................................... -3,327 9,961 138,664 128,703 -13,288 247,281 260,569
Sept. p ...................................... -14,993 -15,530 202,912 218,442 537 287,351 286,814

CAPITAL MOVEMENTS
December 2009
82
TABLE CM-IV-3.—Net Foreign Transactions in Long-Term Domestic Securities by Type and Country
[In millions of dollars; negative figures indicate net sales by foreigners to U.S. residents or a net outflow of capital from the United States. Source: Treasury International Capital Reporting System]
Marketable Treasury bonds and notes
U.S. Government corporations and Federal agency bonds Corporate bonds Corporate stocks
2009 2009 2009 2009
Country
Calendar year 2008 (1)
Jan. through Sept. (2)
July through Sept. p
(3)
Calendar year 2008 (4)
Jan. through Sept. (5)
July through Sept. p
(6)
Calendar year 2008 (7)
Jan. through Sept. (8)
July through Sept. p
(9)
Calendar year 2008 (10)
Jan. through Sept. (11)
July through Sept. p
(12) Europe:
Austria............................. -1,054 -693 16 -282 -133 -36 -344 350 118 419 306 47Belgium........................... -1,941 -691 -250 -1,605 1,791 822 -11,149 -10,246 -2,949 -1,042 1,787 757Bulgaria........................... 8 7 2 -5 - - -13 - - -7 -1 -2Cyprus 1 .......................... 64 -203 -10 -24 -92 -28 33 5 3 137 27 -27Czech Republic............... -288 142 -21 -900 -147 1 -71 -10 - 174 243 146Denmark ......................... 349 216 255 -1,883 -48 -27 -513 -105 164 392 780 386Finland............................ 361 527 158 -36 -27 -7 -84 238 18 -36 721 372France............................. -15,360 12,710 5,626 2,740 12,247 6,253 -1,991 -4,531 1,008 -7,187 2,807 9,289Germany ......................... 591 -735 -547 -3,391 -702 311 4,954 -753 405 -19,341 -48 -267Greece ............................ 181 109 174 103 -158 -46 56 -6 -13 -493 14 -23Hungary .......................... -237 294 295 42 -21 19 -133 86 51 163 213 188Ireland............................. -4,275 -5,620 -1,406 -3,421 -3,813 -3,340 -15,326 -9,971 -3,688 838 309 179Italy ................................. 688 -953 -2 -1,245 -293 -127 157 184 232 -1,835 -93 169Kazakhstan 1................... 1,644 742 33 -337 -8 - -23 28 - 17 7 1Luxembourg.................... -7,248 7,633 795 -26,926 5,474 4,402 -9,453 -1,815 -729 -7,648 679 1,035Monaco 1......................... -102 -313 -359 94 -15 -11 166 54 54 -77 -166 27Netherlands .................... -4,790 1,352 1,047 -1,076 -663 -45 -364 -1,717 -372 -1,469 1,020 512Norway............................ 32,812 6,888 2,067 -6,496 -881 1,441 -1,559 -514 51 7,486 6,755 2,021Poland............................. 5,857 846 442 1,091 4 50 -14 -4 -1 -92 -34 -17Portugal .......................... 1,091 -14 -22 55 -195 -123 48 -10 19 145 352 -97Romania ......................... -219 -757 -683 -532 -2 6 9 - - -4 -2 -4Russia............................. 11,193 -15,282 -2,832 -3,582 -966 1 548 62 37 48 -14 -11Serbia and Montenegro 2... -96 -66 45 -9 - 3 -1 - - 2 -1 -1Spain............................... -8,022 -714 -776 -946 181 47 -1,020 109 541 -75 248 161Sweden........................... -3,136 3,709 1,634 -3,231 -1,333 58 -519 -1,124 -663 5,096 2,450 438Switzerland ..................... 1,156 7,000 277 -2,010 -3,553 -1,306 11,896 -923 -727 5,404 7,664 2,035Turkey............................. -1,650 -2,416 -1,009 690 - 1 12 319 1 -7 27 12Ukraine 1 ......................... -1,658 -597 -89 -591 -29 -4 95 -1 - -35 -2 -United Kingdom .............. 188,502 86,148 21,249 77,398 13,644 2,230 31,882 -7,488 -16,526 29,924 23,413 13,051Channel Islands .............. 1,368 -279 -12 -1,570 -75 -266 -12,555 -695 -23 574 398 216All other Europe 1............ 222 -163 69 -819 -1,800 -863 -609 -162 -117 175 83 78
Total Europe ............... 196,012 98,826 26,167 21,296 18,388 9,415 -5,885 -38,640 -23,106 11,646 49,942 30,671Memo: Euro Area 3.............. -39,660 12,717 4,803 -36,080 13,382 8,027 -34,620 -28,157 -5,411 -37,453 8,200 12,158Memo: European Union 4 .... 151,126 102,949 27,952 34,981 25,341 10,432 -4,063 -37,048 -22,380 -1,749 35,265 26,344Canada ............................... -5,908 25,045 15,488 5,437 3,508 1,649 7,196 5,653 -1,393 7,380 -1,634 2,815Latin America:
Argentina ........................ -163 -322 -269 -223 38 27 422 428 214 373 356 195 Brazil............................... -10,225 -23,106 2,503 470 476 -1,781 742 989 -4 1,438 36 206 Chile ............................... 4,706 -1,296 -652 -1,015 213 -157 123 79 33 808 277 76 Colombia......................... 1,356 -2,464 -2,179 1,731 -1,566 -194 368 278 52 -8 222 133 Ecuador .......................... 204 -307 -52 269 -90 -8 5 48 47 2 -26 -18 Costa Rica 5 .................... 11 125 71 -219 140 129 -349 89 22 113 37 -29 Guatemala ...................... -348 -244 -209 -7 9 3 18 -52 -58 6 1 3 Mexico ............................ -7,092 -460 -777 5,024 -9,559 -2,626 1,742 3,209 426 508 272 220Panama .......................... 140 121 155 277 646 252 403 331 238 418 111 48Peru ................................ 3,566 -432 -345 527 -617 -421 369 95 -21 -24 424 211Uruguay .......................... 739 -488 -523 -98 -106 -169 390 537 211 210 259 108Venezuela....................... -407 -122 -39 -2 273 33 -20 172 37 257 297 44All other Latin America 5 ... -751 207 -43 12 6 -28 31 207 128 40 41 34
Total Latin America ..... -8,264 -28,788 -2,359 6,746 -10,137 -4,940 4,244 6,410 1,325 4,141 2,307 1,231
See footnotes at end of table.

CAPITAL MOVEMENTS
December 2009
83
TABLE CM-IV-3.—Net Foreign Transactions in Long-Term Domestic Securities by Type and Country, con.
[In millions of dollars; negative figures indicate net sales by foreigners to U.S. residents or a net outflow of capital from the United States. Source: Treasury International Capital Reporting System]
Marketable Treasury bonds and notes
U.S. Government corporations and Federal agency bonds Corporate bonds Corporate stocks
2009 2009 2009 2009
Country
Calendar year 2008 (1)
Jan. through Sept.
(2)
July through Sept. p
(3)
Calendar year 2008 (4)
Jan. through Sept. (5)
July through Sept. p
(6)
Calendar year 2008 (7)
Jan. through Sept.
(8)
July through Sept. p
(9)
Calendar year 2008 (10)
Jan. through Sept. (11)
July through Sept. p
(12) Caribbean:
Anguilla 6 ................................... -805 -1,588 -475 -211 -633 - -269 151 134 -2,229 1,066 -237Bahamas ................................... -12,705 3,431 -5,617 2,146 -1,001 207 183 1,570 847 -1,849 941 -68Barbados 6 ................................. -19 375 68 317 -20 24 196 1,097 1,165 110 -53 -25Bermuda .................................... 9,189 4,979 2,017 -38,011 3,673 319 -394 1,822 665 -1,155 -416 -251British Virgin Islands 6 ................ 2,309 -5,291 -923 583 -277 -88 -6,320 -5 264 -4,555 6,549 216Cayman Islands ......................... 34,443 -19,703 -8,678 -51,506 -23,170 -4,551 29,018 -3,405 -2,226 -29,161 13,547 6,582Cuba.......................................... - - - - - - - - - - - -Jamaica ..................................... -11 37 14 -232 -20 -3 22 11 3 20 -12 -10Netherlands Antilles................... -4,682 3,060 387 593 -383 111 28 -166 45 -4,678 828 443Trinidad and Tobago.................. 111 312 55 198 -60 28 -6 -81 -44 -24 173 144All other Caribbean 6.................. 113 49 58 -91 420 47 84 205 26 55 85 44
Total Caribbean ..................... 27,943 -14,339 -13,094 -86,214 -21,471 -3,906 22,542 1,199 879 -43,466 22,708 6,838Asia:
China, Mainland......................... 84,743 96,877 41,389 16,688 -16,813 -8,261 29,598 -2,723 -522 -706 1,245 1,046Hong Kong................................. 6,242 2,691 1,120 24,526 6,042 527 7,006 2,994 -193 27,462 2,512 1,011India........................................... 2,048 4,087 2,741 -326 7 6 97 13 -6 1,344 -1,597 -1,496Indonesia ................................... -5,875 -4,304 -219 146 -60 -30 19 219 8 -27 -1 5Israel.......................................... -2,114 -149 1,862 -255 -122 -63 589 -209 -534 961 892 357Japan......................................... 6,077 109,442 27,439 5,971 -7,426 2,238 22,256 239 1,769 21,382 12,406 2,481Korea, South.............................. -11,171 7,237 2,574 -16,320 6,017 379 630 -1,269 299 2,752 1,110 603Lebanon..................................... -26 29 7 -3 - -1 -3 75 55 63 42 20Malaysia .................................... -944 1,842 418 2,141 -1,162 -309 308 509 285 29 198 77Pakistan..................................... 19 -110 -23 -1,264 -4 - -72 2 2 -5 -33 -Philippines ................................. -2,118 -533 -189 14 -174 -108 83 -79 -62 -5 38 40Singapore .................................. -7,051 1,564 687 -1,877 -1,363 -355 -1,077 -2,932 -1,059 4,717 10,851 5,209Syria .......................................... - - - - - - - 3 - 5 36 -Taiwan....................................... 5,829 6,095 989 2,523 10,138 3,186 1,650 6,242 1,910 12 495 98Thailand..................................... -2,869 -111 1,128 264 -744 -605 160 7 3 -13 -3 12Oil exporting countries 7 ............. 24,913 1,329 -8,030 -14,468 2,963 231 3,497 -3,018 -813 7,277 3,492 2,928All other Asia.............................. 1,170 170 -259 -112 -695 -62 -103 -540 -1 60 66 16
Total Asia .............................. 98,873 226,156 71,634 17,648 -3,396 -3,227 64,638 -467 1,141 65,308 31,749 12,407Africa:
Egypt ......................................... 1,093 -153 -10 -1,702 -194 -14 -22 82 -19 5 -20 -24Liberia........................................ -86 -128 -119 23 -28 -11 -318 75 31 -2,587 -114 2Morocco..................................... -269 20 -17 -2,371 -1,379 -272 1 107 -1 -4 -3 -South Africa ............................... -2,294 -493 -529 -109 -432 -43 -66 -71 -8 333 -20 -11Oil exporting countries 8 ............. 11,416 3,871 3,069 654 -112 -2 152 110 -3 -2,626 20 -11All other Africa ........................... 449 516 200 -92 39 7 67 86 9 237 -907 2
Total Africa ............................ 10,309 3,633 2,594 -3,597 -2,106 -335 -186 389 9 -4,642 -1,044 -42Other countries:
Australia..................................... -3,009 771 2,729 -78 733 295 319 -1,970 585 340 1,470 1,219New Zealand.............................. -153 -25 23 315 -28 8 3 -26 -51 -19 482 214All other countries ...................... 32 -8 -10 16 14 -5 2 11 7 19 -833 16
Total other countries .............. -3,130 738 2,742 253 719 298 324 -1,985 541 340 1,119 1,449Total foreign countries ....... 315,835 311,271 103,172 -38,431 -14,495 -1,046 92,873 -27,441 -20,604 40,707 105,147 55,369
International and regional orgs: International organizations......... -191 6 567 -141 -1,131 -335 613 -1,197 114 17 -6 -1Regional organizations 9 ............ -253 -16 77 -862 -338 31 1 -41 -70 12 2 -
Total international and regional organizations.............. -444 -10 644 -1,003 -1,469 -304 614 -1,238 44 29 -4 -1
Grand total......................... 315,391 311,261 103,816 -39,434 -15,964 -1,350 93,487 -28,679 -20,560 40,736 105,143 55,368
1 Before June 2006, data for Cyprus, Kazakhstan, Monaco, and Ukraine are included in “All other Europe.” 2 On February 4, 2003, Yugoslavia changed its name to Serbia and Montenegro. Data for other entities of the former Yugoslavia recognized as independent states by the United States are reported under “All other Europe” as follows: Beginning in December 1992 for Bosnia and Herzegovina, Croatia, and Slovenia; and beginning in December 1994 for the former Yugoslav Republic of Macedonia. 3 Includes Austria, Belgium, Finland, France, Germany, Greece, Ireland, Italy, Luxembourg, the Netherlands, Portugal, and Spain. For data as of January 2008, also includes Cyprus, Malta, and Slovenia. For data as of January 2009, also includes Slovakia. 4 As of May 2004, the European Union includes Austria, Belgium, Cyprus, the Czech Republic, Denmark, Estonia, Finland, France, Germany, Greece, Hungary, Ireland, Italy,
Latvia, Lithuania, Luxembourg, Malta, the Netherlands, Poland, Portugal, Slovakia, Slovenia, Spain, Sweden, and the United Kingdom. Data available beginning June 2006. As of January 2007, also includes Bulgaria and Romania. 5 Before June 2006, data for Costa Rica are included in “All other Latin America.” 6 Before June 2006, data for Anguilla, Barbados, and the British Virgin Islands are included in “All other Caribbean.” 7 Includes Bahrain, Iran, Iraq, Kuwait, Oman, Qatar, Saudi Arabia, and United Arab Emirates (Trucial States). 8 Includes Algeria, Gabon, Libya, and Nigeria. 9 Includes European, Latin American, Caribbean, Asian, African, and Middle East regional organizations.

CAPITAL MOVEMENTS
December 2009
84
TABLE CM-IV-4.—U.S. Transactions with Foreigners in Long-Term Domestic and Foreign Securities, by Type and Country, During Third Quarter 2009, Preliminary
[In millions of dollars. Source: Treasury International Capital Reporting System]
Gross purchases by foreigners from U.S. residents Gross sales by foreigners to U.S. residents Domestic securities Domestic securities
Corporate and other Foreign securities
Corporate and other Foreign securities
Country
Total purchases
(1)
Marketable Treasury
and Federal
Financing Bank bonds and notes
(2)
Bonds of U.S. Gov’t
corps and federally-
sponsored agencies
(3) Bonds
(4) Stocks
(5) Bonds
(6) Stocks
(7)
Total sales (8)
Marketable Treasury
and Federal
Financing Bank bonds and notes
(9)
Bonds of U.S. Gov’t
corps and federally-
sponsored agencies
(10) Bonds (11)
Stocks (12)
Bonds (13)
Stocks (14)
Europe:
Austria..................................... 3,580 783 251 347 552 1,050 597 2,571 767 287 229 505 304 478 Belgium................................... 11,807 1,384 1,954 384 4,710 1,380 1,996 22,227 1,634 1,132 3,333 3,953 10,279 1,896 Bulgaria................................... 31 10 - - 20 - 1 31 8 - - 22 1 - Cyprus 1 .................................. 909 1 7 3 58 426 413 1,221 12 35 - 85 495 594 Czech Republic....................... 948 445 1 - 349 18 135 816 466 - - 203 12 135 Denmark ................................. 8,341 1,328 26 627 1,471 3,797 1,092 7,296 1,073 53 463 1,085 3,589 1,033 Finland .................................... 2,378 618 55 111 603 288 703 3,773 460 61 93 231 2,121 806 France..................................... 916,044 573,610 11,894 2,853 281,896 22,242 23,550 882,150 567,984 5,641 1,845 272,607 11,557 22,516 Germany ................................. 76,381 25,045 3,108 3,065 16,386 19,867 8,911 69,024 25,591 2,797 2,660 16,653 12,259 9,064 Greece .................................... 1,214 296 31 25 437 128 297 1,100 122 77 38 460 28 373 Hungary .................................. 1,349 409 65 51 608 87 129 652 114 46 - 420 18 54 Ireland..................................... 48,503 19,098 8,024 2,943 7,430 5,525 5,482 61,983 20,504 11,364 6,631 7,251 10,117 6,116 Italy ......................................... 17,296 3,606 387 358 7,205 1,723 4,017 16,768 3,608 514 126 7,036 1,030 4,454 Kazakhstan 1........................... 77 59 - - 9 5 4 40 26 - - 8 1 5 Luxembourg ............................ 33,229 2,872 8,285 4,067 8,872 4,949 4,183 36,363 2,076 3,884 4,796 7,837 13,131 4,639 Monaco 1................................. 553 7 - 119 342 16 69 854 366 11 65 315 50 47 Netherlands............................. 42,158 5,661 2,046 1,607 11,197 7,238 14,409 38,170 4,614 2,092 1,979 10,685 6,046 12,755 Norway.................................... 30,532 6,959 12,086 1,235 5,201 1,839 3,212 23,439 4,892 10,645 1,184 3,180 1,132 2,406 Poland..................................... 5,313 4,677 50 1 90 171 324 5,237 4,235 - 2 107 574 319 Portugal .................................. 2,250 211 10 61 1,149 705 114 2,589 232 133 42 1,246 455 480 Romania ................................. 688 638 6 - 42 - 2 1,369 1,321 - - 46 - 2 Russia..................................... 3,743 3,067 1 37 369 26 243 6,485 5,899 - - 380 13 193 Serbia and Montenegro 2 ........ 218 130 3 - 85 - - 172 85 - - 86 - 1 Spain....................................... 15,723 4,112 352 3,277 1,698 2,889 3,394 14,570 4,888 305 2,736 1,537 1,525 3,578 Sweden................................... 14,025 3,648 70 218 3,022 3,004 4,063 14,251 2,014 12 881 2,584 5,037 3,723 Switzerland ............................. 50,240 5,349 753 4,681 23,893 2,868 12,696 49,996 5,072 2,059 5,408 21,858 2,587 13,012 Turkey..................................... 1,498 967 1 2 124 65 339 2,399 1,976 - 1 112 105 205 Ukraine 1 ................................. 468 236 - - 28 201 3 386 325 4 - 28 9 20 United Kingdom ...................... 2,210,652 1,480,081 45,783 107,544 180,414 165,034 231,796 2,197,187 1,458,832 43,553 124,070 167,363 155,873 247,496 Channel Islands ...................... 9,988 502 54 1,118 5,427 821 2,066 10,336 514 320 1,141 5,211 1,230 1,920 All other Europe 1 .................... 2,590 652 498 116 477 315 531 3,494 583 1,361 233 399 599 319
Total Europe ....................... 3,512,726 2,146,460 95,802 134,850 564,164 246,678 324,772 3,476,948 2,120,293 86,387 157,956 533,493 240,178 338,641 Memo: Euro Area 3...................... 1,171,813 637,361 36,423 19,173 342,321 68,423 68,112 1,152,899 632,558 28,396 24,584 330,163 69,419 67,779 Canada ....................................... 301,527 105,680 7,971 9,460 81,083 43,162 54,171 298,155 90,192 6,322 10,853 78,268 55,259 57,261 Latin America:
Argentina ................................ 4,341 208 74 356 2,199 711 793 3,686 477 47 142 2,004 465 551 Brazil....................................... 48,594 28,096 511 356 4,001 7,057 8,573 53,462 25,593 2,292 360 3,795 7,582 13,840 Chile........................................ 10,155 3,612 676 278 2,396 2,041 1,152 10,193 4,264 833 245 2,320 1,413 1,118 Colombia................................. 7,185 3,708 57 150 1,215 1,674 381 10,546 5,887 251 98 1,082 2,946 282 Costa Rica 4 ............................ 1,140 537 6 72 246 243 36 1,071 589 14 25 264 137 42 Ecuador .................................. 679 155 138 57 281 32 16 468 84 9 35 310 17 13 Guatemala .............................. 735 535 4 12 143 35 6 1,009 744 1 70 140 45 9 Mexico .................................... 34,436 17,783 2,083 1,310 5,582 2,350 5,328 41,341 18,560 4,709 884 5,362 4,855 6,971 Panama .................................. 5,057 650 382 589 1,599 1,103 734 4,011 495 130 351 1,551 794 690 Peru ........................................ 3,744 1,041 267 169 1,219 464 584 4,877 1,386 688 190 1,008 1,344 261 Uruguay .................................. 5,037 1,568 39 432 1,127 1,357 514 5,724 2,091 208 221 1,019 1,742 443 Venezuela............................... 2,458 126 76 194 1,133 706 223 2,568 165 43 157 1,089 896 218 All other Latin America 4.......... 1,283 321 76 163 302 355 66 898 364 104 35 268 89 38
Total Latin America ............. 124,844 58,340 4,389 4,138 21,443 18,128 18,406 139,854 60,699 9,329 2,813 20,212 22,325 24,476 Caribbean:
Anguilla 5................................. 106,603 2,610 - 270 88,046 224 15,453 106,892 3,085 - 136 88,283 130 15,258 Bahamas................................. 128,788 51,293 750 22,735 36,450 7,872 9,688 133,381 56,910 543 21,888 36,518 8,154 9,368 Barbados 5 .............................. 3,159 470 282 1,293 680 352 82 1,700 402 258 128 705 82 125
See footnotes at end of table.
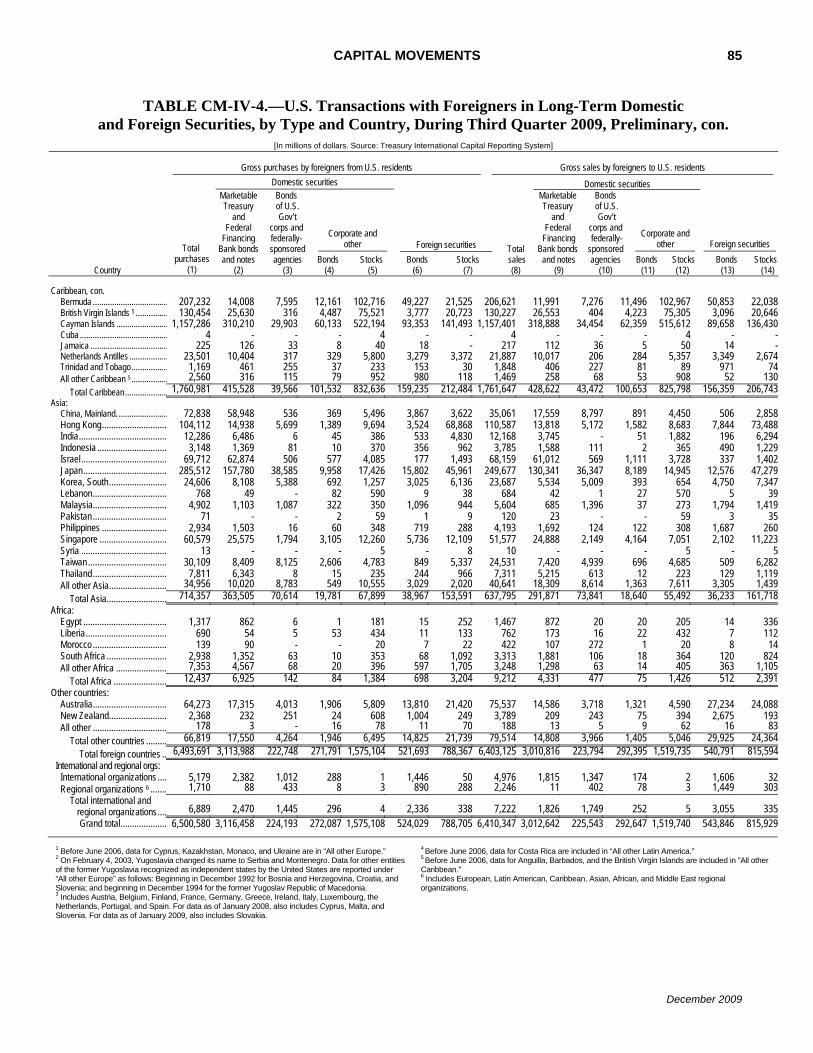
CAPITAL MOVEMENTS
December 2009
85
TABLE CM-IV-4.—U.S. Transactions with Foreigners in Long-Term Domestic and Foreign Securities, by Type and Country, During Third Quarter 2009, Preliminary, con.
[In millions of dollars. Source: Treasury International Capital Reporting System]
Gross purchases by foreigners from U.S. residents Gross sales by foreigners to U.S. residents Domestic securities Domestic securities
Corporate and other Foreign securities
Corporate and other Foreign securities
Country
Total purchases
(1)
Marketable Treasury
and Federal
Financing Bank bonds and notes
(2)
Bonds of U.S. Gov’t
corps and federally-
sponsored agencies
(3) Bonds
(4) Stocks
(5) Bonds
(6) Stocks
(7)
Total sales
(8)
Marketable Treasury
and Federal
Financing Bank bonds and notes
(9)
Bonds of U.S. Gov’t
corps and federally- sponsored agencies
(10) Bonds (11)
Stocks (12)
Bonds (13)
Stocks (14)
Caribbean, con. Bermuda ................................... 207,232 14,008 7,595 12,161 102,716 49,227 21,525 206,621 11,991 7,276 11,496 102,967 50,853 22,038British Virgin Islands 5 ............... 130,454 25,630 316 4,487 75,521 3,777 20,723 130,227 26,553 404 4,223 75,305 3,096 20,646Cayman Islands ........................ 1,157,286 310,210 29,903 60,133 522,194 93,353 141,493 1,157,401 318,888 34,454 62,359 515,612 89,658 136,430Cuba ......................................... 4 - - - 4 - - 4 - - - 4 - -Jamaica .................................... 225 126 33 8 40 18 - 217 112 36 5 50 14 -Netherlands Antilles .................. 23,501 10,404 317 329 5,800 3,279 3,372 21,887 10,017 206 284 5,357 3,349 2,674Trinidad and Tobago................. 1,169 461 255 37 233 153 30 1,848 406 227 81 89 971 74All other Caribbean 5 ................. 2,560 316 115 79 952 980 118 1,469 258 68 53 908 52 130
Total Caribbean.................... 1,760,981 415,528 39,566 101,532 832,636 159,235 212,484 1,761,647 428,622 43,472 100,653 825,798 156,359 206,743Asia:
China, Mainland. ....................... 72,838 58,948 536 369 5,496 3,867 3,622 35,061 17,559 8,797 891 4,450 506 2,858Hong Kong............................ 104,112 14,938 5,699 1,389 9,694 3,524 68,868 110,587 13,818 5,172 1,582 8,683 7,844 73,488India...................................... 12,286 6,486 6 45 386 533 4,830 12,168 3,745 - 51 1,882 196 6,294Indonesia .............................. 3,148 1,369 81 10 370 356 962 3,785 1,588 111 2 365 490 1,229Israel..................................... 69,712 62,874 506 577 4,085 177 1,493 68,159 61,012 569 1,111 3,728 337 1,402Japan.................................... 285,512 157,780 38,585 9,958 17,426 15,802 45,961 249,677 130,341 36,347 8,189 14,945 12,576 47,279Korea, South......................... 24,606 8,108 5,388 692 1,257 3,025 6,136 23,687 5,534 5,009 393 654 4,750 7,347Lebanon................................ 768 49 - 82 590 9 38 684 42 1 27 570 5 39Malaysia................................ 4,902 1,103 1,087 322 350 1,096 944 5,604 685 1,396 37 273 1,794 1,419Pakistan................................ 71 - - 2 59 1 9 120 23 - - 59 3 35Philippines ............................ 2,934 1,503 16 60 348 719 288 4,193 1,692 124 122 308 1,687 260Singapore ............................. 60,579 25,575 1,794 3,105 12,260 5,736 12,109 51,577 24,888 2,149 4,164 7,051 2,102 11,223Syria ..................................... 13 - - - 5 - 8 10 - - - 5 - 5Taiwan .................................. 30,109 8,409 8,125 2,606 4,783 849 5,337 24,531 7,420 4,939 696 4,685 509 6,282Thailand................................ 7,811 6,343 8 15 235 244 966 7,311 5,215 613 12 223 129 1,119All other Asia......................... 34,956 10,020 8,783 549 10,555 3,029 2,020 40,641 18,309 8,614 1,363 7,611 3,305 1,439
Total Asia.......................... 714,357 363,505 70,614 19,781 67,899 38,967 153,591 637,795 291,871 73,841 18,640 55,492 36,233 161,718Africa:
Egypt .................................... 1,317 862 6 1 181 15 252 1,467 872 20 20 205 14 336Liberia................................... 690 54 5 53 434 11 133 762 173 16 22 432 7 112Morocco................................ 139 90 - - 20 7 22 422 107 272 1 20 8 14South Africa .......................... 2,938 1,352 63 10 353 68 1,092 3,313 1,881 106 18 364 120 824All other Africa ...................... 7,353 4,567 68 20 396 597 1,705 3,248 1,298 63 14 405 363 1,105
Total Africa ....................... 12,437 6,925 142 84 1,384 698 3,204 9,212 4,331 477 75 1,426 512 2,391Other countries:
Australia................................ 64,273 17,315 4,013 1,906 5,809 13,810 21,420 75,537 14,586 3,718 1,321 4,590 27,234 24,088New Zealand......................... 2,368 232 251 24 608 1,004 249 3,789 209 243 75 394 2,675 193All other ................................ 178 3 - 16 78 11 70 188 13 5 9 62 16 83
Total other countries ......... 66,819 17,550 4,264 1,946 6,495 14,825 21,739 79,514 14,808 3,966 1,405 5,046 29,925 24,364Total foreign countries .. 6,493,691 3,113,988 222,748 271,791 1,575,104 521,693 788,367 6,403,125 3,010,816 223,794 292,395 1,519,735 540,791 815,594
International and regional orgs: International organizations .... 5,179 2,382 1,012 288 1 1,446 50 4,976 1,815 1,347 174 2 1,606 32Regional organizations 6 ....... 1,710 88 433 8 3 890 288 2,246 11 402 78 3 1,449 303
Total international and regional organizations.... 6,889 2,470 1,445 296 4 2,336 338 7,222 1,826 1,749 252 5 3,055 335
Grand total.................... 6,500,580 3,116,458 224,193 272,087 1,575,108 524,029 788,705 6,410,347 3,012,642 225,543 292,647 1,519,740 543,846 815,929
1 Before June 2006, data for Cyprus, Kazakhstan, Monaco, and Ukraine are in “All other Europe.” 2 On February 4, 2003, Yugoslavia changed its name to Serbia and Montenegro. Data for other entities of the former Yugoslavia recognized as independent states by the United States are reported under “All other Europe” as follows: Beginning in December 1992 for Bosnia and Herzegovina, Croatia, and Slovenia; and beginning in December 1994 for the former Yugoslav Republic of Macedonia. 3 Includes Austria, Belgium, Finland, France, Germany, Greece, Ireland, Italy, Luxembourg, the Netherlands, Portugal, and Spain. For data as of January 2008, also includes Cyprus, Malta, and Slovenia. For data as of January 2009, also includes Slovakia.
4 Before June 2006, data for Costa Rica are included in “All other Latin America.” 5 Before June 2006, data for Anguilla, Barbados, and the British Virgin Islands are included in ”All other Caribbean.” 6 Includes European, Latin American, Caribbean, Asian, African, and Middle East regional organizations.

CAPITAL MOVEMENTS
December 2009
86
TABLE CM-IV-5.—U.S. Transactions with Foreigners in Long-Term Domestic and Foreign Securities, by Type and Country, During Calendar Year 2008
[In millions of dollars. Source: Treasury International Capital Reporting System]
Gross purchases by foreigners from U.S. residents Gross sales by foreigners to U.S. residents Domestic securities Domestic securities
Corporate and other Foreign securities
Corporate and other Foreign securities
Country
Total purchases
(1)
Marketable Treasury
and Federal
Financing Bank bonds and notes
(2)
Bonds of U.S. Gov’t
corps and federally- sponsored agencies
(3) Bonds (4)
Stocks (5)
Bonds (6)
Stocks (7)
Total sales (8)
Marketable Treasury
and Federal
Financing Bank bonds and notes
(9)
Bonds of U.S. Gov’t
corps and federally- sponsored agencies
(10) Bonds (11)
Stocks (12)
Bonds (13)
Stocks (14)
Europe:
Austria............................... 23,639 8,218 1,149 754 5,693 2,765 5,060 23,101 9,273 1,431 1,098 5,274 1,177 4,848Belgium............................. 71,504 8,659 1,391 3,647 16,480 8,392 32,935 121,656 10,600 2,996 14,796 17,522 43,320 32,423Bulgaria............................. 68 42 - - 21 - 5 83 34 5 13 28 3 -Cyprus 1 ........................... 7,425 176 47 82 1,201 1,031 4,888 6,616 112 71 49 1,064 567 4,752Czech Republic ................. 6,625 3,721 473 45 1,099 507 780 7,066 4,009 1,373 116 925 114 529Denmark ........................... 48,276 6,817 4,186 1,766 17,928 8,421 9,158 45,060 6,468 6,069 2,279 17,536 3,367 9,341Finland .............................. 12,059 3,227 1,065 128 1,282 1,256 5,101 10,559 2,866 1,100 212 1,318 454 4,608France............................... 4,633,831 2,148,440 39,769 20,083 2,196,756 93,710 135,073 4,629,413 2,163,800 37,029 22,074 2,203,943 67,862 134,704Germany ........................... 430,492 110,846 25,390 22,300 153,170 62,744 56,042 432,280 110,255 28,781 17,346 172,511 51,226 52,160Greece .............................. 11,207 1,715 156 98 2,167 4,719 2,353 6,563 1,533 52 42 2,660 160 2,115Hungary ............................ 3,061 495 152 88 1,166 718 442 3,255 732 110 221 1,003 730 459Ireland............................... 783,943 336,159 54,208 20,830 45,848 296,846 30,052 806,530 340,434 57,629 36,156 45,010 294,434 32,866Italy ................................... 78,234 13,596 2,275 1,165 28,848 11,554 20,796 72,508 12,908 3,520 1,008 30,683 2,642 21,747Kazakhstan 1 .................... 11,446 8,666 533 114 95 1,839 199 9,829 7,022 870 137 78 1,621 101Luxembourg ...................... 150,572 12,109 36,286 16,404 41,950 18,021 25,802 249,841 19,356 63,212 25,857 49,598 64,942 26,875Monaco 1 ......................... 5,390 251 113 228 3,788 322 688 5,142 353 19 62 3,865 236 607Netherlands....................... 307,426 44,308 17,183 7,424 120,720 26,024 91,768 311,153 49,097 18,259 7,788 122,189 21,564 92,256Norway.............................. 241,206 108,014 57,614 11,392 39,934 9,599 14,653 210,031 75,202 64,110 12,951 32,448 11,850 13,470Poland............................... 23,617 19,362 2,374 8 215 852 806 16,728 13,505 1,283 22 307 499 1,112Portugal............................. 9,577 2,455 182 161 3,793 1,784 1,202 8,102 1,364 127 113 3,648 1,512 1,338Romania............................ 4,387 3,922 3 9 344 96 13 5,052 4,141 535 - 348 23 5Russia............................... 61,870 41,882 10,953 676 1,660 1,230 5,469 51,600 30,689 14,535 128 1,612 400 4,236Serbia and Montenegro 2 .. 751 497 - - 227 - 27 894 593 9 1 225 20 46Spain................................. 91,473 20,503 674 7,727 7,021 28,692 26,856 71,325 28,525 1,621 8,747 7,096 1,114 24,222Sweden............................. 235,668 10,039 14,121 2,201 85,907 19,176 104,224 217,930 13,175 17,352 2,720 80,811 13,320 90,552Switzerland ....................... 260,750 38,371 6,947 29,066 113,497 9,189 63,680 246,204 37,215 8,957 17,170 108,093 11,605 63,164Turkey............................... 24,843 15,581 699 44 870 5,903 1,746 21,874 17,231 9 32 877 2,078 1,647Ukraine 1 .......................... 5,341 3,780 150 132 172 1,092 15 7,016 5,438 741 37 207 464 129United Kingdom................. 12,563,058 6,981,662 505,725 660,149 1,850,505 810,186 1,754,831 12,233,021 6,793,160 428,327 628,267 1,820,581 805,783 1,756,903Channel Islands ................ 93,119 38,351 632 4,088 28,847 6,117 15,084 103,299 36,983 2,202 16,643 28,273 3,881 15,317All other Europe 1 .............. 16,471 3,963 1,428 402 5,507 1,935 3,236 17,300 3,741 2,247 1,011 5,332 1,769 3,199
Total Europe ................. 20,217,331 9,995,827 785,879 811,211 4,776,711 1,434,721 2,412,982 19,951,028 9,799,815 764,583 817,096 4,765,065 1,408,737 2,395,732
Memo: Euro Area 3................ 6,616,220 2,710,954 179,824 100,963 2,627,388 557,982 439,109 6,754,346 2,750,614 215,904 135,583 2,664,841 551,317 436,087
Canada ................................. 1,555,920 519,217 63,303 36,373 381,815 253,441 301,771 1,538,678 525,125 57,866 29,177 374,435 248,326 303,749Latin America:
Argentina........................... 21,938 1,777 263 771 6,140 6,981 6,006 19,277 1,940 486 349 5,767 4,580 6,155Brazil ................................. 214,346 116,128 4,724 1,318 21,349 26,081 44,746 216,989 126,353 4,254 576 19,911 13,012 52,883Chile.................................. 73,675 40,688 3,106 1,664 13,855 7,173 7,189 67,768 35,982 4,121 1,541 13,047 4,874 8,203Colombia........................... 39,353 23,098 4,302 1,177 3,797 6,006 973 34,639 21,742 2,571 809 3,805 4,715 997Costa Rica 4 ..................... 7,877 5,115 353 268 1,013 733 395 7,360 4,911 84 263 1,011 470 621Ecuador............................. 3,559 815 245 224 424 607 1,244 3,620 804 464 573 311 403 1,065Guatemala ........................ 1,567 784 18 45 309 335 76 1,810 1,132 25 27 303 261 62Mexico .............................. 172,021 54,938 16,338 8,865 31,886 24,657 35,337 159,771 62,030 11,314 7,123 31,378 17,465 30,461Panama............................. 16,842 2,364 1,263 1,640 5,292 3,282 3,001 15,404 2,224 986 1,237 4,874 2,787 3,296Peru .................................. 14,769 4,913 1,858 550 2,857 2,873 1,718 8,682 1,347 1,331 181 2,881 967 1,975Uruguay ............................ 18,571 7,285 569 890 3,210 4,428 2,189 15,979 6,546 667 500 3,000 3,204 2,062Venezuela ......................... 9,649 695 631 467 3,573 3,284 999 15,442 1,102 633 487 3,316 8,916 988All other Latin America 4 ... 4,236 1,261 1,321 222 844 311 277 4,856 2,012 1,309 191 804 239 301
Total Latin America ....... 598,403 259,861 34,991 18,101 94,549 86,751 104,150 571,597 268,125 28,245 13,857 90,408 61,893 109,069
See footnotes at end of table.

CAPITAL MOVEMENTS
December 2009
87
TABLE CM-IV-5.—U.S. Transactions with Foreigners in Long-Term Domestic and Foreign Securities, by Type and Country, During Calendar Year 2008, con.
[In millions of dollars. Source: Treasury International Capital Reporting System]
Gross purchases by foreigners from U.S. residents Gross sales by foreigners to U.S. residents Domestic securities Domestic securities
Corporate and other Foreign securities
Corporate and other Foreign securities
Country
Total purchases
(1)
Marketable Treasury
and Federal
Financing Bank bonds and notes
(2)
Bonds of U.S. Gov’t
corps and federally- sponsored agencies
(3) Bonds
(4) Stocks
(5) Bonds
(6) Stocks
(7)
Total sales (8)
Marketable Treasury
and Federal
Financing Bank bonds and notes
(9)
Bonds of U.S. Gov’t
corps and federally- sponsored agencies
(10) Bonds (11)
Stocks (12)
Bonds (13)
Stocks (14)
Caribbean:
Anguilla 5............................... 419,600 18,895 649 782 350,952 993 47,328 423,524 19,700 860 1,051 353,181 1,127 47,605Bahamas .............................. 615,505 309,695 10,533 21,104 179,449 22,323 72,401 627,590 322,400 8,387 20,921 181,298 22,403 72,181Barbados 5 ............................ 9,359 1,120 5,238 598 1,207 471 725 8,816 1,139 4,921 402 1,097 472 785Bermuda ............................... 1,375,436 186,452 62,867 43,792 863,281 28,209 190,835 1,419,359 177,263 100,878 44,186 864,436 43,172 189,424British Virgin Islands 5 ........... 791,816 76,921 4,788 33,286 509,156 28,656 139,009 807,210 74,612 4,205 39,606 513,711 28,868 146,208Cayman Islands .................... 8,709,065 1,618,303 1,112,016 337,388 4,405,073 181,001 1,055,284 8,753,989 1,583,860 1,163,522 308,370 4,434,234 174,929 1,089,074Cuba..................................... - - - - - - - - - - - - - -Jamaica ................................ 6,521 4,891 866 129 217 367 51 7,129 4,902 1,098 107 197 779 46Netherlands Antilles .............. 211,843 112,039 4,550 2,647 61,137 10,792 20,678 221,043 116,721 3,957 2,619 65,815 10,744 21,187Trinidad and Tobago............. 4,683 648 1,106 220 369 985 1,355 4,256 537 908 226 393 762 1,430All other Caribbean ............... 6,011 821 1,280 412 2,506 308 684 5,971 708 1,371 328 2,451 373 740
Total Caribbean................ 12,149,838 2,329,785 1,203,893 440,358 6,373,347 274,105 1,528,350 12,278,887 2,301,842 1,290,107 417,816 6,416,813 283,629 1,568,680Asia:
China, Mainland ............... 496,924 285,900 129,929 42,054 15,652 17,731 5,658 354,624 201,157 113,241 12,456 16,358 5,499 5,913Hong Kong ........................ 551,023 66,770 54,637 14,410 77,700 7,118 330,388 472,312 60,528 30,111 7,404 50,238 6,073 317,958India .................................. 43,772 12,233 35 151 2,756 850 27,747 36,017 10,185 361 54 1,412 493 23,512Indonesia........................... 13,574 5,999 987 22 928 1,061 4,577 19,781 11,874 841 3 955 1,401 4,707Israel ................................. 313,004 266,982 3,548 2,396 25,211 1,438 13,429 312,189 269,096 3,803 1,807 24,250 568 12,665Japan ................................ 1,316,561 551,563 143,744 60,732 61,640 95,800 403,082 1,242,503 545,486 137,773 38,476 40,258 99,042 381,468Korea, South ..................... 129,871 45,127 25,295 8,041 5,362 9,191 36,855 147,948 56,298 41,615 7,411 2,610 7,386 32,628Lebanon ............................ 1,314 110 - 47 947 43 167 1,248 136 3 50 884 10 165Malaysia ............................ 34,156 10,168 10,036 697 986 3,466 8,803 30,866 11,112 7,895 389 957 2,231 8,282Pakistan ............................ 1,185 70 187 62 307 30 529 2,497 51 1,451 134 312 31 518Philippines......................... 14,764 7,652 912 345 1,742 2,178 1,935 16,423 9,770 898 262 1,747 1,969 1,777Singapore.......................... 266,829 66,851 46,177 8,412 53,079 14,769 77,541 259,244 73,902 48,054 9,489 48,362 7,277 72,160Syria.................................. 515 - - - 449 - 66 511 - - - 444 - 67Taiwan .............................. 106,989 32,898 18,199 3,071 22,607 2,130 28,084 95,195 27,069 15,676 1,421 22,595 1,829 26,605Thailand ............................ 21,132 13,626 782 218 788 960 4,758 22,491 16,495 518 58 801 585 4,034All other Asia ..................... 172,652 64,534 34,566 9,828 43,639 10,793 9,292 144,434 38,451 49,146 6,434 36,302 6,622 7,479
Total Asia ...................... 3,484,265 1,430,483 469,034 150,486 313,793 167,558 952,911 3,158,283 1,331,610 451,386 85,848 248,485 141,016 899,938Africa:
Egypt................................. 12,984 8,606 157 12 439 448 3,322 13,134 7,513 1,859 34 434 142 3,152Liberia ............................... 3,568 47 38 127 2,361 161 834 6,345 133 15 445 4,948 58 746Morocco ............................ 574 280 88 3 127 34 42 3,269 549 2,459 2 131 20 108South Africa....................... 11,489 4,769 302 23 1,358 1,242 3,795 15,765 7,063 411 89 1,025 3,015 4,162All other Africa................... 35,724 18,374 888 277 6,937 5,520 3,728 22,661 6,509 326 58 9,326 981 5,461
Total Africa.................... 64,339 32,076 1,473 442 11,222 7,405 11,721 61,174 21,767 5,070 628 15,864 4,216 13,629Other countries:
Australia ............................ 260,087 50,433 22,562 7,981 36,928 27,446 114,737 274,346 53,442 22,640 7,662 36,588 38,589 115,425New Zealand ..................... 7,908 576 2,625 177 1,522 1,495 1,513 18,021 729 2,310 174 1,541 11,762 1,505All other............................. 824 71 102 16 483 20 132 1,145 39 86 14 464 29 513
Total other countries...... 268,819 51,080 25,289 8,174 38,933 28,961 116,382 293,512 54,210 25,036 7,850 38,593 50,380 117,443Total foreign countries ............... 38,338,915 14,618,329 2,583,862 1,465,145 11,990,370 2,252,942 5,428,267 37,853,159 14,302,494 2,622,293 1,372,272 11,949,663 2,198,197 5,408,240
International and regional orgs: International organizations... 14,898 6,833 2,270 1,238 115 4,113 329 13,802 7,024 2,411 625 98 3,431 213Regional organizations 6 ..... 20,993 2,360 2,265 571 50 13,371 2,376 11,358 2,613 3,127 570 38 2,580 2,430Total international and regional organizations....... 35,891 9,193 4,535 1,809 165 17,484 2,705 25,160 9,637 5,538 1,195 136 6,011 2,643
Grand total................... 38,374,806 14,627,522 2,588,397 1,466,954 11,990,535 2,270,426 5,430,972 37,878,319 14,312,131 2,627,831 1,373,467 11,949,799 2,204,208 5,410,883
1 Before June 2006, data for Cyprus, Kazakhstan, Monaco, and Ukraine are included in “All other Europe.”
2 On February 4, 2003, Yugoslavia changed its name to Serbia and Montenegro. Data for other entities of the former Yugoslavia recognized as independent states by the United States are reported under “All other Europe” as follows: Beginning in December 1992 for Bosnia and Herzegovina, Croatia, and Slovenia; and beginning in December 1994 for the former Yugoslav Republic of Macedonia.
3 Includes Austria, Belgium, Finland, France, Germany, Greece, Ireland, Italy, Luxembourg, the Netherlands, Portugal, and Spain. For data as of January 2008, also includes Cyprus, Malta, and Slovenia. 4 Before June 2006, data for Costa Rica are included in “All other Latin America.” 5 Before June 2006, data for Anguilla, Barbados, and the British Virgin Islands are included in “All other Caribbean.” 6 Includes European, Latin America, Caribbean, Asian, African, and Middle East regional organizations.
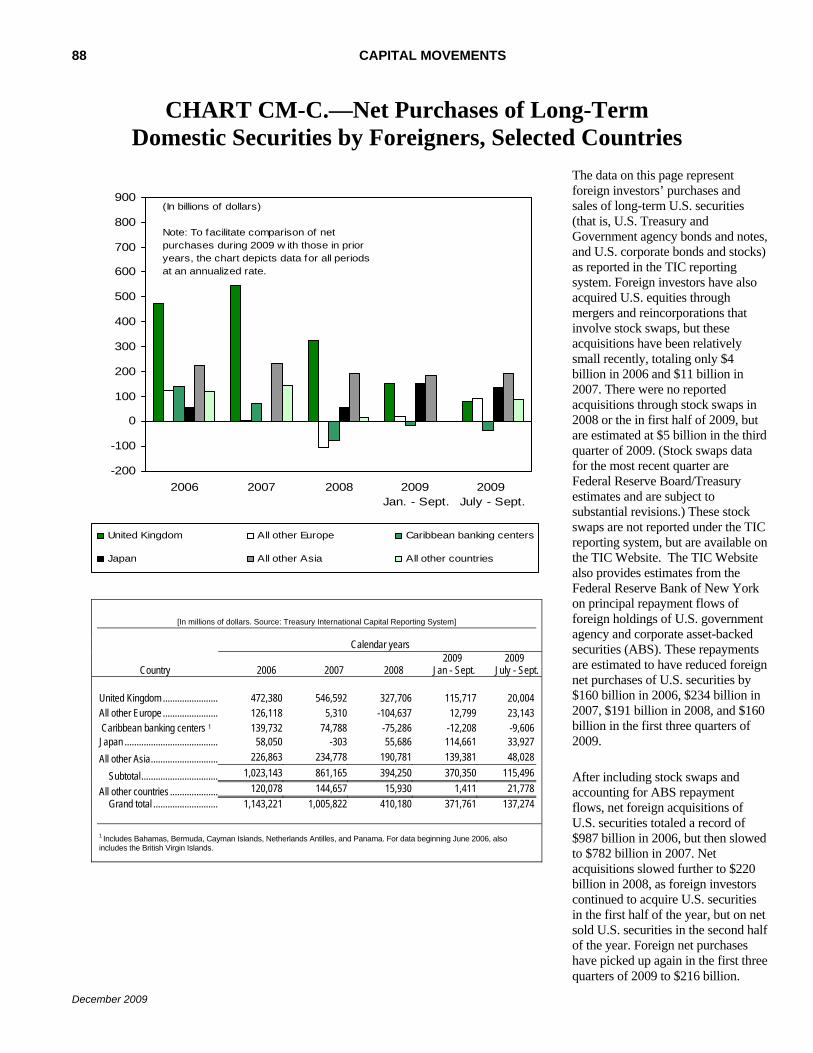
88 CAPITAL MOVEMENTS
December 2009
CHART CM-C.—Net Purchases of Long-Term Domestic Securities by Foreigners, Selected Countries
[In millions of dollars. Source: Treasury International Capital Reporting System]
Calendar years
Country
2006 2007 2008 2009 Jan - Sept.
2009 July - Sept.
United Kingdom ........................ 472,380 546,592 327,706 115,717 20,004 All other Europe ........................ 126,118 5,310 -104,637 12,799 23,143 Caribbean banking centers 1 139,732 74,788 -75,286 -12,208 -9,606 Japan ........................................ 58,050 -303 55,686 114,661 33,927 All other Asia............................. 226,863 234,778 190,781 139,381 48,028
Subtotal................................. 1,023,143 861,165 394,250 370,350 115,496
All other countries ..................... 120,078 144,657 15,930 1,411 21,778 Grand total ............................ 1,143,221 1,005,822 410,180 371,761 137,274
1 Includes Bahamas, Bermuda, Cayman Islands, Netherlands Antilles, and Panama. For data beginning June 2006, also includes the British Virgin Islands.
The data on this page represent foreign investors’ purchases and sales of long-term U.S. securities (that is, U.S. Treasury and Government agency bonds and notes, and U.S. corporate bonds and stocks) as reported in the TIC reporting system. Foreign investors have also acquired U.S. equities through mergers and reincorporations that involve stock swaps, but these acquisitions have been relatively small recently, totaling only $4 billion in 2006 and $11 billion in 2007. There were no reported acquisitions through stock swaps in 2008 or the in first half of 2009, but are estimated at $5 billion in the third quarter of 2009. (Stock swaps data for the most recent quarter are Federal Reserve Board/Treasury estimates and are subject to substantial revisions.) These stock swaps are not reported under the TIC reporting system, but are available on the TIC Website. The TIC Website also provides estimates from the Federal Reserve Bank of New York on principal repayment flows of foreign holdings of U.S. government agency and corporate asset-backed securities (ABS). These repayments are estimated to have reduced foreign net purchases of U.S. securities by $160 billion in 2006, $234 billion in 2007, $191 billion in 2008, and $160 billion in the first three quarters of 2009. After including stock swaps and accounting for ABS repayment flows, net foreign acquisitions of U.S. securities totaled a record of $987 billion in 2006, but then slowed to $782 billion in 2007. Net acquisitions slowed further to $220 billion in 2008, as foreign investors continued to acquire U.S. securities in the first half of the year, but on net sold U.S. securities in the second half of the year. Foreign net purchases have picked up again in the first three quarters of 2009 to $216 billion.
-200
-100
0
100
200
300
400
500
600
700
800
900
2006 2007 2008 2009 Jan. - Sept.
2009 July - Sept.
United Kingdom All other Europe Caribbean banking centers
Japan All other Asia All other countries
(In billions of dollars)
Note: To facilitate comparison of net purchases during 2009 w ith those in prior years, the chart depicts data for all periods at an annualized rate.

CAPITAL MOVEMENTS
December 2009
89
The data on this page represent U.S. investors’ purchases and sales of long-term foreign securities as reported to the TIC reporting system. U.S. investors also have acquired foreign stocks through mergers that involve stock swaps. Net acquisitions through stock swaps amounted to $4 billion in 2005, $19 billion in 2006, $12 billion in 2007, $7 billion in 2008, and $2 billion in the first quarter of 2009. There were no acquisitions through stock swaps in the second or third quarters of 2009. (Stock swaps data for the most recent quarter are Federal Reserve Board/Treasury estimates and are subject to substantial revisions.) These stock swaps are not reported under the TIC reporting system, but are available on the TIC Website.
Including acquisitions through stock swaps, U.S. net purchases of long-term foreign securities amounted $176 billion in 2005 and $270 billion in 2006, but then eased somewhat to $241 billion in 2007. U.S. investors switched to net sales of $79 billion in foreign securities in 2008. U.S. investors’ acquisitions have recovered in 2009, amounting to $158 billion in the first three quarters.
CHART CM-D.—Net Purchases of Long-Term
Foreign Securities by U.S. Investors*
[In millions of dollars. Source: Treasury International Capital Reporting System]
Calendar years
Type 2005 2006 2007 2008 2009
Jan. - Sept. 2009
July - Sept. Foreign bonds ...... 45,095 144,452 133,923 -66,218 98,268 19,817 Foreign stocks...... 127,296 106,455 95,300 -20,089 57,255 27,224
Total ................... 172,391 250,907 229,223 -86,307 155,523 47,041 * Net purchases by U.S. investors equal net sales by foreigners, or gross sales minus gross purchases of securities.
-200
-100
0
100
200
300
400
2005 2006 2007 2008 2009Jan.-Sept.
2009July-Sept.
Foreign bonds Foreign stocks Total foreign securities
(In billions of dollars)
Note: To facilitate comparison of net purchases during 2009w ith those in prior years, the chart depicts data for all periodsat an annualized rate.

CAPITAL MOVEMENTS
December 2009
90
SECTION V.—Holdings of, and Transactions in, Financial Derivatives Contracts with Foreigners Reported by Businesses in the United States
TABLE CM-V-1.—Gross Totals of Holdings with Positive and Negative Fair Values, by Type of Contract
[Holdings at end of period in millions of dollars. Source: Treasury International Capital Reporting System]
2007 2008 2009 Dec. June Sept. Dec. r Mar. June pGross total of holdings with negative fair values ........................... 2,487,860 3,528,055 3,137,738 6,461,178 5,905,721 4,290,310
Total over-the-counter (OTC) contracts..................................... 2,456,093 3,469,018 3,092,038 6,398,087 5,867,994 4,257,399Single-currency interest rate contracts .................................. 1,434,083 1,781,034 1,602,170 4,470,553 4,131,955 3,081,951
Forwards ............................................................................ 1,410 4,586 8,046 9,851 6,214 6,410Swaps ................................................................................ 1,275,308 1,594,291 1,425,059 4,178,435 3,861,423 2,851,546Options............................................................................... 157,365 182,157 169,065 282,267 264,318 223,995
Foreign exchange contracts .................................................. 240,138 294,743 325,466 481,833 323,645 282,152Forwards ............................................................................ 72,450 87,327 113,706 169,983 104,191 80,532Swaps ................................................................................ 115,889 151,177 160,807 234,573 163,323 158,090Options............................................................................... 51,799 56,239 50,953 77,277 56,131 43,530
Other contracts ...................................................................... 781,872 1,393,241 1,164,402 1,445,701 1,412,394 893,296Equity ................................................................................. n.a. n.a. n.a. n.a. 85,255 62,762Credit.................................................................................. n.a. n.a. n.a. n.a. 1,169,626 698,936All other .............................................................................. n.a. n.a. n.a. n.a. 157,513 131,598
Total exchange-traded contracts ............................................... 31,767 59,037 45,700 63,091 37,727 32,911Own contracts on foreign exchanges .................................... 4,101 5,837 3,952 1,725 2,175 1,330U.S. customers’ contracts on foreign exchanges.................. 3,658 6,110 5,336 7,325 8,029 6,230Foreign counterparty contracts on U.S. exchanges .............. 24,008 47,090 36,412 54,041 27,523 25,351
Memorandum items: Contracts with own foreign office........................................... 615,885 937,871 928,243 1,423,392 1,348,473 953,188Contracts with foreign official institutions .............................. 14,495 13,152 12,094 26,636 17,054 13,078Contracts of U.S. depository institutions with foreigners....... 790,580 997,078 1,180,178 2,803,032 n.a. n.a.
Gross total of holdings with positive fair values............................. 2,559,332 3,638,417 3,241,052 6,625,129 6,074,115 4,466,770Total over-the-counter (OTC) contracts..................................... 2,526,075 3,575,564 3,190,484 6,562,853 6,037,265 4,432,787
Single-currency interest rate contracts .................................. 1,463,086 1,825,236 1,655,033 4,551,035 4,233,882 3,189,969Forwards ............................................................................ 1,234 4,926 5,119 10,831 7,873 7,475Swaps ................................................................................ 1,288,685 1,619,634 1,463,033 4,216,924 3,933,545 2,936,023Options............................................................................... 173,167 200,676 186,881 323,280 292,464 246,471
Foreign exchange contracts .................................................. 290,943 349,048 356,026 497,234 329,872 299,728Forwards ............................................................................ 73,894 82,668 118,693 180,414 103,874 79,760Swaps ................................................................................ 160,129 205,104 179,177 229,552 161,932 170,712Options............................................................................... 56,920 61,276 58,156 87,268 64,066 49,256
Other contracts ...................................................................... 772,046 1,401,280 1,179,425 1,514,584 1,473,511 943,090Equity ................................................................................. n.a. n.a. n.a. n.a. 57,010 49,227Credit.................................................................................. n.a. n.a. n.a. n.a. 1,244,167 753,286All other .............................................................................. n.a. n.a. n.a. n.a. 172,334 140,577
Total exchange-traded contracts ............................................... 33,257 62,853 50,568 62,276 36,850 33,983Own contracts on foreign exchanges .................................... 4,558 5,665 3,549 1,852 1,734 1,362Customers’ contracts on foreign exchanges ......................... 3,422 7,742 6,185 7,387 6,938 4,935Foreign counterparty contracts on U.S. exchanges .............. 25,277 49,446 40,834 53,037 28,178 27,686
Memorandum items: Contracts with own foreign office........................................... 623,349 955,322 934,312 1,429,761 1,369,287 981,442Contracts with foreign official institutions .............................. 13,040 12,861 9,657 20,794 17,257 15,604Contracts of U.S. depository institutions with foreigners....... 811,889 1,029,986 1,205,971 2,837,891 n.a. n.a.

CAPITAL MOVEMENTS
December 2009
91
TABLE CM-V-2.—Gross Total of Holdings with Negative Fair Values, by Country
[Holdings at end of period in millions of dollars. Source: Treasury International Capital Reporting System]
2007 2008 2009 Country
Dec. June Sept. Dec. r Mar. June p
Europe: Belgium .......................................................................... 12,803 17,750 12,470 23,990 21,017 13,115 France ............................................................................ 130,795 194,366 164,518 302,240 267,759 185,376 Germany ........................................................................ 175,390 255,611 177,000 357,176 325,000 220,570 Ireland ............................................................................ 162,977 184,059 213,901 411,112 397,375 298,678 Italy................................................................................. 6,412 8,952 6,652 11,448 11,925 8,308 Netherlands.................................................................... 31,659 58,928 39,964 42,442 34,357 21,317 Switzerland .................................................................... 61,915 97,204 77,780 114,215 93,177 68,733 United Kingdom ............................................................. 1,535,536 2,251,499 2,055,700 4,590,128 4,247,792 3,087,508 All other Europe ............................................................. 56,910 74,959 60,260 77,322 65,962 51,883
Total Europe .............................................................. 2,174,397 3,143,328 2,808,245 5,930,073 5,464,364 3,955,488
Memo: Euro Area 1 ........................................................ 549,170 757,354 645,133 1,191,135 1,098,407 780,096
Memo: European Union 2............................................... 2,095,271 3,022,261 2,712,368 5,804,938 5,362,335 3,879,897
Canada............................................................................... 43,759 58,529 50,747 90,601 77,738 55,278
Total Latin America ............................................................ 13,764 17,092 13,013 13,049 11,854 11,235
Caribbean: Cayman Islands ............................................................. 110,074 122,194 105,363 133,614 111,254 76,141 All other Caribbean ........................................................ 22,706 32,122 24,521 33,447 21,823 15,378
Total Caribbean ......................................................... 132,780 154,316 129,884 167,061 133,077 91,519
Asia: Japan ........................................................................... 67,577 66,700 62,749 142,646 119,009 101,125 All other Asia.................................................................. 33,085 57,373 46,370 77,125 62,725 47,659
Total Asia ................................................................... 100,662 124,073 109,119 219,771 181,734 148,784
Total Africa ......................................................................... 3,025 5,845 4,402 5,507 4,687 3,610
Other countries: Australia ......................................................................... 13,239 18,648 16,305 24,498 22,279 16,335 All other .......................................................................... 849 547 652 1,265 1,162 997
Total other countries .................................................. 14,088 19,195 16,957 25,763 23,441 17,332
Total foreign countries ........................................... 2,482,475 3,522,378 3,132,367 6,451,825 5,896,895 4,283,246
Total international and regional organizations................... 5,389 5,677 5,372 9,355 8,826 7,063
Grand total ................................................................. 2,487,860 3,528,055 3,137,738 6,461,178 5,905,721 4,290,310 1 Includes Austria, Belgium, Finland, France, Germany, Greece, Ireland, Italy, Luxembourg, the Netherlands, Portugal, and Spain. For data as of January 2008, also includes Cyprus, Malta, and Slovenia. For data as of January 2009, also includes Slovakia.
2 Includes Austria, Belgium, Bulgaria, Cyprus, the Czech Republic, Denmark, Estonia, Finland, France, Germany, Greece, Hungary, Ireland, Italy, Latvia, Lithuania, Luxembourg, Malta, the Netherlands, Poland, Portugal, Romania, Slovakia, Slovenia, Spain, Sweden, and the United Kingdom.

CAPITAL MOVEMENTS
December 2009
92
TABLE CM-V-3.—Gross Total of Holdings with Positive Fair Values, by Country
[Holdings at end of period in millions of dollars. Source: Treasury International Capital Reporting System]
2007 2008 2009 Country Dec. June Sept. Dec. r Mar. June p
Europe:
Belgium ..................................................................... 13,329 19,872 14,308 30,559 28,326 18,103France ....................................................................... 139,382 204,125 173,382 328,209 287,586 205,911Germany.................................................................... 185,036 271,668 188,081 365,763 334,350 238,970Ireland ....................................................................... 163,883 193,358 222,010 424,358 406,282 313,260Italy............................................................................ 15,668 20,761 12,104 15,130 14,315 11,741Netherlands............................................................... 36,044 63,412 41,475 45,155 37,071 26,771Switzerland................................................................ 69,586 103,906 86,565 123,836 99,416 72,601United Kingdom......................................................... 1,558,496 2,272,620 2,095,893 4,658,297 4,329,400 3,164,368All other Europe ........................................................ 47,949 67,924 53,087 68,471 58,008 41,757
Total Europe.......................................................... 2,229,373 3,217,646 2,886,905 6,059,778 5,594,754 4,093,482
Memo: Euro Area 1.................................................... 572,162 801,150 673,487 1,247,252 1,142,111 839,037
Memo: European Union 2.......................................... 2,144,029 3,090,441 2,781,596 5,922,585 5,484,568 4,014,296
Canada.......................................................................... 51,648 74,917 55,749 92,214 77,908 57,959
Total Latin America ....................................................... 16,037 20,120 15,338 15,652 15,357 14,131
Caribbean: Cayman Islands ........................................................ 112,007 131,186 114,665 153,197 131,209 93,275
All other Caribbean ................................................... 21,305 28,070 25,422 32,889 21,941 18,434
Total Caribbean..................................................... 133,312 159,256 140,087 186,086 153,150 111,709
Asia: Japan......................................................................... 66,643 65,405 61,780 141,528 120,350 103,141All other Asia ............................................................. 36,647 64,837 54,198 91,732 77,950 56,577
Total Asia .............................................................. 103,290 130,242 115,978 233,260 198,300 159,718
Total Africa .................................................................... 4,260 6,155 4,722 6,396 5,176 4,181
Other countries: Australia .................................................................... 17,356 25,666 18,153 26,023 23,528 20,506All other ..................................................................... 954 708 955 1,833 1,746 1,621
Total other countries ............................................. 18,310 26,374 19,108 27,856 25,274 22,127
Total foreign countries ...................................... 2,556,230 3,634,710 3,237,887 6,621,242 6,069,919 4,463,307
Total international and regional organizations.............. 3,104 3,705 3,164 3,888 4,197 3,462
Grand total ............................................................ 2,559,332 3,638,417 3,241,052 6,625,129 6,074,115 4,466,770
1 Includes Austria, Belgium, Finland, France, Germany, Greece, Ireland, Italy, Luxembourg, the Netherlands, Portugal, and Spain. For data as of January 2008, also includes Cyprus, Malta, and Slovenia. For data as of January 2009, also includes Slovakia.
2 Includes Austria, Belgium, Cyprus, the Czech Republic, Denmark, Estonia, Finland, France, Germany, Greece, Hungary, Ireland, Italy, Latvia, Lithuania, Luxembourg, Malta, the Netherlands, Poland, Portugal, Romania, Slovakia, Slovenia, Spain, Sweden, and the United Kingdom.

CAPITAL MOVEMENTS
December 2009
93
TABLE CM-V-4.—Net Cash Settlements Received by U.S. Residents from Foreign Residents, by Type of Contract
[In millions of dollars. Source: Treasury International Capital Reporting System]
2007 2008 2008 2009
Type of Derivatives Contract Total Total r Apr.- June July - Sept. Oct.- Dec. r Jan. - Mar. Apr. - June p Total over-the-counter (OTC) contracts............................................ 6,851 -20,147 -4,617 -6,443 -4,866 12,021 1,864
Single-currency interest rate contracts ......................................... 11,030 -3,684 -4 421 2,026 -4,625 1,757
Foreign exchange contracts.......................................................... -3,814 -10,001 768 -5,564 -1,646 4,471 374
Other contracts.............................................................................. -365 -6,462 -5,381 -1,300 -5,246 12,175 -267
Total exchange-traded contracts ...................................................... -629 -12,800 2,262 1,557 -12,874 -4,800 9,401
Own contracts on foreign exchanges ........................................... 3,566 -1,480 7,227 -171 -10,245 -3,465 1,150
U.S. customers’ contracts on foreign exchanges ......................... 2,634 -8,683 1,185 -4,221 -4,999 -2,222 8,109
Foreign counterparty contacts on U.S. exchanges ...................... -6,829 -2,637 -6,150 5,949 2,370 887 142
Total net cash settlements from foreigners ...................................... 6,222 -32,947 -2,355 -4,886 -17,740 7,221 11,265
Memorandum items:
Contracts with foreign official institutions.................................. 872 1,831 -1,198 768 830 -674 -1,142 Note.—Negative figures indicate net cash payments or a net outflow of capital from the United States.

CAPITAL MOVEMENTS
December 2009
94
TABLE CM-V-5.—Net Cash Settlements Received by U.S. Residents from Foreign Residents, by Country
[In millions of dollars. Source: Treasury International Capital Reporting System]
2007 2008 2008 2009 Country Total Total r Apr. - June July - Sept. Oct. - Dec. r Jan. - Mar. Apr.- June p
Europe:
Belgium ................................................................................. -2,380 -208 101 188 -520 -570 1,073
France ................................................................................... -3,685 -19,184 -2,673 -3,982 -12,373 377 3,667
Germany ............................................................................... 84 -6,564 -2,746 1,310 -4,565 -6,470 -428
Ireland ................................................................................... -319 -4,154 -318 -791 -1,984 1,635 1,116
Italy........................................................................................ 730 -2,423 41 -1,004 -1,211 -41 299
Netherlands........................................................................... 516 -2,203 -3,206 124 1,473 415 407
Switzerland ........................................................................... 6,498 -7,303 -996 -2,907 1,685 3,199 2,186
United Kingdom .................................................................... 12,570 -5,022 5,581 -11,055 2,318 9,343 2,425
All other Europe .................................................................... 2,114 7,316 -4,209 6,283 3,718 -525 -1,249
Total Europe ..................................................................... 16,128 -39,745 -8,425 -11,834 -11,459 7,363 9,496
Memo: Euro area 1 ................................................................ -2,962 -30,990 -13,618 1,231 -16,236 -3,685 4,363
Memo: European Union 2...................................................... 9,750 -36,060 -8,153 -10,115 -14,886 3,428 6,179
Canada...................................................................................... -3,005 3,277 399 -2,387 2,126 -1,109 -2,599
Total Latin America ................................................................... -1,329 728 260 -143 941 856 -152
Caribbean:
Cayman Islands .................................................................... -1,159 11,011 3,109 5,417 -664 1,843 -132
All other Caribbean ............................................................... -250 4,902 1,072 4,800 33 1,370 -145
Total Caribbean ................................................................ -1,409 15,913 4,181 10,217 -631 3,213 -277
Asia:
Japan .................................................................................... -2,703 -9,685 2,998 -2,868 -5,085 -1,959 2,006
All other Asia......................................................................... -12 -4,317 -1,642 244 -1,272 1,051 1,987
Total Asia .......................................................................... -2,715 -14,002 1,356 -2,624 -6,357 -908 3,993
Total Africa ................................................................................ -264 -148 36 137 -175 -627 53
Other countries:
Australia ................................................................................ -1,602 1,049 35 1,907 -2,245 -1,156 1,076
All other ................................................................................. -230 92 49 -69 94 -76 10
Total other countries ......................................................... -1,832 1,141 84 1,838 -2,151 -1,232 1,086
Total foreign countries .................................................. 5,574 -32,836 -2,109 -4,796 -17,706 7,556 11,600
Total international and regional organizations.......................... 651 -121 -247 -98 -31 -335 -333
Grand total ........................................................................ 6,222 -32,947 -2,355 -4,886 -17,740 7,221 11,265
1 Includes Austria, Belgium, Finland, France, Germany, Greece, Ireland, Italy, Luxembourg, the Netherlands, Portugal, and Spain. For data as of January 2008, also includes Cyprus, Malta, and Slovenia. For data as of January 2009, also includes Slovakia. 2 Includes Austria, Belgium, Bulgaria, Cyprus, the Czech Republic, Denmark, Estonia, Finland, France, Germany, Hungary, Ireland, Italy, Latvia, Lithuania, Luxembourg, Malta, the Netherlands, Poland, Portugal, Romania, Slovakia, Slovenia, Spain, Sweden, and the United Kingdom.
Note.—Negative figures indicate net cash payments or a net outflow of capital from the United States.

December 2009
95
INTRODUCTION: Foreign Currency PositionsThe “Treasury Bulletin” reports foreign currency
holdings of large foreign exchange market participants. These reports provide information on positions in derivative instruments, such as foreign exchange futures and options, that are increasingly used in establishing foreign exchange positions but were not covered in the old reports.
The information is based on reports of large foreign
exchange market participants on holdings of five major foreign currencies (Canadian dollar, Japanese yen, Swiss franc, pound sterling, and euro) and the U.S. dollar. Positions in the U.S. dollar, which have been collected since January 1999, are intended to approximate “all other” currency positions of reporting institutions. U.S.-based businesses file a consolidated report for their domestic and foreign subsidiaries, branches, and agencies. U.S. subsidiaries of foreign entities file only for themselves, not for their foreign parents. Filing is required by law (31 United States Code 5315; 31 Code of Federal Regulations 128, Subpart C).
Weekly and monthly reports must be filed throughout the
calendar year by major foreign exchange market participants, which are defined as market participants with more than $50 billion equivalent in foreign exchange contracts on the last business day of any calendar quarter during the previous year (end March, June, September, or December). Such contracts include the amounts of foreign exchange spot contracts bought and sold, foreign exchange forward contracts bought and sold, foreign exchange futures bought and sold, and one half the notional amount of foreign exchange options bought and sold.
A quarterly report must be filed throughout the calendar year by each foreign exchange market participant that had more than $5 billion equivalent in foreign exchange contracts on the last business day of any quarter the previous year (end March, June, September, or December).
This information is published in six sections
corresponding to each of the major currencies covered by the reports. Tables I-1 through VI-1 present the currency data reported weekly by major market participants. Tables I-2 through VI-2 present more detailed currency data of major market participants, based on monthly Treasury reports. Tables I-3 through VI-3 present quarterly consolidated currency data reported by large market participants that do not file weekly reports.
Principal exchanged under cross-currency interest rate
swaps is reported as part of purchases or sales of foreign exchange. Such principal also was noted separately on monthly and quarterly reports through December 1998, when this practice was discontinued. The net options position, or the net delta-equivalent value of an options position, is an estimate of the relationship between an option’s value and an equivalent currency hedge. The delta equivalent value is defined as the product of the first partial derivative of an option valuation formula (with respect to the price of the underlying currency) multiplied by the notional principal of the contract.

FOREIGN CURRENCY POSITIONS
December 2009
96
SECTION I.—Canadian Dollar Positions TABLE FCP-I-1.—Weekly Report of Major Market Participants
[In millions of Canadian dollars. Source: Office of International Monetary and Financial Policy]
Spot, forward and future contracts
Report date Purchased
(1) Sold (2)
Net options positions (3)
Exchange rate
(Canadian dollars per U.S. dollar)
(4)
04/08/09 .................................................................... 631,972 659,966 55 1.2353
04/15/09 .................................................................... 650,566 677,285 517 1.2040
04/22/09 .................................................................... 647,263 674,926 283 1.2361
04/29/09 .................................................................... 645,222 669,847 571 1.2008
05/06/09 .................................................................... 676,601 698,774 477 1.1726
05/13/09 .................................................................... 664,276 689,625 61 1.1686
05/20/09 .................................................................... 662,461 685,615 224 1.1434
05/27/09 .................................................................... 682,782 705,874 267 1.1120
06/03/09 .................................................................... 701,100 724,367 506 1.0973
06/10/09 .................................................................... 716,790 735,543 608 1.1100
06/17/09 .................................................................... 648,186 664,429 583 1.1371
06/24/09 .................................................................... 626,367 646,893 n.a. 1.1462
07/01/09 .................................................................... 643,453 663,345 449 1.1446
07/08/09 .................................................................... 631,441 650,830 584 1.1650
07/15/09 .................................................................... 638,549 656,982 n.a. 1.1192
07/22/09 .................................................................... 633,250 655,331 n.a. 1.0980
07/29/09 .................................................................... 633,008 654,710 674 1.0881
08/05/09 .................................................................... 649,180 669,308 579 1.0722
08/12/09 .................................................................... 648,658 672,191 255 1.0875
08/19/09 .................................................................... 641,589 663,482 216 1.0968
08/26/09 .................................................................... 632,284 653,819 -14 1.0988
09/02/09 .................................................................... 652,931 674,453 121 1.1060
09/09/09 .................................................................... 657,236 675,869 235 1.0783
09/16/09 .................................................................... 633,029 631,534 n.a. 1.0662
09/23/09 .................................................................... 609,354 623,769 190 1.0722
09/30/09 .................................................................... 644,961 659,644 45 1.0719

FOREIGN CURRENCY POSITIONS
December 2009
97
SECTION I.—Canadian Dollar Positions, con. TABLE FCP-I-2.—Monthly Report of Major Market Participants
[In millions of Canadian dollars. Office of International Monetary and Financial Policy]
Options positions Spot, forward and future contracts
Foreign currency denominated Calls Puts
Report date Purchased
(1) Sold (2)
Assets (3)
Liabilities (4)
Bought (5)
Written (6)
Bought (7)
Written (8)
Net delta equivalent
(9)
Exchange rate (Canadian dollars per U.S. dollar)
(10) 2006 - Dec................... 579,771 588,986 160,820 146,721 74,389 68,162 90,305 94,040 6,142 1.1652
2007 - Dec................... 694,064 714,446 197,438 182,233 71,200 69,421 72,055 77,515 -522 0.9881
2008 - Oct ................... 817,607 846,772 191,668 164,583 52,351 53,220 61,117 59,599 -1,214 1.2158
Nov .................. 800,323 841,201 175,232 152,935 39,942 39,348 46,428 45,867 -1,401 1.2360
Dec .................. 634,789 666,685 175,405 154,246 34,361 32,641 36,089 37,162 -829 1.2240
2009 - Jan ................... 646,263 677,683 159,321 139,136 33,273 32,062 35,077 35,549 -101 1.2365
Feb .................. 671,695 702,394 158,950 136,095 34,210 33,087 38,774 38,183 -500 1.2710
Mar .................. 638,146 679,424 149,394 128,115 35,686 34,115 37,474 37,613 -379 1.2606
Apr................... 659,496 684,740 161,812 137,865 33,955 33,788 36,065 35,130 66 1.1939
May.................. 693,046 718,975 154,585 135,507 40,745 40,614 40,776 39,037 -220 1.0957
June................. 629,717 650,417 139,275 121,734 43,924 43,069 41,231 41,464 227 1.1626
July .................. 647,026 670,748 142,291 125,957 37,438 36,377 39,567 39,818 355 1.0791
Aug .................. 648,266 672,676 147,446 125,937 40,801 41,966 50,886 46,542 n.a. 1.0967
Sept ................. 646,686 664,469 140,386 128,353 41,859 40,549 39,668 37,879 -330 1.0719
TABLE FCP-I-3.—Quarterly Report of Large Market Participants [In millions of Canadian dollars. Source: Office of International Monetary and Financial Policy]
Options positions Spot, forward and future contracts
Foreign currency denominated Calls Puts
Report date Purchased
(1) Sold (2)
Assets (3)
Liabilities (4)
Bought (5)
Written (6)
Bought (7)
Written (8)
Net delta equivalent
(9)
Exchange rate (Canadian dollars per U.S. dollar)
(10) 2006 - Dec................... 20,327 26,745 65,076 34,842 833 456 1,536 844 n.a. 1.1652
2007 - Mar ................... 13,129 21,573 67,774 32,113 444 n.a. n.a. n.a. n.a. 1.153
June ................. 10,551 16,894 94,501 65,451 259 346 1,481 805 -174 1.0634
Sept.................. 10,062 16,161 92,670 69,270 n.a. 256 1,450 n.a. -192 0.9959
Dec................... 9,864 17,299 90,515 74,923 n.a. 1,186 1,628 703 -300 0.9881
2008 - Mar ................... 24,894 21,409 110,013 71,727 836 957 2,125 1,310 -470 1.0275
June ................. 25,156 21,808 139,752 77,457 418 1,328 2,216 1,914 -422 1.0185
Sept.................. 23,605 27,206 126,237 74,740 n.a. 1,195 1,979 n.a. n.a. 1.0597
Dec................... 14,969 27,815 110,044 67,230 n.a. 743 1,846 n.a. n.a. 1.2240
2009 - Mar ................... 8,282 19,513 85,815 62,677 185 381 1,261 861 n.a. 1.2606
June.................. 12,765 18,629 67,510 44,437 n.a. 196 n.a. 325 -78 1.1626

FOREIGN CURRENCY POSITIONS
December 2009
98
SECTION II.—Japanese Yen Positions TABLE FCP-II-1.—Weekly Report of Major Market Participants
[In billions of Japanese yen. Source: Office of International Monetary and Financial Policy]
Spot, forward and future contracts
Report date
Purchased (1)
Sold (2)
Net options positions (3)
Exchange rate
(Japanese yen per
U.S. dollar) (4)
04/08/09 .................................................................. 302,703 307,711 n.a. 99.95
04/15/09 .................................................................. 301,840 306,910 n.a. 99.37
04/22/09 .................................................................. 306,169 312,494 n.a. 98.14
04/29/09 .................................................................. 311,741 318,594 n.a. 96.97
05/06/09 .................................................................. 326,500 333,028 n.a. 98.60
05/13/09 .................................................................. 307,089 313,896 1,798 95.75
05/20/09 .................................................................. 295,161 301,288 1,626 95.16
05/27/09 .................................................................. 301,535 307,731 1,629 95.01
06/03/09 .................................................................. 305,597 312,360 1,615 95.72
06/10/09 .................................................................. 306,249 313,113 1,778 98.13
06/17/09 .................................................................. 301,537 308,347 866 95.65
06/24/09 .................................................................. 289,809 296,279 852 95.38
07/01/09 .................................................................. 288,580 294,843 797 96.41
07/08/09 .................................................................. 294,561 301,151 n.a. 92.90
07/15/09 .................................................................. 291,292 297,416 792 94.09
07/22/09 .................................................................. 292,056 298,392 909 93.77
07/29/09 .................................................................. 296,631 302,402 867 95.13
08/05/09 .................................................................. 292,820 298,871 886 94.98
08/12/09 .................................................................. 298,984 305,390 911 96.16
08/19/09 .................................................................. 296,920 303,315 1,006 93.87
08/26/09 .................................................................. 293,129 298,371 972 94.25
09/02/09 .................................................................. 299,309 304,106 1,118 92.43
09/09/09 .................................................................. 295,051 299,668 1,076 91.85
09/16/09 .................................................................. 293,735 297,805 1,073 91.00
09/23/09 .................................................................. 301,850 306,857 1,055 91.45
09/30/09 .................................................................. 316,110 320,249 1,098 89.49

FOREIGN CURRENCY POSITIONS
December 2009
99
SECTION II.—Japanese Yen Positions, con. TABLE FCP-II-2.—Monthly Report of Major Market Participants
[In billions of Japanese yen. Source: Office of International Monetary and Financial Policy]
Options positions Spot, forward and future contracts
Foreign currency denominated Calls Puts
Report date Purchased
(1) Sold (2)
Assets (3)
Liabilities (4)
Bought (5)
Written (6)
Bought (7)
Written (8)
Net delta equivalent
(9)
Exchange rate (Japanese yen per U.S. dollar)
(10) 2006 - Dec.................. 326,745 321,477 59,888 61,243 80,330 84,922 81,768 78,511 -1,538 119.0200
2007 - Dec.................. 463,494 462,366 69,975 72,014 112,480 115,176 122,042 123,860 761 111.7100
2008 - Oct .................. 412,583 415,910 56,997 55,756 73,233 63,856 86,630 93,689 2,791 98.2800
Nov ................. 381,547 385,268 54,011 53,231 68,158 58,087 79,887 87,524 3,307 95.4600
Dec ................. 323,332 327,005 56,606 55,822 64,185 54,758 75,507 81,983 3,295 90.7900
2009 - Jan .................. 334,069 336,685 56,968 55,685 60,541 52,821 72,217 77,249 2,506 89.8300
Feb ................. 347,802 352,245 57,700 56,081 60,065 53,869 73,549 77,119 2,218 97.7400
Mar ................. 330,801 335,829 53,688 52,051 59,542 52,961 73,246 77,162 n.a. 99.1500
Apr.................. 344,996 351,015 57,416 55,082 58,537 52,720 73,333 76,710 n.a. 98.7600
May................. 333,553 340,009 56,680 53,810 55,200 50,394 73,059 74,741 1,638 95.5500
June................ 305,410 311,413 52,148 50,911 53,349 49,403 71,101 72,879 804 96.4200
July ................. 326,038 333,178 53,242 51,473 51,643 47,825 70,018 70,847 1,051 94.5400
Aug ................. 317,353 322,774 50,396 49,071 49,744 46,868 68,743 69,551 1,730 92.8200
Sept ................ 341,851 346,132 48,825 48,884 46,473 43,663 65,172 66,319 1,096 89.4900
TABLE FCP-II-3.—Quarterly Report of Large Market Participants [In billions of Japanese yen. Source: Office of International Monetary and Financial Policy]
Options positions Spot, forward and future contracts
Foreign currency denominated Calls Puts
Report date Purchased
(1) Sold (2)
Assets (3)
Liabilities (4)
Bought (5)
Written (6)
Bought (7)
Written (8)
Net delta equivalent
(9)
Exchange rate (Japanese yen per U.S. dollar)
(10) 2006 - Dec................... 9,336 9,825 6,913 4,069 n.a. n.a. 1,001 n.a. -239 119.02
2007 - Mar ................... 4,623 5,036 6,174 2,904 910 n.a. 1,749 1,166 -325 117.56
June ................. 4,408 5,575 7,442 3,064 n.a. n.a. 2,210 n.a. n.a. 123.39
Sept.................. 5,039 6,234 6,558 2,808 1,170 518 1,005 587 n.a. 114.97
Dec................... 4,816 5,798 6,497 3,070 761 711 988 896 38 111.71
2008 - Mar ................... 5,441 6,554 11,048 2,696 376 340 1,097 866 58 99.85
June.................. 7,419 6,502 14,540 3,121 n.a. 364 1,027 549 18 106.17
Sept.................. 6,208 6,529 12,792 3,175 338 356 1,032 516 13 105.94
Dec................... 4,674 4,299 8,662 2,901 227 313 812 314 -11 90.79
2009 - Mar ................... 2,589 3,575 5,178 2,337 140 206 825 333 -42 99.15
June.................. 2,915 4,277 5,793 2,367 n.a. 167 846 269 -29 96.42

FOREIGN CURRENCY POSITIONS
December 2009
100
SECTION III.—Swiss Franc Positions TABLE FCP-III-1.—Weekly Report of Major Market Participants
[In millions of Swiss francs. Source: Office of International Monetary and Financial Policy]
Spot, forward and future contracts
Report date Purchased
(1) Sold (2)
Net options positions (3)
Exchange rate (Swiss francs per U.S. dollar)
(4) 04/08/09 .................................................................. 678,579 689,182 1,627 1.1459
04/15/09 .................................................................. 668,665 678,022 1,613 1.1453
04/22/09 .................................................................. 676,419 684,580 1,056 1.1634
04/29/09 .................................................................. 686,282 695,956 2,420 1.1309
05/06/09 .................................................................. 678,876 688,801 2,693 1.1313
05/13/09 .................................................................. 683,265 693,476 2,703 1.1061
05/20/09 .................................................................. 680,264 687,739 3,196 1.1022
05/27/09 .................................................................. 686,203 691,872 2,517 1.0861
06/03/09 .................................................................. 710,706 717,473 2,963 1.0684
06/10/09 .................................................................. 719,530 726,805 2,894 1.0816
06/17/09 .................................................................. 667,412 672,752 2,401 1.0870
06/24/09 .................................................................. 686,578 686,310 2,044 1.0842
07/01/09 .................................................................. 654,600 655,767 1,729 1.0720
07/08/09 .................................................................. 666,667 671,754 n.a. 1.0923
07/15/09 .................................................................. 656,083 662,552 2,619 1.0746
07/22/09 .................................................................. 643,571 648,873 n.a. 1.0659
07/29/09 .................................................................. 656,872 660,683 n.a. 1.0882
08/05/09 .................................................................. 662,190 665,122 652 1.0630
08/12/09 .................................................................. 670,350 675,113 -371 1.0765
08/19/09 .................................................................. 677,411 682,723 204 1.0630
08/26/09 .................................................................. 697,812 701,307 -642 1.0697
09/02/09 .................................................................. 711,458 714,886 -24 1.0628
09/09/09 .................................................................. 725,387 727,544 123 1.0403
09/16/09 .................................................................. 670,039 668,195 -668 1.0328
09/23/09 .................................................................. 669,394 666,139 -532 1.0259
09/30/09 .................................................................. 768,398 768,337 -620 1.0375

FOREIGN CURRENCY POSITIONS
December 2009
101
SECTION III.—Swiss Franc Positions, con. TABLE FCP-III-2.—Monthly Report of Major Market Participants
[In millions of Swiss francs. Source: Office of International Monetary and Financial Policy]
Options positions Spot, forward and future contracts
Foreign currency denominated Calls Puts
Report date Purchased
(1) Sold (2)
Assets (3)
Liabilities (4)
Bought (5)
Written (6)
Bought (7)
Written (8)
Net delta equivalent
(9)
Exchange rate (Swiss francs per
U.S. dollar) (10)
2006 - Dec................... 603,056 627,243 79,535 75,067 132,261 124,219 155,127 164,475 n.a. 1.2195
2007 - Dec................... 981,030 987,962 95,668 96,554 296,139 295,801 258,017 244,868 4,527 1.1329
2008 - Oct ................... 937,246 948,889 75,393 78,075 196,983 184,747 191,872 194,011 -1,471 1.1669
Nov .................. 886,183 887,457 75,284 75,755 178,017 171,105 188,261 190,888 -2,266 1.2165
Dec .................. 685,168 683,919 65,440 69,021 162,230 158,197 175,827 178,706 -1,352 1.0673
2009 - Jan ................... 713,098 717,450 67,519 69,547 156,789 156,834 160,415 158,720 -1,018 1.1612
Feb .................. 734,756 744,409 64,937 69,199 150,458 157,169 161,821 149,984 1,317 1.1672
Mar .................. 739,101 746,643 64,812 67,732 130,583 143,124 160,358 147,545 1,541 1.1395
Apr................... 723,487 726,575 70,641 70,353 119,598 126,330 139,761 134,732 1,383 1.1402
May.................. 708,514 715,692 60,887 63,895 112,212 122,016 138,877 132,579 2,431 1.0692
June................. 689,494 689,116 57,101 59,086 106,635 117,172 136,412 128,622 1,697 1.0867
July .................. 711,465 722,102 59,645 60,606 111,084 119,522 132,616 127,369 1,072 1.0668
Aug .................. 732,213 732,954 57,277 58,769 110,838 119,333 133,140 122,523 n.a. 1.0569
Sept ................. 813,502 813,243 63,185 59,227 92,905 98,454 124,122 115,512 -446 1.0375
TABLE FCP-III-3.—Quarterly Report of Large Market Participants [In millions of Swiss francs. Source: Office of International Monetary and Financial Policy]
Options positions Spot, forward and future contracts
Foreign currency denominated Calls Puts
Report date Purchased
(1) Sold (2)
Assets (3)
Liabilities (4)
Bought (5)
Written (6)
Bought (7)
Written (8)
Net delta equivalent
(9)
Exchange rate (Swiss francs per
U.S. dollar) (10)
2006 - Dec................... 19,099 26,282 46,317 11,031 n.a. n.a. n.a. n.a. n.a. 1.2195
2007 - Mar ................... 23,188 25,040 47,552 13,441 1,819 n.a. n.a. n.a. n.a. 1.2126
June ................. 16,511 23,187 46,886 14,061 855 n.a. n.a. n.a. n.a. 1.2240
Sept.................. 20,823 24,139 46,837 13,612 2,422 n.a. 596 n.a. 136 1.1672
Dec................... 15,134 20,077 46,339 10,338 584 283 535 324 -69 1.1329
2008 - Mar ................... 21,491 29,248 49,284 10,785 1,166 679 1,589 696 -16 0.9921
June.................. 16,727 26,727 62,191 10,566 n.a. n.a. 2,031 n.a. -24 1.0202
Sept.................. 15,916 28,686 63,301 11,924 n.a. n.a. 1,025 518 - 1.1189
Dec................... 11,140 22,483 52,460 10,716 n.a. n.a. 438 544 n.a. 1.0673
2009 - Mar ................... 9,740 20,478 42,551 10,843 113 103 805 644 n.a. 1.1395
June.................. 10,065 18,807 43,746 10,150 n.a. n.a. n.a. 285 n.a. 1.0867

FOREIGN CURRENCY POSITIONS
December 2009
102
SECTION IV.—Sterling Positions TABLE FCP-IV-1.—Weekly Report of Major Market Participants
[In millions of pounds sterling. Source: Office of International Monetary and Financial Policy]
Spot, forward and future contracts
Report date Purchased
(1) Sold (2)
Net options positions (3)
Exchange rate (U.S. dollars per
pound) (4)
04/08/09 .................................................................. 1,004,141 1,023,558 1,202 1.4692
04/15/09 .................................................................. 932,670 952,549 1,626 1.4990
04/22/09 .................................................................. 953,430 971,060 n.a. 1.4496
04/29/09 .................................................................. 959,096 974,000 n.a. 1.4802
05/06/09 .................................................................. 960,561 978,423 1,676 1.5063
05/13/09 .................................................................. 944,367 964,815 1,561 1.5165
05/20/09 .................................................................. 982,220 1,006,191 1,788 1.5670
05/27/09 .................................................................. 978,629 999,666 1,190 1.6068
06/03/09 .................................................................. 1,053,339 1,072,543 1,187 1.6405
06/10/09 .................................................................. 1,083,944 1,104,520 1,335 1.6334
06/17/09 .................................................................. 1,037,636 1,055,111 1,309 1.6293
06/24/09 .................................................................. 969,699 990,198 1,715 1.6486
07/01/09 .................................................................. 961,987 970,944 1,653 1.6524
07/08/09 .................................................................. 941,204 955,916 1,627 1.6027
07/15/09 .................................................................. 974,166 985,946 1,666 1.6439
07/22/09 .................................................................. 976,762 993,412 1,773 1.6439
07/29/09 .................................................................. 993,567 1,011,272 1,706 1.6379
08/05/09 .................................................................. 982,085 1,004,230 1,534 1.6977
08/12/09 .................................................................. 943,009 964,715 1,116 1.6538
08/19/09 .................................................................. 979,130 998,794 1,790 1.6555
08/26/09 .................................................................. 995,790 1,014,745 1,818 1.6235
09/02/09 .................................................................. 989,003 1,003,949 n.a. 1.6269
09/09/09 .................................................................. 994,553 1,006,908 1,827 1.6557
09/16/09 .................................................................. 946,580 952,294 1,943 1.6501
09/23/09 .................................................................. 948,497 958,590 n.a. 1.6404
09/30/09 .................................................................. 1,033,873 1,048,554 n.a. 1.6004

FOREIGN CURRENCY POSITIONS
December 2009
103
SECTION IV.—Sterling Positions, con. TABLE FCP-IV-2.—Monthly Report of Major Market Participants
[In millions of pounds sterling. Source: Office of International Monetary and Financial Policy]
Options positions Spot, forward and future contracts
Foreign currency denominated Calls Puts
Report date Purchased
(1) Sold (2)
Assets (3)
Liabilities (4)
Bought (5)
Written (6)
Bought (7)
Written (8)
Net delta equivalent
(9)
Exchange rate (U.S. dollars per pound)
(10) 2006 - Dec................... 813,178 846,452 400,194 350,140 81,276 73,370 78,380 80,387 2,269 1.9586
2007 - Dec................... 1,106,323 1,121,684 450,883 372,556 80,197 69,881 93,248 103,301 3,400 1.9843
2008 - Oct ................... 1,356,523 1,365,196 448,584 319,184 61,870 58,802 76,430 79,670 678 1.6165
Nov .................. 1,206,138 1,217,492 500,194 347,609 51,130 51,199 64,123 63,733 850 1.5348
Dec .................. 975,940 995,931 495,444 342,452 44,891 43,251 51,977 53,230 631 1.4619
2009 - Jan ................... 992,637 1,009,035 498,062 349,518 47,422 45,124 48,311 51,338 1,151 1.4413
Feb .................. 1,012,009 1,034,023 494,329 344,860 44,525 40,563 43,158 47,745 1,024 1.4276
Mar .................. 951,181 969,221 462,479 331,262 57,320 53,595 40,106 43,739 925 1.4300
Apr................... 987,751 1,004,154 404,225 324,447 47,157 44,903 37,301 42,571 1,350 1.4799
May.................. 1,009,001 1,026,796 381,514 312,229 48,464 43,924 37,292 43,988 1,014 1.6160
June................. 950,738 963,187 369,350 298,015 48,366 44,510 37,467 45,924 1,361 1.6452
July .................. 1,003,246 1,026,694 400,352 311,238 45,368 39,267 38,050 47,595 1,252 1.6713
Aug .................. 963,725 978,536 406,179 326,523 48,135 42,025 49,993 59,033 n.a. 1.6314
Sept ................. 1,065,984 1,083,972 431,385 329,870 45,843 41,693 47,004 51,984 n.a. 1.6004
TABLE FCP-IV-3.—Quarterly Report of Large Market Participants [In millions of pounds sterling. Source: Office of International Monetary and Financial Policy]
Options positions Spot, forward and future contracts
Foreign currency denominated Calls Puts
Report date Purchased
(1) Sold (2)
Assets (3)
Liabilities (4)
Bought (5)
Written (6)
Bought (7)
Written (8)
Net delta equivalent
(9)
Exchange rate (U.S. dollars per pound)
(10) 2006 - Dec................... 23,342 31,721 53,158 18,843 n.a. n.a. 2,034 565 10 1.9586
2007 - Mar ................... 12,787 20,170 60,460 22,609 267 69 n.a. n.a. -441 1.9685
June ................. 9,617 19,167 61,316 24,253 n.a. 60 n.a. n.a. n.a. 2.0063
Sept.................. 10,145 20,745 75,325 30,537 154 n.a. 2,491 n.a. n.a. 2.0389
Dec................... 11,365 22,642 76,423 26,918 139 159 3,733 n.a. -1,292 1.9843
2008 - Mar ................... 18,074 30,594 80,685 28,259 n.a. 90 1,956 883 -1,168 1.9855
June.................. 17,970 31,267 94,886 26,549 n.a. 302 2,046 1,195 n.a. 1.9906
Sept.................. 18,814 32,314 94,119 31,139 127 184 4,010 924 n.a. 1.7804
Dec................... 16,513 28,787 80,329 29,461 124 149 2,441 n.a. n.a. 1.4619
2009 - Mar ................... 12,645 15,895 57,217 32,870 153 137 2,142 763 n.a. 1.4300
June.................. 8,463 14,543 60,507 34,076 n.a. 146 n.a. n.a. n.a. 1.6452

FOREIGN CURRENCY POSITIONS
December 2009
104
SECTION V.—U.S. Dollar Positions TABLE FCP-V-1.—Weekly Report of Major Market Participants
[In millions of U.S. dollars. Source: Office of International Monetary and Financial Policy]
Spot, forward and future contracts
Report date Purchased
(1) Sold (2)
Net options positions (3)
Exchange rate (4)
04/08/09 ................................................................ 13,017,731 13,087,019 768 n.a.
04/15/09 ................................................................ 12,837,520 12,913,519 1,508 n.a.
04/22/09 ................................................................ 12,972,367 13,044,666 -1,427 n.a.
04/29/09 ................................................................ 13,343,290 13,406,117 -3,329 n.a.
05/06/09 ................................................................ 13,321,826 13,389,014 -316 n.a.
05/13/09 ................................................................ 13,466,987 13,517,944 505 n.a.
05/20/09 ................................................................ 13,465,565 13,399,756 -846 n.a.
05/27/09 ................................................................ 13,879,593 13,834,464 -435 n.a.
06/03/09 ................................................................ 14,249,731 14,204,852 132 n.a.
06/10/09 ................................................................ 14,545,746 14,508,490 -4,186 n.a.
06/17/09 ................................................................ 13,951,387 13,827,144 2,368 n.a.
06/24/09 ................................................................ 13,737,254 13,608,860 2,059 n.a.
07/01/09 ................................................................ 14,118,920 13,961,510 179 n.a.
07/08/09 ................................................................ 13,603,943 13,486,097 -1,171 n.a.
07/15/09 ................................................................ 13,525,788 13,406,903 -11,205 n.a.
07/22/09 ................................................................ 13,536,704 13,443,496 -10,883 n.a.
07/29/09 ................................................................ 13,780,639 13,690,516 -9,397 n.a.
08/05/09 ................................................................ 13,707,771 13,581,182 -16,858 n.a.
08/12/09 ................................................................ 13,685,208 13,544,335 -9,472 n.a.
08/19/09 ................................................................ 13,713,677 13,564,987 -9,957 n.a.
08/26/09 ................................................................ 13,702,917 13,613,226 -9,356 n.a.
09/02/09 ................................................................ 13,878,040 13,799,183 -5,397 n.a.
09/09/09 ................................................................ 14,051,403 13,988,069 -18,270 n.a.
09/16/09 ................................................................ 13,599,732 13,615,643 -11,668 n.a.
09/23/09 ................................................................ 13,670,579 13,677,553 -8,312 n.a.
09/30/09 ................................................................ 14,500,674 14,531,686 -5,380 n.a.

FOREIGN CURRENCY POSITIONS
December 2009
105
SECTION V.—U.S. Dollar Positions, con. TABLE FCP-V-2.—Monthly Report of Major Market Participants
[In millions of U.S. dollars. Source: Office of International Monetary and Financial Policy]
Options positions Spot, forward
and future contracts Foreign currency
denominated Calls Puts
Report date Purchased
(1) Sold (2)
Assets (3)
Liabilities (4)
Bought (5)
Written (6)
Bought (7)
Written (8)
Net delta equivalent
(9)
Exchange rate (10)
2006 - Dec.............. 10,523,993 10,613,502 - - 1,877,190 1,921,370 2,004,037 2,251,079 -8,890 n.a.
2007 - Dec.............. 16,604,296 16,621,391 - - 2,665,228 2,579,678 2,534,065 n.a. 794 n.a.
2008 - Oct .............. 18,023,570 18,010,589 - - 3,639,554 3,715,441 4,001,058 3,962,748 996 n.a.
Nov ............. 16,897,006 16,899,403 - - 3,309,641 3,404,580 3,790,897 3,753,138 4,806 n.a.
Dec ............. 14,157,193 14,295,305 - - 3,216,341 3,311,971 3,750,439 3,700,270 -4,233 n.a.
2009 - Jan .............. 14,191,114 14,308,543 - - 3,087,045 3,143,982 3,540,964 3,518,820 -4,877 n.a.
Feb ............. 14,134,645 14,188,658 - - 2,725,815 3,430,086 3,061,456 3,042,159 -5,698 n.a.
Mar ............. 13,754,639 13,820,770 - - 2,849,625 2,892,513 2,993,819 2,951,855 -208 n.a.
Apr.............. 14,201,373 14,180,133 - - 2,597,445 2,651,947 2,873,709 2,833,666 -170 n.a.
May............. 14,739,401 14,721,439 - - 2,424,869 2,493,896 2,796,776 2,755,515 3,226 n.a.
June............ 14,151,342 14,018,521 - - 2,343,036 2,398,024 2,684,489 2,660,414 4,621 n.a.
July ............. 14,676,091 14,564,040 - - 2,258,719 2,310,391 2,545,795 2,541,530 -9,980 n.a.
Aug ............. 14,103,597 14,037,241 - - 2,294,156 2,321,528 2,494,599 2,494,105 -30,037 n.a.
Sept ............ 15,268,940 15,285,964 - - 2,071,509 2,128,587 2,446,463 2,344,399 -8,481 n.a.
TABLE FCP-V-3.—Quarterly Report of Large Market Participants [In millions of U.S. dollars. Source: Office of International Monetary and Financial Policy]
Options positions Spot, forward and future contracts
Foreign currency denominated Calls Puts
Report date Purchased
(1) Sold (2)
Assets (3)
Liabilities (4)
Bought (5)
Written (6)
Bought (7)
Written (8)
Net delta equivalent
(9)
Exchange rate (10)
2006 - Dec................... 445,675 450,809 - - 25,301 38,520 17,570 23,098 -278 n.a.
2007 - Mar ................... 257,985 245,890 - - 33,632 23,046 17,873 20,639 122 n.a.
June.................. 271,790 230,303 - - 36,519 32,361 21,051 n.a. 2,341 n.a.
Sept .................. 283,902 268,604 - - 33,028 21,170 19,119 10,739 -1,325 n.a.
Dec ................... 297,212 291,395 - - 29,007 22,828 13,464 10,454 2,111 n.a.
2008 - Mar ................... 384,255 382,695 - - 29,794 27,278 15,610 15,318 3,114 n.a.
June.................. 340,324 342,590 - - 30,279 25,934 15,361 11,644 2,745 n.a.
Sept .................. 346,969 328,750 - - 26,978 23,465 19,379 13,612 -109 n.a.
Dec ................... 291,721 281,080 - - 25,365 15,176 8,439 6,931 1,145 n.a.
2009 - Mar ................... 229,519 196,627 - - 29,452 25,135 6,956 5,394 2,291 n.a.
June.................. 237,179 197,359 - - 16,989 12,555 7,236 6,082 1,027 n.a.

FOREIGN CURRENCY POSITIONS
December 2009
106
SECTION VI.—Euro Positions TABLE FCP-VI-1.—Weekly Report of Major Market Participants
[In millions of euros. Source: Office of International Monetary and Financial Policy]
Spot, forward and future contracts
Report date Purchased
(1) Sold (2)
Net options positions (3)
Exchange rate
(Euros per U.S. dollar)
(4) 04/08/09 ............................................................................. 3,809,085 3,735,054 1,755 0.7526
04/15/09 ............................................................................. 3,704,240 3,631,087 1,709 0.7586
04/22/09 ............................................................................. 3,792,874 3,710,867 2,002 0.7685
04/29/09 ............................................................................. 3,923,852 3,847,498 3,411 0.7505
05/06/09 ............................................................................. 3,952,014 3,876,702 1,600 0.7512
05/13/09 ............................................................................. 3,981,052 3,909,671 1,455 0.7347
05/20/09 ............................................................................. 3,940,979 3,876,036 2,489 0.7265
05/27/09 ............................................................................. 3,994,035 3,920,492 3,037 0.7182
06/03/09 ............................................................................. 4,176,549 4,111,297 3,616 0.7045
06/10/09 ............................................................................. 4,250,918 4,172,338 4,299 0.7152
06/17/09 ............................................................................. 3,992,816 3,924,169 1,928 0.7220
06/24/09 ............................................................................. 3,977,812 3,910,709 1,726 0.7135
07/01/09 ............................................................................. 4,055,403 4,010,110 2,203 0.7049
07/08/09 ............................................................................. 3,954,050 3,884,575 898 0.7219
07/15/09 ............................................................................. 3,860,467 3,790,911 903 0.7084
07/22/09 ............................................................................. 3,814,149 3,740,369 1,446 0.7032
07/29/09 ............................................................................. 3,889,116 3,817,875 -259 0.7126
08/05/09 ............................................................................. 3,817,244 3,741,336 1,165 0.6949
08/12/09 ............................................................................. 3,803,332 3,729,782 1,001 0.7035
08/19/09 ............................................................................. 3,800,972 3,728,992 619 0.7012
08/26/09 ............................................................................. 3,794,505 3,723,531 1,630 0.7027
09/02/09 ............................................................................. 3,859,277 3,785,342 2,670 0.7020
09/09/09 ............................................................................. 3,881,743 3,811,385 4,244 0.6862
09/16/09 ............................................................................. 3,767,514 3,686,241 4,213 0.6804
09/23/09 ............................................................................. 3,781,742 3,700,592 4,427 0.6779
09/30/09 ............................................................................. 3,870,463 3,774,512 3,624 0.6835

FOREIGN CURRENCY POSITIONS
December 2009
107
SECTION VI.—Euro Positions, con. TABLE FCP-VI-2.—Monthly Report of Major Market Participants
[In millions of euros. Source: Office of International Monetary and Financial Policy]
Options positions Spot, forward and future contracts
Foreign currency denominated Calls Puts
Report date Purchased
(1) Sold (2)
Assets (3)
Liabilities (4)
Bought (5)
Written (6)
Bought (7)
Written (8)
Net delta equivalent
(9)
Exchange rate (10)
2006 - Dec................... 2,908,461 2,899,018 1,471,459 1,427,573 651,970 693,889 508,842 587,473 -14,933 0.7578
2007 - Dec................... 4,057,077 4,029,716 1,995,834 1,941,086 590,115 584,307 558,711 557,451 3,580 0.6848
2008 - Oct ................... 4,839,339 4,749,132 1,708,452 1,662,678 519,760 565,703 582,178 580,715 -639 0.7885
Nov .................. 4,709,541 4,624,402 1,853,674 1,816,912 494,904 534,155 533,471 538,819 -832 0.7878
Dec .................. 3,956,295 3,869,172 1,836,594 1,823,683 466,120 501,559 750,439 760,767 1,108 0.7184
2009 - Jan ................... 3,964,027 3,892,556 1,821,280 1,814,050 451,966 483,299 766,242 778,637 1,755 0.7810
Feb .................. 4,009,759 3,948,460 1,860,679 1,850,057 438,200 471,934 506,044 513,741 2,404 0.7898
Mar .................. 3,966,315 3,909,096 1,783,672 1,771,541 452,634 478,774 488,051 503,447 715 0.7541
Apr................... 4,133,770 4,049,118 1,710,904 1,707,105 434,348 462,886 450,651 466,300 311 0.7551
May.................. 4,274,948 4,221,000 1,666,699 1,646,244 448,376 468,287 395,848 412,724 747 0.7079
June................. 4,081,869 4,023,126 1,612,664 1,580,416 386,847 428,978 397,265 401,016 837 0.7133
July .................. 4,014,991 3,944,767 1,629,521 1,605,186 351,208 399,381 401,361 394,364 -294 0.7003
Aug .................. 3,736,153 3,665,181 1,673,154 1,650,110 350,059 392,565 389,854 382,481 4,447 0.6967
Sept ................. 4,061,544 3,960,067 1,625,730 1,603,238 306,108 341,040 344,695 357,465 2,474 0.6835
TABLE FCP-VI-3.—Quarterly Report of Large Market Participants [In millions of euros. Source: Office of International Monetary and Financial Policy]
Options positions Spot, forward and future contracts
Foreign currency denominated Calls Puts
Report date Purchased
(1) Sold (2)
Assets (3)
Liabilities (4)
Bought (5)
Written (6)
Bought (7)
Written (8)
Net delta equivalent
(9)
Exchange rate (10)
2006 - Dec................... 126,039 132,907 207,774 150,191 8,664 2,967 7,494 4,987 -603 0.7578
2007 - Mar ................... 74,638 81,811 188,261 118,068 9,318 3,549 11,618 4,045 -611 0.7477
June ................. 68,711 81,208 204,447 125,902 7,443 3,408 10,670 3,743 -1,051 0.7396
Sept.................. 82,783 79,080 218,344 139,178 9,967 3,207 6,648 2,948 699 0.7033
Dec................... 81,522 80,991 213,943 138,149 8,674 2,806 5,653 2,137 -1,362 0.6848
2008 - Mar ................... 126,180 91,977 262,397 157,462 8,362 5,988 8,821 7,976 1,039 0.6327
June.................. 116,332 88,752 272,427 119,914 9,806 3,601 10,018 5,693 3,067 0.6350
Sept.................. 87,982 94,534 246,267 113,023 10,459 5,295 8,870 9,606 1,667 0.7102
Dec................... 92,026 88,502 212,167 106,561 6,839 2,745 5,509 4,762 1,761 0.7184
2009 - Mar ................... 70,202 78,229 172,836 101,840 6,348 3,043 n.a. n.a. 1,529 0.7541
June.................. 61,282 71,989 198,864 98,476 5,447 3,728 4,911 4,031 1,337 0.7133

December 2009
108
INTRODUCTION: Exchange Stabilization FundTo stabilize the exchange value of the dollar, the
Exchange Stabilization Fund (ESF) was established pursuant to chapter 6, section 10 of the Gold Reserve Act of January 30, 1934 (codified at 31 United States Code 5302), which authorized establishment of a Treasury fund to be operated under the exclusive control of the Secretary, with approval of the President.
Subsequent amendment of the Gold Reserve Act modified the original purpose somewhat to reflect termination of the fixed exchange rate system.
Resources of the fund include dollar balances, partially invested in U.S. Government securities, special drawing rights (SDRs), and balances of foreign currencies. Principal sources of income (+) or loss (-) for the fund are profits (+) or losses (-) on SDRs and foreign exchange, as well as interest earned on assets.
• Table ESF-1 presents the assets, liabilities, and capital of the fund. The figures are in U.S. dollars or their equivalents based on current exchange rates computed according to the accrual method of accounting. The capital account represents the original capital appropriated to the fund by Congress of $2 billion, minus a subsequent transfer of $1.8 billion to pay for the initial U.S. quota subscription to the International Monetary Fund. Gains and losses are reflected in the cumulative net income (+) or loss (-) account.
• Table ESF-2 shows the results of operations by quarter. Figures are in U.S. dollars or their equivalents computed according to the accrual method. “Profit (+) or loss (-) on foreign exchange” includes realized profits or losses. “Adjustment for change in valuation of SDR holdings and allocations” reflects net gain or loss on revaluation of SDR holdings and allocations for the quarter.
TABLE ESF-1.—Balances as of March 31, 2009, and June 30, 2009
[In thousands of dollars. Source: Office of the Assistant Secretary of the Treasury for Management]
Assets, liabilities, and capital March 31, 2009
April 1, 2009, through
June 30, 2009 June 30, 2009 Assets U.S. dollars:
Held with Treasury: Fund Balance................................................................... - - - U.S. Government securities............................................. 15,818,103 486,646 16,304,749 Government Sponsored Enterprises (GSE) Securities ... 1,825,016 -100,016 1,725,000
Special drawing rights 1 ........................................................... 9,081,632 355,702 9,437,334 Foreign exchange and securities:
European euro ..................................................................... 13,504,198 827,667 14,331,865 Japanese yen....................................................................... 9,667,567 285,802 9,953,369
Accounts receivable................................................................. 141,890 16,480 158,370 Total assets.......................................................................... 50,038,406 1,872,281 51,910,687
Liabilities and capital Current liabilities:
Accounts payable................................................................. 6,606 -1,099 5,507 Total current liabilities ...................................................... 6,606 -1,099 5,507
Other liabilities: SDR certificates ................................................................... 2,200,000 - 2,200,000 SDR allocations ................................................................... 7,325,140 280,057 7,605,197 Unearned revenue .............................................................. 108,628 110,726 219,354
Total other liabilities ......................................................... 9,633,768 390,783 10,024,551 Capital:
Capital account .................................................................... 200,000 - 200,000 Net income (+) or loss (-) (see table ESF-2) ....................... 40,198,032 -38,100,034 2,097,998
Total capital...................................................................... 40,398,032 1,482,597 41,880,629 Total liabilities and capital............................................ 50,038,406 1,872,281 51,910,687
See footnote on the following page.

EXCHANGE STABILIZATION FUND
December 2009
109
TABLE ESF-2.—Income and Expense [In thousands of dollars. Source: Office of the Assistant Secretary of the Treasury for Management]
Current quarter April 1, 2009,
through June 30, 2009
Fiscal year to date October 1, 2008,
through June 30, 2009
Income and expense
Profit (+) or loss (-) on:
Foreign exchange ........................................................................ 1,055,087,594 844,986,156
Adjustment for change in valuation of SDR holdings and allocations 1 .............................................. 67,468,090 -4,218,433
Interest (+) or net charges (-) on:
SDRs............................................................................................ 1,651,912 10,698,687
U.S. Government securities......................................................... 4,326,861 15,897,666
GSE Securities............................................................................. 2,368,746 4,081,787
Foreign exchange ........................................................................ 75,921,466 290,872,467
Insurance premiums .................................................................... 275,772,219 935,679,270
Commissions ............................................................................... - -
Income from operations ............................................................... 1,482,596,887 2,097,997,599
Net income (+) or loss (-) ............................................................. 1,482,596,887 2,097,997,599
1 Beginning July 1974, the International Monetary Fund adopted a technique for valuing the SDRs based on a weighted average of exchange rates for the currencies of selected member countries. The U.S. SDR holdings and allocations are valued on this basis beginning July 1974.
Note.— Annual balance sheets for fiscal years 1934 through 1940 appeared in the 1940 “Annual Report of the Secretary of the Treasury” and those for succeeding years appeared in subsequent reports through 1980. Quarterly balance sheets beginning with December 31, 1938, have been published in the “Treasury Bulletin.” Data from inception to September 30, 1978, may be found on the statements published in the January 1979 “Treasury Bulletin.”

Trust Funds

TRUST FUNDS
December 2009
113
TABLE TF-6A.—Highway Trust Fund The following information is released according to the
provisions of the Byrd Amendment [codified at 26 United States Code 9503(d)] and represents data concerning the Highway Trust Fund. The figure described as “unfunded authorizations” is the latest estimate received from the DOT for fiscal year 2010.
The 48-month revenue estimates for the highway and mass transit accounts, respectively, include the latest estimates received from Treasury’s Office of Tax Analysis for excise taxes, net of refunds. They represent net highway receipts for those periods beginning at the close of fiscal year 2010.
Highway Account [In billions of dollars. Source: DOT]
Commitments (unobligated balances plus unpaid obligations, fiscal year 2010) .............................................................................................................. 79
less:
Cash balance (fiscal year 2010) ......................................................................................................................................................................................... -4
Unfunded authorizations (fiscal year 2010) ........................................................................................................................................................................ 83
48-month revenue estimate (fiscal years 2011, 2012, 2013, and 2014)............................................................................................................................ 137
Note.—Detail may not add to totals due to rounding.
Mass Transit Account [In billions of dollars. Source: DOT]
Commitments (unobligated balances plus unpaid obligations, fiscal year 2010) .............................................................................................................. 16
less:
Cash balance (fiscal year 2010) ......................................................................................................................................................................................... 1
Unfunded authorizations (fiscal year 2010) ........................................................................................................................................................................ 15
48-month revenue estimate (fiscal years 2011, 2012, 2013, and 2014)............................................................................................................................ 20

December 2009
114
Research Paper Series
Available through the Office of the Assistant Secretary for Economic Policy
9002. “Historical Trends in the U.S. Cost of Capital.” Robert Gillingham and John S. Greenlees. December 1990.
9003. “The Effect of Marginal Tax Rates on Capital Gains Revenue: Another Look at the Evidence.” Robert Gillingham and John S. Greenlees. December 1990.
9004. “An Econometric Model of Capital Gains Realization Behavior.” Robert Gillingham, John S. Greenlees, and Kimberly D. Zieschang. August 1990.
9101. “The Impact of Government Deficits on Personal and National Saving Rates.” (Revised) Michael R. Darby, Robert Gillingham, and John S. Greenlees. February 1991.
9102. “Social Security and the Public Debt.” James E. Duggan. October 1991.
9201. “Issues in Eastern European Social Security Reform.” John C. Hambor. June 1992.
9202. “Life-Health Insurance Markets.” John S. Greenlees and James E. Duggan. July 1992.
9203. “Property-Casualty Insurance Markets.” Lucy Huffman and David Bernstein. August 1992.
9301. “The Bank-Reported Data in the U.S. Balance of Payments: Basic Features and an Assessment of their Reliability.” Michael Cayton. February 1993.
9302. “The Returns Paid to Early Social Security Cohorts.” James E. Duggan, Robert Gillingham, and John S. Greenlees. April 1993.
9303. “Distributional Effects of Social Security: The Notch Issue Revisited.” James E. Duggan, Robert Gillingham, and John S. Greenlees. Revised April 1995.
9501. “Progressive Returns to Social Security? An Answer from Social Security Records.” James E. Duggan, Robert Gillingham, and John S. Greenlees. November 1995.
9701. “Housing Bias in the CPI and Its Effects on the Budget Deficit and Social Security Trust Fund.” James E. Duggan, Robert Gillingham, and John S. Greenlees. January 1997.
9702. “An Improved Method for Estimating the Total Taxable Resources of the States.” Michael Compson and John Navratil. December 1997.
2001-01. “Some Regulatory and Institutional Barriers to Congestion Pricing at Airports.” Edward Murphy and John D. Worth. May 2001.
2001-02. “Actuarial Nonequivalence in Early and Delayed Social Security Benefit Claims.” James E. Duggan and Christopher J. Soares. June 2001.

RESEARCH PAPER SERIES
December 2009
115
2003-01. “Annuity Risk: Volatility and Inflation Exposure in Payments from Immediate Life Annuities.” Christopher J. Soares and Mark Warshawsky. January 2003.
2005-01. “Possible Alternatives to the Medicare Trustees’ Long-Term Projections of Health Spending.” Jason D. Brown and Ralph M. Monaco. January 2005.
2005-02. “The Long-Term Real Interest Rate for Social Security.” James A. Girola. March 2005.
2006-01. “Implications of Returns on Treasury Inflation-Indexed Securities for Projections of the Long-Term Real Interest Rate.” James A. Girola. March 2006.
2007-01. “Mortality and Lifetime Income Evidence from Social Security Records.” James E. Duggan, Robert Gillingham, and John S. Greenlees. December 2006.
2007-02. “The Impact of Post-9/11 Visa Policies on Travel to the United States.” Brent Neiman and Phillip L. Swagel. June 2007.
2008-01. “Prefunding Social Security Benefits to Achieve Intergenerational Fairness: Can It Be Done in the Social Security Trust Fund?” Randall P. Mariger. December 2008.
2008-02. “Do Social Security Surpluses Pay Down Publicly Held Debt? Evidence from Budget Data.” Randall P. Mariger. December 2008.
Copies may be obtained by writing to: Ann Bailey, Department of the Treasury
1500 Pennsylvania Ave., NW., Room 4409 MT Washington, DC 20220
Telephone (202) 622-1519 or fax (202) 622-4112

December 2009
116
Glossary With References to Applicable Sections and Tables
Source: Financial Management Service
Amounts outstanding and in circulation (USCC)—Includes all issues by the Bureau of the Mint purposely intended as a medium of exchange. Coins sold by the Bureau of the Mint at premium prices are excluded; however, uncirculated coin sets sold at face value plus handling charge are included.
Average discount rate (PDO-1, -2)—In Treasury bill auctions, purchasers tender competitive bids on a discount rate basis. The average discount rate is the weighted, or adjusted, average of all bids accepted in the auction.
Budget authority (“Federal Fiscal Operations”)—Congress passes laws giving budget authority to Government entities, which gives the agencies the power to spend Federal funds. Congress can stipulate various criteria for the spending of these funds. For example, Congress can stipulate that a given agency must spend within a specific year, number of years, or any time in the future.
The basic forms of budget authority are appropriations, authority to borrow, contract authority, and authority to obligate and expend offsetting receipts and collections. The period of time during which Congress makes funds available may be specified as 1-year, multiple-year, or no-year. The available amount may be classified as either definite or indefinite; a specific amount or an unspecified amount can be made available. Authority also may be classified as current or permanent. Permanent authority requires no current action by Congress.
Budget deficit—The total, cumulative amount by which budget outlays (spending) exceed budget receipts (income).
Cash management bills (PDO-1)—Marketable Treasury bills of irregular maturity lengths, sold periodically to fund short-term cash needs of Treasury. Their sale, having higher minimum and multiple purchase requirements than those of other issues, is generally restricted to competitive bidders.
Competitive tenders (“Treasury Financing Operations”)—A bid to purchase a stated amount of one issue of Treasury securities at a specified yield or discount. The bid is accepted if it is within the range accepted in the auction. (See Noncompetitive tenders.)
Currency no longer issued (USCC)—Old and new series gold and silver certificates, Federal Reserve notes, national bank notes, and 1890 Series Treasury notes.
Debt outstanding subject to limitation (FD-6)—The debt incurred by the Treasury subject to the statutory limit set by Congress. Until World War I, a specific amount of debt was authorized to each separate security issue. Beginning with the
Second Liberty Loan Act of 1917, the nature of the limitation was modified until, in 1941, it developed into an overall limit on the outstanding Federal debt. As of September 2009, the debt limit was $12,104,000 million; the limit may change from year to year.
The debt subject to limitation includes most of Treasury’s public debt except securities issued to the Federal Financing Bank, upon which there is a limitation of $15 billion, and certain categories of older debt (totaling approximately $595 million as of February 1991).
Discount—The interest deducted in advance when purchasing notes or bonds. (See Accrued discount.)
Discount rate (PDO-1)—The difference between par value and the actual purchase price paid, annualized over a 360-day year. Because this rate is less than the actual yield (coupon-equivalent rate), the yield should be used in any comparison with coupon issue securities.
Dollar coins (USCC)—Include standard silver and nonsilver coins.
Domestic series (FD-2)—Nonmarketable, interest- and non-interest-bearing securities issued periodically by Treasury to the Resolution Funding Corporation (RFC) for investment of funds authorized under section 21B of the Federal Home Loan Bank Act (12 United States Code 1441b).
Federal intrafund transactions (“Federal Fiscal Opera-tions”)—Intrabudgetary transactions in which payments and receipts both occur within the same Federal fund group (Federal funds or trust funds).
Federal Reserve notes (USCC)—Issues by the U.S. Government to the public through the Federal Reserve banks and their member banks. They represent money owed by the Government to the public. Currently, the item “Federal Reserve notes—amounts outstanding” consists of new series issues. The Federal Reserve note is the only class of currency currently issued.
Foreign (“Foreign Currency Positions,” IFS-2, -3)—Locations other than those included under the definition of the United States. (See United States.)
Foreigner (“Capital Movements,” IFS-2)—All institutions and individuals living outside the United States, including U.S. citizens living abroad, and branches, subsidiaries, and other affiliates abroad of U.S. banks and business concerns; central governments, central banks, and other official institutions of countries other than the United States; and

GLOSSARY
December 2009
117
international and regional organizations, wherever located. Also refers to persons in the United States to the extent that they are known by reporting institutions to be acting for foreigners.
Foreign official institutions (“Capital Movements”)—Includes central governments of foreign countries, including all departments and agencies of national governments; central banks, exchange authorities, and all fiscal agents of foreign national governments that undertake activities similar to those of a treasury, central bank, or stabilization fund; diplomatic and consular establishments of foreign national governments; and any international or regional organization, including subordinate and affiliate agencies, created by treaty or convention between sovereign states.
Foreign public borrower (“Capital Movements”)—Includes foreign official institutions, as defined above, the corporations and agencies of foreign central governments, including development banks and institutions, and other agencies that are majority-owned by the central government or its departments; and state provincial and local governments of foreign countries and their departments and agencies.
Foreign-targeted issue (PDO-2)—Foreign-targeted issues were notes sold between October 1984 and February 1986 to foreign institutions, foreign branches of U.S. institutions, foreign central banks or monetary authorities, or to international organizations in which the United States held membership. Sold as companion issues, they could be converted to domestic (normal) Treasury notes with the same maturity and interest rates. Interest was paid annually.
Fractional coins (USCC)—Coins minted in denominations of 50, 25, and 10 cents, and minor coins (5 cents and 1 cent).
Government account series (FD-2)—Certain trust fund statutes require the Secretary of the Treasury to apply monies held by these funds toward the issuance of nonmarketable special securities. These securities are sold directly by Treasury to a specific Government agency, trust fund, or account. Their rate is based on an average of market yields on outstanding Treasury obligations, and they may be redeemed at the option of the holder. Roughly 80 percent of these are issued to five holders: the Federal Old-Age and Survivors Insurance Trust Fund; the civil service retirement and disability fund; the Federal Hospital Insurance Trust Fund; the military retirement fund; and the Unemployment Trust Fund.
Interfund transactions (“Federal Fiscal Operations”)—Transactions in which payments are made from one fund group (either Federal funds or trust funds) to a receipt account in another group.
International Monetary Fund (“Exchange Stabilization Fund,” IFS-1)—(IMF) Established by the United Nations, the IMF promotes international trade, stability of exchange, and monetary cooperation. Members are allowed to draw from the fund.
Intrabudgetary transactions (“Federal Fiscal Operations”)—These occur when payment and receipt both occur within the budget, or when payment is made from off-budget Federal entities whose budget authority and outlays are excluded from the budget totals.
Noncompetitive tenders (“Treasury Financing Opera-tions”)—This is a tender or bid to purchase a stated par amount of securities at the highest yield or discount rate awarded to competitive bidders for a single-price auction.
Obligations (“Federal Fiscal Operations”)—An unpaid commitment to acquire goods or services.
Off-budget Federal entities (“Federal Fiscal Operations”)—Federally owned and controlled entities whose transactions are excluded from the budget totals under provisions of law. Their receipts, outlays, and surplus or deficit are not included in budget receipts, outlays, or deficits. Their budget authority is not included in totals of the budget.
Outlays (“Federal Fiscal Operations”)—Payments on obligations in the form of cash, checks, the issuance of bonds or notes, or the maturing of interest coupons.
Own foreign offices (“Capital Movements”)—Refers to U.S. reporting institutions’ parent organizations, branches and/or majority-owned subsidiaries located outside the United States.
Par value—The face value of bonds or notes, including interest.
Quarterly financing (“Treasury Financing Operations”)—Treasury has historically offered packages of several “coupon” security issues on the 15th of February, May, August, and November, or on the next working day. These issues currently consist of a 3-year note, a 10-year note, and a 30-year bond. Treasury sometimes offers additional amounts of outstanding long-term notes or bonds, rather than selling new security issues. (See Reopening.)
Receipts (“Federal Fiscal Operations”)—Funds collected from selling land, capital, or services, as well as collections from the public (budget receipts), such as taxes, fines, duties, and fees.
Reopening (PDO-2)—The offer for sale of additional amounts of outstanding issues, rather than an entirely new issue. A reopened issue will always have the same maturity date, CUSIP-number, and interest rate as the original issue.
Special drawing rights (“Exchange Stabilization Fund,” IFS-1)—International assets created by IMF that serve to increase international liquidity and provide additional international reserves. SDRs may be purchased and sold among eligible holders through IMF. (See IMF.)
SDR allocations are the counterpart to SDRs issued by IMF based on members’ quotas in IMF. Although shown in Exchange Stabilization Fund (ESF) statements as liabilities,

GLOSSARY
December 2009
118
they must be redeemed by ESF only in the event of liquidation of, or U.S. withdrawal from, the SDR department of IMF or cancellation of SDRs.
SDR certificates are issued to the Federal Reserve System against SDRs when SDRs are legalized as money. Proceeds of monetization are deposited into an ESF account at the Federal Reserve Bank of New York.
Spot (“Foreign Currency Positions”)—Due for receipt or delivery within 2 workdays.
State and local government series (SLGS) (FD-2)—Special nonmarketable certificates, notes, and bonds offered to State and local governments as a means to invest proceeds from their own tax-exempt financing. Interest rates and maturities comply with IRS arbitrage provisions. SLGS are offered in both time deposit and demand deposit forms. Time deposit certificates have maturities of up to 1 year. Notes mature in 1 to 10 years and bonds mature in more than 10 years. Demand deposit securities are 1-day certificates rolled over with a rate adjustment daily.
Statutory debt limit (FD-6)—By Act of Congress there is a limit, either temporary or permanent, on the amount of public debt that may be outstanding. When this limit is reached, Treasury may not sell new debt issues until Congress
increases or extends the limit. For a detailed listing of changes in the limit since 1941, see the Budget of the United States Government. (See debt outstanding subject to limitation.)
STRIPS (PDO-2)—Separate Trading of Registered Interest and Principal Securities. Long-term notes and bonds may be divided into principal and interest-paying components, which may be transferred and sold in amounts as small as $1,000. STRIPS are sold at auction at a minimum par amount, varying for each issue. The amount is an arithmetic function of the issue’s interest rate.
Treasury bills—The shortest term Federal security (maturity dates normally varying from 3 to 12 months), are sold at a discount.
Trust fund transaction (“Federal Fiscal Operations”)—An intrabudgetary transaction in which both payments and receipts occur within the same trust fund group.
United States—Includes the 50 States, District of Columbia, Commonwealth of Puerto Rico, American Samoa, Midway Island, Virgin Islands, Wake Island, and all other territories and possessions.
U.S. notes (USCC)—Legal tender notes of five different issues: 1862 ($5-$1,000 notes); 1862 ($1-$2 notes); 1863 ($5-$1,000 notes); 1863 ($1-$10,000 notes); and 1901 ($10 notes).

Personal name (Please type or print)
Company name
Street address
City, State, Zip code
Daytime phone including area code
❑ Check payable to Superintendent of Documents
❑ SOD Deposit Account
❑ ViSA ❑ MasterCard ❑ Discover/NOVUS ❑ American Express
(expiration date)
AUTHORIZING SIGNATURE 10/07
Thank you for your order!
Check Method of Payment:
Order Processing Code: 3509 Easy Secure Internet:bookstore.gpo.gov
Toll Free: 866 512–1800DC Area: 202 512–1800Fax: 202 512–2104
Mail: U.S. Government Printing Office PO Box 979050 St. Louis, MO 63197–9000
PUBLICATION AND SUBSCRIPTIONORDER FORM
Qty Stock Number Publication Title Price Total Price
Qty List ID Title Price Total Price
Prices include regular domestic postage and handling and are subject to change.International customers please add 40%
Publications
SubscriptionTotal for Publications
Total for Publications
Total Cost of Order
Please return order form with payment
Thank you for your interest in U.S. Government Information. ALL SALES ARE FINAL.
Fax or e-mail