Embed Size (px)
Citation preview
Bulletin 62
Effect of Detergent-Laden Water on the Growth of Corn Wybe Kroontje Jesse N. Judy Hermann C. H. Hahne

·-· ·_. : .. : ,i.;~ ·~: ~ :.~ ~ .. . = . ' .. '
~ .. :~ . .. ~
V ·IRGINIA P·OL YTL~CH NIC IN STITU TE A !~- ~-:~ TE
UN I J::~S ITY
L I B ·. /\RIES . :~ i;~ .. : ~ _____________ _,~?· .. ::; -~ ~ .·
d I : :. .. -:st ;,~ :\.C ~ 4 ·~
(. . -~-.. • ..... JI> •: •• ~ •. . ~ ~ ~ r:.)
;°. . . • f. / . -- . ,., .-. . .. ~·.
Bulletin 62 August 1973
Effect of Detergent-Laden Water
on the Growth of Corn
Wybe Kroontje Professor
Jesse N. Judy Graduate Research Assistant
Hermann C. H. Hahne Graduate Research Assistant
Department of Agronomy Virginia Polytechnic Institute and State University
Blacksburg, Virginia
The work upon which this publication is based was supported by funds provided by the United States Department of the Interior, Office of Water Resources Research, as authorized under the Water Resources Research Act of 1964.
OWRR Project A-041-VA VPl-WRRC-BULL 62
A publication of Virginia Water Resources Research Center
Virginia Polytechnic Institute and State University Blacksburg, Virginia 24061

-, j)
201 V5 7 hO .. GZ
(_ . 2-
PREFACE
Increased use of synthetic detergents during the past two decades has
compounded the disposal problems caused by sewage sludges and effluents.
Possibilities of utilizing sewage sludges as fertilizer and soil conditioners or
sewage effluents as irrigation water caused concern about pollution that
detergent ingredients may introduce. This applies especially to the inorganic
ingredients since biodegradable organic components are broken down by conventional secondary waste treatment processes. With this in mind, an investigation was initiated to study the effects of detergents on corn seedling
growth. The main objectives were to determine the tolerance level of corn
with regard to levels of detergent application on a wide variety of soils. An
effort was made to identify the inorganic components of detergents
responsible for major detrimental effects on the growth of the plants.
iii

TABLE OF CONTENTS
Abstract
Introduction ................... 3
Materials and Methods . . . . . . . . . . . . . . . . 5
Greenhouse Experiment 5 Laboratory Analyses 6 Statistica l Analyses 7
Results and Discussion ............ 9
Visu al Observations of Plant Growth Plant Yield as Influenced by Detergents Concentrations of Inorganic Components in the
Detergents and Their Effects on Plant Growth Effects of Detergents on Soil pH . . . . .
Correlati on Analysis for Relationships Between Plant Yield and Selected Variables . . . .
Summary and Conclusions
Literature Cited
Appendix
v
9 9
. 11
. 18
. 18
.21
.23
.27
LIST OF..FIGURES
1. Sketch of a Leaf Constriction .... 10
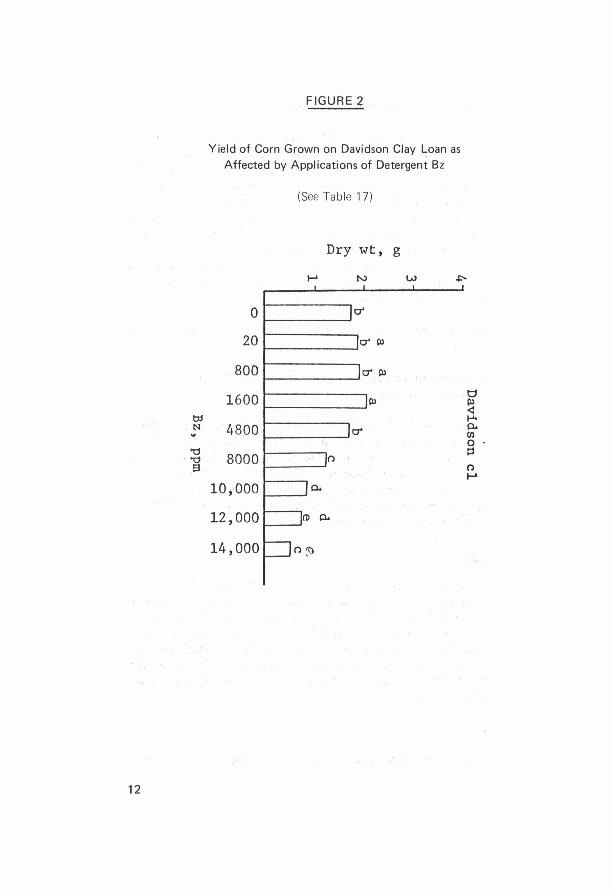
2. Yield of Corn Grown on Davidson Clay Loam as Affected by Applications of Detergent Bz . 12
3. Yield of Corn Grown on the Davidson Clay Loam as Affected by Applications of Detergent Tz . . 13
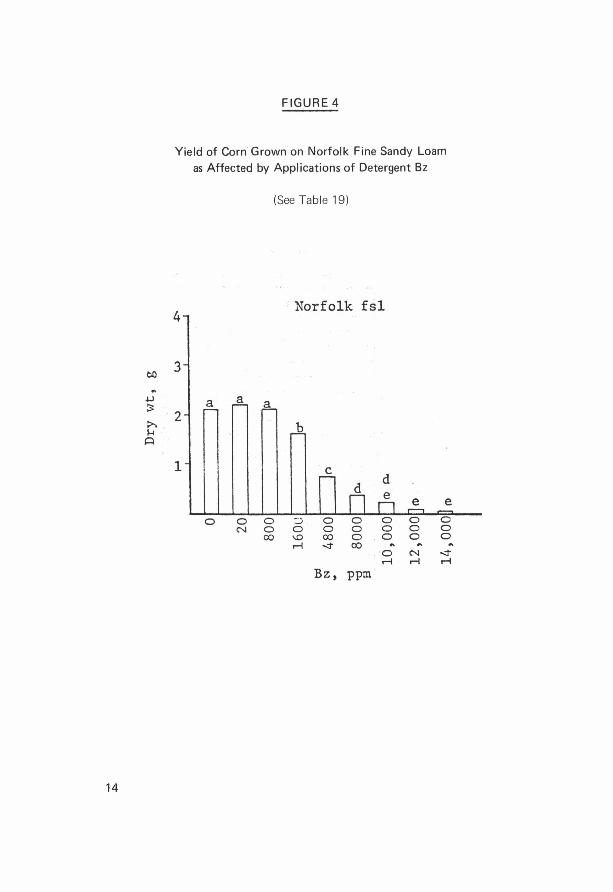
4. Yield of Corn Grown on Norfolk Fine Sandy Loam as Affected by Applications of Detergent Bz . . . . . . . . . 14
5. Yield of Corn Grown on Norfolk Fine Sandy Loam as Affected by Applications of Detergent Tx . . . . . . . . . 15
vi
LIST OF TABLES
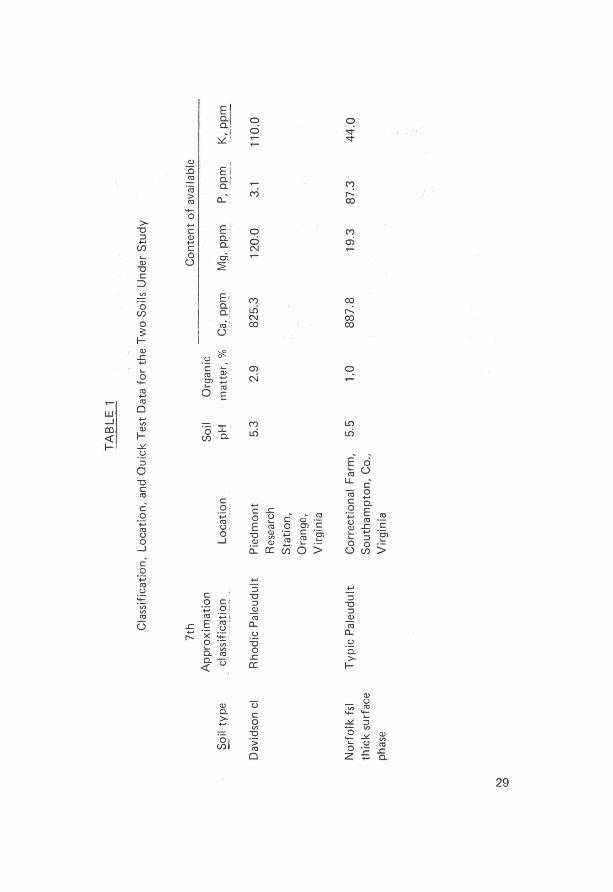
1. Classification, Location, and Quick Test Data for the Two
Soils Under Study . . . . . . . . . . .
2. Detergent Applied to the Soils Studied
3. Corn Seedling Emergence Compared to Detergent
Concentration
4. Concentration of Some Elements in the Two Detergents
5. Phosphorus Concentration in Corn Grown on Davidson Clay
Loam as Affected by Levels of Detergent in lrigation
.29
.30
.31
.32
Water .... 33
6. Phosphorus Concentration in Corn Grown on Norfolk Fine
Sandy Loam as Affected by Levels of Detergent in Irrigation Water
7. Boron Concentration of the Various Detergent Solutions
8. Boron Concentration of Corn Grown on Two Soils as Afected
.34
.35
by Level of Detergent in Irrigation Water ... 36
9. Electrical Conductivity of the Saturation Extracts of Two
Soils as Affected by Levels of Detergent in lrgiation
10.
Water
Exchangeable Sodium Percentage in Saturation Extracts of Two
Soils as Affected by Levels of Detergents in lrigation
Water . . . . . . . . . . . . . .
11. The pH of the Detergent Solutions Under Study
12. Soil pH of Davidson Clay Loam and Norfolk Fine Sandy Loam
as Afected by Levels of Detergent in Irrigation
.. 37
.38
.39
Water . . . . . . . . . . . . . . ..... 40
13. Multiple and Partial Correlation Analyses Between Yield of Corn on the Davidson Clay Loam Treated with Bz and Selected Independent Variables . . . . . . . . . . . .41
vii
14. Multiple and Partial Correlation Analyses Between Yield
of Corn on the Davidson Clay Loam Treated with Detergent
Tx and Selected Variables . . . . . . . . . . . . . .42
15. Multiple and Partial Correlation Analyses Between Yield
of Corn on the Norfolk Fine Sandy Loam Treated with
Detergent Bz and Selected Variables
16. Multiple and Partial Correlation Analyses Between Yield
of Corn on the Norfolk Fine Sandy Loam Treated with
Detergent and Selected Variables . . . . . . . .
. . . .. 43
.... 44
17. Yield of Corn Grown on Davidson Clay Loam as Affected
by Applications of Detergent Bz . . . . . . . . . . . . . 45
18. Yield of Corn Grown on Davidson Clay Loam as Affected
by Aplications of Detergent Tx .... 46
19. Yield of Corn Grown on Norfolk Fine Sandy Loam as
Affected by Applications of Detergent Bz ..... 47
20. Yield of Corn Grown on Norfolk Fine Sandy Loam as
Affected by Applications of Detergent Tx . . . . .48
21. Height of Corn Grown on Two Soils as Affected by
Detergent Applications . . . . . . . . . . . . .49
22. Fresh Weight of Corn Grown on Two Soils as
Affected by Detergent Applications . . . . . . . . . . . . 50
viii
ABSTRACT
A greenhouse experiment was conducted to determine the effects of two detergents on the growth of corn (Zea mays L.) when the detergent was individually applied to Davidson clay loam and Norfolk fine sandy loam. The detergents used were a heavy-duty non-enzyme detergent (Bz) and a heavy-duty enzyme detergent (Tx). These were applied in irrigation water at concentrations of 0, 20, 800, 1600, 4800, 8000, 10,000, 12,000, and 14,000 ppm.
Stimulations in growth occurred on the Davidson soil that received 1600 ppm Bz and 800, 1600, 4800, and 8000 ppm Tx, and on the Norfolk soil that received 800 ppm Tx. These stimulations were attributed to responses to phosphorus contained in the detergents.
Abnormal growth characteristics were observed on many treatments, and yield decreases were noted on the Davidson soil that received 8000, 10,000, 12,000, and 14,000 ppm Bz and 14,000 ppm Tx. Regression analyses showed that the detrimental effects on plant yields were due to soluble salt damages caused by the sodium in the detergents on all treatments except where Tx was applied to the Norfolk soil. In the latter case, specific sodium effects could not be separated from general salinity effects. Detergent Bz was more detrimental to plant growth than Tx. Plants grown on the Davidson soil were more tolerant to detergent applications than those grown on the Norfolk soil, probably because of the larger cation exchange capacity and higher magnesium content of the Davidson soil.

INTRODUCTION
The use of synthetic household detergents has increased greatly during the past 30 years, from 30 million pounds in 1940 to 5 billion pounds in 1966 (5). There has also been growing interest in the use of soils as a disposal medium for domestic sewage (6, 16). Some concern has arisen regarding pollution by detergents or detergent components when contained in sewage sludges that may be used as fertilizers or soil conditioners, or in effluent waters that may be used for irrigation. Evidence of this concern has been apparent in Europe where the addition of sodium perborate and borax to detergents has been restricted. Th is action was necessary because the boron salts remained in effluent water and adversely affected crops when this water was used for irrigation (7).
Because only biodegradable organic constituents are broken down by conventional secondary waste treatment processes, the inorganic detergent
components remain in sewage sludges or effluents. Detrimental effects on plant growth might become evident if these materials are applied to soils as a means of disposal or if they are discharged to surface waters that are used for irrigation. Very little research has been done to investigate the effects of complete synthetic household laundry detergent formulations on plant growth. Therefore, the objectives of this investigation were as follows:
1. To ascertain the effects of various concentrations of two detergents on the growth of corn.
2. To determine the response different soils display with respect to the amount of detergent applied and the occurrence of any beneficial or detrimental effects of plant growth.
3. To identify the inorganic components present in detergents that might be responsible for beneficial or detrimental effects on plant growth.
3

MATERIALS AND METHODS
A greenhouse experiment was conducted to determine the effect of detergent applications on the growth of corn (Zea mays L.). Two soils, a Davidson clay
loam and a Norfolk fine sandy loam, were selected for the investigation.
Selection of the two soils was based on their agricultural importance in Virginia and their differences in physical and chemical properties. Two detergents, a heavy-duty enzyme detergent (Tx) and a heavy-duty non
enzyme detergent (Bz), were chosen for the investigation. These detergents
were chosen because of their extensive usage and difference in enzyme content.
I. Greenhouse Experiment
In the greenhouse experiment surface soi I material was used, 0- to 15- cm
layer of a Davidson clay loam and a thick surface phase of a Norfolk fine
sandy loam (Table 1). Each soil was air dried, sieved through a four-mesh
stainless steel screen, and mixed. A subsample of each soil was sent to the Virginia Tech Soil Testing Laboratory for pH, organic matter, and available
Ca, K, Mg, and P determinations by quick test procedures (23). These results
(Table 1) were used in conjunction with Lime Use Guides ( 11, 12) to
estimate the quantity of dolomitic limestone required to attain a soil pH of approximately 6.5 and with Soil Fertility Guides (10, 13) to evaluate the
level of P and K applications required for the greenhouse study.
Amounts of lime applied per 2.268 kg soil were 4.6 and 6.8 gm dolomitic
limestone for the Davidson clay loam and the Norfolk fine sandy loam,
respectively. All pots received an application of 1.8 gm of a 16-8-8 commercial fertilizer. The amended soils were mixed for one minute in a twin-shell blender and placed in plastic lined pots. Applications of 1.8 gm of 16-8-8 fertilizer supplied 288 mg N, 63 mg P, and 120 mg K. Six kernels of Pioneer 3369A seed corn were planted in each pot at a depth of approximately 2.5 cm and the day after planting treatments were initiated by watering with the various detergent solutions.
Treatments consisted of applications of distilled water containing, 0, 20, 800,
1600, 4800, 8000, 10,000, 12,000, and 14,000 ppm of either Tx or Bz. The concentrations of detergents included 20 ppm because concentrations of this magnitude are normally found in raw sewage (3); 1600 ppm because it is the magnitude normally found in automatic washers; and 8000 ppm because a preliminary observation indicated a retard~tion of plant growth at this
5
concentration. The other concentrations were arbitrarily chosen to obtain
additional reference points. The pots for each soil were arranged in a
randomized complete block design with four replications.
The initial application was used to bring the soil moisture content to field
capacity and amounted to 710 ml on the Davidson -clay loam and 350 ml on the Norfolk fine sandy loam. Thereafter, the pots were maintained at field capacity by daily additions of the respective solutions. The total amount of detergent applied with each treatment during the experiment is presented in
Table 2.
Visual observations on growth characteristics were maintained throughout the experiment. Plants were thinned to four seedlings per pot when they were
approximately 2.5 cm tall and were harvested at soil level after a growth
period of twenty days. The relatively short growth period was necessary
because plants receiving higher concentrations of detergent were beginning to
die and therefore, to have continued the experiment would have only resulted in a decrease in harvestable tissue. At harvest time fresh weights and plant
heights were measured and the plants· in each pot were described. The soil in
each pot was air-dried, thoroughly mixed, and stored in plastic bags.
11. Laboratory Analyses
Plant tissue samples from each pot were dried at 70°C for 48 hours, weighed,
and ground to pass a 40-mesh screen in preparation for B and P analyses. The B concentration of sub-samples of ground tissue was determined by the
curcumin colorimetric procedure as modified by Mulford and Martens (20).
The phosphorus concentration was determined in the following manner: A 0.5-gm sub-sample was ashed at 450°C for 2.5 hours and the ash was dissolved in 100 ml 0.3N HN03. Phosphorus in a 10-ml aliquot of the acidic sample was then determined by the molybdovanadophosphoric acid procedure (17).
The pH of the soil samples from each pot of the greenhouse study was determined by the method reported by Peech (22). The electrical conductivity (EC) of saturation extracts of these samples was determined by the method devised by the United States Soil Salinity Laboratory Staff (25). The Na, Ca, and Mg concentrations in saturation extracts of the soil samples were determined by atomic absorption spectrophotometry.
6
The exchangeable sodium percentage (ESP) was computed by the following equation:
ESP = 100 (-0.0126 + 0.01475x)
1 + (-0.0126 + 0.01475x)
where x equals the sodium adsorption ratio. The sodium adsorption ratio (SAR) was calculated from the relationship
SAR= Na+/[ (Ca+++ Mg ++)/2] %
where Na, Ca, and Mg are expressed in milliequivalents per liter (25).
Samples of the two detergents were sent to St. Louis Testing Laboratories, Inc., for As, B, Ca, K, Mg, Na, and P analyses. This laboratory was chosen because of their experience with detergent analyses.
Ill. Statistical Analyses
Data on plant growth, yield, soil, and plant tissue analyses were subjected to an analysis of variance and the Duncan's Multiple Range Test (9). Relationships between corn yield and B concentration in plant tissue, sojl pH, EC of saturation extracts, and ESP of the soils were investigated by partial and multiple correlation and regression analyses using the BMD03R computer program (8).
7

RESULTS AND DISCUSSION
I. Visual Observation of Plant Growth
Delays in seedling emergence were observed on both soils treated with higher levels of detergent (Table 3). Seedling emergence on the control and lower rates of application began five days after planting. Seedling emergence was delayed until the eighth day after planting on the Davidson clay loam which received solutions containing 14,000 ppm Tx and on the Norfolk fine sandy loam that received solutions containing 10,000, 12,000, and 14,000 ppm Bz and 8000, 10,000, 12,000, and 14,000 ppm Tx.
The coleoptiles of seedlings emerging on the sixth and seventh day after planting has a yell ow or whitish-yellow tint. Seven days after planting, leaf expansion began on treatments that received solutions containing less than 4800 ppm detergent, but where solutions containing 4800 ppm detergent or more were applied, the seedlings began to bend up to 90°, resulting in growth parallel to the soil surface. Nine days after planting some of the bent plants began to straighten, but there seemed to be some injury as evidenced by chlorotic tips and necrotic areas on the leaves.
Another abnormal growth characteristic, leaf constrictions, developed by the eleventh day. These leaf constrictions, illustrated in Figure 1, appeared in one case on a treatment as low as 1600 ppm detergent. With time, tissue within the constricted areas became chlorotic, later translucent, and finally necrotic. It was evident by the eleventh day that plants on treatments that received high concentrations of the detergents were stunted and deformed.
By the twelfth day many of the plants had a generally mottled appearance and were also developing interveinal chlorosis. Some of the mottled plants appeared very healthy otherwise. The eighteenth day after planting, some tip dieback was evident, and there seemed to be a recurrence of the bending. However, the bending was not as severe as that observed on the seventh day.
11. Plant Yield as Influenced by Detergents
The effect of detergent applications on the yield of corn grown on the two soils is shown in Figure 2. Application of solutions containing 1600 ppm Bz or 800, 1600, 4800, or 8000 ppm Tx increased yield on the Davidson clay loam, the maximum yield being attained at the 1600 ppm Tx rate. The only increase in yield on the Norfolk fine sandy loam occurred where solutions
9
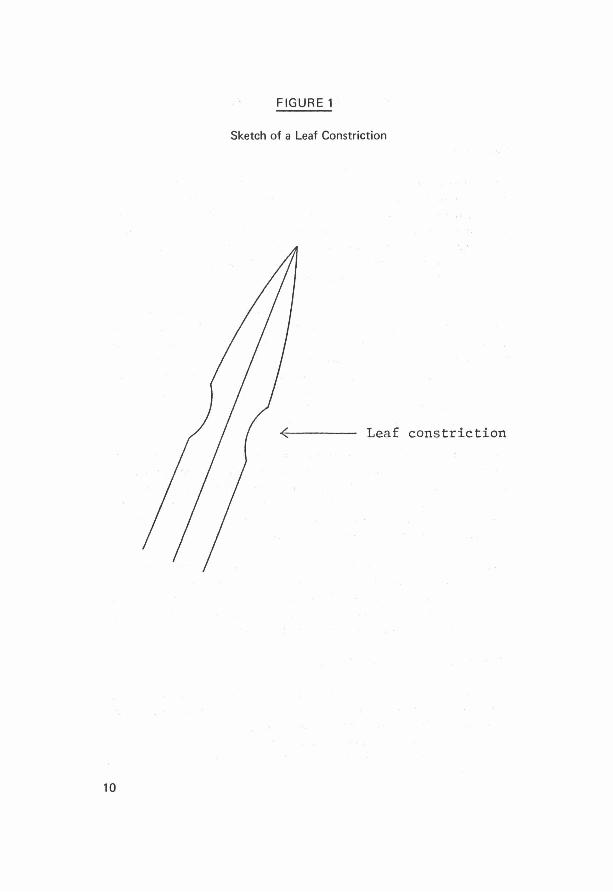
FIGURE 1
Sketch of a Leaf Constriction
Leaf constriction
10
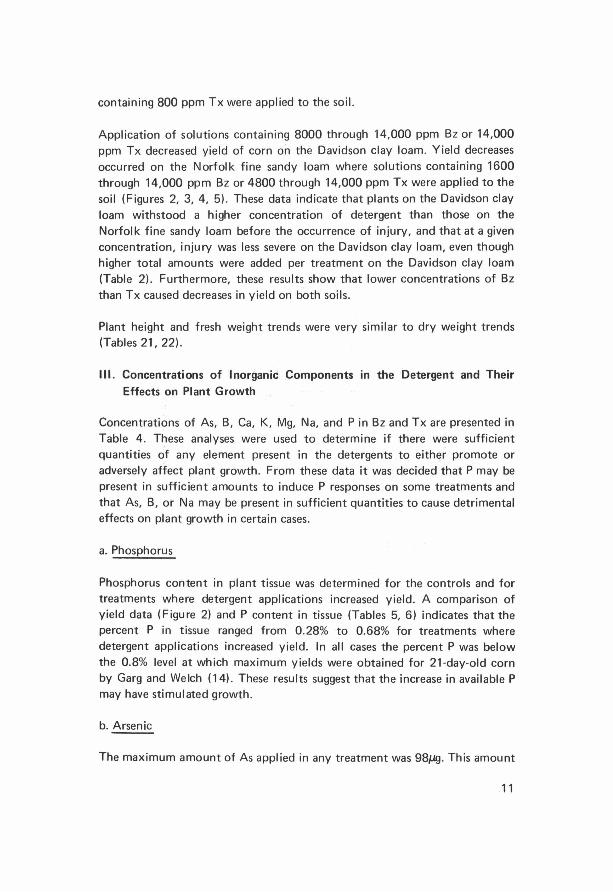
containing 800 ppm Tx were applied to the soil.
Application of solutions containing 8000 through 14,000 ppm Bz or 14,000 ppm Tx decreased yield of corn on the Davidson clay loam. Yield decreases
occurred on the Norfolk fine sandy loam where solutions containing 1600 through 14,000 ppm Bz or 4800 through 14,000 ppm Tx were applied to the soil (Figures 2, 3, 4, 5). These data indicate that plants on the Davidson clay
loam withstood a higher concentration of detergent than those on the Norfolk fine sandy loam before the occurrence of injury, and that at a given concentration, injury was less severe on the Davidson clay loam, even though higher total amounts were added per treatment on the Davidson clay loam (Table 2). Furthermore, these results show that lower concentrations of Bz than Tx caused decreases in yield on both soils.
Plant height and fresh weight trends were very similar to dry weight trends (Tables 21, 22).
Ill. Concentrations of Inorganic Components in the Detergent and Their
Effects on Plant Growth
Concentrations of As, B, Ca, K, Mg, Na, and P in Bz and Tx are presented in
Table 4. These analyses were used to determine if there were sufficient quantities of any element present in the detergents to either promote or adversely affect plant growth. From these data it was decided that P may be present in sufficient amounts to induce P responses on some treatments and that As, B, or Na may be present in sufficient quantities to cause detrimental effects on plant growth in certain cases.
a. Phosphorus
Phosphorus content in plant tissue was determined for the controls and for treatments where detergent applications increased yield. A comparison of yield data (Figure 2) and P content in tissue (Tables 5, 6) indicates that the percent P in tissue ranged from 0.28% to 0.68% for treatments where detergent applications increased yield. In all cases the percent P was below the 0.8% level at which maximum yields were obtained for 21-day-old corn
by Garg and Welch (14). These results suggest that the increase in available P may have stimulated growth.
b. Arsenic
The maximum amount of As applied in any treatment was 98µg. This amount
11
tp N ..
"O . 'O
s
12
FIGURE2
Yield of Corn Grown on Davidson Clay ~oan as Affected by Applications of Detergent Bz
(See Table 17)
Dry wt, g
~ N w
0 O"
20 O" Pl
800 O" Pl
1600 Pl
4800 O"
8000 n
10,000 ~
12,000 (l) ~
14,000 n (C)
t:j
~ ~ ~ en O· :::3
n t-'
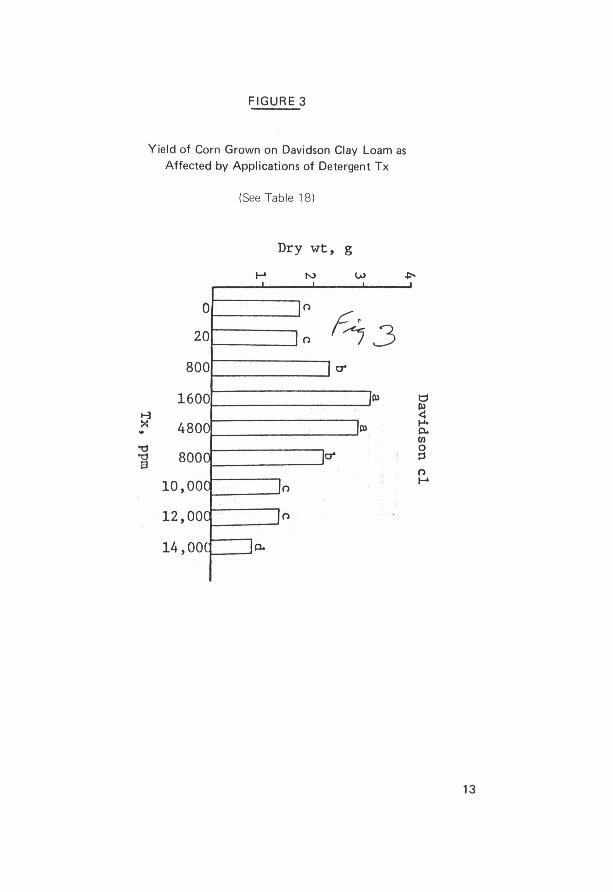
FIGURE 3
Yield of Corn Grown on Davidson Clay Loam as
Affected by Applications of Detergent Tx
(See Table 18 )
Dry wt, g
~ N w
0 n
r~.3 20 n
800 r::T
1600 ~
~ x 4800 ~ .. "d "'d 800 r::T s
10,00 n
n
0.
t1
~ t-Jo 0. (I)
0 ~
n ~
13
bO
.u ;3:
>.. ,.....
0
14
FIGURE 4
Yield of Corn Grown on Norfolk Fine Sandy Loam as Affected by Applications of Detergent Bz
(See Table 19)
4 Norfolk f sl
3
a a a 2
b
1 c d
d e
0 0 0 ::.; 0 0 0 0 0 N 0 0 0 0 0 0 0
00 \0 00 0 0 0 0 M ...:r 00 .. ... ...
0 N ...:r M M M
Bz, ppm
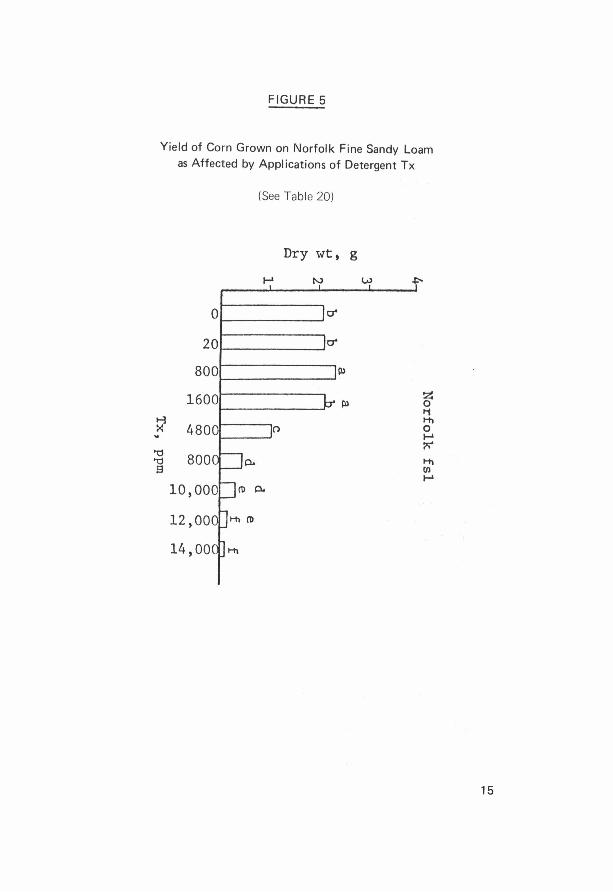
FIGURE 5
Yield of Corn Grown on Norfolk Fine Sandy Loam as Affected by Applications of Detergent Tx
(See Table 20)
Dry wt, g
N
0
20
800
1600 1-3 >< 4800 .. n
-0 800 -0 0.. s 10,000
14,00
15
was applied to the Davidson soil in the 14,000 ppm Bz solution and would be sufficient to increase the As concentration of the soils by approximately 0.043 ppm. An increase ·of this magnitude seems to be negligible when compared to results obtained by Small and Mccants (24) which .show that As concentrations in soils were not increased by the use of arsenical insecticides in tobacco production. In addition, Williams and Whetstone [as cited by Liebig ( 18)] found As concentrations of 0.3 to 38.0 ppm in virgin and cropped soils. Of these soils 30% contained 5 ppm As or less, 50% ranged from 5 to 10 ppm, and 20% contained more than 10 ppm. Under the aerobic conditions of this study, the As added in detergents would remain in the less toxic pentavalent form rather than the· trivalent form ( 15). These reports emphasize the irrelevance of a maxim.um increase of 0.043 ppm As in the soil.
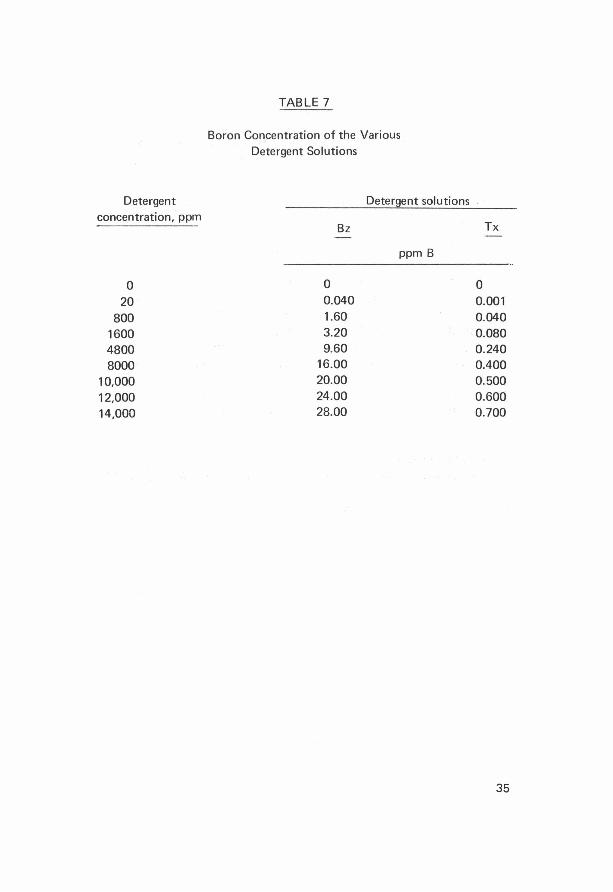
c. Boron
The concentrations of 8 in the various detergent solutions were calculated on the basis ·of the detergent analyses (Table 4) . and are presented in Table 7. Since the 8 concentrations of some of the detergent solutions were greater than the 1 to 2 ppm tolerance level in irrigation water used for corn production (1 ), B toxicity may be expected at the higher rates of applications.
The highest H concentration in tissue, 133.2 ppm', occurred where the solution containing 12,000 ppm Bz were applied to the Norfolk soil (Table 8). Martens* reported a higher B concentration in 5-week-old corn tissue of the
same variety as used herein without yield decreases: Allison .(2) concluded that in leaves normally associated with the development of B toxicity, concentrations of B are greater than 250 ppm. Oertli and Kohl (21) found that B concentrations in green, chlorotic, and necrotic leaf areas of young corn showing B toxicity were in the range of 360 to 790, 490 to 1160, and 1220 to 12,860 ppm, respectively. It seems reasonable to conclude from the B concentrations in plant tissue (Table 8) and the research cited above that B toxicity was not responsible for decreases · in corn yield due to detergent applications.
d. Sodium
The Na concentration in Bz was 21.0% and in Tx was 21.5% (Table 4) which gives a concentration range of 0 to 2800 ppm Na in the solutions used. Applications of detergent solutions with relatively high Na concentrations
*Personal communication: David C. Martens, Agronomy Department, Virginia Polytechnic Institute and State University.
16
will increase the Na content of the soil with the subsequent increase in EC and ESP.
A comparison of the EC data (Table 9) and the yield data (Figure 2) shows that decreases in yield were initiated at EC values of 7. 7 mm hos/cm and 8.5 mmhos/cm on the Davidson Bz and Tx treatments, ·respectively. The corresponding EC values for the Norfolk Bz and Tx treatments are 8.3 mmhos/cm and 10.1 mmhos/cm, respectively. These results correspond to earlier findings on effect of EC on yields (2, 25) and therefore, indicate that an increase in EC, mainly caused by Na in the detergents, may have contributed significantly to the reduction in tissue yields.
Detergent applications increased the ESP on the Davidson clay loam to a maximum of 35.0% and on the Norfolk fine sandy loam to a maximum of 60.7% (Table 10).
Rhoades* reported that Na toxicity occurs in young sweet corn at an ESP of approximately 25%. He also ·indicated that this ESP level refers only to the direct toxic effect of sodium on corn growth in the absence of adverse physical properties of soil and if an ESP of this level or lower causes structural breakdown of the soil, then this problem will supersede that of Na toxicity per se. ·However, Allison (1) shows that on a Pachappa loam with an ESP of 15%, the yield of Golden Bantam corn was reduced by 50%. Lunt (19), who reviewed relationships between ESP and plant growth, states that deterioration of soil physical properties becomes increasingly pronounced as the ESP exceeds 10 to 20% and mentions that Na injury occurs at lower ESP's in the greenhouse than in the field. By comparing the ESP (Table 10) and the yield data (Figure 2), it can be seen that decreases· in yield were first observed on the Davidson Bz and Tx treatments at ESP values of 18.1 and 35 percent, respectively. On the Norfolk soil decrease in yield was first obtained at ESP value of 9.4% where 1600 ppm Bz was applied. On the Tx treatments, an ESP value of 23.5% caused the first yield decrease at the 4800 ppm rate.
The results (Tables 9 and 10) when compared to yield data (Figure 2) indiq1te that EC and ESP values may both l;le responsible for the decrease i·n plant tissue yield. Since the EC and ESP are both highly dependent on the Na component in the detergents, separation of their individual effects becomes a necessity as shown in the section dealing with multiple regressions.
*Personal communication : James D. Rhoades, Soil Scientist, U.S. Salinity Labo
ratory, Riverside, California
17
IV. Effect of Detergents on Soil pH
The pH levels of the detergent solutions under study were determined, and it was found that the pH levels of all solutions, except the 20 ppm Bz and Tx solutions, ranged from 9.0 to 9. 7 (Table 11 ). The pH of the soil in each treatment was measured to determine if applications o·f detergent solutions increased the soil pH to detrimental levels. Soil pH varied from a low of 5.8 on the Norfolk soil that received solutions containing 800 ppm Bz to a high of 7.2 on the Norfolk soil that received solutions containing 14,000 ppm Tx, a difference of 1.4 units (Table 12). Epperson and Hawkins (.12) reported that the most favorable pH range for corn is 6·.1 through 7.3 and that corn may grow fairly well to normal in the pH range of 5.6 through 6.0. Hence, it was concluded that the application of detergent solutions did not increase the soil pH to levels that were detrimental to corn.
V. Correlation Analyses for Relationships Between Plant Yield and Selected Variables
Evidence reported in previous sections indicates that changes in B availability and soil pH due to detergent applications were not responsible for decreases in yield, but that the increases in soluble salts (resulting mainly from Na contained in the detergents) caused the decreases in yield. Multiple and partial correlation analyses were conducted to support these conclusions. The dependent variable in these analyses was yield, and the independent variables were B concentrations in plant tissue, soil pH, EC of saturation extracts, and ESP. For each analysis, those treatments were deleted which received lower detergent concentrations than the treatment on which maximum yields were measured. This procedure was followed to avoid confounding effects over the range where yields increased due to detergent applications.
The coefficients of multiple correlation between yield and the four independent variables ranged from 0.908 to 0.969 where solutions of the two detergents were applied to the Davidson and Norfolk soils (Tables 13, 14, 15, and 16). The determination coefficients show that the four variables accounted for 82.4 to 93.8 percent of the variation in yield. When the independent variables, B concentration in plant tissue and soil pH, were deleted from the analyses, and yield was correlated with EC of saturation extracts and ESP, 81.9 to 93.6 percent of the variation in yield was explained. This $light loss of dependent variation and the non-significance of the partial correlations coefficients for B and pH in plant tissue substantiate previous conclusions that the B addition and pH change due to detergent applications had no adverse effects on plant growth.
18
The coefficients of multiple correlation ranged from 0.905 to 0.968 where yield was correlated with the independent variables, EC of saturation extracts,· and ESP, omitting B and pH. The non-significance of the coefficients of partial correlation for EC of saturation extracts shows that only ESP contributed to the correlation where Bz and Tx were applied to the Davidson clay loam and where Bz was applied to the Norfolk fine sandy loam (Tables 13, 14, and 15). The coefficients of partial correlation for EC were significant only for the Tx treatments on the Norfolk soil (Table 16) where the salinity effects could not be separated from the ESP effects.
The partial correlation coefficients suggest that the exchangeable Na added to the soils by the detergents was mainly responsible for the reduction in the vegetative growth of the corn plants. When the EC and ESP values (Tables 9 and 10) are related to the plant tissue yields (Figure 3), it would seem that the EC values should give the best indicator for detrimental effects since all treatments with EC values above 7.5 mmhos showed reduction in plant growth, whereas the corresponding ESP valu'es varied between 9.4 and 35.0 percent. However, as shown, the partial correlation coefficients indicate that the ESP is the main contributor towards reduction in plant growth. The reason is that the EC is in itself a dependent variable of exchangeable Na added and hence, dependent on the ESP. Bower, ~ ~ (4) reported a similar situation between effects of pH and exchangeable Na on yields of sugar beets.
Unfortunately, no definite explanation could be formulated as to why detrimental effects on plant growth were obtained at widely different ESP values over the various treatments (Table 10) . The difference observed between soils may be explained by the difference in cation exchange capacity (CEC) and Mg content in these soils (Table 1 ). On the Norfolk soil, which has a lower CEC and less Mg as compared to the Davidson soil, Na additions will induce Mg deficiency at a lower Na level. The difference in ESP values between the two detergent treatments cannot be explained since the actual structural components of the detergents are not known. A possible factor may be a differential ability for sequestering Ca and Mg thereby differentially inducing Ca and Mg deficiency; however, there is no proof that this is the case.
19

SUMMARY AND CONCLUSIONS
A greenhouse experiment was conducted to determine the effect of
detergents contained in irrigation water on the growth of corn (Zea mays L.)
on a Davidson clay loam and a Norfolk fine sandy loam. The soils were maintained at approximately field capacity with solutions containing various concentrations of either a heavy-duty non-enzyme laundry detergent (Bz) or a heavy-duty enzyme detergent (Tx). The detergent concentrations used were 0, 20, 800, 1600, 4800, 8000, 10,000, 12,000, and 14,000 ppm.
Yield increases were observed on the Davidson clay loam on treatments that received 800, 1600, 4800, and 8000 ppm Tx and 1600 ppm Bz. The only yield increase which was observed on the Norfolk fine sandy loam occurred on the 800 ppm Tx treatment. These yield increases · were attributed to an increase in P availability from the P contained in the detergents.
Abnormal growth characteristics such as plant bending, the development of leaf constrictions, interveinal chlorsis, mottling, and tip dieback were
observed in corn on many treatments. .Yield decreases occurred on the Davidson clay loam on treatments that received 8000, 10,000, 12,000, and 14,000 ppm Bz and 14,000 ppm Tx. Yield decreases on the Norfolk fi _ne sandy loam were obtained with treatments of 1600, 4800, 8000, 10,000, 12,000, and 14,000 ppm Bz and 4800, 8000, 10,000, 12,000, and 14,000 ppm Tx. Corn yields were compared with soil pH; EC of soil saturation extracts, ESP of the soils, and B concentrations in plant tissue to determine the factor responsible for yield decreases: Based on these comparisons, it was concluded that the Na content of the detergents was mainly responsible for the decrease ·in yield on all treatments except where Tx was applied to the Norfolk fine sandy loam. In the latter case, the general saltnity effects as measured by EC could not be separated from specific Na effects as measured by ESP.
Plants withstood higher concentrations of detergents on the Davidson clay loam than on the Norfolk fine sandy loam. The severity of plant injury was less on the Davidson clay loam, probably because of its larger cation exchange capacity and higher Mg content. Detergent Bz was more detrimental with respect to plant yield than Tx. This effect could not be explained on the basis of soil pH, EC of saturation extracts, ESP of the soils, B concentration in plant tissue or the inorganic composition of the detergents. Possible factors that may have to be considered are differential ability between detergents for sequestering Ca and Mg, and the availability of phosphates which will be related to the structural compositions of the detergents.
21

LITERATURE CITED
1. Allison, L. E. 1956. Soil and Plant Responses ·to VAMA and HPAN Soil Conditioners in the Presence of High-exchangeable Sodium. Soil Sci. Soc. Amer. Proc. 20:147-151.
2. Allison, L. E. 1964. Salinity in Relation to Irrigation. Advance. Agron. 16:139-180.
3. Anonymous. 1969. Detergent Enzymes: Biodegradation and Environmental Acceptability. B ioScience 19: 1093-1094.
4. Bower, C. A., C. D. Moddie, P. Orth, and F. B. Gschwend. 1954. Correlation of Sugar Beet Yields with Chemical Properties of a Saline-alkali Soil. Soil Sci. 77:443-451.
5. Brenner, T. E. 1969. Biodegradable Detergents and Water Pollution . .!.!!_ Advances in Environmental Sciences, p. 14 7-196. John Wiley and Sons, New York, N. Y. Vol. 1.
6. Conn, Richard. 1970. Liquid Sludge as a· Farm Fertilizer. Crops and Soils 22:12-13.
7. Davidson, A., and B. M. Milwidsky. 1967. Synthetic Detergents. 4th ed., p. 1-65. Leonard Hill Books., Strand, London, England.
8. Dixon, W. J. (ed.) 1971. BMD, Biomedical Computer Programs, Univ. of Calif. Publications in Automatic Computation. 2nd ed., p. 258-275c. Univ. of Calif. Press at Berkely and Los Angeles, California.
9. Duncan, D. B. 1955. Multiple Range and Multiple F Tests. Biometrics 11: 1-42.
10. Epperson, G. R., and G. W. Hawkins. 1966. Soil Fertility Guides for the Coastal Plains Region of Virginia. Virginia Polytechnic Institute Ext.
Div. Bull . 297.
11. Epperson, G. R ., and G. W. Hawkins. 1968. Lime Use Guides for the Coastal Plains Region of Virginia. Virginia Polytechnic Institute Ext.
Div. Pub. 106.
23
12. Epperson, G. R., and G. W. Hawkins. 1968. Lime Use Guides for the Piedmont Plains Region of Virginia. Virginia Polytechnic Institute Ext.
Div. Pub. 108.
13. Epper.son, G. R., G. W. Hawkins, and G.D. McCart. 1971 . Soil Fertility Guides for the Piedmont Region of Virginia. Virginia Polytechnic Institute and State Univ. Ext. Div. Pub. 429.
14. Garg, K. P., and L. F. Welch. 1967. Growth and Phosphorus Uptake by Corn as Influenced by Phosphorus Placement. Agron. J. 59: 152-154.
15. Harris, A J., K. J. Roberts, and A. E. Christie. 1971. Effects of Detergents on Water Supplies. J. AWWA 63:795-799.
16. Hinsley, T. B., and S. So~ewitz. 1969. Digested Sludge Disposal on Crop Land. J. WPCA 41: 822-830.
17. Kitson, R. E., and M. G. Mellon. 1964. Colorimetric Determination of Phosphorus as Molybdivanadophosphoric Acid. Ind. Eng. Chem. (Anal. Ed.) 16:379-383.
18. Liebig, G. F ., Jr. 1966. Arsenic. In Diagnostic Criteria for Plants and
Soils. Homer D. Chapman (ed.) p. 13-23. Univ. of Calif., Division of Agricultural Sciences.
19. Lunt, 0. R. 1966. Sodiµm. ~Diagnostic Criteria for Plants and Soils. Homer D. Chapman (ed.) p. 409-432. Univ. of Calif., Division of Agricultural Sciences.
20. Mulford, F. R., and D. C. Martens. 1970. A Simple Procedure for Drying Solutions for Boron Determinations by the Curcumin Method. Soil Sci. Soc. Amer. Proc. 34: 155-156.
21. Oertli, J. J., and H. C. Kohl. 1961. Some Considerations About the Tolerance of Various Plant Species to Excessive Supplies of Boron. Soil Sci. 99:243-247.
22. Peech, M. 1965. Hydrogen-ion Activity . ..!.!:!. Methods of Soil Analysis:
24
Chemical and Microbiological Properties. C. A. Black (ed.) Amer. Soc. Agron., · Madison, Wisconsin.

23. Rich, C. I. 1955. Rapid Soil Testing Procedures at Virginia Polytechnic Institute. Virginia Agr. Exp. Sta. Bull. 475:1 -8.
24. Small, H. G., Jr., and C. B. McCants. 1962. Residual Arsenic in Soils and Concentration in Tobacco. Tobacco Sci. 6:34-36.
25. United States Salinity Laboratory Staff. 1954. USDA Agr. Handbook No. 60. L.A. Richards (ed.) p. 1-160.
25


APPENDIX
27

N c.o
Soi!
_!'(
P~
Dav
idso
n cl
No
rfo
lk f
sl
thic
k su
rfac
e ph
ase
TA
BL
E 1
Cla
ssifi
catio
n, L
oca
tion
, an
d Q
uic
k T
est
Dat
a fo
r th
e T
wo
Soi
ls U
nd
er
Stu
dy
7th
C
on
ten
t o
f av
aila
ble
Ap
pro
xim
ati
on
S
oil
Org
anic
cl
assi
ficat
ion
Lo
catio
n
.. --
-------
--· -
-pH
m
att
er,
%
Ca!E
PT.
Mg
,_pP~
. _P
~_ppm
IS.~
PP~
Rho
die
Pa
leu
du
lt P
ied
mo
nt
5.3
2.9
82
5.3
1
20
.0
3.1
11
0.0
R
esea
rch
Sta
tion
, O
rang
e,
Vir
gin
ia
Typ
ic P
ale
ud
ult
Co
rre
ctio
na
l F
arm
, 5.
5 1
.0
88
7.8
1
9.3
8
7.3
4
4.0
S
ou
tha
mp
ton
, C
o.,
Vir
gin
ia
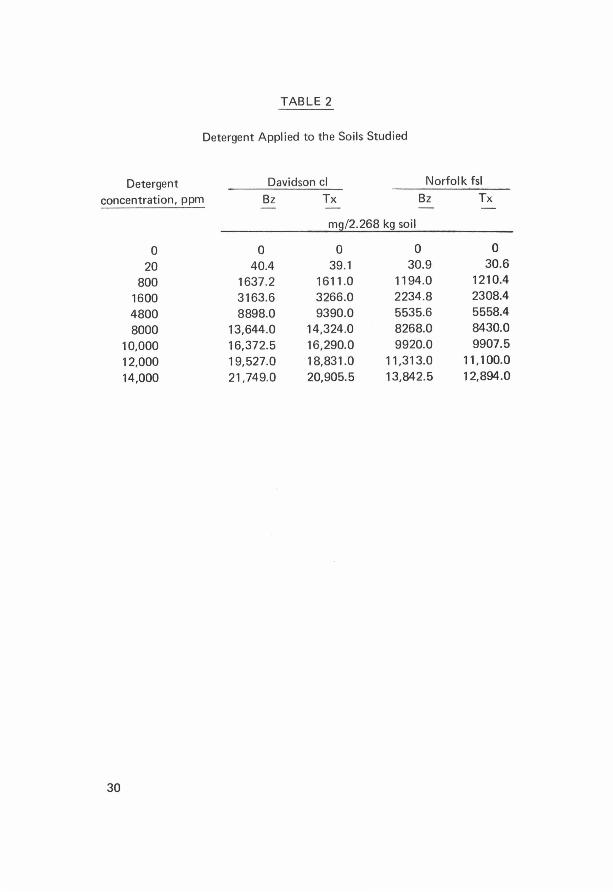
TABLE 2
Detergent Applied to the Soils Studied
Detergent Davidson cl Norfolk fsl
concentration, ppm Bz Tx Bz Tx
m9/2.268 kg soil
0 0 0 0 0
20 40.4 39.1 30.9 30.6
800 1637.2 1611.0 1194.0 1210.4
1600 3163.6 3266.0 2234.8 2308.4
4800 8898.0 9390.0 5535.6 5558.4
8000 13,644.0 14,324.0 8268.0 8430.0
10,000 16,372.5 16,290.0 9920.0 9907.5
12,000 19,527.0 18,831.0 11,313.0 11, 100.0
14,000 21,749.0 20,905.5 13,842.5 12,894.0
30
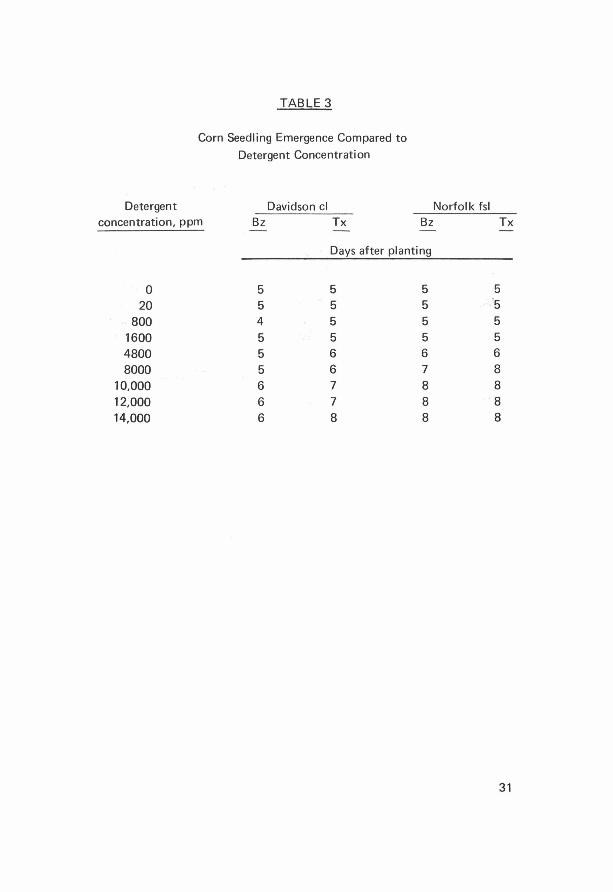
TABLE 3
Corn Seedling Emergence Compared to
Detergent Concentration
Detergent concentration, ppm
Davidson cl Bz Tx
Norfolk fsl Bz Tx
Days after planting
0 5 5 5 5 20 5 5 5 5
800 4 5 5 5 1600 5 5 5 5 4800 5 6 6 6 8000 5 6 7 8
10,000 6 7 8 8 12,000 6 7 8 8 14,000 6 8 8 8
31
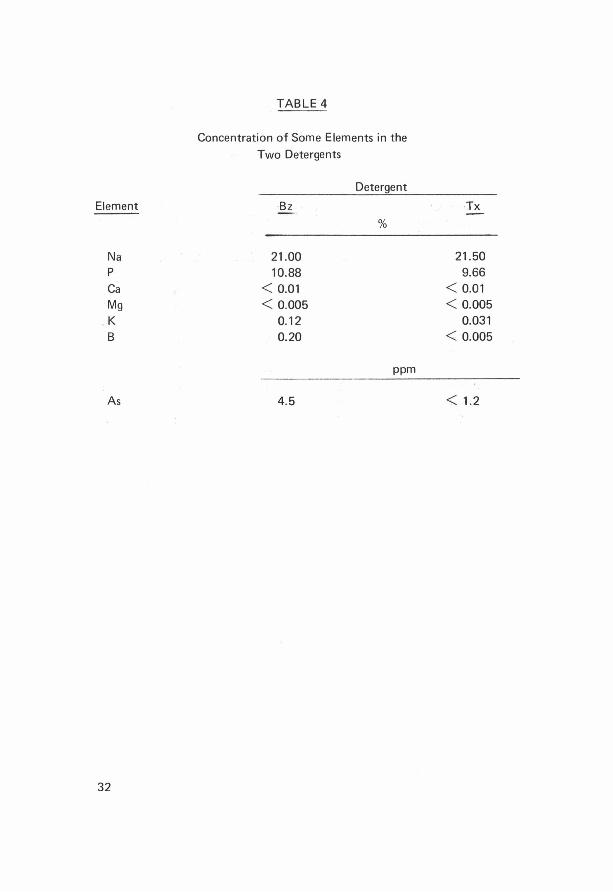
TABLE 4
Concentration of Some Elements in the Two Detergents
Detergent
Element Bz Tx
%
Na 21.00 21.50 p 10.88 9.66 Ca < 0.01 < 0.01 Mg < 0.005 < 0.005 K 0.12 0.031 8 0.20 < 0.005
ppm
As 4.5 < 1.2
32
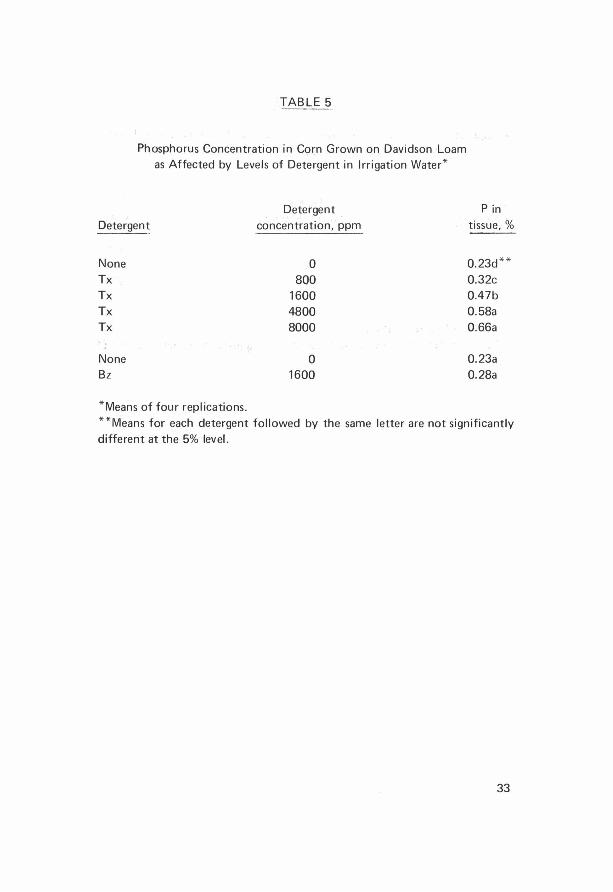
TABLE 5
Phosphorus Concentration in Corn Grown on Davidson Loam as Affected by Levels of Detergent in Irrigation Water *
Detergent
Detergen! concentration, ppm
None 0 Tx 800 Tx 1600 Tx 4800 Tx 8000
None 0 Bz 1600
*Means of four replications.
P in tissue,%
0.23d * *
0.32c 0.47b 0.58a 0.66a
0.23a 0.28a
* * Means for each detergent followed by the same letter are not significantly different at the 5% level.
33
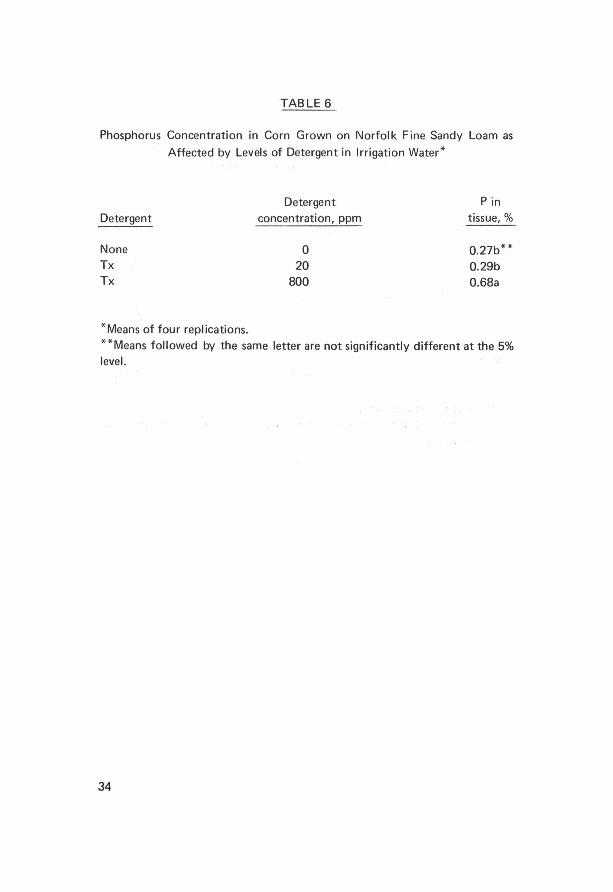
TABLE 6
Phosphorus Concentration in Corn Grown on Norfolk Fine Sandy Loam as
Affected by Levels of Detergent in Irrigation Water*
Detergent Pin
Detergent concentration, ppm tissue,%
None 0 0.27b** Tx 20 0.29b Tx 800 0.68a
*Means of four replications.
**Means followed by the same letter are not significantly different at the 5% level.
34
Detergent concentration, ppm
0 20
800 1600 4800 8000
10,000 12,000 14,000
TABLE 7
Boron Concentration of the Various Detergent Solutions
Detergent solutions
Bz
ppm B
0 0.040 1.60 3.20 9.60
16.00 20.00 24.00 28.00
Tx
0 0.001 0.040 0.080 0.240 0.400 0.500 0.600 0.700
35
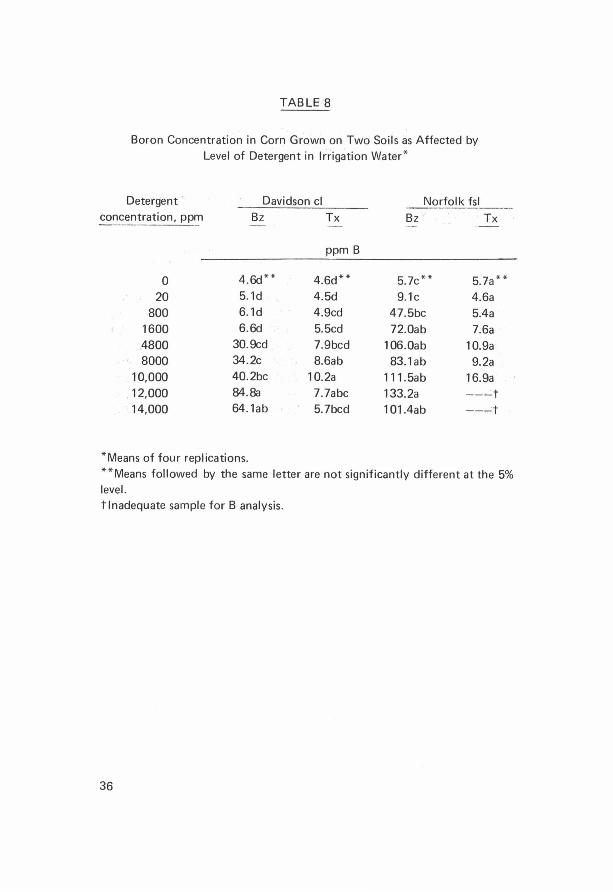
TABLE 8
Boron Concentration in Corn Grown on Two Soils as Affected by Level of Detergent in Irrigation Water*
Detergent · Davidson cl Norfolk fsl concentration, ppm Bz Tx Bz · Tx
ppm B
0 4.6d** 4.6d** 5.7c** 5.7a** 20 5.1d 4.5d 9.1c 4.6a
800 6.1d 4.9cd 47.5bc 5.4a 1600 6.6d 5.5cd 72.0ab 7.6a 4800 30.9cd 7.9bcd 106.0ab 10.9a 8000 34.2c 8.6ab 83.1ab 9.2a
10,000 40.2bc 10.2a 111.5ab 16.9a . 12,000 84.Ba 7.7abc 133.2a --~t
14,000 64. lab 5.7bcd 101.4ab __ _;t
*Means of four replications. **Means followed by the same letter are not significantly different at the 5% level. t Inadequate sample for B analysis.
36
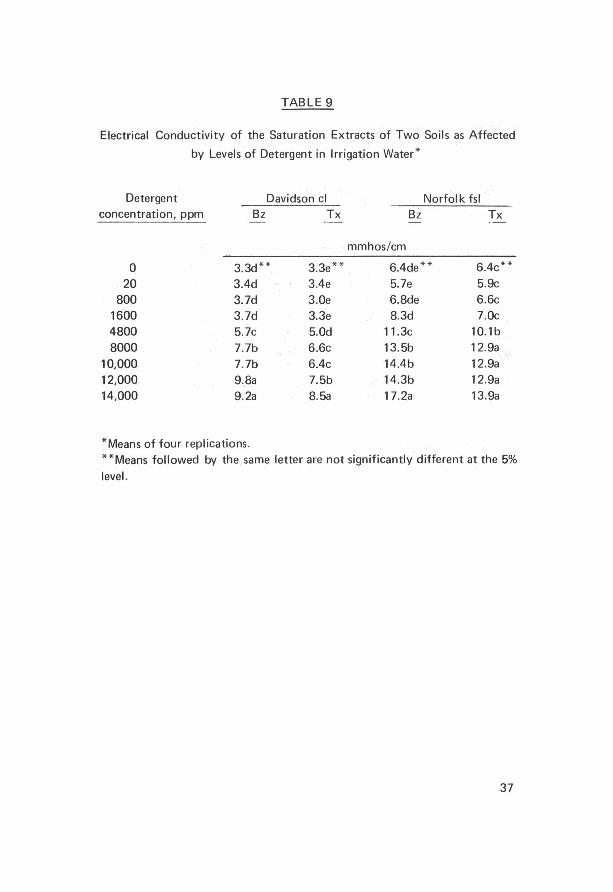
TABLE 9
Electrical Conductivity of the Saturation Extracts of Two Soils as Affected
by Levels of Detergent in Irrigation Water *
Detergent concentration, ppm
0 20
800 1600 4800 8000 .
10,000 12,000 14,000
Davidson cl Bz Tx
3.3d* * 3.3e* * 3.4d 3.4e 3.7d 3.0e 3.7d 3.3e 5.7c 5.0d 7.7b 6.6c 7.7b 6.4c 9.8a 7.5b 9.2a 8.5a
*Means of four replications.
Norfolk fsl Bz Tx
mmhos/cm
6.4de ** 6.4c**
5.7e 5.9c 6.8de 6.6c 8.3d 7.0c
11.3c 10.1b 13.5b 12.9a 14.4b 12.9a 14.3b 12.9a 17.2a 13.9a
**Means followed by the same letter are not significantly different at the 5%
level.
37
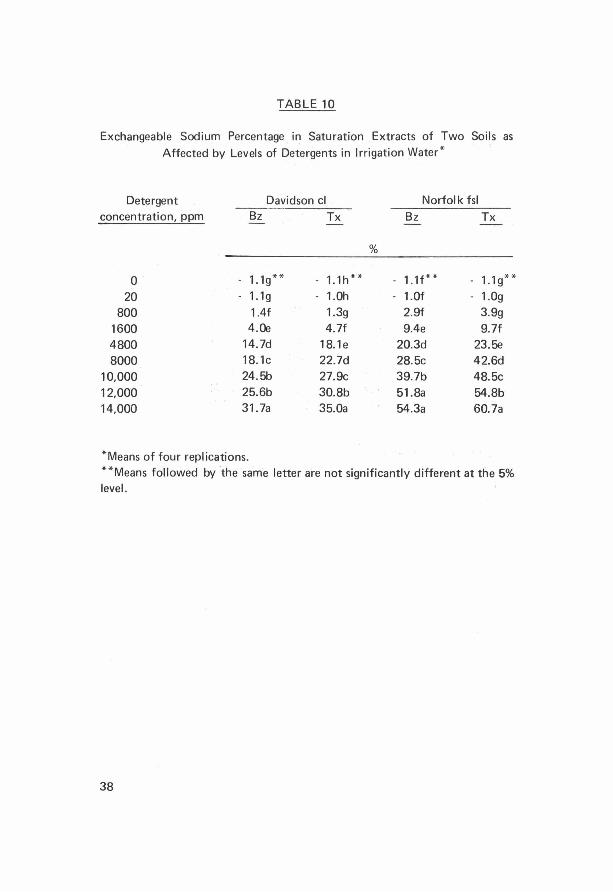
TABLE 10
Exchangeable Sodium Percentage in Saturation Extracts of Two Soils as Affected by Levels of Detergents in Irrigation Water*
Detergent Davidson cl Norfolk fsl concentration, ppm Bz Tx Bz Tx
%
0 - 1.1g** - 1.1h** - 1.1f* * - 1.1g**
20 - 1.1g - 1.0h - 1.0f - 1.0g 800 1.4f 1.3g 2.9f 3.9g
1600 4.0e 4.7f 9.4e 9.7f 4800 14.7d 18.1e 20.3d 23.5e 8000 18.1c 22.7d 28.5c 42.6d
10,000 24.5b 27.9c 39.7b 48.5c 12,000 25.6b 30.8b 51.8a 54.8b 14,000 31.7a 35.0a 54.3a 60.7a
*Means of four replications. **Means followed by the same letter are not significantly different at the 5% level.
38
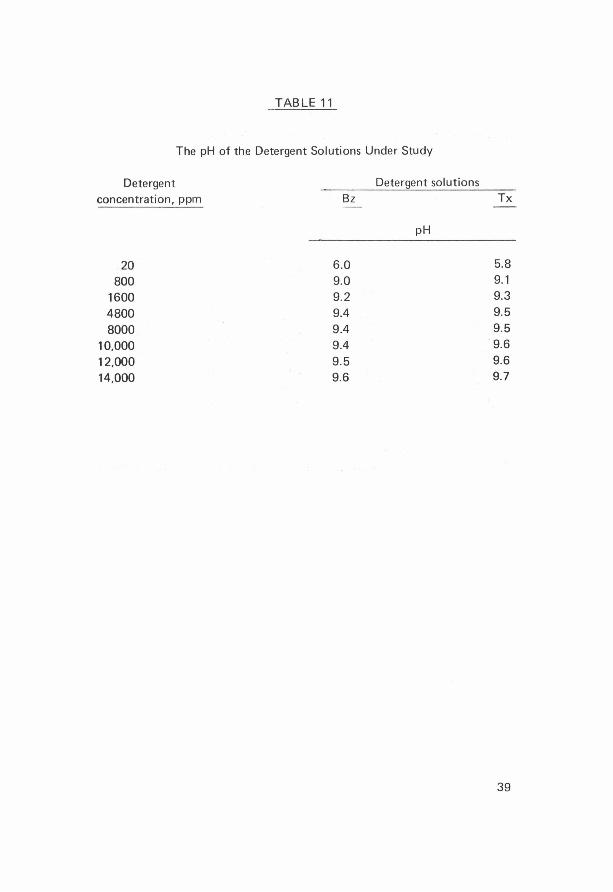
TABLE 11
The pH of the Detergent Solutions Under Study
Detergent concentration, ppm
20 800
1600 4800 8000
10,000 12,000 14,000
Detergent solutions Bz
pH
6.0 9.0 9.2 9.4 9.4 9.4 9.5 9.6
Tx
5.8 9.1 9.3 9.5 9.5 9.6 9.6 9.7
39
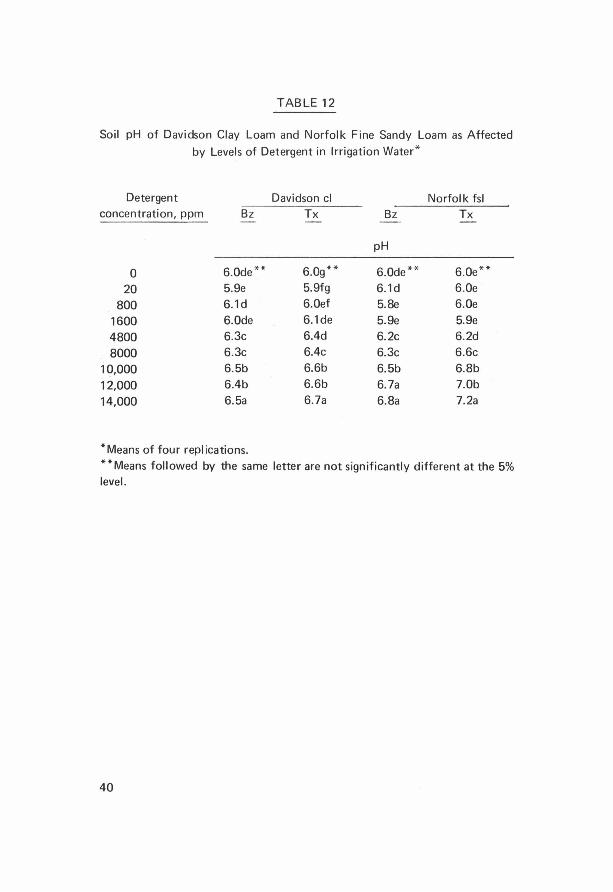
TABLE 12
Soil pH of Davidson Clay Loam and Norfolk Fine Sandy Loam as Affected by Levels of Detergent in Irrigation Water*
Davidson cl Detergent concentration, ppm Bz Tx
0 6.0de ** 6.0g **
20 5.9e 5.9fg
800 6. ld 6.0ef
1600 6.0de 6.lde
4800 6.3c 6.4d
8000 6.3c 6.4c
10,000 6.5b 6.6b
12,000 6.4b 6.6b
14,000 6.5a 6.7a
*Means of four replications.
Norfolk fsl Bz Tx
pH
6.0de** 6.0e** 6. ld 6.0e 5.8e 6.0e 5.9e 5.9e 6.2c 6.2d 6.3c 6.6c 6.5b 6.8b 6.7a 7.0b 6.8a 7.2a
**Means followed by the same letter are not significantly different at the 5% level.
40
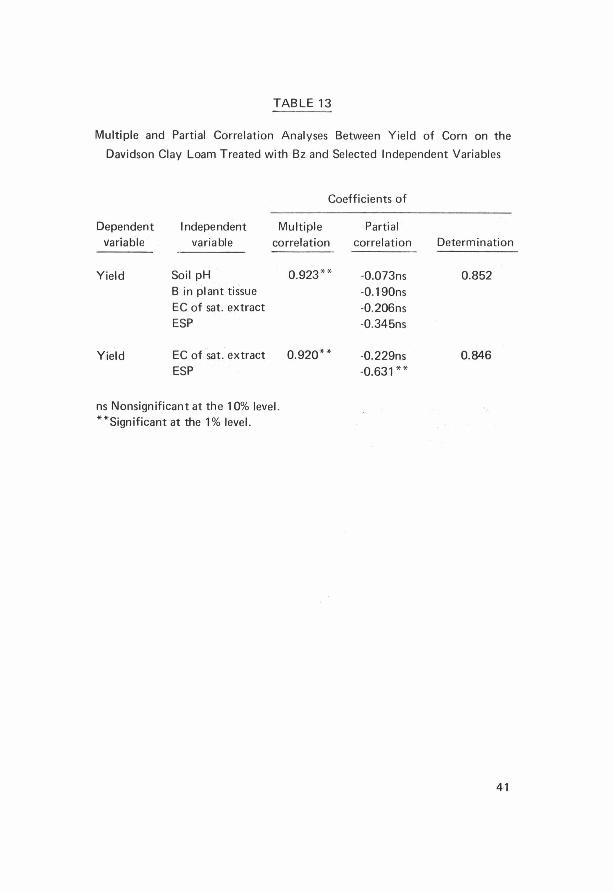
TABLE13
Multiple and Partial Correlation Analyses Between Yield of Corn on the
Davidson Clay Loam Treated with Bz and Selected Independent Variables
Coefficients of
Dependent Independent Multiple variable variable correlation
Yield Soil pH 0.923**
B in plant tissue EC of sat. extract ESP
Yield EC of sat. extract 0.920**
ESP
ns Nonsignificant at the 10% level. **Significant at the 1% level.
Partial correlation
-0.073ns -0.190ns
-0.206ns -0.345ns
-0.229ns -0.631 **
Determination
0.852
0.846
4·1
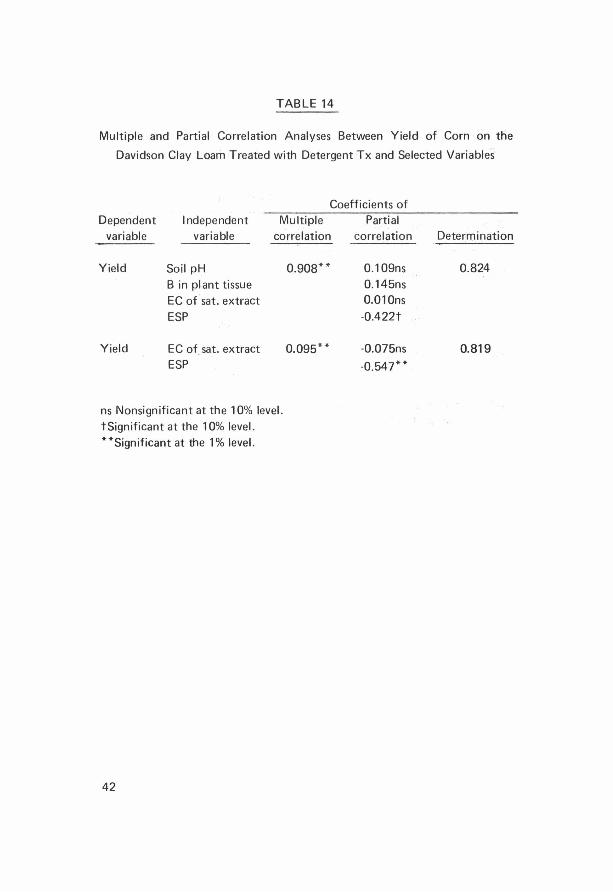
TABLE14
Multiple and Partial Correlation Analyses Between Yield of Corn on the
Davidson Clay Loam Treated with Detergent Tx and Selected Variables
Coefficients of Dependent Independent
variable variable Multiple
correlation
Yield Soil pH
Yield
B in pl ant tissue
EC of sat. extract ESP
EC of_ sat. extract ESP
ns Nonsignificant at the 10% level.
tSignificant at the 10% level. **Significant at the 1% level.
42
0.908**
0.095**
Partial correlation
0.109ns 0.145ns 0.010ns
-0.422t
-0.075ns
-0.547**
Determination
0.824
0.819
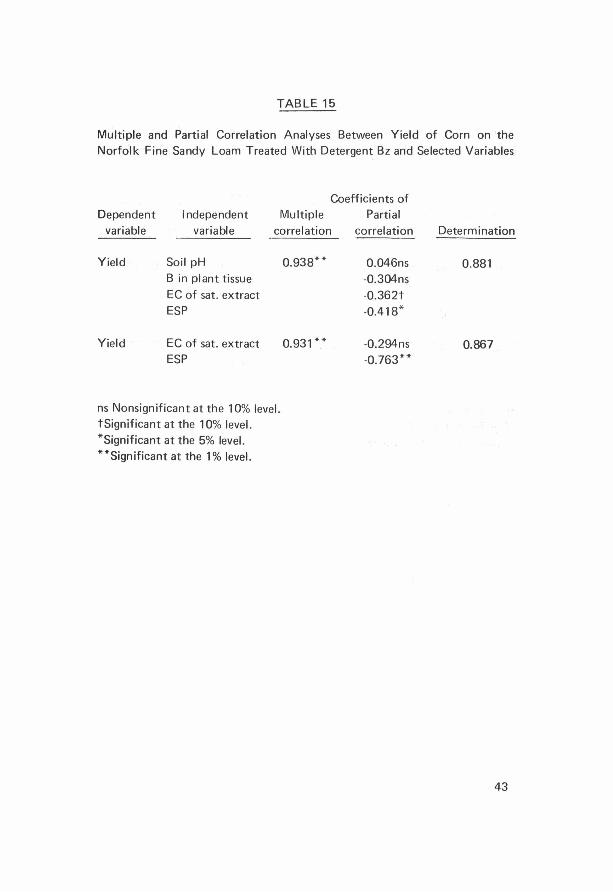
TABLE 15
Multiple and Partial Correlation Analyses Between Yield of Corn on the Norfolk Fine Sandy Loam Treated With Detergent Bz and Selected Variables
Coefficients of Dependent Independent Multiple Partial
variable variable correlation correlat1on
Yield Soil pH
Yield
B in plant tissue
EC of sat. extract ESP
EC of sat. extract ESP
ns Nonsignificant at the 10% level. tSignificant at the 10% level. *Significant at the 5% level. **Significant at the 1 % level.
0.938**
0.931 **
0.046ns -0.304ns -0.362t -0.418*
-0.294ns -0. 763**
Determination
0.881
0.867
43
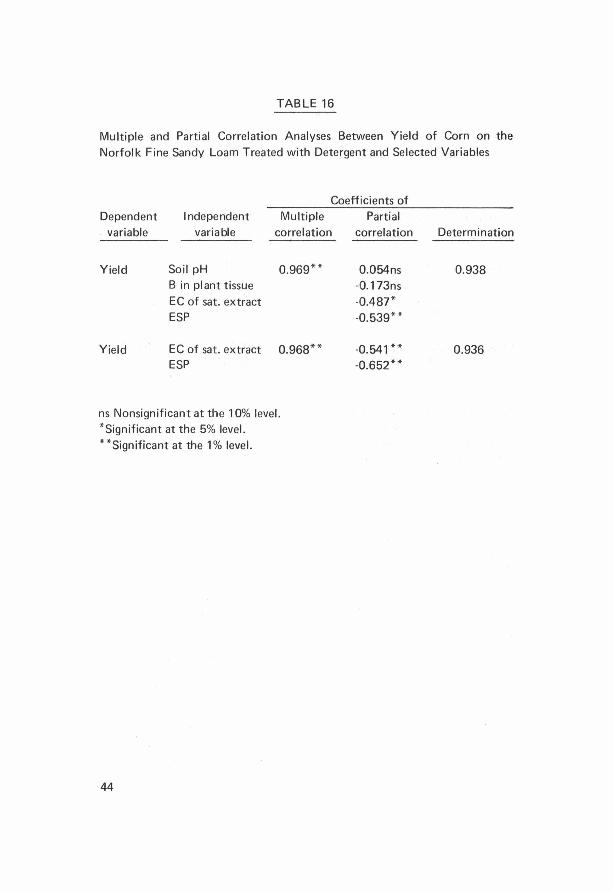
TABLE16
Multiple and Partial Correlation Analyses Between Yield of Corn on the Norfolk Fine Sandy Loam Treated with Detergent and Selected Variables
Coefficients of Dependent
variable
Independent variable
Multiple Partial correlation
Yield Soil pH 0.969** B in plant tissue
EC of sat. extract ESP
Yield EC of sat. extract 0.968** ESP
ns Nonsignificant at the 10% level. *Significant at the 5% level. **Significant at the 1 % level.
44
correlation
0.054ns -0.173ns -0.487* -0.539**
-0.541** -0.652**
Determination
0.938
0.936
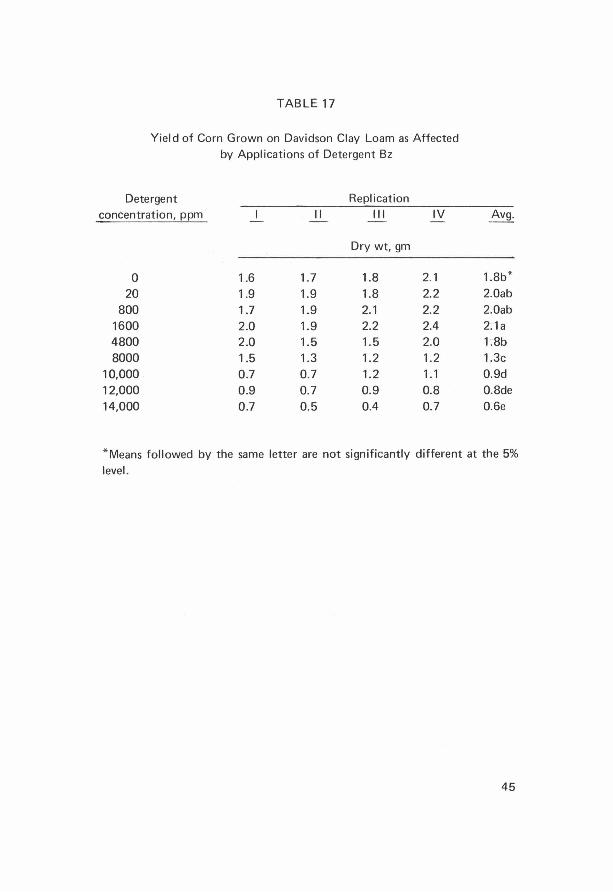
TABLE17
Viel d of Corn Grown on Davidson Clay Loam as Affected by Applications of Detergent Bz
Detergent Replication concentration, ppm 11 111 IV Avg.
Dry wt, gm
0 1.6 1.7 1.8 2.1 1.8b* 20 1.9 1.9 1.8 2.2 2.0ab
800 1.7 1.9 2.1 2.2 2.0ab 1600 2.0 1.9 2.2 2.4 2: 1a 4800 2.0 1.5 1.5 2.0 1.8b 8000 1.5 1.3 1.2 1.2 1.3c
10,000 0.7 0.7 1.2 1.1 0.9d 12,000 0.9 0.7 0.9 0.8 0.8de 14,000 0.7 0.5 0.4 0.7 0.6e
*Means followed by the same letter are not significantly different at the 5% level.
45
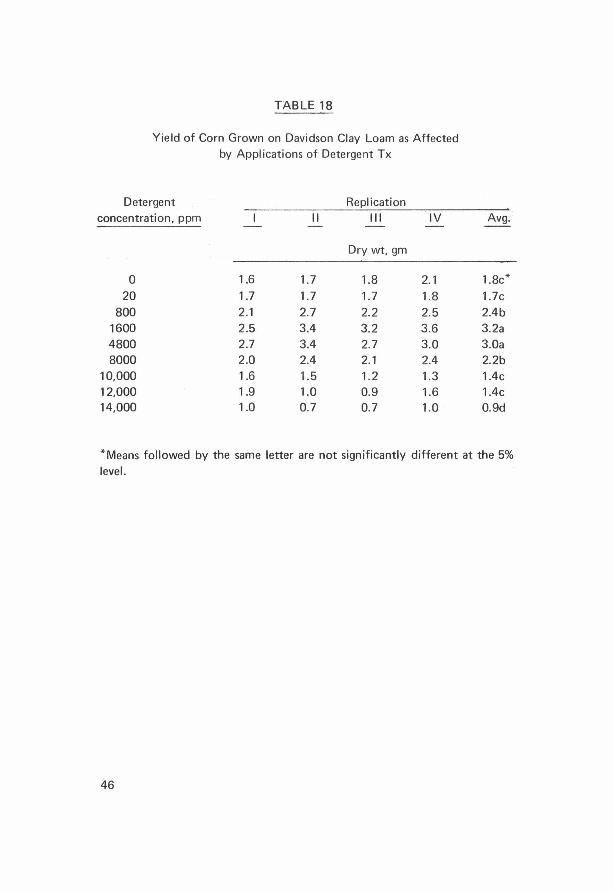
TABLE18
Yield of Corn Grown on Davidson Clay Loam as Affected by Appl.ications of Detergent Tx
Detergent Replication concentration, ppm II Ill IV Avg.
Dry wt, gm
0 1.6 1.7 1.8 2.1 1.8c* 20 1.7 1.7 1.7 1.8 1.7c
800 2.1 2.7 2.2 2.5 2.4b 1600 2.5 3.4 3.2 3.6 3.2a 4800 2.7 3.4 2.7 3.0 3.0a 8000 2.0 2.4 2.1 2.4 2.2b
10,000 1.6 1.5 1.2 1.3 1.4c 12,000 1.9 1.0 0.9 1.6 1.4c 14,000 1.0 0.7 0.7 1.0 0.9d
*Means followed by the same letter are not significantly different at the 5% level.
46
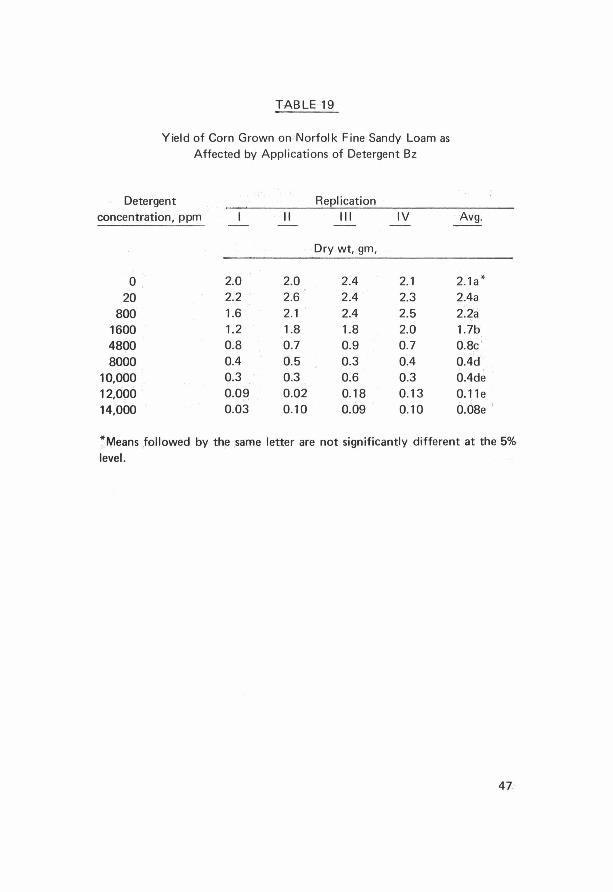
TABLE 19
Yield of Corn Grown on Norfolk Fine Sandy Loam as Affected by Applications of Detergent Bz
Detergent Replication concentration, ppm II 111 IV
Dry wt, gm,
0 2.0 2.0 2.4 2.1 20 2.2 2.6 2.4 2.3
800 1.6 2.1 2.4 2.5 1600 1.2 1.8 1.8 2.0 4800 0.8 0.7 0.9 0.7 8000 0.4 0.5 0.3 0.4
10,000 0.3 0.3 0.6 0.3 12,000 0.09 0.02 0.18 0.13 14,000 0.03 0.10 0.09 0.10
Avg.
2.1a * 2.4a 2.2a 1.7b 0.8c ' 0.4d 0.4de 0.11e 0.08e
~Means followed by the same letter are not significantly different at the 5% level.
47.
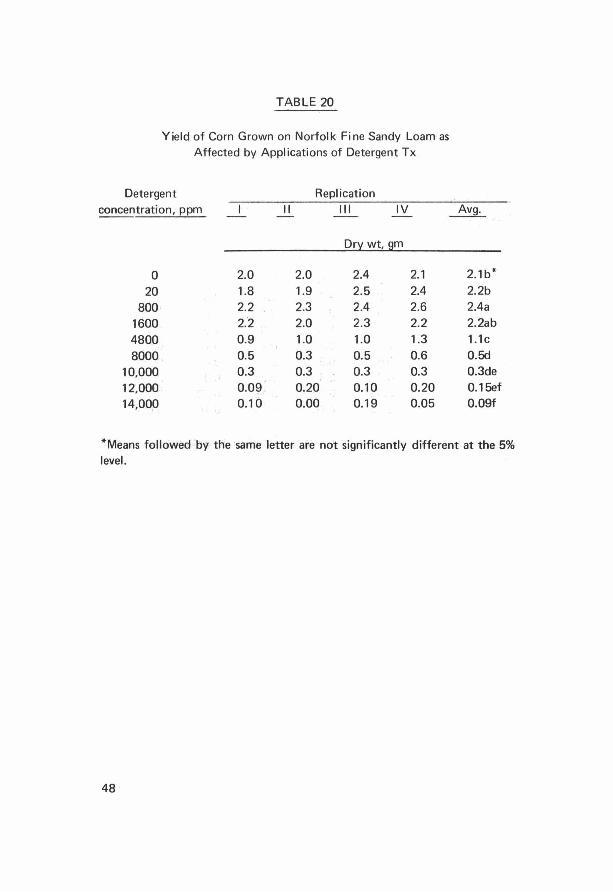
TABLE 20
Yield of Corn Grown on Norfolk Fine Sandy Loam as Affected by Applications of Detergent Tx
Detergent concentration, ppm
0 20
800 1600 4800 8000
10,000 12,000 14,00,0
II
2.0 1.8 2.2 2.2 0.9 0.5 0.3 0.09 0.10
Replication 11 I IV
Dry wt, gm
2.0 2.4 2.1 1.9 2.5 2.4 2.3 2.4 2.6 2.0 2.3 2.2 1.0 1.0 1.3 0.3 0~5 0.6 0.3 0.3 0.3 0.20 0.10 0.20 0.00 0.19 0.05
Avg.
2.1b* 2.2b 2.4a 2.2ab 1.1c 0.5d 0.3de 0.15ef 0.09f
*Means followed by the same letter are not significantly different at the 5% level.
48
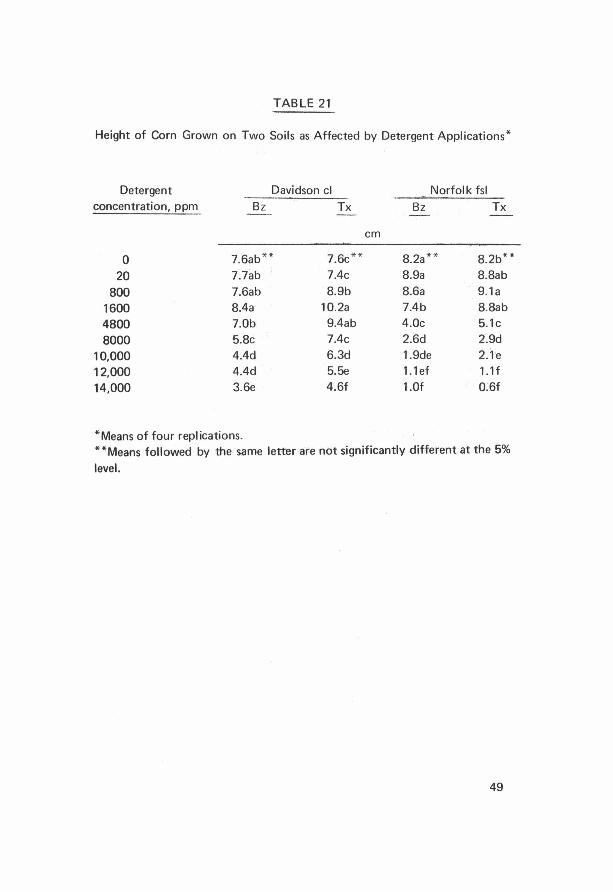
TABLE 21
Height of Corn Grown on Two Soils as Affected by Detergent Applications*
Detergent Davidson cl Norfolk fsl concentration, ppm Bz Tx Bz Tx
cm
0 7.6ab** 7.6c** 8.2a** 8.2b**
20 7.7ab 7.4c 8.9a 8.8ab
800 7.6ab 8.9b 8.6a 9.1a 1600 8.4a 10.2a 7.4b 8.8ab 4800 7.0b 9.4ab 4.0c 5.1c
8000 5.8c 7.4c 2.6d 2.9d 10,000 4.4d 6.3d 1.9de 2.1e 12,000 4.4d 5.5e 1.1 ef 1.1f 14,000 3.6e 4.6f 1.0f 0.6f
*Means of four replications. **Means followed by the same letter are not significantly different at the 5%
level.
49
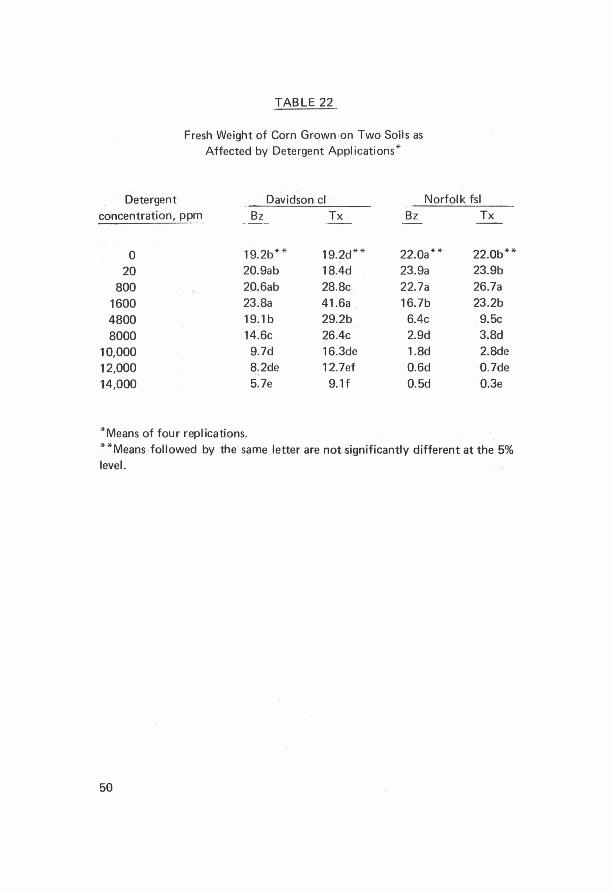
TABLE 22
Fresh Weight of Com Grown ·on Two Soils as Affected by Detergent Applications*
Detergent Davidson cl Norfolk fsl concentration, PP'!1_ Bz Tx Bz Tx
0 19.2b* * 19.2d** 22.0a** 22.0b**
20 20.9ab 18.4d 23.9a 23.9b 800 20.6ab 28.8c 22.7a 26.7a
1600 23.8a 41.6a 16.7b 23.2b 4800 19.1 b 29.2b 6.4c 9.5c 8000 14.6c 26.4c 2.9d 3.8d
10,000 9.7d 16.3de 1.8d 2.8de 12,000 8.2de 12. 7ef 0.6d 0.7de 14,000 5.7e 9.1f 0.5d 0.3e
*Means of four replications. **Meaos followed by the same letter are not significantly different at the 5% level.
50

WATER RESOURCES RESEARCH CENTER VIRGINIA POLYTECHNIC INSTITUTE and STATE UNIVERSITY