Embed Size (px)
Citation preview
Electronic copy available at: http://ssrn.com/abstract=1989555
Johnson School Research Paper Series #8-2012
Bulk Classification of Trading Activity
David Easley—Cornell University Marcos M. López de Prado—Tudor Investment Corp
Maureen O’Hara—Cornell University
March, 2012
This paper can be downloaded without charge at The Social Science Research Network Electronic Paper Collection.
Electronic copy available at: http://ssrn.com/abstract=1989555Electronic copy available at: http://ssrn.com/abstract=1989555
1
BULK CLASSIFICATION OF TRADING ACTIVITY
David Easley1
Marcos M. López de Prado2 [email protected]
Maureen O’Hara3
March, 2012
ABSTRACT
The classification of the aggressor’s side of a trade is a critical concern in Market
Microstructure Theory. Among other uses, it is a key input necessary to identify
information asymmetries and the presence of toxic order flow. Although some
Exchanges have recently started to report the “aggressor” flag, historical databases
usually lack this piece of data. Thus the researcher and/or practitioner still needs to
infer the aggressor side from existing information, typically level 1 Tick Data. This
poses the additional problem of having to parse hundreds of millions of records per
instrument and year. In this paper we propose a new Bulk Volume Classification
methodology that does not require working with Tick Data. Instead, it uses Time or
Volume Bars, which for a small fraction of the records needed by the Tick rule
delivers a classification with greater accuracy. The implication is that working with
Tick Data for inferring the aggressor classification is not only inefficient and costly,
but also does not offer greater accuracy compared to Time or Volume Bars.
Keywords: Aggressor side, Bulk Volume Classification, flow toxicity, volume
imbalance, market microstructure.
JEL codes: C02, D52, D53, G14.
We thank Robert Almgren, Robert Engle, Craig Holden, David Leinweber, Pam Moulton, Mark Ready,
Riccardo Rebonato, John Wu and the CIFT group at the Lawrence Berkeley National Laboratory for
providing useful comments. We are grateful to Sergey Kosyakov and Steven Jones for their research
assistance.
* The authors have applied for a patent on ‘Bulk Volume Classification’ and have a financial interest in it.
1 Scarborough Professor and Donald C. Opatrny Chair Department of Economics, Cornell University. 2 Head of High Frequency Futures Trading at Tudor Investment Corp., and Postdoctoral Fellow of
RCC at Harvard University. 3 Purcell Professor of Finance, Johnson Graduate School of Management, Cornell University.
Electronic copy available at: http://ssrn.com/abstract=1989555
2
INTRODUCTION
Every trade involves at least one buyer and one seller, and knowing which side
initiated the trade is valuable information to market participants. Trade direction (i.e.
buy or sell) can be used to identify asymmetric information, and a sustained
imbalance of trade can signal the presence of toxic order flow and its potential
consequent effects on market liquidity. Determining who initiated the trade, however,
has never been straightforward, and in high frequency settings this task is even more
challenging. Trading now takes place largely in electronic markets where designated
liquidity providers are not present, and practices such as order splitting, hidden orders,
and fragmentation of trading make drawing inferences from trade data problematic.
Even when order data is available, however, the sheer volume of trading results in
massive data files which are expensive to buy and store, let alone to manipulate. For
practitioners and researchers alike, what is needed is a reliable, inexpensive
mechanism to assign trade direction in high frequency markets.
In this paper, we propose a new approach for classifying trading activity. Our
classification technique is inspired by the principle that bulk counting and measuring
may be more accurate than item counting when measurement error is likely.4 The
“Bulk Volume Classification” (BVC) algorithm aggregates trades over short time
intervals (denoted time bars) or volume intervals (denoted volume bars) and then uses
the standardized price change between the beginning and end of the interval to
approximate the percentage of buy and sell volume. Unlike traditional trade
classification algorithms that assign trades to be either buys or sells, our approach
4 For example, suppose that you have an unbiased instrument for measuring distances, which makes
random errors whose standard deviation is . If we are allowed only two measurements on two items
of different lengths, A and B, there is a more accurate procedure of measuring these items than
measuring independently. Indeed, if you apply your first measurement on A+B and your second
measurement on A-B, the measuring error will be half that if you measure A and B independently! See
Mosteller [1965] for a formal proof.
3
apportions trades into buy volume and sell volume. As we demonstrate in this paper,
this approach provides a parsimonious, accurate, and highly tractable way to assign
trade direction.
Our research can be viewed as providing a new tool for the high frequency
world that now characterizes trading. As we discuss in Easley et al. [2011a; 2011b;
2012], high frequency markets are not simply the “old” markets speeded up. Massive
numbers of trades occurring in extremely short time intervals challenge conventional
time-based approaches of analyzing data. Indeed, one intriguing result of our research
is that classifying trading using volume-bars is more accurate than using time-bars,
especially in the case of commodities.
We also show that using either time-bars or volume bars is more accurate than
standard tick rule classification schemes based on individual trade data. Using futures
data, we find that a tick rule algorithm works reasonably well in the e-mini S&P 500
Futures, correctly classifying 86.43% of the data, but it does significantly less well in
oil futures (78.95%) and in gold futures (67.18%). We attribute this degradation of
performance to the smaller trading volume, lower liquidity (i.e. thinner books) and
greater dynamicity (number of quote changes per fill) in these contracts. In contrast,
we find that the BVC approach can (depending on the time or volume bar
specification) correctly classify 91% of e-mini S&P 500 Futures volume, 91.59% of
oil futures volume, and 87.36% of gold futures trading activity. Moreover, the time-
series evidence shows that while all three classification approaches (tick rule, time
bars, volume bars) work less well on extremely active days, in the e-mini contract
BVC time-bars beat the tick rule on 82.11% of days while volume-bars does so on
99.19% of days.
4
Another advantage of our approach is its parsimonious use of data. One might
have conjectured that an advantage of the high frequency world is more extensive
databases providing information such as trade direction. Yet, while such databases
are now becoming available in some markets, they have serious drawbacks. The
massive number of trades in markets makes such data expensive both to buy and to
manipulate.5 Multiple exceptions and nuances make dealing with this data a research
project in its own right, as will become apparent later in this paper. Fragmentation of
trading also requires such data from every market in which a security trades,
something unlikely to occur for asset classes like equities. Using time-bars, our
approach allows the researcher to work with a tiny fraction of the original tick dataset.
Moreover, time bar data are available at low cost from vendors such as Bloomberg.
We believe this new approach will be useful for a wide variety of applications in high
frequency markets.
This paper is organized as follows. Section 1 discusses existing trade
classification algorithms, their historical accuracy in different market settings, and the
complications posed by high frequency markets for trade classification. Section 2
introduces our BVC algorithm and the role played by time bars and volume bars.
Section 3 investigates the accuracy of tick rule versus BVC in the context of the e-
mini S&P500 futures, the WTI crude oil futures, and Gold futures. Section 4
addresses the stability of these classification approaches by looking at their time-
series behavior. Section 5 discusses the accuracy of trade classification if we apply the
empirical distribution of price changes. Section 6 summarizes the main conclusions.
The Appendix provides an algorithm in Python Language.
5 Databases that include information such as buyer and seller indicators involve the processing of
hundreds of millions of records per year and instrument. This is not a trivial problem, and is one of the
reasons behind the S.E.C.’s plea for computational help from the U.S. Department of Energy’s
National Laboratories (see Bethel, Leinweber, Ruebel and Wu [2011]).
5
1. TRADE CLASSIFICATION ALGORITHMS
The problem of how to classify trades into buys and sells is long-standing. Data
providing the time-stamped trade price and, often, quantity have typically been
available for exchange-traded products such as futures. The advent of the national
market system (and the consequent development of the consolidated tape and
consolidated quote systems) allowed similar time-stamped quote data for equity
markets. Based on such data, a variety of approaches have been developed to classify
trades into buys and sells. In this section, we provide a brief taxonomy of these
approaches, their historical accuracy, and the circumstances under which they falter.
1.1. TICK RULE
The Tick rule classifies a trade as a buy if the trade price is greater than the previous
trade price, and as a sell if the trade price is lower than the previous trade price. If the
trade price is equal to the previous price, the trade is assigned to the same side as the
previous trade. This method is the least data demanding among all tick-based
algorithms, as it only requires price data (referred to in the market as Level 1 data).
Another advantage of this approach is that it leaves no trades unclassified.
By focusing on price movements, the tick rule captures the natural intuition
that buyers pay a higher price and sellers get a lower price. There are, however, a
variety of reasons why such a simple approach can fail to provide accurate
classifications. One such reason is movements within the order book. A trade at a
lower price may be a sale, but it can also be a buy if time has passed and the spread
has moved down. In a high frequency setting, a related problem can arise as price
movements up or down in rapid succession tend to deplete the book and cause orders
to replenish. This can cause buys to be mis-classified as sells, and conversely. Trades
at no price movement are particularly challenging. The convention signs the trade in
6
the direction of the previous trade but practices such as hidden orders introduce errors.
For example, a trade at the midpoint (say classified as a buy) followed by a hidden
sell order at the midpoint will incorrectly classify the latter trade as a buy.
In the case of futures and options, calendar trades pose a challenge of their
own. These are exchange-guaranteed spreads traded in own book. However, every
trade in that book impacts two other books simultaneously. These implied trades are
generated by the exchange at an arbitrary level (only the difference of “spread”
matters to the exchange and traders involved). Although they may be for a large size
that can sweep the market several levels, they are typically not reported by most
vendors, thus adding uncertainty regarding the meaning of the next trade’s sign.
As with most trade classification studies, research on tick rule accuracy has
focused on implementation in equities markets (there is, to our knowledge, no
comparable study of tick rule accuracy in futures markets). Odders-White [2000]
reports 78.6% accuracy when applying this algorithm on the NYSE’s 1991 TORQ
database. Ellis, Michaely and O’Hara [2000] report 80% accuracy on Nasdaq data
from the late 1990’s. Aitken and Frino [1996] estimate 75% accuracy on Australian
stocks in the 1990’s. Whether these tick rule classification accuracies persist in high
frequency settings is not clear, but recent evidence from Chakrabarty, Moulton and
Shkilko [2012] (discussed later in the paper) suggests that accuracies have degraded
substantially
1.2. QUOTE RULE
The Quote Rule classifies a trade that occurs above the best-bid-or-offer (the BBO)
midpoint as a Buy, a trade that occurs below the BBO midpoint as a Sell, and leaves
as unclassified trades that occur at the midpoint. This method is more data demanding
than the Tick rule as it requires Level 2 data (tick trades and BBO quotes). In
7
principle, the availability of more data should make trade classification more accurate,
but in reality quote rule algorithms are problematic. In equity markets, for example,
the large number of trades occurring at the mid-quote results in large classification
errors using this approach. Equally challenging is the difficulty of aligning trades to
the correct prevailing quotes. In particular, quotes change more frequently than trades
execute, meaning that a trade may appear to be at the current ask when in fact it took
place at what was then the prevailing bid.6 This problem is likely to be particularly
acute for less liquid securities with thinner order books.
Empirical investigations find substantial errors using the quote rule for trade
classification. Odders-White [2000] reports that this algorithm left 15.9% of the
trades unclassified, and it misclassified an additional 9.1% when applied to NYSE’s
TORQ database. Ellis, Michaely and O’Hara [2000] report 78% accuracy on Nasdaq
data, counting unclassified trades as misclassified.
1.3. LEE-READY ALGORITHM
The most widely-used classification method for stocks, the Lee and Ready [1991]
algorithm combines features from both the tick and quote rules. This classification
algorithm was designed to sign trades on the NYSE where different reporting systems
collected quote information and trade information from the specialists. The Lee-
Ready algorithm applies the quote rule on all transactions away from the midpoint,
and a tick rule for those transactions at the midpoint. Like the tick rule, the Lee-Ready
6 In electronic markets, quote changes will often occur when orders are cancelled, and not just when
orders execute. Hasbrouck and Saar [2009] find that 98% of orders on the NYSE are cancelled,
underscoring the difficulties of this approach.
8
algorithm leaves no trades unclassified, however it requires Level 2 data for
implementation.7
Odders-White [2000] reports a 85% accuracy when applying this algorithm on
NYSE’s 1991 TORQ database. Ellis, Michaely and O’Hara [2000] report 83%
accuracy on 1996 Nasdaq data. Chakrabarty, Moulton, and Shkilko [2012], using
2005 data from INET (an ECN now part of Nasdaq), find that Lee-Ready classified
correctly only 68-69% of trades. This dramatic fall-off in classification accuracy is
likely to be even greater today given that high frequency trading was nascent in 2005.
The original Lee-Ready algorithm specified a 5-second delay in comparing
trades to quotes, highlighting even in pre-high frequency days the difficulty of
aligning times for trade and quote reports. This problem is substantially more
difficult now. In equities, for example, there are now 13 exchanges (and a variety of
trade reporting facilities (TRFs)) sending data to the consolidated tape. The tape
marks trade and quote times when it receives the data, but this will be different from
the actual trade or quote time depending on the latency of the venue’s reporting
technology. Moreover, the aggregate tape is then a blend of all of these reports,
delivered at various latencies.8 Most professional traders now purchase direct feeds
of data from the individual venues rather than rely on the much slower, and arguably
less accurate, tape data.9
In summary, extant trade classification algorithms use time-stamped
individual trade and quote reports to infer trade direction. While arguably accurate
“enough” in the past, the speed, volume and fragmentation of current high frequency
7 Since all futures trades must occur at the bid or ask (and spreads are typically only one tick), Lee-Ready reduces to the Tick Rule for these products and needs only Level 1 data. 8 Holden and Jacobsen (2011) discuss these tape timing issues in more detail. 9 The problems with the consolidated tape then translate into problems with TAQ data as it is derived
from the tape. In addition to the issues raised above, O’Hara, Yao, Ye [2011] show that the tape also
does not report odd lot transactions, which in turn means that the sequence of trades is incorrect as well
as incomplete.
9
markets pose serious challenges to any trade-based classification approach. Even
apart from accuracy concerns, however, current practices such as algorithmic trading
result in massive numbers of trades, quotes and messages that can overwhelm even
the most sophisticated data handling systems.10
In the next section, we propose a new
approach to classifying trading activity.
2. BULK VOLUME CLASSIFICATION (BVC)
In our analysis, we aggregate trades over short time or volume intervals (denoted time
bars and volume bars respectively), assign each interval the last price included in it,
and then use the standardized price change between the two consecutive intervals to
determine the percentage of buy and sell volume.11
For example, a bar is assigned
the price change , where is the last price included in bar , and the
last price included in bar .12
Aggregation mitigates the effects of order splitting,
and using the standardized price change allows volume classification in probabilistic
terms (which we call Bulk Volume Classification, or BVC for short). Let
(
)
[ (
)]
(1)
where is the volume traded during (time or volume) bar , and which we wish to
classify in terms of buy and sell volume and
respectively. Z is the CDF of the
standard normal distribution, is the price change between two consecutive
10 For this reason, exchanges are not able to ensure that events are broadcasted in the same sequence as they took place. This phenomenon is particularly detrimental to the accuracy of Tick-based
classification rules. 11 See also Easley, et al. [2011b] where we apply this technique in estimating VPIN measures. 12 The first bar starts with the second transaction in our sample, so that the algorithm has a for
initialization.
10
bars and is an estimate of the volume-weighted standard derivation of price
changes between bars. Our procedure splits the volume in a bar equally between buy
and sell volume if there is no price change from the beginning to the end of the bar.
Alternatively, if the price increases, the volume is weighted more toward buys than
sells and the weighting depends on how large the price change is relative to the
distribution of price changes.
A key difference between BVC and the Tick-based algorithms is that the latter
signs volume as either buy or sell, whilst the former assigns a fraction of the volume
as buys and the remainder as sells. In other words, the Tick-based algorithms provide
a discrete classification, while the BVC algorithm is continuous. Because most
trading now arises from algorithms which slice and dice orders into tiny pieces, it
seems sensible that trading intentions are now better captured by looking at the
aggregation of trades rather than the individual units.
It is also useful to note that because the BVC approach uses the normal
approximation it works well with large numbers of trades, a feature now describing
most high frequency markets. In low transactional settings13
, however, BVC will not
be appropriate as it is not designed to sign individual trades. In such markets,
standard tick-based algorithms are the more appropriate approach.
3. CLASSIFICATION ACCURACY
How well does this classification algorithm work? To establish this, we need to
compare our estimated buy and sell categorizations with actual buy-sell data.
Standard equity databases do not provide such information, but it is available (for a
price) for futures contracts trading on GLOBEX. Apart from availability, futures data
13 As we will see later, accuracy increases with greater data granularity per bin, because measuring
errors offset each other. If bins are extremely small because only a few trades occur per bin, accuracy
will decline.
11
have several advantages relative to equity data. One is that futures are not
fragmented, so selection biases in the data are nonexistent. Another advantage is that
all trades must occur either at the best bid or the best offer. Consequently, quote data
provides little additional information for purposes of trade classification.14
For this
reason, we will limit our analysis to comparing the accuracy of two Level 1
algorithms: Tick-rule and BVC.
We focus our investigation on three contracts: the e-mini S&P 500 future, the
WTI Crude Oil future, and the Gold futures. The e-mini S&P 500 Futures trades on
the Chicago Mercantile Exchange (CME) and is the most actively traded index futures
contract, with an average daily volume of 2.2 million contracts. The WTI Crude Oil
Futures trades on the New York Mercantile Exchange (NYMEX) and is the most
actively traded commodities contract. Gold Futures trade on the Commodities
Exchange (COMEX) and, while active, their trading volume is approximately one-
fifth that of the e-mini. Trade classification algorithms can be sensitive to market
structure, book dynamics and liquidity among other factors, so we use these three
distinct contracts to look for general trends in trade classification accuracy.
3.1. TRANSACTIONS DATA
Our empirical study begins with an analysis of tick data for the CME e-mini S&P500
Futures contract from November 7th
2010 to November 6th 2011. DataMine Market
Depth is the CME Group database that provides (at a cost) all messages needed to
recreate the book (multiple-depth) and trade data for any CME GLOBEX trade
14 We do not entirely discard the applicability of Level 2 algorithms to other products, especially those
with a sparse book, but in the case of full and deep books like the E-mini S&P500, Level 1 algorithms
seem to make the most adequate use of the data.
12
product, time-stamped to the millisecond, following the FIX/FAST protocol15
. This
level 3 data was purchased directly from the CME, and was delivered as 357 zip files
containing 2272 flat files. This represents about 21.6GB of compressed data, and
about 220GB uncompressed.16
There are a variety of challenges in working with this data. The data comes in
a highly irregular format in which a single line can contain an arbitrary number of
messages. Among these messages, we find anywhere between 1 and 19 trades per
line. Most messages relate to requests to modify or cancel quotes. Another problem is
that a trade cannot be identified by any particular FIX tag, but only by a combination
of them (for example, when tag 269=2 after another tag 279=0, then tag 270 contains
the price, tag 271 the traded size, tag 5797 the aggressor side, tag 52 the UTC
transmission time and tag 107 the instrument). A further complication is that the files
mix messages from all e-mini S&P500 Futures contracts trading at that time, not only
the front contract, requiring care in separating trades from the different expirations.
Finally, some reported trades are fictional, and the only way to tell the difference with
the real trades is by checking the trade time (they are time stamped during periods
when the Exchange was actually closed).17
It should be noted that Exchanges do not always report trades in the sequence
they occurred, particular when their networks are overloaded with dense traffic. Book
updates are incremental. Losing or misplacing a message within the sequence of
events means that the researcher will not reconstruct the book correctly, which will
15 This protocol receives frequent updates and modifications. In the context of this paper, we will
always refer to version 2.19, dated 12/09/11. 16
We mention these numbers to signal the difficulty of working with this data using standard
commercial packages. 17 Fictional trades can arise as part of the algorithm testing process. Another oddity in the data is that
27,419 trades (or 0.0213% of the total) reported at 4.30pm EST on weekdays and 6pm on Sundays are
matched in the opening auction, and therefore have no aggressor flag. These were deleted from our
study.
13
impact the accuracy of the Tick-based algorithms but it will not affect BVC’s
accuracy. Tag 34 (“Integer Message Sequence Number”) helps to identify whether a
message was broadcasted out of sequence.
In short, a rather complex data handler needs to be programmed in order to
extract the fields we need: Time, Price18
, Volume, Aggressor and Instrument.19
Once
the data is parsed, we are left with 128,579,415 trades (Level 1 data) stored in a
SQLite3 database, which occupies 3.87GB of memory. A similar database with Level
2 data would consist of 20.7GB of memory containing 629,897,077 records (trades
and BBO updates). There is an average of about 3.9 BBO updates per trade.
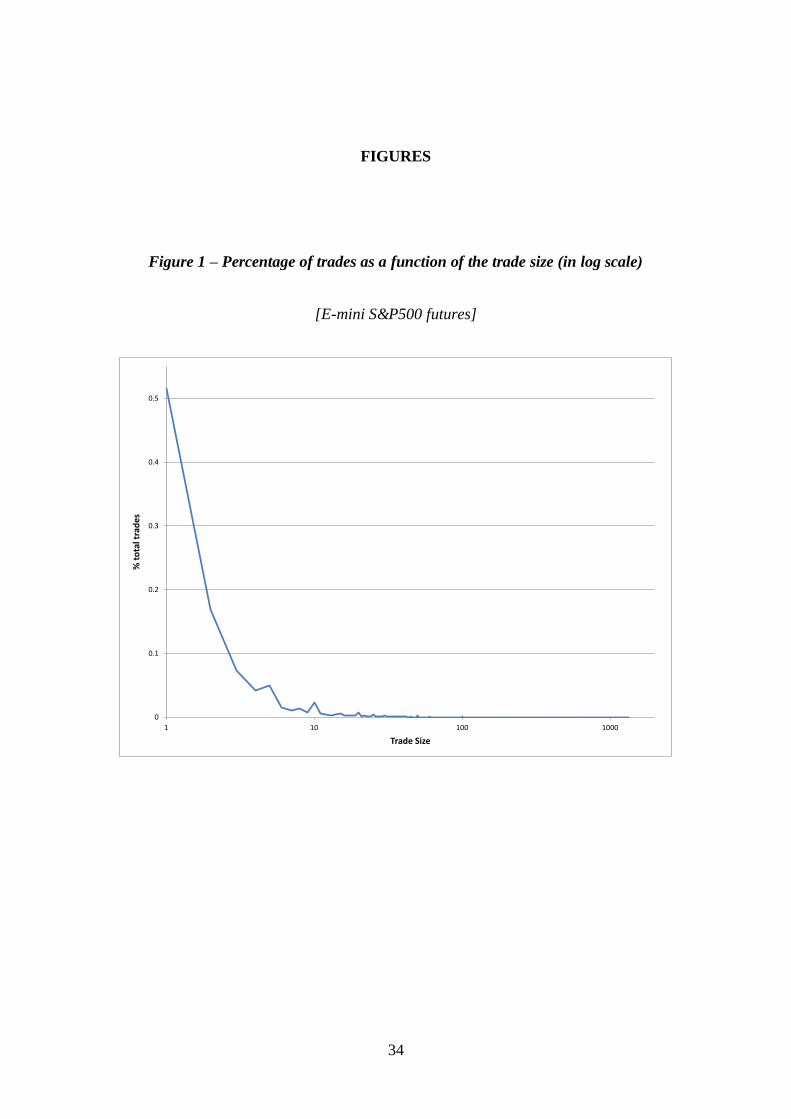
Most of these trades are small, averaging 4.50 contracts per reported fill.
Figure 1 plots the frequency of trades per trade size. About 51.56% of the trades are
for one contract. Because the CME applies a FIFO (First In, First Out) matching
algorithm for e-mini S&P500 futures, reducing the size of the order does not place it
lower in the queue20
. The frequency line quickly decays as a function of the trade size,
with the exception of round trade sizes (5, 10, 20, 25, 50, 100, 200, etc.).
That round trade sizes are much more common than their neighbors may be
attributed to so-called ‘mouse’ or ‘GUI’ traders, i.e. human traders that send orders by
clicking buttons on a GUI (Graphical User Interface). As an interesting aside, this
footprint of ‘GUI traders’ could be used by machines to learn the patterns of their
human competitors, and eventually anticipate them to the advantage of the ‘silicon
traders’. For example, size 10 is 2.9 times more frequent than size 9. Size 50 is 10.86
18 Prices are recorded in cents of the index level, to avoid decimals. 19 Unfortunately every exchange makes slightly different implementations of the FIX protocol, which means that a CME data handler may not work on EUREX FIX-formatted messages. 20 That is not the case for all CME products. The CME reports the matching algorithm through FIX tag
1142. For instance, CME matches Eurodollar short futures following an Allocation algorithm. This is
an enhanced pro-rata algorithm that incorporates a priority (TOP order) to the first incoming order that
betters the market. CME follows a Pro-Rata algorithm to match orders on FX Futures Spreads. The
CME applies 10 different matching algorithms, depending on the product.
14
times more likely than size 49. Size 100 is 16.78 times more frequent than size 99.
Size 200 is 27.18 times more likely than size 199. Size 250 is 32.5 times more
frequent than size 249, and size 500 is 57.06 times more frequent than size 499. Such
patterns are not typical of ‘silicon traders’ who usually randomize trades to disguise
their footprint in markets.
[FIGURE 1 HERE]
3.2. TIME BARS AND VOLUME BARS
Dealing with (time or volume) bars is much easier, faster, and cheaper. To begin with,
most data vendors offer time bars pre-processed, which saves the time and expense
associated with FIX-formatted tick data. Bloomberg users, for example, can download
up to 6 months of time bars for any security at no extra cost. In addition, One-Tick
and TickWrite users can form sub-minute time bars as well as volume and tick bars.
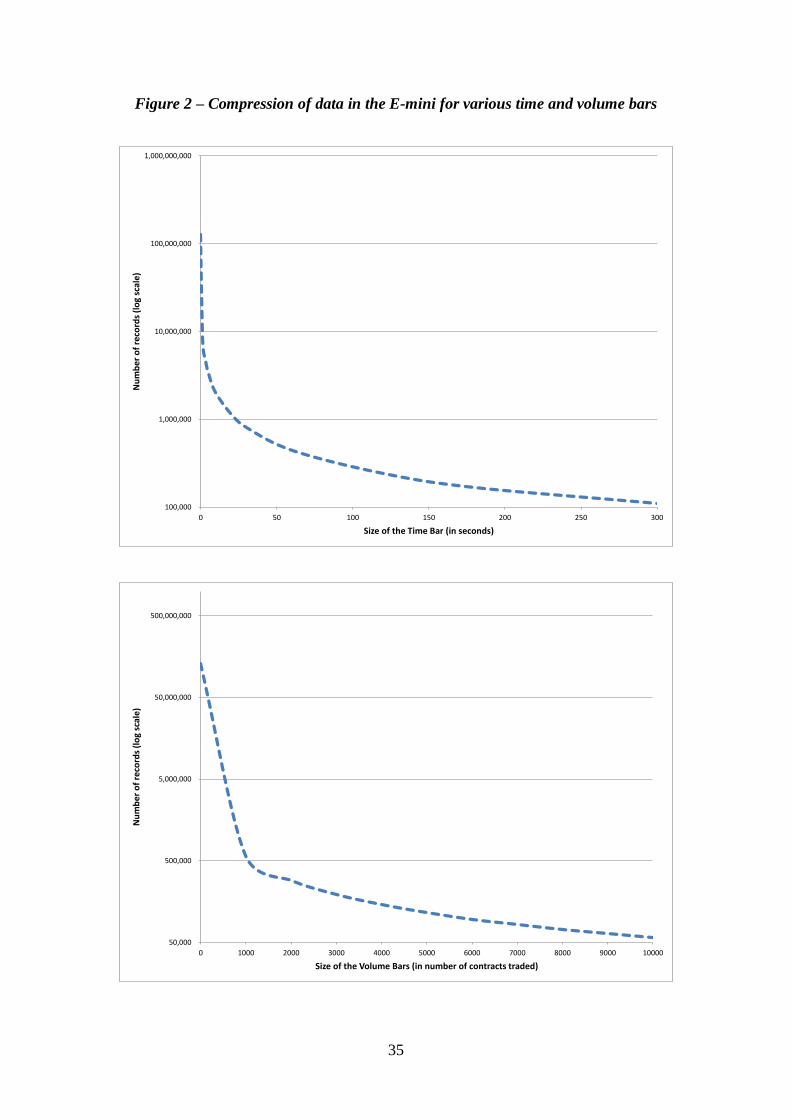
Compressing the data into either time bars or volume bars dramatically
reduces the amount of data needed for analysis. For example, our 128,579,415
original trades result in only 443,653 time bars of size 1-minute. This is a much more
manageable series, constituting just 0.35% of the original data size. Finer time bars
also allow significant compression, with 1-second time bars reducing the data points
to 8,732,580, or 6.89% of the original data. In our analysis, we evaluate trade
accuracy using time bars from 1 second to 300 seconds. Volume bars are defined
over specific quantities and in our study we look at volume bars ranging from 1,000 to
10,000 contracts. Using as few as 1000 contracts, however, we can compress the data
to 0.45% of its original size. Figure 2 shows how the various time and volume bar
settings affects the compression of data for the e-mini S&P 500 future.
[FIGURE 2 HERE]
15
3.3. DOES IT WORK? TESTING THE ACCURACY OF BULK VOLUME
AND THE TICK RULE
We have shown that the BVC approach dramatically reduces the amount of data
needed to classify buy and sell trading activity, but we have not yet shown how
accurate it is. In this section, we investigate this issue by computing the accuracy of
the BVC approach as well as the accuracy of the Tick Rule algorithm. Our BVC
approach yields a fraction of trade in each bar that is classified as buyer or seller
initiated. As it does not classify individual trades we cannot compute accuracy on a
trade-by-trade basis. Instead, for both the Tick Rule and BVC approach, we compare
the computed fraction of buy and sell trades in each bar with the actual fraction of buy
and sell trades in the bar.
To do this comparison we compute the buy and sell volume implied by the
Tick Rule and compare the accuracy of this estimate with the accuracy of BVC’s
estimates. If (
) is the actual buy and sell volume in bar τ and ( ̂ ̂) is the
estimated buy and sell volume in bar τ , then the accuracy ratio (Ar) is defined to be
∑ [ ( ̂ ) ( ̂
)]
∑ (2)
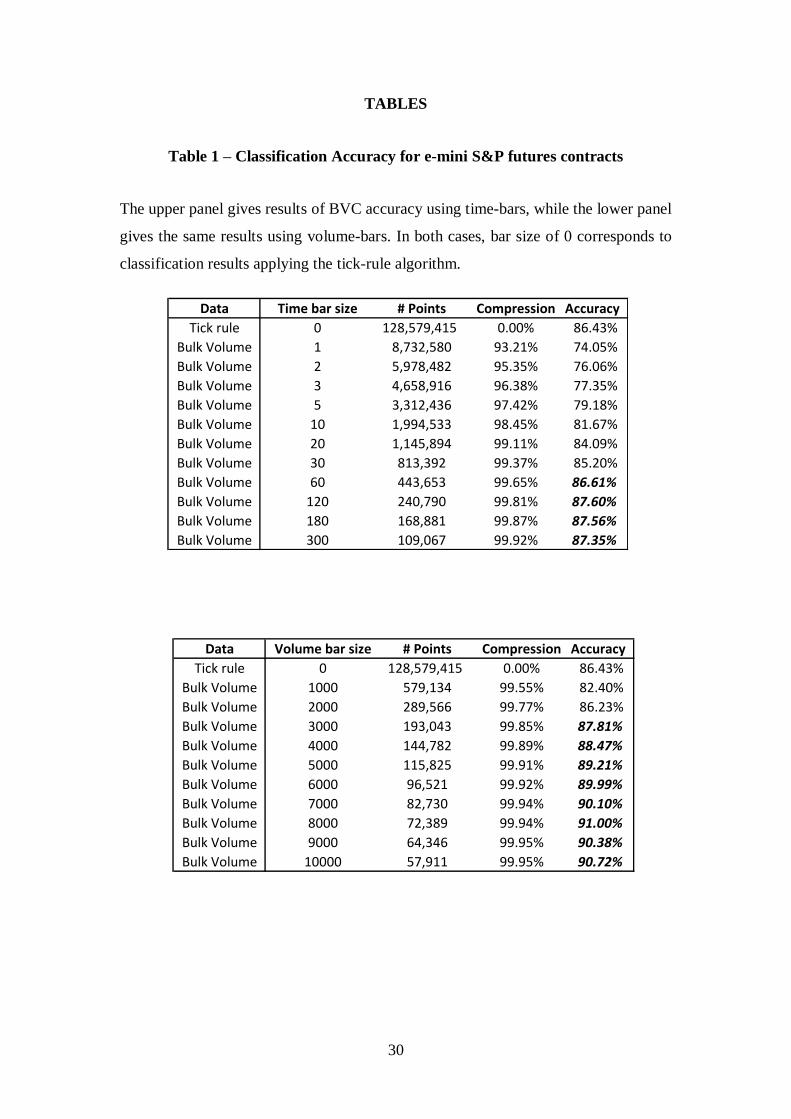
Table 1 provides accuracy ratios for the Tick Rule and BVC on the e-mini S&P 500
Futures contract.
[TABLE 1 HERE]
We first note that using the tick-rule on e-mini S&P 500 Futures delivers an
accuracy ratio of 86.43%. This is remarkably close to the results reported in the
aforementioned studies on stocks, and it suggests that the tick-rule provides a
16
reasonably accurate, though heavily data intensive way, to classify buy and sell trades
in e-mini futures.21
The BVC results vary depending upon the time bar or volume bar selected, but
the table clearly shows that the BVC algorithm beats the tick rule for time bars of 60
seconds or longer and for volume bars of 3000 shares or more. Moreover, using the
BVC approach we can correctly classify approximately 87.6% of volume using time
bars, and 90.72% of volume using volume bars. Thus, the BVC algorithm is more
accurate than the standard tick-based approach.22
This greater accuracy comes with a more parsimonious use of data. Using
volume bars, we can achieve a 90% accuracy rate using only 0.6% of the data needed
for the tick-rule. Focusing on a 60 second time bar, we can achieve 86.61% accuracy
using 0.35% of the data. In other words, less data granularity is at least as informative
as full granularity for the purpose of trade classification.
What may be surprising is that volume bars are more accurate than time bars.
This is consistent with arguments in Easley, López de Prado, and O’Hara [2011a;
2011b] that in high frequency markets a volume clock is a more appropriate metric
than a time clock. Volume bars fill more quickly when markets are active, and more
slowly when it is inactive. Volume bars always contain the same amount of volume,
so the aggregation properties of the BVC approach will generally work better than it
21 Note that this is accuracy of the tick rule’s estimate about the volume of buy and sell trades, and not
its accuracy on a trade-by-trade basis. Calculating this latter trade-by-trade accuracy, the tick rule
correctly classifies 86.14% of trades. 22 It is worth noting that if all trades generated price changes of the same absolute size, varying
between negative for sells and positive for buys, then the tick rule and BVC would yield identical
estimates for the fraction of buy versus sell volume. In reality, some price changes are zero, some are
small and some are large, each associated with different trade sizes, and so the two procedures yield
differing estimates. We thank Craig Holden for prompting us to think about this point.
17
will with the varying amounts of trade found in time bars.23
This suggests that
volume bars may be a better choice for classifying trading activity.
A related issue is the optimal time or volume bar size to use. Accuracy
increases with bar size, but we are also giving up some of the variability in trading
patterns that is apparent with shorter bars (although this is less of a problem with
volume bars). Depending on the research question posed, some researchers will favor
a particular bar type and size over others, taking into account factors such as data
compression and accuracy.
3.4. ROBUSTNESS IN OTHER MARKETS: APPLICATION TO WTI
CRUDE OIL FUTURES AND GOLD FUTURES
Because order matching protocols differ across market settings, one might expect that
the accuracy of classification algorithms will differ as well. In this sub-section, we
address this issue by implementing our analysis on two additional futures contracts,
the WTI Oil future (trading on NYMEX) and the Gold future (trading on COMEX).
Apart from the differences introduced by differing market rules, these contracts also
differ with respect to trading volume levels and order book activity, factors that might
also be expected to affect accuracy levels.
WTI Crude Oil Futures are the most liquid of all crude contracts, and the
futures product with largest volume among all physical commodities. We acquired
Level 3 data from NYMEX, from November 28th
2010 to November 27th 2011. A
data handler is also needed in this case, as the same data pre-processing problems are
present in WTI Crude Oil Futures as we found in the e-mini S&P500 Futures.24
Once
23 A variety of authors have noted that volume or transaction based analyses have “better” statistical
properties than time based analyses of securities transactions. See for example, Mandelbrot [1967],
Clark [1973] or Ané and Geman [2000] among many. 24 The data also follows the FIX/FAST protocol, and was delivered as 364 zip files containing 4949 flat
files. This represents about 50.7GB of compressed data, and about 510GB uncompressed.
18
the data is parsed, we are left with 78,630,179 signed trades, stored in a SQLite3
database of Level 1 data which occupies 2.29GB of memory. A similar database with
level 2 data would consume 47.5GB of memory containing 1,486,832,916 records
(trades and BBO updates), or about 17.91 BBO changes per trade.
Gold Futures are traded at the Commodity Exchange (COMEX). Level 3 data
was acquired from COMEX, from November 28th 2010 to December 20
th 2011.
25
Once the data is parsed, we are left with 27,960,542 signed trades, stored in a SQLite3
database of Level 1 data which occupies 833MB of memory. A similar database with
Level 2 data would consist of 36.4GB of memory containing 1,142,557,861 records
(trades and BBO updates), or about 39.86 average BBO changes per trade.
Trading in the WTI Oil and Gold futures contracts share much in common
with the e-mini S&P 500 Futures contract, but there are some important differences.
For example, book dynamics of the WTI contract are quite different from those of the
e-mini. Frequent modifications and cancellations of orders make the WTI book much
more unstable than the e-mini’s. In our particular sample, there is an average of 17.91
BBO updates for each WTI trade, which is strikingly greater than 3.8 BBO updates
for the e-mini. In Gold futures, the number is even higher, with an average of 39.86
BBO updates per trade. These book dynamics create problems for tick rule
classification, and so we would expect BVC on bars to be even more useful for such
contracts. These dynamics also dramatically increase the data needed for tick-by-tick
processing, underscoring another advantage of using time or volume bars in these
settings.26
25 It also follows the FIX/FAST protocol, and was delivered as 388 zip files containing 3044 flat files.
This represents about 28.8GB of compressed data, and about 290GB uncompressed. 26 In particular, one year of WTI data required 510GB for 78,630,179 transactions, while one year of e-
mini S&P500 Futures data needed only 220GB for 128,579,415 transactions.
19
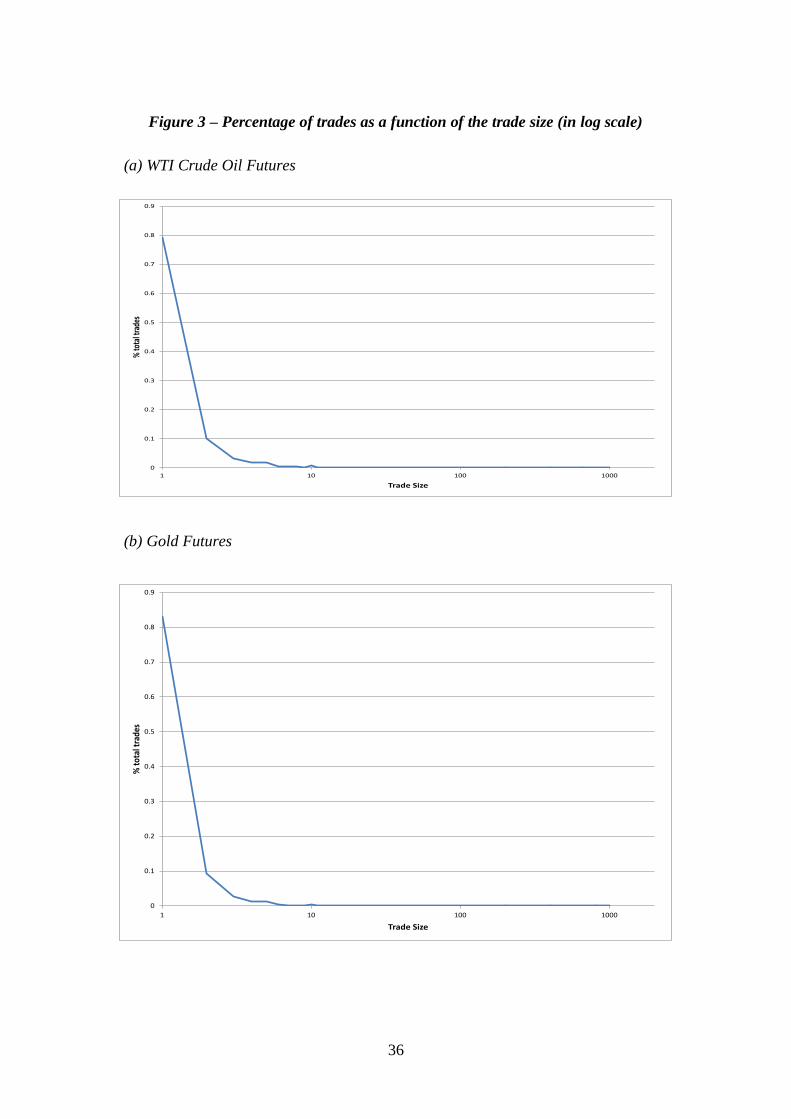
Trade sizes are also different with these contracts. The average trade size for
the WTI Oil is only 1.91 contracts per reported fill. The WTI Crude’s contract value
is typically about 50% more expensive than e-mini S&P500’s, as well as 49% more
volatile, so this smaller trade size may reflect the greater costs of transacting in the
WTI contract. The average trade size for Gold contract is smaller still, only 1.64
contracts per reported fill. Although the Gold contract is about as volatile as the e-
mini S&P500 Futures, its contract value is typically about 50% more expensive than
crude’s, and almost three times as expensive as e-mini’s.
Figure 3 plots the frequency of trades per trade size for WTI crude (panel A)
and for Gold Futures (panel B). Both contracts show a similar profile as the e-mini
contract, although trades are even more concentrated towards single units. In the WTI
contract, 83.02% of the trades were of size 1, while the corresponding number is
79.18% in the gold contract. As we found in the e-mini S&P500 Futures, the
frequency line quickly decays as a function of the trade size, with the exception of
round trade sizes.27
[FIGURE 3 HERE]
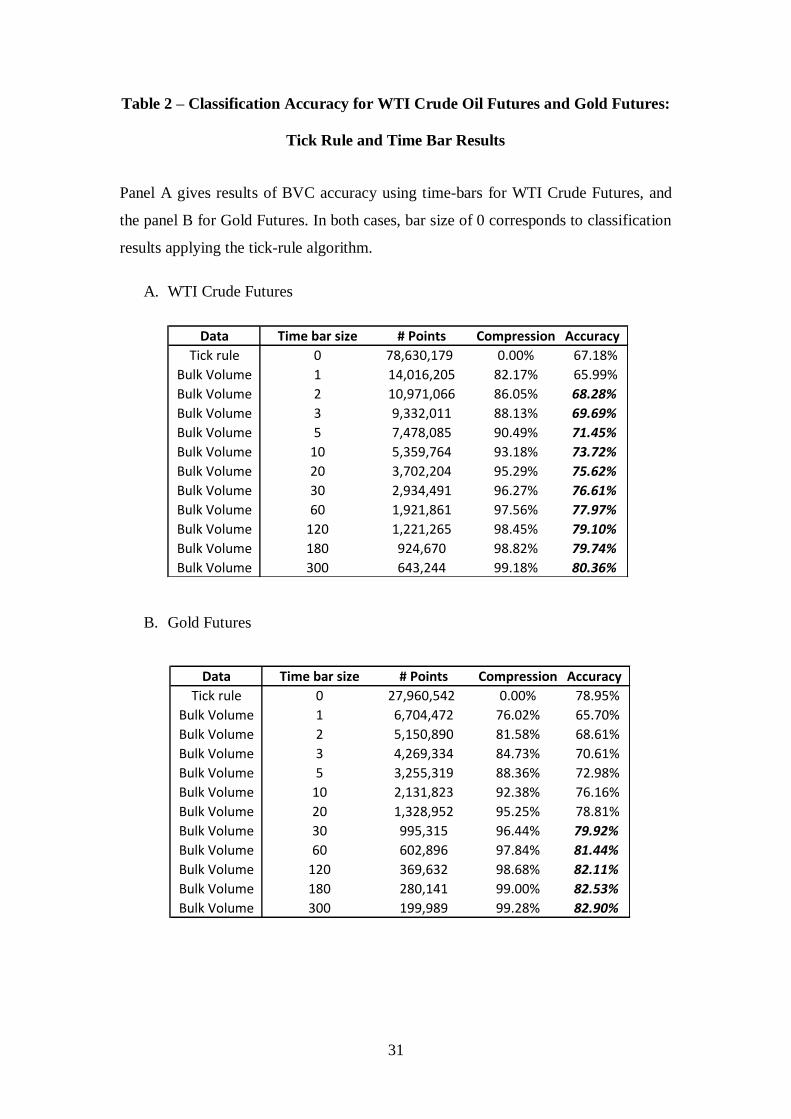
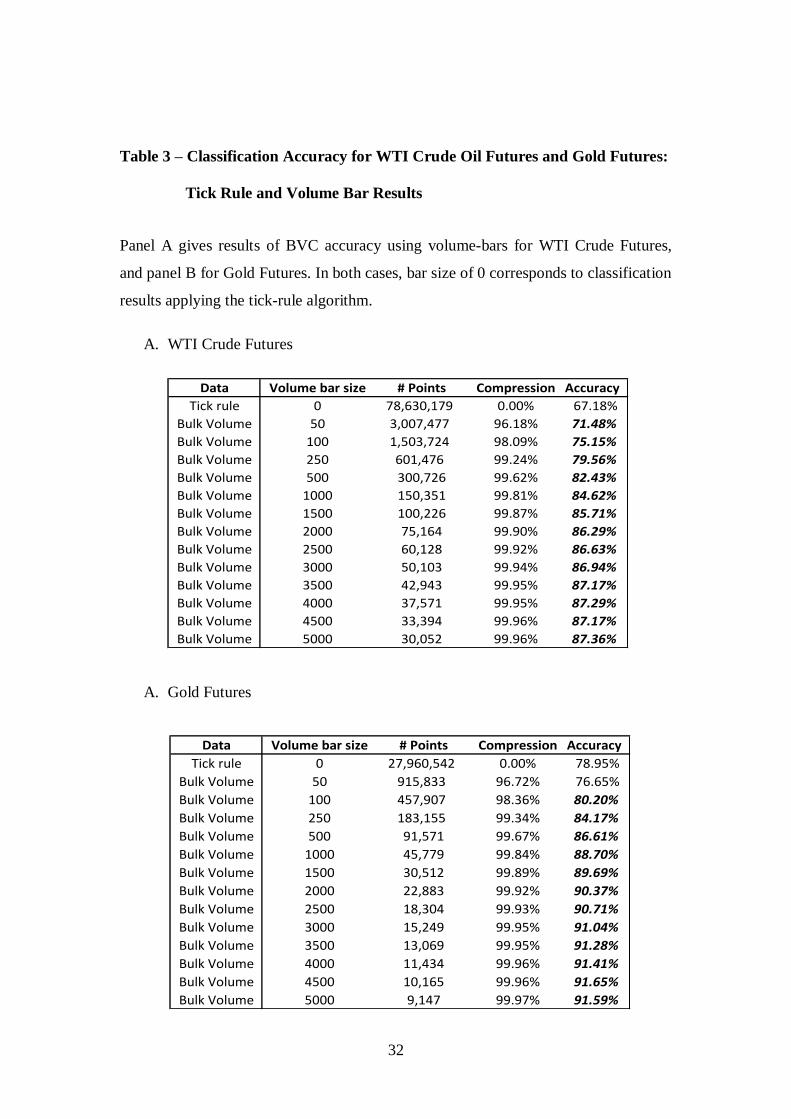
We compared the accuracy of tick rule versus BVC for the WTI Oil and Gold
Futures using time bars (Table 2) and volume bars (Table 3). As we conjectured, the
tick rule does appreciably worse in these contracts, correctly classifying 78.95% of
Gold contracts and only 67.18% of WTI contracts. By contrast, BVC can correctly
classify more than 91% of gold contracts (using volume bars; 82.9% using time bars)
and 87% of WTI contracts (volume bars, 80.3% using time bars). As was the case
with the e-mini Futures contract, volume bars outperform time bars, and both
outperform the tick rule.
27 Anyone coming to this market with sizes over one unit is telegraphing her/his urgency for acquiring
a position, and drawing the attention of predatory algorithms.
20
[TABLE 2 AND TABLE 3 HERE]
The Tables also show that this greater accuracy is available using a wide range
of time and volume bars. For gold Futures, BVC provides greater accuracy for time
bars of 30 seconds or higher and for volume bars of 100 contracts or higher. For WTI
Futures, the cut-offs are even lower, with time bars of 2 or more seconds and volume
bars of 50 or more contracts providing greater accuracy. The Tables also show the
significant compression of data available with BVC. Volume bars use just 1.62% of
the data to outperform the tick rule in Gold futures, and 3.82 % of the data to do so in
WTI futures. We interpret these results as confirming that BVC provides an accurate
and data efficient method for classifying trading activity in markets.
4. THE STABILITY OF CLASSIFICATION RESULTS
Market activity in futures contracts can differ significantly over time, reflecting both
differences in trader sentiment and technical factors such as the roll-over to a new
front contract. Trading activity may also be particularly high in times of market
stress. Our sample period includes August, 2011, a notable period when concerns
about the European sovereign debt crisis caused dramatic movements in markets
worldwide. A natural question to ask is how well do classification algorithms work in
these different market conditions?
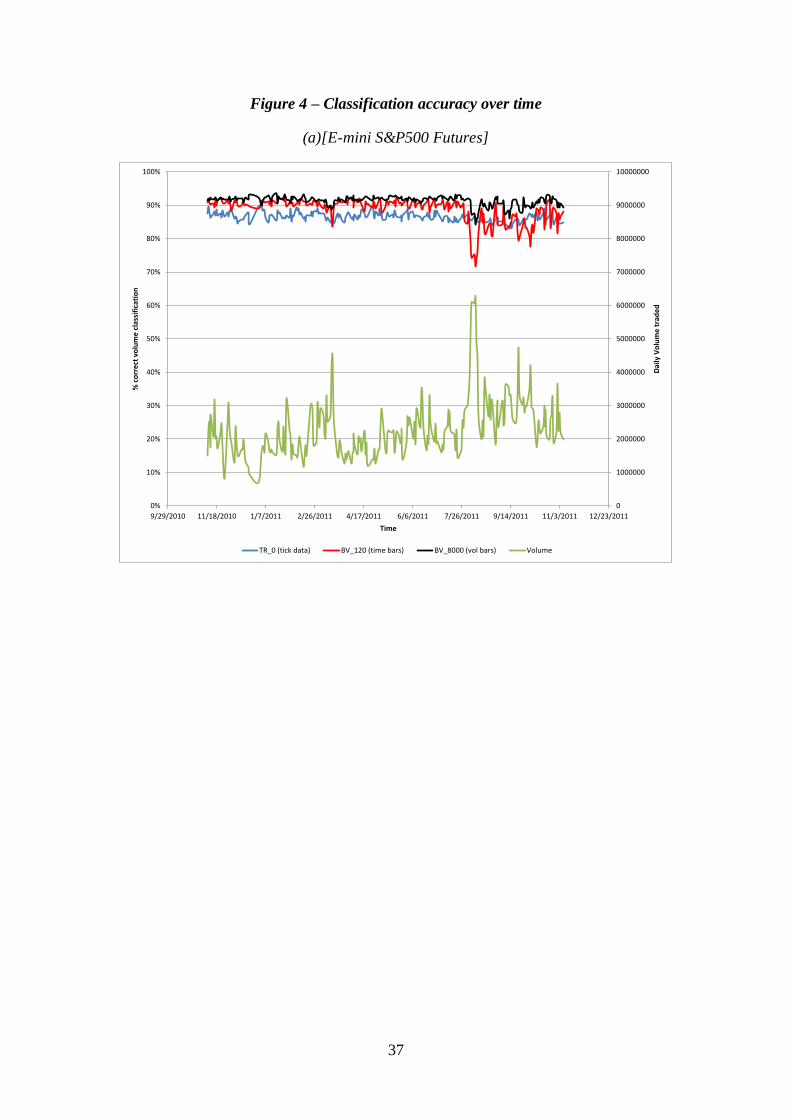
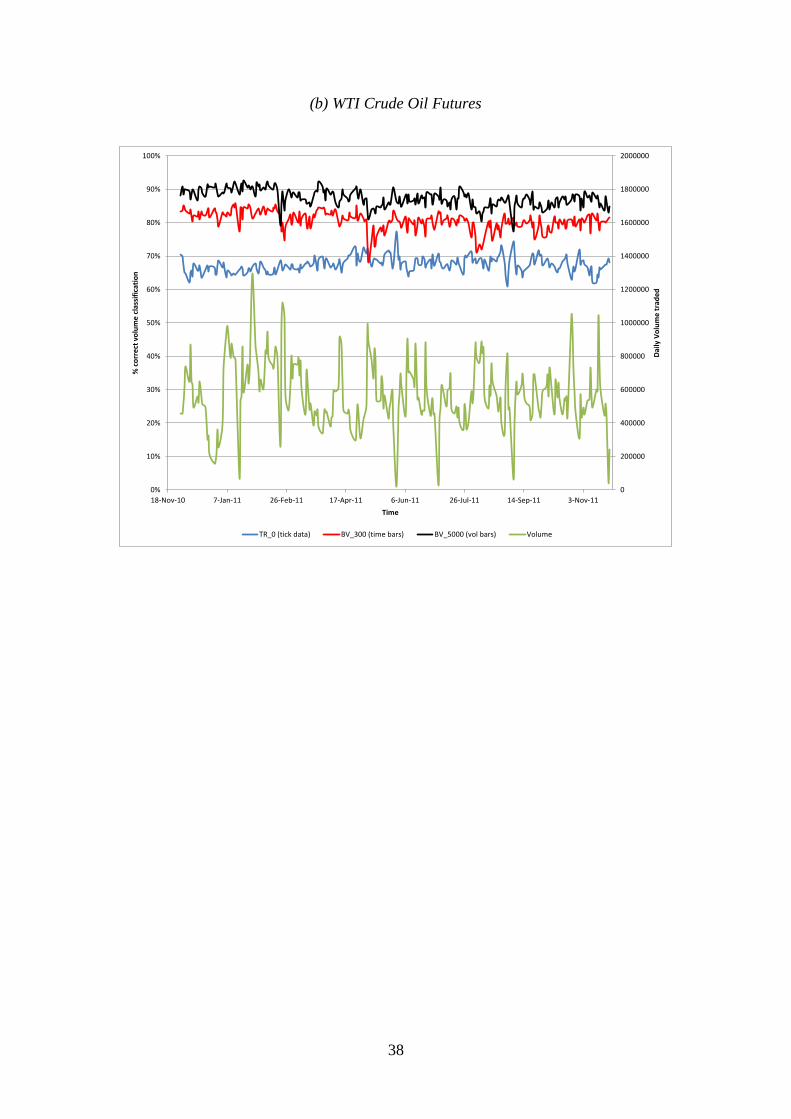
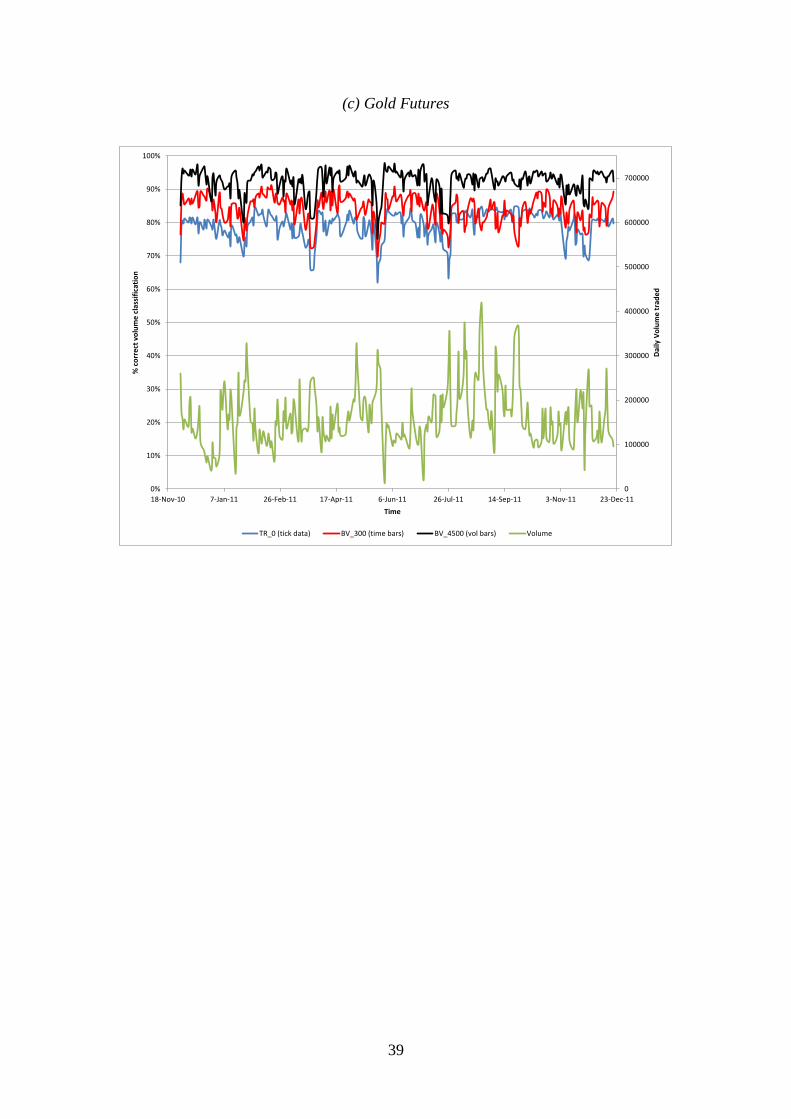
We calculated the daily accuracy of the tick-rule, BVC-volume bars, and
BVC-time bar for the e-mini, WTI oil futures, and gold futures over our sample
period. As the accuracy of the BVC method depends on time and volume bar
specifications, we selected those levels that maximized the BVC performance on
average as given in Tables 1-3. Thus, for the e-mini Futures contract we chose 2-
minute time bars and 8000 contract volume bars; for the WTI oil contract we chose 5-
21
minute time bars and 5000 contract volume bars, and for the Gold contract we chose
5-minute time bars and 4500 contract volume bars. Figure 4 Panels (a), (b), and (c)
plots these accuracy levels along with the daily volume level in each contract.
[FIGURE 4 HERE]
The data reveal a clear rank order: In general, BVC-volume bars provide the
highest classification accuracy across all three contracts and across virtually all
market conditions, followed by BVC-time bars, and then by tick-rule. For the e-mini,
BVC- Time bars beats the Tick-rule on 82.11% of days, and BVC-Volume bars beat
the Tick-rule on 99.19% of days. For WTI oil futures, BVC-Time bars beats the
Tick-rule on 99.61% of days, and BVC-Volume bars beat the Tick-rule on 100% of
days. Similarly, for Gold futures, BVC- Time bars beats the Tick-rule on 87.27% of
days, and BVC- Volume bars beats the Tick-rule on 100% of days.
All three algorithms tend to perform worse on highly active days. These
activity patterns differ across the contracts, with the e-Mini S&P 500 and Gold
Futures being particularly affected by the sovereign debt crisis in August. On August
9th
, the e-Mini S&P500 futures hit its highest volume level in the history of the
contract. This extraordinary volume resulted in a degradation of BVC relative
accuracy: BVC-Time bars did noticeably worse than Tick-rule (71.68% vs. 85.89%),
while BVC-Volume bars correctly classified 84.33% of the volume, about the same as
Tick-rule. Overall, however, the relative ranking among algorithm accuracy appears
reasonably robust to market activity, and this is particularly true for the WTI oil future
and gold future contracts.
An interesting feature revealed by Figure 4 is a spike down in classification
accuracy for all three methods, around 11/23/10, 01/26/11, 03/25/11, 05/25/11,
07/25/11 and 11/23/11. These are not arbitrary dates; they coincide with the sessions
22
around which volume shifts from one front contract to the next (a.k.a. rolling dates).
Trade on these dates is dominated by large calendar trades, typically executed through
exchange guaranteed spreads, impacting two books in opposite directions. In order to
avoid this phenomenon, we recommend excluding such dates for the purpose of trade
classification.
5. USING THE EMPIRICAL DISTRIBUTION OF PRICE CHANGES
The bulk volume classification procedure described in Eq.(1) treats price changes
as if they are distributed i.i.d. with
( ) (3)
This normality assumption is a simplification that obviates the need to compute the
empirical distribution of price changes. Alternatively, we could compute the true CDF
of price changes, F, and then define an alternative bulk volume classification
procedure, BVC2, whereby
( )
[ ( )]
(4)
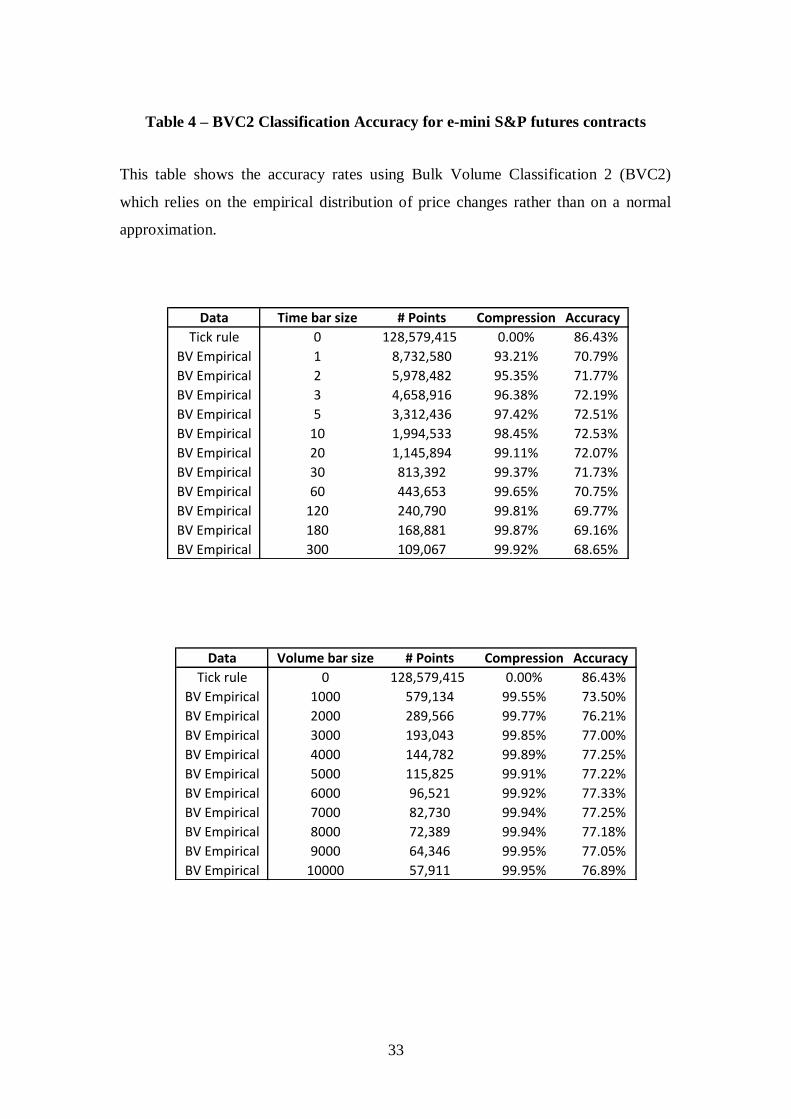
There are a several features of Eq.(4) that lead us to suspect that it will not
deliver a particularly accurate classification. First, we are no longer assuming that
( )
. In fact, ( )
. This may be the result of a bullish trend over a particular
subsample that is not canceled by a bearish trend over another subsample with our
23
data set. Using the actual distribution of price change would allow that phenomenon
to condition our volume classification over the entire sample. Similarly, price gaps
originated at particular events, like Nonfarm payroll releases, will introduce
significant skewness and kurtosis into the distribution that will condition the entire
sample. Because Eq.(4) incorporates more sample information than Eq.(1), the impact
of these subsample effects will be more prevalent in BVC2 than in BVC. Finally,
is not continuous due to fixed tick sizes, making F a highly discretized
distribution. The accuracy results, reported in Table 4, confirm this intuition. The
BVC2 biases classification algorithm is much less effective in classifying trading
volume than the BVC algorithm. Thus it does not appear to be productive to use the
actual distribution of price changes.
[TABLE 4]
6. CONCLUSIONS
It may seem counterintuitive to expect greater accuracy from lower data granularity,
but in fact bulk measurements have proven more accurate in a number of settings,
such as bulk weighting and counting. Inspired by this principle, we propose a new
Bulk Classification algorithm to identify the aggressor side of a collection of trades.
This departs from previous attempts in the literature, which targeted classifying
individual trades. Instead, for a given set of trades bundled in bars, we label a fraction
of the volume as buys and the remainder as sells.
Bundling ticks in terms of time bars allows the researcher to work with a small
fraction of the original tick dataset (only 0.35% for 1-minute bars in the e-mini S&P
500 Futures). Most researchers would prefer working with 0.35% of a dataset
composed of hundreds of millions of records, as long as there is no substantial loss of
24
accuracy. What we have found is that, for the purpose of volume classification, BVC
of Time and Volume bars is more accurate than the Tick Rule of tick data. That more
information can be extracted from less data granularity has important theoretical
implications for studies of high frequency market microstructure, and of course
presents an important practical advantage for researchers not accustomed to dealing
with large databases.
We caution against overreaching the implications of these findings. Tick-
based classification still has a place in addressing a number of questions. For
example, a researcher may be more interested in classifying a particular set of non-
contiguous trades, which cannot be bundled in bars, like the activity of a particular
market participant (revealed through FIX tag 50, where available). With trading now
dominated by computer algorithms, however, trading is rapidly converging to single
trade sizes. Order splitting is now the norm, and researchers interested in discerning
trading intentions may find using time or volume bars a more natural unit of analysis
than individual trades for a wide range of issues. We encourage researchers to
investigate whether a principle similar to bulk estimation can be successfully applied
to other computational problems in high frequency markets.
One additional issue to consider is that researchers often want to classify
trades as buys or sells in order to infer information-based trade. In cases in which
trade occurred primarily through a specialist posting bid and ask prices that outsiders
hit this classification could provide insight into informed trading. But in electronic
limit order book markets this inference is far less obvious. Eisler, Bouchaud and
Kockelkoren [2011] make the point that informed traders may choose to place limit
orders, aiming at decreasing execution costs. In that case, which side is the aggressor
on an individual trade does not necessarily reveal which side is informed although the

25
overall buy and sell volumes should. Thus, in addition to providing a parsimonious
approach to trade classification, BVC could potentially be even more informative than
aggressor flags for the purpose of determining informational asymmetry.
26
REFERENCES
Aitken, M. and A. Frino, 1996, The accuracy of the tick test: Evidence from the
Australian Stock Exchange, Journal of Banking and Finance, 20, 1715-1729
Ané, T., and H. Geman, 2000, Order Flow, Transaction Clock and Normality of Asset
Returns. Journal of Finance 55:2259–84.
Asquith, P., R. Oman and C. Safaya, 2010, Short Sales and Trade Classification
Algorithms, Journal of Financial Markets, 13, 157-173.
Bethel, W., D. Leinweber, O. Ruebel and K. Wu, 2011, Federal Market Information
Technology in the Post Flash Crash Era: Roles for Supercomputing,
http://ssrn.com/abstract=1939522
Chakrabarty, B., P. C. Moulton, and A. Shkilko, 2012, Short Sales, Long Sales, and
the Lee-Ready Trade Classification Algorithm Revisited, Journal of Financial
Markets, forthcoming.
Clark, P. K., 1973, A Subordinated Stochastic Process Model with Finite Variance for
Speculative Prices. Econometrica 41:135–55.
Easley, D., M. López de Prado and M. O’Hara, 2011a, The Microstructure of the
Flash Crash, Journal of Portfolio Management, Winter.
http://ssrn.com/abstract=1695041
. Easley, D., M. López de Prado and M. O’Hara2011b, Flow Toxicity and Liquidity in
a High Frequency World, Review of Financial Studies, Forthcoming.
http://ssrn.com/abstract=1695596
Easley, D., M. López de Prado and M. O’Hara, 2012, The Volume Clock: Insights
into the High Frequency Paradigm, Working Paper,
27
Eisler, Zoltan, J.-P. Bouchaud and J. Kockelkoren, 2011, The Impact of order book
events: Market orders, limit orders and cancellations, working paper, August.
http://ssrn.com/abstract=1373762
Ellis, K., R. Michaely and M. O’Hara, 2000, The Accuracy of Trade Classification
Rules: Evidence from Nasdaq, Journal of Financial and Quantitative Analysis,
35(4), December.
Hasbrouck, J. and G. Saar, 2009, Technology and Liquidity Provision: The Blurring
of Traditional Definitions, Journal of Financial Markets.
Holden, C. and S. Jacobsen, 2011, The Breakdown of Standard Microstructure
Techniques and What to Do About It, Working paper.
Lee, C. and M. Ready, 1991, Inferring Trade Direction from Intraday Data, Journal
of Finance, 46, 733-746.
Mandlebrot, B., and M. Taylor, 1967, On the Distribution of Stock Price Differences.
Operations Research 15(5):1057–62.
Mosteller, F., 1965, Fifty challenging problems in probability with solutions, Dover
Publications, pp.79-80.
Odders-White, E., 2000, On the Occurrence and Consequences of Inaccurate Trade
Classification, Journal of Financial Markets, 3, 259-286.
O’Hara, M., 1995, Market Microstructure Theory, Blackwell.
28
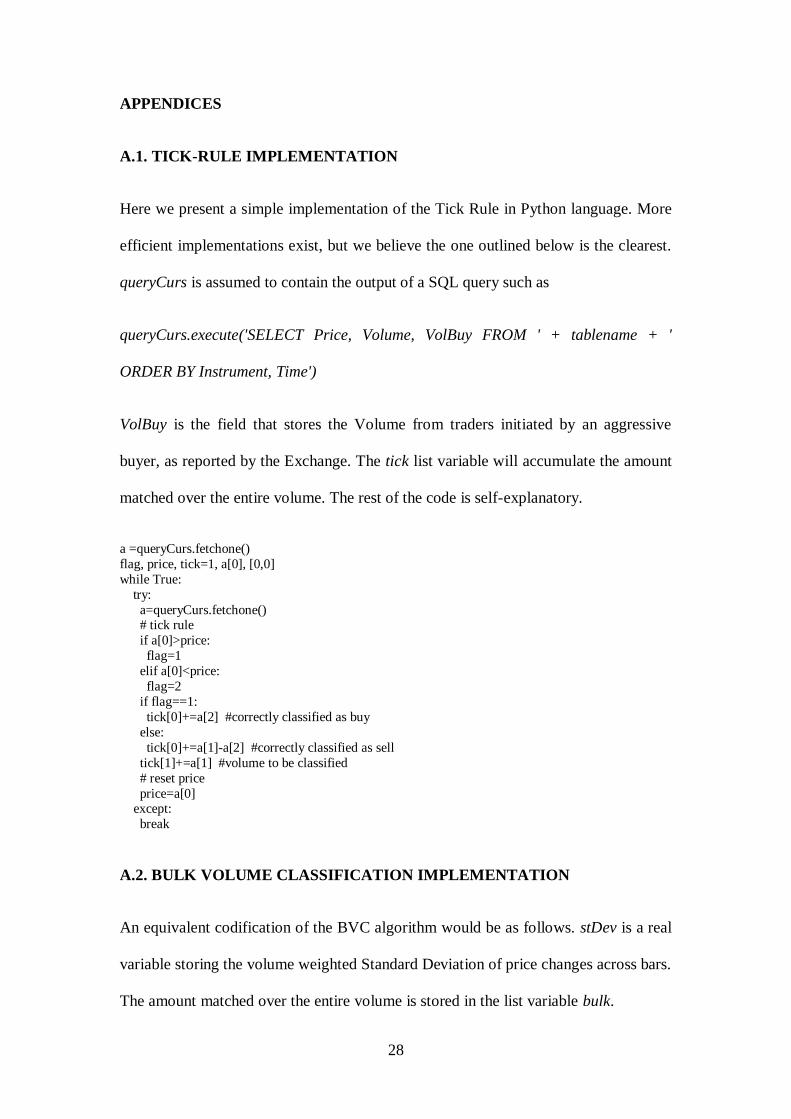
APPENDICES
A.1. TICK-RULE IMPLEMENTATION
Here we present a simple implementation of the Tick Rule in Python language. More
efficient implementations exist, but we believe the one outlined below is the clearest.
queryCurs is assumed to contain the output of a SQL query such as
queryCurs.execute('SELECT Price, Volume, VolBuy FROM ' + tablename + '
ORDER BY Instrument, Time')
VolBuy is the field that stores the Volume from traders initiated by an aggressive
buyer, as reported by the Exchange. The tick list variable will accumulate the amount
matched over the entire volume. The rest of the code is self-explanatory.
a =queryCurs.fetchone()
flag, price, tick=1, a[0], [0,0]
while True:
try:
a=queryCurs.fetchone() # tick rule
if a[0]>price:
flag=1
elif a[0]<price:
flag=2
if flag==1:
tick[0]+=a[2] #correctly classified as buy
else:
tick[0]+=a[1]-a[2] #correctly classified as sell
tick[1]+=a[1] #volume to be classified
# reset price
price=a[0] except:
break
A.2. BULK VOLUME CLASSIFICATION IMPLEMENTATION
An equivalent codification of the BVC algorithm would be as follows. stDev is a real
variable storing the volume weighted Standard Deviation of price changes across bars.
The amount matched over the entire volume is stored in the list variable bulk.

29
a =queryCurs.fetchone()
price, bulk=a[0], [0,0]
while True:
try:
a=queryCurs.fetchone()
# bulk classification z=float(a[0]-price)/stDev
z=scipy.stats.norm.cdf(z)
bulk[0]+=min(a[1]*z,a[2]) #correctly classified as buy
bulk[0]+=min(a[1]*(1-z),a[1]-a[2]) #correctly classified as sell
bulk[1]+=a[1] #volume to be classified
# reset price
price=a[0]
except:
break
30
TABLES
Table 1 – Classification Accuracy for e-mini S&P futures contracts
The upper panel gives results of BVC accuracy using time-bars, while the lower panel
gives the same results using volume-bars. In both cases, bar size of 0 corresponds to
classification results applying the tick-rule algorithm.
Data Time bar size # Points Compression Accuracy
Tick rule 0 128,579,415 0.00% 86.43%
Bulk Volume 1 8,732,580 93.21% 74.05%
Bulk Volume 2 5,978,482 95.35% 76.06%
Bulk Volume 3 4,658,916 96.38% 77.35%
Bulk Volume 5 3,312,436 97.42% 79.18%
Bulk Volume 10 1,994,533 98.45% 81.67%
Bulk Volume 20 1,145,894 99.11% 84.09%
Bulk Volume 30 813,392 99.37% 85.20%
Bulk Volume 60 443,653 99.65% 86.61%
Bulk Volume 120 240,790 99.81% 87.60%
Bulk Volume 180 168,881 99.87% 87.56%
Bulk Volume 300 109,067 99.92% 87.35%
Data Volume bar size # Points Compression Accuracy
Tick rule 0 128,579,415 0.00% 86.43%
Bulk Volume 1000 579,134 99.55% 82.40%
Bulk Volume 2000 289,566 99.77% 86.23%
Bulk Volume 3000 193,043 99.85% 87.81%
Bulk Volume 4000 144,782 99.89% 88.47%
Bulk Volume 5000 115,825 99.91% 89.21%
Bulk Volume 6000 96,521 99.92% 89.99%
Bulk Volume 7000 82,730 99.94% 90.10%
Bulk Volume 8000 72,389 99.94% 91.00%
Bulk Volume 9000 64,346 99.95% 90.38%
Bulk Volume 10000 57,911 99.95% 90.72%
31
Table 2 – Classification Accuracy for WTI Crude Oil Futures and Gold Futures:
Tick Rule and Time Bar Results
Panel A gives results of BVC accuracy using time-bars for WTI Crude Futures, and
the panel B for Gold Futures. In both cases, bar size of 0 corresponds to classification
results applying the tick-rule algorithm.
A. WTI Crude Futures
B. Gold Futures
Data Time bar size # Points Compression Accuracy
Tick rule 0 78,630,179 0.00% 67.18%
Bulk Volume 1 14,016,205 82.17% 65.99%
Bulk Volume 2 10,971,066 86.05% 68.28%
Bulk Volume 3 9,332,011 88.13% 69.69%
Bulk Volume 5 7,478,085 90.49% 71.45%
Bulk Volume 10 5,359,764 93.18% 73.72%
Bulk Volume 20 3,702,204 95.29% 75.62%
Bulk Volume 30 2,934,491 96.27% 76.61%
Bulk Volume 60 1,921,861 97.56% 77.97%
Bulk Volume 120 1,221,265 98.45% 79.10%
Bulk Volume 180 924,670 98.82% 79.74%
Bulk Volume 300 643,244 99.18% 80.36%
Data Time bar size # Points Compression Accuracy
Tick rule 0 27,960,542 0.00% 78.95%
Bulk Volume 1 6,704,472 76.02% 65.70%
Bulk Volume 2 5,150,890 81.58% 68.61%
Bulk Volume 3 4,269,334 84.73% 70.61%
Bulk Volume 5 3,255,319 88.36% 72.98%
Bulk Volume 10 2,131,823 92.38% 76.16%
Bulk Volume 20 1,328,952 95.25% 78.81%
Bulk Volume 30 995,315 96.44% 79.92%
Bulk Volume 60 602,896 97.84% 81.44%
Bulk Volume 120 369,632 98.68% 82.11%
Bulk Volume 180 280,141 99.00% 82.53%
Bulk Volume 300 199,989 99.28% 82.90%
32
Table 3 – Classification Accuracy for WTI Crude Oil Futures and Gold Futures:
Tick Rule and Volume Bar Results
Panel A gives results of BVC accuracy using volume-bars for WTI Crude Futures,
and panel B for Gold Futures. In both cases, bar size of 0 corresponds to classification
results applying the tick-rule algorithm.
A. WTI Crude Futures
A. Gold Futures
Data Volume bar size # Points Compression Accuracy
Tick rule 0 78,630,179 0.00% 67.18%
Bulk Volume 50 3,007,477 96.18% 71.48%
Bulk Volume 100 1,503,724 98.09% 75.15%
Bulk Volume 250 601,476 99.24% 79.56%
Bulk Volume 500 300,726 99.62% 82.43%
Bulk Volume 1000 150,351 99.81% 84.62%
Bulk Volume 1500 100,226 99.87% 85.71%
Bulk Volume 2000 75,164 99.90% 86.29%
Bulk Volume 2500 60,128 99.92% 86.63%
Bulk Volume 3000 50,103 99.94% 86.94%
Bulk Volume 3500 42,943 99.95% 87.17%
Bulk Volume 4000 37,571 99.95% 87.29%
Bulk Volume 4500 33,394 99.96% 87.17%
Bulk Volume 5000 30,052 99.96% 87.36%
Data Volume bar size # Points Compression Accuracy
Tick rule 0 27,960,542 0.00% 78.95%
Bulk Volume 50 915,833 96.72% 76.65%
Bulk Volume 100 457,907 98.36% 80.20%
Bulk Volume 250 183,155 99.34% 84.17%
Bulk Volume 500 91,571 99.67% 86.61%
Bulk Volume 1000 45,779 99.84% 88.70%
Bulk Volume 1500 30,512 99.89% 89.69%
Bulk Volume 2000 22,883 99.92% 90.37%
Bulk Volume 2500 18,304 99.93% 90.71%
Bulk Volume 3000 15,249 99.95% 91.04%
Bulk Volume 3500 13,069 99.95% 91.28%
Bulk Volume 4000 11,434 99.96% 91.41%
Bulk Volume 4500 10,165 99.96% 91.65%
Bulk Volume 5000 9,147 99.97% 91.59%
33
Table 4 – BVC2 Classification Accuracy for e-mini S&P futures contracts
This table shows the accuracy rates using Bulk Volume Classification 2 (BVC2)
which relies on the empirical distribution of price changes rather than on a normal
approximation.
Data Time bar size # Points Compression Accuracy
Tick rule 0 128,579,415 0.00% 86.43%
BV Empirical 1 8,732,580 93.21% 70.79%
BV Empirical 2 5,978,482 95.35% 71.77%
BV Empirical 3 4,658,916 96.38% 72.19%
BV Empirical 5 3,312,436 97.42% 72.51%
BV Empirical 10 1,994,533 98.45% 72.53%
BV Empirical 20 1,145,894 99.11% 72.07%
BV Empirical 30 813,392 99.37% 71.73%
BV Empirical 60 443,653 99.65% 70.75%
BV Empirical 120 240,790 99.81% 69.77%
BV Empirical 180 168,881 99.87% 69.16%
BV Empirical 300 109,067 99.92% 68.65%
Data Volume bar size # Points Compression Accuracy
Tick rule 0 128,579,415 0.00% 86.43%
BV Empirical 1000 579,134 99.55% 73.50%
BV Empirical 2000 289,566 99.77% 76.21%
BV Empirical 3000 193,043 99.85% 77.00%
BV Empirical 4000 144,782 99.89% 77.25%
BV Empirical 5000 115,825 99.91% 77.22%
BV Empirical 6000 96,521 99.92% 77.33%
BV Empirical 7000 82,730 99.94% 77.25%
BV Empirical 8000 72,389 99.94% 77.18%
BV Empirical 9000 64,346 99.95% 77.05%
BV Empirical 10000 57,911 99.95% 76.89%
34
FIGURES
Figure 1 – Percentage of trades as a function of the trade size (in log scale)
[E-mini S&P500 futures]
0
0.1
0.2
0.3
0.4
0.5
1 10 100 1000
% t
ota
l tra
des
Trade Size
35
Figure 2 – Compression of data in the E-mini for various time and volume bars
100,000
1,000,000
10,000,000
100,000,000
1,000,000,000
0 50 100 150 200 250 300
Nu
mb
er o
f re
cord
s (l
og
scal
e)
Size of the Time Bar (in seconds)
50,000
500,000
5,000,000
50,000,000
500,000,000
0 1000 2000 3000 4000 5000 6000 7000 8000 9000 10000
Nu
mb
er o
f re
cord
s (l
og
scal
e)
Size of the Volume Bars (in number of contracts traded)
36
Figure 3 – Percentage of trades as a function of the trade size (in log scale)
(a) WTI Crude Oil Futures
(b) Gold Futures
0
0.1
0.2
0.3
0.4
0.5
0.6
0.7
0.8
0.9
1 10 100 1000
% to
tal t
rade
s
Trade Size
0
0.1
0.2
0.3
0.4
0.5
0.6
0.7
0.8
0.9
1 10 100 1000
% t
otal
trad
es
Trade Size
37
Figure 4 – Classification accuracy over time
(a)[E-mini S&P500 Futures]
0
1000000
2000000
3000000
4000000
5000000
6000000
7000000
8000000
9000000
10000000
0%
10%
20%
30%
40%
50%
60%
70%
80%
90%
100%
9/29/2010 11/18/2010 1/7/2011 2/26/2011 4/17/2011 6/6/2011 7/26/2011 9/14/2011 11/3/2011 12/23/2011
Dai
ly V
olu
me
tra
de
d
% c
orr
ect
vo
lum
e c
lass
ific
atio
n
Time
TR_0 (tick data) BV_120 (time bars) BV_8000 (vol bars) Volume
38
(b) WTI Crude Oil Futures
0
200000
400000
600000
800000
1000000
1200000
1400000
1600000
1800000
2000000
0%
10%
20%
30%
40%
50%
60%
70%
80%
90%
100%
18-Nov-10 7-Jan-11 26-Feb-11 17-Apr-11 6-Jun-11 26-Jul-11 14-Sep-11 3-Nov-11
Dai
ly V
olu
me
tra
de
d
% c
orr
ect
vo
lum
e c
lass
ific
atio
n
Time
TR_0 (tick data) BV_300 (time bars) BV_5000 (vol bars) Volume
39
(c) Gold Futures
0
100000
200000
300000
400000
500000
600000
700000
0%
10%
20%
30%
40%
50%
60%
70%
80%
90%
100%
18-Nov-10 7-Jan-11 26-Feb-11 17-Apr-11 6-Jun-11 26-Jul-11 14-Sep-11 3-Nov-11 23-Dec-11
Dai
ly V
olu
me
tra
de
d
% c
orr
ect
vo
lum
e c
lass
ific
atio
n
Time
TR_0 (tick data) BV_300 (time bars) BV_4500 (vol bars) Volume

40
DISCLAIMER
The views expressed in this paper are those of the authors and not necessarily reflect
those of Tudor Investment Corporation. No investment decision or particular course
of action is recommended by this paper.