Embed Size (px)
Citation preview
1
Bulgarian Academy of Sciences. 22 July, 2008
Index
• Introduction
• Outline of the scheme
• Step 1. Individual weights
• Step 2. Preference aggregation
• Step 3. Determination of the indicators
• Step 4. Final aggregation
• Conclusions
End

2
Bulgarian Academy of Sciences. 22 July, 2008
Introduction
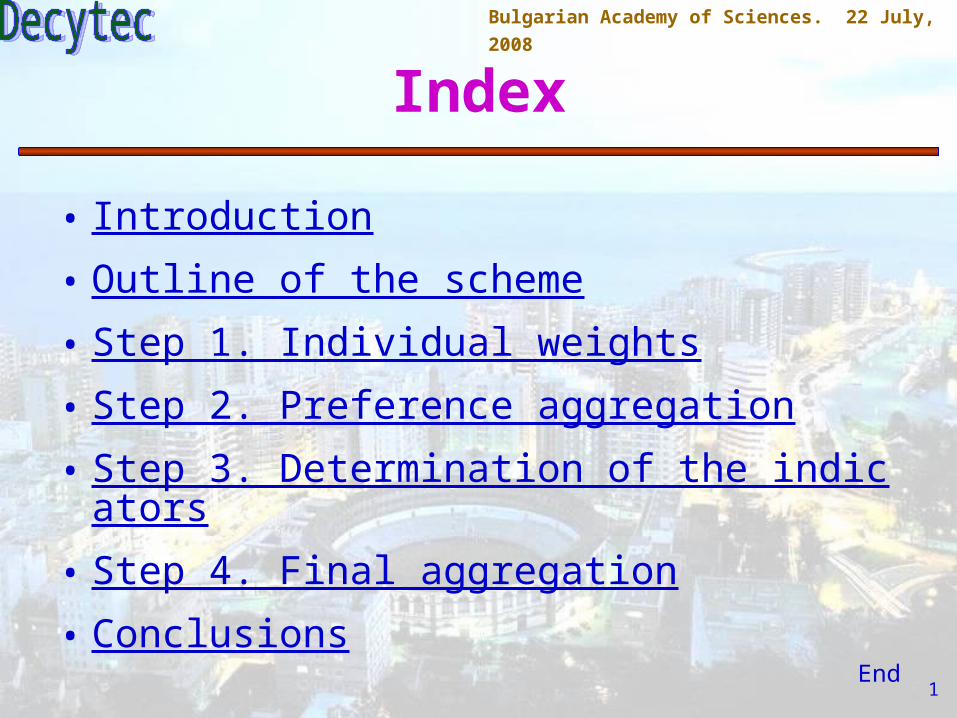
• Sustainable development (Brundtland Commision, 1987): development that meets the needs of the present without compromising the ability of future generations to meet their own needs.
• This is, by nature, a multicriteria concept.
3
Bulgarian Academy of Sciences. 22 July, 2008
Introduction
Sustainability
Social
Economic Environmental

4
Bulgarian Academy of Sciences. 22 July, 2008
Introduction
Natural capital vs. Man-made capital.• Weak sustainability. Total capital
constant. Substitutability paradigm.• Strong sustainability. Natural capital and
man-made capital are (at the most) complementary. Non substitutability paradigm.

5
Bulgarian Academy of Sciences. 22 July, 2008
Introduction
• Life cycle assesment. Environmental performance of production and services through all phases of their life cycle (from craddle to tomb): Extracting and processing raw materials; manufacturing; transportation and distribution; use, reuse and maintainance; recycling; final disposal.
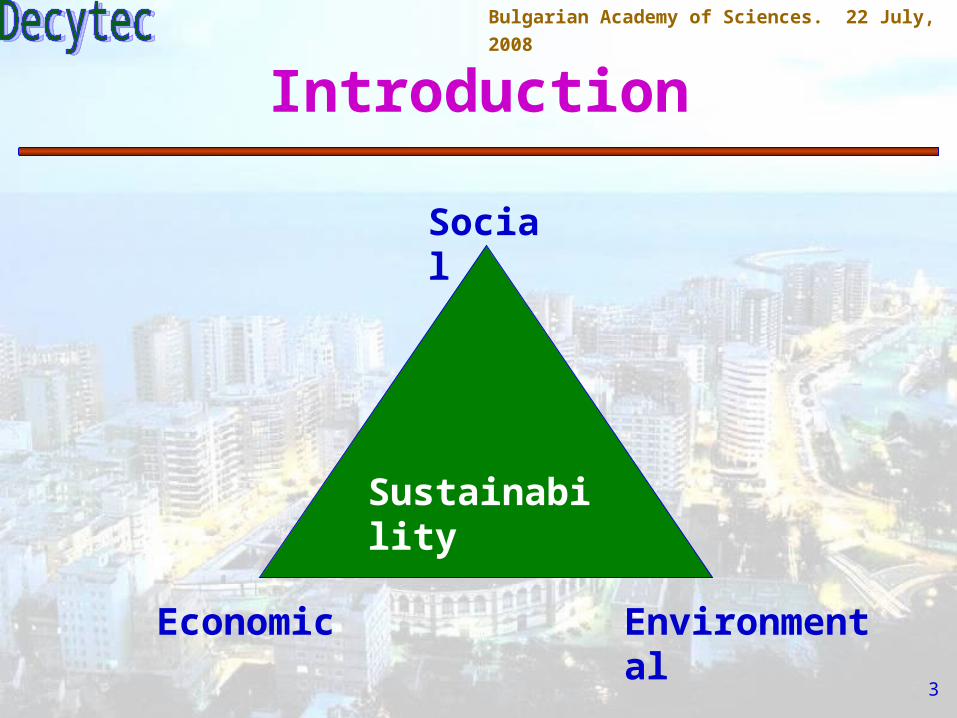
How to measure sustainability?
6
Bulgarian Academy of Sciences. 22 July, 2008
Introduction
• Ecological footprint. Estimate of the ammount of land area a human population, given prevailing technology, would need if the current resource consumption and pollution by the population is matched by the sustainable (renewable) resource production and waste asimilation by such a land area.
How to measure sustainability?

7
Bulgarian Academy of Sciences. 22 July, 2008
Introduction
• (Urban) Indicators. A set of magnitudes measuring different concrete aspects of sustainability. Over 200 indicators are presently used.
• Still to be done:– To define a full common framework (meningful and
comparable),– To actually measure them,– To develop synthetic urban sustainability indicators.
How to measure sustainability?
8
Bulgarian Academy of Sciences. 22 July, 2008
Introduction
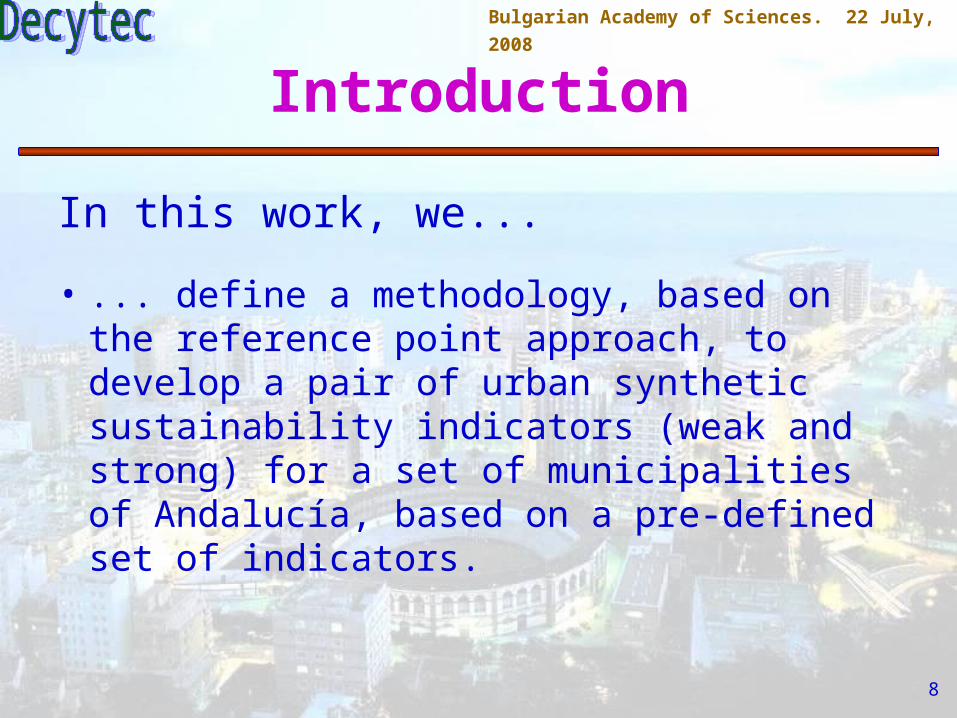
• ... define a methodology, based on the reference point approach, to develop a pair of urban synthetic sustainability indicators (weak and strong) for a set of municipalities of Andalucía, based on a pre-defined set of indicators.
In this work, we...
9
Bulgarian Academy of Sciences. 22 July, 2008
Outline of the scheme
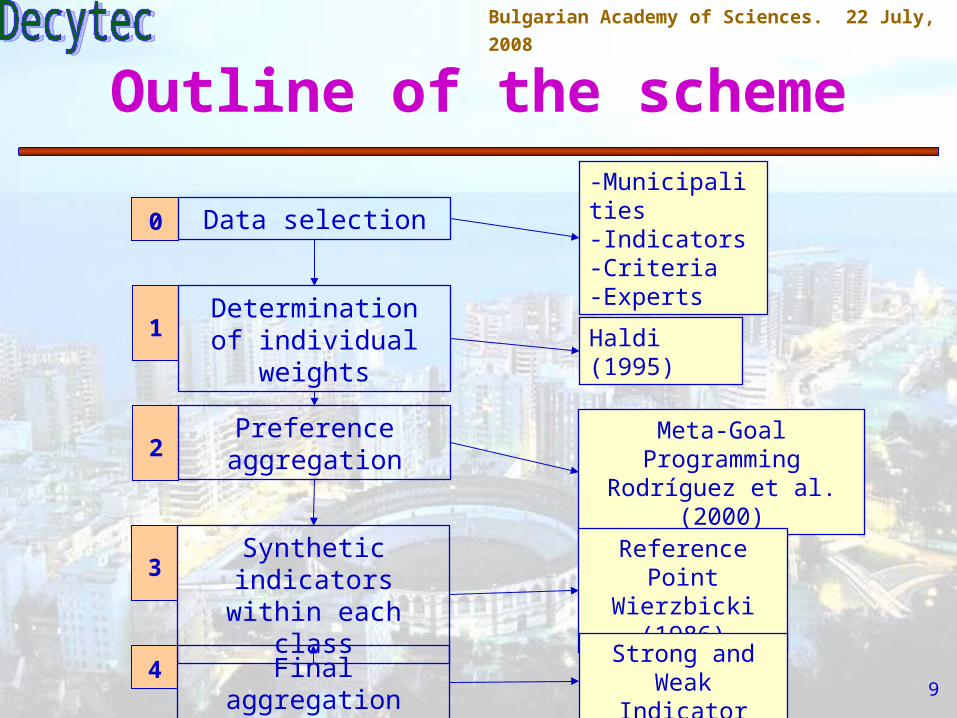
Data selection0
Determination of individual weights1
Preference aggregation2
Synthetic indicators within each class3
Final aggregation4
-Municipalities-Indicators-Criteria-Experts
Haldi (1995)
Meta-Goal ProgrammingRodríguez et al. (2000)
Reference PointWierzbicki (1986)
Strong and Weak Indicator
10
Bulgarian Academy of Sciences. 22 July, 2008
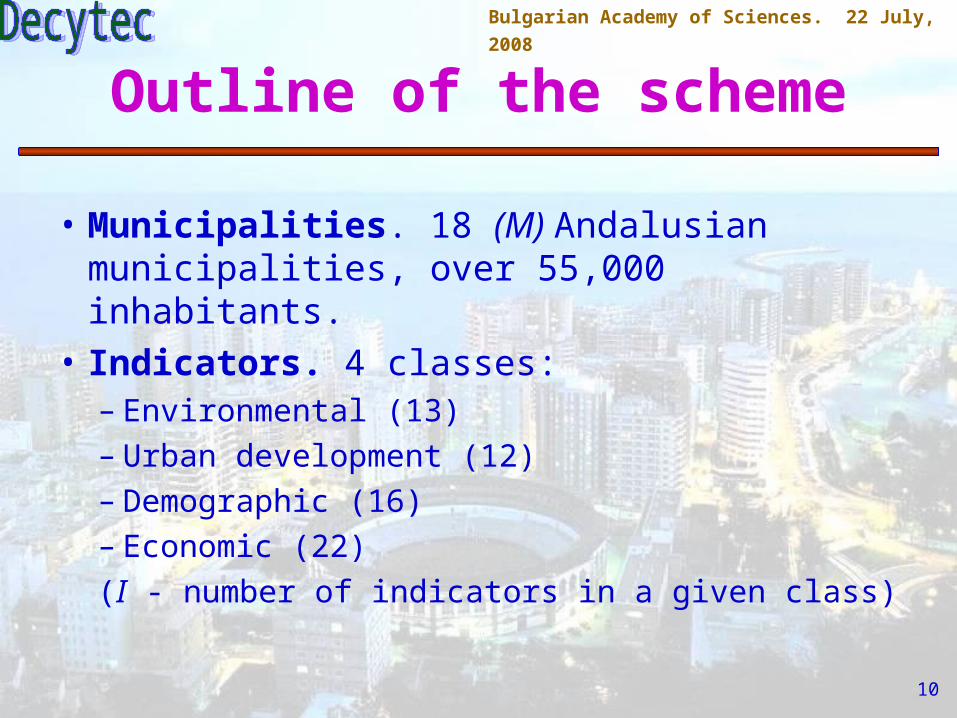
• Municipalities. 18 (M) Andalusian municipalities, over 55,000 inhabitants.
• Indicators. 4 classes:– Environmental (13)– Urban development (12)– Demographic (16)– Economic (22)
(I - number of indicators in a given class)
Outline of the scheme
11
Bulgarian Academy of Sciences. 22 July, 2008
Outline of the scheme
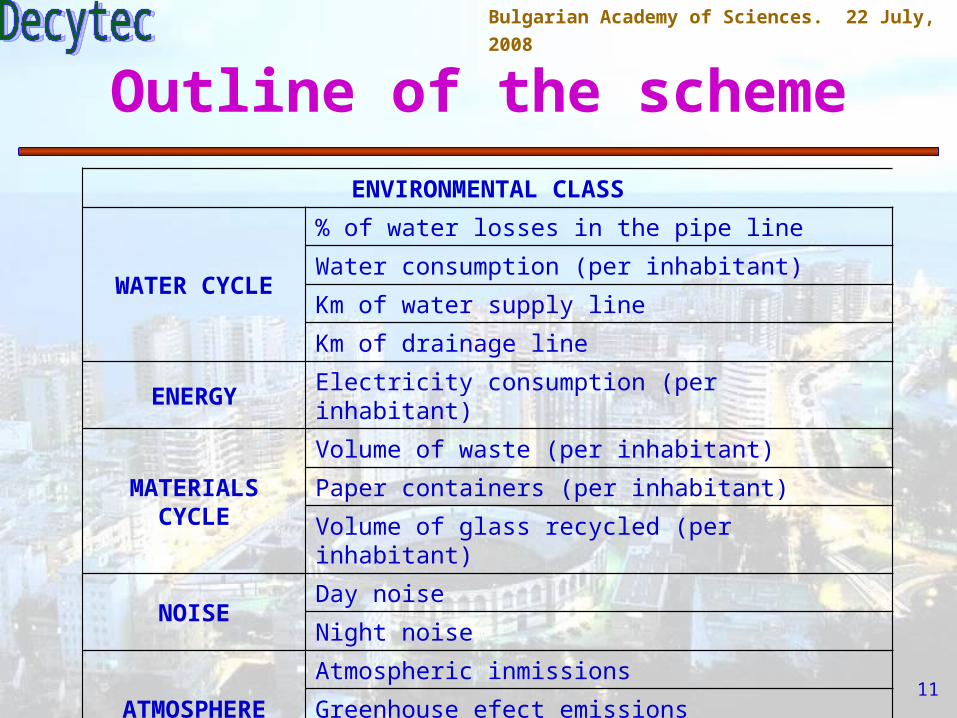
ENVIRONMENTAL CLASS
WATER CYCLE
% of water losses in the pipe line
Water consumption (per inhabitant)
Km of water supply line
Km of drainage line
ENERGY Electricity consumption (per inhabitant)
MATERIALS CYCLE
Volume of waste (per inhabitant)
Paper containers (per inhabitant)
Volume of glass recycled (per inhabitant)
NOISEDay noise
Night noise
ATMOSPHERE
Atmospheric inmissions
Greenhouse efect emissions
Global emissions

12
Bulgarian Academy of Sciences. 22 July, 2008
• Criteria. The indicators are to be maximized or minimized– Some are clear (e.g. % of water loss)– Others are not so clear (e.g. Paper
containers/inhabitant, electricity consumption)
• Panel of experts. 6 experts (ND):– 2 Environmental – 2 Social– 2 Economic
Outline of the scheme
13
Bulgarian Academy of Sciences. 22 July, 2008
1. Individual Weights
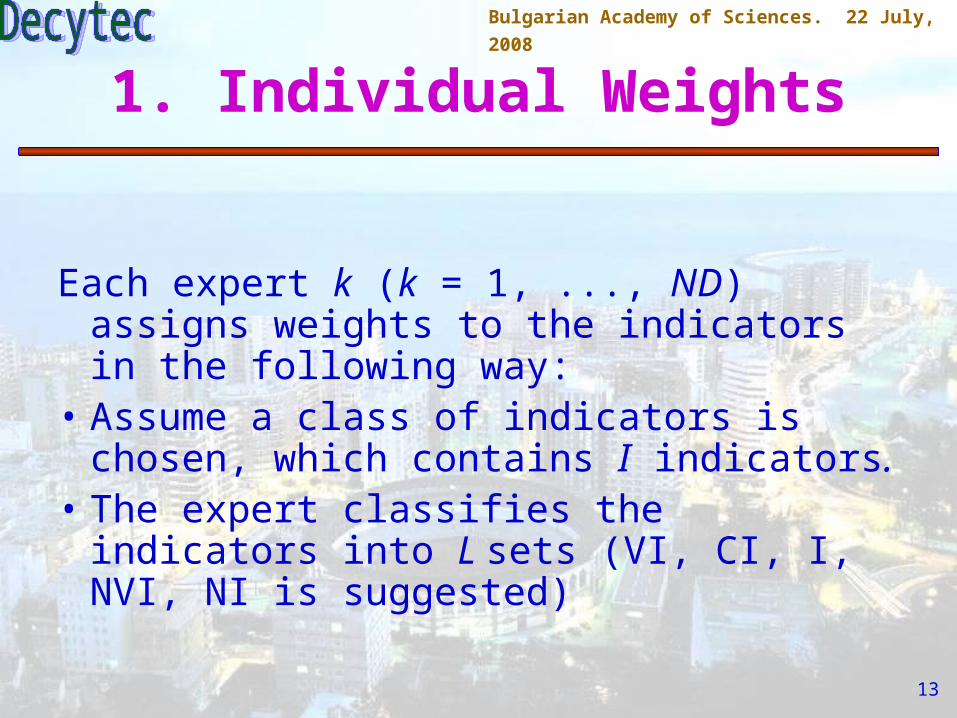
Each expert k (k = 1, ..., ND) assigns weights to the indicators in the following way:
• Assume a class of indicators is chosen, which contains I indicators.
• The expert classifies the indicators into L sets (VI, CI, I, NVI, NI is suggested)

14
Bulgarian Academy of Sciences. 22 July, 2008
1. Individual Weights
• For each l = 2,..., L-1, the expert is asked to place set l between sets l-1 and l+1.
l - 1
l + 1
0
0.25
0.5
0.75
1
set lalk
15
Bulgarian Academy of Sciences. 22 July, 2008
1. Individual Weights
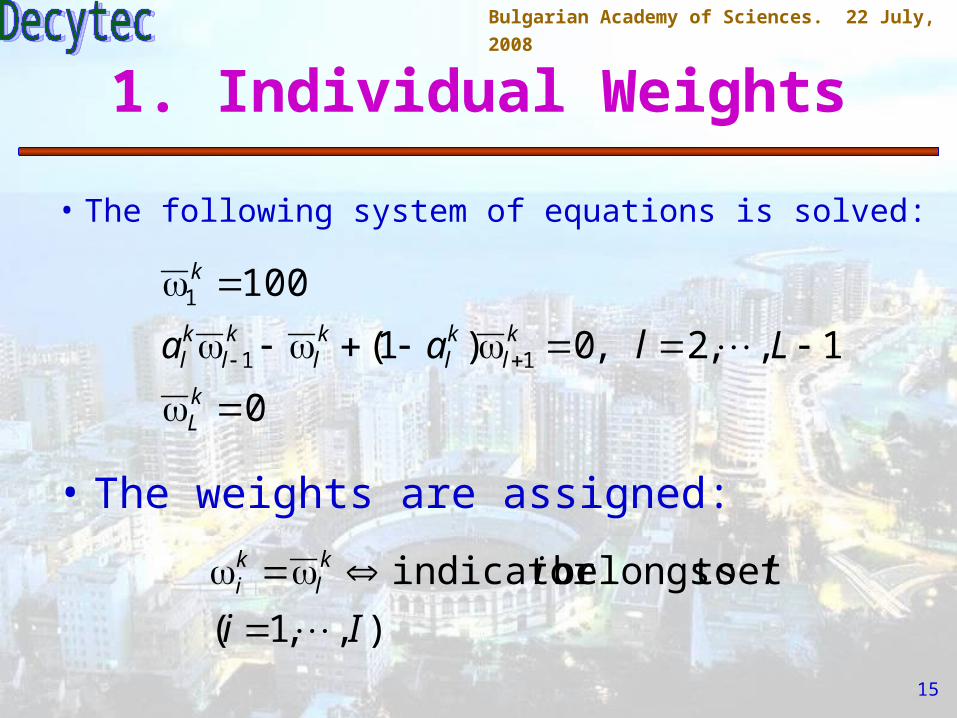
• The following system of equations is solved:
0
1,,2,0)1(
100
11
1
kL
kl
kl
kl
kl
kl
k
Llaa
• The weights are assigned:
),,1(
set tobelongs indicator
Ii
likl
ki
16
Bulgarian Academy of Sciences. 22 July, 2008
1. Individual Weights
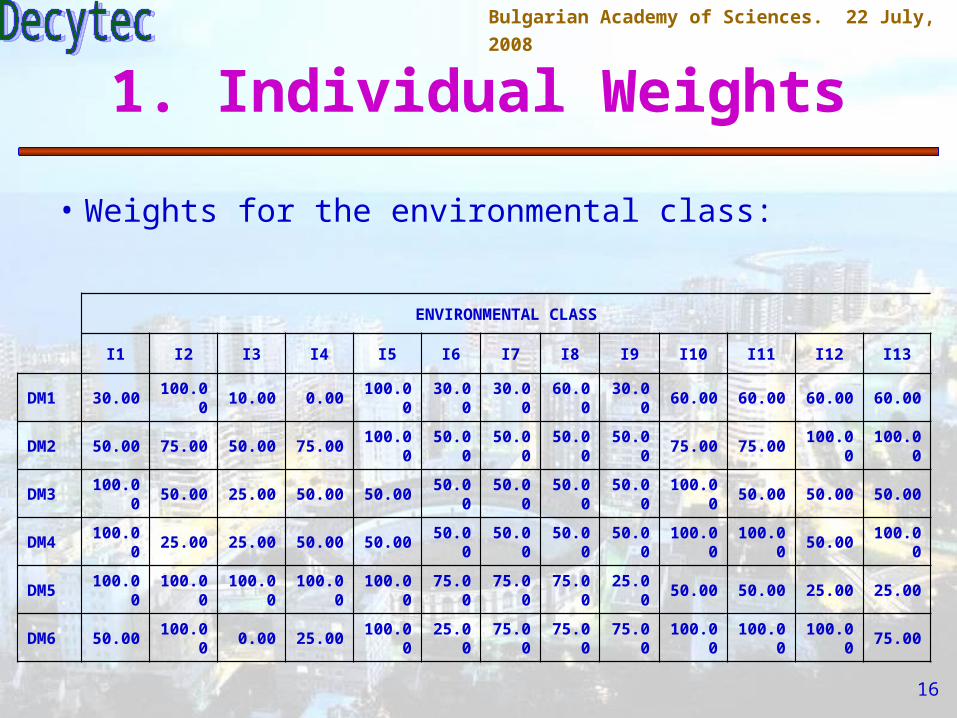
ENVIRONMENTAL CLASS
I1 I2 I3 I4 I5 I6 I7 I8 I9 I10 I11 I12 I13
DM1 30.00100.0
010.00 0.00
100.00
30.00 30.00 60.00 30.00 60.00 60.00 60.00 60.00
DM2 50.00 75.00 50.00 75.00100.0
050.00 50.00 50.00 50.00 75.00 75.00
100.00
100.00
DM3 100.00 50.00 25.00 50.00 50.00 50.00 50.00 50.00 50.00 100.00 50.00 50.00 50.00
DM4 100.00 25.00 25.00 50.00 50.00 50.00 50.00 50.00 50.00 100.00100.0
050.00
100.00
DM5 100.00100.0
0100.0
0100.0
0100.0
075.00 75.00 75.00 25.00 50.00 50.00 25.00 25.00
DM6 50.00100.0
00.00 25.00
100.00
25.00 75.00 75.00 75.00 100.00100.0
0100.0
075.00
• Weights for the environmental class:
17
Bulgarian Academy of Sciences. 22 July, 2008
2. Preference Aggregation
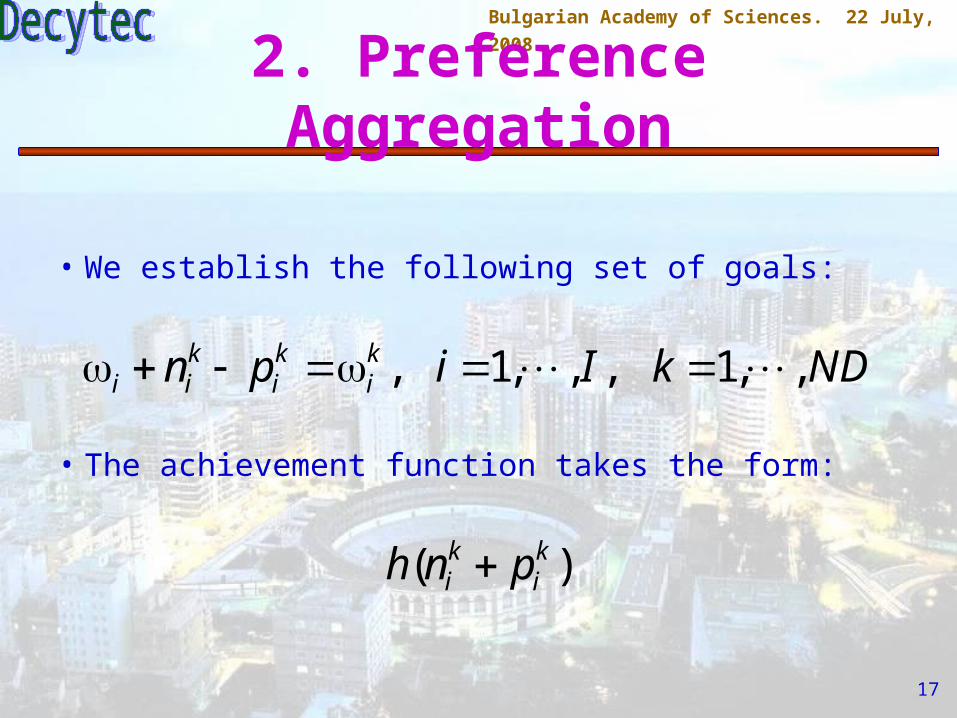
• We establish the following set of goals:
NDkIipn ki
ki
kii ,,1,,,1,
• The achievement function takes the form:
)( ki
ki pnh

18
Bulgarian Academy of Sciences. 22 July, 2008
• Best maximum deviation:
NDkIipn
Ii
NDkIipn
NDkdpn
d
P
ki
ki
i
ki
ki
kii
I
i
ki
ki
,,1,,,1,0,
,,1,1000
,,1,,,1,
,,10)(s.t.
min
)1(1
2. Preference Aggregation
(AP1) d*, smax
19
Bulgarian Academy of Sciences. 22 July, 2008
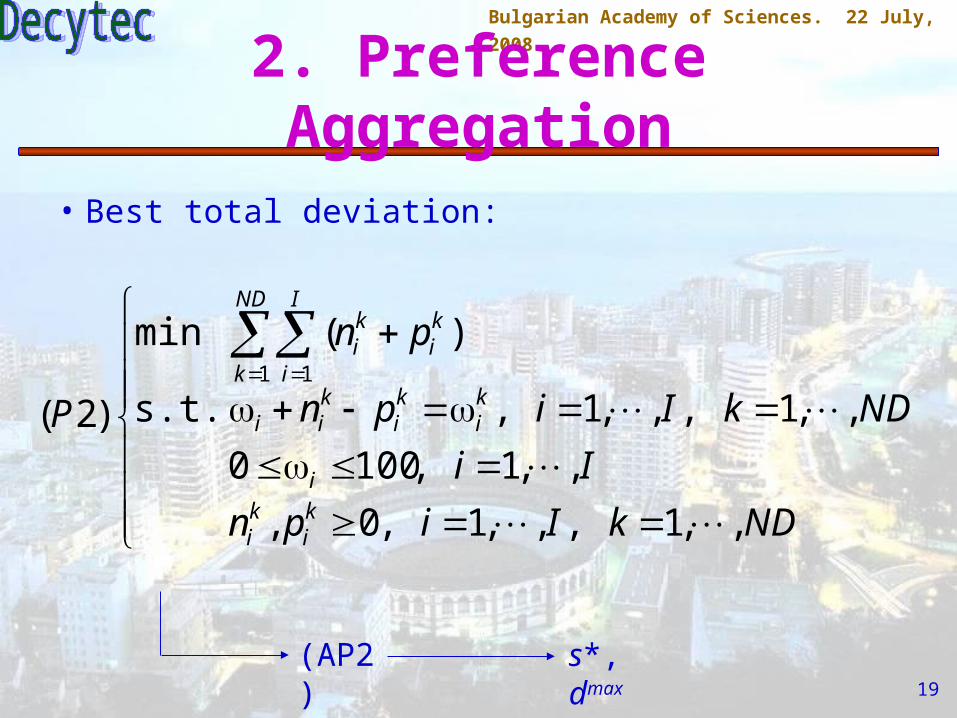
• Best total deviation:
NDkIipn
Ii
NDkIipn
pn
P
ki
ki
i
ki
ki
kii
ND
k
I
i
ki
ki
,,1,,,1,0,
,,1,1000
,,1,,,1,s.t.
)(min
)2(1 1
2. Preference Aggregation
(AP2) s*, dmax

20
Bulgarian Academy of Sciences. 22 July, 2008
• Pay-off matrix:
2. Preference Aggregation
Best Worst
Max. dev. d* dmax
Agg. dev. s* smax
• Meta-Goals: we choose values
max
max
sss
ddd
*,~*,
~
21
Bulgarian Academy of Sciences. 22 July, 2008
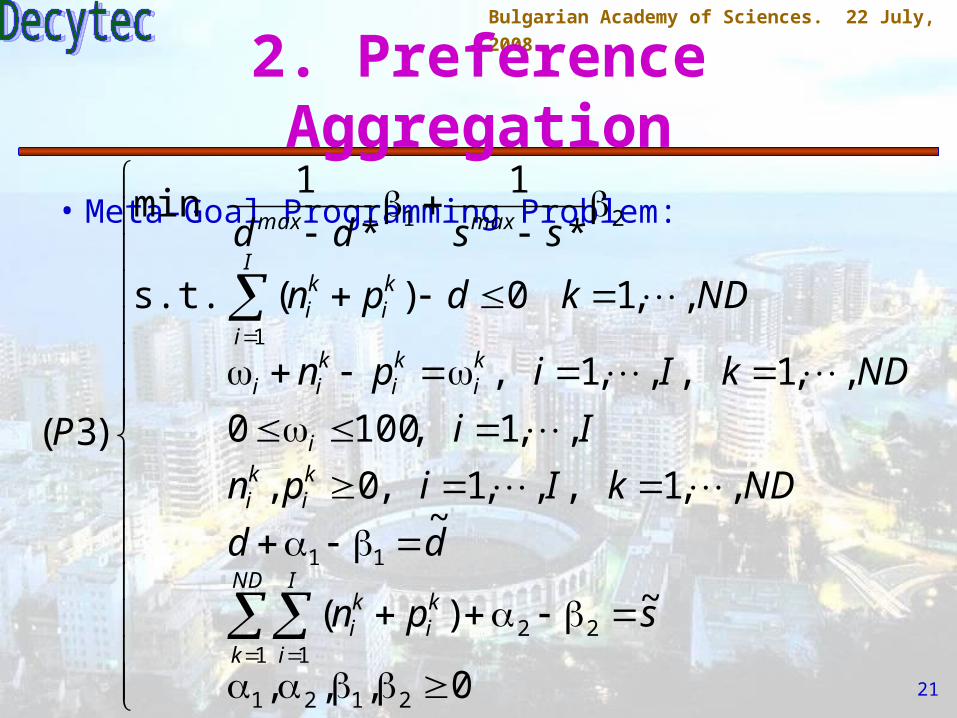
• Meta-Goal Programming Problem:
0,,,
~)(
~,,1,,,1,0,
,,1,1000
,,1,,,1,
,,10)(s.t.
*
1
*
1min
)3(
2121
221 1
11
1
21
spn
dd
NDkIipn
Ii
NDkIipn
NDkdpn
ssdd
P
ND
k
I
i
ki
ki
ki
ki
i
ki
ki
kii
I
i
ki
ki
maxmax
2. Preference Aggregation

22
Bulgarian Academy of Sciences. 22 July, 2008
• An auxiliary problem is solved.
• The process can continue until we achieve a satisfactory solution.
• The final result gives the group weights for each class of indicators.
2. Preference Aggregation
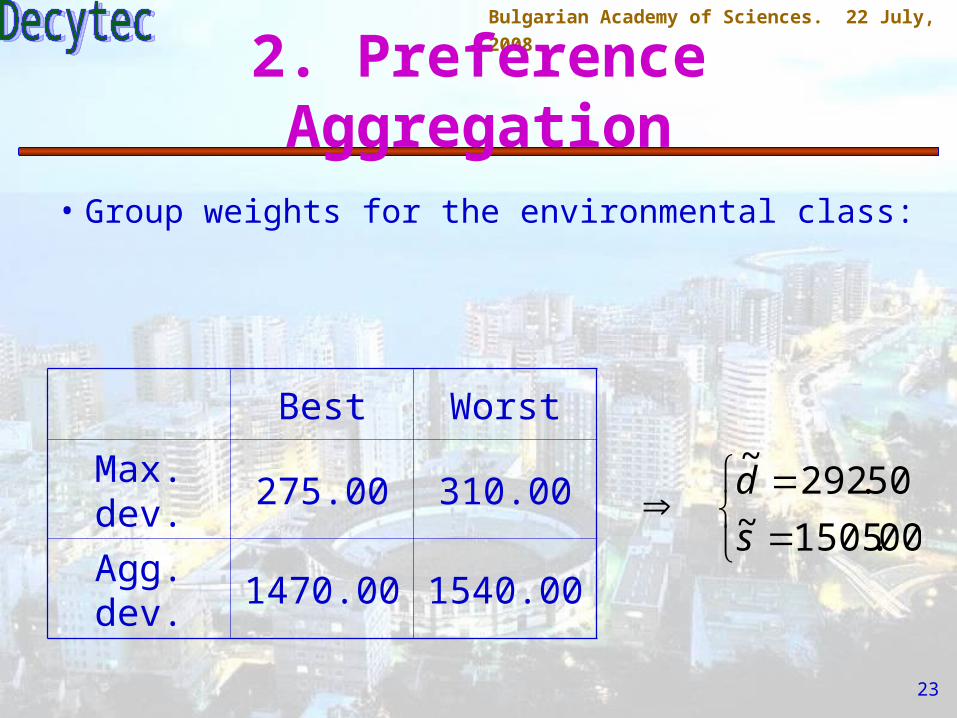
23
Bulgarian Academy of Sciences. 22 July, 2008
2. Preference Aggregation
Best Worst
Max. dev. 275.00 310.00
Agg. dev. 1470.00 1540.00
00.1505~
50.292~
s
d
• Group weights for the environmental class:
24
Bulgarian Academy of Sciences. 22 July, 2008
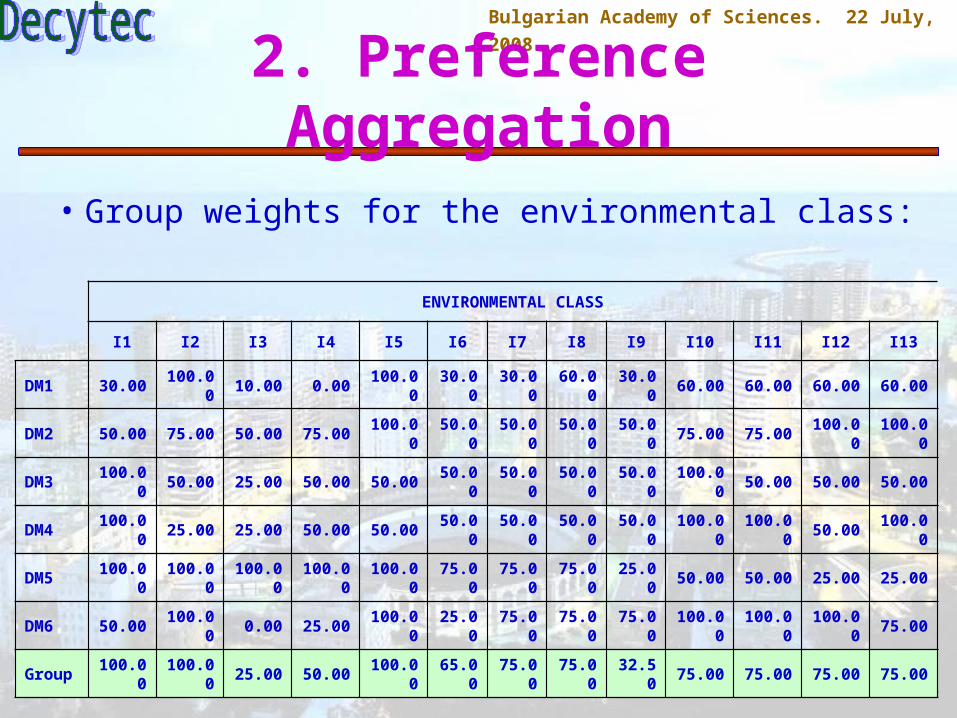
2. Preference Aggregation
ENVIRONMENTAL CLASS
I1 I2 I3 I4 I5 I6 I7 I8 I9 I10 I11 I12 I13
DM1 30.00100.0
010.00 0.00
100.00
30.00 30.00 60.00 30.00 60.00 60.00 60.00 60.00
DM2 50.00 75.00 50.00 75.00100.0
050.00 50.00 50.00 50.00 75.00 75.00
100.00
100.00
DM3 100.00 50.00 25.00 50.00 50.00 50.00 50.00 50.00 50.00 100.00 50.00 50.00 50.00
DM4 100.00 25.00 25.00 50.00 50.00 50.00 50.00 50.00 50.00 100.00100.0
050.00
100.00
DM5 100.00100.0
0100.0
0100.0
0100.0
075.00 75.00 75.00 25.00 50.00 50.00 25.00 25.00
DM6 50.00100.0
00.00 25.00
100.00
25.00 75.00 75.00 75.00 100.00100.0
0100.0
075.00
Group 100.00100.0
025.00 50.00
100.00
65.00 75.00 75.00 32.50 75.00 75.00 75.00 75.00
• Group weights for the environmental class:
25
Bulgarian Academy of Sciences. 22 July, 2008
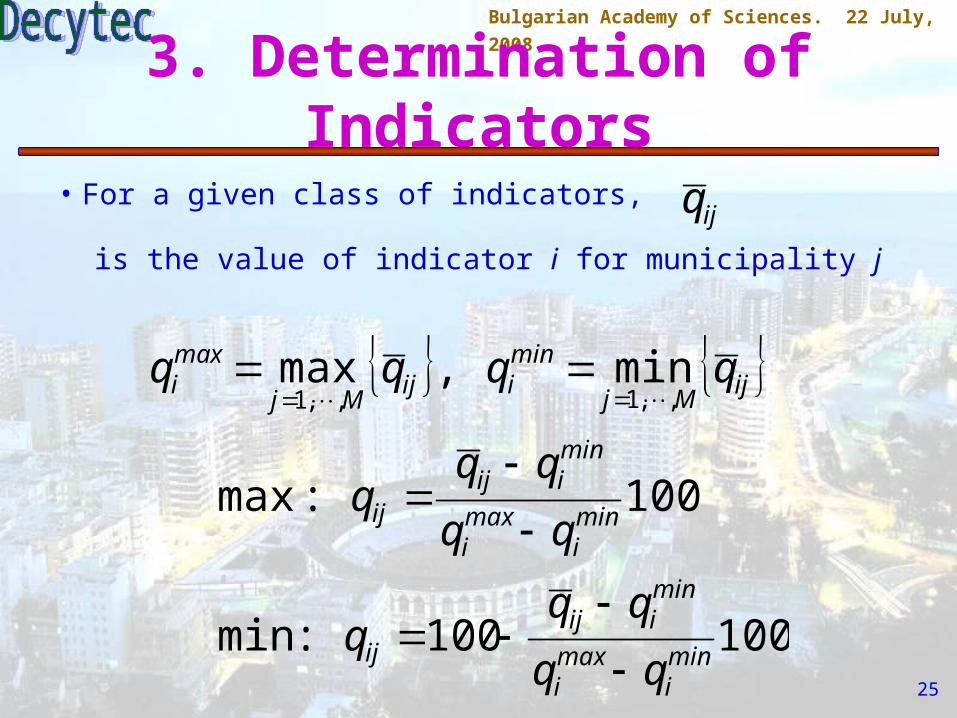
3. Determination of Indicators
• For a given class of indicators, ijq
is the value of indicator i for municipality j
ijMj
miniij
Mj
maxi qqqq
,,1,,1min,max
100100:min
100:max
mini
maxi
miniij
ij
mini
maxi
miniij
ij
qqq
qqq
26
Bulgarian Academy of Sciences. 22 July, 2008
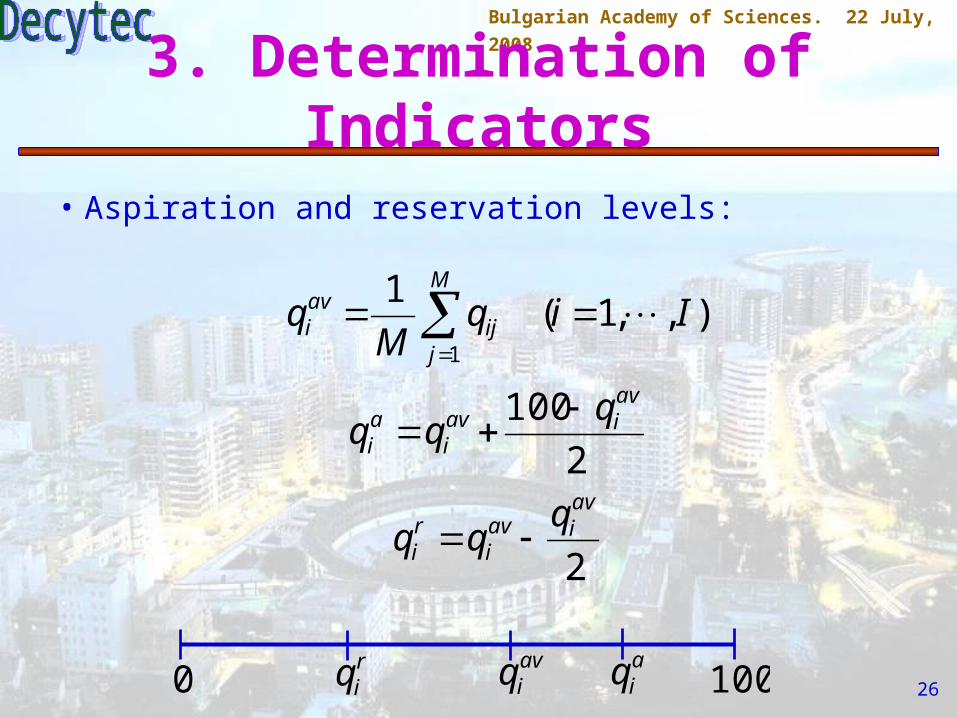
• Aspiration and reservation levels:
2
2
100
),,1(1
1
aviav
iri
aviav
iai
M
jij
avi
qqq
qqq
IiqM
q
3. Determination of Indicators
0 100aviq
aiq
riq

27
Bulgarian Academy of Sciences. 22 July, 2008
• Individual achievement functions:
),,1(),,1(
0if
if
100if100
1
),,(
MjIi
qqq
qqqqq
qqq
qqq
riijr
i
riij
aiij
rir
iai
riij
ijaia
i
aiij
ri
aiiji
3. Determination of Indicators
-1
0
1
2
aviq
aiq
riq 100
28
Bulgarian Academy of Sciences. 22 July, 2008
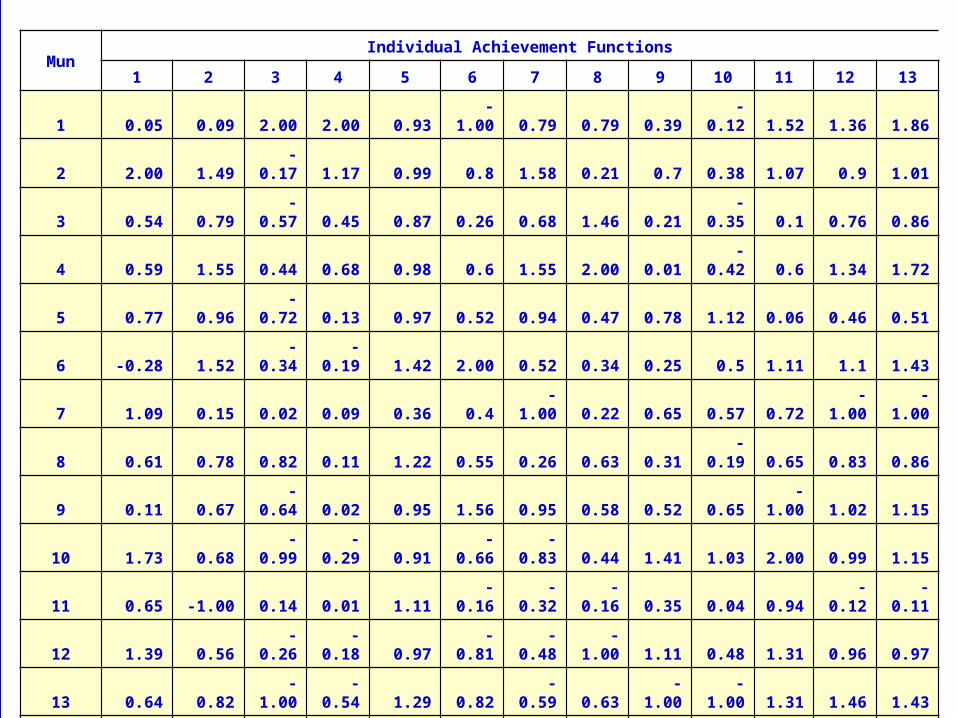
3. Determination of IndicatorsMun
Individual Achievement Functions
1 2 3 4 5 6 7 8 9 10 11 12 13
1 0.05 0.09 2.00 2.00 0.93 -1.00 0.79 0.79 0.39 -0.12 1.52 1.36 1.86
2 2.00 1.49 -0.17 1.17 0.99 0.8 1.58 0.21 0.7 0.38 1.07 0.9 1.01
3 0.54 0.79 -0.57 0.45 0.87 0.26 0.68 1.46 0.21 -0.35 0.1 0.76 0.86
4 0.59 1.55 0.44 0.68 0.98 0.6 1.55 2.00 0.01 -0.42 0.6 1.34 1.72
5 0.77 0.96 -0.72 0.13 0.97 0.52 0.94 0.47 0.78 1.12 0.06 0.46 0.51
6 -0.28 1.52 -0.34 -0.19 1.42 2.00 0.52 0.34 0.25 0.5 1.11 1.1 1.43
7 1.09 0.15 0.02 0.09 0.36 0.4 -1.00 0.22 0.65 0.57 0.72 -1.00 -1.00
8 0.61 0.78 0.82 0.11 1.22 0.55 0.26 0.63 0.31 -0.19 0.65 0.83 0.86
9 0.11 0.67 -0.64 0.02 0.95 1.56 0.95 0.58 0.52 0.65 -1.00 1.02 1.15
10 1.73 0.68 -0.99 -0.29 0.91 -0.66 -0.83 0.44 1.41 1.03 2.00 0.99 1.15
11 0.65 -1.00 0.14 0.01 1.11 -0.16 -0.32 -0.16 0.35 0.04 0.94 -0.12 -0.11
12 1.39 0.56 -0.26 -0.18 0.97 -0.81 -0.48 -1.00 1.11 0.48 1.31 0.96 0.97
13 0.64 0.82 -1.00 -0.54 1.29 0.82 -0.59 0.63 -1.00 -1.00 1.31 1.46 1.43
14 0.4 1.00 -0.43 -0.52 1.8 -0.04 -0.47 0.15 0.97 2.00 1.31 1.62 1.57
15 1.26 0.9 0.44 -0.46 2.00 -0.25 -0.32 -0.06 -0.31 -1.00 1.16 2.00 2.00
16 -1.00 0.12 -0.26 -0.85 0.65 0.85 2.00 0.14 1.14 1.53 0.52 0.98 0.93
17 1.4 0.37 -0.41 -0.45 0.89 1.55 0.22 0.09 2.00 1.48 -0.19 0.86 0.83
18 1.62 2.00 -0.52 -1.00 -1.00 -0.83 0.08 0.41 0.28 0.01 0.4 -0.73 -0.86
Weight 100.00 100.00 25.00 50.00 100.00 65.00 75.00 75.00 32.50 75.00 75.00 75.00 75.00
Norm 0.11 0.11 0.03 0.05 0.11 0.07 0.08 0.08 0.04 0.08 0.08 0.08 0.08

29
Bulgarian Academy of Sciences. 22 July, 2008
• Construction of the synthetic indicators
(i are the normalized group weigths)
),,1(
),,(:weak
),,(min:strong
1
,,1
Mj
qqq
qqq
I
i
ri
aiijii
wj
ri
aiijii
Ii
sj
3. Determination of Indicators

30
Bulgarian Academy of Sciences. 22 July, 2008
• Graphical representation:
3. Determination of Indicators
M1
M4
M7M11
M16
M18
M2
M3M5
M6
M8M9M10
M12 M13
M14
M15
M17
0,00
0,20
0,40
0,60
0,80
1,00
1,20
-0,14 -0,12 -0,10 -0,08 -0,06 -0,04 -0,02 0,00
Strong Indicator
Wea
k In
dic
ato
r

31
Bulgarian Academy of Sciences. 22 July, 2008
4. Final aggregation
• Let us denote by
the strong and weak indicators corresponding to municipality j and to the indicator class h (h = 1, 2, 3, 4)
wjh
sjh ,
• Let us assume that the weights
4321 ,,,
are assigned to the four classes of indicators

32
Bulgarian Academy of Sciences. 22 July, 2008
• Global indicators:
4. Final aggregation
),,1(
:weak
min:strong
4
1
4,,1
Mjh
wjhh
wj
sjhh
h
sj
• Weights:– Environmental: 0.4– Economic: 0.3– Urban development: 0.15– Demographic: 0.15

33
Bulgarian Academy of Sciences. 22 July, 2008
• Graphical representation:
4. Final aggregation
M1 M3
M4
M7
M11
M12
M13
M15
M16
M18
M2
M5M6
M8
M9
M10 M14
M17
0
0,1
0,2
0,3
0,4
0,5
0,6
0,7
0,8
0,9
-0,06 -0,05 -0,04 -0,03 -0,02 -0,01 0
Strong Indicator
Weak In
dic
ato
r
34
Bulgarian Academy of Sciences. 22 July, 2008
• Weights: two options– Give the weights ourselves and carry out a
sensitivity analysis.– Determine the weights in a group decision making
process like the one carried out in step 2
4. Final aggregation
35
Bulgarian Academy of Sciences. 22 July, 2008
Conclusions
• Urban indicators have been designed to measure concrete aspects of sustainability, but there is a lack of a unified measure.
• We have developed a full methodology to build synthetic urban indicators.
• Both strong and weak sustainability indicators are built and taken into account.
• The pair of indicators and their graphical representation allows a more in depth analysis of the data.

36
Bulgarian Academy of Sciences. 22 July, 2008
Conclusions
• The methodology developed comprises several different schemes, among which we can point out:– Meta-Goal Programming, for the
determination of the group weights.– Reference point technique (objective ranking)
for the construction of the indicators.
• The scheme can be adapted to any number of indicators and/or municipalities.

37
Bulgarian Academy of Sciences. 22 July, 2008
Conclusions
• Future Research Lines:– To carry out a wider study:
• Broader range (national?), higher number of municipalities.
• Refine the panel of experts.• More reliable data.
– Final aggregation:• Full systematic sensitivity analysis.• Classification scheme.
38
Bulgarian Academy of Sciences. 22 July, 2008
Conclusions
• Future Research Lines:– Group weights:
• Full group decision making process.• Different penalizations for n and p.
– Reference point scheme:• Interval criteria.• Different slopes for the branches of the
achievement functions.• Different aspiration and reservation values.