Embed Size (px)
Citation preview
Bulgaria in figures – 2018 edition
1
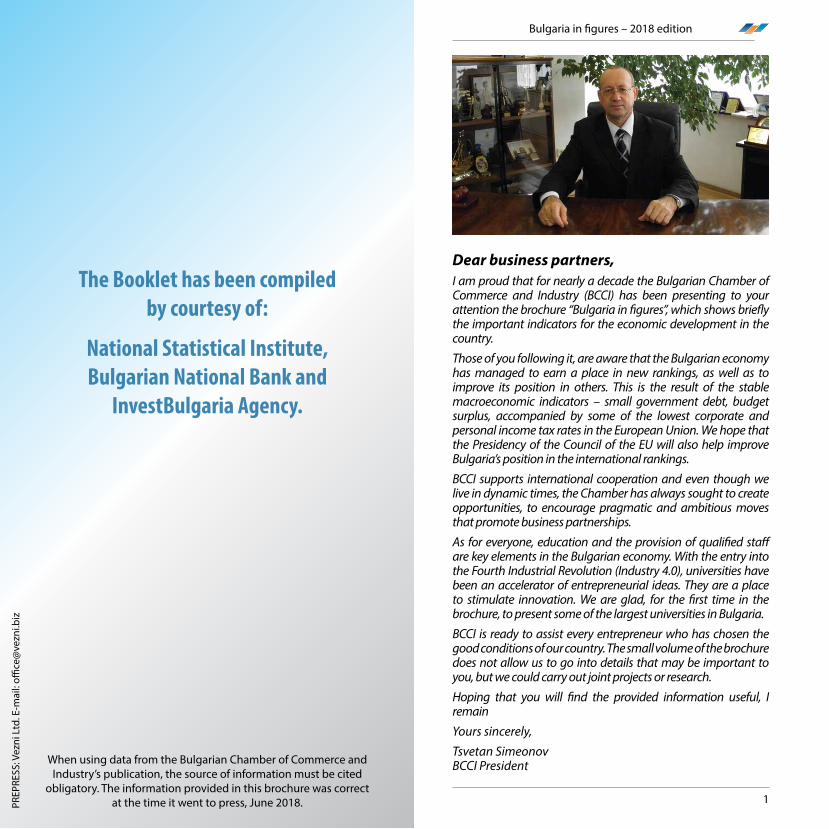
Dear business partners,I am proud that for nearly a decade the Bulgarian Chamber of Commerce and Industry (BCCI) has been presenting to your attention the brochure “Bulgaria in figures”, which shows briefly the important indicators for the economic development in the country.
Those of you following it, are aware that the Bulgarian economy has managed to earn a place in new rankings, as well as to improve its position in others. This is the result of the stable macroeconomic indicators – small government debt, budget surplus, accompanied by some of the lowest corporate and personal income tax rates in the European Union. We hope that the Presidency of the Council of the EU will also help improve Bulgaria’s position in the international rankings.
BCCI supports international cooperation and even though we live in dynamic times, the Chamber has always sought to create opportunities, to encourage pragmatic and ambitious moves that promote business partnerships.
As for everyone, education and the provision of qualified staff are key elements in the Bulgarian economy. With the entry into the Fourth Industrial Revolution (Industry 4.0), universities have been an accelerator of entrepreneurial ideas. They are a place to stimulate innovation. We are glad, for the first time in the brochure, to present some of the largest universities in Bulgaria.
BCCI is ready to assist every entrepreneur who has chosen the good conditions of our country. The small volume of the brochure does not allow us to go into details that may be important to you, but we could carry out joint projects or research.
Hoping that you will find the provided information useful, I remain
Yours sincerely,
Tsvetan Simeonov BCCI PresidentWhen using data from the Bulgarian Chamber of Commerce and
Industry’s publication, the source of information must be cited obligatory. The information provided in this brochure was correct
at the time it went to press, June 2018.
The Booklet has been compiled by courtesy of:
National Statistical Institute, Bulgarian National Bank and
InvestBulgaria Agency.
PREP
RESS
: Vez
ni L
td. E
-mai
l: offi
ce@
vezn
i.biz
Bulgaria in figures – 2018 edition
2 3
Bulgaria in figures – 2018 edition
REPUBLIC OF BULGARIA
Vidin
Montana
VratsaPleven
Lovech
So aSo a (cap)
Gabrovo
Ruse Razgrad
Silistra
Dobrich
North-West region
South-West regionSouth Central region
North Central region North-East region
South-East region
VarnaTargovishte
Shumen
Burgas
Yambol
Sliven
Haskovo
Plovdiv
Smolyan
Pazardzhik
Blagoevgrad
Kyustendil
Pernik
Kardzhali
VelikoTarnovo
StaraZagora
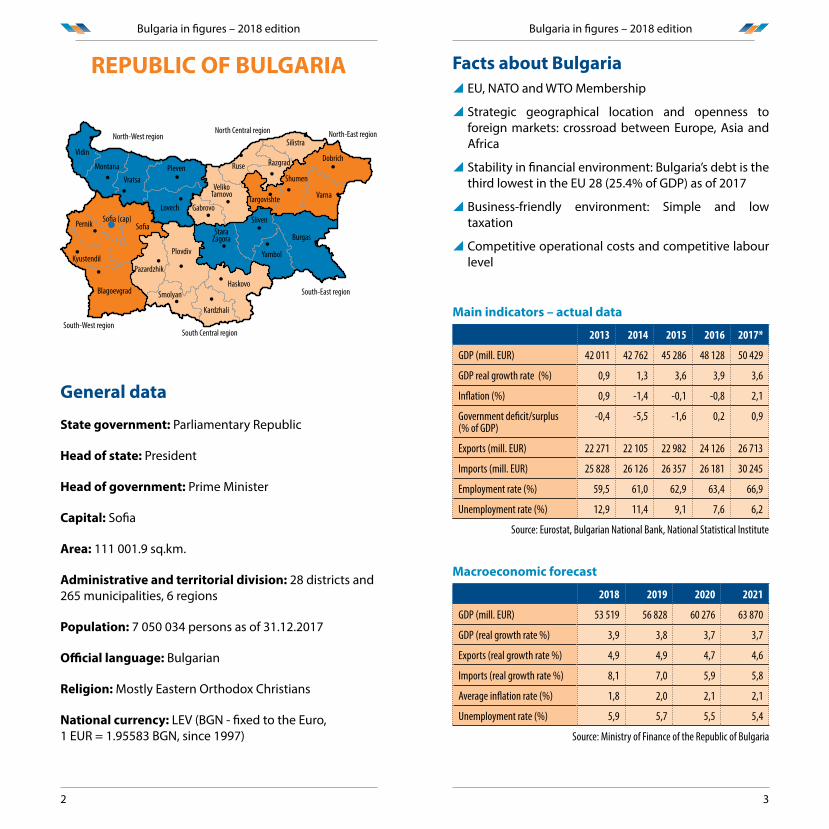
General data
State government: Parliamentary Republic
Head of state: President
Head of government: Prime Minister
Capital: Sofia
Area: 111 001.9 sq.km.
Administrative and territorial division: 28 districts and 265 municipalities, 6 regions
Population: 7 050 034 persons as of 31.12.2017
Official language: Bulgarian
Religion: Mostly Eastern Orthodox Christians
National currency: LEV (BGN - fixed to the Euro, 1 EUR = 1.95583 BGN, since 1997)
Facts about Bulgaria \ EU, NATO and WTO Membership
\ Strategic geographical location and openness to foreign markets: crossroad between Europe, Asia and Africa
\ Stability in financial environment: Bulgaria’s debt is the third lowest in the EU 28 (25.4% of GDP) as of 2017
\ Business-friendly environment: Simple and low taxation
\ Competitive operational costs and competitive labour level
Main indicators – actual data
2013 2014 2015 2016 2017*
GDP (mill. EUR) 42 011 42 762 45 286 48 128 50 429
GDP real growth rate (%) 0,9 1,3 3,6 3,9 3,6
Inflation (%) 0,9 -1,4 -0,1 -0,8 2,1
Government deficit/surplus (% of GDP)
-0,4 -5,5 -1,6 0,2 0,9
Exports (mill. EUR) 22 271 22 105 22 982 24 126 26 713
Imports (mill. EUR) 25 828 26 126 26 357 26 181 30 245
Employment rate (%) 59,5 61,0 62,9 63,4 66,9
Unemployment rate (%) 12,9 11,4 9,1 7,6 6,2
Source: Eurostat, Bulgarian National Bank, National Statistical Institute
Macroeconomic forecast
2018 2019 2020 2021
GDP (mill. EUR) 53 519 56 828 60 276 63 870
GDP (real growth rate %) 3,9 3,8 3,7 3,7
Exports (real growth rate %) 4,9 4,9 4,7 4,6
Imports (real growth rate %) 8,1 7,0 5,9 5,8
Average inflation rate (%) 1,8 2,0 2,1 2,1
Unemployment rate (%) 5,9 5,7 5,5 5,4
Source: Ministry of Finance of the Republic of Bulgaria
Bulgaria in figures – 2018 edition
4 5
Bulgaria in figures – 2018 edition
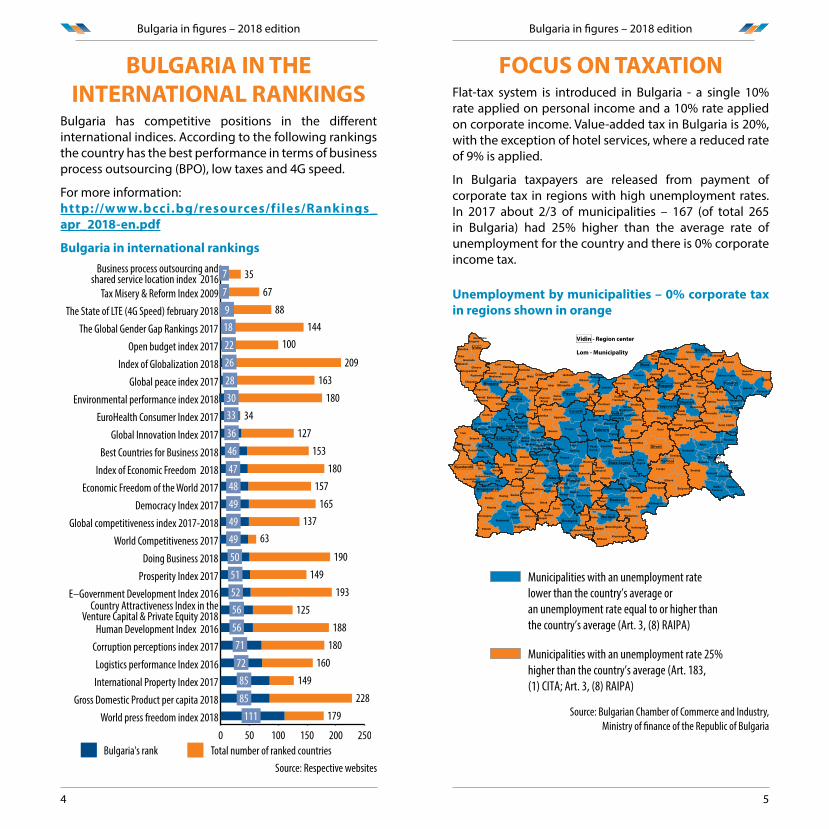
BULGARIA IN THE INTERNATIONAL RANKINGS
Bulgaria has competitive positions in the different international indices. According to the following rankings the country has the best performance in terms of business process outsourcing (BPO), low taxes and 4G speed.
For more information:http://w w w.bcci.bg/resources/files/Rankings_apr_2018-en.pdf
Bulgaria in international rankings
0 50 100 150 200 250Total number of ranked countriesBulgaria's rank
World press freedom index 2018Gross Domestic Product per capita 2018
International Property Index 2017Logistics performance Index 2016
Corruption perceptions index 2017Human Development Index 2016
Country Attractiveness Index in the Venture Capital & Private Equity 2018
E–Government Development Index 2016Prosperity Index 2017
Doing Business 2018World Competitiveness 2017
Global competitiveness index 2017-2018Democracy Index 2017
Economic Freedom of the World 2017Index of Economic Freedom 2018
Best Countries for Business 2018Global Innovation Index 2017
EuroHealth Consumer Index 2017Environmental performance index 2018
Global peace index 2017Index of Globalization 2018
Open budget index 2017The Global Gender Gap Rankings 2017
The State of LTE (4G Speed) february 2018Tax Misery & Reform Index 2009
Business process outsourcing and shared service location index 2016
11185
8572
7156
56525150
4949
4849
47
4636
333028
26
18
22
9
7
7
179228
149160
180188
125193
149190
13763
165157
180153
12734
180163
209
144
6788
100
35
Source: Respective websites
FOCUS ON TAXATIONFlat-tax system is introduced in Bulgaria - a single 10% rate applied on personal income and a 10% rate applied on corporate income. Value-added tax in Bulgaria is 20%, with the exception of hotel services, where a reduced rate of 9% is applied.
In Bulgaria taxpayers are released from payment of corporate tax in regions with high unemployment rates. In 2017 about 2/3 of municipalities – 167 (of total 265 in Bulgaria) had 25% higher than the average rate of unemployment for the country and there is 0% corporate income tax.
Unemployment by municipalities – 0% corporate tax in regions shown in orange
Krichim
DolnuDabnik
Bregovo
Boinitza
Kula
Vidin
GramadaMakresh
DimovoBelogradchik
Chuprene
Ruzhentzi
Lom
BrusartziMedkovez
Yakimovo
ValchedrumKozlodui
Novo Selo
Boichinovtzi
Chiprovtzi
GeorgiDamianovo
Montana
Berkovitza
Varshetz
Krivodol
Vratza
Mezdra
SvogeGodech
KostinbrodDragoman
Sofia-city
Botevgrad Pravetz
EtropoleSlivnitza
BojurishteTrun
Breznik
Pernik
Radomir
Trekliano
Zemen
Kovachevtzi
DolnaBania
Samokov
Belovo
Ihtiman
Kostenetz
Elin Pelin
GornaMalina
Kyustendil BobovDol
Nevestino
Dupnitza
SaparevaBanya
Boboshevo
Kocherinovo Rila
Blagoevgrad
Simitly
Kresna
Strumyane
Petrich
Sandanski
Razlog
Bansko
GozeDelchev
Hadjidimovo
Garmen
Satovcha
Yakoruda
BelitzaVelingrad
Lesichevo
Septemvri
Rakitovo
Panagyurishte
Pazardjik
Strelcha
Batak
Bratzigovo
Peshtera
Devin
BorinoDospat
Lukovit
Ugarchin
Teteven
Roman
Yablanitza
Sofia region
Pleven
Lovech
Gabrovo
Veliko Tarnovo
Ruse
Silistra
Dobrich region
Dobrich
Varna Shumen
Plovdiv
Burgas
Sliven
Yambol
Tundja
Stara Zagora
Haskovo
Kurdjali Smolyan
Mizia
ByalaSlatina
Borovan
HairedinOryahovo Guliantzi
DolnaMitropolia
ChervenBryag
IskarKneja
Nikopol
LevskiPordim
Belene
Letnitza
Troyan
Apriltzi
Dryanovo
Tryavna
Sevlievo
Svishtov
Pavlikeni
SuhindolGorna
Oryahovitza
LyaskovetzZlataritza
Elena
Ivanovo Vyatovo
Tzenovo DveMogili
Borovo
Byala
SlivoPole
Chepelare
Banite
Madan
Rudozem
Laki
ZlatogradNedelino
Chernoochene
Ardino
Djebel Momchilgrad
KirkovoKrumovgrad
DimitrovgradParvomai
Mineralnibani
Simeonovgrad
Stambolovo
Harmanli
Lyubimetz
Madjarovo
Svilengrad
Topolovgrad
Ivailovgrad
Maritza
Sadovo
Rakovski
AsenovgradKuklen
Rodopi
Perushtitza
Saedinenie
Hisarya
KaloyanovoBrezovo
KarlovoPavelBanya
Kazanluk Maglij
BratyaDaskalovi
ChirpanRadnevo
Opan
Galabovo
NovaZagora
Tvarditza
Kotel
Razgrad
Kubrat
ZavetIsperih
Samuil
Loznitza
Tzar Kaloyan
Tutrakan
Glavinitza
Dulovo
Sitovo
AlfatarKoinardja
Krushari
GeneralToshevo
Tervel
BalchikKavarna
Shabla
Vulchi Dol
AksakovoSuvorovoVetrino
DevnyaBeloslav
Avren
Dolni Chiflik
Byala
Provadia
DalgopolSmyadovo
Varbitza
VelikiPreslav
KaolinovoNikola
Kozlevo
NoviPazar
Kaspichan
Venetz
Hitrino
Targovishte
Opaka
Popovo
Antonovo
Omurtag
PolskiTrambesh
Strajitza
SungurlareRuen
Karnobat
AitosNesebar
Pomorie
Kameno
SredetzSozopol
Primorsko
MalkoTarnovo
TzarevoBolyarovo
Elhovo
Straldja
Anton
Koprivshtitza
PirdopZlatitza
ChelopechMirkovo
Chavdar
Gurkovo
Nikolaevo
Vidin - Region center
Lom - Municipality
Sopot
Municipalities with an unemployment rate 25%higher than the country’s average (Art. 183,(1) CITA; Art. 3, (8) RAIPA)
Municipalities with an unemployment ratelower than the country’s average oran unemployment rate equal to or higher thanthe country’s average (Art. 3, (8) RAIPA)
Sarnitsa
Source: Bulgarian Chamber of Commerce and Industry, Ministry of finance of the Republic of Bulgaria
Bulgaria in figures – 2018 edition
6 7
Bulgaria in figures – 2018 edition
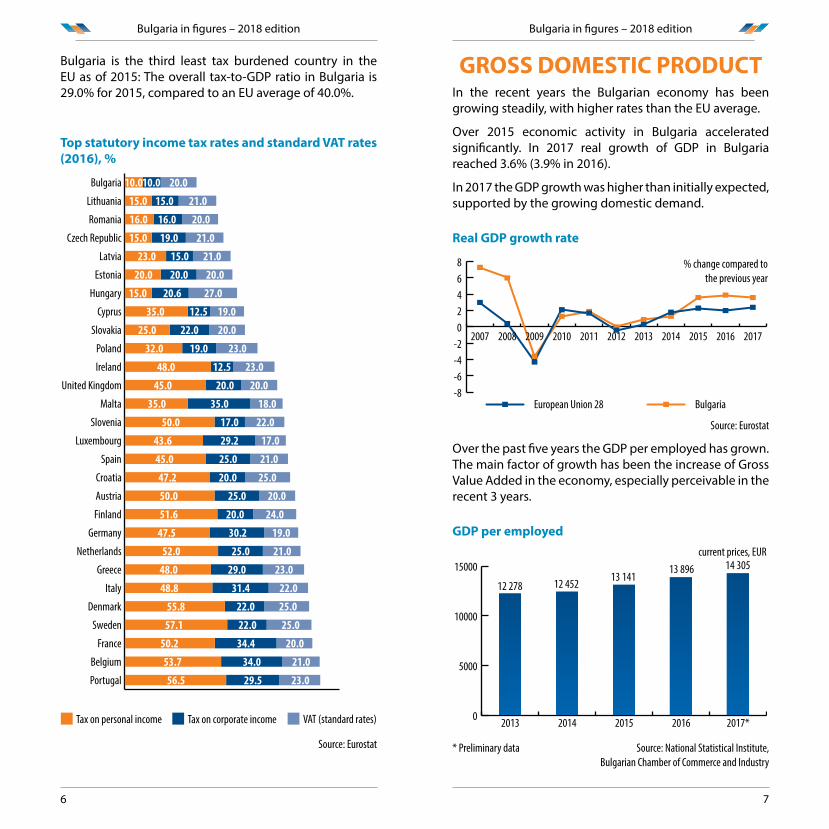
Bulgaria is the third least tax burdened country in the EU as of 2015: The overall tax-to-GDP ratio in Bulgaria is 29.0% for 2015, compared to an EU average of 40.0%.
Top statutory income tax rates and standard VAT rates (2016), %
VAT (standard rates)Tax on corporate incomeTax on personal income
Portugal
Belgium
France
Sweden
Denmark
Italy
Greece
Netherlands
Germany
Finland
Austria
Croatia
Spain
Luxembourg
Slovenia
Malta
United Kingdom
Ireland
Poland
Slovakia
Cyprus
Hungary
Estonia
Latvia
Czech Republic
Romania
Lithuania
Bulgaria
53.7 21.034.0
56.5 23.029.5
50.2 20.034.4
57.1 25.022.0
55.8 25.022.0
48.8 22.031.4
48.0 23.029.0
52.0 21.025.0
47.5 19.030.2
51.6 24.020.0
50.0 20.025.0
47.2 25.020.0
45.0 21.025.0
43.6 17.029.2
50.0 22.017.0
35.0 18.035.0
45.0 20.020.0
48.0 23.012.5
32.0 23.019.0
25.0 20.022.0
35.0 19.012.5
15.0 27.020.6
20.0 20.020.0
23.0 21.015.0
15.0 21.019.0
16.0 20.016.0
15.0 21.015.0
10.0 20.010.0
Source: Eurostat
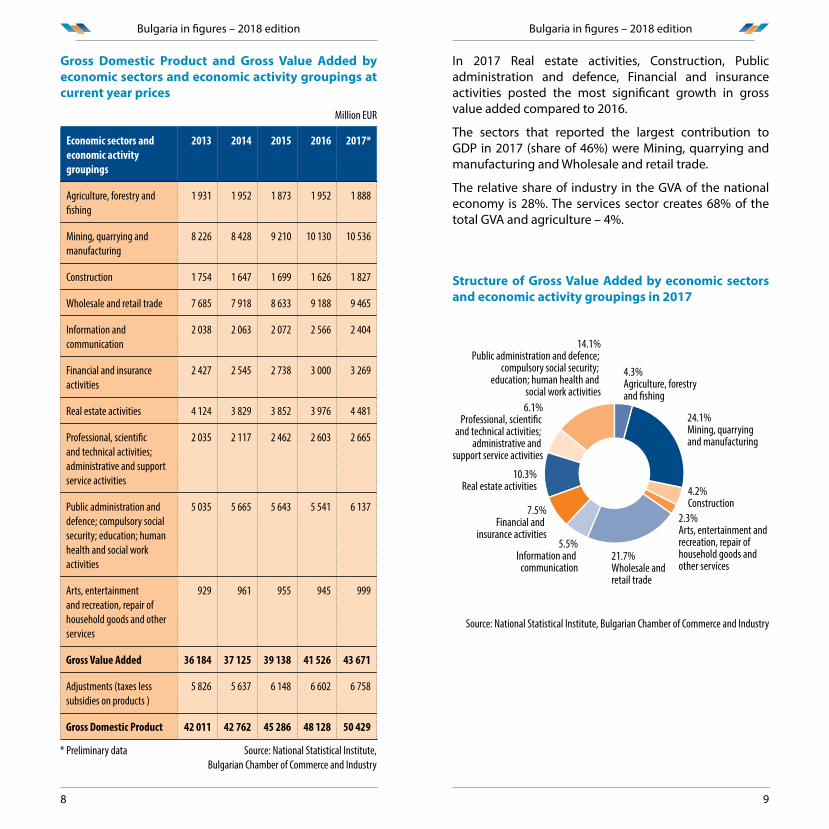
GROSS DOMESTIC PRODUCTIn the recent years the Bulgarian economy has been growing steadily, with higher rates than the EU average.
Over 2015 economic activity in Bulgaria accelerated significantly. In 2017 real growth of GDP in Bulgaria reached 3.6% (3.9% in 2016).
In 2017 the GDP growth was higher than initially expected, supported by the growing domestic demand.
Real GDP growth rate
-8-6-4-202468
BulgariaEuropean Union 28
20172016201520142013201220112010200920082007
% change compared tothe previous year
Source: Eurostat
Over the past five years the GDP per employed has grown. The main factor of growth has been the increasе of Gross Value Added in the economy, especially perceivable in the recent 3 years.
GDP per employed
0
5000
10000
15000
2017*2016201520142013
12 278 12 452 13 14113 896 14 305
current prices, EUR
* Preliminary data Source: National Statistical Institute, Bulgarian Chamber of Commerce and Industry
Bulgaria in figures – 2018 edition
8 9
Bulgaria in figures – 2018 edition
Gross Domestic Product and Gross Value Added by economic sectors and economic activity groupings at current year prices
Million EUR
Economic sectors and economic activity groupings
2013 2014 2015 2016 2017*
Agriculture, forestry and fishing
1 931 1 952 1 873 1 952 1 888
Mining, quarrying and manufacturing
8 226 8 428 9 210 10 130 10 536
Construction 1 754 1 647 1 699 1 626 1 827
Wholesale and retail trade 7 685 7 918 8 633 9 188 9 465
Information and communication
2 038 2 063 2 072 2 566 2 404
Financial and insurance activities
2 427 2 545 2 738 3 000 3 269
Real estate activities 4 124 3 829 3 852 3 976 4 481
Professional, scientific and technical activities; administrative and support service activities
2 035 2 117 2 462 2 603 2 665
Public administration and defence; compulsory social security; education; human health and social work activities
5 035 5 665 5 643 5 541 6 137
Arts, entertainment and recreation, repair of household goods and other services
929 961 955 945 999
Gross Value Added 36 184 37 125 39 138 41 526 43 671
Adjustments (taxes less subsidies on products )
5 826 5 637 6 148 6 602 6 758
Gross Domestic Product 42 011 42 762 45 286 48 128 50 429
* Preliminary data Source: National Statistical Institute, Bulgarian Chamber of Commerce and Industry
In 2017 Real estate activities, Construction, Public administration and defence, Financial and insurance activities posted the most significant growth in gross value added compared to 2016.
The sectors that reported the largest contribution to GDP in 2017 (share of 46%) were Mining, quarrying and manufacturing and Wholesale and retail trade.
The relative share of industry in the GVA of the national economy is 28%. The services sector creates 68% of the total GVA and agriculture – 4%.
Structure of Gross Value Added by economic sectors and economic activity groupings in 2017
14.1%Public administration and defence;
compulsory social security; education; human health and
social work activities6.1%
Professional, scienti�c and technical activities;
administrative and support service activities
10.3%Real estate activities
7.5%Financial and
insurance activities5.5%
Information and communication
21.7%Wholesale and retail trade
2.3%Arts, entertainment and recreation, repair of household goods and other services
4.2%Construction
24.1%Mining, quarrying and manufacturing
4.3%Agriculture, forestry and �shing
Source: National Statistical Institute, Bulgarian Chamber of Commerce and Industry
Bulgaria in figures – 2018 edition
10 11
Bulgaria in figures – 2018 edition
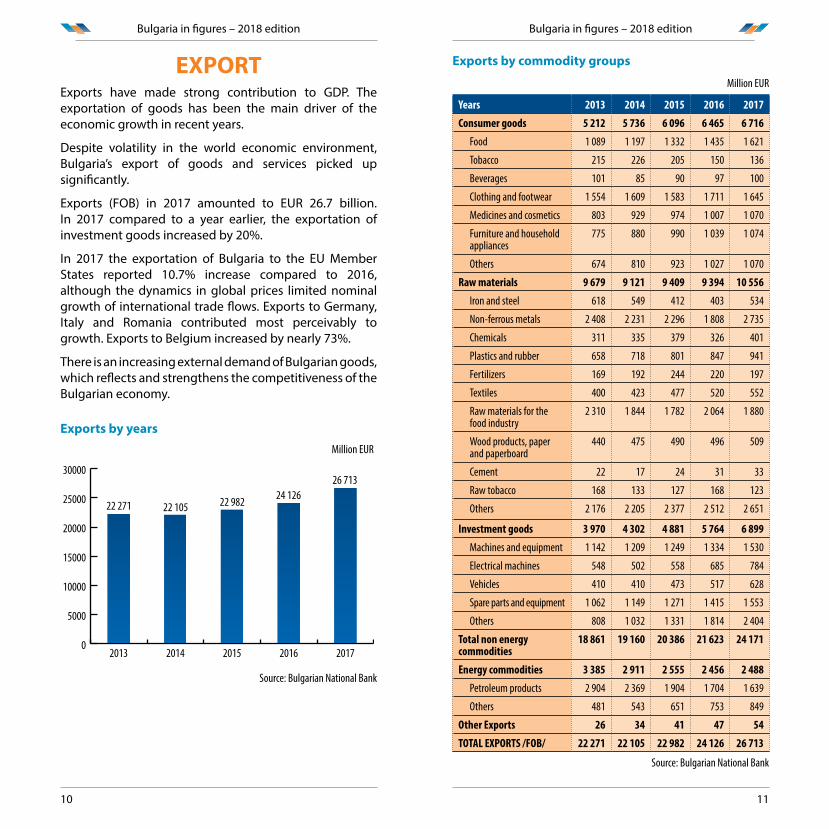
EXPORTExports have made strong contribution to GDP. The exportation of goods has been the main driver of the economic growth in recent years.
Despite volatility in the world economic environment, Bulgaria’s export of goods and services picked up significantly.
Exports (FOB) in 2017 amounted to EUR 26.7 billion. In 2017 compared to a year earlier, the exportation of investment goods increased by 20%.
In 2017 the exportation of Bulgaria to the EU Member States reported 10.7% increase compared to 2016, although the dynamics in global prices limited nominal growth of international trade flows. Exports to Germany, Italy and Romania contributed most perceivably to growth. Exports to Belgium increased by nearly 73%.
There is an increasing external demand of Bulgarian goods, which reflects and strengthens the competitiveness of the Bulgarian economy.
Exports by years
0
5000
10000
15000
20000
25000
30000
20172016201520142013
22 271 22 105 22 982 24 12626 713
Мillion EUR
Source: Bulgarian National Bank
Exports by commodity groups
Million EUR
Years 2013 2014 2015 2016 2017
Consumer goods 5 212 5 736 6 096 6 465 6 716
Food 1 089 1 197 1 332 1 435 1 621
Tobacco 215 226 205 150 136
Beverages 101 85 90 97 100
Clothing and footwear 1 554 1 609 1 583 1 711 1 645
Medicines and cosmetics 803 929 974 1 007 1 070
Furniture and household appliances
775 880 990 1 039 1 074
Others 674 810 923 1 027 1 070
Raw materials 9 679 9 121 9 409 9 394 10 556
Iron and steel 618 549 412 403 534
Non-ferrous metals 2 408 2 231 2 296 1 808 2 735
Chemicals 311 335 379 326 401
Plastics and rubber 658 718 801 847 941
Fertilizers 169 192 244 220 197
Textiles 400 423 477 520 552
Raw materials for the food industry
2 310 1 844 1 782 2 064 1 880
Wood products, paper and paperboard
440 475 490 496 509
Cement 22 17 24 31 33
Raw tobacco 168 133 127 168 123
Others 2 176 2 205 2 377 2 512 2 651
Investment goods 3 970 4 302 4 881 5 764 6 899
Machines and equipment 1 142 1 209 1 249 1 334 1 530
Electrical machines 548 502 558 685 784
Vehicles 410 410 473 517 628
Spare parts and equipment 1 062 1 149 1 271 1 415 1 553
Others 808 1 032 1 331 1 814 2 404
Total non energy commodities
18 861 19 160 20 386 21 623 24 171
Еnergy commodities 3 385 2 911 2 555 2 456 2 488
Petroleum products 2 904 2 369 1 904 1 704 1 639
Others 481 543 651 753 849
Other Exports 26 34 41 47 54
TOTAL EXPORTS /FOB/ 22 271 22 105 22 982 24 126 26 713
Source: Bulgarian National Bank
Bulgaria in figures – 2018 edition
12 13
Bulgaria in figures – 2018 edition
Structure of exports by commodity groups in 2017
0.2%Other Exports9.3%
Energy commodities
25.8%Investment goods
39.5%Raw materials
25.1%Consumer goods
Source: Bulgarian National Bank
Exports to the TOP 10 Bulgarian trade partner countries in 2017
0 500 1000 1500 2000 2500 3000 3500 4000Netherlands
RussiaSpain
FranceBelgium
GreeceTurkey
RomaniaItaly
Germany 3 5922 212
2 1792 078
1 7171 1171 093
783715
662
Million EUR
Source: Bulgarian National Bank
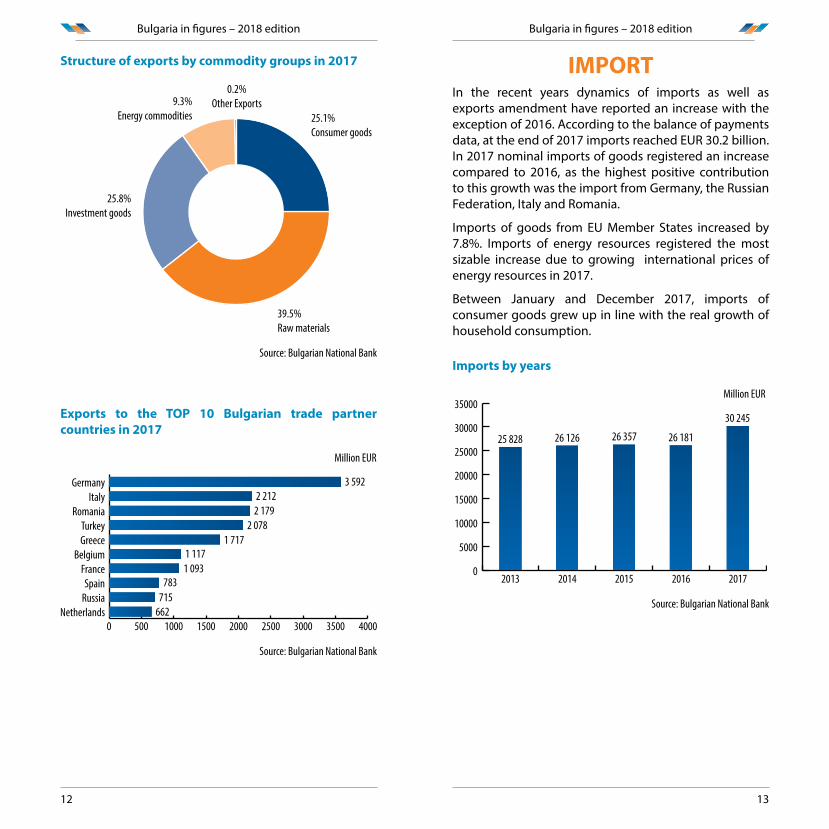
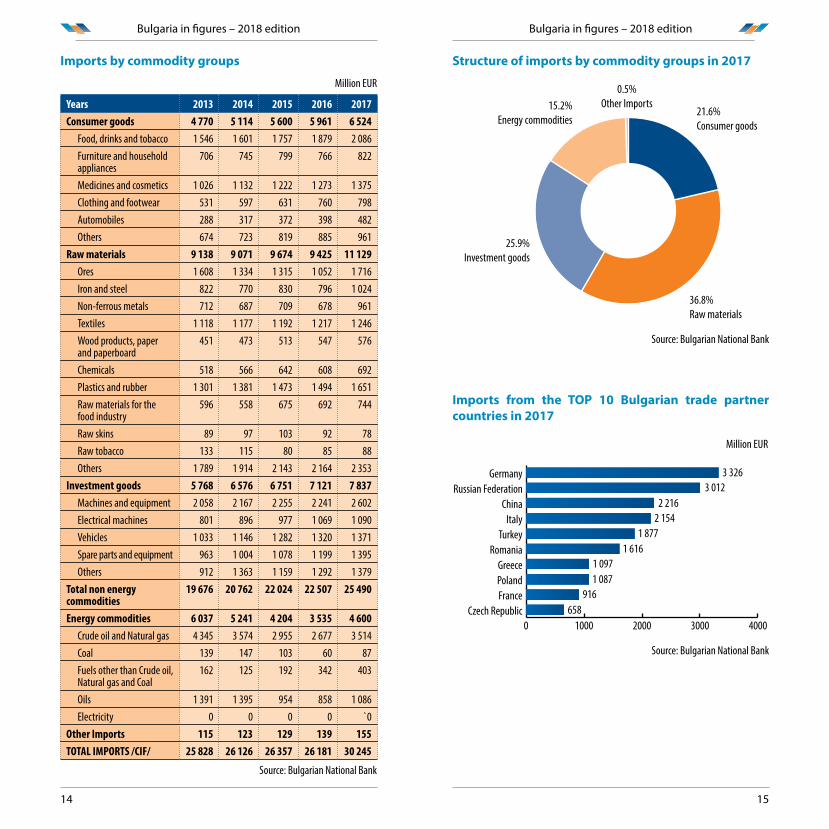
IMPORTIn the recent years dynamics of imports as well as exports amendment have reported an increase with the exception of 2016. According to the balance of payments data, at the end of 2017 imports reached EUR 30.2 billion. In 2017 nominal imports of goods registered an increase compared to 2016, as the highest positive contribution to this growth was the import from Germany, the Russian Federation, Italy and Romania.
Imports of goods from EU Member States increased by 7.8%. Imports of energy resources registered the most sizable increase due to growing international prices of energy resources in 2017.
Between January and December 2017, imports of consumer goods grew up in line with the real growth of household consumption.
Imports by years
0
5000
10000
15000
20000
25000
30000
35000
20172016201520142013
25 828 26 126 26 357 26 181
30 245
Мillion EUR
Source: Bulgarian National Bank
Bulgaria in figures – 2018 edition
14 15
Bulgaria in figures – 2018 edition
Imports by commodity groups
Million EUR
Years 2013 2014 2015 2016 2017Consumer goods 4 770 5 114 5 600 5 961 6 524
Food, drinks and tobacco 1 546 1 601 1 757 1 879 2 086Furniture and household appliances
706 745 799 766 822
Medicines and cosmetics 1 026 1 132 1 222 1 273 1 375Clothing and footwear 531 597 631 760 798Automobiles 288 317 372 398 482Others 674 723 819 885 961
Raw materials 9 138 9 071 9 674 9 425 11 129Ores 1 608 1 334 1 315 1 052 1 716Iron and steel 822 770 830 796 1 024Non-ferrous metals 712 687 709 678 961Textiles 1 118 1 177 1 192 1 217 1 246Wood products, paper and paperboard
451 473 513 547 576
Chemicals 518 566 642 608 692Plastics and rubber 1 301 1 381 1 473 1 494 1 651Raw materials for the food industry
596 558 675 692 744
Raw skins 89 97 103 92 78Raw tobacco 133 115 80 85 88Others 1 789 1 914 2 143 2 164 2 353
Investment goods 5 768 6 576 6 751 7 121 7 837Machines and equipment 2 058 2 167 2 255 2 241 2 602Electrical machines 801 896 977 1 069 1 090Vehicles 1 033 1 146 1 282 1 320 1 371Spare parts and equipment 963 1 004 1 078 1 199 1 395Others 912 1 363 1 159 1 292 1 379
Total non energy commodities
19 676 20 762 22 024 22 507 25 490
Еnergy commodities 6 037 5 241 4 204 3 535 4 600Crude oil and Natural gas 4 345 3 574 2 955 2 677 3 514Coal 139 147 103 60 87Fuels other than Crude oil, Natural gas and Coal
162 125 192 342 403
Oils 1 391 1 395 954 858 1 086Electricity 0 0 0 0 `0
Other Imports 115 123 129 139 155TOTAL IMPORTS /CIF/ 25 828 26 126 26 357 26 181 30 245
Source: Bulgarian National Bank
Structure of imports by commodity groups in 2017
0.5%Other Imports15.2%
Energy commodities
25.9%Investment goods
36.8%Raw materials
21.6%Consumer goods
Source: Bulgarian National Bank
Imports from the TOP 10 Bulgarian trade partner countries in 2017
0 1000 2000 3000 4000Czech Republic
FrancePolandGreece
RomaniaTurkey
ItalyChina
Russian FederationGermany 3 326
3 0122 216
2 1541 877
1 6161 0971 087
916658
Million EUR
Source: Bulgarian National Bank
Bulgaria in figures – 2018 edition
16 17
Bulgaria in figures – 2018 edition
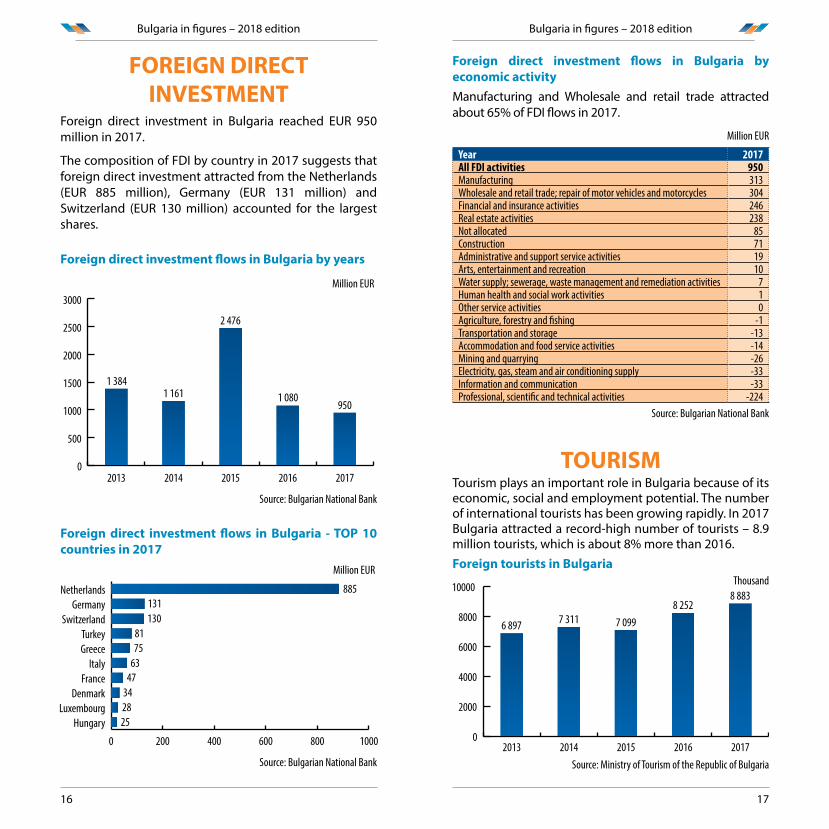
FOREIGN DIRECT INVESTMENТ
Foreign direct investment in Bulgaria reached EUR 950 million in 2017.
The composition of FDI by country in 2017 suggests that foreign direct investment attracted from the Netherlands (EUR 885 million), Germany (EUR 131 million) and Switzerland (EUR 130 million) accounted for the largest shares.
Foreign direct investment flows in Bulgaria by years
0
500
1000
1500
2000
2500
3000
20172016201520142013
1 3841 161
2 476
1 080950
Million EUR
Source: Bulgarian National Bank
Foreign direct investment flows in Bulgaria - TOP 10 countries in 2017
0 200 400 600 800 1000
HungaryLuxembourg
DenmarkFrance
ItalyGreeceTurkey
SwitzerlandGermany
Netherlands 885131130
8175
6347
342825
Million EUR
Source: Bulgarian National Bank
Foreign direct investment flows in Bulgaria by economic activityManufacturing and Wholesale and retail trade attracted about 65% of FDI flows in 2017.
Million EUR
Year 2017All FDI activities 950Manufacturing 313Wholesale and retail trade; repair of motor vehicles and motorcycles 304Financial and insurance activities 246Real estate activities 238Not allocated 85Construction 71Administrative and support service activities 19Arts, entertainment and recreation 10Water supply; sewerage, waste management and remediation activities 7Human health and social work activities 1Other service activities 0Agriculture, forestry and fishing -1Transportation and storage -13Accommodation and food service activities -14Mining and quarrying -26Electricity, gas, steam and air conditioning supply -33Information and communication -33Professional, scientific and technical activities -224
Source: Bulgarian National Bank
TOURISMTourism plays an important role in Bulgaria because of its economic, social and employment potential. The number of international tourists has been growing rapidly. In 2017 Bulgaria attracted a record-high number of tourists – 8.9 million tourists, which is about 8% more than 2016.Foreign tourists in Bulgaria
0
2000
4000
6000
8000
10000
20172016201520142013
6 897 7 311 7 0998 252
8 883Thousand
Source: Ministry of Tourism of the Republic of Bulgaria

Bulgaria in figures – 2018 edition
18 19
Bulgaria in figures – 2018 edition
TOP 10 countries ranked by number of tourists in Bulgaria for 2017
0 200 400 600 800 1000 1200 1400
Ukraine United Kingdom
PolandSerbia
Macedonia Russia Turkey
Germany Romania
Greece 1 1581 139
870636
558545
394394
338305
Thousand
Source: Ministry of Tourism of the Republic of Bulgaria
Тhe ranking by number of tourists for 2017 is headed by Greece with 1158 tousand tourists, followed by Romania with 1139 thousand tourists, and Germany with 870 tousand tourists.
According to data from balance of payment, in 2017 the revenue from international tourism in Bulgaria exceeded EUR 3.6 billion.
Revenue from international tourism in Bulgaria
0
1000
2000
3000
4000
20172016201520142013
2 891 2 945 2 838
3 2853 589
Million EUR
Source: Bulgarian National Bank
CONSUMER PRICESConsumer price indices and annual inflationIn 2017 annual inflation was positive at +2.1 per cent.
This was mainly the result of the continuing rises in international oil, food and commodity prices in euro, which were passed onto final consumer prices of energy products and food.
Consumer price index (annual average inflation rates - %)
-2
0
2
4
20172016201520142013
0.9
-1.4
-0.1 -0.8
2.1
previous year=100
Source: National Statistical Institute
Annual average consumer price index by main categories (annual average inflation rates - %)
previous year=100Main categories 2013 2014 2015 2016 2017Average consumer price index (CPI) 0,9 -1,4 -0,1 -0,8 2,1Food and non-alcoholic beverages 2,8 -1,0 0,3 -0,2 4,0Alciholic beverages and tobacco 0,8 1,1 0,8 2,0 1,5Clothing and footwear -0,3 -1,1 0,6 -0,5 -1,4Housing, water, electricity, gas and other fuels
-0,6 -2,0 3,4 0,0 3,2
Furnishings, household equipment and routine household maintenance
0,1 -1,1 -0,4 -1,5 -0,3
Health -2,5 -3,4 -1,6 -0,2 0,2Transport -0,6 -3,4 -9,1 -6,4 3,7Communication 0,0 -3,5 -3,1 -3,7 -2,6Recreation and culture -1,4 -0,7 2,8 -0,5 -2,5Education 3,0 1,7 2,7 2,7 4,5Restaurants and hotels 3,6 1,2 1,1 1,4 2,5Miscellaneous goods and service 0,7 -0,2 -0,2 -1,2 0,3
Source: National Statistical Institute
Bulgaria in figures – 2018 edition
20 21
Bulgaria in figures – 2018 edition
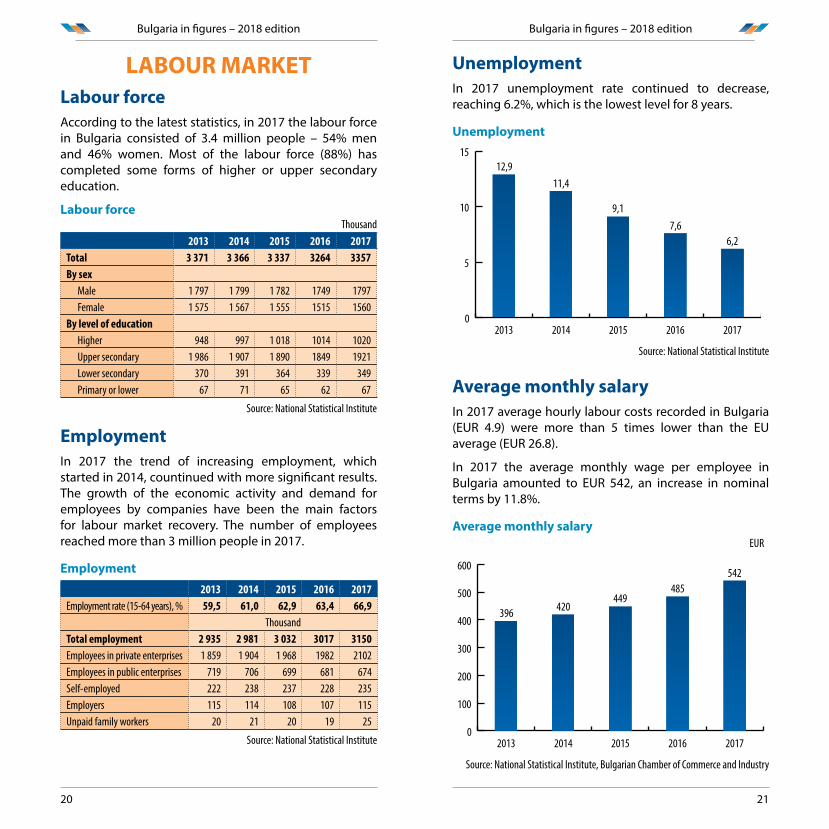
LABOUR MARKETLabour forceAccording to the latest statistics, in 2017 the labour force in Bulgaria consisted of 3.4 million people – 54% men and 46% women. Most of the labour force (88%) has completed some forms of higher or upper secondary education.
Labour force Thousand
2013 2014 2015 2016 2017Total 3 371 3 366 3 337 3264 3357By sex
Male 1 797 1 799 1 782 1749 1797Female 1 575 1 567 1 555 1515 1560
By level of educationHigher 948 997 1 018 1014 1020Upper secondary 1 986 1 907 1 890 1849 1921Lower secondary 370 391 364 339 349Primary or lower 67 71 65 62 67
Source: National Statistical Institute
EmploymentIn 2017 the trend of increasing employment, which started in 2014, countinued with more significant results. The growth of the economic activity and demand for employees by companies have been the main factors for labour market recovery. The number of employees reached more than 3 million people in 2017.
Employment
2013 2014 2015 2016 2017Employment rate (15-64 years), % 59,5 61,0 62,9 63,4 66,9
ThousandTotal employment 2 935 2 981 3 032 3017 3150Employees in private enterprises 1 859 1 904 1 968 1982 2102Employees in public enterprises 719 706 699 681 674Self-employed 222 238 237 228 235Employers 115 114 108 107 115Unpaid family workers 20 21 20 19 25
Source: National Statistical Institute
UnemploymentIn 2017 unemployment rate continued to decrease, reaching 6.2%, which is the lowest level for 8 years.
Unemployment
0
5
10
15
20172016201520142013
12,911,4
9,17,6
6,2
Source: National Statistical Institute
Average monthly salaryIn 2017 average hourly labour costs recorded in Bulgaria (EUR 4.9) were more than 5 times lower than the EU average (EUR 26.8).
In 2017 the average monthly wage per employee in Bulgaria amounted to EUR 542, an increase in nominal terms by 11.8%.
Average monthly salary
0
100
200
300
400
500
600
20172016201520142013
396 420449
485542
EUR
Source: National Statistical Institute, Bulgarian Chamber of Commerce and Industry
22
Bulgaria in figures – 2018 edition
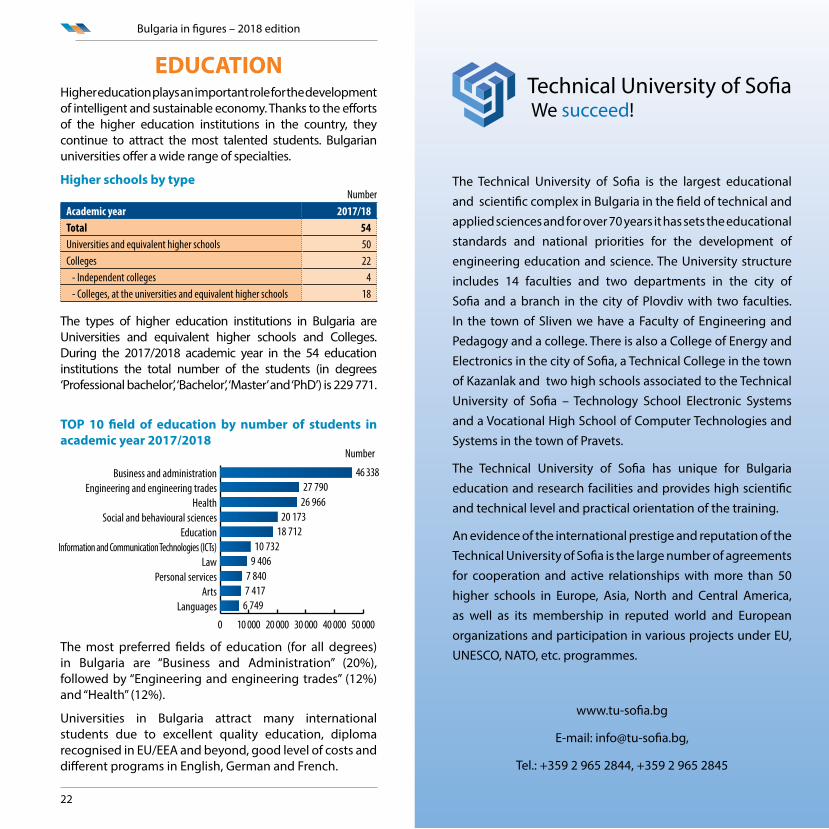
EDUCATIONHigher education plays an important role for the development of intelligent and sustainable economy. Thanks to the efforts of the higher education institutions in the country, they continue to attract the most talented students. Bulgarian universities offer a wide range of specialties.
Higher schools by type Number
Academic year 2017/18Total 54Universities and equivalent higher schools 50Colleges 22 - Independent colleges 4 - Colleges, at the universities and equivalent higher schools 18
The types of higher education institutions in Bulgaria are Universities and equivalent higher schools and Colleges. During the 2017/2018 academic year in the 54 education institutions the total number of the students (in degrees ‘Professional bachelor’, ‘Bachelor’, ‘Master’ and ‘PhD’) is 229 771.
TOP 10 field of education by number of students in academic year 2017/2018
0 10 000 20 000 30 000 40 000 50 000
LanguagesArts
Personal servicesLaw
Information and Communication Technologies (ICTs)Education
Social and behavioural sciencesHealth
Engineering and engineering tradesBusiness and administration 46 338
27 79026 966
20 17318 712
10 7329 406
7 8407 417
6 749
Number
The most preferred fields of education (for all degrees) in Bulgaria are “Business and Administration” (20%), followed by “Engineering and engineering trades” (12%) and “Health” (12%).
Universities in Bulgaria attract many international students due to excellent quality education, diploma recognised in EU/EEA and beyond, good level of costs and different programs in English, German and French.
Тhe Technical University of Sofia is the largest educational and scientific complex in Bulgaria in the field of technical and applied sciences and for over 70 years it has sets the educational standards and national priorities for the development of engineering education and science. The University structure includes 14 faculties and two departments in the city of Sofia and a branch in the city of Plovdiv with two faculties. In the town of Sliven we have a Faculty of Engineering and Pedagogy and a college. There is also a College of Energy and Electronics in the city of Sofia, a Technical College in the town of Kazanlak and two high schools associated to the Technical University of Sofia – Technology School Electronic Systems and a Vocational High School of Computer Technologies and Systems in the town of Pravets.
The Technical University of Sofia has unique for Bulgaria education and research facilities and provides high scientific and technical level and practical orientation of the training.
An evidence of the international prestige and reputation of the Technical University of Sofia is the large number of agreements for cooperation and active relationships with more than 50 higher schools in Europe, Asia, North and Central America, as well as its membership in reputed world and European organizations and participation in various projects under EU, UNESCO, NATO, etc. programmes.
www.tu-sofia.bg
E-mail: [email protected],
Tel.: +359 2 965 2844, +359 2 965 2845
Technical University of SofiaWe succeed!

Bulgaria in figures – 2018 edition
27
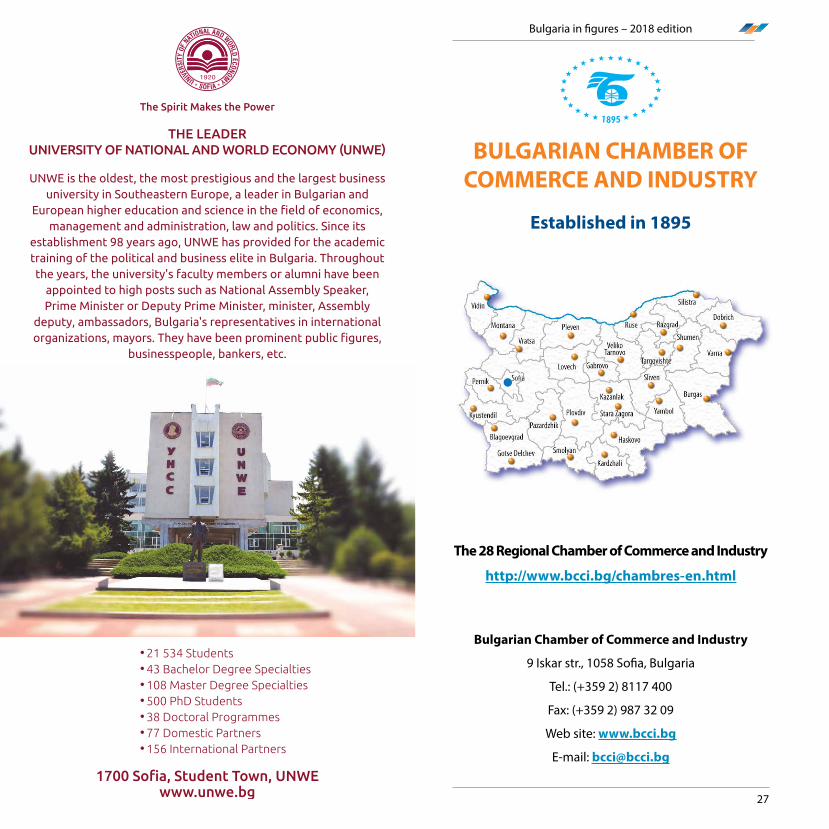
The 28 Regional Chamber of Commerce and Industry
http://www.bcci.bg/chambres-en.html
Bulgarian Chamber of Commerce and Industry
9 Iskar str., 1058 Sofia, Bulgaria
Tel.: (+359 2) 8117 400
Fax: (+359 2) 987 32 09
Web site: www.bcci.bg
E-mail: [email protected]
BULGARIAN CHAMBER OF COMMERCE AND INDUSTRY
Established in 1895
Bulgaria in figures – 2018 edition
28 29
Bulgaria in figures – 2018 edition
BULGARIAN CHAMBER OF COMMERCE AND INDUSTRY – THIRD CENTURY IN BENEFIT OF
TRADE AND INDUSTRY
\ The BCCI is the leading employers’ association in Bulgaria – comprising of over 53 000 members, in which are employed with labor contract more than 844 thousand persons (38% of total employed in the country).
\ The BCCI is based on the principles of voluntary membership, autonomy and self-financing and seeks to establish ethical and socially responsible relationships in business.
\ The BCCI contributes to the creation of a more favourable business environment and dedicates many efforts to the promotion and support of entrepreneurship and innovation initiatives.
\ Тhe BCCI is a part of the Association of the Organizations of Bulgarian Employers (AOBE) – a free union of the four employers’ organizations that are officially acknowledged as representative according to the operating legislation.
\ The BCCI is a universal organization in which all members are companies from various sectors and of different sizes, which comply with the Code of Business Ethics.
\ 28 Regional Chambers of Commerce and Industry are united in the Unified System of Bulgarian Chambers of Commerce and Industry.
\ The BCCI participates in over 200 public-private bodies.
\ The BCCI is a regular member of the International Chamber of Commerce (ICC), World Chambers Federation (WCF), Association of European Chambers of Commerce (Eurochambres), World Trade Centers Association (WTCA), Association of the Balkan Chambers (ABC), Regional Cooperation Council, International Council on Cooperation, BSEC Business Council, Central European Initiative (CEI), GS1 International Association, Enterprise Europe Network (EEN).
\ A Club of Joint and Foreign Chambers in Bulgaria with over 50 organizations operates at BCCI.
\ The 97 Sectorial Organizations are united in a Council of Sectorial Organizations at the BCCI.
\ At BCCI operates an Arbitration Court with 120 years of activity.
Structures and services
TRADE REGISTER AND MEMBERSHIP DIRECTORATEi Additional information:
https://www.bcci.bg/tradereg-general-en1.html
Main activities:1. Trade Register Services
\ Registration in the Unified voluntary trade register of the BCCI – over 53 000 companies and organizations and other legal subjects;
\ Obligatory registration of commercial representative offices of foreign persons in Bulgaria;
\ Maintenance and updating of the information on file subject to registration;
\ Issuing of certificates and references in Bulgarian and foreign languages for the status and financial condition of the registered legal subjects;
\ Providing oral and written references in Bulgarian and foreign languages with data about the registered legal subjects.
2. Membership with BCCI.3. Issuance and validation of documents:
\ Certificates of origin of goods;BCCI is the only organization in Bulgaria accredited by ICC WCF to issue certificates of origin;
\ Validation of signatures.4. Issuance and validation of ATA Carnets.5. Issuance of Force-Majeure Certificates.6. Assistance for validation of invitation-declarations for
business trips of foreigners to the Republic of Bulgaria.7. Assitance in obtaining information about the existence and
current status of foreign companies.8. Obtaining a qualified electronic signature certificate by
physical persons and legal entities respectively StampIT Doc and StampIT DocPro.
9. Excellent SME certificate.10. Carrying out coordination and keeping constant relations
with the 28 Regional Chambers of Commerce and Industry (RCCI).
11. Carrying out coordination with the sectorial organizations members of the Council of Sectorial Organisations with the BCCI.
For Contacts: Zdravka Georgieva, DirectorTel.: (+359 2) 987 88 84, 8117 476Fax: (+359 2) 987 32 09E-mail: [email protected]
Bulgaria in figures – 2018 edition
30 31
Bulgaria in figures – 2018 edition
EUROPEAN INTEGRATION AND EUROPEAN PROJECTS DIRECTORATEi Additional information:
http://www.bcci.bg/projectsBCCI.htm
http://www.bcci.bg/seminars-en.html http://www.bcci.bg/en-een.html http://www.bcci.bg/economic-analyses-en.html
Main activities:1. Participation in EU funded projects.2. Enhancing the BCCI’s capacity to manage activities under EU
programmes.3. Supporting the development and strengthening of the SMEs.4. Enterprise Europe Network is the largest information and
consulting network in the world that helps SMEs to take advantage of business opportunities in the EU single market, to increase their competitiveness in Europe and find reliable technology, business and project partners.
5. Business research inquiries at a request of the customers.6. Economic analyses by sectors.7. Database references about the financial results of a company
or a group of companies.8. Annual classification TOP 100 – The leading companies in the
Bulgarian economy.9. Provision of information based on the annual financial
statements of the companies.10. Publication of annual financial statements.For Contacts: Mariana Tancheva, DirectorTel.: (02) 988 34 82; 8117 508, Fax: (02) 987 32 09E-mail: [email protected]
INTERNATIONAL COOPERATION AND INTERNATIONAL ORGANIZATIONS DIRECTORATEi Additional information:
http://www.bcci.bg/business-delegations-en.html
http://www.bcci.bg/seminars-en.html http://www.bcci.bg/company-presentation.html
Main activities:1. Assistance for establishing business contacts with partners
from all over the word.2. Organizing workshops and seminars with Bulgarian and
foreign lecturers for entrepreneurs.3. Organizing business missions abroad and business forums
and events in Bulgaria.For Contacts: Gabriela Dimitrova, DirectorTel.: (02) 987 25 38; 8117 489, Fax: (02) 987 32 09E-mail: [email protected], [email protected]
ARBITRAТION COURT AT BCCIi Additional information:
http://www.bcci.bg/arbitration/index.html
1. Out-of-court tribunal institution for fast and efficient settlement of private law property disputes.
2. Four times lower taxes for big claims in comparison with the taxes, applied by public court.
3. Possibility to include foreign arbitrators, if the company has more than 50% foreign capital.
4. 98% of the cases are solved within 12 months period.5. Possibility to involve private law enforcement agents.Arbitration Clause, recommended by the BCCI:
“Any disputes arising from this contract or concerning it, including disputes arising from or concerning its interpretation, invalidity, non-performance of termination, as well as disputes about filling gaps in a contract or its adaption to newly arisen circumstances, shall be settled by the Arbitration Court at the Bulgarian Chamber of Commerce and Industry in accordance with its Rules for cases based on Arbitration Agreements.”
For Contacts: Blagovest Punev, PresidentNatalia Stefanova, Secretary of the Arbitration CourtNina Nikolova, Secretary of the Arbitration CourtTel.: (+359 2) 8117 434, (+359 2) 8117 560,Fax: (+359 2) 987 32 09E-mail: [email protected]
GS1 BULGARIAi Additional information:
http://www.gs1bg.org
Member organization of GS1, global, neutral, non-profit standards organization that brings efficiency and transparency to the supply chain. GS1 standards are proven by industry and can help companies achieve their public policy goals.For Contacts: Tzveta Bratanova, CEOTel.: (+359 2) 8117 604E-mail: [email protected]
BCCI – CENTRE FOR VOCATIONAL TRAINING, TRANSLATIONS, CONSULTATIONS AND COMPANY SERVICES EOODi Additional information:
http://www.center.bcci.bg
Main activities:1. Consultations on economic activity; legal issues; projects for
financing; marketing research; tax issues.2. Filling in/elaboration of commercial documents.3. Translation / interpretation services.4. Training.5. Fairs and Exhibitions.For Contacts: Margarita DamyanovaTel.: (+359 2) 8117 477, Fax: (+359 2) 987 32 09E-mail: [email protected]
32
Bulgaria in figures – 2018 edition
INDUSTRIAL ZONESi Additional information:
http://www.bcci.bg/zones/
INDUSTRIAL PARK – STRIMON, SimitliINDUSTRIAL AND BUSINESS PARK AITOS, AitosBURGAS INDUSTRIAL ZONE, BugrasINDUSTRIAL ZONE “MEDEN RUDNIK”, BurgasINDUSTRIAL ZONE “POBEDA”, BurgasINDUSTRIAL ZONE “NORTH”, BurgasINDUSTRIAL ZONE “SOUTH”, BurgasBALGAROVO INDUSTRIAL ZONE, BalgaravoDOBRICH BUSINESS ZONE, DobrichINDUSTRIAL ZONE “NORTH”, DobrichINDUSTRIAL ZONE “WEST”, DobrichGENERAL TOSHEVO INDUSTRIAL ZONE, General ToshevoGABROVO INDUSTRIAL ZONE, GabrovoDIMITROVGRAD INDUSTRIAL ZONE, DimitrovgradFREE ZONE - SVILENGRAD, SvilengradSVILENGRAD INDUSTRIAL ZONE, SvilengradINDUSTRIAL ZONE KARDZHALI - SOUTH, KardzhaliLETNITSA INDUSTRIAL ZONE, LetnitsaTROYAN INDUSTRIAL ZONE, TroyanTECHNOLOGY PARK, MontanaINDUSTRIAL PARK - PAZARDZHIK, SeptemvriINDUSTRIAL ZONE, PernikINDUSTRIAL PARK PERNIK - EAST, PernikINDUSTRIAL ZONE PERNIK, PernikINDUSTRIAL ZONE DOLNA MITROPOLIA, Dolna MitropoliaINDUSTRIAL ZONE - PLEVEN, PlevenTELISH (PLEVEN) INDUSTRIAL ZONE, TelishINDUSTRIAL PARK RHODOPES, PlovdivKRUMOVO LOGISTICS ZONE, PlovdivASSENOVGRAD INDUSTRIAL ZONE, AsenovgradMARITSA INDUSTRIAL AND COMMERCIAL ZONE, PlovdivNORTH INDUSTRIAL ZONE, PlovdivPLOVDIV FREE ZONE, PlovdivKALOYANOVO INDUSTRIAL ZONE, KaloyanovoINDUSTRIAL AND COMMERCIAL ZONE KARADZHALOVO, KaradzhalovoKUKLEN INDUSTRIAL AND COMMERCIAL ZONE, KuklenRAKOVSKI INDUSTRIAL ZONE, StryamaBUSINESS ZONE “PERISTAR” - RAZGRAD, RazgradRUSE EAST INDUSTRIAL PARK, RuseINDUSTRIAL PARK RUSE, RuseIVANOVO INDUSTRIAL ZONE, ShtraklevoKASPICHAN INDUSTRIAL ZONE, KaspichanSHUMEN INDUSTRIAL PARK, ShumenDANUBE INDUSTRIAL PARK, SilistraTCHAVDAR PARK BOTEVGRAD, BotevgradINDUSTRIAL PARK SOFIA, SofiaINDUSTRIAL PARK SOFIA EAST, Elin PelinSAMOKOV INDUSTRIAL ZONE, SamokovINDUSTRIAL PARK PROMOEST BULGARIA, SofiaINDUSTRIAL PARK WEST, SofiaELIN PELIN INDUSTRIAL PARK, Elin PelinGORNA MALINA INDUSTRIAL ZONE, Gorna MalinaINDUSTRIAL PARK - PETARCH, PetarchSTARA ZAGORA INDUSTRIAL ZONE, EleninoINDUSTRIAL ZONE ZSK, Stara ZagoraTARGOVISHTE INDUSTRIAL ZONE, TargovishteINDUSTRIAL ZONE VARNA - WEST, DevnyaFIRST INDUSTRIAL ZONE - AVREN, AvrenINDUSTRIAL ZONE VETRINO, VetrinoSUVOROVO INDUSTRIAL ZONE, SuvorovoVARNA WEST INDUSTRIAL ZONE, VarnaINDUSTRIAL ZONE - SOUTH, STRAZHITSA, StrazhitsaSVISHTOV INDUSTRIAL ZONE, SvishtovVRATZA INDUSTRIAL ZONE, Vratza
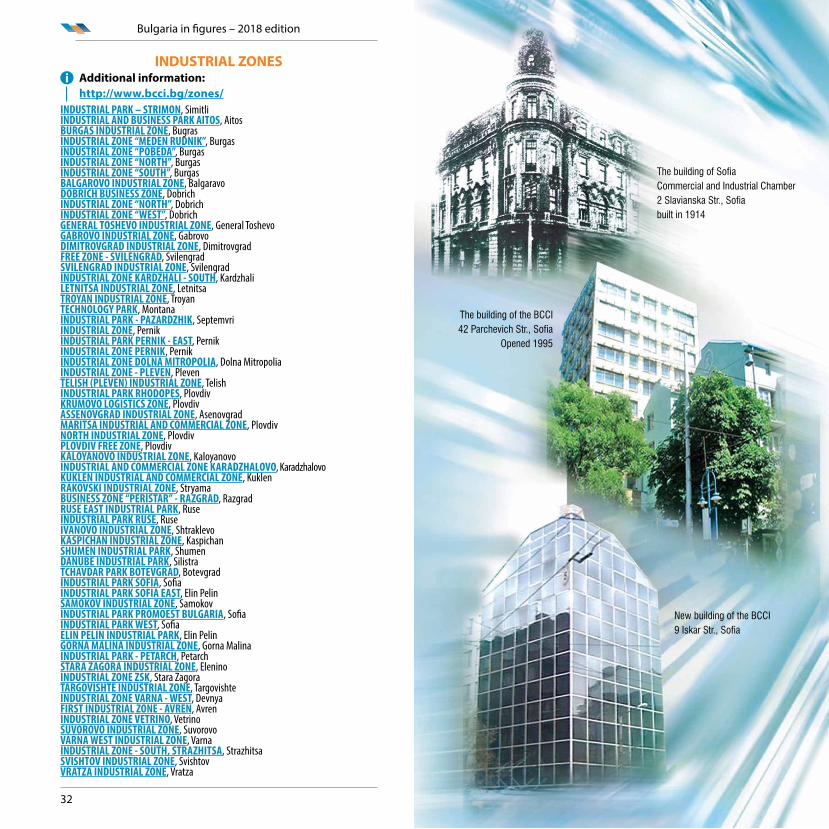
New building of the BCCI9 Iskar Str., Sofia
The building of SofiaCommercial and Industrial Chamber2 Slavianska Str., Sofiabuilt in 1914
The building of the BCCI42 Parchevich Str., Sofia
Opened 1995

Bulgarian Chamber of Commerce and Industry
9 Iskar Str., 1058 Sofia, BulgariaTel.: (+359 2) 8117 400
Fax: (+359 2) 987 32 09Web site: www.bcci.bg
E-mail: [email protected]