Embed Size (px)
Citation preview
©2014 International Monetary Fund
January 2014
IMF Country Report No. 14/23
BULGARIA 2013 ARTICLE IV CONSULTATION
Under Article IV of the IMF’s Articles of Agreement, the IMF holds bilateral discussions with members, usually every year. In the context of the 2013 Article IV consultation with Bulgaria, the following documents have been released and are included in this package: The Staff Report for the 2013 Article IV consultation, prepared by a staff team of the IMF for Executive Board’s consideration on January 24, 2014, following discussions that ended on November 14, 2013, with the officials of Bulgaria on economic developments and policies. Based on information available at the time of these discussions, the staff report was completed on December 23, 2013.
An Informational Annex prepared by the IMF.
A Press Release summarizing the views of the Executive Board as expressed during its January 24, 2014 consideration of the staff report that concluded the Article IV Consultation with Bulgaria.
A Statement by the Executive Director for Bulgaria.
The document listed below has been or will be separately released. Selected Issues Paper
The policy of publication of staff reports and other documents allows for the deletion of market-sensitive information.
Copies of this report are available to the public from
International Monetary Fund Publication Services P.O. Box 92780 Washington, D.C. 20090
Telephone: (202) 623-7430 Fax: (202) 623-7201 E-mail: [email protected] Internet: http://www.imf.org
International Monetary Fund
Washington, D.C.
January 30, 2014
BULGARIA STAFF REPORT FOR THE 2013 ARTICLE IV CONSULTATION
KEY ISSUES Context. Macroeconomic and financial stability has been maintained despite the difficult environment globally—especially in neighboring Greece—and recent domestic discord, but growth remains tepid and unemployment high. Ambitious (and politically challenging) reforms are needed to achieve Bulgaria’s objective of more rapid income convergence with Europe. Outlook and risks. Domestic demand is projected to recover gradually while exports and foreign direct investment are expected to benefit from recovery in Europe. The domestic social and political situation and continued uncertainty about the outlook for external partners present downside risks. Fiscal policy. The unchanged structural stance under the 2014 budget, which sets the deficit close to national fiscal limits, strikes an appropriate balance given low projected growth and a strong underlying fiscal position on the one hand and the importance of maintaining fiscal credibility (particularly in the context of the currency board) on the other. The budget is subject to implementation risk, especially as revenues may fall short of target. The intended increase in capital spending should be accompanied by appropriate project selection and monitoring procedures. Medium-term risks—in particular related to pensions and state-owned enterprises—will need to be addressed. Financial sector policies. The financial system remains well-capitalized and liquid, but profitability is low. Gradual reduction of nonperforming loans through asset disposal will be important to reduce asset price uncertainty and support future investment. Structural policies. Progress in addressing institutional and broader structural gaps (including those that contribute to corruption and cronyism) is needed to set the foundation for stronger growth and job creation. Previous IMF advice. Policy implementation has generally been consistent with IMF recommendations. Prudent fiscal and supervisory policies have been pursued, allowing macroeconomic and financial stability to be maintained. However, recent reforms to strengthen the sustainability of the pension system have been reversed, and the bold structural reforms needed to accelerate growth require new momentum.
December 23, 2013
BULGARIA
2 INTERNATIONAL MONETARY FUND
Approved By Philip Gerson (EUR) and Vivek Arora (SPR)
Discussions were held in Sofia during November 6–14, 2013. The staff team comprised Ms. Shannon (head), Messrs. Lakwijk and Gracia (all EUR), Ms. Weber (FAD), Mr. Quill (MCM), and Mr. Tolosa (Resident Representative), and Ms. Paliova (Resident Representative Office, Economist), with research assistance from headquarters by Mr. Peterson and administrative assistance by Ms. Mahadewa. Mr. Manchev (OED) participated in the discussions. The mission met with Finance Minister Chobanov, Bulgarian National Bank Governor Iskrov, other senior officials, financial sector and industry representatives, labor unions, and civil society organizations. A press conference concluded the visit.
CONTENTS
CONTEXT: A NEED FOR GROWTH ______________________________________________________________ 4
BACKGROUND: LITTLE GROWTH MOMENTUM BUT SOLID FUNDAMENTALS ______________ 5
ECONOMIC OUTLOOK AND RISKS _____________________________________________________________ 13
POLICIES TO ACCELERATE GROWTH AND PRESERVE STABILITY ____________________________ 15
A. Fiscal Policy: Safeguarding Consolidation and Improving Spending Composition ____________ 15
B. Financial Sector: Maintaining Stability and Supporting the Recovery __________________________ 18
C. The Next Generation of Reforms ______________________________________________________________ 20
STAFF APPRAISAL ______________________________________________________________________________ 22 BOXES 1. Pension Reform Reversals _____________________________________________________________________ 16 2. Energy and Railroad Sectors ___________________________________________________________________ 18 3. Resolving NPLs in Bulgaria _____________________________________________________________________ 19 4. Transition to CRD IV ___________________________________________________________________________ 20 FIGURES 1. Trends in Recovery Following Domestic Demand Collapse, 2003–12 ____________________________6 2. Real Sector Developments, 2007–13 _____________________________________________________________7 3. External Sector Developments, 2003–13 _________________________________________________________8 4. Fiscal Developments, 2005–15 ___________________________________________________________________9 5. Inflation and Credit Developments, 2008–13 __________________________________________________ 11 6. Financial Sector Developments, 2007–13 ______________________________________________________ 12
BULGARIA
INTERNATIONAL MONETARY FUND 3
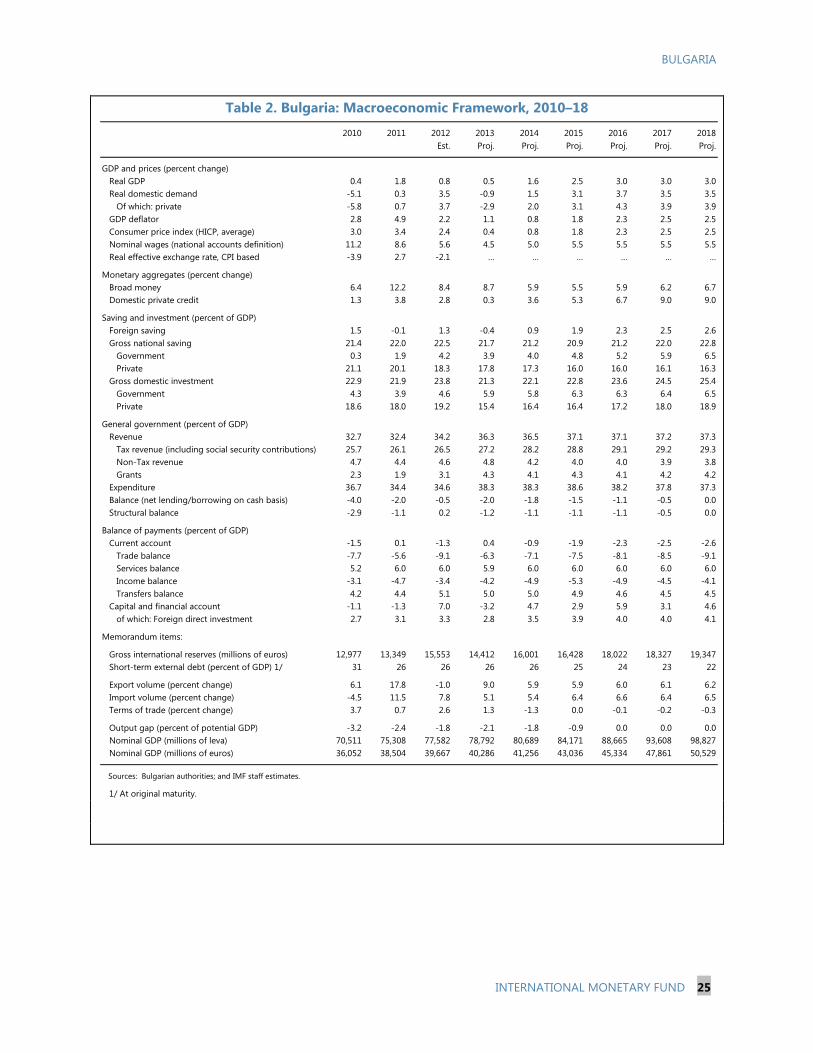
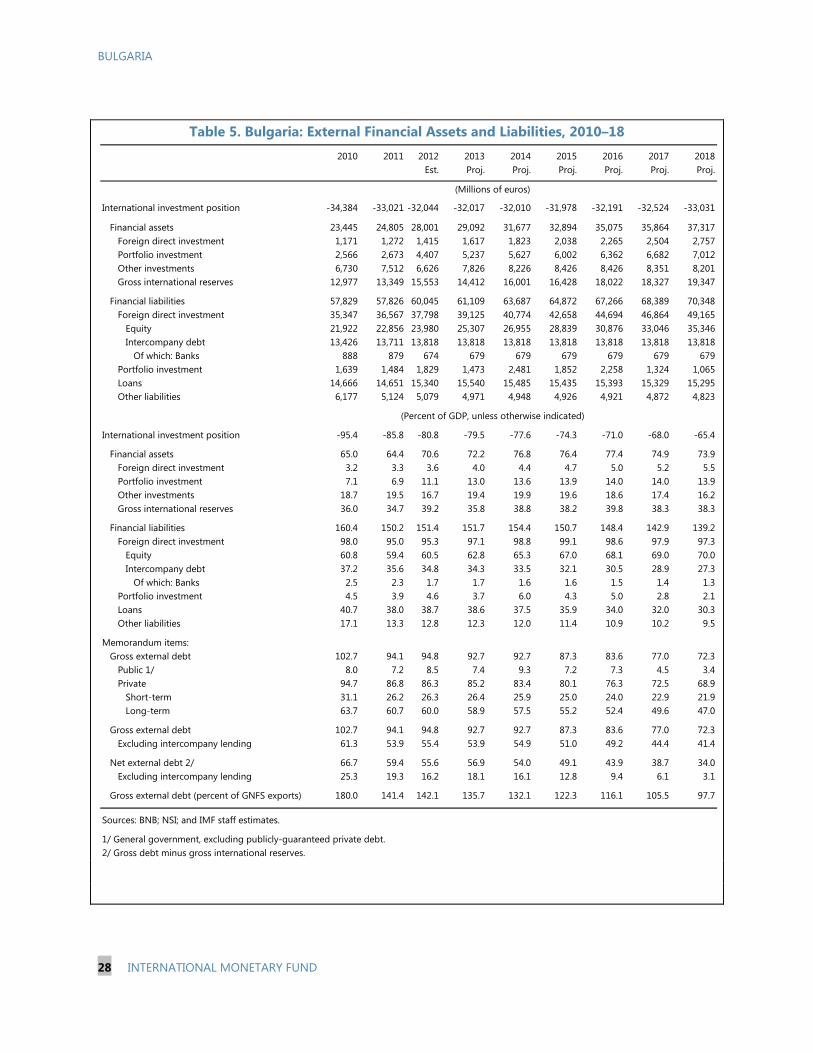
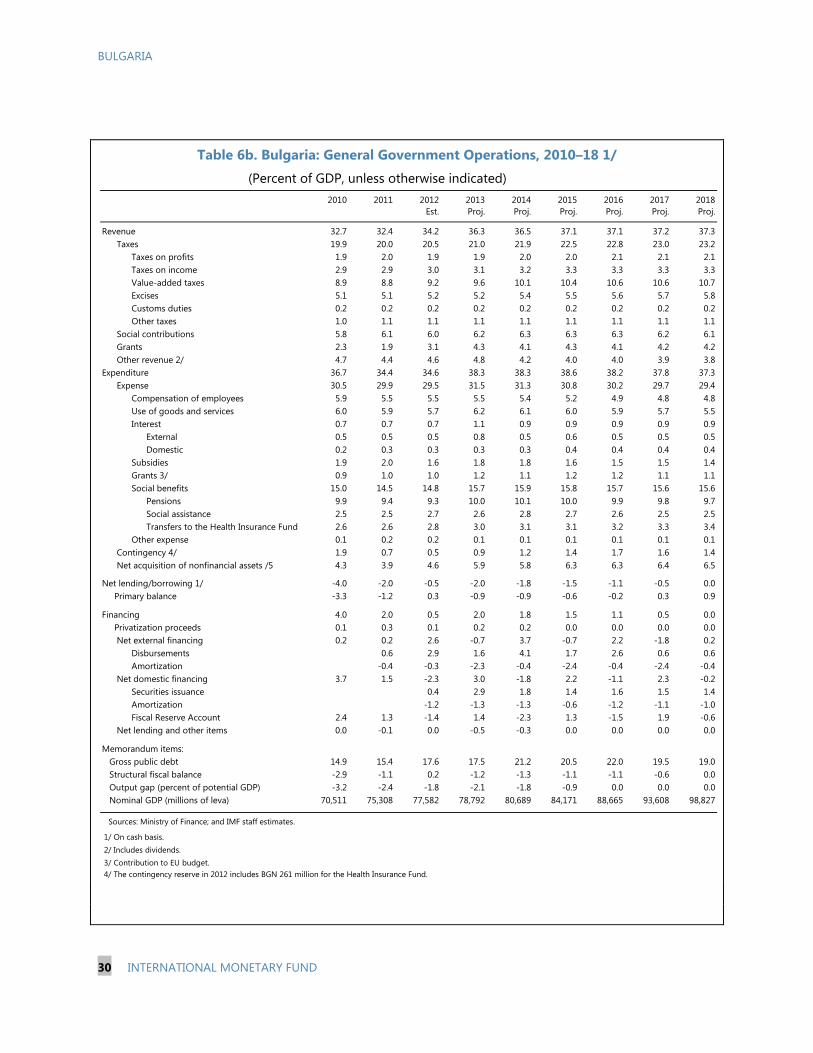
TABLES 1. Selected Economic and Social Indicators, 2010–18 ___________________________________________ 24 2. Macroeconomic Framework, 2010–18 ________________________________________________________ 25 3. Real GDP Components, 2010–18 ______________________________________________________________ 26 4. Balance of Payments, 2010–18 ________________________________________________________________ 27 5. External Financial Assets and Liabilities, 2010–18 _____________________________________________ 28 6a. General Government Operations, 2010–18 __________________________________________________ 29 6b. General Government Operations, 2010–18 __________________________________________________ 30 7. Monetary Accounts, 2010–18 _________________________________________________________________ 31 8. Financial Soundness Indicators, 2010–13 _____________________________________________________ 32 APPENDIX I. External and Public Debt Sustainability Analyses _______________________________________________ 33

BULGARIA
4 INTERNATIONAL MONETARY FUND
-4
-3
-2
-1
0
1
2
3
4
-4
-3
-2
-1
0
1
2
3
4
Croa
tia
Rom
ania
Hun
gary
Turk
ey
Bulg
aria
Euro
are
a
Slov
enia
Russ
ia
Latv
ia
Pola
nd
Esto
nia
Czec
h
Lith
uani
a
Slov
akia
Change in Income Gap with EU(Per capita PPP GDP; US dollar thousands)
2002-2008 2008-2012
2002-2012
US$1.6 thousandworsening of income gap with EU average
0
200
400
600
800
1000
1200
1400
0
200
400
600
800
1000
1200
1400CDS Spreads
Croatia
Latvia
Lithuania
Romania
Turkey
Bulgaria
CONTEXT: A NEED FOR GROWTH 1. Bulgaria has effectively pursued policies to support macroeconomic and financial stability for over a decade, but income convergence with the European Union (EU) has been slow. The stabilization policies established in the second half of the 1990s and firmly implemented since have insulated Bulgaria well against shocks from the global financial crisis, turmoil in neighboring Greece, and recent domestic discord. However, Bulgaria remains the poorest EU member, with income levels about half the EU average. While this marks an improvement in relative terms (up from one-third in 2002), using WEO data the gap in absolute incomes has widened over the last decade.
2. The current year has been marked by social and political turbulence. Underlying concerns include the still fragile recovery, high unemployment, significant poverty, and perceptions of widespread corruption and cronyism. In February, the right-of-center government resigned following street protests sparked by high electricity bills. Following elections, a left-of-center coalition was formed in May holding just half of the parliamentary seats, and the government has faced new protests prompted by a controversial appointment this summer.
3. More ambitious and politically challenging reforms will be needed for Bulgaria to increase the pace of convergence to European income levels. The authorities have rightly emphasized the need to safeguard stability while developing a new paradigm for growth and job creation that does not depend on the extraordinary inflows that characterized the pre-crisis period. Adverse demographic changes, accelerated by emigration, add to the challenge. Progress will require addressing long-standing institutional and broader structural rigidities to enhance domestic competition, reinforce the rule of law, address infrastructure gaps, and strengthen human capital.

BULGARIA
INTERNATIONAL MONETARY FUND 5
3,500
4,500
5,500
6,500
7,500
25
30
35
40
45
50
55
60
1997
1998
1999
2000
2001
2002
2003
2004
2005
2006
2007
2008
2009
2010
2011
2012
Bulgaria: Real GDP(Leva; 2005 prices)
GDP (billion)
GDP per capita (rhs)
Sources: INS; and IMF staff
2011 2012 2013H1
GDP 1.8 0.8 0.2Private consumption 1.5 2.6 0.0Public consumption 1.6 -1.3 3.5Gross fixed investment -6.5 0.8 -0.9
o/w: private -5.6 -3.5 …Net exports and inventories 1/ 2.1 -0.9 -0.2
1/ Contribution to GDP.
(real percent change year on year)
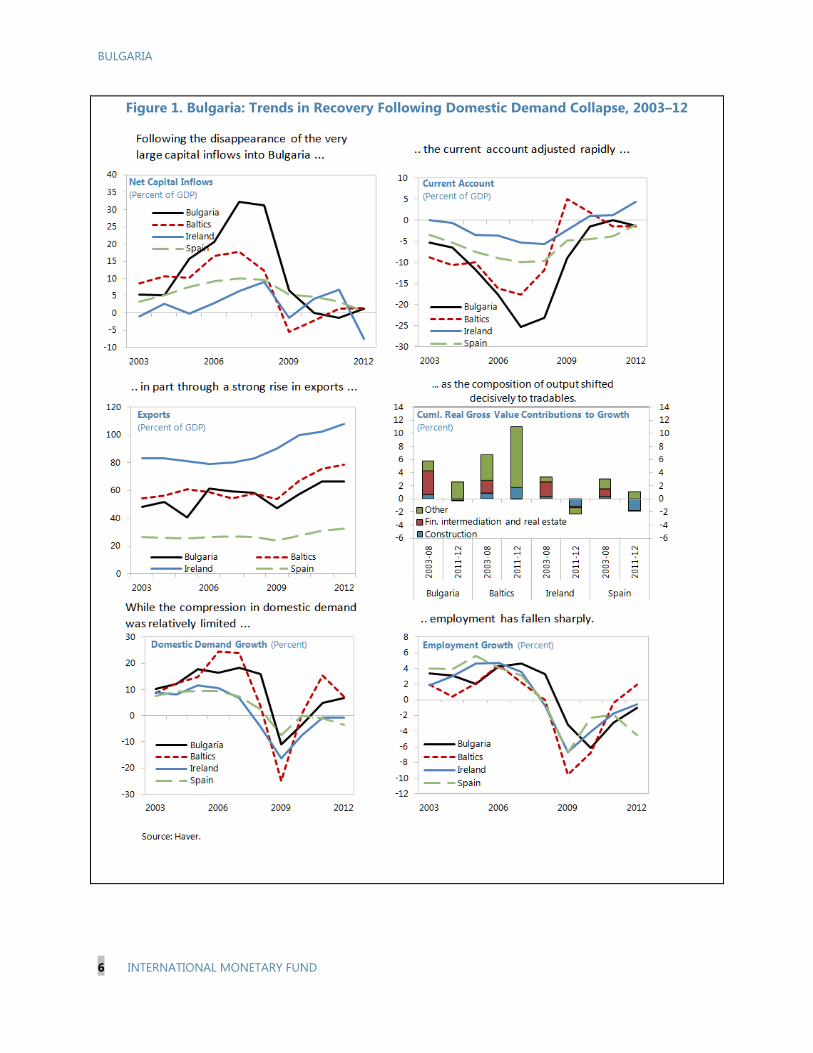
BACKGROUND: LITTLE GROWTH MOMENTUM BUT SOLID FUNDAMENTALS 4. Growth in the aftermath of the global financial crisis has remained low. Output has not yet recovered to pre-crisis levels, and employment has fallen by 13 percent from its peak (Figure 1). Growth declined from 0.8 percent in 2012 to 0.2 percent in the first half of 2013 as domestic uncertainties undermined demand, with unchanged private consumption and a decline in investment (Figure 2 and Tables 1–3). Good agricultural performance, strong export growth (8.0 percent year-on-year), and higher government spending supported the economy. GDP began to recover in the third quarter of 2013 to an estimated 1.5 percent year-on-year as exports continued to perform well.
5. Strong macroeconomic and financial sector policies have mitigated vulnerabilities arising from the difficult external and domestic environment, but challenges remain:
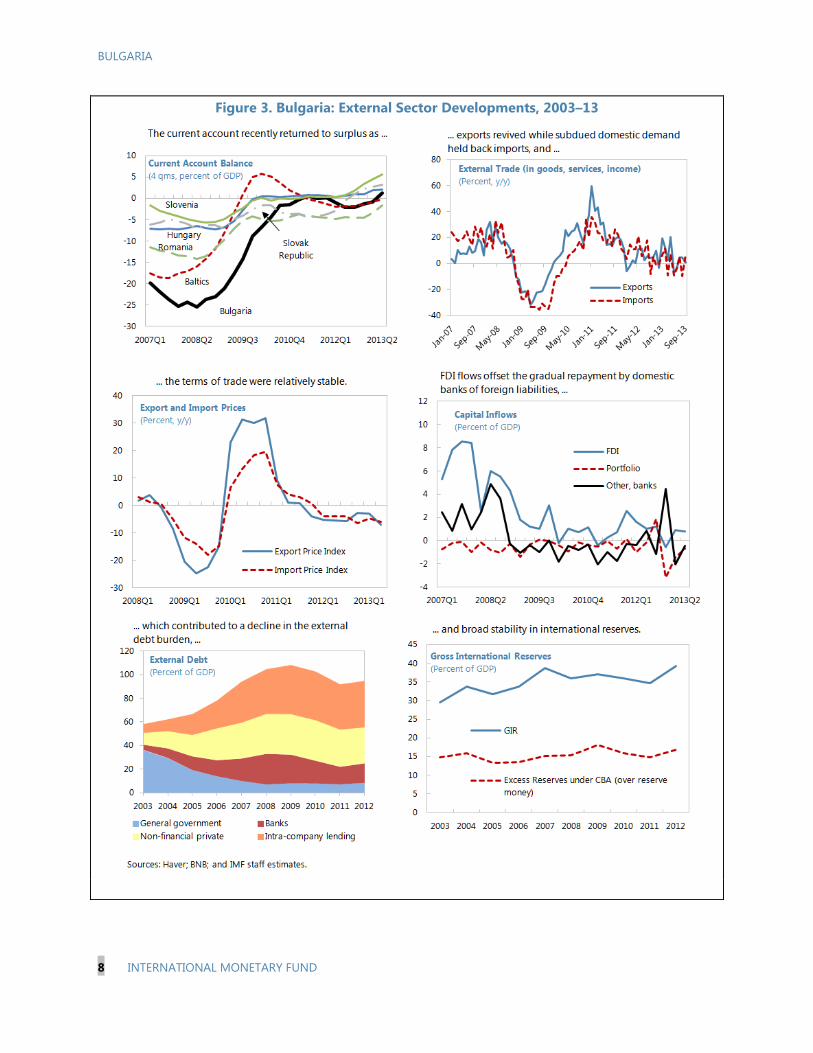
The current account, which reached a deficit of 25 percent of GDP in 2007, is now registering a small surplus, and reserves are comfortable with a reserve adequacy index of 129 (Table 1). Financial inflows are moderate and stable, consisting mostly of FDI at about 3 percent of GDP a year. The international investment position has improved in line with the fall in external debt (Figure 3, Tables 4–5). The reduction in banks’ foreign liabilities has been gradual and is largely driven by plentiful bank liquidity, resulting in a positive net foreign asset position for the first time since 2006. Bulgaria was largely unaffected by the swings in capital flows to emerging markets following concerns about tapering last summer, as its stock market capitalization and domestic public debt are low, at about 10 percent of GDP each, and banks (three quarters of which are subsidiaries of EU banks) are funded mainly by domestic deposits.1
The fiscal deficit fell to 0.5 percent of GDP in 2012, below the budgeted deficit of 1.3 percent of GDP (Figure 4). However, this performance was largely due to lower-than-planned public investment expenditure. Public debt, at 17.6 percent of GDP at end-2012, is the second lowest in the EU and the debt sustainability analysis shows it well contained (Appendix I).
1 Inward spillovers occur more through trade with the euro zone (notably Germany and Italy) and neighboring countries (particularly Romania and Turkey), and direct investment primarily from the European Union (also see “Interconnectedness and Spillovers from the Euro Area to Bulgaria,” 2012 Staff Report, Annex I).
BULGARIA
6 INTERNATIONAL MONETARY FUND
Figure 1. Bulgaria: Trends in Recovery Following Domestic Demand Collapse, 2003–12

BULGARIA
INTERNATIONAL MONETARY FUND 7
Figure 2. Bulgaria: Real Sector Developments, 2007–13
BULGARIA
8 INTERNATIONAL MONETARY FUND
Figure 3. Bulgaria: External Sector Developments, 2003–13

BULGARIA
INTERNATIONAL MONETARY FUND 9
Figure 4. Bulgaria: Fiscal Developments, 2005–15

BULGARIA
10 INTERNATIONAL MONETARY FUND
-5
-3
0
3
5
8
-10
-5
0
5
10
15
2004
Q1
2004
Q3
2005
Q1
2005
Q3
2006
Q1
2006
Q3
2007
Q1
2007
Q3
2008
Q1
2008
Q3
2009
Q1
2009
Q3
2010
Q1
2010
Q3
2011
Q1
2011
Q3
2012
Q1
2012
Q3
2013
Q1
Employment and unemployment, 2004-13(Percent)
Unemployment rate change (y/y, rhs)Employment (y/y)Unemployment rate
Source: NSSI.
0
20
40
60
80
100
120
140
160
180
80
85
90
95
100
105
110
115
120
2000 2002 2004 2006 2008 2010 2012
Real Unit Labor Cost(2005=100)
Bulgaria EstoniaIreland SpainLatvia LithuaniaRomania (rhs)
Source: Haver.
Methodology REER required adjustment
Underlying current
Current account
Macroeconomic balance approach 1 4.9 -1.5 -3.3External sustainability approach 1/ 7.0 -1.5 -4.0Equilibrium exchange rate 2.5 … …
1/ The current account elasticity with respect to the REER is 0.3.
Bulgaria: Exchange Rate Assessment
0.00
0.02
0.04
0.06
0.08
0.10
0.12
0.0
0.1
0.2
0.3
0.4
0.5
0.6
0.7
0.8
0.9
2000 2002 2004 2006 2008 2010 2012
Export Shares(Percent of Partner Imports)
Europe
World (excl. Europe; rhs)
Source: DOTS
Inflation has been low and in line with that of trading partners in recent years (Figure 5). Following reductions in administered electricity prices, inflation turned negative in the second half of 2013. Credit growth, which peaked at 63 percent in 2007, has been flat in 2013.
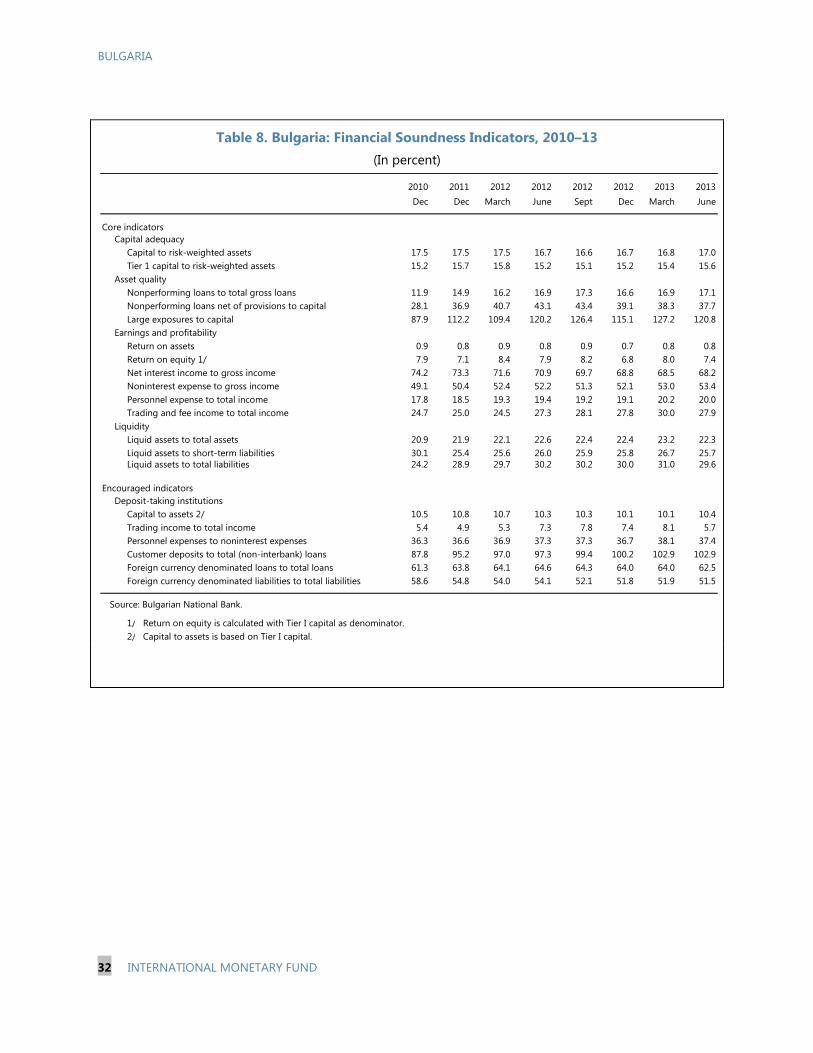
Capitalization and liquidity of the financial sector are high (Figure 6). Although gross nonperforming loans (NPLs)—a legacy from the boom period and subsequent crisis—amounted to 17.2 percent of loans in September, coverage by provisions is comfortable at 72.7 percent.
The REER is broadly in line with fundamentals. Estimates suggest that the exchange rate is slightly undervalued, the current account is somewhat stronger than the norm, and Bulgaria’s export market share
has gradually increased. However, real unit labor costs remain higher than in the boom years (with continued increases in nominal wages), international reserves remain broadly stable, and the rise in market share is consistent with Bulgaria’s ongoing integration in the world economy.
Reductions in unemployment over the last decade have been erased as a result of the crisis. While employment rose slightly in 2013, the unemployment rate has not begun to decline as more of the population entered the workforce. Given that the output gap is not large, most of the unemployment is structural and characterized by significant age, gender, and regional disparities.2
2 See “Growth and Employment,” Selected Issues Papers.

BULGARIA
INTERNATIONAL MONETARY FUND 11
Figure 5. Bulgaria: Inflation and Credit Developments, 2008–13
-20
-10
0
10
20
30
2009
M1
2009
M4
2009
M7
2009
M10
2010
M1
2010
M4
2010
M7
2010
M10
2011
M1
2011
M4
2011
M7
2011
M10
2012
M1
2012
M4
2012
M7
2012
M10
2013
M1
2013
M4
2013
M7
Net Foreign Assets(Percent of GDP)
Net foreign Assets Foreign Assets
Foreign Liabilities
-6
4
14
24
34
44
2009
M1
2009
M4
2009
M7
2009
M10
2010
M1
2010
M4
2010
M7
2010
M10
2011
M1
2011
M4
2011
M7
2011
M10
2012
M1
2012
M4
2012
M7
2012
M10
2013
M1
2013
M4
2013
M7
Credit Growth (Percent, y/y)
TotalCorporatesHouseholdsMortgages
-5
0
5
10
15
20
2008
M1
2008
M7
2009
M1
2009
M7
2010
M1
2010
M7
2011
M1
2011
M7
2012
M1
2012
M7
2013
M1
2013
M7
BGRESTLVALTHROMEA
HICP Inflation (Percent, y/y)
-2
0
2
4
6
8
10
12
14
16
18
2008
M1
2008
M7
2009
M1
2009
M7
2010
M1
2010
M7
2011
M1
2011
M7
2012
M1
2012
M7
2013
M1
2013
M7
Food
Energy
Core
Headline (y/y)
HICP inflation and contributions (Percent)
1/ Hungary, Slovakia, Czech Republic, Romania, Poland, Lithuania, Slovenia, Latvia, and Bulgaria.
Sources: Haver; BNB; IFS; and IMF staff estimates.
… while credit growth has become negligible ...
In recent months core and energy price inflation have turned negative ...
... leading to lower headline inflationthan in other countries.
Strong deposit growth has continued ...
... across sectors. Meanwhile, banks' foreign assets are rising whileexternal funding lines have stabilized (relative to GDP).
-6
4
14
24
34
44
2009
M1
2009
M4
2009
M7
2009
M10
2010
M1
2010
M4
2010
M7
2010
M10
2011
M1
2011
M4
2011
M7
2011
M10
2012
M1
2012
M4
2012
M7
2012
M10
2013
M1
2013
M4
2013
M7
Credit Growth (Percent, y/y)
Total
Lev
FX
-10
-5
0
5
10
15
20
25
2009
M1
2009
M4
2009
M7
2009
M10
2010
M1
2010
M4
2010
M7
2010
M10
2011
M1
2011
M4
2011
M7
2011
M10
2012
M1
2012
M4
2012
M7
2012
M10
2013
M1
2013
M4
2013
M7
Deposit Growth(Percent, y/y)
Bulgaria CEE 1/

BULGARIA
12 INTERNATIONAL MONETARY FUND
Figure 6. Bulgaria: Financial Sector Developments, 2007–13

BULGARIA
INTERNATIONAL MONETARY FUND 13
ECONOMIC OUTLOOK AND RISKS 6. Output is projected to recover slowly. Domestic demand is projected to recover gradually, and exports and foreign direct investment will benefit from recovery in Europe. Inflation is projected to be positive but subdued in the short term and, given faster tradables sector productivity and wage growth, slightly above that in the EU in the medium term. The current account would return to a modest deficit in the medium term financed by FDI.
7. Convergence to EU income levels over the coming decades requires accelerated growth. In the baseline, GDP growth is projected to increase from ½ percent in 2013 to 3 percent in the medium term, whereas the EU is projected to reach a growth rate of 2 percent by 2018—a difference of 1 percentage point that implies only very gradual income convergence. Even with a sustained growth differential of 2 percentage points, full income convergence would still take four decades to be achieved.
8. Staff’s views on risks are summarized in the Risk Assessment Matrix (RAM).
On the domestic side, the political situation remains strained, making needed structural reforms all the more difficult, although Bulgaria’s track record suggests the risk of excessive fiscal relaxation is low. In the financial sector, continued high levels of NPLs, while well provisioned, imply a “collateral overhang” (bad loans backed by property that has not yet been seized and sold) that may deter new investment because of the uncertainty this can create about underlying asset values.
On the external side, uncertainty regarding the economic situation in Europe or other partners may have adverse implications for trade and investment. External debt remains significant (92.7 percent of GDP at mid 2013) but has been falling and presents limited rollover risks (see Appendix I).
In view of the risks, discussed further in the policies section below, it is imperative to move ahead with growth-enhancing reforms and reinforce defenses to support readiness to respond to adverse shocks. The response to sizable adverse shocks would include utilization of automatic stabilizers, as long as financing conditions permit.
9. The authorities’ views on the outlook and risks were close to the staff’s. They saw slightly more upside in the near term, with a stronger recovery in domestic demand; they also noted that their baseline projections do not take into account the “South Stream” gas pipeline, construction of which they expected to begin in 2014. They agreed on potential external downside risks, but also noted that ongoing diversification of exports to emerging markets was helping reduce their vulnerability to European shocks. Regarding the financial sector, they emphasized that buffers were significant and NPLs did not pose stability concerns, but they agreed that various structural constraints—including related to the legal system—had a negative effect on the pace of disposal of seized collateral by banks.

BULGARIA
14 INTERNATIONAL MONETARY FUND
Bulgaria: Risk Assessment Matrix (as of November 14, 2013)3
(Scale: high, medium, or low)
Source of Risk
Relative Likelihood
Impact if Realized
1. Inadequate implementation
of structural reforms to raise productivity and offset impact of emigration and aging (short/medium term).
High
Intensified political and social discord postpones the structural reform agenda, including reforms that would reduce medium-term fiscal risks.
High
Low potential growth and high structural unemployment resulting in a lack of income convergence; increased fiscal pressures.
2. Excess fiscal relaxation (medium term)
Low
Heightened spending pressures in a context of political and social discord; lack of progress in addressing medium-term fiscal risks.
High
Loss of standout Bulgarian advantage of fiscal prudence; increased vulnerability to shocks.
3. NPLs leave asset price
uncertainty (short/medium term).
Medium
Impediments to releasing collateral associated with NPLs, including judicial bottlenecks and administrative costs.
Medium
Lower investment reduces growth.
4. Protracted period of slower European growth (medium term).
High
Direct negative influence through trade and investment channels.
High
Low potential growth, high structural unemployment and low FDI; continued downturn raises fiscal pressures.
5. Deeper emerging market
slowdown (short/medium term).
Medium
Negative surprise, mainly through trade channels.
Medium
Low potential growth, high structural unemployment.
6. Financial stress in the euro area re-emerges (short term)
Medium
Adverse effects from financial stress of parent banks/corporate and through trade and investment channels.
Medium
Funding pressures; lower exports, employment, FDI, and growth; continued downturn raises fiscal pressures.
3 The Risk Assessment Matrix (RAM) shows events that could materially alter the baseline path (the scenario most likely to materialize in the view of IMF staff). The relatively likelihoods of risks listed is the staff’s subjective assessment of the risks surrounding the baseline. The RAM reflects staff’s views on the sources of risk and overall level of concern as of the time of discussions with the authorities.
BULGARIA
INTERNATIONAL MONETARY FUND 15
POLICIES TO ACCELERATE GROWTH AND PRESERVE STABILITY 10. Thanks to its robust policy framework, Bulgaria has successfully withstood recent challenges. Following tumultuous early transition years and the 1997 crisis, a period of stabilization began with the establishment of the currency board and supporting policies, including low fiscal deficits and debt, as well as conservative banking supervision. The robust macroeconomic framework was instrumental in supporting growth and EU membership before the global financial crisis (albeit with extraordinary inflows fueling a boom). Buffers built up during the pre-crisis period helped to mitigate the worst effects of the crisis on growth, although unemployment increased sharply.
11. Looking forward, the authorities recognize the need to safeguard stability while setting the conditions for accelerated growth and job creation. The authorities remain committed to the policies that are needed to support the currency board—which introduced policy predictability and controlled inflation—as the natural bridge to eventual euro adoption. At the same time, they recognize the need for broader reforms to set the conditions for higher growth, lower unemployment, and reduced incentives for migration.
A. Fiscal Policy: Safeguarding Consolidation and Improving Spending Composition
Background
12. After several years of consolidation, the fiscal deficit is projected to increase to 2 percent of GDP in 2013, and the structural deficit to 1 percent of GDP. About half of the increase results from pension increases (after a three year freeze), while spending related to EU funds, largely offset by EU grants, is set to rise by 1¼ percent of GDP. Administrative improvements raised tax revenues to help contain the deficit. Public financing needs remain low, and the fiscal reserve is stable at about 6 percent of GDP (mostly comprising working balances and pledged funds), compared to a pre-crisis peak of 17 percent of GDP.
13. The 2014 budget, consistent with national rules and EU objectives, targets a deficit of 1.8 percent of GDP, leaving the structural deficit little changed. Tax revenues are budgeted to rise by about 1 percent of GDP, mainly through further administrative measures. A reversal of recent pension reforms will take effect in July (Box 1). An increase in social protection spending has been budgeted while operational expenditures are expected to be restrained. The new national
2009 2010 2011 2012 2013
Capital spending (percent of GDP) (Proj.)
Actual 5.1 4.3 3.9 4.6 5.9
Budgeted 7.6 5.8 4.8 6.8 6.8
EU funds absorption (percent) 3 10 19 27 50
Sources: Bulgarian authorities; and IMF staff estimates.

BULGARIA
16 INTERNATIONAL MONETARY FUND
-7
-6
-5
-4
-3
-2
-1
0
After 2011/2012 pension reforms
retirement age freeze for one year + Swiss indexation
Retirement age freeze + Swiss Indexation
1/ Includes average pension increase of 9.3 percent as of April 1, 2013.Source: NSSI Bulgaria.
Balance of the State Social Insurance Budget 1/(Percent of GDP)
investment fund (0.6 percent of GDP) is expected to finance municipal investment following a competitive bidding process overseen by the Council of Ministers. The government’s 2014–16 fiscal framework implies a structural deficit of 1 percent of GDP, consistent with national rules and EU objectives, with spending increases concentrated on investment.4
Box 1. Pension Reform Reversals
Recent pension changes worsen pension sustainability. From July 2014, automatic indexation will be implemented based on the “golden Swiss rule” that links pension increases to the average growth of insurable income and CPI inflation. In addition, the gradual increase in the retirement age, part of the 2011 pension reform and started in 2012 (to reach 65 years for men by 2017 and 63 years for women by 2020), has been halted. Thus, the pension deficit by 2040 is now projected to be near 6 percent of GDP instead of 4 percent of GDP. The deficit is financed by the budget and crowds out other spending, which is increasingly coming under pressure as the population ages.
14. The new public finance law that enters into force in 2014 (as well as EU legislation) requires the government to set up an independent fiscal body. The fiscal council that is being established consists of 5 members (including a chairperson) that will be elected by parliament, and one administrative staff. Its mandate will include issuing opinions on the draft budget and budget execution, the monitoring of fiscal rules, and the activation of corrective mechanisms and escape clauses.
Policy Issues
15. The fiscal impulse in 2013 and the neutral fiscal stance for 2014 are appropriate. Given the unanticipated slowing of the economy in 2013, the discretionary fiscal impulse was fortuitous. The composition of spending was improved through an increase in the share of investment
4 Bulgaria’s maximum structural deficit under the new public finance law and the EU medium-term objective is 1 percent of GDP (given that public debt is under 40 percent of GDP) on an accrual basis. National rules specify a headline cash deficit ceiling of 2 percent of GDP (the annual difference between cash and accrual is small with an average of 0.2 percent of GDP in recent years).
BULGARIA
INTERNATIONAL MONETARY FUND 17
spending and greater absorption of EU funds, both particularly welcome given their positive long-term growth effects.5 Increases in social protection spending beyond the pension increases were limited and targeted. In 2014, keeping the structural deficit unchanged strikes an appropriate balance between postponing consolidation given the modest projected growth and maintaining fiscal credibility—particularly important in the context of the currency board—by observing domestic deficit limits and EU objectives. There are, however, implementation risks with the 2014 budget. While the South Stream project provides potential revenue upside, revenues may underperform if domestic demand or administrative reforms disappoint, or, as projected by staff, inflation is subdued. In such a case and with the budgeted deficit already at or near deficit limits, expenditures would need to be restrained and heightened spending pressures carefully managed to meet the deficit target (see RAM). At the same time, it will be important to ensure efficiency and transparency in management of the new public investment fund, and the independence of the new fiscal council should be supported through adequate staff and resources.
16. Fiscal buffers should be rebuilt over time by targeting a balanced structural budget after 2016. This would allow a substantial liquidity buffer to be built up in the fiscal reserve in good times and automatic stabilizers to work in the event of a shock. As discussed in last year’s Staff Report, rebuilding the fiscal reserve by saving fiscal surpluses would bolster the defenses that Bulgaria needs given shallow domestic financial markets, periodic closing of international markets, intervention limitations inherent in its currency board, and prevailing risks.
17. There is scope to improve the targeting and efficiency of social spending. While recent studies suggest that social protection spending helped to mitigate the income effects of the crisis in Bulgaria, they also point to relatively weak results in terms of poverty reduction, as well as substantial inefficiencies, particularly in health-related spending. Given constrained fiscal space, reforms should focus on improving the allocation of existing social protection spending, including to provide room for greater social assistance spending, for which coverage is currently low.6
18. Medium-term fiscal risks arise from the reversal of pension reform and from contingent liabilities related to some state-owned enterprises. The recent pension reform reversals, without compensatory measures, add to already substantial budgetary pressures from an aging population, with adverse budgetary implications that are limited in the early years but substantial over the longer term. The weak financial position of firms in the railroad sector and some segments of the energy sector, which staff discussed with the World Bank, could represent significant fiscal risks if not adequately addressed (Box 2). As suggested by the European Commission, details on such contingencies should be provided in budget documents.
5 See “Making the Fiscal Framework and Policy More Supportive of Growth,” 2012 Staff Report, Annex III; and Weber and Muir, “Fiscal Multipliers in Bulgaria: Low but Still Relevant,” IMF, WP/13/49. 6 See “Fiscal Policy and Social Protection,” Selected Issues Papers.

BULGARIA
18 INTERNATIONAL MONETARY FUND
Box 2. Energy and Railroad Sectors
Energy. With the economy highly energy intensive, the state-owned vertically-integrated Bulgaria Energy Holding (BEH) accounts for almost half of Bulgaria’s generating capacity. A large BEH subsidiary, the National Electricity Company (NEK), faces financial difficulties given contractual obligations to high purchase prices coupled with low administered prices.1 BEH has recently issued an international bond to provide NEK with liquidity and NEK’s energy exports have been expanded. Sustained efforts to address NEK’s situation, such as outlined by the World Bank, are needed to avoid future impact on the government’s budget. Railroads. Traffic has declined about 70 percent since the mid-1990s, and annual subsidies amount to ½ percent of GDP. The state railway operator defaulted in 2010 and is negotiating with its creditors. A reform agreed with the World Bank and privatization efforts for the freight company are currently on hold. ________________________ 1 See http://documents.worldbank.org/curated/en/2013/05/17776422/republic-bulgaria-power-sector-rapid-
assessment.
19. The authorities underlined their continued commitment to fiscal stability. They are committed to remaining within the 2 percent of GDP domestic deficit ceiling in 2014 and maintaining a structural deficit of about 1 percent of GDP through 2016. They agreed that a return to a balanced structural budget over time would be useful to help rebuild buffers. On spending composition, they see the creation of the public investment fund as a way to increase investment at the municipal level. They recognized the importance of pension sustainability and saw the halt in increases to the retirement age as temporary. On social spending, the authorities aim to improve the accessibility and effectiveness of social transfers and services, in particular for children and older people, and acknowledged the need for more efficient health care spending.
B. Financial Sector: Maintaining Stability and Supporting the Recovery
Background
20. The financial system remains stable and liquid, although profitability has declined. Liquidity remained plentiful due to rising deposits and low credit demand. At the same time, external liabilities of the banking system declined further to 16 percent of GDP compared to an end-2008 peak of 27 percent, and banks’ net foreign assets reached a small surplus compared to a peak deficit of 18 percent of GDP in 2008. IFRS provisioning for NPLs has affected profits, but capital adequacy remains high with all banks meeting the minimum regulatory requirement of 12 percent and system-wide capital at 16.9 percent of risk-weighted assets as of September 2013.
21. NPLs have stabilized, but remain near their peak. As of September, 17.2 percent of loans were classified as impaired (with most of them in excess of 180 days past due). Some banks have recently been more proactive in resolving NPLs by claiming and removing associated collateral from
BULGARIA
INTERNATIONAL MONETARY FUND 19
their balance sheets, a process that is made difficult by a number of factors, including a depressed real estate market and an ineffective and unpredictable insolvency framework (see RAM and Box 3).
Box 3. Resolving NPLs in Bulgaria
A strategy to gradually reduce the stock of NPLs will improve the investment environment and help sustain the recovery while preserving stability. However, a number of constraints have limited progress: With NPLs well provisioned, many banks see benefit in a “wait and see approach.” Banks report that they expect collateral values to improve as the economy recovers and the current political uncertainty is resolved. The foreclosure process is marked by uncertainty about its cost, length, and outcome. This uncertainty also contributes to the wait-and-see approach by banks. Disincentives in the tax system for quick write offs. It is uncertain when losses can be recognized for tax purposes. Limited scope for market-based solutions. Like in many Eastern and Central European countries, the market for distressed assets is underdeveloped, with limited experience with direct sales and securitization.
22. The EU Capital Requirements Directive (CRD IV) that becomes effective in 2014 will require supervisory changes. Capital–based (“specific”) provisions will need to be phased out and the minimum capital adequacy requirements adapted to the new framework (Box 4).
Policy issues
23. Recent efforts by some banks to address the stock of distressed assets and claim associated collateral are steps in the right direction. Credit risk to regulatory capital is substantially mitigated by the current dual provisioning scheme, and plentiful liquidity implies that credit growth at present is not restricted by supply factors. Reduction of NPLs through asset disposal and release of associated collateral will also be important to reduce the administrative and legal costs to banks associated with managing these assets and, more broadly, to reduce asset price uncertainty and support future investment.
24. Recent improvements to the insolvency framework that limit the backdating of insolvencies are welcome but further reforms are needed. Recommendations in last year’s Staff Report remain valid, including the introduction of a fast-track court approval procedure for pre-agreed reorganization plans and out-of-court debt restructuring guidelines, which in other countries have facilitated speedy, cost-effective, and market-friendly settlements. The treatment of loan losses in the tax system should be adjusted to remove potential disincentives to write offs.
BULGARIA
20 INTERNATIONAL MONETARY FUND
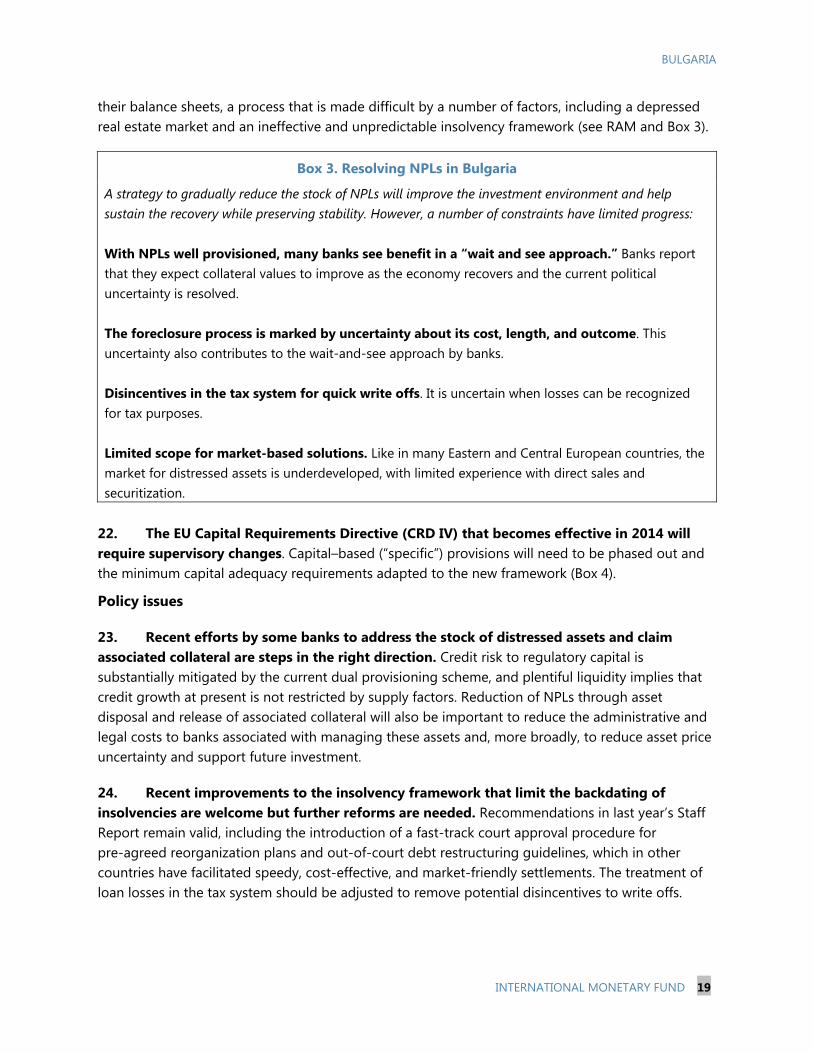
Estonia 28Poland 38Slovenia 43Lithuania 43Hungary 47Latvia 49Turkey 53Czech Republic 57Croatia 57Slovakia 61FYR Macedonia 67Montenegro 67Romania 69Serbia 72Bosnia and Herzegovina 72Bulgaria 77Moldova 102Kosovo 111Albania 116Belarus 123Russia 127Ukraine 144
Source: Transparency International.
Corruption Perception in CESEE(Rank in world, 2013)
Box 4. Transition to CRD IV
BNB supervisory authorities have maintained conservative capital buffers. Under IFRS, expected losses from future events and forward looking considerations are not taken into account. However, BNB supervisory authorities have complemented IFRS provisions with additional capital cushions (“specific provisions”) calculated on an expected loss model and deducted from regulatory capital. Specific provisions are a segregated part of capital that do not affect reported profits (unlike IFRS provisions) but are excluded when computing regulatory capital. Under CRD IV specific provisions will need to be phased out but the authorities are taking steps to preserve appropriate buffers. In order to promote capital conservation, BNB supervisors plan to use available national discretion under the CRD IV package. Specifically, the authorities will use the flexibility under Pillar 1 of the Basel Accord to impose the maximum capital conservation and systemic capital buffers on all banks. In addition, the BNB will use the national discretion afforded under Pillar 2 to impose higher capital requirements on those institutions exhibiting a higher risk profile.
25. The authorities will maintain their conservative approach to bank supervision under the new European framework. They view existing capital and liquidity buffers as critical to maintaining stability. They intend to use available flexibility to maintain high capital adequacy requirements and ensure conservative collateral valuation, which will be particularly important once specific provisions are eliminated. They view NPLs as adequately provisioned to insulate against risks to the stability of the system and recognize that their gradual reduction would be supported by greater efficiencies in the legal system. The authorities do not intend to participate in the close cooperation framework of the Single Supervisory Mechanism, noting the absence of liquidity and solvency support as well as the lack of voting rights in the Governing Council of the ECB for non euro area participants. They remain fully engaged in the reform process at the European level, however, and emphasized the importance of ensuring equal treatment in the new framework for all EU member states.
C. The Next Generation of Reforms
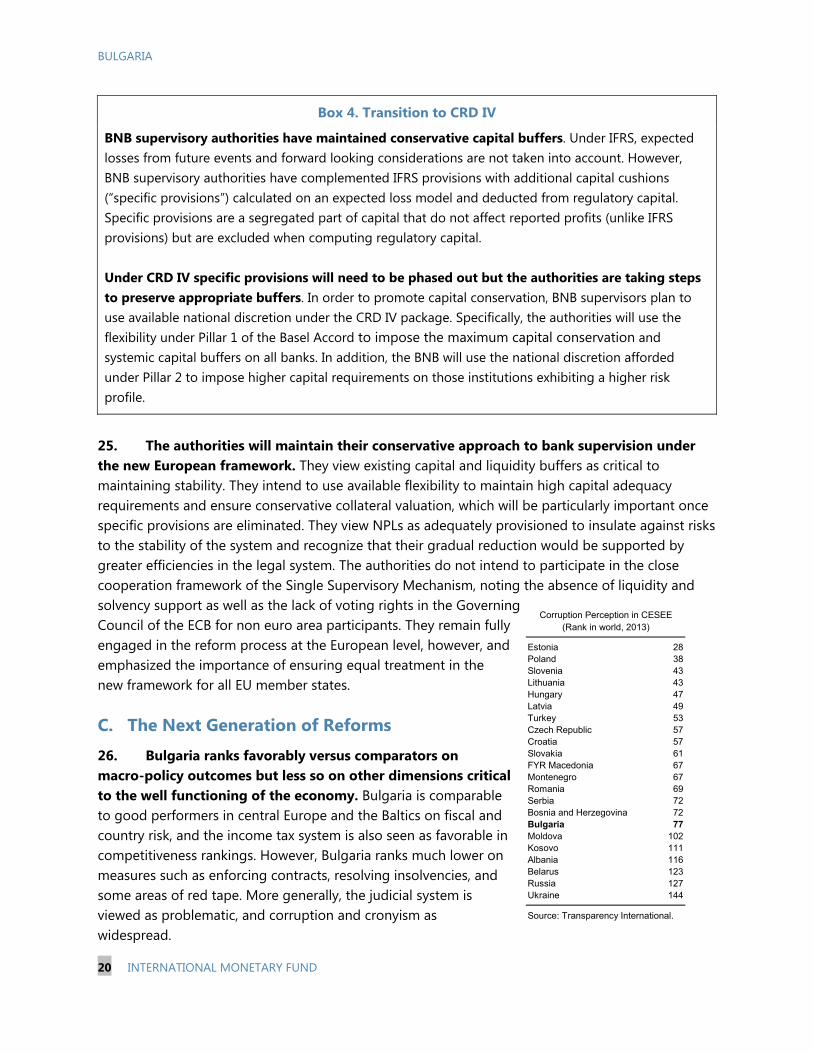
26. Bulgaria ranks favorably versus comparators on macro-policy outcomes but less so on other dimensions critical to the well functioning of the economy. Bulgaria is comparable to good performers in central Europe and the Baltics on fiscal and country risk, and the income tax system is also seen as favorable in competitiveness rankings. However, Bulgaria ranks much lower on measures such as enforcing contracts, resolving insolvencies, and some areas of red tape. More generally, the judicial system is viewed as problematic, and corruption and cronyism as widespread.
BULGARIA
INTERNATIONAL MONETARY FUND 21
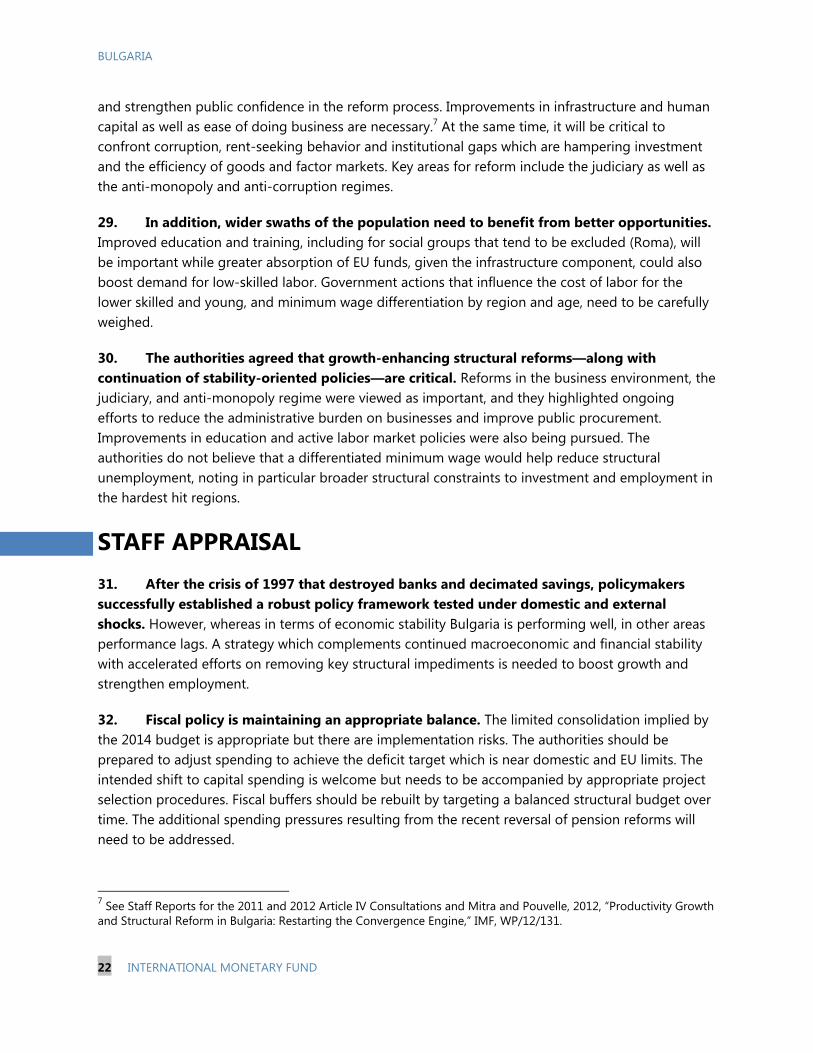
East Germany
Poland
Czech Rep.
Slovakia
Hungary
Bulgaria
Lithuania
Ukraine
Russia
30
50
70
90
30
50
70
90
30 40 50 60 70 80 90
1991
2009 -20
Pew Survey question: "Do you agree that the country moved from a state controlledto a market economy?"(Percent responding "yes")
Source: Pew Global Attitudes Project 2009.
32
33
29
31
33
0 2 4 6 8 10
Bribing and corruption
Ageing of society
Bureaucracy
Pension funding
Brain drain
Bulgaria: Areas of relative weakness(Scale 0 to 10-lower worse, rank among 33 European countries next to bars)
Source: IMD, World Competitiveness 2013.
18
18
18
18
14
3
3
0 2 4 6 8 10
Central bank policy
Creation of firms
Parallel economy
Relocation threats of R&D facilities
Relocation threats of production
Real corporate taxes
Real personal taxes
Bulgaria: Areas of relative strength(Scale 0 to 10-lower worse, rank among 33 European countries next to bars)
Source: IMD, World Competitiveness 2013.
0.0
0.1
0.2
0.3
0.4
0.5
0.6
0.7
2000 2002 2004 2006 2008 2010 2012
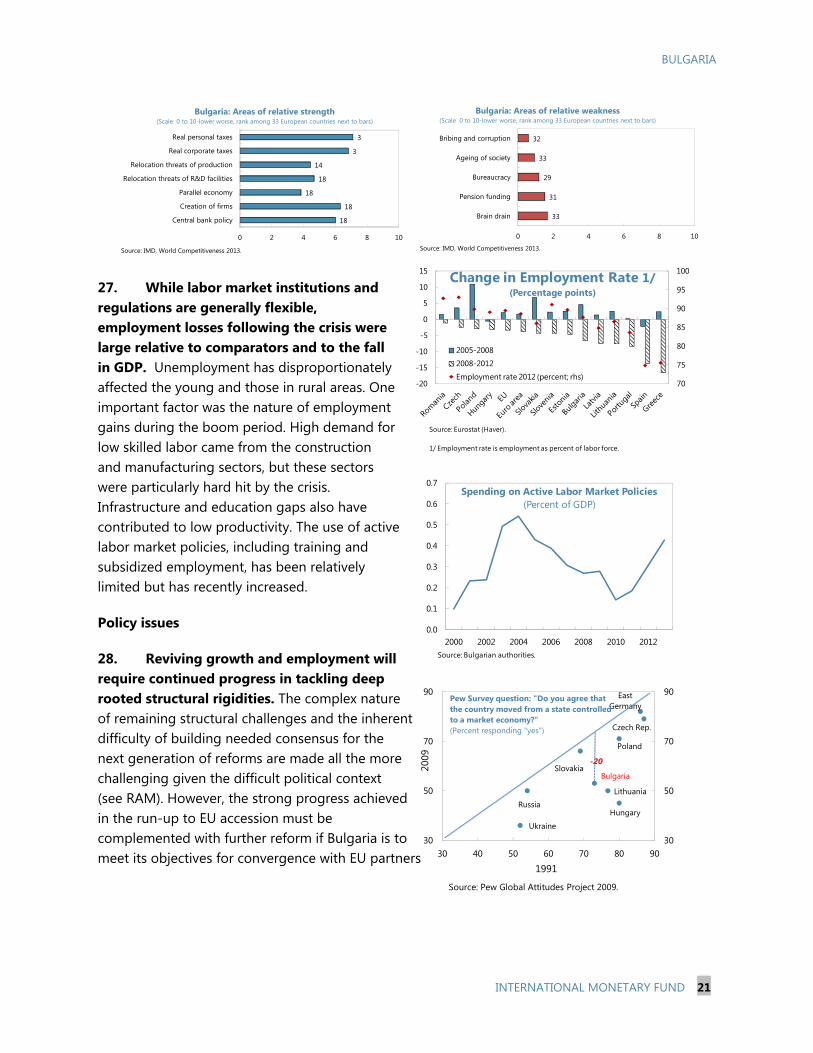
Spending on Active Labor Market Policies(Percent of GDP)
Source: Bulgarian authorities.
70
75
80
85
90
95
100
-20
-15
-10
-5
0
5
10
15 Change in Employment Rate 1/(Percentage points)
2005-2008
2008-2012
Employment rate 2012 (percent; rhs)
Source: Eurostat (Haver).
1/ Employment rate is employment as percent of labor force.
27. While labor market institutions and regulations are generally flexible, employment losses following the crisis were large relative to comparators and to the fall in GDP. Unemployment has disproportionately affected the young and those in rural areas. One important factor was the nature of employment gains during the boom period. High demand for low skilled labor came from the construction and manufacturing sectors, but these sectors were particularly hard hit by the crisis. Infrastructure and education gaps also have contributed to low productivity. The use of active labor market policies, including training and subsidized employment, has been relatively limited but has recently increased.
Policy issues
28. Reviving growth and employment will require continued progress in tackling deep rooted structural rigidities. The complex nature of remaining structural challenges and the inherent difficulty of building needed consensus for the next generation of reforms are made all the more challenging given the difficult political context (see RAM). However, the strong progress achieved in the run-up to EU accession must be complemented with further reform if Bulgaria is to meet its objectives for convergence with EU partners
BULGARIA
22 INTERNATIONAL MONETARY FUND
and strengthen public confidence in the reform process. Improvements in infrastructure and human capital as well as ease of doing business are necessary.7 At the same time, it will be critical to confront corruption, rent-seeking behavior and institutional gaps which are hampering investment and the efficiency of goods and factor markets. Key areas for reform include the judiciary as well as the anti-monopoly and anti-corruption regimes.
29. In addition, wider swaths of the population need to benefit from better opportunities. Improved education and training, including for social groups that tend to be excluded (Roma), will be important while greater absorption of EU funds, given the infrastructure component, could also boost demand for low-skilled labor. Government actions that influence the cost of labor for the lower skilled and young, and minimum wage differentiation by region and age, need to be carefully weighed.
30. The authorities agreed that growth-enhancing structural reforms—along with continuation of stability-oriented policies—are critical. Reforms in the business environment, the judiciary, and anti-monopoly regime were viewed as important, and they highlighted ongoing efforts to reduce the administrative burden on businesses and improve public procurement. Improvements in education and active labor market policies were also being pursued. The authorities do not believe that a differentiated minimum wage would help reduce structural unemployment, noting in particular broader structural constraints to investment and employment in the hardest hit regions.
STAFF APPRAISAL 31. After the crisis of 1997 that destroyed banks and decimated savings, policymakers successfully established a robust policy framework tested under domestic and external shocks. However, whereas in terms of economic stability Bulgaria is performing well, in other areas performance lags. A strategy which complements continued macroeconomic and financial stability with accelerated efforts on removing key structural impediments is needed to boost growth and strengthen employment.
32. Fiscal policy is maintaining an appropriate balance. The limited consolidation implied by the 2014 budget is appropriate but there are implementation risks. The authorities should be prepared to adjust spending to achieve the deficit target which is near domestic and EU limits. The intended shift to capital spending is welcome but needs to be accompanied by appropriate project selection procedures. Fiscal buffers should be rebuilt by targeting a balanced structural budget over time. The additional spending pressures resulting from the recent reversal of pension reforms will need to be addressed.
7 See Staff Reports for the 2011 and 2012 Article IV Consultations and Mitra and Pouvelle, 2012, “Productivity Growth and Structural Reform in Bulgaria: Restarting the Convergence Engine,” IMF, WP/12/131.
BULGARIA
INTERNATIONAL MONETARY FUND 23
33. The financial sector remains stable. The authorities’ intention to maintain financial sector buffers under the new framework is appropriate. Recent steps taken by some banks to reduce NPLs through asset disposal should be further encouraged to reduce asset price uncertainty and support future investment. Steps taken by the authorities to preserve their conservative supervisory approach in the changing European framework are appropriate.
34. Structural policies require new impetus. A key issue is governance reform, including in the judicial system and anti-corruption and anti-monopoly regimes, to help support the macroeconomic performance and stability of the country over the medium term. EU funds should continue to be absorbed rapidly and further improvements in education and training are needed to reduce labor market rigidities.
35. It is recommended that the next Article IV consultation with Bulgaria be held on the standard 12-month cycle.

BULGARIA
24 INTERNATIONAL MONETARY FUND
Table 1. Bulgaria: Selected Economic and Social Indicators, 2010–18
2010 2011 2012 2013 2014 2015 2016 2017 2018Est. Proj. Proj. Proj. Proj. Proj. Proj.
Output, prices, and labor market (percent change, unless otherwise indicated)Real GDP 0.4 1.8 0.8 0.5 1.6 2.5 3.0 3.0 3.0Real domestic demand -5.1 0.3 3.5 -0.9 1.5 3.1 3.7 3.5 3.5Consumer price index (HICP, average) 3.0 3.4 2.4 0.4 0.8 1.8 2.3 2.5 2.5Consumer price index (HICP, end of period) 4.4 2.0 2.8 -0.5 1.5 2.0 2.5 2.5 2.5Nominal wages (national accounts definition) 11.2 8.6 5.6 4.5 5.0 5.5 5.5 5.5 5.5Population -0.8 -2.4 -0.6 -0.5 -0.5 -0.5 -0.5 -0.5 -0.5Employment -6.1 -2.8 -1.1 0.1 0.8 0.9 0.6 0.5 0.4Unemployment rate (percent of labor force) 10.3 11.3 12.4 12.4 11.9 11.3 10.7 10.1 9.5Output gap (percent of potential GDP) -3.2 -2.4 -1.8 -2.1 -1.8 -0.9 0.0 0.0 0.0
General government finances (percent of GDP)Revenue 32.7 32.4 34.2 36.3 36.5 37.1 37.1 37.2 37.3
o/w: Grants 2.3 1.9 3.1 4.3 4.1 4.3 4.1 4.2 4.2Expenditure 36.7 34.4 34.6 38.3 38.3 38.6 38.2 37.8 37.3Balance (net lending/borrowing on cash basis) -4.0 -2.0 -0.5 -2.0 -1.8 -1.5 -1.1 -0.5 0.0
Privatization proceeds 0.1 0.3 0.1 0.2 0.2 0.0 0.0 0.0 0.0External financing 1/ 0.2 0.2 2.6 -0.7 3.7 -0.7 2.2 -1.8 0.2Domestic financing 1.4 0.2 -0.9 1.6 0.5 0.9 0.4 0.4 0.4Financing from fiscal reserves 2/ 2.4 1.3 -1.4 1.4 -2.3 1.3 -1.5 1.9 -0.6Net lending and other items 0.0 -0.1 0.0 -0.5 -0.3 0.0 0.0 0.0 0.0
Gross public debt 2/ 14.9 15.4 17.6 17.5 21.2 20.5 22.0 19.5 19.0Structural balance -2.9 -1.1 0.2 -1.2 -1.1 -1.1 -1.1 -0.5 0.0
Money and credit (percent change)Broad money (M3) 6.4 12.2 8.4 8.7 5.9 5.5 5.9 6.2 6.7Domestic private credit 1.3 3.8 2.8 0.3 3.6 5.3 6.7 9.0 9.0
Interest rates (percent)Interbank rate, 3-month SOFIBOR 4.1 3.8 2.3 … … … … … …Lending rate 11.1 10.6 9.7 … … … … … …
Balance of payments (percent of GDP, unless otherwise indicated)Current account balance -1.5 0.1 -1.3 0.4 -0.9 -1.9 -2.3 -2.5 -2.6
o/w: Merchandise trade balance -7.7 -5.6 -9.1 -6.3 -7.1 -7.5 -8.1 -8.5 -9.1Capital and financial account balance -1.1 -1.3 7.0 -3.2 4.7 2.9 5.9 3.1 4.6
o/w: Foreign direct investment balance 2.7 3.1 3.3 2.8 3.5 3.9 4.0 4.0 4.1International investment position -95 -86 -81 -79 -78 -74 -71 -68 -65
o/w: Gross external debt 103 94 95 93 93 87 84 77 72o/w: Gross official reserves 36 35 39 36 39 38 40 38 38
In months of imports 6.1 5.8 6.7 5.9 6.1 6.3 6.4 6.1 6.0In percent of broad money 50 46 49 42 44 43 44 43 42In percent of ST debt 3/ 85 91 114 116 123 126 143 135 150In percent of risk-weighted metric 4/ 124 134 130 127 … … … … …
Exchange ratesLeva per euroLeva per U.S. dollar (end of period) 1.48 1.45 1.47 … … … … … …Effective exchange rate (percent change)
Nominal -3.3 2.1 -1.9 … … … … … …Real (CPI based) -3.9 2.7 -2.1 … … … … … …
Social indicators (reference year in parentheses): Per capita GNI (2011): US$ 6,550; income distribution (Gini index, 2007): 28.2; poverty rate (2007): 10.6 percent.Primary education completion rate (2009): 95.5.Births per woman (2010): 1.5; mortality under 5 (per 1,000) (2011): 12.1; life expectancy at birth (2010): 73.5 years.
Sources: Bulgarian authorities; World Development Indicators; and IMF staff estimates.
1/ Reflects €950 million Eurobond issued in 2012 and another assumed in 2014 and 2016.2/ In projection period, largely reflects issuance and repayment of eurobonds.3/ Short-term debt is at remaining maturity and includes deposits of foreign banks in local subsidiaries.4/ See "Assessing Reserve Adequacy" (IMF Policy Papers, 2/14/2011).
Currency board peg to euro at lev 1.95583 per euro
BULGARIA
INTERNATIONAL MONETARY FUND 25
Table 2. Bulgaria: Macroeconomic Framework, 2010–18
2010 2011 2012 2013 2014 2015 2016 2017 2018Est. Proj. Proj. Proj. Proj. Proj. Proj.
GDP and prices (percent change)Real GDP 0.4 1.8 0.8 0.5 1.6 2.5 3.0 3.0 3.0Real domestic demand -5.1 0.3 3.5 -0.9 1.5 3.1 3.7 3.5 3.5
Of which: private -5.8 0.7 3.7 -2.9 2.0 3.1 4.3 3.9 3.9GDP deflator 2.8 4.9 2.2 1.1 0.8 1.8 2.3 2.5 2.5Consumer price index (HICP, average) 3.0 3.4 2.4 0.4 0.8 1.8 2.3 2.5 2.5Nominal wages (national accounts definition) 11.2 8.6 5.6 4.5 5.0 5.5 5.5 5.5 5.5Real effective exchange rate, CPI based -3.9 2.7 -2.1 … … … … … …
Monetary aggregates (percent change)Broad money 6.4 12.2 8.4 8.7 5.9 5.5 5.9 6.2 6.7Domestic private credit 1.3 3.8 2.8 0.3 3.6 5.3 6.7 9.0 9.0
Saving and investment (percent of GDP)Foreign saving 1.5 -0.1 1.3 -0.4 0.9 1.9 2.3 2.5 2.6Gross national saving 21.4 22.0 22.5 21.7 21.2 20.9 21.2 22.0 22.8
Government 0.3 1.9 4.2 3.9 4.0 4.8 5.2 5.9 6.5Private 21.1 20.1 18.3 17.8 17.3 16.0 16.0 16.1 16.3
Gross domestic investment 22.9 21.9 23.8 21.3 22.1 22.8 23.6 24.5 25.4Government 4.3 3.9 4.6 5.9 5.8 6.3 6.3 6.4 6.5Private 18.6 18.0 19.2 15.4 16.4 16.4 17.2 18.0 18.9
General government (percent of GDP)Revenue 32.7 32.4 34.2 36.3 36.5 37.1 37.1 37.2 37.3 Tax revenue (including social security contributions) 25.7 26.1 26.5 27.2 28.2 28.8 29.1 29.2 29.3 Non-Tax revenue 4.7 4.4 4.6 4.8 4.2 4.0 4.0 3.9 3.8 Grants 2.3 1.9 3.1 4.3 4.1 4.3 4.1 4.2 4.2Expenditure 36.7 34.4 34.6 38.3 38.3 38.6 38.2 37.8 37.3Balance (net lending/borrowing on cash basis) -4.0 -2.0 -0.5 -2.0 -1.8 -1.5 -1.1 -0.5 0.0Structural balance -2.9 -1.1 0.2 -1.2 -1.1 -1.1 -1.1 -0.5 0.0
Balance of payments (percent of GDP)Current account -1.5 0.1 -1.3 0.4 -0.9 -1.9 -2.3 -2.5 -2.6
Trade balance -7.7 -5.6 -9.1 -6.3 -7.1 -7.5 -8.1 -8.5 -9.1Services balance 5.2 6.0 6.0 5.9 6.0 6.0 6.0 6.0 6.0Income balance -3.1 -4.7 -3.4 -4.2 -4.9 -5.3 -4.9 -4.5 -4.1Transfers balance 4.2 4.4 5.1 5.0 5.0 4.9 4.6 4.5 4.5
Capital and financial account -1.1 -1.3 7.0 -3.2 4.7 2.9 5.9 3.1 4.6of which: Foreign direct investment 2.7 3.1 3.3 2.8 3.5 3.9 4.0 4.0 4.1
Memorandum items:
Gross international reserves (millions of euros) 12,977 13,349 15,553 14,412 16,001 16,428 18,022 18,327 19,347Short-term external debt (percent of GDP) 1/ 31 26 26 26 26 25 24 23 22
Export volume (percent change) 6.1 17.8 -1.0 9.0 5.9 5.9 6.0 6.1 6.2Import volume (percent change) -4.5 11.5 7.8 5.1 5.4 6.4 6.6 6.4 6.5Terms of trade (percent change) 3.7 0.7 2.6 1.3 -1.3 0.0 -0.1 -0.2 -0.3
Output gap (percent of potential GDP) -3.2 -2.4 -1.8 -2.1 -1.8 -0.9 0.0 0.0 0.0Nominal GDP (millions of leva) 70,511 75,308 77,582 78,792 80,689 84,171 88,665 93,608 98,827Nominal GDP (millions of euros) 36,052 38,504 39,667 40,286 41,256 43,036 45,334 47,861 50,529
Sources: Bulgarian authorities; and IMF staff estimates.
1/ At original maturity.

BULGARIA
26 INTERNATIONAL MONETARY FUND
Table 3. Bulgaria: Real GDP Components, 2010–18
2010 2011 2012 2013 2014 2015 2016 2017 2018
Est. Proj. Proj. Proj. Proj. Proj. Proj.
GDP 0.4 1.8 0.8 0.5 1.6 2.5 3.0 3.0 3.0Domestic demand -5.1 0.3 3.5 -0.9 1.5 3.1 3.7 3.5 3.5
Private demand -5.8 0.7 3.7 -2.9 2.0 3.1 4.3 3.9 3.9Public demand -1.6 -1.0 3.0 8.1 -0.5 3.2 1.2 1.8 1.9
Final consumption 0.4 1.5 1.9 1.0 1.3 2.3 2.7 2.5 2.5Private consumption 0.1 1.5 2.6 0.4 1.8 2.8 3.2 2.9 2.9Public consumption 1.9 1.6 -1.3 3.4 -0.5 0.0 0.3 0.6 0.6
Investment -21.2 -4.0 10.1 -7.5 2.3 6.3 7.4 7.1 7.0Gross fixed investment -18.3 -6.5 0.8 0.9 2.5 5.9 7.3 7.0 7.0
Private investment -19.5 -5.6 -3.5 -5.3 3.5 3.8 8.7 7.8 7.7Public investment -12.4 -10.3 20.2 23.5 -0.5 12.0 3.4 4.6 4.8
Inventories 1/ -0.9 0.6 2.0 -1.9 0.0 0.1 0.0 0.0 0.0Net exports 1/ 6.1 1.5 -2.9 1.4 0.0 -0.8 -0.9 -0.8 -0.8Exports of goods and services 14.7 12.3 -0.4 7.8 5.6 5.6 5.7 5.7 5.8Imports of goods and services 2.4 8.8 3.7 5.0 5.2 6.2 6.3 6.1 6.1
Domestic demand -5.7 0.4 3.7 -0.9 1.6 3.3 3.9 3.8 3.8Private demand -5.4 0.6 3.1 -2.6 1.7 2.7 3.7 3.4 3.4Public demand -0.3 -0.2 0.6 1.6 -0.1 0.7 0.3 0.4 0.4
Final consumption 0.4 1.3 1.6 0.8 1.1 2.0 2.3 2.1 2.1Private consumption 0.1 1.0 1.8 0.3 1.2 2.0 2.2 2.0 2.0Public consumption 0.3 0.2 -0.2 0.5 -0.1 0.0 0.0 0.1 0.1
Investment -6.1 -0.9 2.2 -1.7 0.5 1.4 1.7 1.7 1.7Gross fixed investment -5.3 -1.5 0.2 0.2 0.5 1.3 1.6 1.6 1.7
Private investment -4.6 -1.1 -0.6 -0.9 0.6 0.6 1.4 1.3 1.4Public investment -0.6 -0.5 0.8 1.1 0.0 0.7 0.2 0.3 0.3
Inventories -0.9 0.6 2.0 -1.9 0.0 0.1 0.0 0.0 0.0Net exports 6.1 1.5 -2.9 1.4 0.0 -0.8 -0.9 -0.8 -0.8Exports of goods and services 7.7 7.3 -0.2 5.1 3.9 4.0 4.3 4.4 4.6Imports of goods and services 1.6 5.8 2.6 3.7 4.0 4.9 5.2 5.1 5.4
1/ Contributions to GDP growth.
Sources: Bulgaria National Statistical Institute; and IMF staff
(Contribution to real GDP growth, in percent)
(Real growth rate, in percent)

BULGARIA
INTERNATIONAL MONETARY FUND 27
Table 4. Bulgaria: Balance of Payments, 2010–18
2010 2011 2012 2013 2014 2015 2016 2017 2018Est. Proj. Proj. Proj. Proj. Proj. Proj.
Current account balance -533 39 -528 162 -369 -818 -1,064 -1,186 -1,300Trade balance -2,764 -2,156 -3,622 -2,553 -2,911 -3,236 -3,651 -4,083 -4,573
Exports (f.o.b.) 15,561 20,264 20,793 21,874 23,077 24,541 26,198 28,130 30,209Imports (f.o.b.) -18,325 -22,420 -24,415 -24,426 -25,988 -27,778 -29,849 -32,212 -34,783
Services balance 1,868 2,323 2,397 2,380 2,473 2,590 2,727 2,881 3,048Exports of non-factor services 5,011 5,354 5,660 5,637 5,882 6,161 6,475 6,817 7,183Imports of non-factor services -3,144 -3,031 -3,263 -3,257 -3,409 -3,571 -3,748 -3,936 -4,135
Income balance -1,134 -1,813 -1,342 -1,686 -2,006 -2,286 -2,207 -2,149 -2,048Receipts 618 614 731 958 1,094 1,198 1,303 1,418 1,533Payments -1,752 -2,426 -2,073 -2,644 -3,100 -3,484 -3,510 -3,567 -3,580
Current transfer balance 1,497 1,685 2,039 2,021 2,075 2,114 2,068 2,165 2,273
Capital and financial account balance -411 -492 2,757 -1,302 1,958 1,244 2,658 1,491 2,320Capital transfer balance 256 464 514 514 515 516 517 519 520Foreign direct investment balance 977 1,199 1,302 1,126 1,442 1,669 1,810 1,931 2,048Portfolio investment balance -660 -423 -964 -1,234 653 -709 341 -960 -328Other investment balance -984 -1,732 1,906 -1,707 -653 -232 -10 1 81
General government and monetary authorities 73 88 115 -35 -113 -105 -142 -167 -167Domestic banks -1,217 -1,889 1,483 -1,552 -651 -251 -50 26 101Other private sector 160 69 307 -120 112 124 182 142 146
Errors and omissions 560 611 -68 0 0 0 0 0 0
Overall balance -384 159 2,161 -1,140 1,589 426 1,595 305 1,020
Financing 384 -159 -2,161 1,140 -1,589 -426 -1,595 -305 -1,020Gross international reserves (increase: -) 384 -159 -2,161 1,140 -1,589 -426 -1,595 -305 -1,020
Memorandum items:Current account balance -1.5 0.1 -1.3 0.4 -0.9 -1.9 -2.3 -2.5 -2.6Merchandise trade balance -7.7 -5.6 -9.1 -6.3 -7.1 -7.5 -8.1 -8.5 -9.1
Exports 43.2 52.6 52.4 54.3 55.9 57.0 57.8 58.8 59.8Imports 50.8 58.2 61.6 60.6 63.0 64.5 65.8 67.3 68.8
Foreign direct investment balance 2.7 3.1 3.3 2.8 3.5 3.9 4.0 4.0 4.1Gross external financing requirement 45.1 36.5 38.1 29.4 27.9 29.0 29.2 30.2 27.4Gross official reserves (millions of euro) 12,977 13,349 15,553 14,412 16,001 16,428 18,022 18,327 19,347
In percent of risk-weighted metric 1/ 124 129 135 129 … … … … …ST debt at original maturity (percent of reserves) 86.3 75.6 67.1 73.7 66.7 65.4 60.3 59.8 57.2ST debt at remaining maturity (percent of reserves) 117.2 109.6 87.6 86.1 81.2 79.6 69.8 74.2 66.8Terms of trade (merchandise, percent change) 3.7 0.7 2.6 1.3 -1.3 0.0 -0.1 -0.2 -0.3Exports of goods (volume, growth rate) 6.1 17.8 -1.0 9.0 5.9 5.9 6.0 6.1 6.2Imports of goods (volume, growth rate) -4.5 11.5 7.8 5.1 5.4 6.4 6.6 6.4 6.5Exports of goods (prices, growth rate) 25.4 10.5 3.6 -3.5 -0.4 0.4 0.7 1.2 1.1Imports of goods (prices, growth rate) 20.9 9.8 1.0 -4.8 1.0 0.4 0.8 1.4 1.4GDP (millions of euro) 36,052 38,504 39,667 40,286 41,256 43,036 45,334 47,861 50,529
Sources: Bulgarian authorities; and IMF staff estimates.
1/ See "Assessing Reserve Adequacy" (IMF Policy Papers, 2/14/2011).
(Millions of euros)
(Percent of GDP, unless otherwise indicated)
BULGARIA
28 INTERNATIONAL MONETARY FUND
Table 5. Bulgaria: External Financial Assets and Liabilities, 2010–18
2010 2011 2012 2013 2014 2015 2016 2017 2018Est. Proj. Proj. Proj. Proj. Proj. Proj.
International investment position -34,384 -33,021 -32,044 -32,017 -32,010 -31,978 -32,191 -32,524 -33,031
Financial assets 23,445 24,805 28,001 29,092 31,677 32,894 35,075 35,864 37,317 Foreign direct investment 1,171 1,272 1,415 1,617 1,823 2,038 2,265 2,504 2,757 Portfolio investment 2,566 2,673 4,407 5,237 5,627 6,002 6,362 6,682 7,012 Other investments 6,730 7,512 6,626 7,826 8,226 8,426 8,426 8,351 8,201 Gross international reserves 12,977 13,349 15,553 14,412 16,001 16,428 18,022 18,327 19,347
Financial liabilities 57,829 57,826 60,045 61,109 63,687 64,872 67,266 68,389 70,348 Foreign direct investment 35,347 36,567 37,798 39,125 40,774 42,658 44,694 46,864 49,165 Equity 21,922 22,856 23,980 25,307 26,955 28,839 30,876 33,046 35,346 Intercompany debt 13,426 13,711 13,818 13,818 13,818 13,818 13,818 13,818 13,818
Of which: Banks 888 879 674 679 679 679 679 679 679 Portfolio investment 1,639 1,484 1,829 1,473 2,481 1,852 2,258 1,324 1,065 Loans 14,666 14,651 15,340 15,540 15,485 15,435 15,393 15,329 15,295 Other liabilities 6,177 5,124 5,079 4,971 4,948 4,926 4,921 4,872 4,823
International investment position -95.4 -85.8 -80.8 -79.5 -77.6 -74.3 -71.0 -68.0 -65.4
Financial assets 65.0 64.4 70.6 72.2 76.8 76.4 77.4 74.9 73.9 Foreign direct investment 3.2 3.3 3.6 4.0 4.4 4.7 5.0 5.2 5.5 Portfolio investment 7.1 6.9 11.1 13.0 13.6 13.9 14.0 14.0 13.9 Other investments 18.7 19.5 16.7 19.4 19.9 19.6 18.6 17.4 16.2 Gross international reserves 36.0 34.7 39.2 35.8 38.8 38.2 39.8 38.3 38.3
Financial liabilities 160.4 150.2 151.4 151.7 154.4 150.7 148.4 142.9 139.2 Foreign direct investment 98.0 95.0 95.3 97.1 98.8 99.1 98.6 97.9 97.3 Equity 60.8 59.4 60.5 62.8 65.3 67.0 68.1 69.0 70.0 Intercompany debt 37.2 35.6 34.8 34.3 33.5 32.1 30.5 28.9 27.3
Of which: Banks 2.5 2.3 1.7 1.7 1.6 1.6 1.5 1.4 1.3 Portfolio investment 4.5 3.9 4.6 3.7 6.0 4.3 5.0 2.8 2.1 Loans 40.7 38.0 38.7 38.6 37.5 35.9 34.0 32.0 30.3 Other liabilities 17.1 13.3 12.8 12.3 12.0 11.4 10.9 10.2 9.5
Memorandum items:Gross external debt 102.7 94.1 94.8 92.7 92.7 87.3 83.6 77.0 72.3
Public 1/ 8.0 7.2 8.5 7.4 9.3 7.2 7.3 4.5 3.4Private 94.7 86.8 86.3 85.2 83.4 80.1 76.3 72.5 68.9
Short-term 31.1 26.2 26.3 26.4 25.9 25.0 24.0 22.9 21.9Long-term 63.7 60.7 60.0 58.9 57.5 55.2 52.4 49.6 47.0
Gross external debt 102.7 94.1 94.8 92.7 92.7 87.3 83.6 77.0 72.3Excluding intercompany lending 61.3 53.9 55.4 53.9 54.9 51.0 49.2 44.4 41.4
Net external debt 2/ 66.7 59.4 55.6 56.9 54.0 49.1 43.9 38.7 34.0Excluding intercompany lending 25.3 19.3 16.2 18.1 16.1 12.8 9.4 6.1 3.1
Gross external debt (percent of GNFS exports) 180.0 141.4 142.1 135.7 132.1 122.3 116.1 105.5 97.7
Sources: BNB; NSI; and IMF staff estimates.
1/ General government, excluding publicly-guaranteed private debt.2/ Gross debt minus gross international reserves.
(Millions of euros)
(Percent of GDP, unless otherwise indicated)

BULGARIA
INTERNATIONAL MONETARY FUND 29
Table 6a. Bulgaria: General Government Operations, 2010–18 1/ (Millions of leva, unless otherwise indicated)
2010 2011 2012 2013 2014 2015 2016 2017 2018Est. Proj. Proj. Proj. Proj. Proj. Proj.
Revenue 23,053 24,435 26,516 28,570 29,454 31,204 32,883 34,858 36,894Taxes 14,044 15,085 15,933 16,563 17,686 18,918 20,231 21,532 22,888
Taxes on profits 1,353 1,496 1,478 1,519 1,579 1,685 1,840 1,940 2,048Taxes on income 2,031 2,180 2,298 2,429 2,583 2,749 2,918 3,094 3,275Value-added taxes 6,267 6,612 7,152 7,574 8,161 8,756 9,360 9,965 10,587Excises 3,568 3,860 4,048 4,070 4,368 4,636 4,964 5,321 5,697Customs duties 119 131 118 120 122 128 134 142 150Other taxes 705 806 840 853 873 963 1,015 1,071 1,131
Social contributions 4,091 4,567 4,642 4,847 5,073 5,292 5,543 5,795 6,049Grants 1,603 1,463 2,368 3,349 3,300 3,595 3,600 3,900 4,200Other revenue 2/ 3,315 3,321 3,573 3,810 3,395 3,399 3,509 3,631 3,757
Expenditure 25,877 25,923 26,874 30,169 30,904 32,465 33,879 35,367 36,898Expense 21,514 22,483 22,910 24,849 25,253 25,955 26,756 27,840 29,023
Compensation of employees 4,147 4,152 4,239 4,345 4,345 4,345 4,345 4,519 4,740Use of goods and services 4,208 4,421 4,444 4,892 4,919 5,087 5,209 5,333 5,460Interest 486 547 573 875 692 780 782 826 872
External 336 350 374 654 418 468 407 429 453Domestic 150 197 199 222 275 313 376 397 419
Subsidies 1,317 1,518 1,228 1,383 1,431 1,333 1,365 1,397 1,431Grants 3/ 670 779 809 908 905 980 1,051 1,051 1,051Social benefits 10,583 10,949 11,482 12,335 12,864 13,332 13,907 14,616 15,371
Pensions 6,971 7,108 7,234 7,873 8,125 8,435 8,774 9,172 9,591Social assistance 1,797 1,915 2,067 2,078 2,253 2,287 2,314 2,372 2,431Transfers to Health Insurance Fund 1,815 1,927 2,181 2,384 2,486 2,610 2,819 3,073 3,349
Other expense 104 117 134 110 98 98 98 98 98Contingency 4/ 1,317 490 365 676 991 1,196 1,503 1,503 1,403Net acquisition of nonfinancial assets /5 3,045 2,950 3,600 4,644 4,660 5,313 5,620 6,024 6,472
Net lending/borrowing 1/ -2,823 -1,488 -359 -1,600 -1,450 -1,261 -995 -509 -4 Primary balance -2,338 -941 214 -724 -757 -481 -213 317 868
Financing 2,824 1,488 359 1,600 1,450 1,261 995 509 4Privatization proceeds 46 239 76 141 151 38 32 0 0Net external financing 161 134 2,047 -527 2,947 -602 1,920 -1,668 205
Disbursements 430 2,252 1,285 3,271 1,405 2,291 576 576Amortization -297 -205 -1,813 -325 -2,007 -371 -2,245 -371
Net domestic financing 2,634 1,160 -1,749 2,362 -1,426 1,849 -941 2,178 -201Bank credit / Securities issuance 1,555 723 303 2,292 1,485 1,186 1,388 1,400 1,400Amortization -589 -576 -970 -1,006 -1,070 -467 -1,022 -1,033 -1,022Fiscal Reserve Account 1,668 1,013 -1,082 1,077 -1,841 1,130 -1,307 1,810 -579
Net lending and other items -19 -45 -16 -376 -222 -24 -15 0 0
Memorandum items:Fiscal reserve account 6,012 4,999 6,081 5,010 6,829 5,658 6,926 5,115 5,694Gross public debt 10,532 11,629 13,674 13,768 17,129 17,246 19,532 18,231 18,814Nominal GDP (percent change) 3.2 6.8 3.0 1.6 2.4 4.3 5.3 5.6 5.6Real GDP (percent change) 0.4 1.8 0.8 0.5 1.6 2.5 3.0 3.0 3.0HICP inflation (percent change) 3.0 3.4 2.4 0.4 0.8 1.8 2.3 2.5 2.5Nominal private consumption (percent ch.) 2.6 6.2 6.2 0.9 2.5 4.8 5.8 5.4 5.2Nominal imports (percent change) 10.2 18.6 8.7 0.0 6.2 6.6 7.2 7.6 7.7
Sources: Ministry of Finance; and staff estimates.
1/ On cash basis. 2/ Includes dividends. 3/ Contribution to EU budget. 4/ The contingency reserve in 2012 includes BGN 261 million for the Health Insurance Fund. 5/ Includes only acquisitions of nonfinancial assets, i.e., capital expenditure.
BULGARIA
30 INTERNATIONAL MONETARY FUND
Table 6b. Bulgaria: General Government Operations, 2010–18 1/
(Percent of GDP, unless otherwise indicated)
2010 2011 2012 2013 2014 2015 2016 2017 2018Est. Proj. Proj. Proj. Proj. Proj. Proj.
Revenue 32.7 32.4 34.2 36.3 36.5 37.1 37.1 37.2 37.3Taxes 19.9 20.0 20.5 21.0 21.9 22.5 22.8 23.0 23.2
Taxes on profits 1.9 2.0 1.9 1.9 2.0 2.0 2.1 2.1 2.1Taxes on income 2.9 2.9 3.0 3.1 3.2 3.3 3.3 3.3 3.3Value-added taxes 8.9 8.8 9.2 9.6 10.1 10.4 10.6 10.6 10.7Excises 5.1 5.1 5.2 5.2 5.4 5.5 5.6 5.7 5.8Customs duties 0.2 0.2 0.2 0.2 0.2 0.2 0.2 0.2 0.2Other taxes 1.0 1.1 1.1 1.1 1.1 1.1 1.1 1.1 1.1
Social contributions 5.8 6.1 6.0 6.2 6.3 6.3 6.3 6.2 6.1Grants 2.3 1.9 3.1 4.3 4.1 4.3 4.1 4.2 4.2Other revenue 2/ 4.7 4.4 4.6 4.8 4.2 4.0 4.0 3.9 3.8
Expenditure 36.7 34.4 34.6 38.3 38.3 38.6 38.2 37.8 37.3Expense 30.5 29.9 29.5 31.5 31.3 30.8 30.2 29.7 29.4
Compensation of employees 5.9 5.5 5.5 5.5 5.4 5.2 4.9 4.8 4.8Use of goods and services 6.0 5.9 5.7 6.2 6.1 6.0 5.9 5.7 5.5Interest 0.7 0.7 0.7 1.1 0.9 0.9 0.9 0.9 0.9
External 0.5 0.5 0.5 0.8 0.5 0.6 0.5 0.5 0.5Domestic 0.2 0.3 0.3 0.3 0.3 0.4 0.4 0.4 0.4
Subsidies 1.9 2.0 1.6 1.8 1.8 1.6 1.5 1.5 1.4Grants 3/ 0.9 1.0 1.0 1.2 1.1 1.2 1.2 1.1 1.1Social benefits 15.0 14.5 14.8 15.7 15.9 15.8 15.7 15.6 15.6
Pensions 9.9 9.4 9.3 10.0 10.1 10.0 9.9 9.8 9.7Social assistance 2.5 2.5 2.7 2.6 2.8 2.7 2.6 2.5 2.5Transfers to the Health Insurance Fund 2.6 2.6 2.8 3.0 3.1 3.1 3.2 3.3 3.4
Other expense 0.1 0.2 0.2 0.1 0.1 0.1 0.1 0.1 0.1Contingency 4/ 1.9 0.7 0.5 0.9 1.2 1.4 1.7 1.6 1.4Net acquisition of nonfinancial assets /5 4.3 3.9 4.6 5.9 5.8 6.3 6.3 6.4 6.5
Net lending/borrowing 1/ -4.0 -2.0 -0.5 -2.0 -1.8 -1.5 -1.1 -0.5 0.0 Primary balance -3.3 -1.2 0.3 -0.9 -0.9 -0.6 -0.2 0.3 0.9
Financing 4.0 2.0 0.5 2.0 1.8 1.5 1.1 0.5 0.0 Privatization proceeds 0.1 0.3 0.1 0.2 0.2 0.0 0.0 0.0 0.0
Net external financing 0.2 0.2 2.6 -0.7 3.7 -0.7 2.2 -1.8 0.2Disbursements 0.6 2.9 1.6 4.1 1.7 2.6 0.6 0.6Amortization -0.4 -0.3 -2.3 -0.4 -2.4 -0.4 -2.4 -0.4
Net domestic financing 3.7 1.5 -2.3 3.0 -1.8 2.2 -1.1 2.3 -0.2Securities issuance 0.4 2.9 1.8 1.4 1.6 1.5 1.4Amortization -1.2 -1.3 -1.3 -0.6 -1.2 -1.1 -1.0Fiscal Reserve Account 2.4 1.3 -1.4 1.4 -2.3 1.3 -1.5 1.9 -0.6
Net lending and other items 0.0 -0.1 0.0 -0.5 -0.3 0.0 0.0 0.0 0.0
Memorandum items:Gross public debt 14.9 15.4 17.6 17.5 21.2 20.5 22.0 19.5 19.0Structural fiscal balance -2.9 -1.1 0.2 -1.2 -1.3 -1.1 -1.1 -0.6 0.0Output gap (percent of potential GDP) -3.2 -2.4 -1.8 -2.1 -1.8 -0.9 0.0 0.0 0.0Nominal GDP (millions of leva) 70,511 75,308 77,582 78,792 80,689 84,171 88,665 93,608 98,827
Sources: Ministry of Finance; and IMF staff estimates.
1/ On cash basis. 2/ Includes dividends. 3/ Contribution to EU budget. 4/ The contingency reserve in 2012 includes BGN 261 million for the Health Insurance Fund.

BULGARIA
INTERNATIONAL MONETARY FUND 31
Table 7. Bulgaria: Monetary Accounts, 2010–18 (In billions of leva, unless otherwise stated)
2010 2011 2012 2013 2014 2015 2016 2017 2018 Dec. Dec. Dec. Dec. Dec. Dec. Dec. Dec. Dec. Est. Proj. Proj. Proj. Proj. Proj. Proj.
Monetary SurveyNet foreign assets 17.1 21.1 25.3 28.4 32.8 34.2 37.4 37.9 39.6Net domestic assets 49.2 52.5 53.9 55.0 56.6 61.3 65.5 72.7 80.0
Domestic credit 50.0 53.7 55.1 56.5 58.2 62.8 66.9 74.2 81.4General government -2.3 -0.5 -0.7 0.6 0.2 1.8 1.8 3.1 4.0Non-government 52.3 54.3 55.8 55.9 58.0 61.0 65.1 71.0 77.4
Broad money (M3) 50.7 56.9 61.7 67.1 71.0 74.9 79.3 84.2 89.9Currency outside banks 7.4 7.8 8.5 9.0 9.3 9.7 10.3 10.8 11.4Reserve money 14.1 14.9 17.4 18.7 19.0 19.4 19.8 20.3 20.8Deposits 2/ 43.4 49.1 53.2 58.1 61.7 65.2 69.1 73.4 78.5
Accounts of the Bulgarian National BankNet foreign assets 24.0 24.6 29.0 28.2 31.3 32.1 35.3 35.9 37.9
Net foreign reserves (billions of euro) 12.2 12.6 14.8 14.4 16.0 16.4 18.0 18.3 19.4Net domestic assets -5.5 -5.0 -6.7 -5.6 -6.8 -4.8 -5.5 -3.2 -3.2
Net claims on government -5.3 -4.2 -5.7 -4.6 -5.8 -4.0 -5.0 -2.8 -2.9
Base money 14.1 14.9 17.4 18.7 19.0 19.4 19.8 20.3 20.8Currency in circulation 7.4 7.8 8.5 9.0 9.3 9.7 10.3 10.8 11.4Banks reserves 6.8 7.1 8.9 9.7 9.7 9.6 9.6 9.5 9.4
Deposit money banksNet foreign assets -6.9 -3.5 -3.6 0.2 1.5 2.1 2.2 2.0 1.7
Gross foreign assets 8.0 9.1 10.0 13.0 13.8 14.3 14.3 14.0 13.6Gross foreign liabilities 14.8 12.6 13.7 12.8 12.3 12.2 12.1 12.0 11.9
Net domestic assets 54.2 56.5 59.3 59.3 62.2 65.1 70.2 75.2 82.7Domestic credit 55.2 57.9 60.7 61.0 63.9 66.8 71.8 76.8 84.2
Memorandum items: Base money 9.0 5.6 16.7 7.4 1.7 1.9 2.4 2.4 2.5
Broad money 6.4 12.2 8.4 8.7 5.9 5.5 5.9 6.2 6.7Domestic non-government credit 1.3 3.8 2.8 0.3 3.6 5.3 6.7 9.0 9.0Domestic deposits 6.9 13.2 8.3 9.2 6.1 5.7 6.0 6.2 6.9
Domestic currency 11.9 21.0 17.0 7.5 6.5 6.1 6.4 6.6 7.3Foreign currency 2.2 5.2 -2.1 11.6 5.6 5.1 5.5 5.7 6.4
Money multiplier (ratio) 3.59 3.82 3.55 3.59 3.74 3.87 4.00 4.15 4.32Velocity (M3) (ratio) 1.39 1.32 1.26 1.17 1.13 1.12 1.11 1.11 1.09
GDP (millions of leva) 70,511 75,308 77,582 78,792 80,689 84,171 88,665 93,608 98,827
Sources: Bulgarian National Bank, National Statistics Institute, and Fund staff estimates and projections.
1/ Includes long term deposits and bank capital and reserves2/ Includes deposits at central bank.3/ Includes repurchase agreements.
(Annual percentage change, unless otherwise indicated)
BULGARIA
32 INTERNATIONAL MONETARY FUND
Table 8. Bulgaria: Financial Soundness Indicators, 2010–13 (In percent)
2010 2011 2012 2012 2012 2012 2013 2013Dec Dec March June Sept Dec March June
Core indicatorsCapital adequacy
Capital to risk-weighted assets 17.5 17.5 17.5 16.7 16.6 16.7 16.8 17.0Tier 1 capital to risk-weighted assets 15.2 15.7 15.8 15.2 15.1 15.2 15.4 15.6
Asset qualityNonperforming loans to total gross loans 11.9 14.9 16.2 16.9 17.3 16.6 16.9 17.1Nonperforming loans net of provisions to capital 28.1 36.9 40.7 43.1 43.4 39.1 38.3 37.7Large exposures to capital 87.9 112.2 109.4 120.2 126.4 115.1 127.2 120.8
Earnings and profitabilityReturn on assets 0.9 0.8 0.9 0.8 0.9 0.7 0.8 0.8Return on equity 1/ 7.9 7.1 8.4 7.9 8.2 6.8 8.0 7.4Net interest income to gross income 74.2 73.3 71.6 70.9 69.7 68.8 68.5 68.2Noninterest expense to gross income 49.1 50.4 52.4 52.2 51.3 52.1 53.0 53.4Personnel expense to total income 17.8 18.5 19.3 19.4 19.2 19.1 20.2 20.0Trading and fee income to total income 24.7 25.0 24.5 27.3 28.1 27.8 30.0 27.9
LiquidityLiquid assets to total assets 20.9 21.9 22.1 22.6 22.4 22.4 23.2 22.3Liquid assets to short-term liabilities 30.1 25.4 25.6 26.0 25.9 25.8 26.7 25.7Liquid assets to total liabilities 24.2 28.9 29.7 30.2 30.2 30.0 31.0 29.6
Encouraged indicators Deposit-taking institutions
Capital to assets 2/ 10.5 10.8 10.7 10.3 10.3 10.1 10.1 10.4Trading income to total income 5.4 4.9 5.3 7.3 7.8 7.4 8.1 5.7Personnel expenses to noninterest expenses 36.3 36.6 36.9 37.3 37.3 36.7 38.1 37.4Customer deposits to total (non-interbank) loans 87.8 95.2 97.0 97.3 99.4 100.2 102.9 102.9Foreign currency denominated loans to total loans 61.3 63.8 64.1 64.6 64.3 64.0 64.0 62.5Foreign currency denominated liabilities to total liabilities 58.6 54.8 54.0 54.1 52.1 51.8 51.9 51.5
Source: Bulgarian National Bank.
1/ Return on equity is calculated with Tier I capital as denominator.2/ Capital to assets is based on Tier I capital.

BULGARIA
INTERNATIONAL MONETARY FUND 33
Appendix I. External and Public Debt Sustainability Analyses
1. External debt peaked in 2009 and has since declined. With little change in public external debt relative to GDP, the decline in gross external debt from 108 percent of GDP at end-2009 to 95 percent of GDP at end-2012 was due to private sector deleveraging. Half of this decline was due to banks, where debt fell from 24 percent of GDP at end-2009 to 16 percent of GDP at end-2012. Excluding inter-company lending, which is relatively stable, external debt was 55 percent of GDP at end-2012, and this was largely offset by international reserves. Rollover risks in the nonbank private sector, which did not materialize during the global financial crisis, are contained by the moderate short-term exposure.
2. The counterpart of the private sector deleveraging was the reduction in the current account deficit. The current account moved from a deficit of 25 percent of GDP in 2007 and 9 percent of GDP in 2009 to a (projected) surplus in 2013. Baseline medium-term balance of payments projections indicate the current account returning to deficit, financed mainly by foreign direct investment flows.
3. Gross external debt in the baseline projections declines further. It reaches around 72 percent of GDP by 2018 primarily due to nominal GDP growth, with relatively little change in nominal external debt (which falls by 3 percent from 2012 to 2018). In the historical DSA scenario the denominator effect on the debt-to-GDP ratio is even stronger because historical growth is higher than projected growth (Figure 1 and Table 1).
4. The decline in external debt relative to the size of the economy appears well anchored. Shocks applied to the interest rate, the growth rate and the current account deficit would shift the trajectory of external debt relative to GDP upwards. However, in these scenarios the highest level of external debt reached by 2017 is 86 percent of GDP, which would still imply declines in the ratio of external debt to GDP in coming years.
5. Public debt remains at very manageable levels. At around 20 percent of GDP in the baseline projections, Bulgaria’s indebtedness remains low by international standards. In alternative scenarios, the public debt ratio remains well contained (Figure 2 and Table 2). However, risks from unaccounted contingent liabilities (and worse-than-assumed downside scenarios) could result in higher outcomes, as could aging-related spending pressures following the recent reversal of pension reforms.
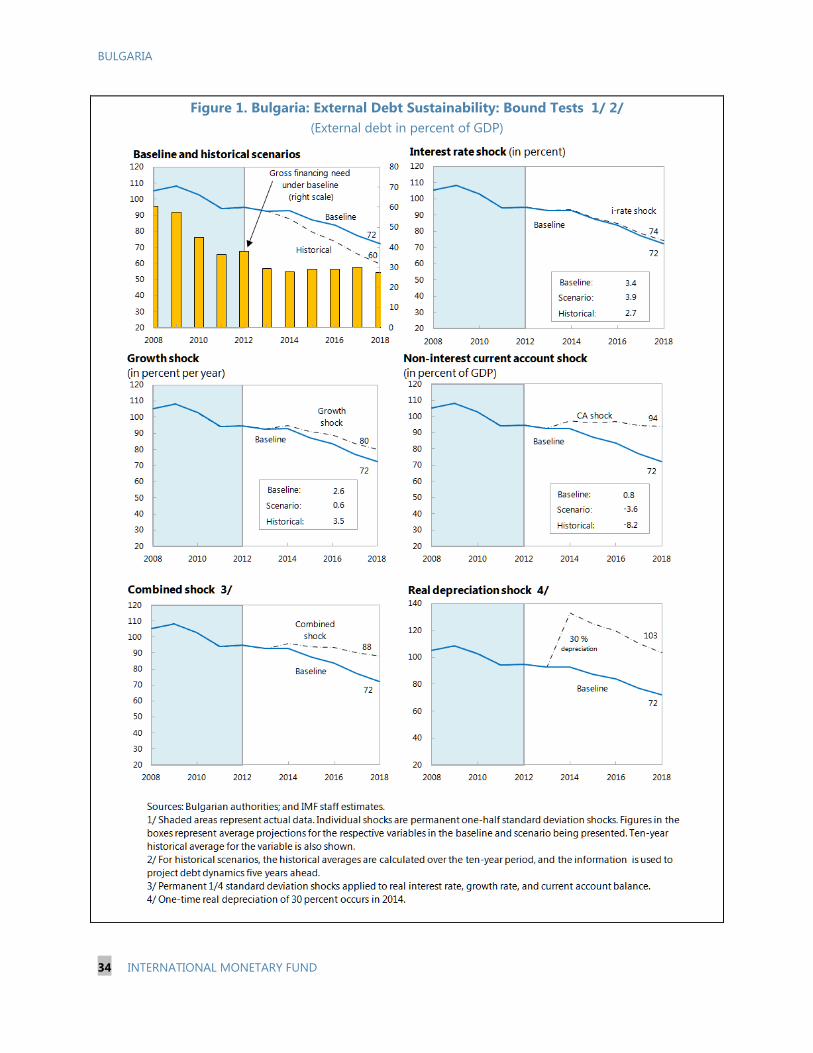
BULGARIA
34 INTERNATIONAL MONETARY FUND
Figure 1. Bulgaria: External Debt Sustainability: Bound Tests 1/ 2/ (External debt in percent of GDP)

Table 1. Bulgaria: External Debt Sustainability Framework, 2008–2018 (In percent of GDP, unless otherwise indicated)
Projections2002 2003 2004 2005 2006 2007 2008 2009 2010 2011 2012 2013 2014 2015 2016 2017 2018 Debt-stabilizing
non-interest current account 6/
Baseline: External debt 63.5 58.1 62.2 66.7 78.1 94.3 105.1 108.3 102.7 94.1 94.8 92.7 92.7 87.3 83.6 77.0 72.3 -5.7
Change in external debt -5.3 4.1 4.5 11.5 16.1 10.8 3.1 -5.6 -8.6 0.7 -2.1 0.1 -5.5 -3.6 -6.6 -4.7Identified external debt-creating flows (4+8+9) -16.1 -12.4 -8.7 -7.2 -12.2 -6.0 12.0 0.0 -13.4 3.3 -4.2 -4.6 -4.7 -4.6 -4.4 -4.2
Current account deficit, excluding interest payments 3.3 4.7 9.9 15.7 23.0 20.5 7.0 0.0 -1.8 -0.3 -2.6 -1.6 -1.7 -0.8 -0.3 0.3Deficit in balance of goods and services 10.2 11.3 15.4 17.5 19.7 20.5 8.2 2.5 -0.4 3.1 0.4 1.1 1.5 2.0 2.5 3.0
Exports 50.2 51.3 55.2 56.0 61.2 59.4 58.1 47.6 57.1 66.5 66.7 68.3 70.2 71.3 72.1 73.0 74.0Imports 61.5 66.5 71.5 78.7 79.1 78.6 55.8 59.5 66.1 69.8 68.7 71.3 72.8 74.1 75.5 77.0
Net non-debt creating capital inflows (negative) -7.0 -8.1 -12.3 -16.3 -20.7 -10.9 -4.7 -3.2 -2.3 -2.9 -3.3 -4.0 -4.4 -4.5 -4.5 -4.6Automatic debt dynamics 1/ -12.5 -9.0 -6.3 -6.7 -14.4 -15.7 9.6 3.3 -9.3 6.5 1.7 1.0 1.4 0.6 0.4 0.1
Contribution from nominal interest rate 1.9 1.6 1.6 1.9 2.1 2.4 2.1 1.4 1.7 1.8 2.2 2.5 3.6 3.1 2.8 2.3Contribution from real GDP growth -2.7 -3.2 -3.5 -3.8 -4.0 -4.7 6.2 -0.4 -1.7 -0.8 -0.5 -1.5 -2.2 -2.5 -2.4 -2.2Contribution from price and exchange rate changes 2/ -11.6 -7.4 -4.4 -4.8 -12.6 -13.3 1.4 2.3 -9.3 5.5 ... ... ... ... ... ...
Residual, incl. change in gross foreign assets (2-3) 3/ 10.8 16.4 13.2 18.7 28.4 16.8 -8.8 -5.6 4.8 -2.6 2.1 4.6 -0.8 1.0 -2.2 -0.6
External debt-to-exports ratio (in percent) 126.4 113.2 112.5 119.0 127.7 158.8 181.0 227.6 180.0 141.4 142.1 135.7 132.1 122.3 116.1 105.5 97.7
Gross external financing need (in billions of US dollars) 4/ 3.5 5.6 11.5 14.1 24.0 31.5 28.0 21.6 19.6 19.4 15.7 15.2 16.4 17.2 18.6 17.8in percent of GDP 17.0 22.3 39.6 42.3 56.8 60.4 57.5 45.1 36.5 38.1 10-Year 10-Year 29.4 27.9 29.0 29.2 30.2 27.4
Scenario with key variables at their historical averages 5/ 92.7 87.9 79.6 73.6 65.9 59.9 -14.2Historical Standard
Key Macroeconomic Assumptions Underlying Baseline Average Deviation
Real GDP growth (in percent) 5.5 6.7 6.4 6.5 6.4 6.2 -5.5 0.4 1.8 0.8 3.5 4.1 0.5 1.6 2.5 3.0 3.0 3.0GDP deflator in US dollars (change in percent) 22.5 14.5 7.6 7.7 19.2 16.4 -1.3 -2.1 10.0 -5.5 8.9 9.5 4.4 0.0 1.1 1.5 1.8 1.8Nominal external interest rate (in percent) 3.8 3.4 2.9 3.3 3.5 3.1 1.8 1.3 1.9 1.8 2.7 0.9 2.4 2.7 4.1 3.8 3.5 3.1Growth of exports (US dollar terms, in percent) 32.1 31.6 16.1 25.3 23.1 20.9 -23.6 18.0 30.6 -4.5 17.0 17.8 7.5 4.4 5.3 5.6 6.2 6.2Growth of imports (US dollar terms, in percent) 36.4 32.1 23.0 26.4 27.5 22.8 -33.8 4.9 24.3 0.5 16.4 20.9 3.4 5.3 5.9 6.4 6.8 6.9Current account balance, excluding interest payments -3.3 -4.7 -9.9 -15.7 -23.0 -20.5 -7.0 0.0 1.8 0.3 -8.2 8.9 2.6 1.6 1.7 0.8 0.3 -0.3Net non-debt creating capital inflows 7.0 8.1 12.3 16.3 20.7 10.9 4.7 3.2 2.3 2.9 8.8 6.2 3.3 4.0 4.4 4.5 4.5 4.6
1/ Derived as [r - g - r(1+g) + ea(1+r)]/(1+g+r+gr) times previous period debt stock, with r = nominal effective interest rate on external debt; r = change in domestic GDP deflator in US dollar terms, g = real GDP growth rate, e = nominal appreciation (increase in dollar value of domestic currency), and a = share of domestic-currency denominated debt in total external debt.2/ The contribution from price and exchange rate changes is defined as [-r(1+g) + ea(1+r)]/(1+g+r+gr) times previous period debt stock. r increases with an appreciating domestic currency (e > 0) and rising inflation (based on GDP deflator). 3/ For projection, line includes the impact of price and exchange rate changes.4/ Defined as current account deficit, plus amortization on medium- and long-term debt, plus short-term debt at end of previous period. 5/ The key variables include real GDP growth; nominal interest rate; dollar deflator growth; and both non-interest current account and non-debt inflows in percent of GDP.6/ Long-run, constant balance that stabilizes the debt ratio assuming that key variables (real GDP growth, nominal interest rate, dollar deflator growth, and non-debt inflows in percent of GDP) remain at their levels of the last projection year.
Actual
BULG
ARIA
INTERN
ATION
AL MO
NETARY FU
ND
35
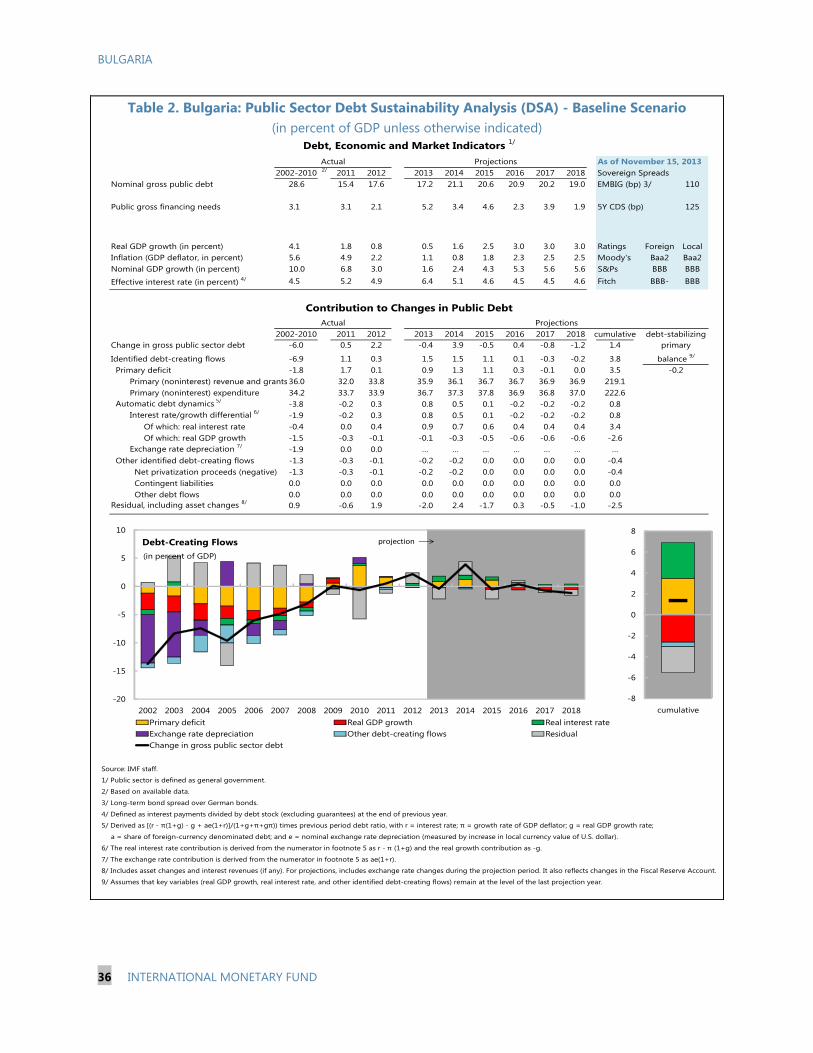
BULGARIA
36 INTERNATIONAL MONETARY FUND
Table 2. Bulgaria: Public Sector Debt Sustainability Analysis (DSA) - Baseline Scenario (in percent of GDP unless otherwise indicated)
As of November 15, 20132/ 2011 2012 2013 2014 2015 2016 2017 2018 Sovereign Spreads
Nominal gross public debt 28.6 15.4 17.6 17.2 21.1 20.6 20.9 20.2 19.0 EMBIG (bp) 3/ 110
Public gross financing needs 3.1 3.1 2.1 5.2 3.4 4.6 2.3 3.9 1.9 5Y CDS (bp) 125
Real GDP growth (in percent) 4.1 1.8 0.8 0.5 1.6 2.5 3.0 3.0 3.0 Ratings Foreign LocalInflation (GDP deflator, in percent) 5.6 4.9 2.2 1.1 0.8 1.8 2.3 2.5 2.5 Moody's Baa2 Baa2Nominal GDP growth (in percent) 10.0 6.8 3.0 1.6 2.4 4.3 5.3 5.6 5.6 S&Ps BBB BBB
Effective interest rate (in percent) 4/ 4.5 5.2 4.9 6.4 5.1 4.6 4.5 4.5 4.6 Fitch BBB- BBB
2011 2012 2013 2014 2015 2016 2017 2018 cumulativeChange in gross public sector debt -6.0 0.5 2.2 -0.4 3.9 -0.5 0.4 -0.8 -1.2 1.4
Identified debt-creating flows -6.9 1.1 0.3 1.5 1.5 1.1 0.1 -0.3 -0.2 3.8Primary deficit -1.8 1.7 0.1 0.9 1.3 1.1 0.3 -0.1 0.0 3.5
Primary (noninterest) revenue and grants36.0 32.0 33.8 35.9 36.1 36.7 36.7 36.9 36.9 219.1Primary (noninterest) expenditure 34.2 33.7 33.9 36.7 37.3 37.8 36.9 36.8 37.0 222.6
Automatic debt dynamics 5/ -3.8 -0.2 0.3 0.8 0.5 0.1 -0.2 -0.2 -0.2 0.8Interest rate/growth differential 6/ -1.9 -0.2 0.3 0.8 0.5 0.1 -0.2 -0.2 -0.2 0.8
Of which: real interest rate -0.4 0.0 0.4 0.9 0.7 0.6 0.4 0.4 0.4 3.4Of which: real GDP growth -1.5 -0.3 -0.1 -0.1 -0.3 -0.5 -0.6 -0.6 -0.6 -2.6
Exchange rate depreciation 7/ -1.9 0.0 0.0 … … … … … … …Other identified debt-creating flows -1.3 -0.3 -0.1 -0.2 -0.2 0.0 0.0 0.0 0.0 -0.4
Net privatization proceeds (negative) -1.3 -0.3 -0.1 -0.2 -0.2 0.0 0.0 0.0 0.0 -0.4Contingent liabilities 0.0 0.0 0.0 0.0 0.0 0.0 0.0 0.0 0.0 0.0Other debt flows 0.0 0.0 0.0 0.0 0.0 0.0 0.0 0.0 0.0 0.0
Residual, including asset changes 8/ 0.9 -0.6 1.9 -2.0 2.4 -1.7 0.3 -0.5 -1.0 -2.5
Source: IMF staff.
1/ Public sector is defined as general government.
2/ Based on available data.
3/ Long-term bond spread over German bonds.
4/ Defined as interest payments divided by debt stock (excluding guarantees) at the end of previous year.
5/ Derived as [(r - π(1+g) - g + ae(1+r)]/(1+g+π+gπ)) times previous period debt ratio, with r = interest rate; π = growth rate of GDP deflator; g = real GDP growth rate;
a = share of foreign-currency denominated debt; and e = nominal exchange rate depreciation (measured by increase in local currency value of U.S. dollar).
6/ The real interest rate contribution is derived from the numerator in footnote 5 as r - π (1+g) and the real growth contribution as -g.
7/ The exchange rate contribution is derived from the numerator in footnote 5 as ae(1+r).
8/ Includes asset changes and interest revenues (if any). For projections, includes exchange rate changes during the projection period. It also reflects changes in the Fiscal Reserve Account.
9/ Assumes that key variables (real GDP growth, real interest rate, and other identified debt-creating flows) remain at the level of the last projection year.
-0.2balance 9/
primary
Debt, Economic and Market Indicators 1/
2002-2010Actual
Projections
Contribution to Changes in Public DebtProjections
2002-2010Actual
debt-stabilizing
-20
-15
-10
-5
0
5
10
2002 2003 2004 2005 2006 2007 2008 2009 2010 2011 2012 2013 2014 2015 2016 2017 2018
Debt-Creating Flows
Primary deficit Real GDP growth Real interest rate Exchange rate depreciation Other debt-creating flows ResidualChange in gross public sector debt
projection
(in percent of GDP)
-8
-6
-4
-2
0
2
4
6
8
cumulative
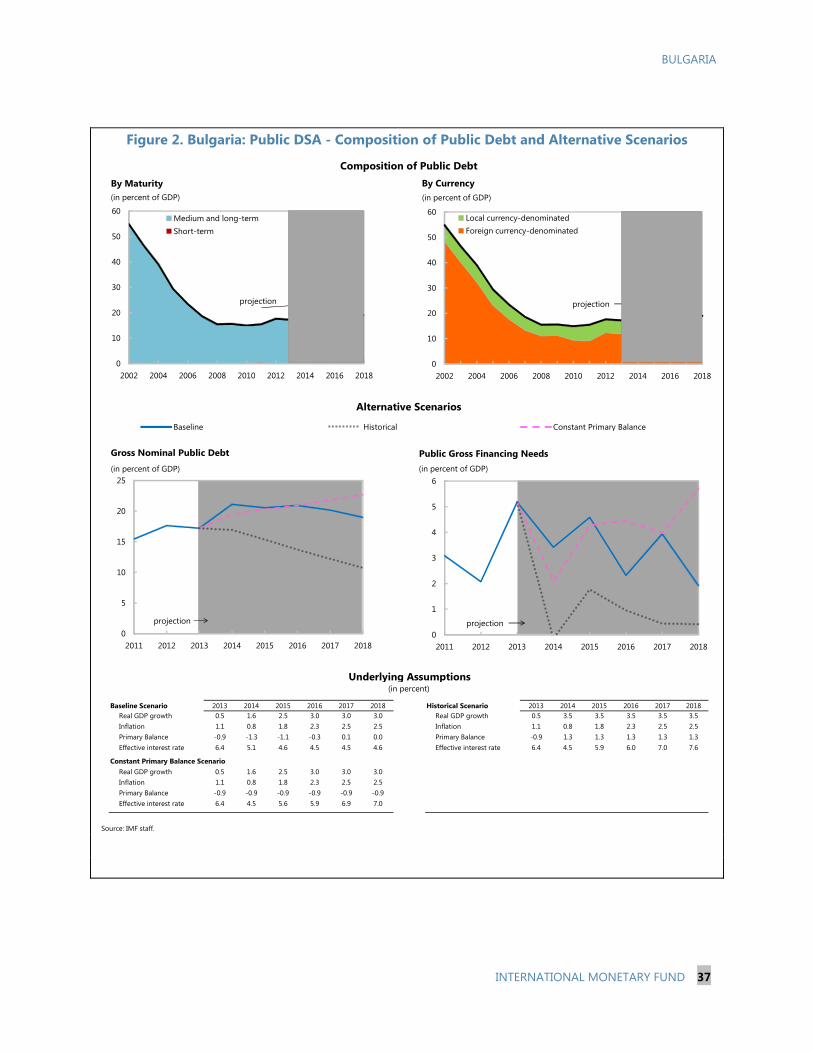
BULGARIA
INTERNATIONAL MONETARY FUND 37
Figure 2. Bulgaria: Public DSA - Composition of Public Debt and Alternative Scenarios
Baseline Scenario 2013 2014 2015 2016 2017 2018 Historical Scenario 2013 2014 2015 2016 2017 2018Real GDP growth 0.5 1.6 2.5 3.0 3.0 3.0 Real GDP growth 0.5 3.5 3.5 3.5 3.5 3.5Inflation 1.1 0.8 1.8 2.3 2.5 2.5 Inflation 1.1 0.8 1.8 2.3 2.5 2.5Primary Balance -0.9 -1.3 -1.1 -0.3 0.1 0.0 Primary Balance -0.9 1.3 1.3 1.3 1.3 1.3Effective interest rate 6.4 5.1 4.6 4.5 4.5 4.6 Effective interest rate 6.4 4.5 5.9 6.0 7.0 7.6
Constant Primary Balance ScenarioReal GDP growth 0.5 1.6 2.5 3.0 3.0 3.0Inflation 1.1 0.8 1.8 2.3 2.5 2.5Primary Balance -0.9 -0.9 -0.9 -0.9 -0.9 -0.9Effective interest rate 6.4 4.5 5.6 5.9 6.9 7.0
Source: IMF staff.
Underlying Assumptions(in percent)
Alternative Scenarios
Composition of Public Debt
Baseline Historical Constant Primary Balance
0
5
10
15
20
25
2011 2012 2013 2014 2015 2016 2017 2018
Gross Nominal Public Debt
(in percent of GDP)
projection
0
1
2
3
4
5
6
2011 2012 2013 2014 2015 2016 2017 2018
Public Gross Financing Needs(in percent of GDP)
projection
0
10
20
30
40
50
60
2002 2004 2006 2008 2010 2012 2014 2016 2018
By Maturity
Medium and long-termShort-term
projection
(in percent of GDP)
0
10
20
30
40
50
60
2002 2004 2006 2008 2010 2012 2014 2016 2018
By Currency
Local currency-denominatedForeign currency-denominated
projection
(in percent of GDP)

BULGARIA STAFF REPORT FOR THE 2013 ARTICLE IV CONSULTATION—INFORMATIONAL ANNEX Prepared By
European Department (in consultation with other departments)
FUND RELATIONS ________________________________________________________________________ 2
IMF-WORLD BANK RELATIONS __________________________________________________________ 4
STATISTICAL ISSUES ______________________________________________________________________ 9
CONTENTS
December 23, 2013
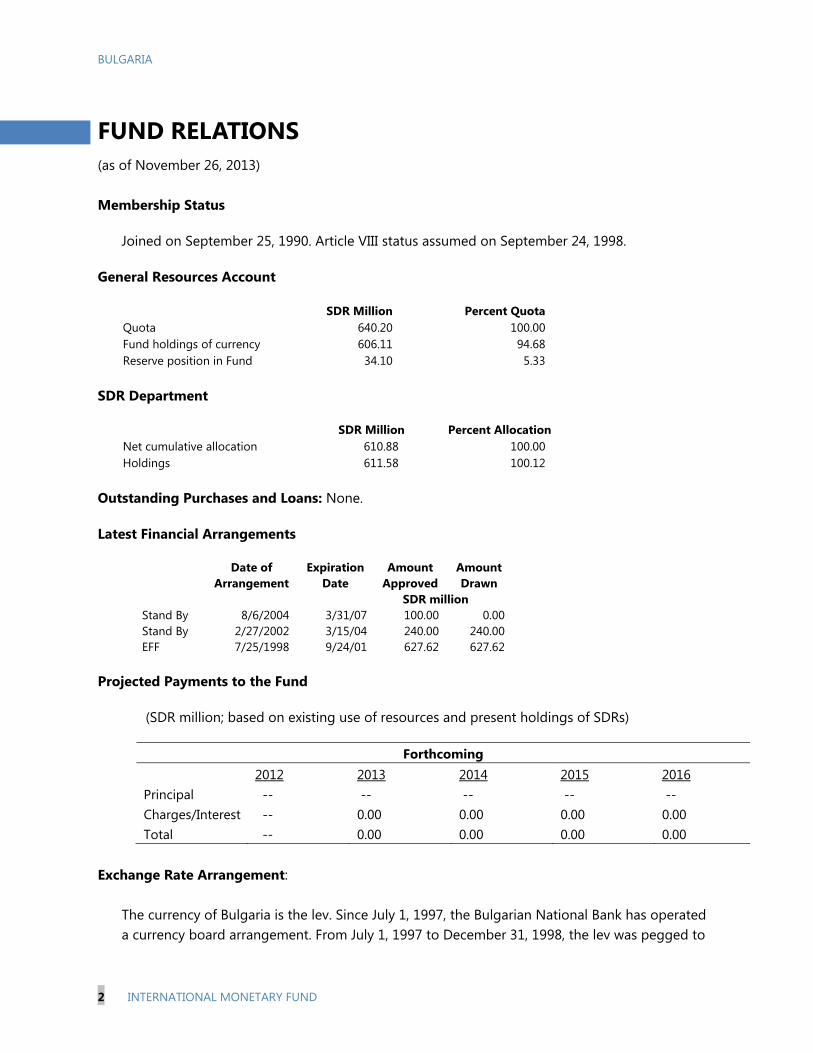
BULGARIA
2 INTERNATIONAL MONETARY FUND
FUND RELATIONS (as of November 26, 2013) Membership Status
Joined on September 25, 1990. Article VIII status assumed on September 24, 1998.
General Resources Account
SDR Million Percent Quota Quota 640.20 100.00 Fund holdings of currency 606.11 94.68 Reserve position in Fund 34.10 5.33
SDR Department
SDR Million Percent Allocation Net cumulative allocation 610.88 100.00 Holdings 611.58 100.12
Outstanding Purchases and Loans: None.
Latest Financial Arrangements
Date of
Arrangement Expiration
Date Amount
Approved Amount Drawn
SDR million Stand By 8/6/2004 3/31/07 100.00 0.00 Stand By 2/27/2002 3/15/04 240.00 240.00 EFF 7/25/1998 9/24/01 627.62 627.62
Projected Payments to the Fund
(SDR million; based on existing use of resources and present holdings of SDRs)
Forthcoming 2012 2013 2014 2015 2016 Principal -- -- -- -- -- Charges/Interest -- 0.00 0.00 0.00 0.00 Total -- 0.00 0.00 0.00 0.00
Exchange Rate Arrangement:
The currency of Bulgaria is the lev. Since July 1, 1997, the Bulgarian National Bank has operated a currency board arrangement. From July 1, 1997 to December 31, 1998, the lev was pegged to

BULGARIA
INTERNATIONAL MONETARY FUND 3
the Deutsche Mark at BGN 1000 per Deutsche Mark. Since January 1, 1999 the lev has been pegged to the euro at BGN 1.95583 per euro. Bulgaria joined the European Union (EU) on January 1, 2007. Bulgaria has accepted the obligations of Article VIII, Sections 2–4, and maintains an exchange system free of restrictions on the making of payments and transfers for current international transfers. Article IV Consultations
The 2012 Article IV Board discussion took place on November 30, 2012. The Staff Report was published on December 13, 2012 (Country Report No. 12/328). Resident Representative
Mr. Tolosa is the Regional Resident Representative, based in Bucharest. He took up the position in June 2013.
BULGARIA
4 INTERNATIONAL MONETARY FUND
IMF-WORLD BANK RELATIONS A. Partnership in Bulgaria’s Development Strategy
1. The World Bank has been leading the policy dialogue in structural and institutional reforms aimed at Bulgaria’s successful EU integration and convergence. On May 17, 2011 the Board of Directors discussed the Country Partnership Strategy (CPS) of the Bank which outlined the roadmap for the Bank’s country support for the period 2011–13. The CPS maintains a strong focus on Bulgaria making the most of its EU membership. It aims to partner with Bulgaria in strengthening national institutions and capacity to meet EU targets and in accelerating the absorption of EU grant funds. The objective of the CPS is to support Bulgaria in strengthening institutions and policies to achieve smart, sustainable, and inclusive growth. The CPS proposes a program dominated by knowledge and advisory services complemented by a modest lending program. World Bank knowledge and advisory services focus on policy reforms, sector strategies and strengthening institutional capacity for increased EU funds absorption. The Bank continues to undertake substantial knowledge and advisory services on policy reforms in select sectors and themes of Bulgaria’s National Reform Program 2011–2015 such as innovation, education, business regulation, transport, water, climate change, and social inclusion.
B. IMF-World Bank Collaboration in Specific Areas
2. The Fund team led by Ms. Shannon (mission chief) meets regularly with the World Bank Bulgaria team led by Mr. Markus Repnik (Country Manager for Bulgaria, the Czech Republic and Slovakia), to discuss macro-critical structural reforms and to coordinate the two teams’ work. The most recent meeting took place in November 2013. 3. Bulgaria’s main macroeconomic challenges are to maintain stability and enhance growth in a difficult external environment. Fiscal discipline and growth enhancing public spending are key to supporting the currency board arrangement and improving growth prospects. Continued prudent regulation and adequate capital buffers will help maintain financial system stability in a changing supervisory framework in Europe, while improvements in the business climate will facilitate more sustainable tradable-based growth. 4. Based on this shared assessment, the teams identified six structural reform areas as macro critical in view of their central role in achieving fiscal consolidation and enhancing growth.
EU funds absorption. Increased absorption of EU funds through improvements of
administrative capacity and upgrading planning, execution, and monitoring systems will play a vital role in supporting growth and investment.

BULGARIA
INTERNATIONAL MONETARY FUND 5
Healthcare reform. Mispricing and other distorted incentives have created financing pressures for the public health insurance fund, calling for a comprehensive reform focusing on efficiency and quality of the system—including through rationalizing in-patient care.
Education reform. Building on past achievement, education reforms should focus on improving results. The areas of reform include measures to enhance the quality of student learning and to improve access to education.
Pension reform. Reforms to improve the financial performance and equity of the pension system will be key to contain rising fiscal costs associated with aging and declining population.
Improving the environment for growth. Anchoring wage growth in productivity growth and strengthening the business environment by improving the insolvency framework and reducing the regulatory costs for doing business are called for. Furthermore, reforms in the judicial system and anti-corruption and anti-monopoly regimes are necessary to underpin higher potential growth.
Basic infrastructure and energy. Upgrading basic infrastructure and strengthening energy governance, security of supply, and energy efficiency are a high priority to improve competitiveness of the economy.
5. The teams agreed that the Bank and the Fund share responsibility on financial sector issues, revenue administration, and pension reforms, while the Bank will lead EU funds absorption, basic infrastructure, business environment, health and education reforms, and social inclusion. Both teams will keep the other apprised of upcoming missions and assessments. World Bank country economists participated in the Article IV Consultations in September 2012 and November 2013.

BULGARIA
6 INTERNATIONAL MONETARY FUND
Bulgaria: Bank and Fund activities, April 2011– June 2015 Work Program Products Delivery Date
World Bank Technical assistance on pensions (analytic work and
workshops)
Water Sector Strategy (advisory)
Poverty & Social Policy Monitoring (analytic work)
Competitiveness Through Innovation (analytic work)
Public Expenditures for Growth and Competitiveness
(analytic work)
Gas Security of Supply Study (analytic work)
Health Sector Policy Note (analytic work)
Support for the implementation of the National Roma
Integration Strategy (analytic work)
Regulatory Reform (analytic work)
Mitigating the Economic Impact of an Aging Population
FY11-FY13 Programmatic Education Sector (advisory)
Bulgaria Power Sector Diagnostic Assessment
Consumer Protection and Financial Advisory
Gender Dimensions of Roma Inclusion (analytic work)
Climate Change and Green Growth (analytic work)
Optimizing and Integrating social Benefits and
Employment Services Provision (advisory)
Bulgaria Productivity Growth (analytic work)
Bulgaria Energy Dialogue
Financial Consumer Protection (advisory)
Competition Policy Reforms and Business Environment
Programmatic Education Sector FY14-15 (advisory)
Deposit Insurance (regional task)
April 2011
June 2011
January 2012
February 2012
March 2012
June 2013
October 2012
June 2013
June 2013
September 2013
September 2013
May 2013
June 2013
October 2013
December 2013
March 2014
June 2014
September 2014
May 2014
June 2014
June 2014
June 2015
Fund TA provision on public debt management (Spring 2011)
Staff visit
TA provision on national accounts
2012 Article IV Consultation
Staff visit
2013 Article IV Consultation
Staff visit
2014 Article IV Consultation
October 2011 report
May 2012
October 2012
November 2012 Board
July 2013
November 2013
Spring 2014
Fall 2014

BULGARIA
INTERNATIONAL MONETARY FUND 7
C. The World Bank Group Strategy and Lending Operations
6. The Bank’s Country Partnership Strategy (CPS) for Bulgaria, discussed by the Bank’s Board on May 17, 2011, is anchored in Bulgaria’s National Reform Program to implement the Europe 2020 Strategy and focused on three main pillars: (i) policy reforms for the National Reform Program to implement Europe 2020 Strategy, (ii) strategies and institutions to accelerate EU funds absorption, and (iii) complementing EU financing.1 7. The active Bank portfolio in Bulgaria as of November 2013 consists of 3 operations at the original loan amount of US$230.5 million equivalent. The World Bank’s lending program in Bulgaria to date comprises 46 IBRD operations with a total original commitment of US$3,003 million equivalent, consisting of 15 adjustment loans (US$1,725.8 million), 24 investment projects (US$1,123 million), one debt reduction loan (US$125 million), four Bank-managed Global Environmental Fund (GEF) grants, and two Bank-managed Prototype Carbon Fund (PCF) operations. Of these 46 operations, 43 have been completed (of which 13 have been fully or partially cancelled during implementation), and 3 operations are currently under implementation (Table 1).
8. Economic and Sector Work. The World Bank country diagnostic work completed over the last two years focuses on assessing the economic and fiscal impact of an aging population; governance, quality assurance and financing of higher education; health sector reform; programmatic crisis monitoring, and administrative barriers to private sector growth Recently completed analytical work includes: Mitigating the Economic Impact of an Aging Population, Power Sector Rapid Assessment, Health Sector Diagnosis. Strengthening Higher Education, Administrative Barriers to Businesses at Municipal Level, and Alternative Dispute Resolution for Financial Services. Three reimbursable advisory service (RAS) agreements for provision of World Bank advisory services were signed in 2012 focusing on water supply and sanitation, innovation, and roads. Currently RAS agreements in the field of health and irrigation are under preparation.
9. As of November, 2013, the IFC had 37 projects (completed and ongoing) in Bulgaria with total commitments of over US$895 million. The single biggest investment of IFC in the country is in the field of renewable energy in the form of a loan for the construction of the largest wind park in Bulgaria. IFC is also involved in the development of the Galata gas field near the Black sea cost. In line with the IFC’s strategic goals for Bulgaria, IFC has supported a company investing in agricultural land and promoting land consolidation. In the financial sector, IFC is supporting two specialized SME banks; it established Bulgaria’s first micro-lending bank and has invested in a venture fund, which is also targeting the SME sector. In other industries, IFC had contributed to key manufacturing projects—it has supported the modernization and expansion of an electronics producer, a large steel mill, and two glass processing plants. Some IFC projects entail an important environmental component. One of the manufacturing plants, for example, is purchasing equipment 1 International Bank for Reconstruction and Development and International Finance Corporation Country Partnership Strategy for Bulgaria for the period 2011-2013 (April 20, 2011).

BULGARIA
8 INTERNATIONAL MONETARY FUND
which would reduce its GHG emissions and the electronics producing company is making sensors for cars that monitor the emission of polluting gases and improve fuel efficiency.
Questions on World Bank activities in Bulgaria may be referred to Ms. Stella Ilieva (3592–9697–251) and Ms. Sylvia Stoynova (3592–9697–220).
Table 1. Bulgaria: Active World Bank Operations (Net of Cancellations)
Operation US$ million Board date
1. Second Trade and Transport Facilitation in Southeast Europe
(TTFSE 2) 50.9 2007
2.
2. Social Inclusion Project 59.0 2008
3. Municipal Infrastructure Development Project 118.7 2009
BULGARIA
INTERNATIONAL MONETARY FUND 9
STATISTICAL ISSUES Data provision is adequate for surveillance purposes. Bulgaria participates in the SDDS since 2003.
Real Sector 1. The National Statistical Institute (NSI) is responsible for compiling national accounts, based on a system consistent with the System of National Accounts 1993 (SNA 1993) and the European System of Accounts 1995. GDP data by activity and expenditure categories are compiled and reconciled within an annual supply and use framework. Government output and final consumption are estimated on an accrual basis. Published national accounts include current and capital accounts for the five main domestic sectors (general government and its sub-sectors, financial corporations, non-financial corporations, nonprofit institutions serving households, and households). The INS publishes financial accounts and balance sheets by institutional sectors and sub-sectors on an annual basis. 2. The NSI has compiled estimates of quarterly GDP by the production and expenditure approaches in current and constant prices since 1994. The preliminary flash estimates of GDP and its components by production and expenditure side are produced and disseminated 42–44 days after the reference period, although persistent inconsistencies in the data have limited their usage. The quarterly updates are disseminated 65 days after the end of the reference quarter with final figures disseminated after approximately 5 quarters. The annual data are disseminated about 5 quarters after the end of the reference year. The estimates at constant prices, which follow international standards, use chain-linked indices. Problems remain in the coverage of private sector activities as well as regarding constant price estimates of capital formation and external trade, although progress has been made in the development of export and import deflators. Recent IMF TA advised on improving the seasonal adjustment procedure of quarterly GDP and volume measures of taxes on products. 3. Regarding price data, the NSI produces a domestic consumer price index (CPI), a harmonized consumer price index (HICP) according to Eurostat methods, and a producer price index (PPI). All are updated monthly. The CPI series begins in 1995, the PPI in 2000 and the HICP in 2005 (for earlier years it is set equal to the CPI). The coverage of the consumer price indices was extended, although they still exclude some important sectors, mainly owner-occupied housing and health and life insurance. Since 2004, financial services are included. Work has started on inclusion of owner-occupied housing in the HICP under a Eurostat project. The geographical coverage of the index is restricted to 27 urban areas that account for an estimated 65 percent of sales.
4. The flow of customs data has improved significantly in recent years and a new system for processing customs records is near completion. The development of export and import unit value indices is progressing smoothly and additional support is expected from Eurostat in this area.

BULGARIA
10 INTERNATIONAL MONETARY FUND
The current indices are used as deflators for the import and export components of the national accounts. Each month the Foreign Trade Statistics Department of the NSI is in contact with the BNB to review data issues and ensure consistency between the NSI export and import data and the balance of payments data. 5. The national accounts data on employment and hours worked are compiled by the NSI based on a Labor Force Survey and Enterprises’ survey on employment—“Quarterly survey on employees, hours worked, wages and salaries, and other expenditures paid by the employers” and “Annual enterprises survey on employment, wages and salaries, and other labor cost” are adjusted according to the ESA95 methodology. The NSI current monthly and quarterly estimates are based on the results from the quarterly sample survey of establishments – QLCS. The QLCS sample includes 13000 private sector enterprises out of approximately 223000. The public sector enterprises are covered exhaustively except for the schools and kindergartens for which from 2008 a sample is drown as well. The NSI household labor force survey is an alternative source of data, but the methodological discrepancies between household and establishment survey need to be taken into account (especially regarding agricultural employment). Since the beginning of 2003 a quarterly Labour force survey, providing average quarterly results, is implemented. 6. The NSI also compiles and publishes quarterly wage data for various economic sectors. The main shortcomings include: (i) under-reporting of private sector wages; and (ii) reporting of average gross earnings only and not wages by occupation. Since 2002, a survey on earnings (Structure of Earnings Survey – SES) is conducted every four years providing information about average monthly and hourly earnings by economic activity, occupation, gender and education. The household budget survey provides an alternative source of data for private sector wages. 7. A Population Census was conducted in early 2011 and is a source for redesigning the household surveys conducted by the NSI, particularly the household budget survey and the labor force survey.
Government finance 8. In recent years, following the recommendations of a combined STA/FAD mission and within the framework of fiscal reporting requirements for EU accession, the authorities have made significant progress on implementing accrual accounting for government, budgetary and statistical systems. Consolidated data on a cash basis, covering general and central government operations, are routinely reported for publication in the GFS Yearbook/Annual CD-ROM and in IFS. In addition, quarterly accrual GFS data for the whole general government are reported for publication in IFS, through Eurostat. The major part of the GFS data is compiled by NSI and the transmissions to Eurostat are carried out by NSI. Since September 2008, the Ministry of Finance (MOF) prepares and submits the SDDS indicators for the central government finances in the IMF’s GFSM 2001 format. The same indicators are published on the MOF’s website on a monthly and quarterly basis.

BULGARIA
INTERNATIONAL MONETARY FUND 11
9. The Ministry of Finance prepares data on the execution of the consolidated government budget on a monthly basis, following the national presentation. These data are not according to GFS standards. Aggregate data on revenue, expenditure, balance of the general government and composition of financing (in national formats) are published in the monthly bulletin and posted on the MOF’s website, in addition to the GFSM 2001 data. Progress has been made in presenting data on a disaggregated basis, including expenditure by functional classification. In addition, a full economic classification of expenditure is now available, and the authorities have provided such data on an annual basis back to 1998. Money and banking statistics 10. The BNB reports monetary data for publication in IFS based on the ECB framework for the collection and compilation of monetary data. Balance of payments 11. Bulgaria provides quarterly balance of payments (BOP) statistics for dissemination in IFS on a timely basis. Yearly BOP data are disseminated in the Balance of Payments Statistics Yearbook up to 2012. The BNB derives other sectors’ investment income data on reinvested earnings (debit) from the annual direct investment surveys of the NSI, as well as through quarterly surveys of the largest foreign-owned enterprises for preliminary estimates. Starting from 2002, data series on freight were revised according to a new methodology introduced jointly by the BNB and the NSI. Since joining the EU in January 2007, the trade data with EU countries are being collected following the INTRASTAT system. Data for imports and exports of goods with non-EU member states are based on SAD (Single Administrative Document) collected by Customs Agency while the movement of goods within the EU is based on Intrastat declarations collected by the National Revenue Agency. Data Standards and Quality 12. Bulgaria is subject to the statistical requirements and reporting standards of Eurostat and the European Central Bank (ECB). Bulgaria subscribes to the Special Data Dissemination Standard (SDDS) since 2003, and the relevant metadata have been posted on the Dissemination Standards Bulletin Board. A data ROSC has been published in December 2003. The latest (2012) annual observation report for Bulgaria is posted on the Fund’s website http://dsbb.imf.org/images/pdfs/AnnualReports/2012/BGR_SDDS_AR2012.pdf.
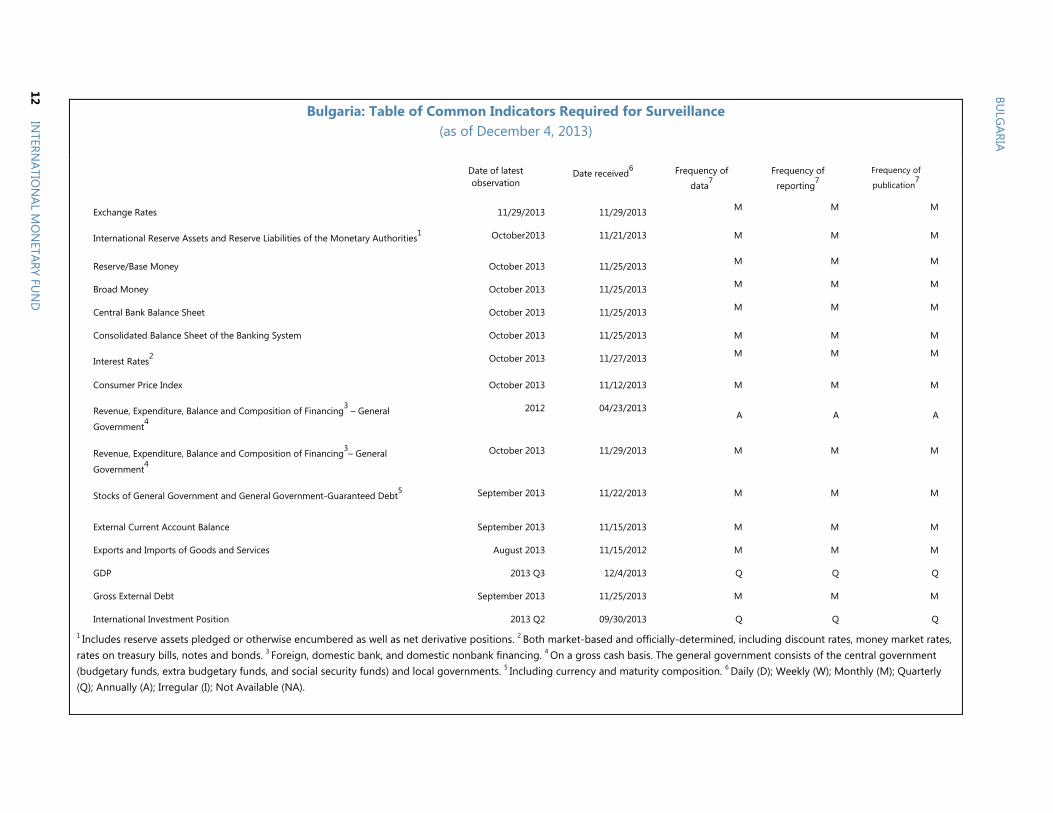
Bulgaria: Table of Common Indicators Required for Surveillance (as of December 4, 2013)
Date of latest
observation Date received6 Frequency of
data7
Frequency of
reporting7
Frequency of
publication7
Exchange Rates 11/29/2013 11/29/2013 M M M
International Reserve Assets and Reserve Liabilities of the Monetary Authorities1 October2013 11/21/2013 M M M
Reserve/Base Money October 2013 11/25/2013 M M M
Broad Money October 2013 11/25/2013 M M M
Central Bank Balance Sheet October 2013 11/25/2013 M M M
Consolidated Balance Sheet of the Banking System October 2013 11/25/2013 M M M
Interest Rates2 October 2013 11/27/2013 M M M
Consumer Price Index October 2013 11/12/2013 M M M
Revenue, Expenditure, Balance and Composition of Financing3 – General
Government4
2012 04/23/2013 A
A
A
Revenue, Expenditure, Balance and Composition of Financing3– General
Government4
October 2013 11/29/2013 M M M
Stocks of General Government and General Government-Guaranteed Debt5 September 2013 11/22/2013 M M M
External Current Account Balance September 2013 11/15/2013 M M M
Exports and Imports of Goods and Services August 2013 11/15/2012 M M M
GDP 2013 Q3 12/4/2013 Q Q Q
Gross External Debt September 2013 11/25/2013 M M M
International Investment Position 2013 Q2 09/30/2013 Q Q Q 1 Includes reserve assets pledged or otherwise encumbered as well as net derivative positions. 2 Both market-based and officially-determined, including discount rates, money market rates, rates on treasury bills, notes and bonds. 3 Foreign, domestic bank, and domestic nonbank financing. 4 On a gross cash basis. The general government consists of the central government (budgetary funds, extra budgetary funds, and social security funds) and local governments. 5 Including currency and maturity composition. 6 Daily (D); Weekly (W); Monthly (M); Quarterly (Q); Annually (A); Irregular (I); Not Available (NA).
BULG
ARIA
12 IN
TERNATIO
NAL M
ON
ETARY FUN
D
Press Release No. 14/30 FOR IMMEDIATE RELEASE January 30, 2014
IMF Executive Board Concludes 2013 Article IV Consultation with Bulgaria
On January 24, 2014, the Executive Board of the International Monetary Fund (IMF) concluded the Article IV consultation with Bulgaria.1 In the aftermath of the global financial crisis growth has remained low and unemployment high. Real GDP growth is projected at about 0.5 percent in 2013 as domestic uncertainties undermined demand but exports are performing well. Domestic demand is projected to recover gradually, and exports and foreign direct investment (FDI) will benefit from recovery in Europe, allowing real GDP growth to rise to about 1.6 percent in 2014. The current account of the balance of payments is expected to be in surplus in 2013 but return to a modest deficit in the medium term, financed by FDI. Inflation is projected to be subdued in the short term, rising only from 0.4 percent in 2013 to 0.8 percent in 2014. With employment beginning to grow, unemployment is projected to decline slightly in 2014 but remain high. Strong macroeconomic and financial sector policies have mitigated vulnerabilities arising from the difficult external and domestic environment. The fiscal deficit fell to 0.5 percent of GDP in 2012 and public debt remained the second lowest in the EU. The reduction in banks’ foreign liabilities has been gradual and is largely driven by plentiful bank liquidity, resulting in a positive net foreign asset position for the first time since 2006, and capitalization of the financial sector is high. Although nonperforming loans (NPLs)—a legacy from the boom period and subsequent crisis—amounted to 17.2 percent of loans in September, coverage by provisions is comfortable at 72.7 percent.
1 Under Article IV of the IMF's Articles of Agreement, the IMF holds bilateral discussions with members, usually every year. A staff team visits the country, collects economic and financial information, and discusses with officials the country's economic developments and policies. On return to headquarters, the staff prepares a report, which forms the basis for discussion by the Executive Board.
International Monetary Fund 700 19th Street, NW Washington, D. C. 20431 USA
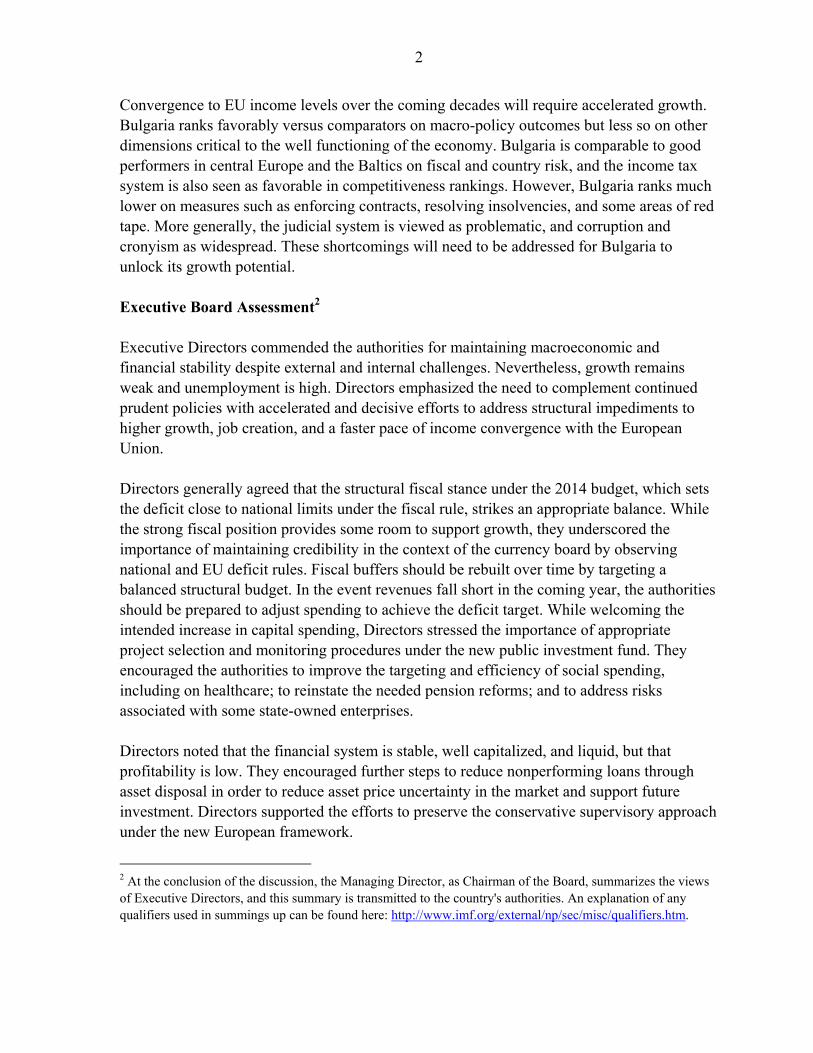
2
Convergence to EU income levels over the coming decades will require accelerated growth. Bulgaria ranks favorably versus comparators on macro-policy outcomes but less so on other dimensions critical to the well functioning of the economy. Bulgaria is comparable to good performers in central Europe and the Baltics on fiscal and country risk, and the income tax system is also seen as favorable in competitiveness rankings. However, Bulgaria ranks much lower on measures such as enforcing contracts, resolving insolvencies, and some areas of red tape. More generally, the judicial system is viewed as problematic, and corruption and cronyism as widespread. These shortcomings will need to be addressed for Bulgaria to unlock its growth potential. Executive Board Assessment2 Executive Directors commended the authorities for maintaining macroeconomic and financial stability despite external and internal challenges. Nevertheless, growth remains weak and unemployment is high. Directors emphasized the need to complement continued prudent policies with accelerated and decisive efforts to address structural impediments to higher growth, job creation, and a faster pace of income convergence with the European Union.
Directors generally agreed that the structural fiscal stance under the 2014 budget, which sets the deficit close to national limits under the fiscal rule, strikes an appropriate balance. While the strong fiscal position provides some room to support growth, they underscored the importance of maintaining credibility in the context of the currency board by observing national and EU deficit rules. Fiscal buffers should be rebuilt over time by targeting a balanced structural budget. In the event revenues fall short in the coming year, the authorities should be prepared to adjust spending to achieve the deficit target. While welcoming the intended increase in capital spending, Directors stressed the importance of appropriate project selection and monitoring procedures under the new public investment fund. They encouraged the authorities to improve the targeting and efficiency of social spending, including on healthcare; to reinstate the needed pension reforms; and to address risks associated with some state-owned enterprises.
Directors noted that the financial system is stable, well capitalized, and liquid, but that profitability is low. They encouraged further steps to reduce nonperforming loans through asset disposal in order to reduce asset price uncertainty in the market and support future investment. Directors supported the efforts to preserve the conservative supervisory approach under the new European framework.
2 At the conclusion of the discussion, the Managing Director, as Chairman of the Board, summarizes the views of Executive Directors, and this summary is transmitted to the country's authorities. An explanation of any qualifiers used in summings up can be found here: http://www.imf.org/external/np/sec/misc/qualifiers.htm.

3
Directors emphasized that bold structural reforms are needed to lift growth, create jobs, and enhance productivity. Policies should focus on improving the business climate and the judicial system as well as anti-corruption and anti-monopoly regimes. Active labor market policies, including further improvements in education and training will be important to reduce labor market rigidities. Directors also encouraged continued efforts to ensure the rapid and efficient absorption of EU funds.
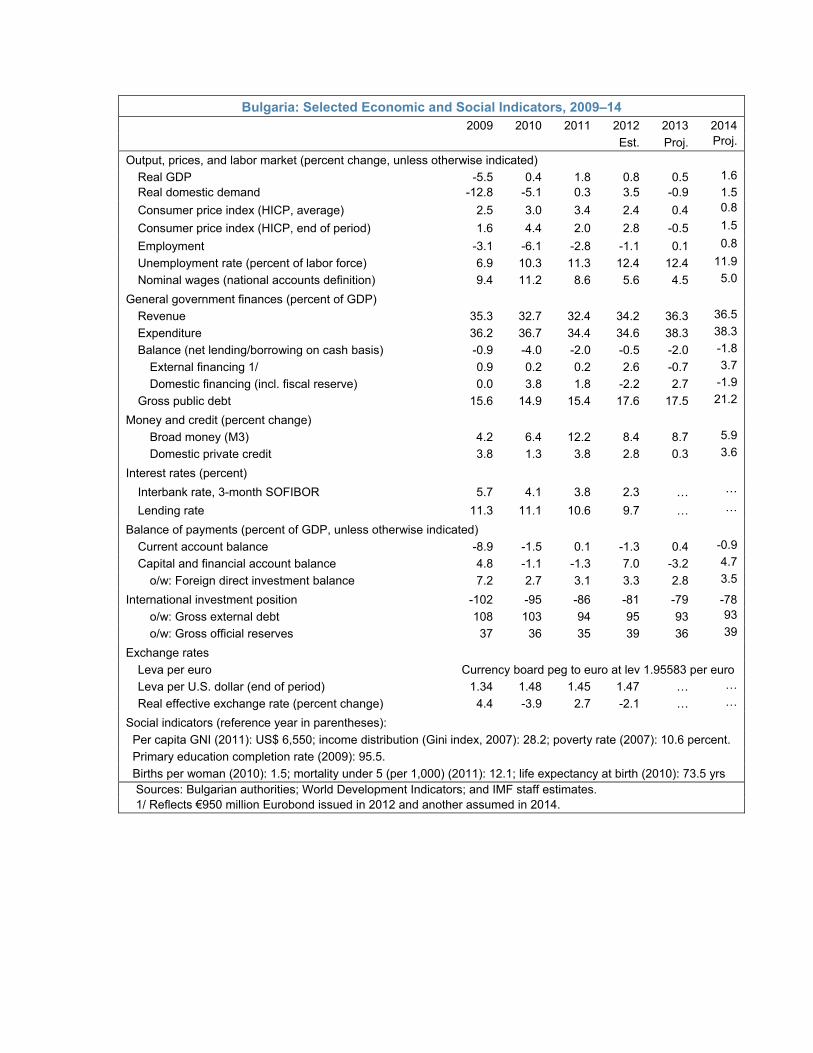
Bulgaria: Selected Economic and Social Indicators, 2009–14 2009 2010 2011 2012 2013 2014
Est. Proj. Proj.
Output, prices, and labor market (percent change, unless otherwise indicated)
Real GDP -5.5 0.4 1.8 0.8 0.5 1.6
Real domestic demand -12.8 -5.1 0.3 3.5 -0.9 1.5
Consumer price index (HICP, average) 2.5 3.0 3.4 2.4 0.4 0.8
Consumer price index (HICP, end of period) 1.6 4.4 2.0 2.8 -0.5 1.5
Employment -3.1 -6.1 -2.8 -1.1 0.1 0.8
Unemployment rate (percent of labor force) 6.9 10.3 11.3 12.4 12.4 11.9
Nominal wages (national accounts definition) 9.4 11.2 8.6 5.6 4.5 5.0
General government finances (percent of GDP)
Revenue 35.3 32.7 32.4 34.2 36.3 36.5
Expenditure 36.2 36.7 34.4 34.6 38.3 38.3
Balance (net lending/borrowing on cash basis) -0.9 -4.0 -2.0 -0.5 -2.0 -1.8
External financing 1/ 0.9 0.2 0.2 2.6 -0.7 3.7
Domestic financing (incl. fiscal reserve) 0.0 3.8 1.8 -2.2 2.7 -1.9
Gross public debt 15.6 14.9 15.4 17.6 17.5 21.2
Money and credit (percent change)
Broad money (M3) 4.2 6.4 12.2 8.4 8.7 5.9
Domestic private credit 3.8 1.3 3.8 2.8 0.3 3.6
Interest rates (percent)
Interbank rate, 3-month SOFIBOR 5.7 4.1 3.8 2.3 … …
Lending rate 11.3 11.1 10.6 9.7 … …
Balance of payments (percent of GDP, unless otherwise indicated)
Current account balance -8.9 -1.5 0.1 -1.3 0.4 -0.9
Capital and financial account balance 4.8 -1.1 -1.3 7.0 -3.2 4.7
o/w: Foreign direct investment balance 7.2 2.7 3.1 3.3 2.8 3.5
International investment position -102 -95 -86 -81 -79 -78
o/w: Gross external debt 108 103 94 95 93 93
o/w: Gross official reserves 37 36 35 39 36 39
Exchange rates
Leva per euro Currency board peg to euro at lev 1.95583 per euro
Leva per U.S. dollar (end of period) 1.34 1.48 1.45 1.47 … …
Real effective exchange rate (percent change) 4.4 -3.9 2.7 -2.1 … …
Social indicators (reference year in parentheses):
Per capita GNI (2011): US$ 6,550; income distribution (Gini index, 2007): 28.2; poverty rate (2007): 10.6 percent.
Primary education completion rate (2009): 95.5.
Births per woman (2010): 1.5; mortality under 5 (per 1,000) (2011): 12.1; life expectancy at birth (2010): 73.5 yrs Sources: Bulgarian authorities; World Development Indicators; and IMF staff estimates. 1/ Reflects €950 million Eurobond issued in 2012 and another assumed in 2014.

Statement by Menno Snel, Executive Director for Bulgaria and Tsvetan Manchev, Advisor to Executive Director
January 24, 2014 The Bulgarian authorities highly appreciate the informative and candid exchange of views with the mission during the 2013 Article IV consultation, and thank staff for their appraisal. They remain committed to prudent macroeconomic policies, and attentive to the Fund’s advice and recommendations. Despite the external headwinds and domestic challenges, Bulgaria maintains macroeconomic and financial stability. Amid the uncertainty, the Currency Board Arrangement (CBA) continues to be the cornerstone for domestic policymaking, together with stringent prudential regulations and a strong underlying fiscal position. A new impetus for the structural reforms will come from improving public confidence in the reform process and further strengthening of the EU fund’s utilization. The authorities’ near-term plan includes three main pillars: (1) increased attention to social issues, thereby reducing the number of people at risk of poverty or social exclusion through better targeting and increased efficiency of social spending; (2) further reduction of external and fiscal vulnerabilities through internal restructuring of the budget without deviating from the new medium-term structural deficit target; and (3) maintaining a conservative approach to bank supervision while implementing the new European Capital Requirements Directive IV (CRD IV) framework. We focus our remarks on (1) recent macroeconomic developments; (2) fiscal sustainability; (3) the banking system; and (4) structural reforms. Recent Macroeconomic Developments The GDP dynamics in Q3 2013 suggested an acceleration of growth to 1.5 percent, which compared favourably to the EU average growth during the same period (0.3 percent). Growth was mainly boosted by exports, up by 9.6 percent. Even as demand from export-oriented industries led to higher imports, up by 8.6 percent, net exports sustained their positive contribution. Final consumption increased by 1.2 percent driven by the rise in public spending. Consumer prices increased by 0.2 percent in October, thus breaking the deflationary path, and the negative annual HICP decelerated to 1.1 percent. Short-term indicators also confirm these early signs of recovery. Labor productivity broke the negative trend observed in the previous quarter, and stepped up by 1.6 percent yoy in real terms in Q3. The upward industrial productivity trend was the main driver behind the quarterly reading, up by 4 percent (yoy). The seasonally adjusted unemployment rate marginally decreased in Q3, but the trend reversed in October, and its level remained unchanged in November (12.9 percent).

2
The current account balance recorded a surplus of more than €1.1 billion in January-October (2.8 percent of GDP). It has been improving (in yoy terms) in most of the 2013 months, mainly resulting from stronger export of goods. The cumulative trade deficit narrowed by 39.5 percent (yoy) in January-October. The current and capital account was positive for the same period, amounting to €1.43 billion, and at the end of 2013 international reserves reached €14.4 billion which covers more than 7 months of the import. Fiscal Sustainability Since the global crisis, the authorities have been facing the daunting task of striking the right balance between fiscal consolidation and supporting economic growth. The protracted slowdown and uncertainty in the Euro Area and the domestic discord in early 2013 necessitated a swift and firm political and policy response. While fully observing the restrictions set by the new Fiscal Compact and domestic fiscal rules, in April 2013 the caretaker government passed a small social assistance package of 0.05 percent of GDP. Given the uncertainty it also proposed a marginal relaxation of the medium-term balance target, and the 2013-2016 Convergence Program extended the path of fiscal consolidation toward achieving Bulgaria’s MTO of a 0.5 percent structural deficit by one year, to 2017. After the parliamentary elections in May 2013, the newly established parliamentary majority has taken power with the firm ambition to spur growth, while preserving the sound underlying fiscal position. Within the revised medium-term budgetary framework, in June, the new government passed a second small social assistance package of additional 0.03 percent of GDP, and in August the Parliament revised the 2013 Budget Law which provided an additional fiscal impulse of 0.7 percent of GDP. As a result, the fiscal deficit was set to reach 2.0 percent of GDP. The budget implementation parameters as of end-November and operational data for December outline an achievement of the revised fiscal targets for the year. At the end of 2013 the fiscal reserve also remained well above the minimum threshold set by the 2013 Budget Law. The 2014 budget fully demonstrates the fiscal responsibility of the new government as well as continuity in the fiscal policy. It remains consistent with national fiscal rules and the Fiscal Compact. The budget envisages a deficit of 1.8 percent of GDP and a further decline to a deficit of 1.1 percent of GDP by 2016. In structural terms the deficit in 2016 is expected to be reduced to 1 percent of GDP which is in line with the MTO. Implementation of the new Public Finance Law is underway, and the 2014 budgetary execution will be the first to fully comply with the new rules. This year, however, the budget lays down taut and ambitious reforms in the public finance management, while restraining administrative and operational expenditures. Within the budget envelop, the authorities aim at increasing the efficiency of capital spending in small municipalities with otherwise low administrative capacity through the establishment of a new special purpose investment fund (0.6 percent of GDP). A competitive bidding process will be implemented under the direct control of the Council of Ministers. Concise amendments in the existing administrative regulations have been adopted to increase efficiency of the active labor market policies at both the national and regional levels. In line
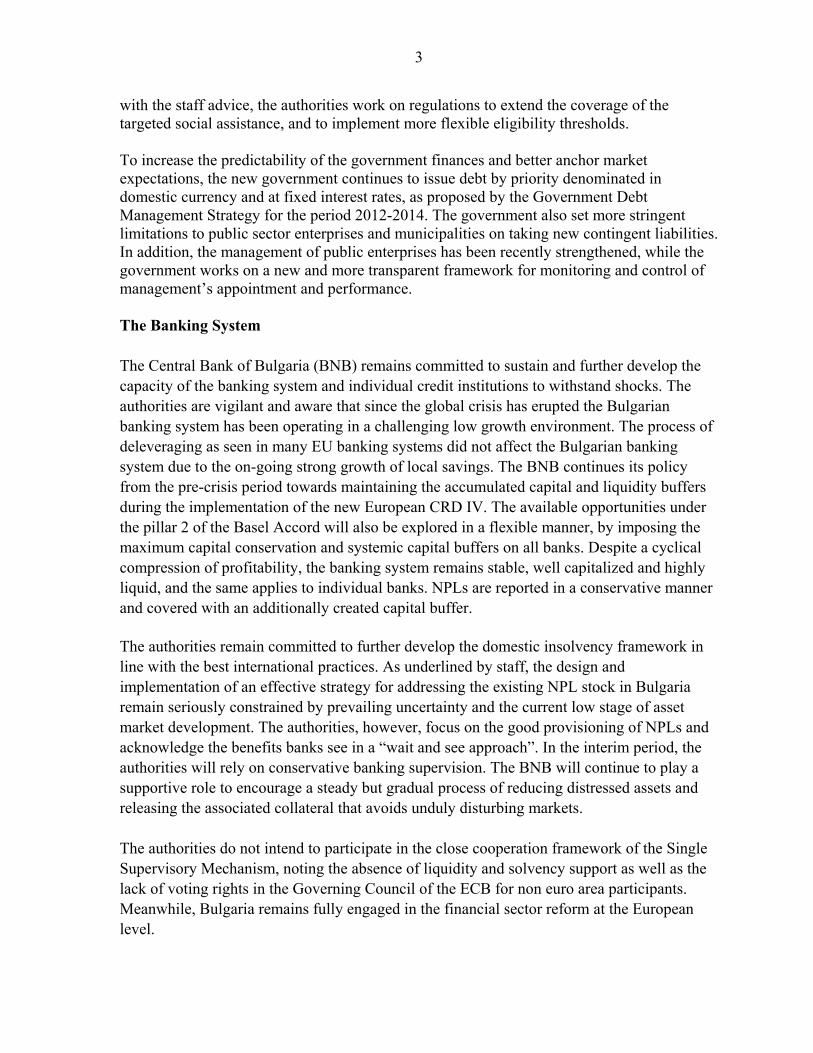
3
with the staff advice, the authorities work on regulations to extend the coverage of the targeted social assistance, and to implement more flexible eligibility thresholds. To increase the predictability of the government finances and better anchor market expectations, the new government continues to issue debt by priority denominated in domestic currency and at fixed interest rates, as proposed by the Government Debt Management Strategy for the period 2012-2014. The government also set more stringent limitations to public sector enterprises and municipalities on taking new contingent liabilities. In addition, the management of public enterprises has been recently strengthened, while the government works on a new and more transparent framework for monitoring and control of management’s appointment and performance. The Banking System The Central Bank of Bulgaria (BNB) remains committed to sustain and further develop the capacity of the banking system and individual credit institutions to withstand shocks. The authorities are vigilant and aware that since the global crisis has erupted the Bulgarian banking system has been operating in a challenging low growth environment. The process of deleveraging as seen in many EU banking systems did not affect the Bulgarian banking system due to the on-going strong growth of local savings. The BNB continues its policy from the pre-crisis period towards maintaining the accumulated capital and liquidity buffers during the implementation of the new European CRD IV. The available opportunities under the pillar 2 of the Basel Accord will also be explored in a flexible manner, by imposing the maximum capital conservation and systemic capital buffers on all banks. Despite a cyclical compression of profitability, the banking system remains stable, well capitalized and highly liquid, and the same applies to individual banks. NPLs are reported in a conservative manner and covered with an additionally created capital buffer. The authorities remain committed to further develop the domestic insolvency framework in line with the best international practices. As underlined by staff, the design and implementation of an effective strategy for addressing the existing NPL stock in Bulgaria remain seriously constrained by prevailing uncertainty and the current low stage of asset market development. The authorities, however, focus on the good provisioning of NPLs and acknowledge the benefits banks see in a “wait and see approach”. In the interim period, the authorities will rely on conservative banking supervision. The BNB will continue to play a supportive role to encourage a steady but gradual process of reducing distressed assets and releasing the associated collateral that avoids unduly disturbing markets. The authorities do not intend to participate in the close cooperation framework of the Single Supervisory Mechanism, noting the absence of liquidity and solvency support as well as the lack of voting rights in the Governing Council of the ECB for non euro area participants. Meanwhile, Bulgaria remains fully engaged in the financial sector reform at the European level.

4
Structural Reforms The authorities remain committed to structural reforms. In compliance with the recommendations from the European Commission and the IMF to strengthen education and narrow skills mismatches, a new National Strategy for Lifelong Education has been adopted at the beginning of 2014. The implementation of pension reforms has been postponed for one year given the widespread discontent among the population about the perceived unfairness of the existing package, but has not been reversed. The authorities have enhanced cooperation with the interested stakeholders to reach an agreement in 2014 on the augmented package to overturn the long-run deficit in the pension system.