Embed Size (px)
Citation preview
BULETINUL INSTITUTULUI POLITEHNIC DIN IAŞI Tomul LX (LXIV)
Fasc. 1-4 TEXTILE. PIELĂRIE 2014 Editura POLITEHNIUM

BULETINUL INSTITUTULUI POLITEHNIC DIN IAŞI PUBLISHED BY
“GHEORGHE ASACHI” TECHNICAL UNIVERSITY OF IAŞI Editorial Office: Bd. D. Mangeron 63, 700050, Iaşi, ROMÂNIA
Tel. 40-232-278683; Fax: 40-232-237666; e-mail: [email protected]
Editorial Board
President: Prof. dr. eng. Ion Giurma, Member of the Academy of Agricultural Sciences and Forest, Rector of the “Gheorghe Asachi” Technical University of Iaşi
Editor-in-Chief: Prof. dr. eng. Carmen Teodosiu, Vice-Rector of the “Gheorghe Asachi” Technical University of Iaşi
Honorary Editors of the Bulletin: Prof. dr. eng. Alfred Braier, Prof. dr. eng. Hugo Rosman,
Prof. dr. eng. Mihail Voicu, Corresponding Member of the Romanian Academy
Editor in Chief of the TEXTILES. LEATHERSHIP Section Prof. dr. eng. Aurelia Grigoriu
Honorary Editors: Prof. dr. eng. Mihai Ciocoiu, Prof. dr. eng. Costache Rusu
Associated Editor: Lecturer dr. eng. LuminiŃa Ciobanu
Editorial Advisory Board
Prof.dr.eng. Mario de Araujo, University of Minho, Portugal
Prof.dr.eng. Vladan Koncar, National Highschool of Arts and Textile Industries of Roubaix, France
Prof.dr.eng. Silvia Avasilcăi, “Gheorghe Asachi” Technical University of Iaşi
Assoc.prof.dr.eng. Maria Carmen Loghin, “Gheorghe Asachi” Technical University of Iaşi
Prof.dr.eng. Pascal Bruniaux, National Highschool of Arts and Textile
Industries of Roubaix, France
Assoc.prof.dr.eng. Stelian-Sergiu Maier, “Gheorghe Asachi” Technical University
of Iaşi Prof.dr.eng. Ioan Cioară, “Gheorghe Asachi”
Technical University of Iaşi Prof.dr.eng. Jiri Militky, Technical University of Liberec, Chzeck Republik
Prof.dr.eng. M. Cetin Erdogan, EGE University of Izmir, Turkey
Prof.dr.eng. Augustin Mureşan, “Gheorghe Asachi” Technical University of Iaşi
Prof.dr.eng. Ana Marija Grancaric, University of Zagreb, CroaŃia
Prof.dr.eng. Crişan Popescu, DWI an der RTWH, Aachen University, Germany
Assoc.prof.dr.eng. Florentina Harnagea, “Gheorghe Asachi” Technical University of Iaşi
Dr.eng. Emilia Visileanu, CPI, INCDTP Bucureşti
Prof.dr.eng. Lubos Hes, Technical University of Liberec, Chzeck Republik
Assoc.prof.dr.eng. Mariana Ursache, “Gheorghe Asachi” Technical University of Iaşi
Prof.dr.eng. Huseyin Kadoglu, EGE University of Izmir, Turkey
Prof.dr.eng. Charles Yang, University of Georgia, Atlanta, USA
Prof.dr.eng. Paul Kiekens, University of Gent, Belgium

BULETINUL INSTITUTULUI POLITEHNIC DIN IAŞI BULLETIN OF THE POLYTECHNIC INSTITUTE OF IAŞI Tomul LX (LXIV), Fasc. 1-4 2014
TEXTILE. PIELĂRIE
Pag.
CRINA BUHAI, LUMINIłA VLAD şi COSTEA BUDULAN, ProprietăŃi de confort ale tricoturilor spacer funcŃionale (engl., rez. rom.) . . . . . . . . .
9
MANUELA AVĂDANEI, CARMEN LOGHIN şi IONUł DULGHERIU, Proiectarea 3D a produselor cu destinaŃii speciale (engl., rez. rom.) . . . .
19
RAMONA BOT-BUDEANU, ANTONELA CURTEZA, PRAMOD AGRAWAL şi GER BRINKS, Proces de vopsire ecologică a materialelor din cânepă cu colorantul Cochineal (engl., rez. rom.) . . . . . . . . . . . . . . . . .
31
OVIDIU CONSTANDACHE, ANGELA CEREMPEI şi RODICA MUREŞAN, Aspecte privind îmbunătăŃirea capacităŃii tinctoriale a fibrelor din PET virgin şi reciclat (engl., rez. rom.) . . . . . . . . . . . . . . . . . . . . . . . . . . . . . . .
39
MARIANA COSTEA şi AURA MIHAI, Metodă inovativă de modelare a calapoadelor pentru încălŃăminte (engl., rez. rom.) . . . . . . . . . . . . . . . .
47
DORIN DAN, Metoda de reprezentare a structurilor din tricot folosind calculatorul personal (engl., rez. rom.) . . . . . . . . . . . . . . . . . . . . . . . . . . .
55
EMILIA FILIPESCU, CLAUDIA NICULESCU, SABINA OLARU, ADRIAN SALISTEAN şi ELENA SPINACHI, Cercetări privind dinamica dimensiunilor antropometrice caracterizând populaŃia infantilă din România (engl., rez. rom.) . . . . . . . . . . . . . . . . . . . . . . . . . .
63
M. NAZRUL ISLAM, M. SHARIF UDDIN şi AMINUR R. KHAN, DisfuncŃionalităŃi ale metodelor PERT/CPM: O abordare matematică şi numerică (engl., rez. rom.) . . . . . . . . . . . . . . . . . . . . . . . . . . . . . . . . .
71
GHEORGHE CHIRIłĂ . . . . . . . . . . . . . . . . . . . . . . . . . . . . . . . . . . . . . . . . . . . . . 83
S U M A R

BULETINUL INSTITUTULUI POLITEHNIC DIN IAŞI BULLETIN OF THE POLYTECHNIC INSTITUTE OF IAŞI Tomul LX (LXIV), Fasc. 1-4 2014
TEXTILES. LEATHERSHIP
Pp.
CRINA BUHAI, LUMINIłA VLAD and COSTEA BUDULAN, Comfort Properties of Functional Spacer Fabrics (English, Romanian summary) . . . . . . . . . . . . . . . . . . . . . . . . . . . . . . . . . . . . . . . . . . . . . . . . .
9
MANUELA AVĂDANEI, CARMEN LOGHIN and IONUł DULGHERIU, 3D Pattern Design of Products with Special Destination (English, Romanian summary) . . . . . . . . . . . . . . . . . . . . . . . . . . . . . . . . . . . . . . . .
19
RAMONA BOT-BUDEANU, ANTONELA CURTEZA, PRAMOD AGRAWAL and GER BRINKS, Eco-Friendly Dyeing with Cochineal Dye on Hemp Fabrics (English, Romanian summary) . . . . . . . . . . . . . . . . . . .
31
OVIDIU CONSTANDACHE, ANGELA CEREMPEI and RODICA MUREŞAN, Aspects Regarding the Tinctorial Behaviour of Fibers Derived from Virgin and Recycled PET (English, Romanian summary) . . . . . . . . . . . . . . . . . . . . . . . . . . . . . . . . . . . . . . . . . . . . . . . .
39
MARIANA COSTEA and AURA MIHAI, Innovative Method of Modelling Shoe Lasts (English, Romanian summary) . . . . . . . . . . . . . . . . . . . . . . .
47
DORIN DAN, Representation Method for the Knitted Structures Using a Personal Computer (English, Romanian summary) . . . . . . . . . . . . . .
55
EMILIA FILIPESCU, CLAUDIA NICULESCU, SABINA OLARU, ADRIAN SALISTEAN and ELENA SPINACHI, Research on the Evolving Nature of Anthropometric Sizes Characterizing Romanian Children Population (English, Romanian summary) . . . . . . . . . . . . . . . . . . . . . . .
63
M. NAZRUL ISLAM, M. SHARIF UDDIN and AMINUR R. KHAN, Crashing PERT/CPM Network: A Mathematical and Numerical Approach (English, Romanian summary) . . . . . . . . . . . . . . . . . . . . . . .
71
GHEORGHE CHIRIłĂ . . . . . . . . . . . . . . . . . . . . . . . . . . . . . . . . . . . . . . . . . . . . . 83
C O N T E N T S

BULETINUL INSTITUTULUI POLITEHNIC DIN IAŞI Publicat de
Universitatea Tehnică „Gheorghe Asachi” din Iaşi Tomul LX (LXIV), Fasc. 1-4, 2014
SecŃia TEXTILE. PIELĂRIE
COMFORT PROPERTIES OF FUNCTIONAL SPACER FABRICS
BY
CRINA BUHAI∗∗∗∗, LUMINIłA VLAD and COSTEA BUDULAN
“Gheorghe Asachi” Technical University of Iaşi, România,
Faculty of Textiles & Leather Engineering and Industrial Management
Received: March 5, 2014 Accepted for publication: June 10, 2014
Abstract. This paper presents a study regarding the physical and
mechanical properties of functional weft knitted spacer fabrics. The studied spacer fabrics consist of two layers that are connected and in the same time kept apart by a knitted layer. The knitted fabrics were obtained using Stoll CMS 530 E 6.2 computer controlled flat knitting machine. The knitted structures and the raw materials were chosen in order to accomplish the superior comfort properties, fact that makes these fabrics suitable for functional clothing. For this purpose, micro-denier yarns, polyester with nano-silver particles and soy protein yarns in different layer arrangement were used to obtain the desired properties.
Many researchers have carried out different studies regarding the comfort properties of textile fabrics; they assert that the comfort properties represent the balance between human body and environment. Moisture management is a leading factor in the assessment of the comfort properties of functional textile.
Three layer knitted fabrics were analysed by other researchers, they use the cotton yarn for the outside layer, superfine or special shaped section filament for the interior layer and Lycra for the middle layer. This knitted fabric proved to have very good thermal wet comfort property.
Keywords: comfort; micro-denier; moisture management; knitted layers.
∗ Corresponding author; e-mail: [email protected]
This paper is the full version of the paper published in abstract at the Textiles of the Future ISKA, Iaşi, June, 2013
10 Crina Buhai et al.
1. Introduction The spacer fabrics consist of two layers that are connected and in the
same time kept apart by a spacer yarn or layer. Spacer knits allow manufacturers to achieve two completely different
structures that have different properties, but they are connected by a spacer yarn to form a single structure. This gives users a great opportunity to change the weight, aesthetic properties, and the fabrics cost to meet consumer demands (Penciuc et al., 2010).
Another important factor that makes these fabrics suitable for clothing is their high porosity and extensibility.
Porosity is a defining factor for the comfort properties of this fabrics, because the amount of air entrapped in the fabrics gives good thermal insulation properties and in the same time allows the perspiration transport trough the fabric.
Many researchers have carried out different studies regarding the comfort properties of textile fabrics; they assert that the comfort properties represent the balance between human body and environment (Nawaz et al., 2011). Moisture management is a leading factor in the assessment of the comfort properties of functional textiles (Bagherzadeh et al., 2012).
Regarding the fields of application of weft knitted fabrics, some researches were made for spacer fabrics specially designed for sports clothing. Bivainyt÷ and Mikučionien÷ (2011) analyzed the air and water vapour permeability of double layered knitted fabrics designed for leisure sports. They used cotton and bamboo for the outer layer and synthetic yarns (polyamide, polyester, polypropylene and Coolmax) for the layer that comes in direct contact with the body (Wilbik-Hałgas et al., 2006). The layer that comes in contact with the skin must be made of highly conductive and diffusive material, to ensure the quick transport of perspiration away from the skin, and the outer layer must be sorptive, to keep moisture away from the body (Wilbik-Hałgas et al., 2006).
A new type of layered knits was developed by the company Eschler AG designed for sports apparel. This structure consists of three layers: the first layer serves to absorb perspiration, the second layer is meant to insulate ensuring the thermal equilibrium of the body, and the third layer is intended to protect against the rain and wind (Hunter, 2012).
Three layer knitted fabrics were analyzed by other researchers, they user the cotton yarn for the outside layer, superfine or special-shaped section filament for the interior layer and Lycra for the middle layer. This knitted fabric proved to have very good thermal-wet comfort property (Baozhu, 2011).
The paper analysed the comfort properties of some three layered weft knitted spacer fabrics, made of different types of yarns. The fabrics comfort properties were analysed in this paper in terms of two important factors: porosity and thickness.
Bul. Inst. Polit. Iaşi, t. LX (LXIV), f. 1-4, 2014 11
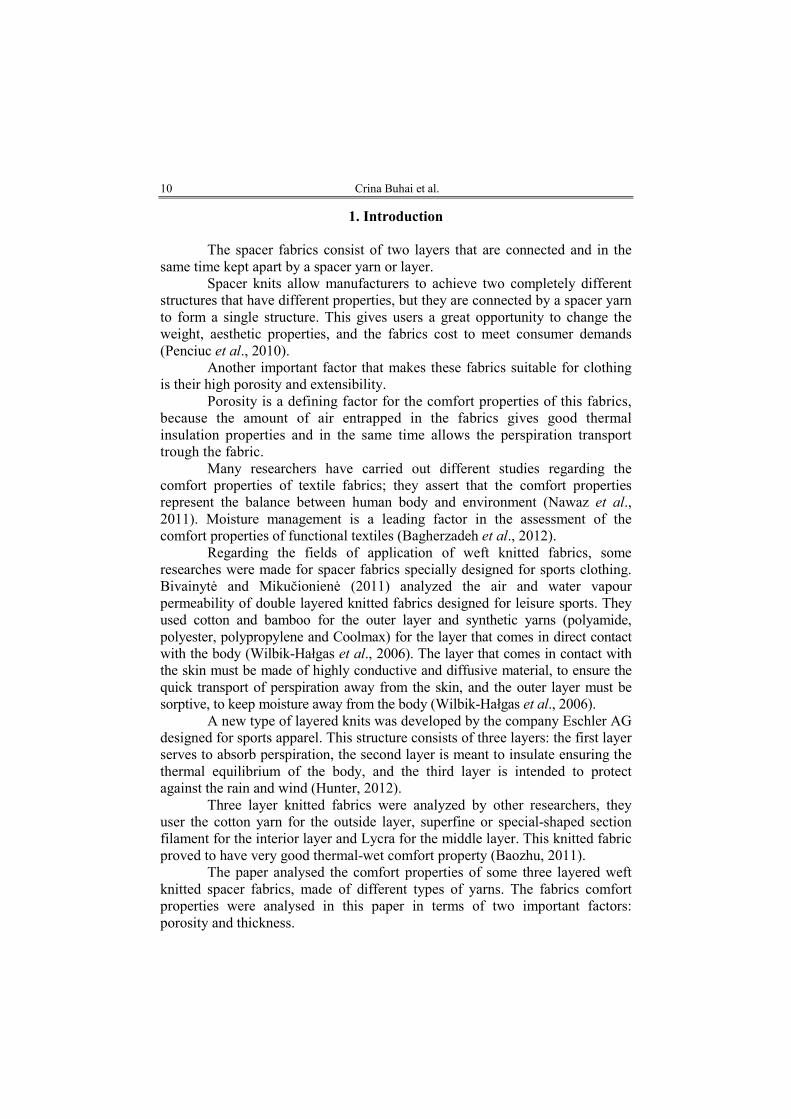
2. Materials and Methods The designed structure is a three layered knitted fabric, obtained by
using Stoll CMS 530 E 6.2 computer controlled flat knitting machine, with constant machine settings. The knitted structures and the raw materials were chosen in order to obtain superior comfort properties, fact that makes these fabrics suitable for functional clothing. For this purpose, micro-denier yarns, polyester with nano-silver particles and soy protein yarns were knitted in different layer arrangement, as illustrated in Fig. 1.
Fig. 1 − Needle diagram for the spacer fabric. The microfiber yarns are very used especially in sports clothing because
they can accumulate a large quantity of air between the fine fibres and transports moisture away from the body. The soy protein yarn and polyester with silver ions were used for the layer that comes in direct contact with the skin, because of their antiallergenic and antimicrobial properties. The yarn characteristics are presented in Table 1.
12 Crina Buhai et al.
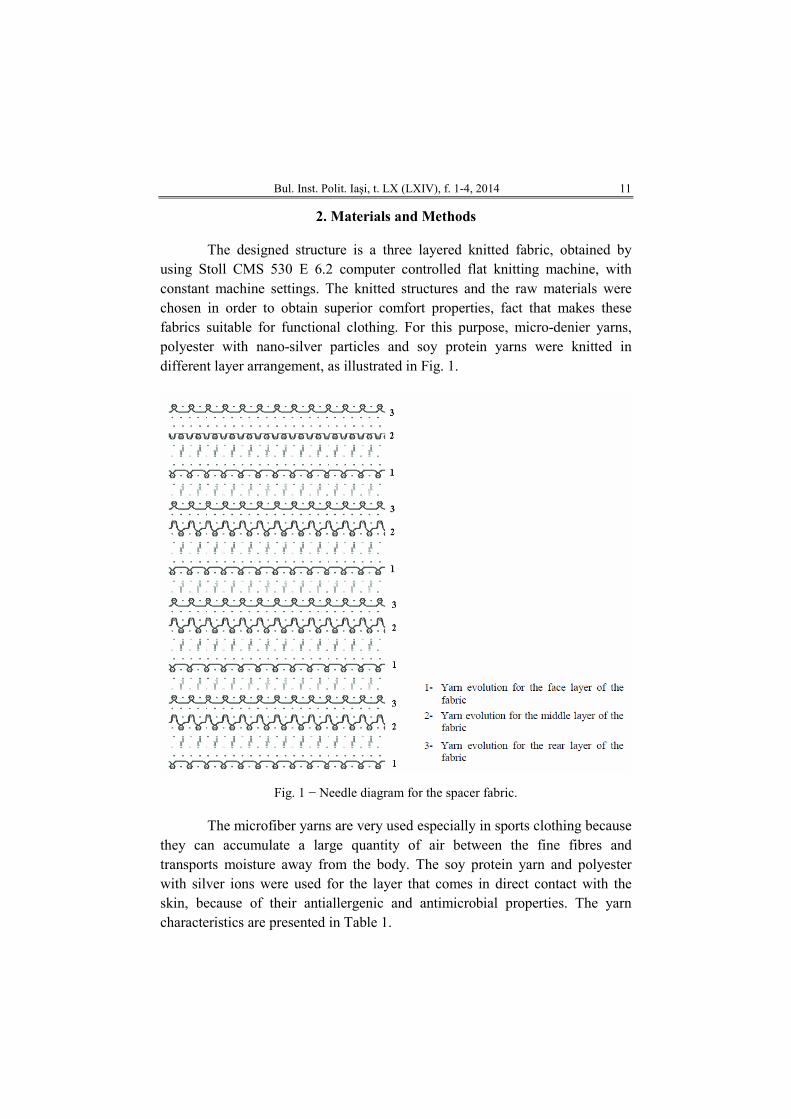
Table 1 Yarn Characteristics
Raw material Yarn count Type of fibres Yarn type
Polyester Nm 30/3 Microfilaments Textured Polyamide Nm 50/3 Microfilaments Textured
Polyester with silver nanoparticles
Nm 40/3 Microfilaments Textured
Polypropylene Nm 16/1 Microfilaments − Soy Nm 56/3 − Twisted
Cotton Nm 40/2 Short fibres Twisted
Table 2 presents the variants of weft knitted spacer fabrics obtained with the
above mentioned layers composition and their arrangement in the knitted structure.
Table 2 Knitted Fabric Variants
Yarn combinations Fabric code Face layer Middle layer Rear layer S1 Polyester Polyester Polyester S2 Polyamide Polyamide Polyamide
S3 Polyester with silver
nanoparticles Polyester with silver
nanoparticles Polyester with silver
nanoparticles
S4 Polyester with silver
nanoparticles Polypropylene Cotton
S5 Polyester with silver
nanoparticles Cotton Polypropylene
S6 Soy protein yarn Soy protein yarn Soy protein yarn S7 Soy protein yarn Polypropylene Cotton S8 Soy protein yarn Cotton Polypropylene
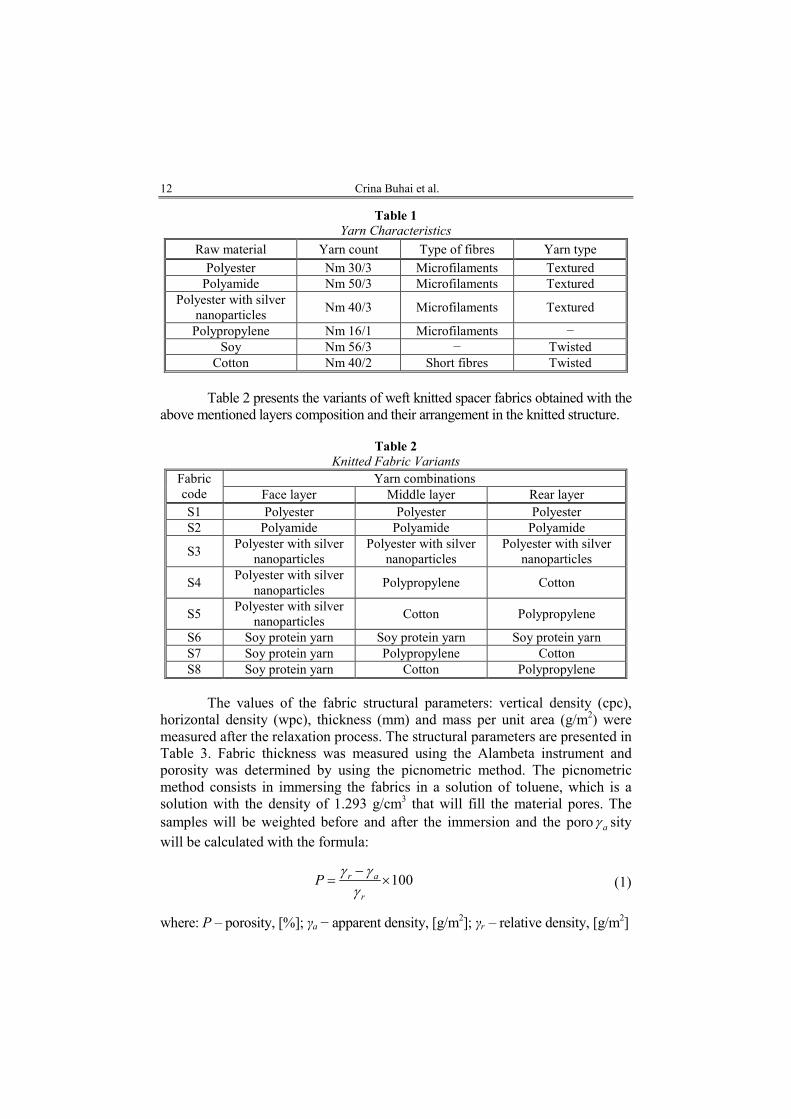
The values of the fabric structural parameters: vertical density (cpc),
horizontal density (wpc), thickness (mm) and mass per unit area (g/m2) were measured after the relaxation process. The structural parameters are presented in Table 3. Fabric thickness was measured using the Alambeta instrument and porosity was determined by using the picnometric method. The picnometric method consists in immersing the fabrics in a solution of toluene, which is a solution with the density of 1.293 g/cm3 that will fill the material pores. The samples will be weighted before and after the immersion and the poro aγ sity will be calculated with the formula:
100r a
r
P−
= ×γ γ
γ (1)
where: P – porosity, [%]; γa − apparent density, [g/m2]; γr – relative density, [g/m2]
Bul. Inst. Polit. Iaşi, t. LX (LXIV), f. 1-4, 2014 13
Table 3 Structural Parameters of the Spacer Fabrics
Fabric density Fabric code wpc cpc
Fabric mass [g/m2]
Thickness [mm]
Porosity [%]
S1 25 48 434 2.47 91.25 S2 26 50 335 2.79 90.46 S3 23 50 305 2.69 91.76 S4 19 48 481 3.99 90.41 S5 21 43 418 3.75 91.22 S6 19 48 582 3.5 89.07 S7 19 55 669 4.34 88.22 S8 20 45 611 3.9 87.46
The fabrics thermal properties were measured by using the Alambeta
instrument, water vapour permeability was determined with Permetest and air permeability with Textest FX 3300. All measurements were repeated 10 times.
3. Results and Discussions
Table 4 shows the average values of four important parameters for the
thermal comfort properties: thermal conductivity, thermal diffusion, thermal absorption and thermal resistance.
Table 4
Thermal Comfort Properties of the Spacer Fabrics
Fabric code
Thermal conductivity
[Wm-1k-1x10⁻³]
Thermal diffusion
[m2s-1x10⁻⁶]
Thermal absorption
[Wm-2s1/2k-1]
Thermal resistance
[Km2w-1x10⁻³] S1 45.340 0.296 80.440 61.180 S2 49.240 0.216 106.100 56.700 S3 45.520 0.286 81.350 58.350 S4 51.790 0.255 92.130 77.220 S5 46.420 0.287 83.180 64.230 S6 47.552 0.244 116.211 68.300 S7 49.430 0.242 113.900 76.720 S8 56.000 0.250 104.220 72.000
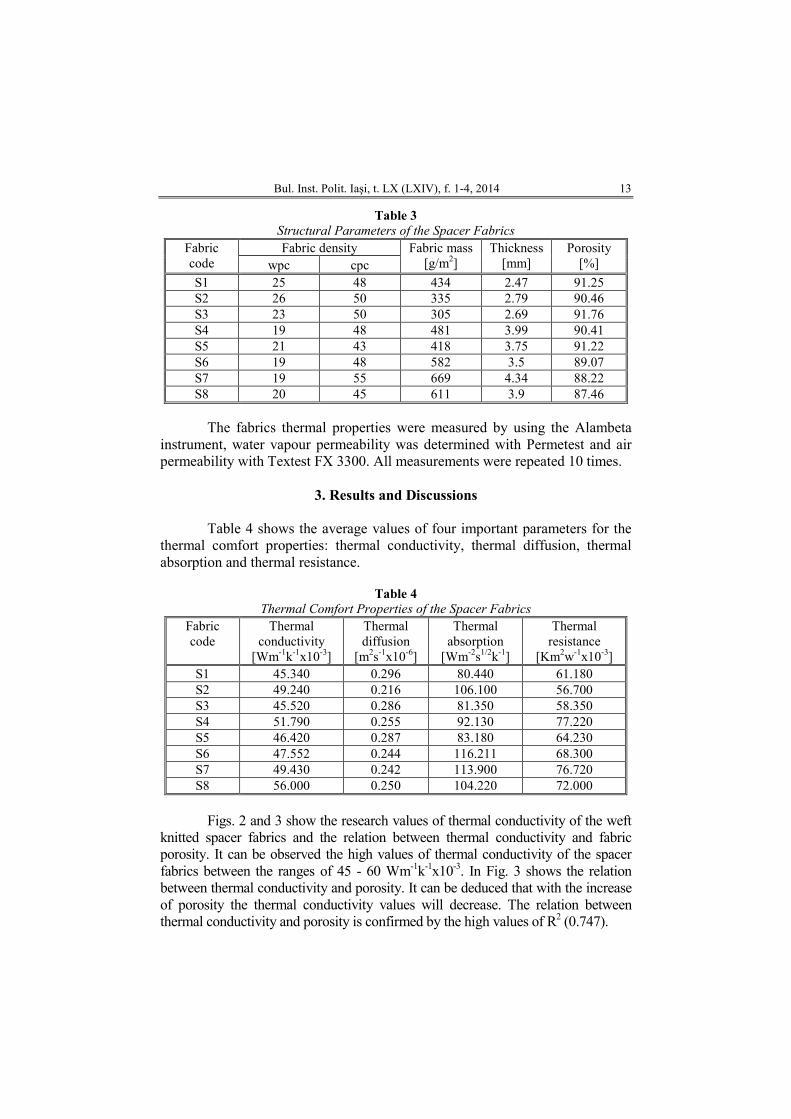
Figs. 2 and 3 show the research values of thermal conductivity of the weft
knitted spacer fabrics and the relation between thermal conductivity and fabric porosity. It can be observed the high values of thermal conductivity of the spacer fabrics between the ranges of 45 - 60 Wm-1k-1x10⁻³. In Fig. 3 shows the relation between thermal conductivity and porosity. It can be deduced that with the increase of porosity the thermal conductivity values will decrease. The relation between thermal conductivity and porosity is confirmed by the high values of R2 (0.747).
14 Crina Buhai et al.
Fig. 2 − The correlation of thermal conductivity with the sample codes of the weft knitted spacer fabrics.
Fig. 3 − Thermal conductivity as a function of porosity.
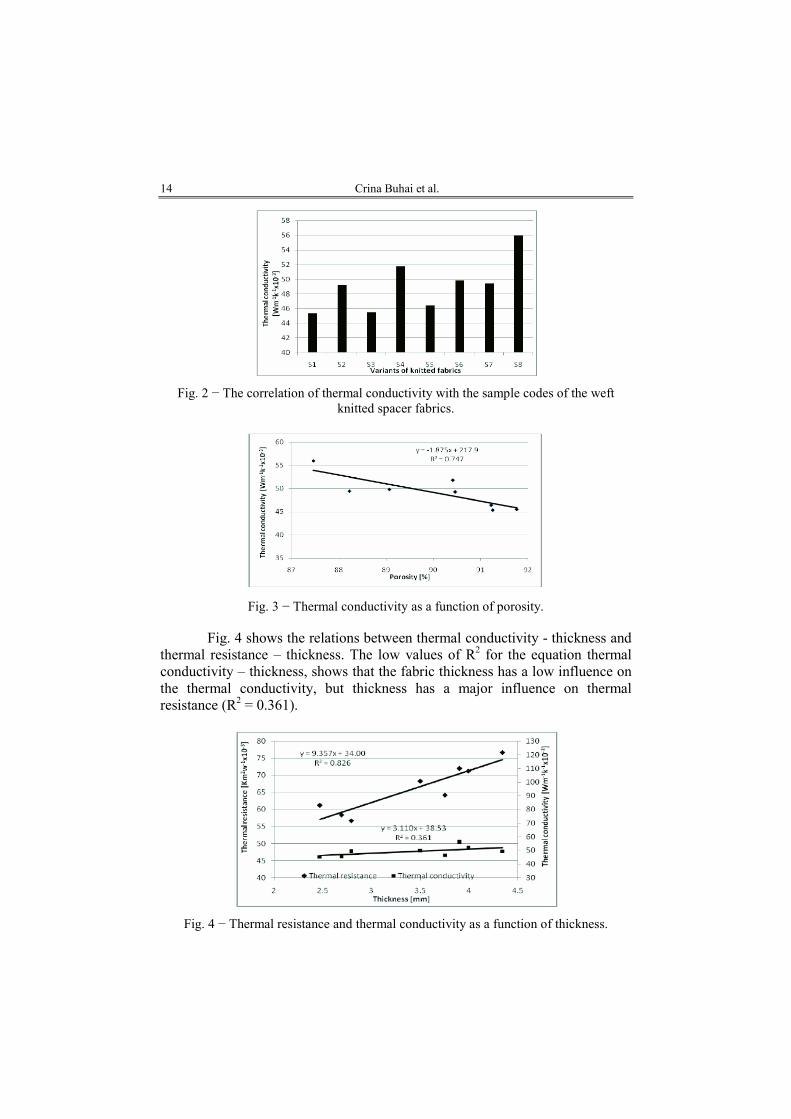
Fig. 4 shows the relations between thermal conductivity - thickness and thermal resistance – thickness. The low values of R2 for the equation thermal conductivity – thickness, shows that the fabric thickness has a low influence on the thermal conductivity, but thickness has a major influence on thermal resistance (R2 = 0.361).
Fig. 4 − Thermal resistance and thermal conductivity as a function of thickness.
Bul. Inst. Polit. Iaşi, t. LX (LXIV), f. 1-4, 2014 15
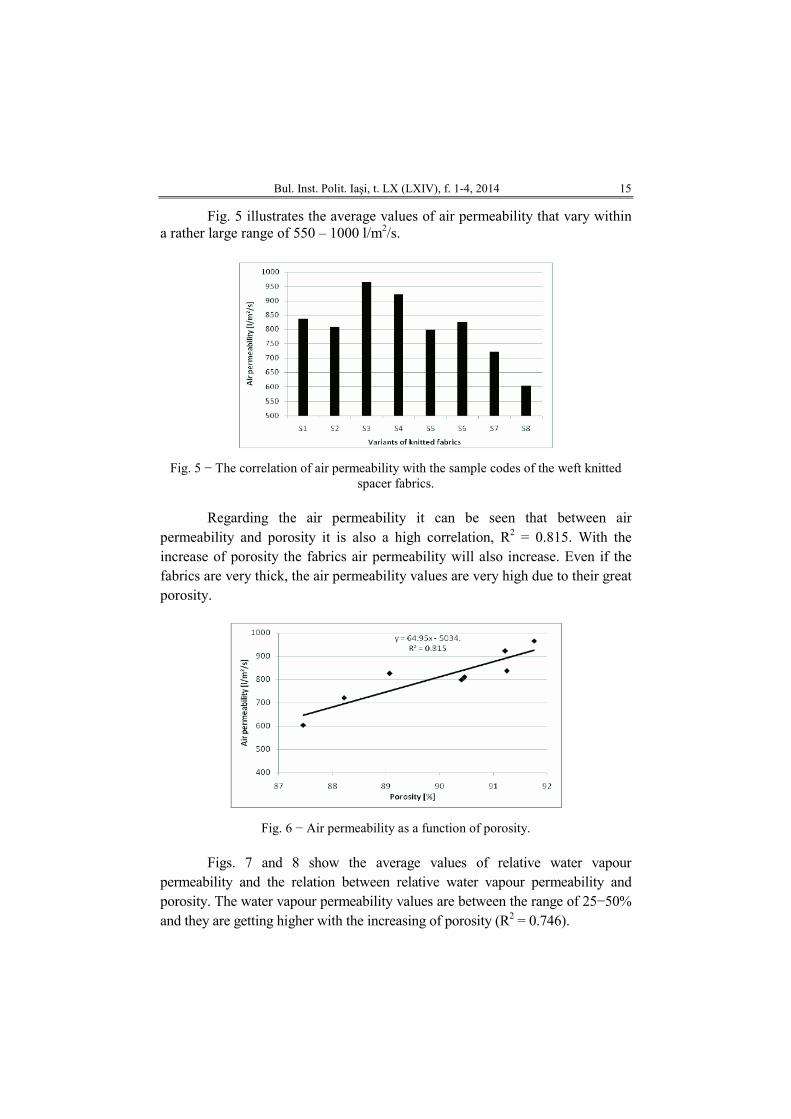
Fig. 5 illustrates the average values of air permeability that vary within a rather large range of 550 – 1000 l/m2/s.
Fig. 5 − The correlation of air permeability with the sample codes of the weft knitted spacer fabrics.
Regarding the air permeability it can be seen that between air
permeability and porosity it is also a high correlation, R2 = 0.815. With the increase of porosity the fabrics air permeability will also increase. Even if the fabrics are very thick, the air permeability values are very high due to their great porosity.
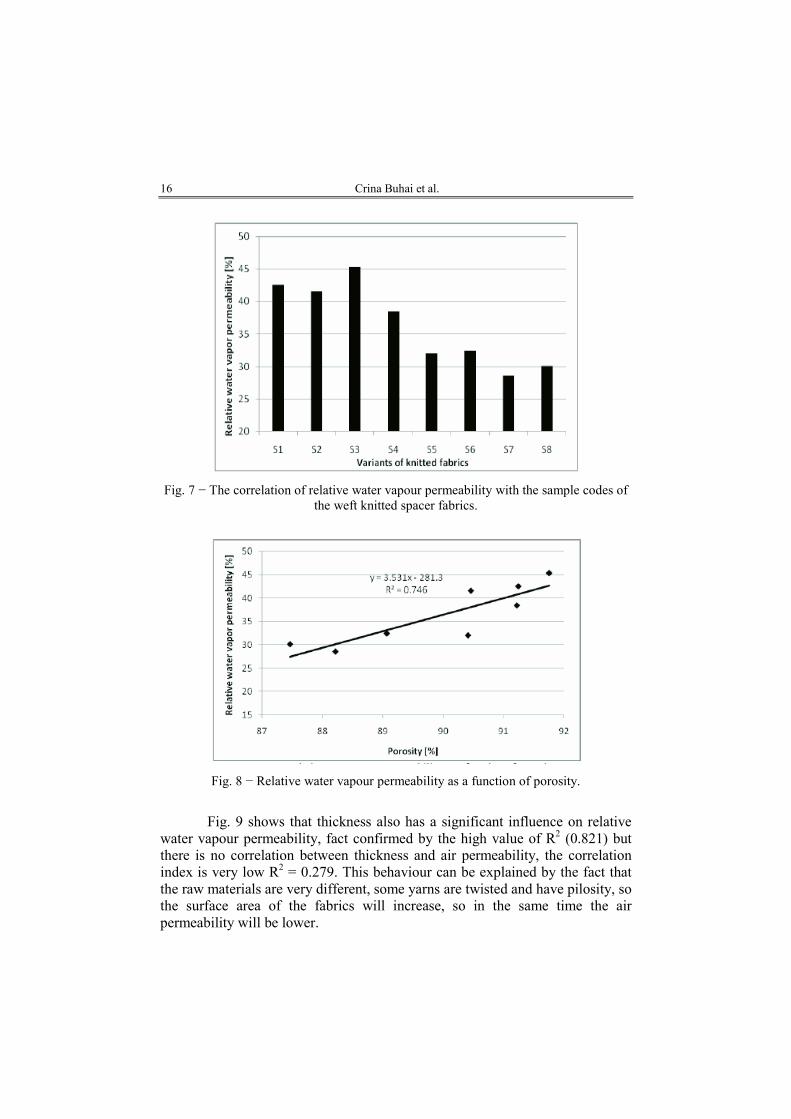
Fig. 6 − Air permeability as a function of porosity. Figs. 7 and 8 show the average values of relative water vapour
permeability and the relation between relative water vapour permeability and porosity. The water vapour permeability values are between the range of 25−50% and they are getting higher with the increasing of porosity (R2 = 0.746).
16 Crina Buhai et al.
Fig. 7 − The correlation of relative water vapour permeability with the sample codes of the weft knitted spacer fabrics.
Fig. 8 − Relative water vapour permeability as a function of porosity.
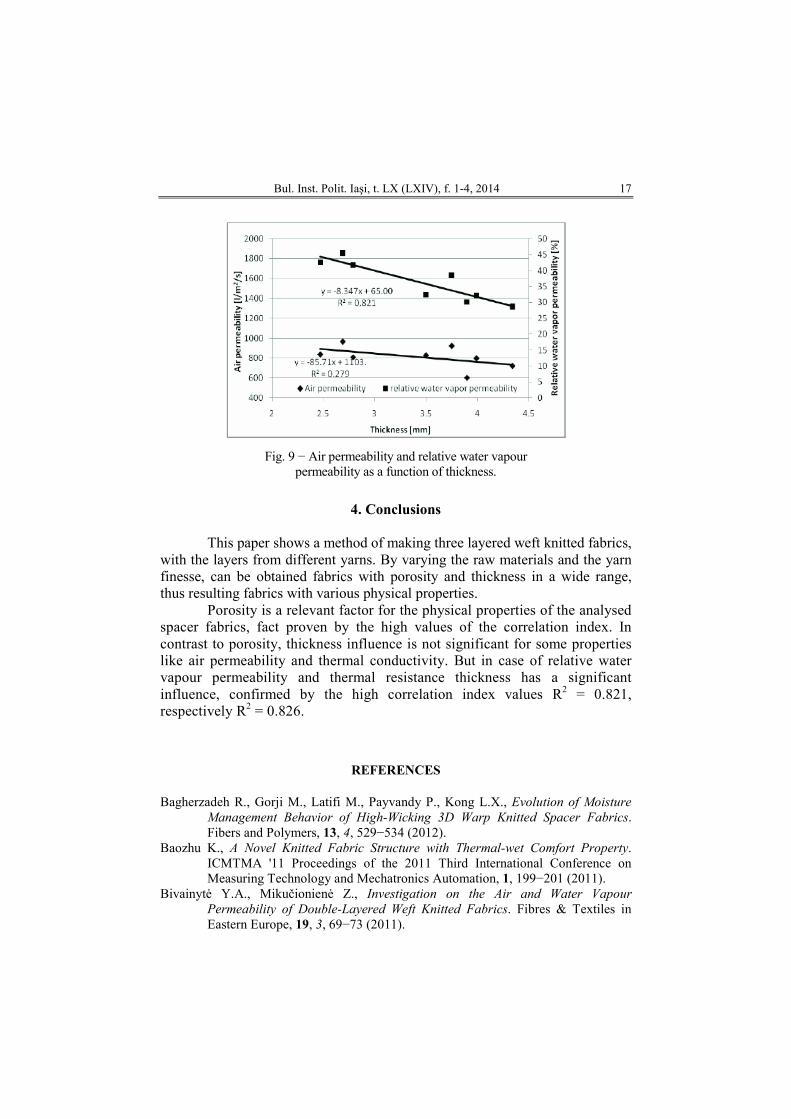
Fig. 9 shows that thickness also has a significant influence on relative
water vapour permeability, fact confirmed by the high value of R2 (0.821) but there is no correlation between thickness and air permeability, the correlation index is very low R2 = 0.279. This behaviour can be explained by the fact that the raw materials are very different, some yarns are twisted and have pilosity, so the surface area of the fabrics will increase, so in the same time the air permeability will be lower.
Bul. Inst. Polit. Iaşi, t. LX (LXIV), f. 1-4, 2014 17
Fig. 9 − Air permeability and relative water vapour permeability as a function of thickness.
4. Conclusions
This paper shows a method of making three layered weft knitted fabrics,
with the layers from different yarns. By varying the raw materials and the yarn finesse, can be obtained fabrics with porosity and thickness in a wide range, thus resulting fabrics with various physical properties.
Porosity is a relevant factor for the physical properties of the analysed spacer fabrics, fact proven by the high values of the correlation index. In contrast to porosity, thickness influence is not significant for some properties like air permeability and thermal conductivity. But in case of relative water vapour permeability and thermal resistance thickness has a significant influence, confirmed by the high correlation index values R2 = 0.821, respectively R2 = 0.826.
REFERENCES
Bagherzadeh R., Gorji M., Latifi M., Payvandy P., Kong L.X., Evolution of Moisture
Management Behavior of High-Wicking 3D Warp Knitted Spacer Fabrics. Fibers and Polymers, 13, 4, 529−534 (2012).
Baozhu K., A Novel Knitted Fabric Structure with Thermal-wet Comfort Property. ICMTMA '11 Proceedings of the 2011 Third International Conference on Measuring Technology and Mechatronics Automation, 1, 199−201 (2011).
Bivainyt÷ Y.A., Mikučionien÷ Z., Investigation on the Air and Water Vapour
Permeability of Double-Layered Weft Knitted Fabrics. Fibres & Textiles in Eastern Europe, 19, 3, 69−73 (2011).
18 Crina Buhai et al.
Hunter B., New 3D Spacer Knits from Eschler. Available from http://www.knittingindustry.com/new-3d-spacerknits-from-eschler/, Accessed: 16-02-2012.
Nawaz N., Troynikov O., Watson C., Thermal Comfort Properties of Knitted Fabrics
Suitable for Skin Layer of Protective Clothing Worn in Extreme Hot
Conditions. Advanced Materials Research, 331, 184−189 (2011). Penciuc M., Blaga M., Radu C.D., Manufacturing of 3D Complex Knitted Shapes. 45th
International Congress IFKT, Ljubljana, Slovenia, 1000−1005 (2010). Wilbik-Hałgas Z., Danych B., Więcek R., Kowalski K.B., Air and Water Vapour
Permeability in Double Layered Knitted Fabrics with Different Raw Materials. Fibres & Textiles in Eastern Europe, 14, 3 (57), 77−80 (2006).
PROPRIETĂłI DE CONFORT ALE TRICOTURILOR SPACER FUNCłIONALE
(Rezumat)
Lucrarea prezintă un studiu referitor la proprietăŃile fizice şi mecanice ale
tricoturilor din bătătură de tip spacer. Tricoturile studiate sunt alcătuite din două straturi legate între ele printr-un strat tricotat care le menŃine la distanŃă. Tricoturile au fost obŃinute pe o maşină rectilinie electronică Stoll CMS 530 E 6.2. Structura şi materia primă au fost alese astfel încât să asigure proprietăŃi de confort superioare, corespunzătoare aplicaŃiei de îmbrăcăminte funcŃională. În acest scop s-au folosit fire din microfibre, poliester cu nano-particule de argint şi din fibre de soia, dispunerea în straturi făcându-se astfel încât să asigure proprietăŃile de confort urmărite.
ProprietăŃile de confort ale materialelor textile au fost studiate de numeroşi cercetători; ei subliniază că aceste caracteristici reprezintă un echilibru între corpul uman şi mediul înconjurător. Transportul de umiditate este esenŃial în evaluarea proprietăŃilor de confort a textilelor funcŃionale.
Studii anterioare au avut în vedere tricoturi în triplu strat, realizate din fire de bumbac (strat exterior), fire filamentare de fineŃe ridicată sau cu secŃiune transversală specială (strat interior) şi fire Lycra pentru stratul de mijloc. Aceste tricoturi s-au dovedit a avea proprietăŃi de confort foarte bune în stare umedă.
BULETINUL INSTITUTULUI POLITEHNIC DIN IAŞI Publicat de
Universitatea Tehnică „Gheorghe Asachi” din Iaşi Tomul LX (LXIV), Fasc. 1-4, 2014
SecŃia TEXTILE. PIELĂRIE
3D PATTERN DESIGN OF PRODUCTS WITH SPECIAL DESTINATION
BY
MANUELA AVĂDANEI∗∗∗∗, CARMEN LOGHIN and IONUł DULGHERIU
“Gheorghe Asachi” Technical University of Iaşi, România,
Faculty of Textiles & Leather Engineering and Industrial Management
Received: June 25, 2014 Accepted for publication: September 18, 2014
Abstract. Thermal protection in underwater environment is very important
for health and personal security. Nowadays there are many persons who either work in this environment or are doing pleasure sports (swimming, scuba-diving, free-diving, and surfing, ski jet, etc.). In this case, it is necessary to wear a special suit, designed as a “second skin” and made from special materials which must ensure comfort, protection and freedom. This paper presents a solution to design a wet suit pattern using an advanced module of pattern making (MTM module from Gemini CAD System) and how is verifying its fit on the body in a 3D virtual environment (Autodesk 3ds Max).
Keywords: wet suit; patterns; MTM module; virtual environment.
1. Introduction
The emergences of new types of raw materials, with the natural ones,
have an important role in the development of textile industry. The focus is on increasing the production of natural fibres and also on developing new types of materials with new properties, used in special products designed to provide
∗Corresponding author; e-mail: [email protected]
This paper is the full version of the paper published in abstract at the Textiles of the Future ISKA, Iaşi, June, 2013
20 Manuela Avădanei et al.
health, comfort properties, and body protection against environment factors. Diversification of occupations has determined the appearance of new
types of products, designed to meet the complex requirements of consumers and complete satisfaction degree.
Playing sports in extreme temperature conditions became a way of life for many people in the world. That kind of sports offer a good health condition, psychological comfort and from these reasons, in the manufacturing process there must be considered the following factors, such as:
− Knowledge of the type of risk factors, environmental conditions and garment requests during wear;
− The correct requirements that consumers require clothing products; − Establishing and highlighting the garment function in order to
determine the relationship between requirements and product characteristics of clothing.
Scuba diving is a sport enjoyed by people around the world. They make diving trips from the Bahamas to the shores of Alaska or Australia, mountains, lakes and even rivers. The difference is made by the equipment. Divers need passion to explore different diving sites, an aspect which makes this sport unique. The suits for this sport are usually made from neoprene or polychloroprene which is a family of synthetic rubbers, produced by Du Pont Company from 1930 (DuPont, 2003, http://msds.dupont.com/msds/pdfs/ EN/PEN_09004a35803d9eb8.pdf, http://www.saferubber.eu).
Neoprene exhibits good chemical stability, and maintains flexibility over a wide temperature range. It is used in a wide variety of applications, such as laptop sleeves, orthopaedic braces (wrist, knee, etc.), electrical insulation, liquid and sheet applied elastomeric membranes or flashings, sports suits and automotive fan belts. Neoprene provides excellent insulation against low temperatures. Neoprene waders are usually about 5 mm thick, and in the medium price range as compared to cheaper materials such as nylon or rubber. However, neoprene is less expensive than breathable fabrics. A foamed neoprene containing gas cells is often used as an insulation material in wetsuits. Foamed neoprene is also used in other insulation and shock-protection (packing) applications (DuPont, 2003; http://msds.dupont.com/msds/pdfs/ EN/PEN_09004a35803d9eb8.pdf; http://www.saferubber.eu).
In its native state, neoprene is a very pliable rubber-like material, which has no better insulating properties than rubber or other solid plastics. For diving and exposure protection applications, neoprene is manufactured by foaming the plastic with nitrogen gas, for the insulation properties of the tiny enclosed and separated gas bubbles (nitrogen is used for chemical convenience, not because it is superior to air as an insulator). The foam cells thus created also make the material quite buoyant, and the diver must compensate for this by wearing weights. Thick wet suits made for the extremely cold water protection are usually made of 7 mm thick neoprene. Since neoprene foam contains gas
Bul. Inst. Polit. Iaşi, t. LX (LXIV), f. 1-4, 2014 21
pockets, the material compresses under water pressure, getting thinner at greater depths; a 7 mm neoprene wet suit offers much less exposure protection under 100 feet of water than at the surface. A recent progress in neoprene technology for wet suits is the “super-flex” variety, which mixes spandex with neoprene for greater flexibility.
As a result, wetsuit neoprene sheets are manufactured in different grades dependent on the application. A neoprene diving suit is denser and less flexible; this ensures its durability and reduces compression at depth.
Sailing wetsuits are never exposed to large compressive forces and contain more gas, so are warmer at the same thickness. Competitive swimming wetsuits are made of the most expanded foam; they have to be very flexible to allow the swimmer‘s unrestricted movement. The disadvantage is that they are quite fragile.
Choosing the proper costume depends on many factors and people's preferences. For example, will it be needed for sinking? What is the water temperature like? What type of sewing do you prefer to have? Do you need a costume zipper front or back?
There are 5 categories of such suits: − Wetsuits - Wet Suits − dry suits - dry suits − semi-dry suits - suits semi wet − Dive Skins - Costumes skin − hot water suits - suits with hot water pumped from the surfaces
through the suit. Besides costumes for hot water, all other types of suits are not used
specifically for diving, but are also used by people who want enhanced thermal protection when practice other water sports such as surfing, sailing, power boating, windsurfing, kite surfing, water skiing, caving and swimming. Ambient pressure suits provide thermal protection when the water is cold or very cold, and some protection against abrasive surfaces, sharp objects and other potential underwater hazards (Nicolaiov et al., 2010; Loghin et al., 2009a; Loghin et al., 2009b; http://msds.dupont.com/msds/pdfs/EN/PEN_09004a35803d9eb8.pdf; http://www.saferubber.eu). This type of suit does not protect divers against pressure or the effects of overexposure to high pressure such as baro-trauma and decompression sickness. The buoyancy excess created by volume is a result of wearing the costume of this type of suit, and for this reason you must wear a seat ballast to offset the positive buoyancy. Some dry suits are fitted with valves to reduce inflation and deflation caused by the increasing or the decreasing pressure of the surrounding environment.
• Wetsuits - Wet Suits Wetsuits are used in waters where temperature is between 10 and 25°C.
Neoprene insulation heats the wearer who is in water. Also, water enters and forms inside a thin film which heats the body temperature. The water flow from inside out is very low.
22 Manuela Avădanei et al.
• Dry suits - dry suit Dry suits are generally used where the water temperature is between -2
and 15°C. The water is prevented from entering inside the dry suit by sealing the neck and limbs, with a waterproof zipper. The insulated dry suit maintains an air gap between the body and costume (under the suit the person must have clothes which provide thermal insulation).
• Semi-dry suits - semi-dry suits Semi-dry suits are used frequently where the water temperature is
between 10 and 20°C. In essence they are just wet suits, but with better insulation at the limbs and neck to minimize water flow between the interior and the environment and vice versa. Compared with dry suits, the semi-dry ones are easier to use and much cheaper. They are made of Neoprene tablet, which provides good thermal insulation, with the increasing depth because gas bubbles are compressed by neoprene pressure.
• Dive Skins - Skin or Shorty suits This type of costume is used where the water temperature exceeds
25°C. It is made of Spandex and does not provide thermal protection, but protects the wearer's body against strings, abrasive surfaces and direct sunlight. This type of suit is also called Shorty.
• Hot water suits Hot water suits are used in commercial diving when the diver has
support from the surface. The suit is attached to a hose which supplies the diver's umbilical with those necessary to maintain life underwater.
Hot water circulates through the hose and maintains a constant temperature in the suit. Hot water flow is controlled by the diver through a valve located at shoulder level on the wetsuit.
Wetsuits are the most widely used as free and autonomous diving equipment. The costume is made of special fabric which is lined, impermeable and maintains a thin film of water between the neoprene and body skin.
This film of water is heated to body temperature for comfort and the qualities of neoprene and so limits heat losses to the water outside. Besides all of these, a wet suit provides thermal protection and protection against cutting or scratching the skin. There are many types of neoprene wet suits which consist of: vest, trousers, hood, gloves and bootee.
When somebody must choose a wet suit he or she should pick the type of neoprene for the suit (according to its destination). Some wet suits are provided with a nylon fabric both inside and out. These are the most durable and can be put on a taken off easier.
Another category of wet suits is fitted with nylon cloth only in the interior. These suits provide thermal protection as well as those with fabric on both sides and are also more flexible, but have the disadvantage that the dress is removed more difficultly. The zippers from the ankles and wrists are not really necessary, but facilitate dressing and undressing the costume. The wet suit
Bul. Inst. Polit. Iaşi, t. LX (LXIV), f. 1-4, 2014 23
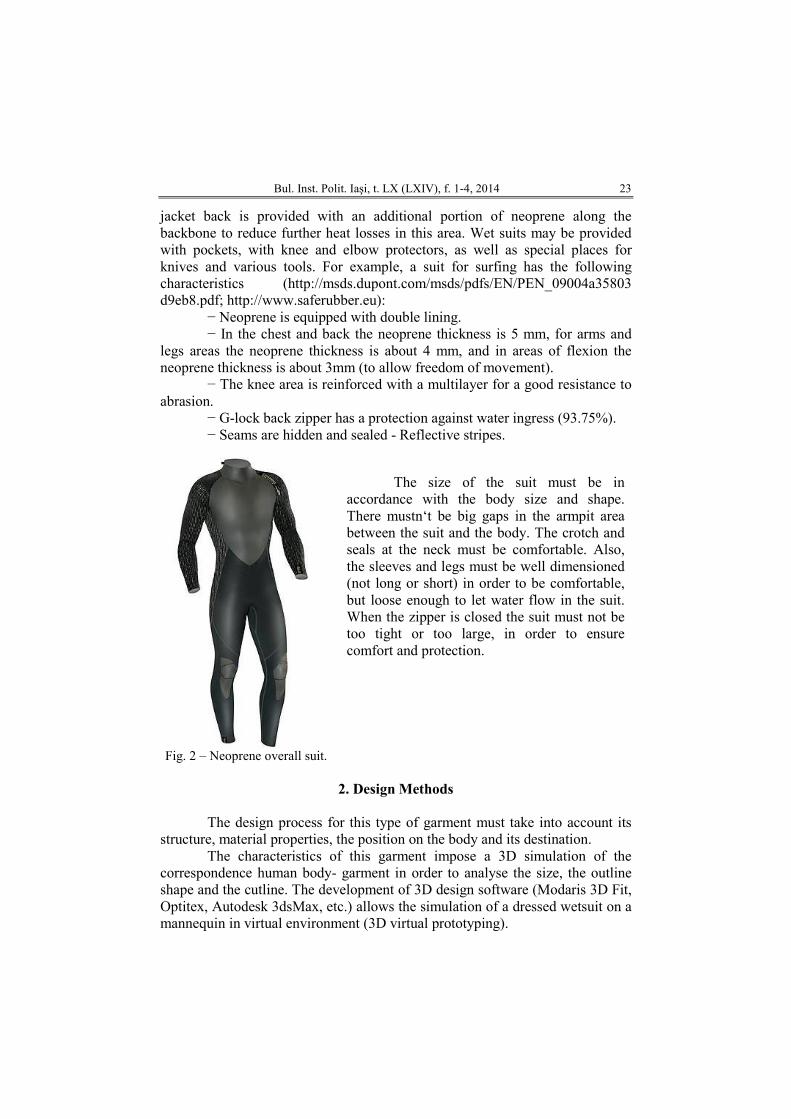
jacket back is provided with an additional portion of neoprene along the backbone to reduce further heat losses in this area. Wet suits may be provided with pockets, with knee and elbow protectors, as well as special places for knives and various tools. For example, a suit for surfing has the following characteristics (http://msds.dupont.com/msds/pdfs/EN/PEN_09004a35803 d9eb8.pdf; http://www.saferubber.eu):
− Neoprene is equipped with double lining. − In the chest and back the neoprene thickness is 5 mm, for arms and
legs areas the neoprene thickness is about 4 mm, and in areas of flexion the neoprene thickness is about 3mm (to allow freedom of movement).
− The knee area is reinforced with a multilayer for a good resistance to abrasion.
− G-lock back zipper has a protection against water ingress (93.75%). − Seams are hidden and sealed - Reflective stripes.
Fig. 2 – Neoprene overall suit.
The size of the suit must be in
accordance with the body size and shape. There mustn‘t be big gaps in the armpit area between the suit and the body. The crotch and seals at the neck must be comfortable. Also, the sleeves and legs must be well dimensioned (not long or short) in order to be comfortable, but loose enough to let water flow in the suit. When the zipper is closed the suit must not be too tight or too large, in order to ensure comfort and protection.
2. Design Methods
The design process for this type of garment must take into account its
structure, material properties, the position on the body and its destination. The characteristics of this garment impose a 3D simulation of the
correspondence human body- garment in order to analyse the size, the outline shape and the cutline. The development of 3D design software (Modaris 3D Fit, Optitex, Autodesk 3dsMax, etc.) allows the simulation of a dressed wetsuit on a mannequin in virtual environment (3D virtual prototyping).
24 Manuela Avădanei et al.
This paper presents a solution how to design wetsuit patterns using advanced module of pattern making (MTM module from Gemini CAD System) and how is verifying the dimensional correspondence and garment equilibrium on the body (mannequin) in 3D virtual environment (Autodesk 3ds Max).
The main stages in designing process of a wetsuit pattern are: • design the flat patterns for the upper and down part of the body; • associate the patterns of the sleeves with the front and back elements
of the blouse; • import the flat patterns in 3D virtual environment (3D Studio Max); • simulate a dressed mannequin with the suit in order to verify the
garment size (dimensional correspondence and equilibrium). • model the main elements of the suits according to its destination,
body shape and material properties. The flat patterns are designed using the advanced module, Made to
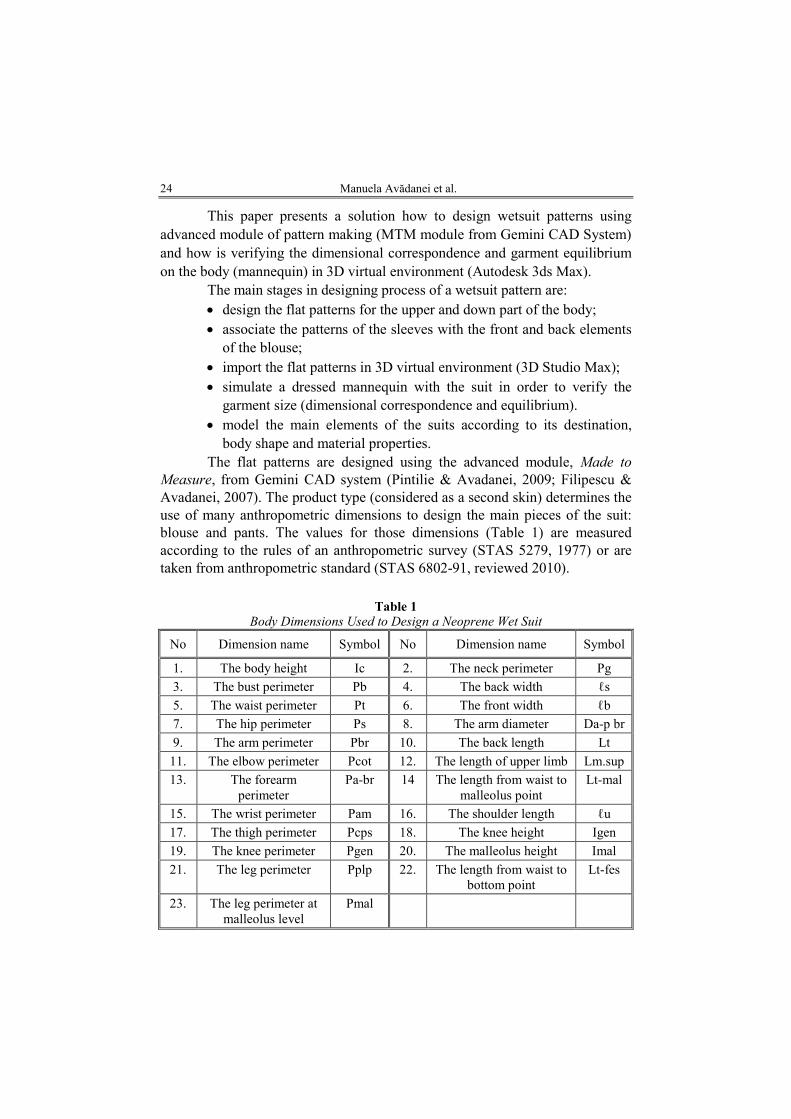
Measure, from Gemini CAD system (Pintilie & Avadanei, 2009; Filipescu & Avadanei, 2007). The product type (considered as a second skin) determines the use of many anthropometric dimensions to design the main pieces of the suit: blouse and pants. The values for those dimensions (Table 1) are measured according to the rules of an anthropometric survey (STAS 5279, 1977) or are taken from anthropometric standard (STAS 6802-91, reviewed 2010).
Table 1
Body Dimensions Used to Design a Neoprene Wet Suit
No Dimension name Symbol No Dimension name Symbol
1. The body height Ic 2. The neck perimeter Pg
3. The bust perimeter Pb 4. The back width ℓs
5. The waist perimeter Pt 6. The front width ℓb
7. The hip perimeter Ps 8. The arm diameter Da-p br
9. The arm perimeter Pbr 10. The back length Lt
11. The elbow perimeter Pcot 12. The length of upper limb Lm.sup
13. The forearm perimeter
Pa-br 14 The length from waist to malleolus point
Lt-mal
15. The wrist perimeter Pam 16. The shoulder length ℓu
17. The thigh perimeter Pcps 18. The knee height Igen
19. The knee perimeter Pgen 20. The malleolus height Imal
21. The leg perimeter Pplp 22. The length from waist to bottom point
Lt-fes
23. The leg perimeter at malleolus level
Pmal
Bul. Inst. Polit. Iaşi, t. LX (LXIV), f. 1-4, 2014 25
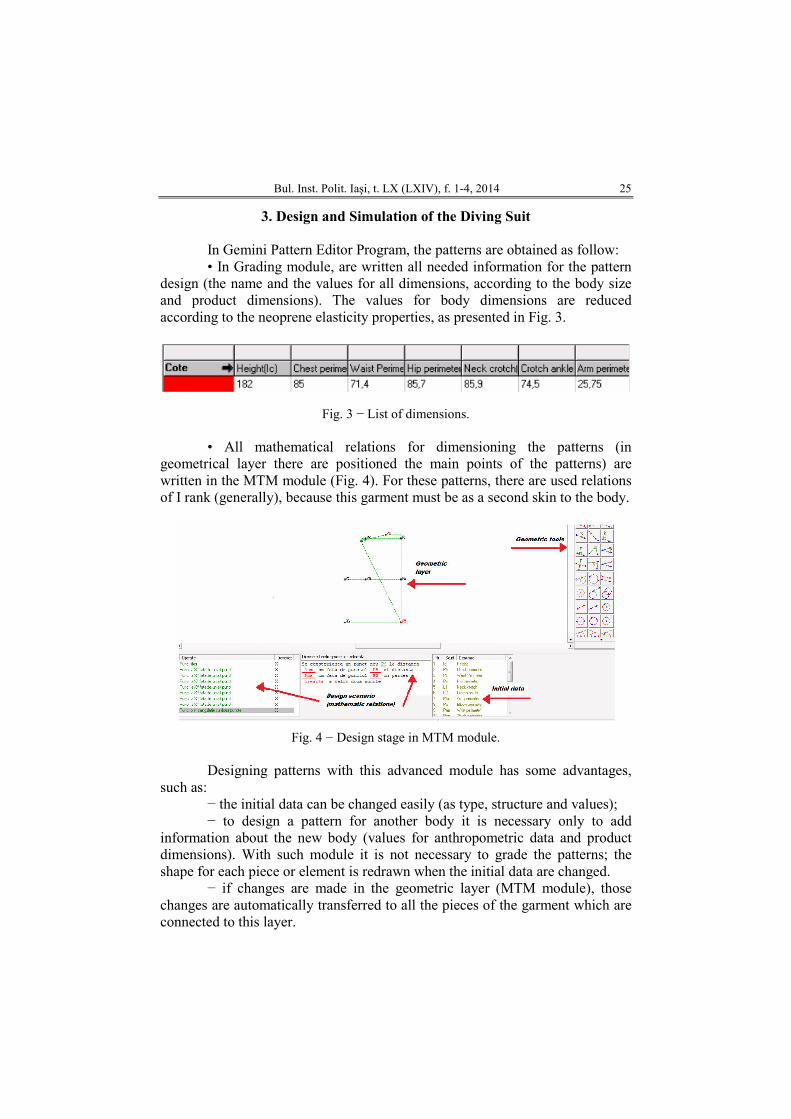
3. Design and Simulation of the Diving Suit In Gemini Pattern Editor Program, the patterns are obtained as follow: • In Grading module, are written all needed information for the pattern
design (the name and the values for all dimensions, according to the body size and product dimensions). The values for body dimensions are reduced according to the neoprene elasticity properties, as presented in Fig. 3.
Fig. 3 − List of dimensions. • All mathematical relations for dimensioning the patterns (in
geometrical layer there are positioned the main points of the patterns) are written in the MTM module (Fig. 4). For these patterns, there are used relations of I rank (generally), because this garment must be as a second skin to the body.
Fig. 4 − Design stage in MTM module. Designing patterns with this advanced module has some advantages,
such as: − the initial data can be changed easily (as type, structure and values); − to design a pattern for another body it is necessary only to add
information about the new body (values for anthropometric data and product dimensions). With such module it is not necessary to grade the patterns; the shape for each piece or element is redrawn when the initial data are changed.
− if changes are made in the geometric layer (MTM module), those changes are automatically transferred to all the pieces of the garment which are connected to this layer.
26 Manuela Avădanei et al.
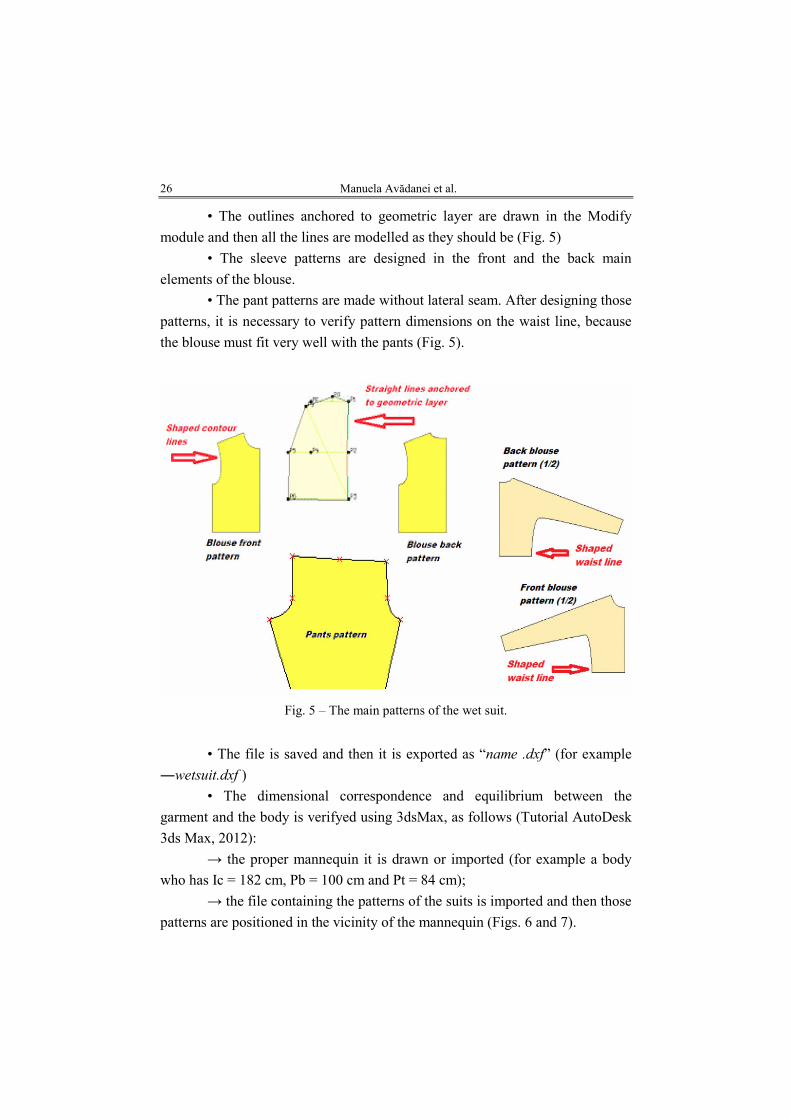
• The outlines anchored to geometric layer are drawn in the Modify
module and then all the lines are modelled as they should be (Fig. 5)
• The sleeve patterns are designed in the front and the back main
elements of the blouse.
• The pant patterns are made without lateral seam. After designing those
patterns, it is necessary to verify pattern dimensions on the waist line, because
the blouse must fit very well with the pants (Fig. 5).
Fig. 5 – The main patterns of the wet suit.
• The file is saved and then it is exported as “name .dxf” (for example
―wetsuit.dxf )
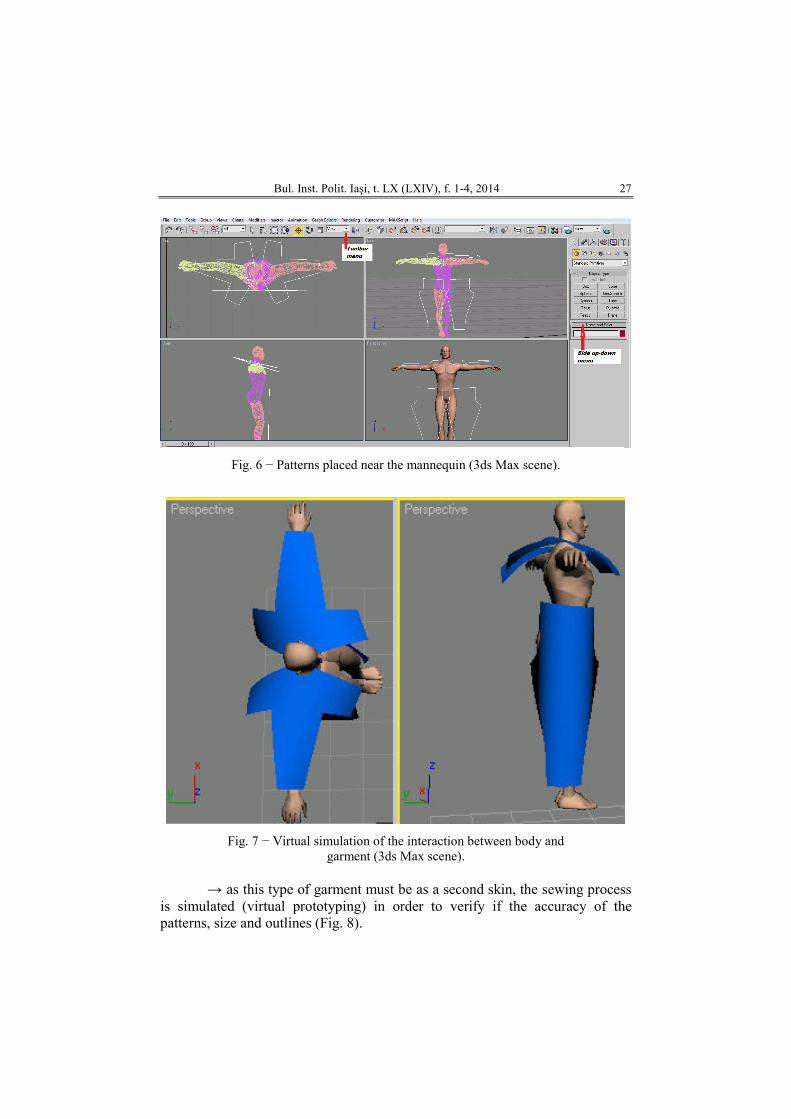
• The dimensional correspondence and equilibrium between the
garment and the body is verifyed using 3dsMax, as follows (Tutorial AutoDesk
3ds Max, 2012):
→ the proper mannequin it is drawn or imported (for example a body
who has Ic = 182 cm, Pb = 100 cm and Pt = 84 cm);
→ the file containing the patterns of the suits is imported and then those
patterns are positioned in the vicinity of the mannequin (Figs. 6 and 7).
Bul. Inst. Polit. Iaşi, t. LX (LXIV), f. 1-4, 2014 27
Fig. 6 − Patterns placed near the mannequin (3ds Max scene).
Fig. 7 − Virtual simulation of the interaction between body and garment (3ds Max scene).
→ as this type of garment must be as a second skin, the sewing process
is simulated (virtual prototyping) in order to verify if the accuracy of the patterns, size and outlines (Fig. 8).
28 Manuela Avădanei et al.
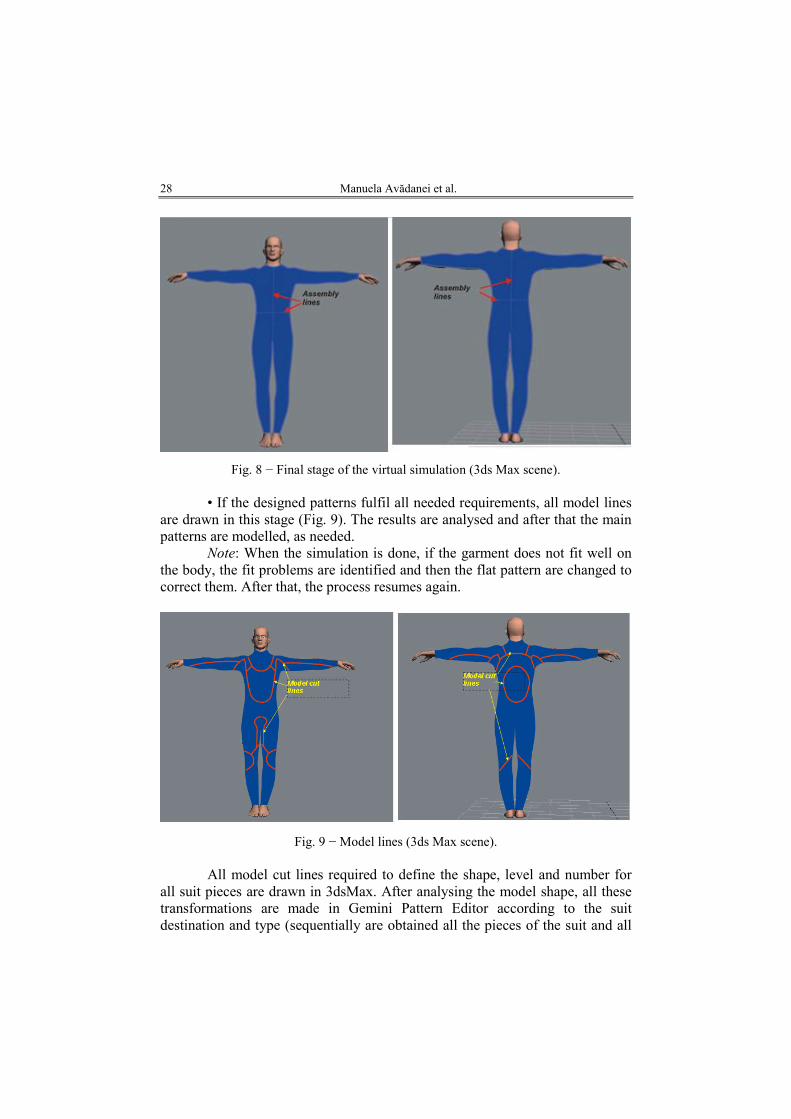
Fig. 8 − Final stage of the virtual simulation (3ds Max scene). • If the designed patterns fulfil all needed requirements, all model lines
are drawn in this stage (Fig. 9). The results are analysed and after that the main patterns are modelled, as needed.
Note: When the simulation is done, if the garment does not fit well on the body, the fit problems are identified and then the flat pattern are changed to correct them. After that, the process resumes again.
Fig. 9 − Model lines (3ds Max scene). All model cut lines required to define the shape, level and number for
all suit pieces are drawn in 3dsMax. After analysing the model shape, all these transformations are made in Gemini Pattern Editor according to the suit destination and type (sequentially are obtained all the pieces of the suit and all
Bul. Inst. Polit. Iaşi, t. LX (LXIV), f. 1-4, 2014 29
the pieces for the markers, used in manufacturing process). These suits are made in panels, with different colours, thickness or any other signs (the brand name and code). During the manufacturing process, seams are placed to assists body movements, minimise restriction and prevent damage in different areas (arm, shoulder, knee and lateral part of the body).
4. Conclusions
When designing a stretch and fitted garment, it is important to know its
destination, the environment conditions and risks and also the material properties.
All the important companies have preoccupations to develop new materials with advanced and improved properties, to design new type of garments to fulfill all consumer needs. In this case it is important to have a new vision about garments with special destination, to find and adopt flexible solution to manufacture garments with added values, because it is necessary to:
• Improve protection in high risk environment and threats; • Maintain thermo-physiological comfort or survival in extreme
conditions. • Improve compatibility between and within different clothing components. • Improve manufacturing technology and develop new materials to
upgrade safety condition. • Reduce manufacturing costs and ensure the environment protection.
REFERENCES * *
* Tutorial Autodesk 3dsMax (2012). DuPont, Technical information — Neoprene (PDF). DuPont Performance Elastomers.
(2003) http://www.dupont.com/products-and-services/plastics-polymers-resins/elastomers.html (accessed at 21.03.2013).
Filipescu E., Avădanei M., Structura şi proiectarea confecŃiilor textile. Ed. Performantica Publishing House, Iaşi (2007).
http://msds.dupont.com/msds/pdfs/EN/PEN_09004a35803d9eb8.pdf (accessed at 9.06.2013). http://www.saferubber.eu (accessed at 25.04.2013). Loghin C. et al., Functional Design of Equipments for Individual Protection.
Proceedings of the 6th International Conference on Management of Technological Changes, Book 2, Alexandropoulos, Greece, 693−696 (2009a).
Loghin C. et al., Functional Design of Protective Clothing with Intelligent Elements. Annals of DAAAM & Proceedings of the 20th International DAAAM Symposium, 20, 435−436 (2009b).
Nicolaiov P. et al., Flexibility in Technological Process Design - a Key Factor
Fordeveloping New Generations of Textile Equipments Based on Intelligent
Mechatronic Systems. Industria Textilă, 61, 4, 157−162 (2010).
30 Manuela Avădanei et al.
Pintilie E., Avădanei M., Proiectarea asistată de calculator în confecŃii. Performantica Publishing House, Iaşi (2009).
STAS 5279-1977, Garments. Body measurement (1977). STAS 6802-91, Male clothes. Body dimensions (reviewed in 2010).
PROIECTAREA 3D A PRODUSELOR CU DESTINAłII SPECIALE
(Rezumat)
ProtecŃia termică în mediul subacvatic este foarte importantă pentru sănătatea
şi securitatea personală. În zilele noastre, multe persoane lucrează în acest mediu sau fac sport de agrement (înot, scufundări, free-diving, surfing, jet ski, etc.). În acest caz, purtătorul trebuie să poarte un costum conceput ca o ,,a doua piele”, fabricat din materiale speciale, care trebuie să îi asigure condiŃii de confort, libertate de mişcare şi protecŃie faŃă de acŃiunea mediului subacvatic. Această lucrare prezintă o soluŃie de proiectare a unui costum subacvatic cu instrumente specifice sistemelor CAD (modulul Made-To-Measure din Gemini CAD System) şi de verificare 3D în spaŃiul virtual a modului de potrivire al produsului pe corp în mediul de lucru Autodesk 3ds Max.
BULETINUL INSTITUTULUI POLITEHNIC DIN IAŞI Publicat de
Universitatea Tehnică „Gheorghe Asachi” din Iaşi Tomul LX (LXIV), Fasc. 1-4, 2014
SecŃia TEXTILE. PIELĂRIE
ECO-FRIENDLY DYEING WITH COCHINEAL DYE
ON HEMP FABRICS
BY
RAMONA BOT-BUDEANU1,∗∗∗∗, ANTONELA CURTEZA
1,
PRAMOD AGRAWAL2 and GER BRINKS
2
1“Gheorghe Asachi” Technical University of Iaşi, România,
Faculty of Textiles & Leather Engineering and Industrial Management 2Knowledge Centre, Design & Technology, Enschede, Netherlands
Received: March 17, 2014 Accepted for publication: October 22, 2014
Abstract. Eco-friendly fabrics in general are those that have been made
using environmentally safe, renewable, and sustainable processes. Hemp fabric is best known for its durability, softness and breath ability while being naturally resistant to mould, mildew and ultraviolet rays. Hemp is resistant to insects, making pesticides unnecessary for cultivation, grows vigorously without the use of herbicides or chemical fertilizers, being a renewable and sustainable resource which prevents erosion of farmland. The Cochineal (Dactylopius coccus) is a scale insect in the suborder Sternorrhyncha, from which the crimson-coloured dye carmine is derived.
Eco-friendly fibres are the raw materials used to manufacture textiles with no or minimum use of chemically-based pesticides, herbicides, or fertilizers, that employ best practice land management, and that adhere to fair trade practices. The purpose of this paper is to develop an environmentally friendly dyeing process using natural hemp fabric and natural dyes Cochineal.
Keywords: natural fabric; hemp; natural dyes; colour.
∗ Corresponding author; e-mail: [email protected]
This paper is the full version of the paper published in abstract at the Textiles of the Future ISKA, Iaşi, June, 2013
32 Ramona Bot-Budeanu et al.
1. Introduction
Nowadays, natural products, especially derived from plants, green
approach and environmental friendly nature, biocompatibility, low toxicity, are gaining popularity all around the world for their use in textiles (Joshi et al., 2009; Samanta & Agarwal, 2009).
Hemp (Cannabis sativa L.) is regarded as one of the oldest plants grown for its fibres used for the manufacture of rope, canvas and clothing (Liberalato, 2003), now hemp is regarded as one of the highest quality fibres and is in high demand.
Hemp not only possesses several excellent properties such as strength, warmth, comfort and durability, it is considered as environmentally friendly plant because less pesticides and herbicides are needed during growing (http://en.wikipedia.org/wiki/Hemp).
Most of natural dyes generally require metallic mordants, for example, alum, iron sulphate and copper sulphate to increase the affinity between fibre and dye molecule, resulting in higher colour yield, different shades and better fastness properties.
The Oeko-Tex Association, Internationaler Verband der Naturtextilwirtschaft (IVN), Organic Trade Association (USA), Soil Association (UK), and Organic and Crop Improvement Association (OCIA) are some of the national and international organizations dealing with the organic certification of products (Dawson, 2012).
Several researches have focused on the improvement of dyeing quality of hemps. For examples, pretreatment of hemp yarns with a commercial product of acrylic copolymer before dyeing with 2:1 premetallised acid dyes significantly improved the uptake of the dyes (Grifoni et al., 2011). According to Singh et al. (2005) the concentration of dye increased the bactericidal properties of dyed textile. The antimicrobial properties seem to be related to the dye structure, especially the presence of functional groups in it.
Recently, Grifoni et al. (2009; 2011) investigated the UV protection properties of flax and hemp fabrics after treatment with some natural dyes. The natural dyes proved quite effective in order to confer UV protection properties.
The use of low-temperature air plasma on hemp fabrics before dyeing with some acid and direct dyes enhanced the dyeing rate, final dye exhaustion and colour yield of dyed samples. In addition to fabric and construction, hemp fabrics dyed with natural dyes from wood, weld and madder with the presence of alum and potassium bitartrate mordants showed a good ultraviolet protection with the UPF (Ultravilolet Protection Factor) above 15 (Grifoni et al., 2009). Hemp fabrics dyed with turmeric provided with the UPF of 15-30 with the use of citric acid and ferrous sulphate mordants (Schmidt-Przewozna & Kowalinski, 2008).
Historically, natural dyes were used to colour clothing or other textiles,
Bul. Inst. Polit. Iaşi, t. LX (LXIV), f. 1-4, 2014 33
and by the mid-1800's chemists began producing synthetic substitutes for them. By the early part of this century only a small percentage of textile dyes were extracted from plants. Lately there has been increasing interest in natural dyes.
2. Materials and Methods
2.1. Materials
100% hemp fabric treated with enzymes Bioprep 3000 L was used as
substrate and 100 % hemp fabric with treatment scouring and bleaching in one step was used as substrate.
The hemp fabrics were obtained from TEX Fir SRL, Romania. The natural Dye Cochenille was supplied by Couleurs de Plantes, France (www.couleurs-de-plantes.com). For the hemp pretreatments the followings substances were used: enzymes Bioprep 3000 L (Novozymes), non-ionic surfactant Triton X-100 (Amersham Biosciences, UK), sodium hydroxide 38°BE, 33% (Tannex CB), hydrogen peroxide 35%, Tanaterge Advance (Netherlands).
2.2. Fabric Treatment
Two treatments were used for the hydrophilic treatment: • First treatment – enzymes pretreatment (the optimal condition was
temperature 50°C, 0,5M Tris-HCl buffer at pH8.0, 2 ml enzymes pectinase Bioprep 3000L, non-ionic surfactant Triton X-100, 2 gr. fabric and 30 min. incubation time in Linitester), then the hemp samples were rinsed thoroughly with cold water and dried in oven for 30 min. at 50°C.
The hydrophylicity of the hemp fabric was measurement by using the drop test determining the wetting time. Three measurements were made on different places of the fabrics, the results were less than 1 sec.
• The second treatment - scouring and bleaching in one step pretreatment (the experiment was done in Linitester, the optimal condition was temperature 98°C, 1 h incubation time, Sodium hydroxide 38°BE, 33%, Tannex CB, 5 ml Hydrogen peroxide 35%, Tanaterge Advance). After this process the samples was rinsed with water at 90°C for 1 h on Linitester and then rinsed thoroughly with cold water and dried in oven for 30 min. at 50°C.
After the bleaching experiments, the hydrophilicity was tested and the results were less than 1 sec. The whiteness was determined with the SpectroEye x-rite spectrophotometer.
2.3. Mordanting and Dyeing
The natural dyeing procedures are mainly two-bath dyeing including a
separated mordanting step:
34 Ramona Bot-Budeanu et al.
• The process of mordant: 2 type of mordants were used: aluminium sulphate and iron sulphate. The textile material was put into the water, short run and that followed
the addition of mordant solution into the water (fabric/water ratio 1:30). After this step, samples of hemp fabric were rinsed intensively with cold water.
− 5 gr. fabric − 150 ml water − 0.8 gr aluminium sulphate/iron sulphate − 98°C − 1h. • The dyeing process: The dyeing was carried out in laboratory with the dyeing machine
Zeltex VISTACOLOR. It was made with a solution of 5% and 10% (of fabric weight) dye, temperature 98°C for 60 min. After dyeing process fabrics samples were washed firstly with very warm water 80°C and then with cold water.
2.4. Colorimetric Measurements
The reference and sample measurement were made to define the
colour value. This test was made with a spectrophotometer 968 (X - Rite, USA) using D65 illuminant and 100 observer (enhanced polarization filter according to ISO/DIS 13655). Each sample was folded twice to give an opaque sample with two plies and three measurements were carried out on different location of the sample.
The colorimetric coordinates of the studied sample, green-red (a), the yellow-blue axis (b) and luminosity (L) used to make a comparison between the reference samples – 5% dye and washed and 10% dye and washed.
2.5. Washing Test
Washing tests were done in Linitester for 30 min at 40°C with
Detergent use for the tests: ECE – Color Detergent, with Phosphate for Fastness Test acc. ISO 105-C06 (Test Gewebe GmbH, Germany)
− the wash liquor was prepared by dissolving 4 g of detergent and 1 gram sodium carbonate/1 litre of water.
3. Results and Discussions
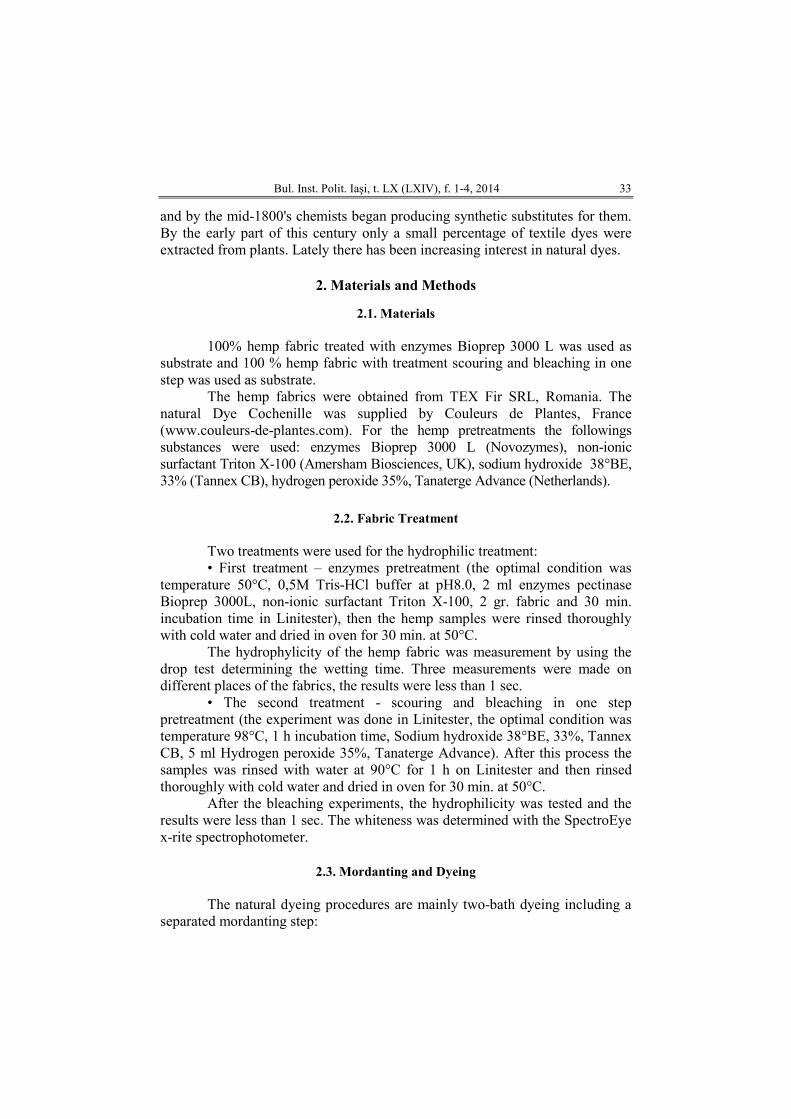
The aspect of the hemp woven samples dyed with 5% and 10%
solutions and treated with the two mordants, as well as Cie L*a*b* values are presented in Figs. 1 to 4.
Bul. Inst. Polit. Iaşi, t. LX (LXIV), f. 1-4, 2014 35
Fig. 1 − 5% and 10% dye with aluminium sulphate.
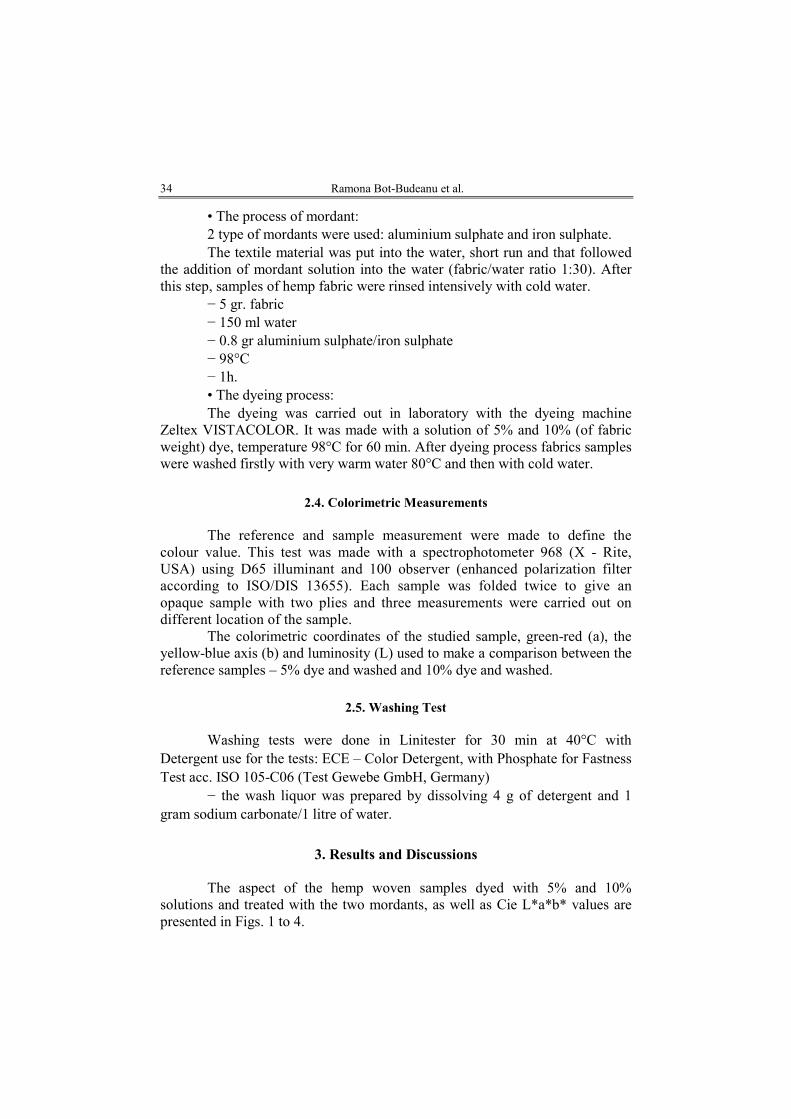
Fig. 2 − Cie L*a*b* values for 5% and 10% dye with aluminium sulphate.
36 Ramona Bot-Budeanu et al.
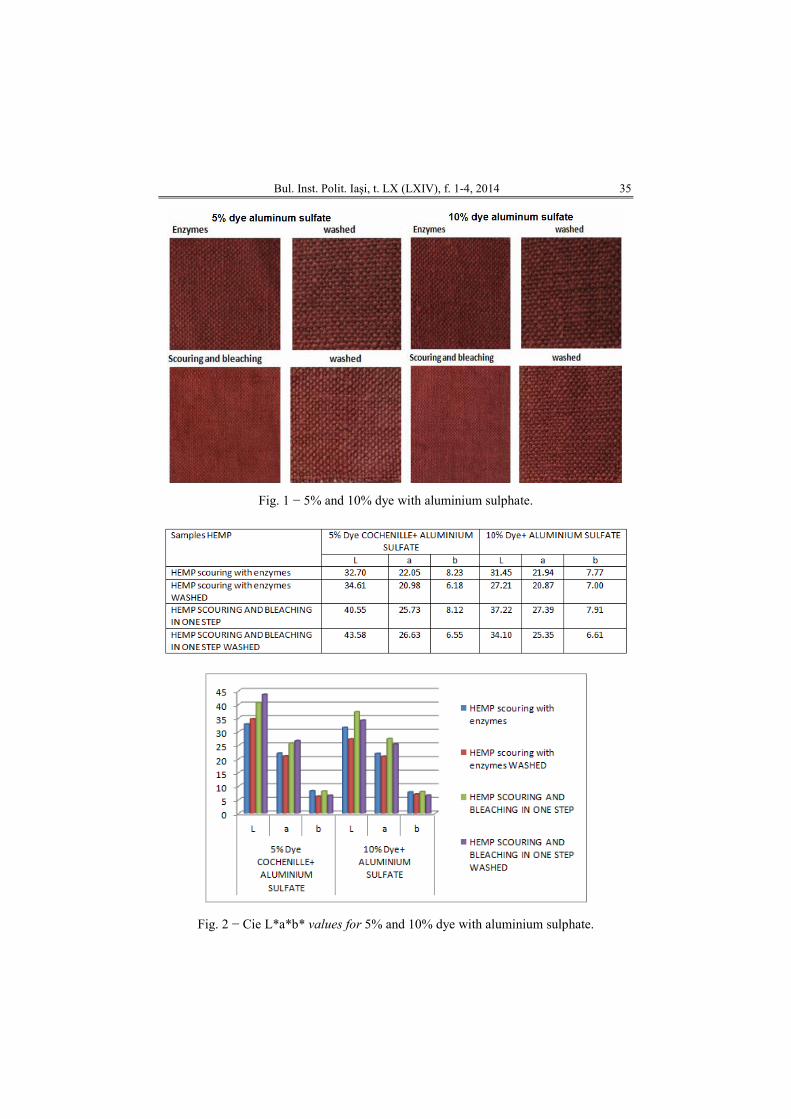
Fig. 3 − Cie L*a*b* values for 5% and 10% dye with iron sulphate.
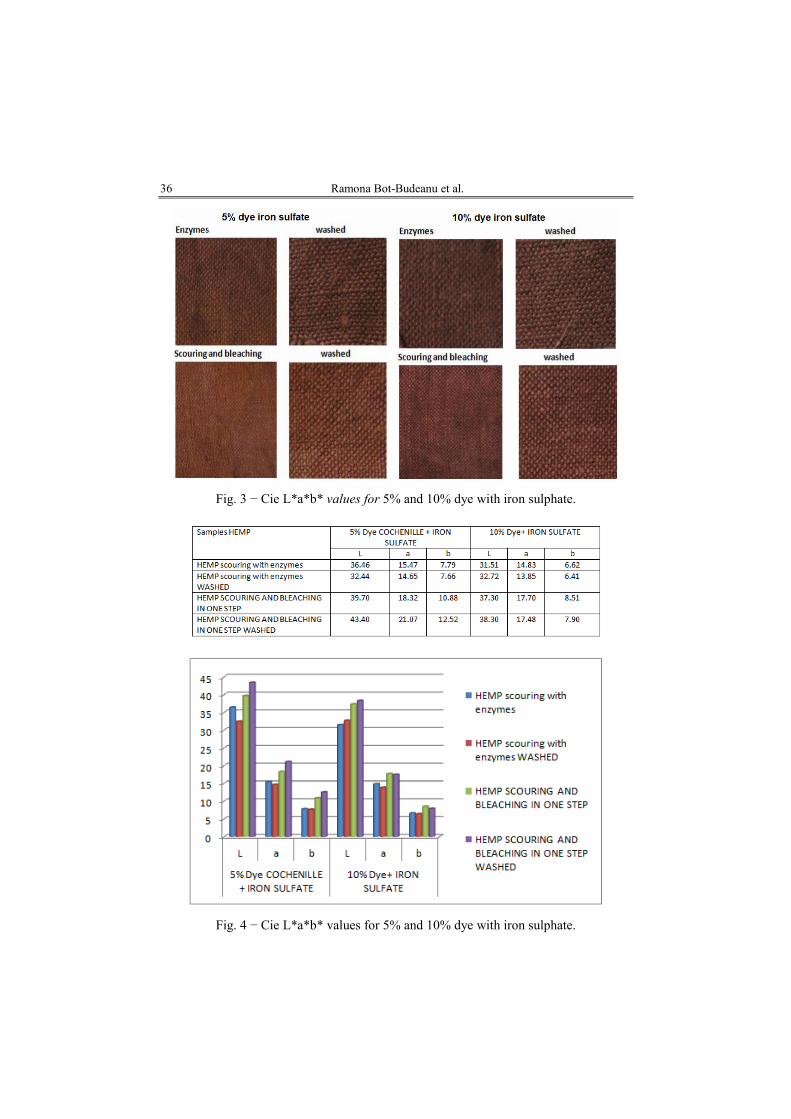
Fig. 4 − Cie L*a*b* values for 5% and 10% dye with iron sulphate.
Bul. Inst. Polit. Iaşi, t. LX (LXIV), f. 1-4, 2014 37
4. Conclusions
Since the last decade, the application of natural dyes on textile materials
is gaining popularity all over the world, possibly because of the increasing awareness regarding the environment, ecology, and pollution control.
The aim of this research is to define an “eco-friendly” technology for natural dyeing with natural dye Cochineal in order to create ecological products, the main focus in ecological production being placed on finishing methods.
Natural dyes, generally supposed to be cheap, nontoxic, renewable and sustainable resource with minimal environmental impact, have attracted the attention of the scientific community.
Acknowledgments. This paper was realised with the support of CUANTUMDOC ― Doctoral Scholarships for research performance at European level Project, ID 79407, financed by the European Social Found and Romanian Government and by the Research Centre, Design & Technology, Saxion, Enschede, the Netherlands. The authors would like to acknowledge support of Rudolf Chemie NV Belgium for supplying functional finishes.
REFERENCES
*** Hemp, Available from http://en.wikipedia.org/wiki/Hemp (accessed at 2112-05-01).
Cardon D., Natural Dyes - Sources, Tradition. Technology and Science (2007). Dapson R.W., The History, Chemistry and Modes of Action of Carmine and Related
Dyes. Biotechnic & Histochemistry, 82, 4, 173–187 (2007). Dawson T., Progress Towards a Greener Textile Industry. Color. Technol, 128, 1–8 (2012). Grifoni D. et al., The Role of Natural Dyes in the UV Protection of Fabrics Made of
Vegetable Fibres. Dyes Pigments, 91, 279–285 (2011). Grifoni D.L. et al., Laboratory and Outdoor Assessment of UV Protection Offered by
Flax and Hemp Fabrics Dyed with Natural Dyes. Photochem. Photobiol., 85, 313–320 (2009).
Joshi M., Ali S.W, Purwar R., Rajendran S. Ecofriendly Antimicrobial Finishing of Textiles Using Bioactive Agents Based on Natural Products. Indian J. Fibre Text. Res, 34, 295–304 (2009).
Liberalato D., Prospect of Hemp Utilization in the European Textile Industry. Agroindustria, 2/3, 147−148 (2003).
Lloyd A.G., Extraction and Chemistry of Cochineal. Food Chemistry, 5, 91–107 (1980). Samanta A.K., Agarwal P., Application of Natural Dyes on Textiles. Indian J. Fibre
Text. Res., 34, 384–399 (2009). Schmidt-Przewozna K., Kowalinski J., Light Fastness Properties and UV Protection
Factor of Naturally Dyed Linen, Hemp and Silk. Proceedings of the 2008 International Conference on Flax and Other Bast Plants, 364−374 (2008).
Singh R. et al., Antimicrobial Activity of Some Natural Dyes. Dyes Pigm., 66, 99–102 (2005).
www.couleurs-de-plantes.com
38 Ramona Bot-Budeanu et al.
PROCES DE VOPSIRE ECOLOGICĂ A MATERIALELOR
DIN CÂNEPĂ CU COLORANTUL COCHINEAL
(Rezumat) Materialele ecologice sunt în general acele materiale care au fost procesate prin
procese ecologice şi sustenabile. Materialele din cânepă sunt caracterizate de durabilitate, moliciune, permeabilitate la vapori, rezistenŃă la mucegai, ciuperci, raze ultraviolete. Cânepa este rezistentă la insecte, ceea ce face inutilă folosirea pesticidelor la cultivare, crescând fără ajutorul ierbicidelor şi a fertilizatorilor chimici, fiind o resursă sustenabilă în prevenŃia eroziunii în terenurile agricole. Cochineal (Dactylopius coccus) este o insectă din subordinul Sternorrhyncha, din care se poate extrage un colorant roşu intens.
Fibrele ecologice sunt folosite pentru a produce materiale textile care nu conŃin deloc sau conŃin doar un minim de pesticide, ierbicide sau îngrăşăminte, bazându-se pe cele mai bune practici în ceea ce priveşte managementul terenurilor şi aderând la practici comerciale corecte. Lucrarea îşi propune să dezvolte un proces de vopsire ecologic folosind materiale din cânepă şi un colorant natural extras din Cochineal.
BULETINUL INSTITUTULUI POLITEHNIC DIN IAŞI Publicat de
Universitatea Tehnică „Gheorghe Asachi” din Iaşi Tomul LX (LXIV), Fasc. 1-4, 2014
SecŃia TEXTILE. PIELĂRIE
ASPECTS REGARDING THE TINCTORIAL BEHAVIOUR OF
FIBERS DERIVED FROM VIRGIN AND RECYCLED PET
BY
OVIDIU CONSTANDACHE, ANGELA CEREMPEI∗∗∗∗ and RODICA MUREŞAN
“Gheorghe Asachi” Technical University of Iaşi, România,
Faculty of Textiles & Leather Engineering and Industrial Management
Received: May 12, 2014 Accepted for publication: September 7, 2014
Abstract. The present paper deals with the dyeing behaviour of recycled
and virgin polyester fibres dyed with Foron brilliant rot SGL (CI Disperse Red 121). The elemental analysis showed slight modifications. Thus the carbon content of the recycled polyester fibre is higher than that of the virgin fibre. In this study was determined the amount of dye fixed on the fibre for various dyeing conditions. There was a correlation between the amounts of dye fixed on the dyed fibre and the colour strength (K/S). Recycled polyester fibre fixed a higher amount of dye than virgin polyester.
Keywords: disperse dye; dye concentration; colour strength.
1. Introduction
The polyethylene terephthalate is one of the most important
thermoplastic polyesters. The PET obtained from recycling packages represents a potentially inexpensive source of raw matter. The main advantage of recycled PET consists in the fact that it does not require reparation from other materials
∗ Corresponding author; e-mail: [email protected]
This paper is the full version of the paper published in abstract at the Textiles of the Future ISKA, Iasi, June, 2013
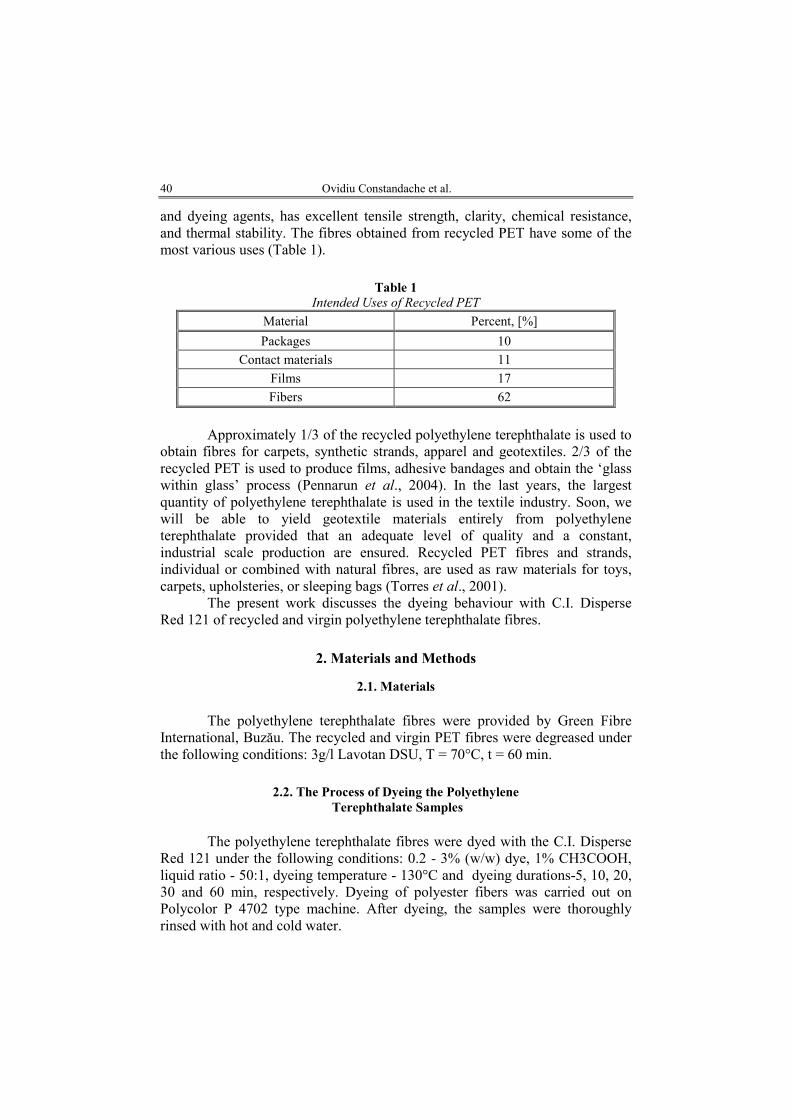
40 Ovidiu Constandache et al.
and dyeing agents, has excellent tensile strength, clarity, chemical resistance, and thermal stability. The fibres obtained from recycled PET have some of the most various uses (Table 1).
Table 1
Intended Uses of Recycled PET
Material Percent, [%]
Packages 10
Contact materials 11
Films 17
Fibers 62
Approximately 1/3 of the recycled polyethylene terephthalate is used to
obtain fibres for carpets, synthetic strands, apparel and geotextiles. 2/3 of the recycled PET is used to produce films, adhesive bandages and obtain the ‘glass within glass’ process (Pennarun et al., 2004). In the last years, the largest quantity of polyethylene terephthalate is used in the textile industry. Soon, we will be able to yield geotextile materials entirely from polyethylene terephthalate provided that an adequate level of quality and a constant, industrial scale production are ensured. Recycled PET fibres and strands, individual or combined with natural fibres, are used as raw materials for toys, carpets, upholsteries, or sleeping bags (Torres et al., 2001).
The present work discusses the dyeing behaviour with C.I. Disperse Red 121 of recycled and virgin polyethylene terephthalate fibres.
2. Materials and Methods
2.1. Materials
The polyethylene terephthalate fibres were provided by Green Fibre
International, Buzău. The recycled and virgin PET fibres were degreased under the following conditions: 3g/l Lavotan DSU, T = 70°C, t = 60 min.
2.2. The Process of Dyeing the Polyethylene
Terephthalate Samples
The polyethylene terephthalate fibres were dyed with the C.I. Disperse
Red 121 under the following conditions: 0.2 - 3% (w/w) dye, 1% CH3COOH, liquid ratio - 50:1, dyeing temperature - 130°C and dyeing durations-5, 10, 20, 30 and 60 min, respectively. Dyeing of polyester fibers was carried out on Polycolor P 4702 type machine. After dyeing, the samples were thoroughly rinsed with hot and cold water.
Bul. Inst. Polit. Iaşi, t. LX (LXIV), f. 1-4, 2014 41
3. Results and Discussions
3.1. Fibre Characterization
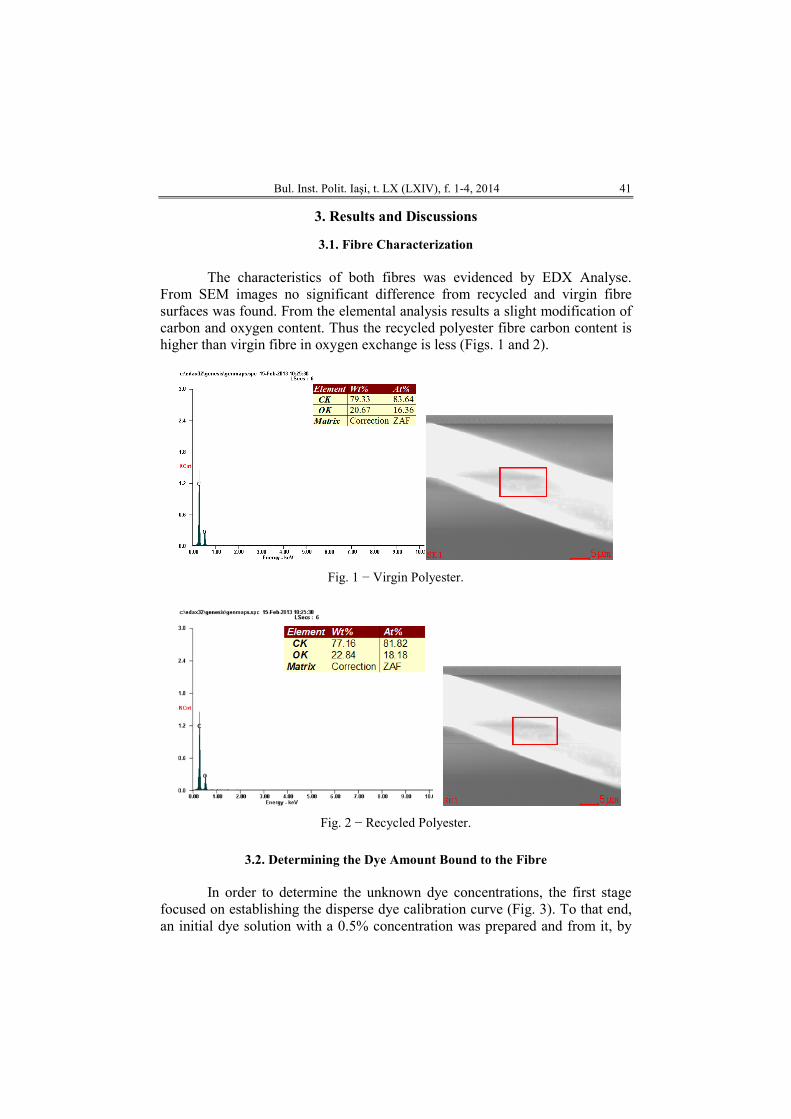
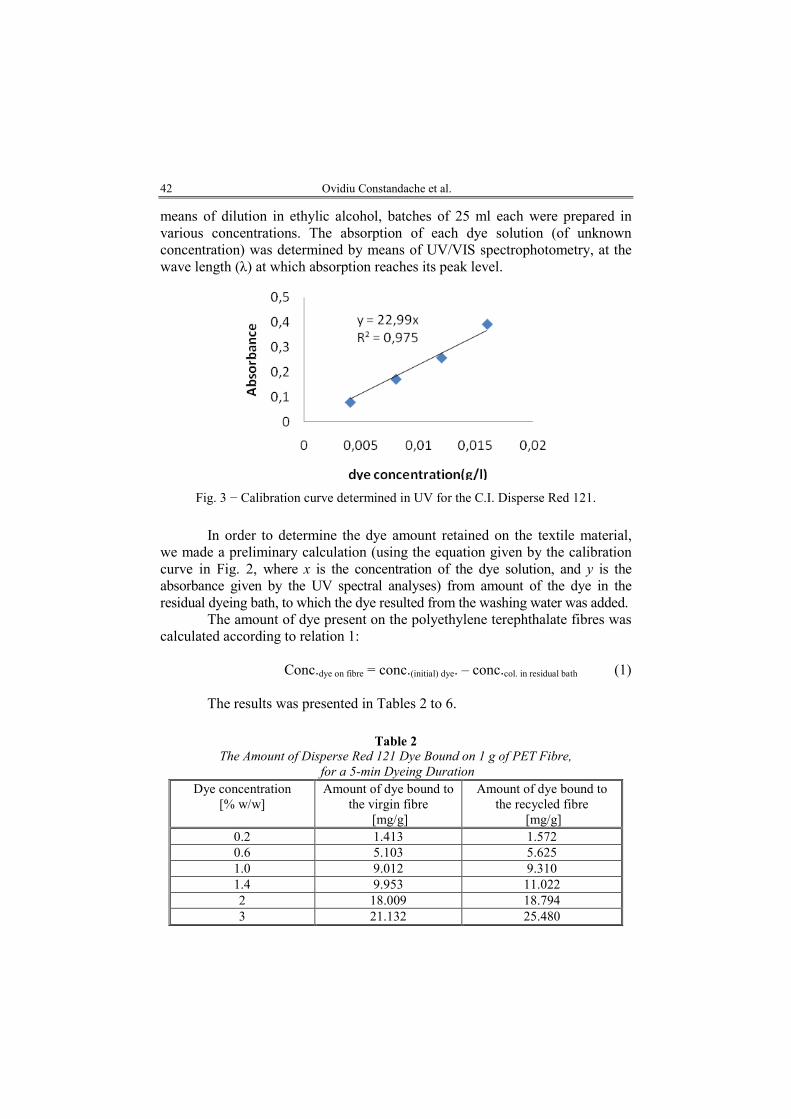
The characteristics of both fibres was evidenced by EDX Analyse.
From SEM images no significant difference from recycled and virgin fibre surfaces was found. From the elemental analysis results a slight modification of carbon and oxygen content. Thus the recycled polyester fibre carbon content is higher than virgin fibre in oxygen exchange is less (Figs. 1 and 2).
Fig. 1 − Virgin Polyester.
Fig. 2 − Recycled Polyester.
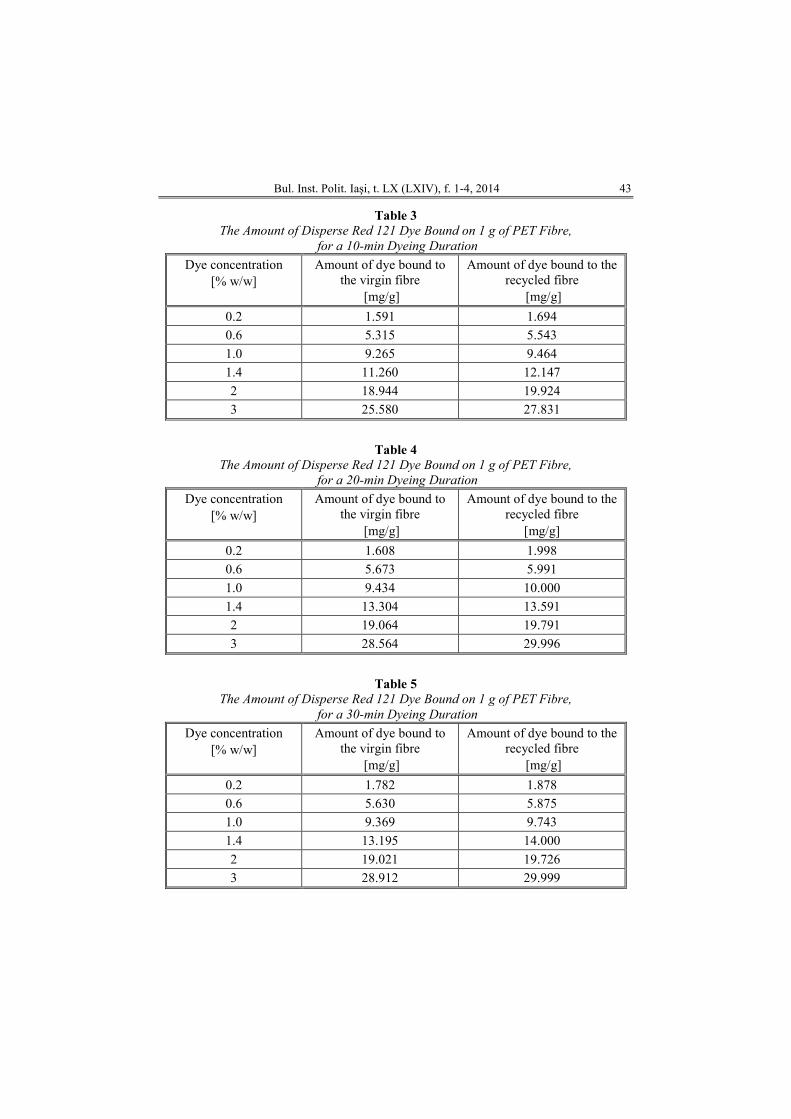
3.2. Determining the Dye Amount Bound to the Fibre
In order to determine the unknown dye concentrations, the first stage
focused on establishing the disperse dye calibration curve (Fig. 3). To that end, an initial dye solution with a 0.5% concentration was prepared and from it, by
42 Ovidiu Constandache et al.
means of dilution in ethylic alcohol, batches of 25 ml each were prepared in various concentrations. The absorption of each dye solution (of unknown concentration) was determined by means of UV/VIS spectrophotometry, at the wave length (λ) at which absorption reaches its peak level.
Fig. 3 − Calibration curve determined in UV for the C.I. Disperse Red 121.
In order to determine the dye amount retained on the textile material,
we made a preliminary calculation (using the equation given by the calibration curve in Fig. 2, where x is the concentration of the dye solution, and y is the absorbance given by the UV spectral analyses) from amount of the dye in the residual dyeing bath, to which the dye resulted from the washing water was added.
The amount of dye present on the polyethylene terephthalate fibres was calculated according to relation 1:
Conc.dye on fibre = conc.(initial) dye. – conc.col. in residual bath (1)
The results was presented in Tables 2 to 6.
Table 2
The Amount of Disperse Red 121 Dye Bound on 1 g of PET Fibre,
for a 5-min Dyeing Duration
Dye concentration [% w/w]
Amount of dye bound to the virgin fibre
[mg/g]
Amount of dye bound to the recycled fibre
[mg/g] 0.2 1.413 1.572 0.6 5.103 5.625 1.0 9.012 9.310 1.4 9.953 11.022 2 18.009 18.794 3 21.132 25.480
Bul. Inst. Polit. Iaşi, t. LX (LXIV), f. 1-4, 2014 43
Table 3
The Amount of Disperse Red 121 Dye Bound on 1 g of PET Fibre,
for a 10-min Dyeing Duration
Dye concentration [% w/w]
Amount of dye bound to the virgin fibre
[mg/g]
Amount of dye bound to the recycled fibre
[mg/g]
0.2 1.591 1.694
0.6 5.315 5.543
1.0 9.265 9.464
1.4 11.260 12.147 2 18.944 19.924 3 25.580 27.831
Table 4
The Amount of Disperse Red 121 Dye Bound on 1 g of PET Fibre,
for a 20-min Dyeing Duration
Dye concentration [% w/w]
Amount of dye bound to the virgin fibre
[mg/g]
Amount of dye bound to the recycled fibre
[mg/g]
0.2 1.608 1.998
0.6 5.673 5.991
1.0 9.434 10.000
1.4 13.304 13.591 2 19.064 19.791 3 28.564 29.996
Table 5
The Amount of Disperse Red 121 Dye Bound on 1 g of PET Fibre,
for a 30-min Dyeing Duration
Dye concentration [% w/w]
Amount of dye bound to the virgin fibre
[mg/g]
Amount of dye bound to the recycled fibre
[mg/g]
0.2 1.782 1.878
0.6 5.630 5.875
1.0 9.369 9.743
1.4 13.195 14.000 2 19.021 19.726 3 28.912 29.999
44 Ovidiu Constandache et al.
Table 6
The Amount of Disperse Red 121 Dye Bound on 1 g of PET Fibre,
for a 60-min Dyeing Duration
Dye concentration
[% w/w]
Amount of dye bound to the virgin fibre
[mg/g]
Amount of dye bound to the recycled fibre
[mg/g]
0.2 1.923 1.980
0.6 5.835 5.935
1.0 8.386 8.717
1.4 13.276 13.653
2 17.969 18.543
3 23.953 27.813
From Tables 2 to 6 result that the amount of dye bound to the recycled
polyethylene terephthalate fibre is higher than the amount of dye bound to the virgin fibre.
3.3. Colour Strength (K/S) Measurements
The colour strength of the samples dyed with the disperse dye was
assessed using the K/S index determined with the Spectroflash 300® spectrophotometer produced by DATACOLOR for the D65/10 illuminant.
For practical purposes, colour strength measurement uses the f(R) function, theoretically inferred by Kubelka and Munk (Puscas & Cezar, 1997; Grindea et al., 1983; Cezar, 2004):
2(1 )
2
RKS R
−= (2)
where: K – the light absorption coefficient; S – the light diffusion coefficient.
The K/S values calculated for the maximum wavelength increase at the same time with the concentration of the dye used for dyeing (Grindea et al., 1983; Puscas, 1983).
The dye concentration influence upon colour strength was studied using the Micromath 2000® software and is presented in Figs. 4 to 8.
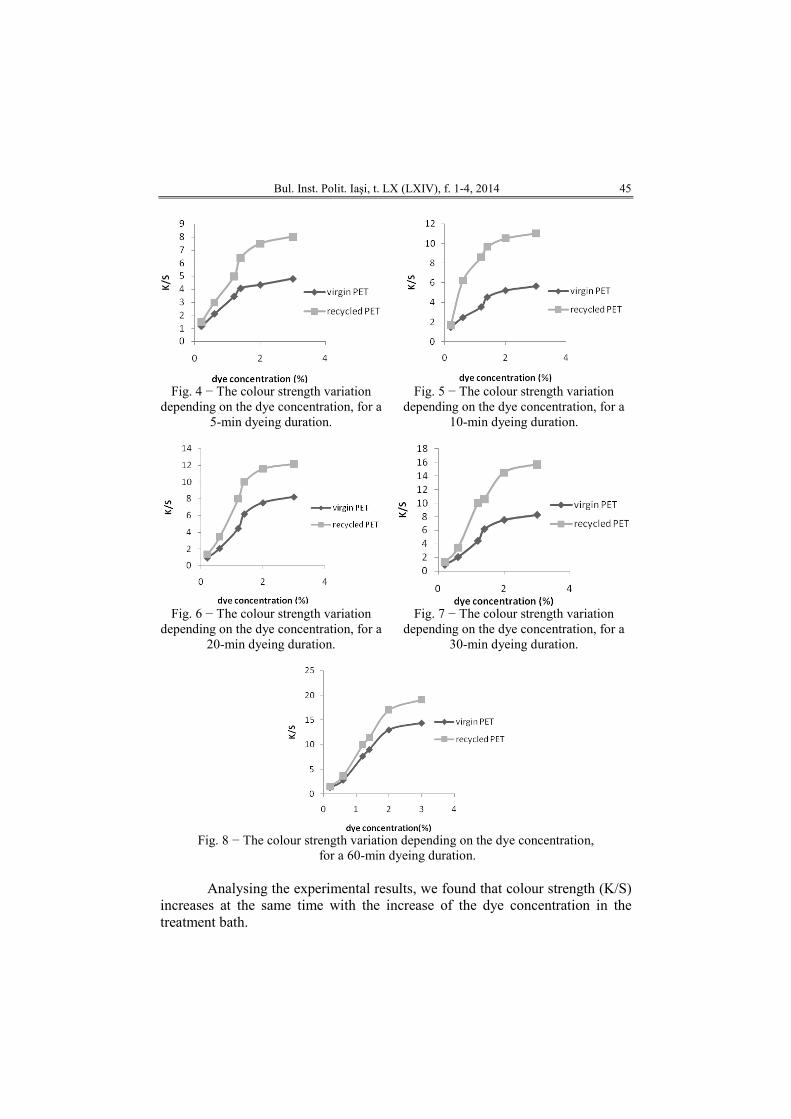
Bul. Inst. Polit. Iaşi, t. LX (LXIV), f. 1-4, 2014 45
Fig. 4 − The colour strength variation
depending on the dye concentration, for a 5-min dyeing duration.
Fig. 5 − The colour strength variation depending on the dye concentration, for a
10-min dyeing duration.
Fig. 6 − The colour strength variation
depending on the dye concentration, for a 20-min dyeing duration.
Fig. 7 − The colour strength variation depending on the dye concentration, for a
30-min dyeing duration.
Fig. 8 − The colour strength variation depending on the dye concentration,
for a 60-min dyeing duration. Analysing the experimental results, we found that colour strength (K/S)
increases at the same time with the increase of the dye concentration in the treatment bath.
46 Ovidiu Constandache et al.
The result produced by the comparative analysis of the tinctorial capacity displayed by the fibres derived from recycled PET and those derived from virgin PET indicates that recycled polyethylene terephthalate has a higher dyeing capacity.
4. Conclusions
According to the results obtained in this paper, the optimal duration of
polyetylentereftalat dyeing is 30 min. Increasing dyeing time over 30 min did not change significantly the quantity of dye fixed on the PET fibre.
Both chromatic analysis parameters (colour strength) and the amount of dye fixed on the fibre, showed that recycled polyethylene fibre is dyed more intensely than virgin PET.
REFERENCES
Cezar D.R., Colour Measurement (in Romanian). “Gheorghe Asachi” Technical
University Publishing House, Iaşi (2004). Grindea M., Hanganu A., Forst T., Textile Dyeing and Printing Technology (in
Romanian). Ed. Tehnical Publishing House, Bucureşti (1983). Pennarun P.Y. et al., Functional Barriers in PET Recycled Bottles. Part IL Diffusion of
Pollutants during Processing. Journal of Applied Polymer Science, 92, 2859−2870 (2004).
Puscas E.L., Cezar D.R., Introduction in the Theory of Colour and Colour Measurement
(in Romanian). Dosoftei Publishing House, Iaşi (1997). Puscas E.L., Colour Theory and Measurement (in Romanian). Rotaprint Publishing
House, Iaşi (1983). Torres N., Robin J.J., Boutevin B., Dyeing of Polyester, Aramid and Polypropylene
Fibres in Supercritical CO2. Journal of Applied Polymer Science, 79, 1816−1824 (2001).
ASPECTE PRIVIND ÎMBUNĂTĂłIREA CAPACITĂłII TINCTORIALE A FIBRELOR DIN PET VIRGIN ŞI RECICLAT
(Rezumat)
În acest studiu s-a analizat capacitatea tinctorială a fibrelor din poliester virgin
şi reciclat, vopsite cu colorantul Foron brilliant rot SGL (CI Disperse Red 121). Analiza elementală a arătat uşoare modificări. Astfel, conŃinutul de carbon al fibrelor de poliester reciclat este mai mare decât cel al fibrelor virgine de poliester. În acest studiu s-a determinat cantitatea de colorant fixat pe fibră pentru diferite condiŃii de vopsire. S-a analizat corelaŃia dintre cantitatea de colorant fixată pe fibră şi intensitatea culorii (K/S). Fibrele de poliester reciclat prezintă un grad mai mare de fixare a colorantului faŃă de fibrele de poliester virgin.
BULETINUL INSTITUTULUI POLITEHNIC DIN IAŞI Publicat de
Universitatea Tehnică „Gheorghe Asachi” din Iaşi Tomul LX (LXIV), Fasc. 1-4, 2014
SecŃia TEXTILE. PIELĂRIE
INNOVATIVE METHOD OF MODELLING SHOE LASTS
BY
MARIANA COSTEA and AURA MIHAI∗∗∗∗
“Gheorghe Asachi” Technical University of Iaşi, România,
Faculty of Textiles & Leather Engineering and Industrial Management
Received: March 11, 2014 Accepted for publication: September 8, 2014
Abstract. The last is the basic instrument both for the footwear
constructive design and for the footwear manufacturing process. The lasting process is done with the uppers on the last, so the shape and dimensions of the footwear will be given by the shape and dimensions of the last. Dimensional comfort when wearing a footwear product is determined by this correspondence between the foot and the interior space of the shoe. The virtual last can be obtained by scanning or digitizing a real one and data are saved in program's data base for their later use. 3D computer aided design techniques (3D CAD) enable direct modelling of footwear on the last, so even before the product is made, it can be analyzed in terms of aesthetic, functional, technological and economical criteria.
Keywords: last; foot; anthropometry; footwear.
1. Introduction
Footwear is more than a foot protective wrapper. Although it is
sometimes described as the intersection between the environment and the human body, enabling movement and experimenting the world, it also has a
∗Corresponding author; e-mail: [email protected]
This paper is the full version of the paper published in abstract at the Textiles of the Future ISKA, Iaşi, June, 2013
48 Mariana Costea and Aura Mihai
strong influence on the social and emotional aspects of our lives (Farrell & Simpson, 2003). Thereby, footwear has acquired different roles and has different meanings depending on the taste of individuals, on their national and professional identity, on their social status and so on (Williams & Nester, 2010). The design activity, pattern making and footwear product development have to meet market requirements expressed at a given time. Lately it was found that the level of comfort is prior to other shoe characteristics for the consumers, followed closely by high demands on quality and aesthetic functions. However, shoes must also fulfill orthopaedic, defense, physiology and hygiene functions. Given the increased, refined and specifically defined requirements of more and more consumers, the footwear industry had to resort to the automation of most sectors. Thus, from design to manufacturing, footwear producers have turned to various software that can produce quality products in terms of aesthetics as well as comfort, in a shorter period of time (Mihai et al., 2009; Ionesi et al., 2014). Revolutionary CAD/CAM systems are the next generation of solutions for computer-aided design and engineering for the shoe industry. Designed exclusively for use with the latest operating systems and environments, they provide the full range of utilities in dedicated packages which are among the most intuitive and easy to use, compared to the current products on the market (Păştină et al., 2011; Sarghie et al., 2013). Whether he uses 3D or 2D CAD systems, the user must take into account the criteria arising from the functions that footwear must meet (Savadkoohi & De Amicis, 2009).
2. Materials and Methods
3D computer aided design techniques (3D CAD) enable direct
modelling of the footwear on the last, so even before the product is made it can be analyzed in terms of aesthetic, functional, technological and economical criteria. Considering all these criteria and sub criteria in a hierarchical, structured way, will allow for the development of new collections, under the conditions of rapid production and meeting the needs and aspirations of consumers (Fujita & Yoshida, 2004; Driscu, 2010).
3D Shoe Design and Shoe Maker modules of DELCAM-Crispin integrated design system are software solutions designed for virtual models, starting from a 3D predefined shape, namely the last shape from the data base. The work facilities (sessions) of this software are made of useful instruments available to the designer who has the possibility of manipulating any model in the virtual space, for example: establishing the positioning lines and control points, flattening the three-dimensional surface of the model to obtain the patterns, visualizing the model by rotating it in various angles, the simultaneous view of two-dimensional designs (patterns, basic design) and the 3D model, the simultaneous opening of windows-work sessions.
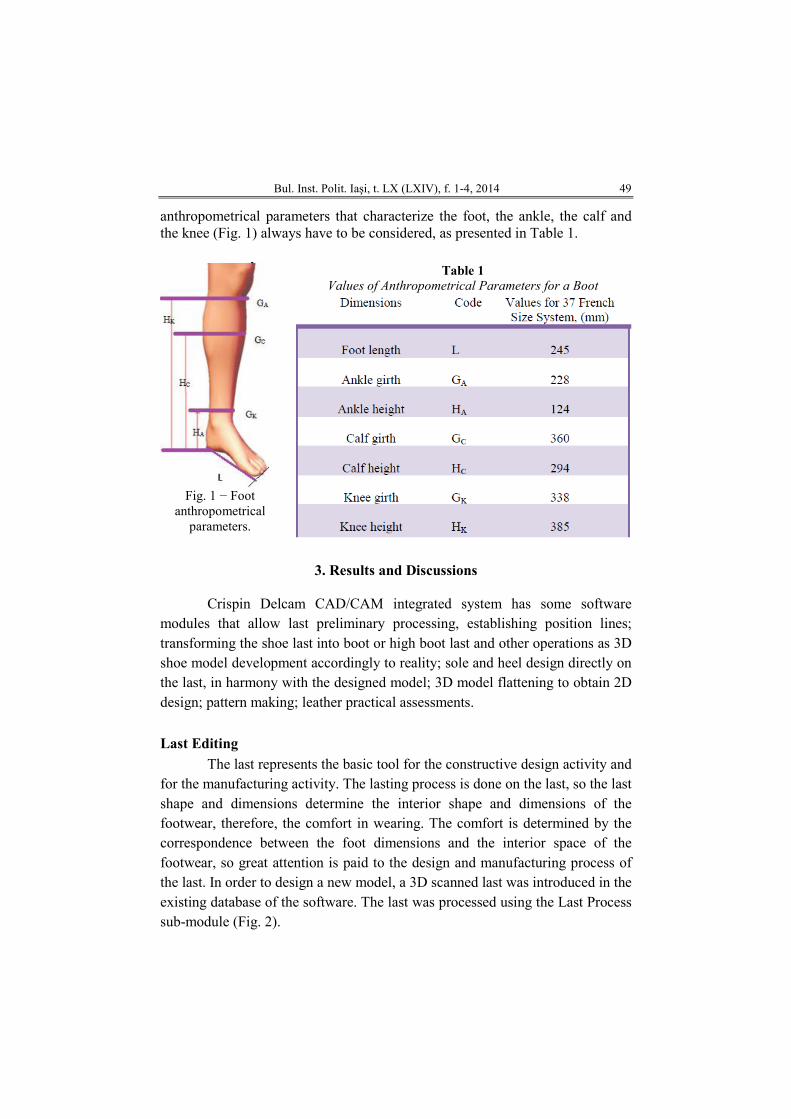
Regardless of the chosen design method, for a boot, in this case, the
Bul. Inst. Polit. Iaşi, t. LX (LXIV), f. 1-4, 2014 49
anthropometrical parameters that characterize the foot, the ankle, the calf and the knee (Fig. 1) always have to be considered, as presented in Table 1.
Fig. 1 − Foot
anthropometrical parameters.
Table 1
Values of Anthropometrical Parameters for a Boot
3. Results and Discussions
Crispin Delcam CAD/CAM integrated system has some software
modules that allow last preliminary processing, establishing position lines; transforming the shoe last into boot or high boot last and other operations as 3D shoe model development accordingly to reality; sole and heel design directly on the last, in harmony with the designed model; 3D model flattening to obtain 2D design; pattern making; leather practical assessments.
Last Editing
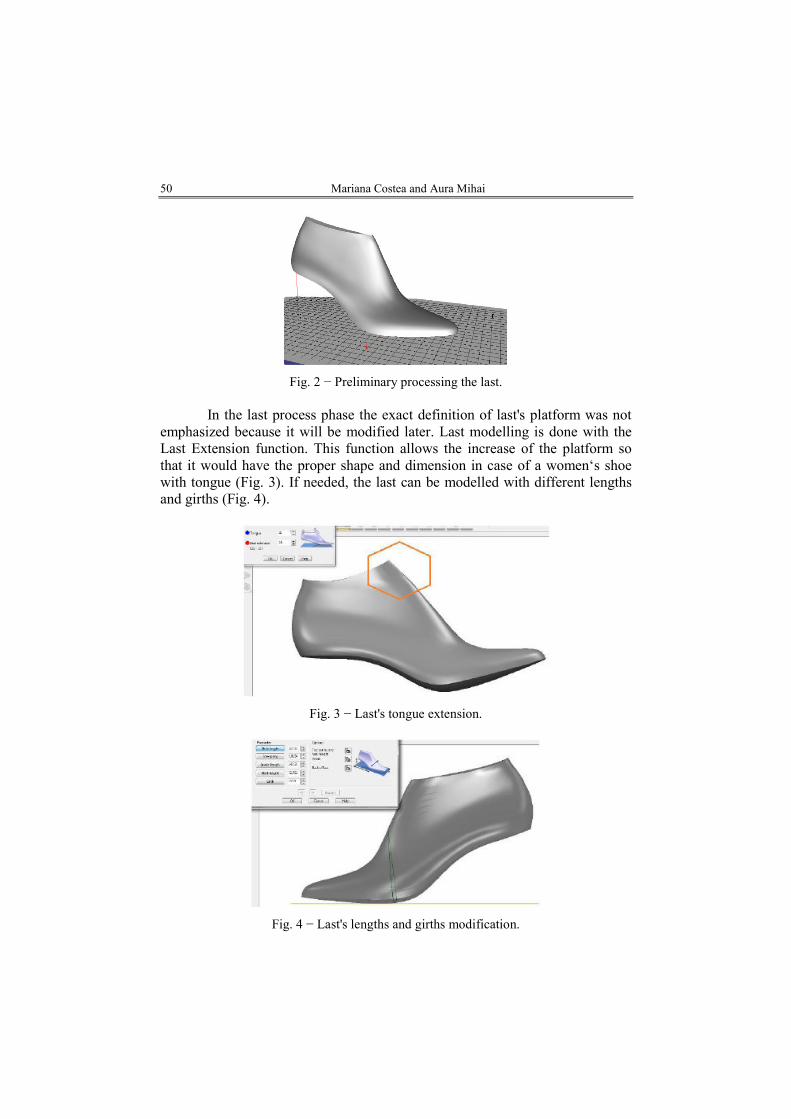
The last represents the basic tool for the constructive design activity and for the manufacturing activity. The lasting process is done on the last, so the last shape and dimensions determine the interior shape and dimensions of the footwear, therefore, the comfort in wearing. The comfort is determined by the correspondence between the foot dimensions and the interior space of the footwear, so great attention is paid to the design and manufacturing process of the last. In order to design a new model, a 3D scanned last was introduced in the existing database of the software. The last was processed using the Last Process sub-module (Fig. 2).
50 Mariana Costea and Aura Mihai
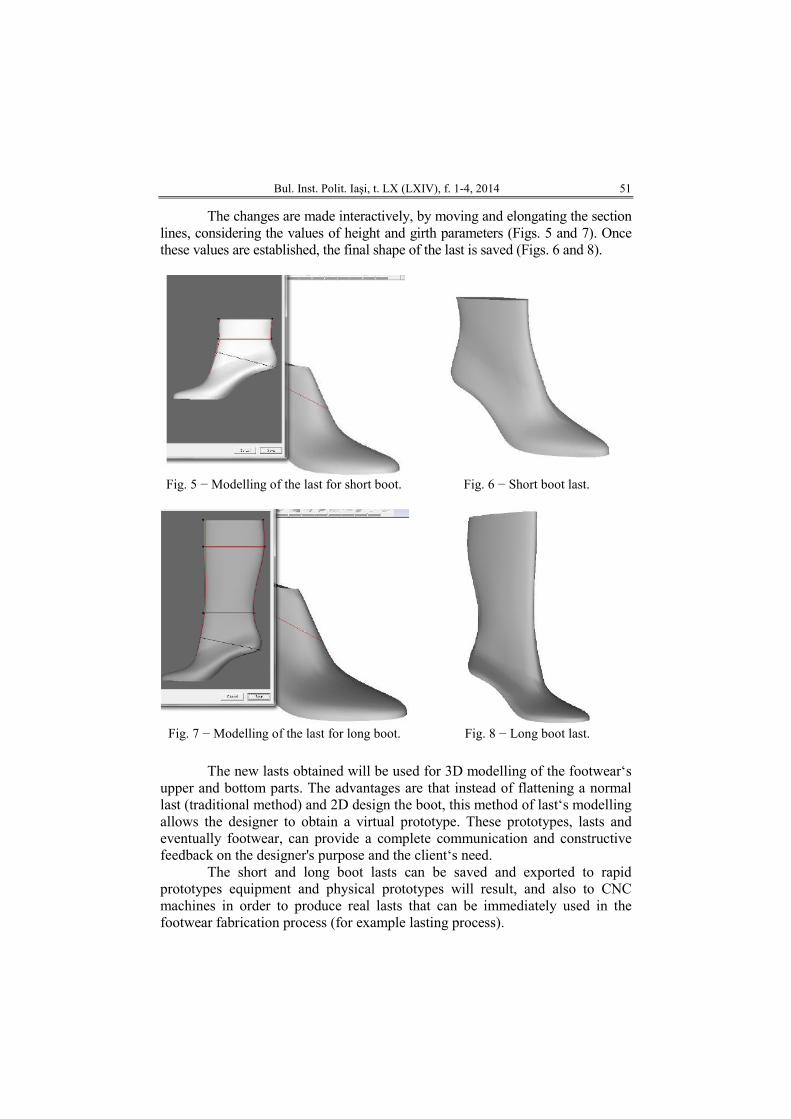
Fig. 2 − Preliminary processing the last. In the last process phase the exact definition of last's platform was not
emphasized because it will be modified later. Last modelling is done with the Last Extension function. This function allows the increase of the platform so that it would have the proper shape and dimension in case of a women‘s shoe with tongue (Fig. 3). If needed, the last can be modelled with different lengths and girths (Fig. 4).
Fig. 3 − Last's tongue extension.
Fig. 4 − Last's lengths and girths modification.
Bul. Inst. Polit. Iaşi, t. LX (LXIV), f. 1-4, 2014 51
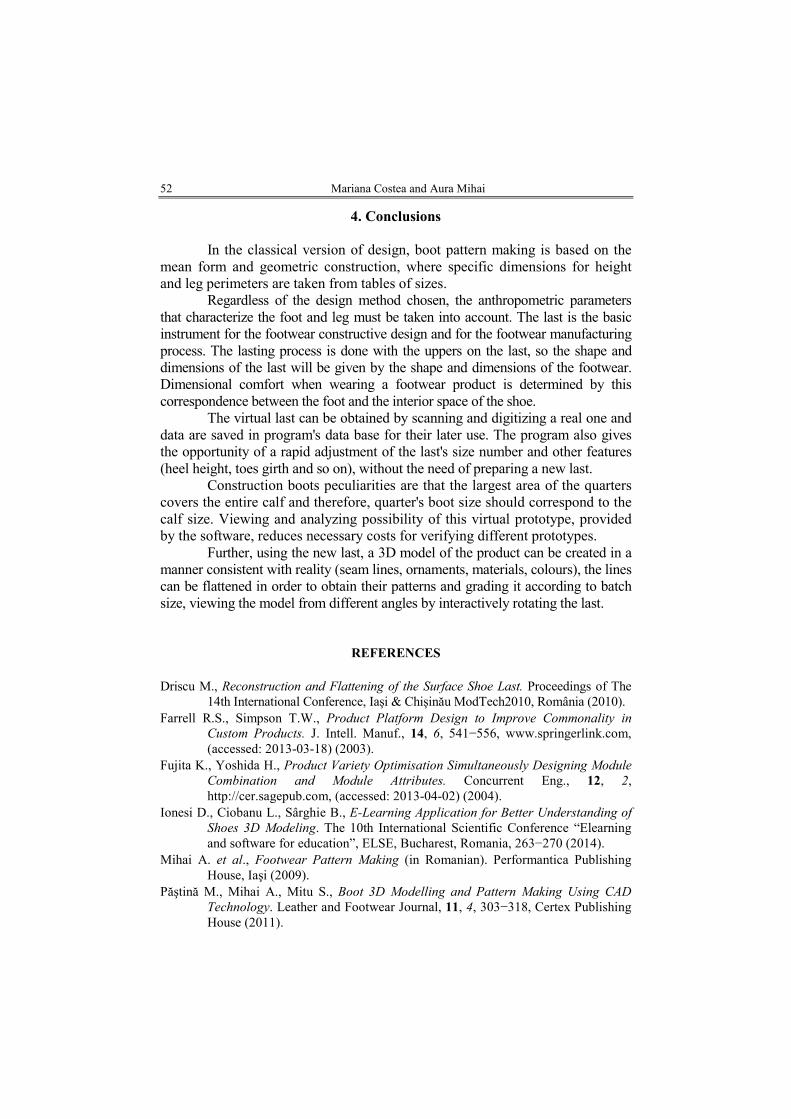
The changes are made interactively, by moving and elongating the section lines, considering the values of height and girth parameters (Figs. 5 and 7). Once these values are established, the final shape of the last is saved (Figs. 6 and 8).
Fig. 5 − Modelling of the last for short boot. Fig. 6 − Short boot last.
Fig. 7 − Modelling of the last for long boot. Fig. 8 − Long boot last.
The new lasts obtained will be used for 3D modelling of the footwear‘s
upper and bottom parts. The advantages are that instead of flattening a normal last (traditional method) and 2D design the boot, this method of last‘s modelling allows the designer to obtain a virtual prototype. These prototypes, lasts and eventually footwear, can provide a complete communication and constructive feedback on the designer's purpose and the client‘s need.
The short and long boot lasts can be saved and exported to rapid prototypes equipment and physical prototypes will result, and also to CNC machines in order to produce real lasts that can be immediately used in the footwear fabrication process (for example lasting process).
52 Mariana Costea and Aura Mihai
4. Conclusions
In the classical version of design, boot pattern making is based on the
mean form and geometric construction, where specific dimensions for height and leg perimeters are taken from tables of sizes.
Regardless of the design method chosen, the anthropometric parameters that characterize the foot and leg must be taken into account. The last is the basic instrument for the footwear constructive design and for the footwear manufacturing process. The lasting process is done with the uppers on the last, so the shape and dimensions of the last will be given by the shape and dimensions of the footwear. Dimensional comfort when wearing a footwear product is determined by this correspondence between the foot and the interior space of the shoe.
The virtual last can be obtained by scanning and digitizing a real one and data are saved in program's data base for their later use. The program also gives the opportunity of a rapid adjustment of the last's size number and other features (heel height, toes girth and so on), without the need of preparing a new last.
Construction boots peculiarities are that the largest area of the quarters covers the entire calf and therefore, quarter's boot size should correspond to the calf size. Viewing and analyzing possibility of this virtual prototype, provided by the software, reduces necessary costs for verifying different prototypes.
Further, using the new last, a 3D model of the product can be created in a manner consistent with reality (seam lines, ornaments, materials, colours), the lines can be flattened in order to obtain their patterns and grading it according to batch size, viewing the model from different angles by interactively rotating the last.
REFERENCES
Driscu M., Reconstruction and Flattening of the Surface Shoe Last. Proceedings of The
14th International Conference, Iaşi & Chişinău ModTech2010, România (2010). Farrell R.S., Simpson T.W., Product Platform Design to Improve Commonality in
Custom Products. J. Intell. Manuf., 14, 6, 541−556, www.springerlink.com, (accessed: 2013-03-18) (2003).
Fujita K., Yoshida H., Product Variety Optimisation Simultaneously Designing Module Combination and Module Attributes. Concurrent Eng., 12, 2, http://cer.sagepub.com, (accessed: 2013-04-02) (2004).
Ionesi D., Ciobanu L., Sârghie B., E-Learning Application for Better Understanding of Shoes 3D Modeling. The 10th International Scientific Conference “Elearning and software for education”, ELSE, Bucharest, Romania, 263−270 (2014).
Mihai A. et al., Footwear Pattern Making (in Romanian). Performantica Publishing House, Iaşi (2009).
Păştină M., Mihai A., Mitu S., Boot 3D Modelling and Pattern Making Using CAD Technology. Leather and Footwear Journal, 11, 4, 303−318, Certex Publishing House (2011).
Bul. Inst. Polit. Iaşi, t. LX (LXIV), f. 1-4, 2014 53
Sarghie B., Costea M., Mihai A., 3D Modelling of Shoe Lasts Using Templates Based on Anthropometrical Measurements of the Foot – Case Study. Leather and Footwear Journal, 13, 3, 221−234, Certex Publishing House (2013).
Savadkoohi B.T., De Amicis R., A CAD System for Evaluating Footwear Fit. Multimedia, Computer Graphics and Broadcasting Communications in Computer and Information Science, 60, www.springerlink.com, (accessed: 2013-03-11) (2009).
Williams A., Nester C., Evolution of Footwear Design and Purpose, Pocket Podiatry: Footwear and Foot Orthoses. 57-67, www.sciencedirect.com, (accessed: 2013-02-21) (2010).
METODĂ INOVATIVĂ DE MODELARE A CALAPOADELOR PENTRU ÎNCĂLłĂMINTE
(Rezumat)
Calapodul este instrumentul de bază atât la proiectarea constructivă, cât şi în
procesul de fabricare a încălŃămintei. Procesul de formare spaŃială şi structurare se face cu ansamblul superior montat pe calapod, astfel încât dimensiunile încălŃămintei să corespundă formei şi dimensiunii calapodului. Confortul dimensional la purtarea unui produs de încălŃăminte este determinat de corespondenŃa dintre picior şi spaŃiul interior al pantofului. Calapodul virtual poate fi obŃinut prin scanarea sau digitizarea unui calapod fizic, informaŃiile despre acesta fiind salvate într-o bază de date pentru a fi folosite ulterior. Tehnicile 3D de proiectare asistată de calculator (CAD 3D) permit modelarea încălŃămintei direct pe calapod, putând fi astfel analizat produsul chiar înainte de a fi realizat, din punct de vedere estetic, funcŃional, tehnologic şi economic.

BULETINUL INSTITUTULUI POLITEHNIC DIN IAŞI Publicat de
Universitatea Tehnică „Gheorghe Asachi” din Iaşi Tomul LX (LXIV), Fasc. 1-4, 2014
SecŃia TEXTILE. PIELĂRIE
REPRESENTATION METHOD FOR THE KNITTED
STRUCTURES USING A PERSONAL COMPUTER
BY
DORIN DAN∗
“Gheorghe Asachi” Technical University of Iaşi, România,
Faculty of Textiles & Leather Engineering and Industrial Management
Received: April 23, 2014 Accepted for publication: June 20, 2014
Abstract. The representation of the knitted structures is very difficult and
elaborate. In this paper, the possibility of using the CorelDRAW application for representing knitted structures using a personal computer will be presented. We have created all knitted structural elements as symbols for: face and reverse stitch, tuck stitch, face and reverse float, transferring elements, cast-off loop. The symbols were created and can be stored in library files. The aim is to create teaching tools for drawing used in universities and secondary technical schools.
Keywords: fabric knitted structure; symbols representation system; CorelDRAW symbols.
1. Introduction
In knitting technology, the most visually accurate way of
communication is to draw the full loop structure. Accurate drawing however, is very complicated and time consuming. It
usually requires much practice and long experience to be descriptive and
∗ Corresponding author; e-mail: [email protected] This paper is the full version of the paper published in abstract at the Textiles of the
Future ISKA, Iaşi, June, 2013
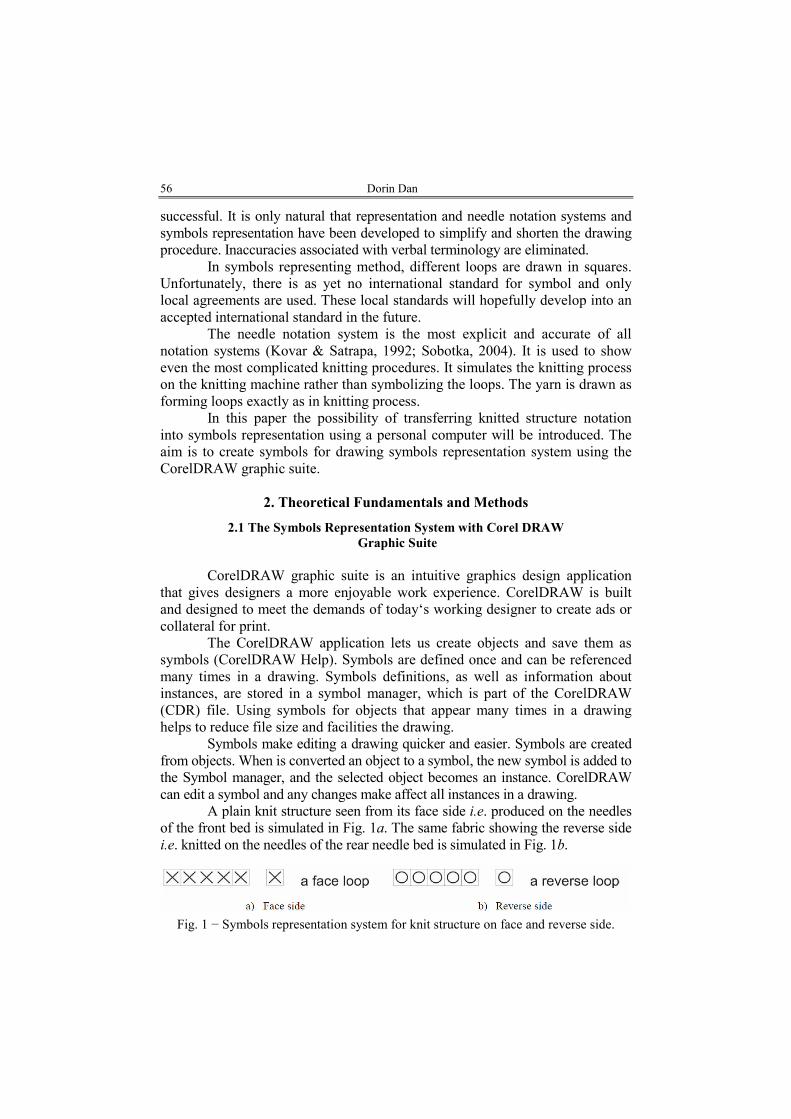
56 Dorin Dan
successful. It is only natural that representation and needle notation systems and symbols representation have been developed to simplify and shorten the drawing procedure. Inaccuracies associated with verbal terminology are eliminated.
In symbols representing method, different loops are drawn in squares. Unfortunately, there is as yet no international standard for symbol and only local agreements are used. These local standards will hopefully develop into an accepted international standard in the future.
The needle notation system is the most explicit and accurate of all notation systems (Kovar & Satrapa, 1992; Sobotka, 2004). It is used to show even the most complicated knitting procedures. It simulates the knitting process on the knitting machine rather than symbolizing the loops. The yarn is drawn as forming loops exactly as in knitting process.
In this paper the possibility of transferring knitted structure notation into symbols representation using a personal computer will be introduced. The aim is to create symbols for drawing symbols representation system using the CorelDRAW graphic suite.
2. Theoretical Fundamentals and Methods
2.1 The Symbols Representation System with Corel DRAW
Graphic Suite
CorelDRAW graphic suite is an intuitive graphics design application
that gives designers a more enjoyable work experience. CorelDRAW is built and designed to meet the demands of today‘s working designer to create ads or collateral for print.
The CorelDRAW application lets us create objects and save them as symbols (CorelDRAW Help). Symbols are defined once and can be referenced many times in a drawing. Symbols definitions, as well as information about instances, are stored in a symbol manager, which is part of the CorelDRAW (CDR) file. Using symbols for objects that appear many times in a drawing helps to reduce file size and facilities the drawing.
Symbols make editing a drawing quicker and easier. Symbols are created from objects. When is converted an object to a symbol, the new symbol is added to the Symbol manager, and the selected object becomes an instance. CorelDRAW can edit a symbol and any changes make affect all instances in a drawing.
A plain knit structure seen from its face side i.e. produced on the needles of the front bed is simulated in Fig. 1a. The same fabric showing the reverse side i.e. knitted on the needles of the rear needle bed is simulated in Fig. 1b.
Fig. 1 − Symbols representation system for knit structure on face and reverse side.
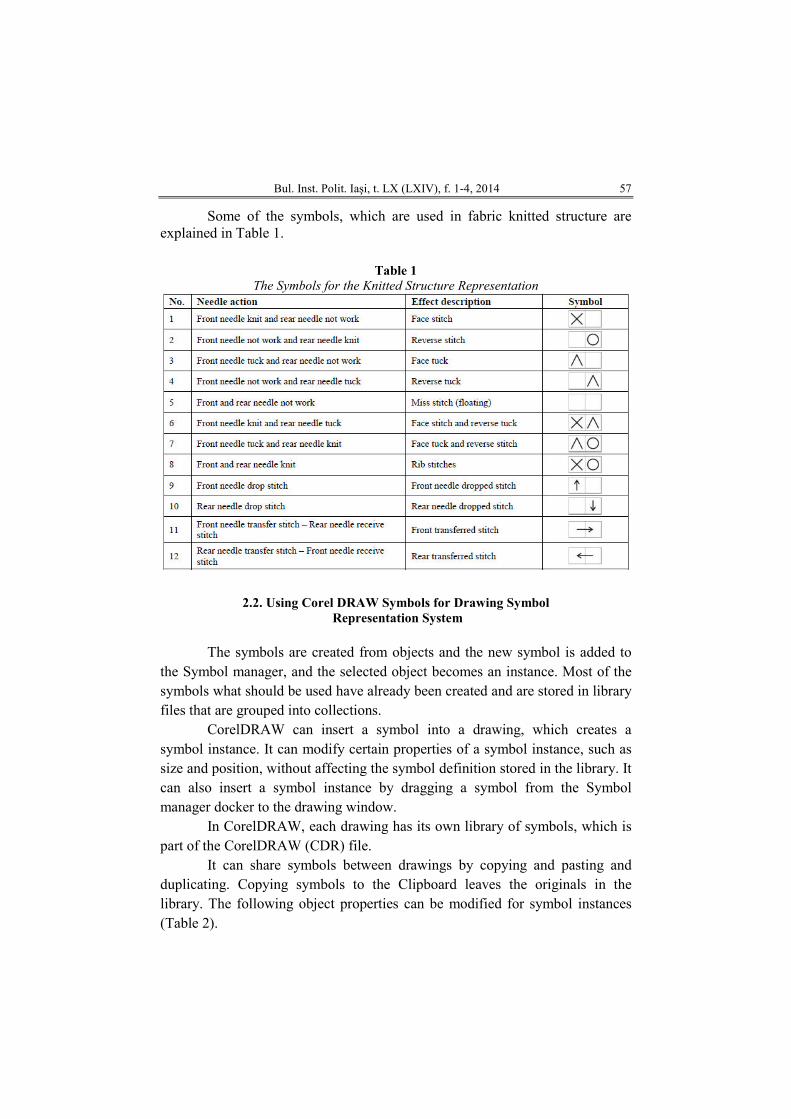
Bul. Inst. Polit. Iaşi, t. LX (LXIV), f. 1-4, 2014 57
Some of the symbols, which are used in fabric knitted structure are explained in Table 1.
Table 1
The Symbols for the Knitted Structure Representation
2.2. Using Corel DRAW Symbols for Drawing Symbol
Representation System
The symbols are created from objects and the new symbol is added to
the Symbol manager, and the selected object becomes an instance. Most of the symbols what should be used have already been created and are stored in library files that are grouped into collections.
CorelDRAW can insert a symbol into a drawing, which creates a symbol instance. It can modify certain properties of a symbol instance, such as size and position, without affecting the symbol definition stored in the library. It can also insert a symbol instance by dragging a symbol from the Symbol manager docker to the drawing window.
In CorelDRAW, each drawing has its own library of symbols, which is part of the CorelDRAW (CDR) file.
It can share symbols between drawings by copying and pasting and duplicating. Copying symbols to the Clipboard leaves the originals in the library. The following object properties can be modified for symbol instances (Table 2).
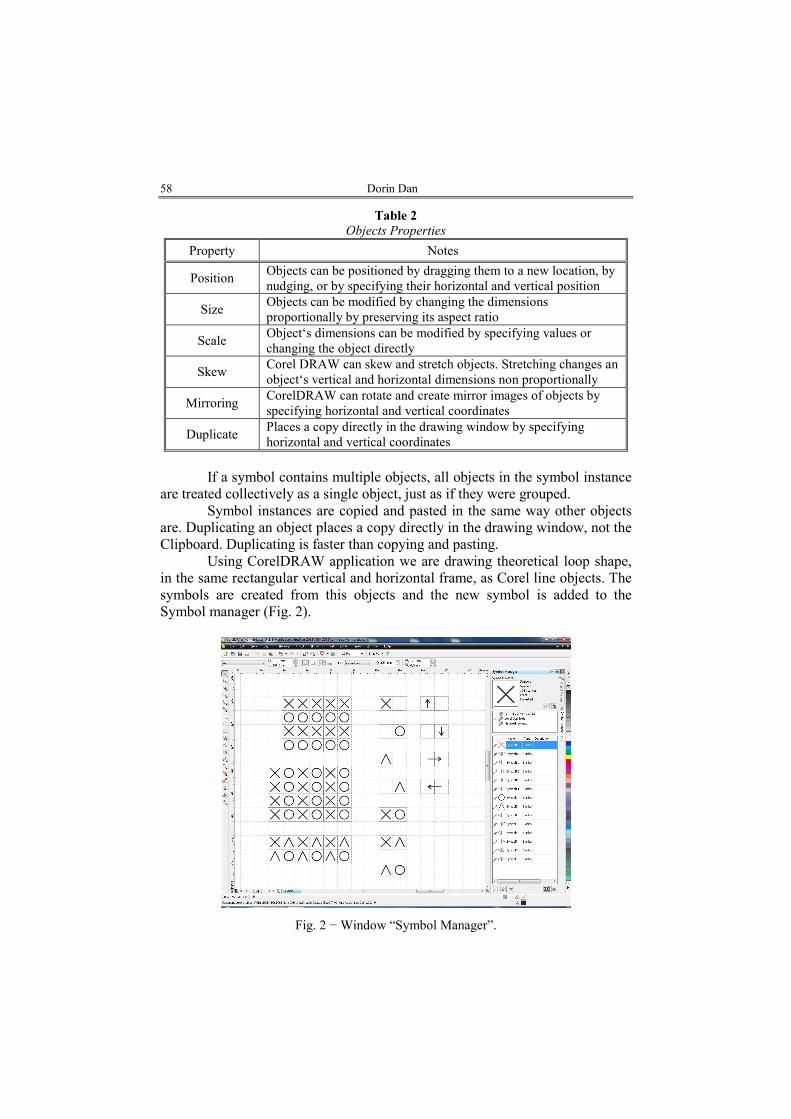
58 Dorin Dan
Table 2
Objects Properties
Property Notes
Position Objects can be positioned by dragging them to a new location, by nudging, or by specifying their horizontal and vertical position
Size Objects can be modified by changing the dimensions proportionally by preserving its aspect ratio
Scale Object‘s dimensions can be modified by specifying values or changing the object directly
Skew Corel DRAW can skew and stretch objects. Stretching changes an object‘s vertical and horizontal dimensions non proportionally
Mirroring CorelDRAW can rotate and create mirror images of objects by specifying horizontal and vertical coordinates
Duplicate Places a copy directly in the drawing window by specifying horizontal and vertical coordinates
If a symbol contains multiple objects, all objects in the symbol instance
are treated collectively as a single object, just as if they were grouped. Symbol instances are copied and pasted in the same way other objects
are. Duplicating an object places a copy directly in the drawing window, not the Clipboard. Duplicating is faster than copying and pasting.
Using CorelDRAW application we are drawing theoretical loop shape, in the same rectangular vertical and horizontal frame, as Corel line objects. The symbols are created from this objects and the new symbol is added to the Symbol manager (Fig. 2).
Fig. 2 − Window “Symbol Manager”.
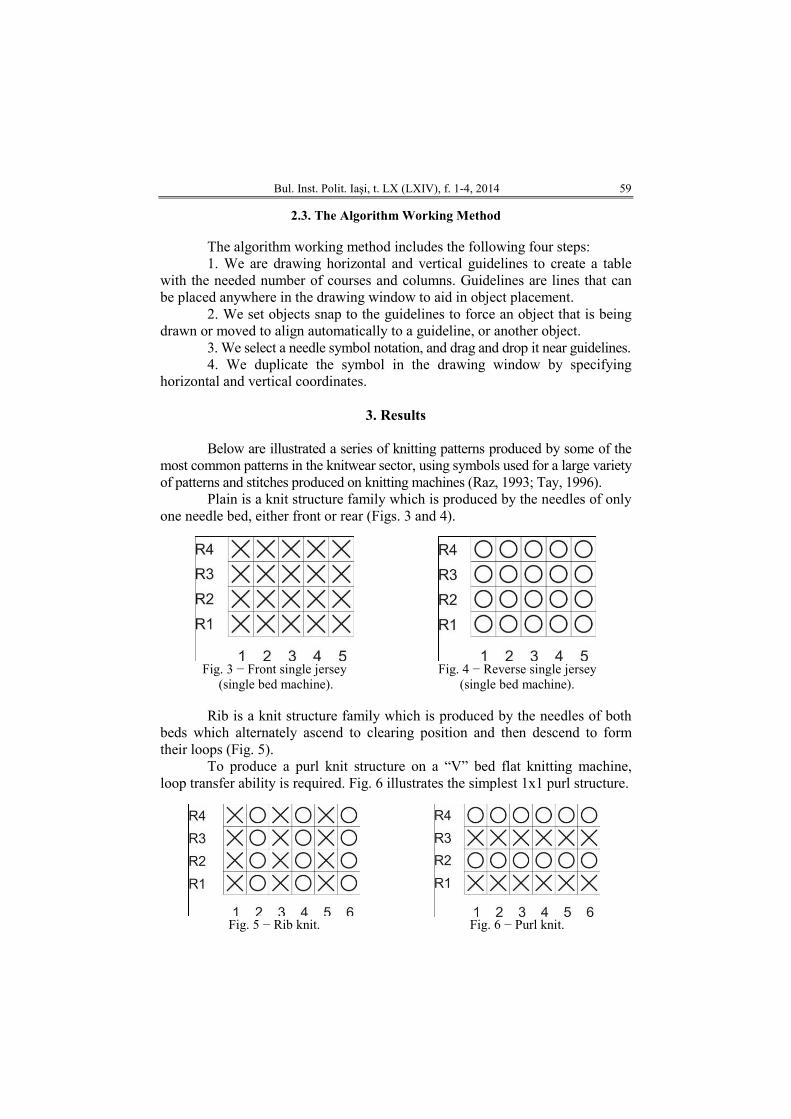
Bul. Inst. Polit. Iaşi, t. LX (LXIV), f. 1-4, 2014 59
2.3. The Algorithm Working Method
The algorithm working method includes the following four steps: 1. We are drawing horizontal and vertical guidelines to create a table
with the needed number of courses and columns. Guidelines are lines that can be placed anywhere in the drawing window to aid in object placement.
2. We set objects snap to the guidelines to force an object that is being drawn or moved to align automatically to a guideline, or another object.
3. We select a needle symbol notation, and drag and drop it near guidelines. 4. We duplicate the symbol in the drawing window by specifying
horizontal and vertical coordinates.
3. Results
Below are illustrated a series of knitting patterns produced by some of the
most common patterns in the knitwear sector, using symbols used for a large variety of patterns and stitches produced on knitting machines (Raz, 1993; Tay, 1996).
Plain is a knit structure family which is produced by the needles of only one needle bed, either front or rear (Figs. 3 and 4).
Fig. 3 − Front single jersey
(single bed machine). Fig. 4 − Reverse single jersey
(single bed machine). Rib is a knit structure family which is produced by the needles of both
beds which alternately ascend to clearing position and then descend to form their loops (Fig. 5).
To produce a purl knit structure on a “V” bed flat knitting machine, loop transfer ability is required. Fig. 6 illustrates the simplest 1x1 purl structure.
Fig. 5 − Rib knit. Fig. 6 − Purl knit.
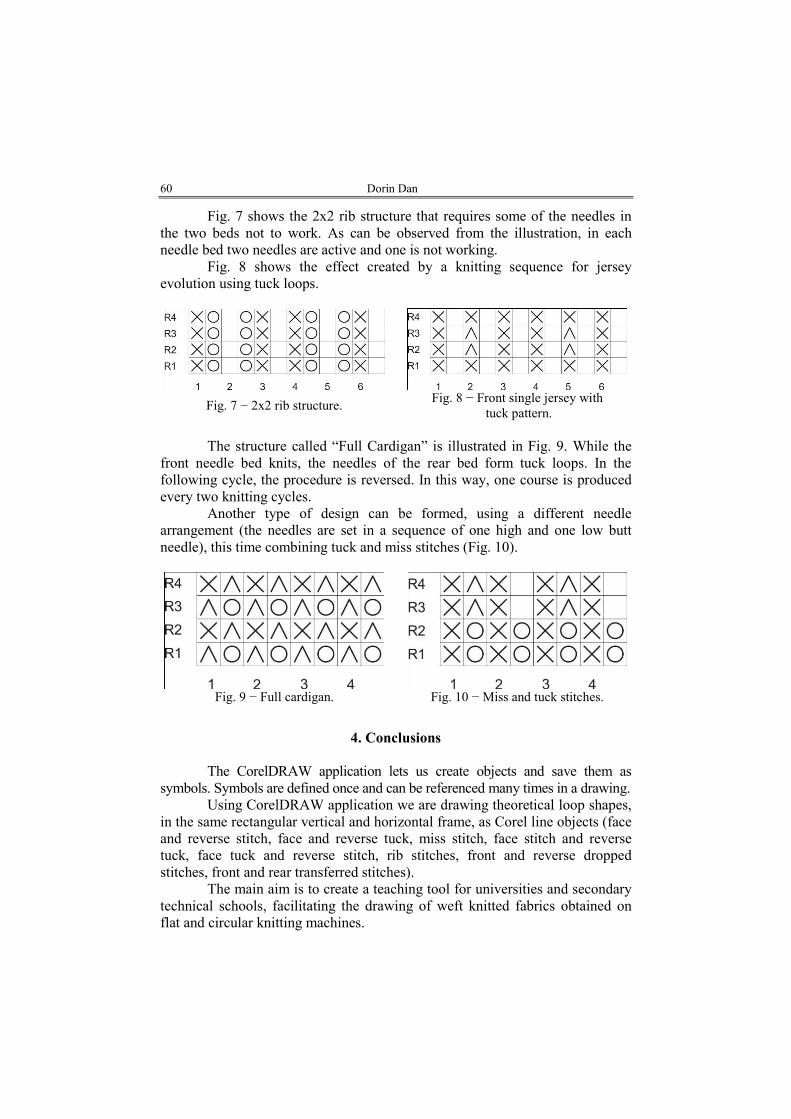
60 Dorin Dan
Fig. 7 shows the 2x2 rib structure that requires some of the needles in the two beds not to work. As can be observed from the illustration, in each needle bed two needles are active and one is not working.
Fig. 8 shows the effect created by a knitting sequence for jersey evolution using tuck loops.
Fig. 7 − 2x2 rib structure. Fig. 8 − Front single jersey with
tuck pattern. The structure called “Full Cardigan” is illustrated in Fig. 9. While the
front needle bed knits, the needles of the rear bed form tuck loops. In the following cycle, the procedure is reversed. In this way, one course is produced every two knitting cycles.
Another type of design can be formed, using a different needle arrangement (the needles are set in a sequence of one high and one low butt needle), this time combining tuck and miss stitches (Fig. 10).
Fig. 9 − Full cardigan. Fig. 10 − Miss and tuck stitches.
4. Conclusions
The CorelDRAW application lets us create objects and save them as
symbols. Symbols are defined once and can be referenced many times in a drawing. Using CorelDRAW application we are drawing theoretical loop shapes,
in the same rectangular vertical and horizontal frame, as Corel line objects (face and reverse stitch, face and reverse tuck, miss stitch, face stitch and reverse tuck, face tuck and reverse stitch, rib stitches, front and reverse dropped stitches, front and rear transferred stitches).
The main aim is to create a teaching tool for universities and secondary technical schools, facilitating the drawing of weft knitted fabrics obtained on flat and circular knitting machines.
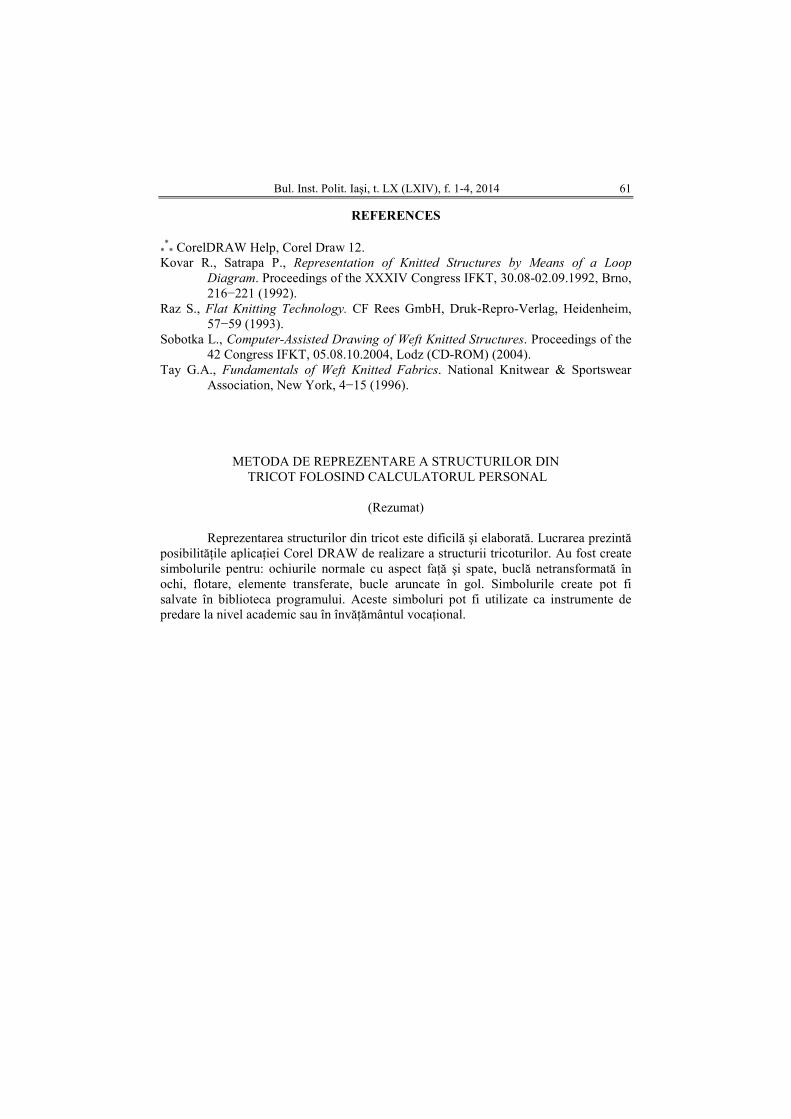
Bul. Inst. Polit. Iaşi, t. LX (LXIV), f. 1-4, 2014 61
REFERENCES
*** CorelDRAW Help, Corel Draw 12.
Kovar R., Satrapa P., Representation of Knitted Structures by Means of a Loop
Diagram. Proceedings of the XXXIV Congress IFKT, 30.08-02.09.1992, Brno, 216−221 (1992).
Raz S., Flat Knitting Technology. CF Rees GmbH, Druk-Repro-Verlag, Heidenheim, 57−59 (1993).
Sobotka L., Computer-Assisted Drawing of Weft Knitted Structures. Proceedings of the 42 Congress IFKT, 05.08.10.2004, Lodz (CD-ROM) (2004).
Tay G.A., Fundamentals of Weft Knitted Fabrics. National Knitwear & Sportswear Association, New York, 4−15 (1996).
METODA DE REPREZENTARE A STRUCTURILOR DIN TRICOT FOLOSIND CALCULATORUL PERSONAL
(Rezumat)
Reprezentarea structurilor din tricot este dificilă şi elaborată. Lucrarea prezintă
posibilităŃile aplicaŃiei Corel DRAW de realizare a structurii tricoturilor. Au fost create simbolurile pentru: ochiurile normale cu aspect faŃă şi spate, buclă netransformată în ochi, flotare, elemente transferate, bucle aruncate în gol. Simbolurile create pot fi salvate în biblioteca programului. Aceste simboluri pot fi utilizate ca instrumente de predare la nivel academic sau în învăŃământul vocaŃional.

BULETINUL INSTITUTULUI POLITEHNIC DIN IAŞI Publicat de
Universitatea Tehnică „Gheorghe Asachi” din Iaşi Tomul LX (LXIV), Fasc. 1-4, 2014
SecŃia TEXTILE. PIELĂRIE
RESEARCH ON THE EVOLVING NATURE OF
ANTHROPOMETRIC SIZES CHARACTERIZING ROMANIAN
CHILDREN POPULATION
BY
EMILIA FILIPESCU1,∗∗∗∗, CLAUDIA NICULESCU
2, SABINA OLARU
2,
ADRIAN SALISTEAN2 and ELENA SPINACHI
1“Gheorghe Asachi” Technical University of Iaşi, România,
Faculty of Textiles & Leather Engineering and Industrial Management 2 National R&D Institute for Textiles and Leather, Bucharest
3 SC Gemini CAD Systems SRL, Iasi
Received: February 10, 2014 Accepted for publication: July 14, 2014
Abstract. Primary database, resulting from anthropometric survey
conducted in 2010 in Romania, using 3D scanning system for the population of children allowed their morphological characterization by age, necessary in clothing. Within the research, evaluation indexes of proportion have been proposed and studied by one-dimensional statistical analysis, such as anterior-posterior balance and perimeters by age groups, results that allowed comparisons with similar data provided by anthropometric surveys conducted in different countries of European community.
Results of the study are practical arguments for the anthropometric standard developed in Romania, in 2011 that regulate bodies’ type system for population aged 6 to 19. Values of partial proportions indexes resulting from research can be used in dimensioning the baselines for clothing with shoulders or waist support, respectively for children, adolescents and youth.
Keywords: body; proportion; index; children.
∗ Corresponding author; e-mail: [email protected]
This paper is the full version of the paper published in abstract at the Textiles of the Future ISKA, Iaşi, June, 2013
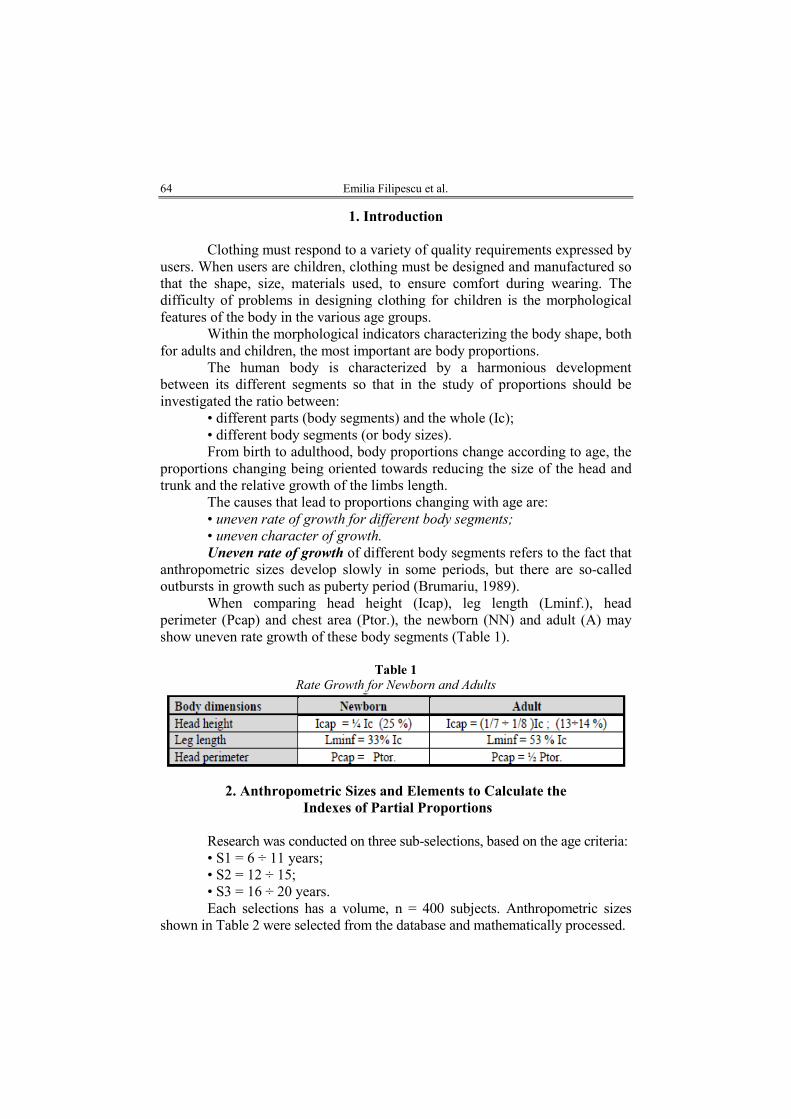
64 Emilia Filipescu et al.
1. Introduction
Clothing must respond to a variety of quality requirements expressed by
users. When users are children, clothing must be designed and manufactured so that the shape, size, materials used, to ensure comfort during wearing. The difficulty of problems in designing clothing for children is the morphological features of the body in the various age groups.
Within the morphological indicators characterizing the body shape, both for adults and children, the most important are body proportions.
The human body is characterized by a harmonious development between its different segments so that in the study of proportions should be investigated the ratio between:
• different parts (body segments) and the whole (Ic); • different body segments (or body sizes). From birth to adulthood, body proportions change according to age, the
proportions changing being oriented towards reducing the size of the head and trunk and the relative growth of the limbs length.
The causes that lead to proportions changing with age are: • uneven rate of growth for different body segments;
• uneven character of growth.
Uneven rate of growth of different body segments refers to the fact that anthropometric sizes develop slowly in some periods, but there are so-called outbursts in growth such as puberty period (Brumariu, 1989).
When comparing head height (Icap), leg length (Lminf.), head perimeter (Pcap) and chest area (Ptor.), the newborn (NN) and adult (A) may show uneven rate growth of these body segments (Table 1).
Table 1
Rate Growth for Newborn and Adults
2. Anthropometric Sizes and Elements to Calculate the
Indexes of Partial Proportions
Research was conducted on three sub-selections, based on the age criteria: • S1 = 6 ÷ 11 years; • S2 = 12 ÷ 15; • S3 = 16 ÷ 20 years. Each selections has a volume, n = 400 subjects. Anthropometric sizes
shown in Table 2 were selected from the database and mathematically processed.
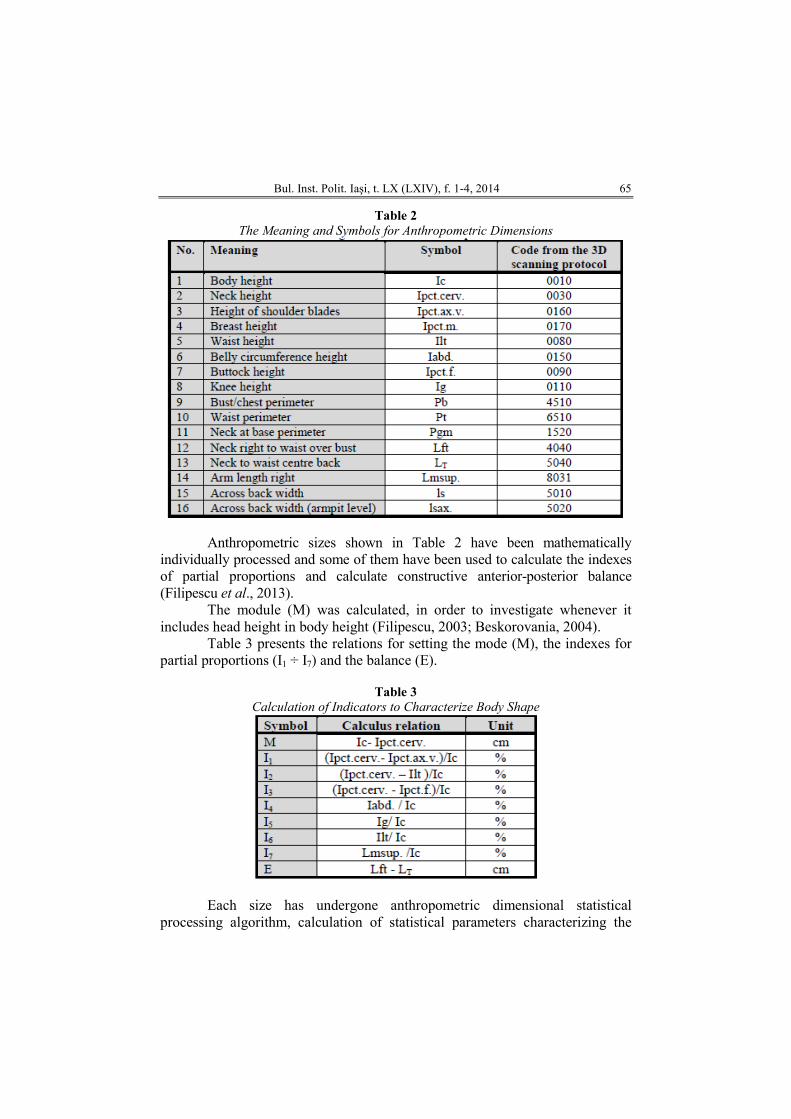
Bul. Inst. Polit. Iaşi, t. LX (LXIV), f. 1-4, 2014 65
Table 2
The Meaning and Symbols for Anthropometric Dimensions
Anthropometric sizes shown in Table 2 have been mathematically individually processed and some of them have been used to calculate the indexes of partial proportions and calculate constructive anterior-posterior balance (Filipescu et al., 2013).
The module (M) was calculated, in order to investigate whenever it includes head height in body height (Filipescu, 2003; Beskorovania, 2004).
Table 3 presents the relations for setting the mode (M), the indexes for partial proportions (I1 ÷ I7) and the balance (E).
Table 3
Calculation of Indicators to Characterize Body Shape
Each size has undergone anthropometric dimensional statistical
processing algorithm, calculation of statistical parameters characterizing the
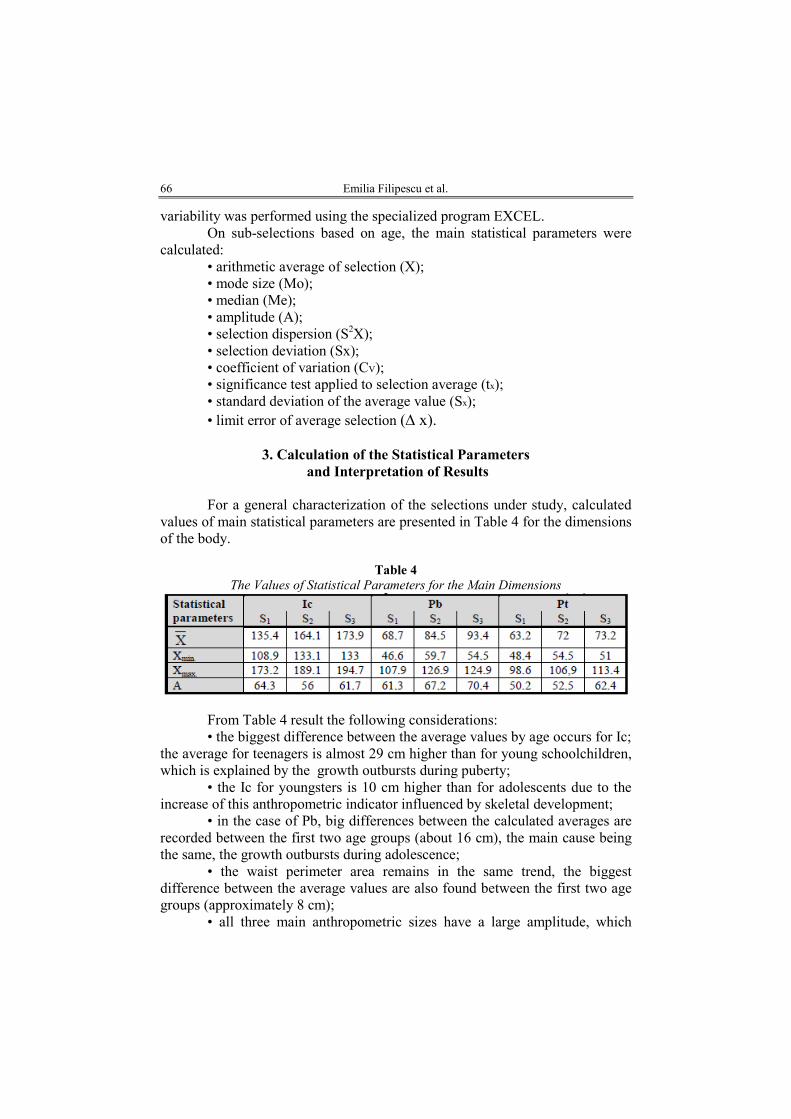
66 Emilia Filipescu et al.
variability was performed using the specialized program EXCEL. On sub-selections based on age, the main statistical parameters were
calculated: • arithmetic average of selection (X); • mode size (Mo); • median (Me); • amplitude (A); • selection dispersion (S2X); • selection deviation (Sx); • coefficient of variation (CV); • significance test applied to selection average (tx); • standard deviation of the average value (Sx); • limit error of average selection (∆ x).
3. Calculation of the Statistical Parameters
and Interpretation of Results
For a general characterization of the selections under study, calculated
values of main statistical parameters are presented in Table 4 for the dimensions of the body.
Table 4
The Values of Statistical Parameters for the Main Dimensions
From Table 4 result the following considerations: • the biggest difference between the average values by age occurs for Ic;
the average for teenagers is almost 29 cm higher than for young schoolchildren, which is explained by the growth outbursts during puberty;
• the Ic for youngsters is 10 cm higher than for adolescents due to the increase of this anthropometric indicator influenced by skeletal development;
• in the case of Pb, big differences between the calculated averages are recorded between the first two age groups (about 16 cm), the main cause being the same, the growth outbursts during adolescence;
• the waist perimeter area remains in the same trend, the biggest difference between the average values are also found between the first two age groups (approximately 8 cm);
• all three main anthropometric sizes have a large amplitude, which
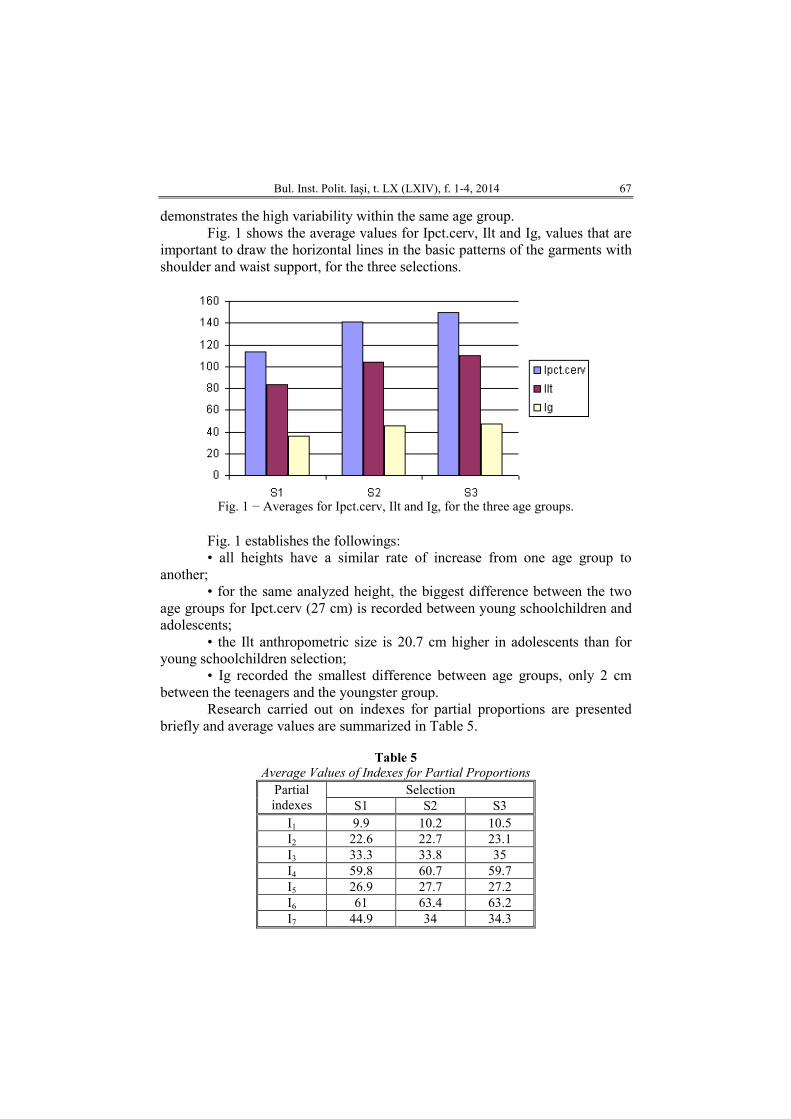
Bul. Inst. Polit. Iaşi, t. LX (LXIV), f. 1-4, 2014 67
demonstrates the high variability within the same age group. Fig. 1 shows the average values for Ipct.cerv, Ilt and Ig, values that are
important to draw the horizontal lines in the basic patterns of the garments with shoulder and waist support, for the three selections.
Fig. 1 − Averages for Ipct.cerv, Ilt and Ig, for the three age groups.
Fig. 1 establishes the followings: • all heights have a similar rate of increase from one age group to
another; • for the same analyzed height, the biggest difference between the two
age groups for Ipct.cerv (27 cm) is recorded between young schoolchildren and adolescents;
• the Ilt anthropometric size is 20.7 cm higher in adolescents than for young schoolchildren selection;
• Ig recorded the smallest difference between age groups, only 2 cm between the teenagers and the youngster group.
Research carried out on indexes for partial proportions are presented briefly and average values are summarized in Table 5.
Table 5
Average Values of Indexes for Partial Proportions
Selection Partial indexes S1 S2 S3
I1 9.9 10.2 10.5 I2 22.6 22.7 23.1 I3 33.3 33.8 35 I4 59.8 60.7 59.7 I5 26.9 27.7 27.2 I6 61 63.4 63.2 I7 44.9 34 34.3
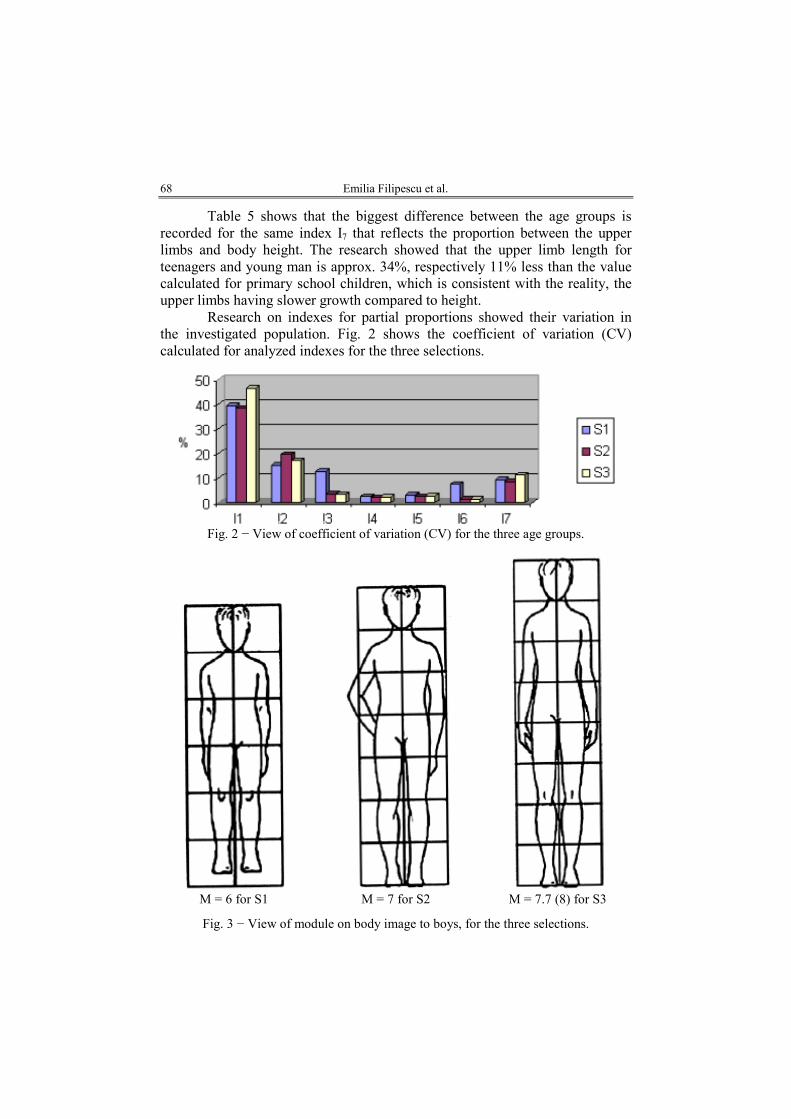
68 Emilia Filipescu et al.
Table 5 shows that the biggest difference between the age groups is recorded for the same index I7 that reflects the proportion between the upper limbs and body height. The research showed that the upper limb length for teenagers and young man is approx. 34%, respectively 11% less than the value calculated for primary school children, which is consistent with the reality, the upper limbs having slower growth compared to height.
Research on indexes for partial proportions showed their variation in the investigated population. Fig. 2 shows the coefficient of variation (CV) calculated for analyzed indexes for the three selections.
Fig. 2 − View of coefficient of variation (CV) for the three age groups.
M = 6 for S1 M = 7 for S2 M = 7.7 (8) for S3
Fig. 3 − View of module on body image to boys, for the three selections.
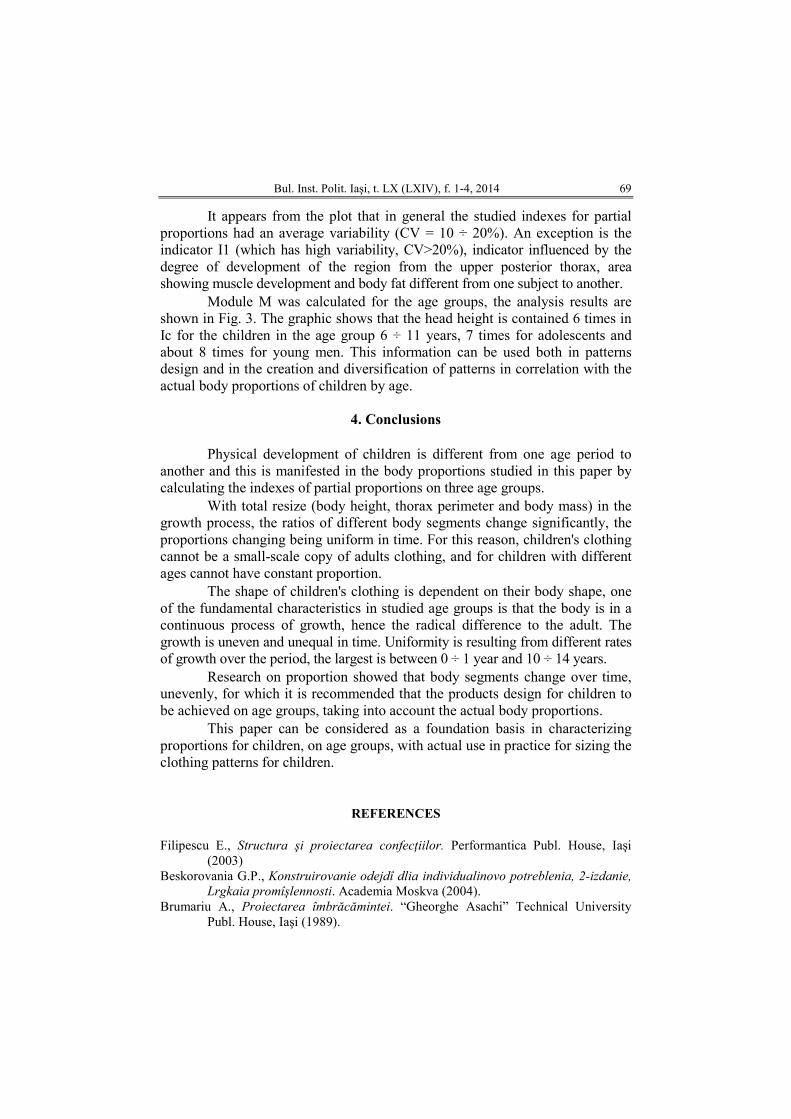
Bul. Inst. Polit. Iaşi, t. LX (LXIV), f. 1-4, 2014 69
It appears from the plot that in general the studied indexes for partial proportions had an average variability (CV = 10 ÷ 20%). An exception is the indicator I1 (which has high variability, CV>20%), indicator influenced by the degree of development of the region from the upper posterior thorax, area showing muscle development and body fat different from one subject to another.
Module M was calculated for the age groups, the analysis results are shown in Fig. 3. The graphic shows that the head height is contained 6 times in Ic for the children in the age group 6 ÷ 11 years, 7 times for adolescents and about 8 times for young men. This information can be used both in patterns design and in the creation and diversification of patterns in correlation with the actual body proportions of children by age.
4. Conclusions
Physical development of children is different from one age period to
another and this is manifested in the body proportions studied in this paper by calculating the indexes of partial proportions on three age groups.
With total resize (body height, thorax perimeter and body mass) in the growth process, the ratios of different body segments change significantly, the proportions changing being uniform in time. For this reason, children's clothing cannot be a small-scale copy of adults clothing, and for children with different ages cannot have constant proportion.
The shape of children's clothing is dependent on their body shape, one of the fundamental characteristics in studied age groups is that the body is in a continuous process of growth, hence the radical difference to the adult. The growth is uneven and unequal in time. Uniformity is resulting from different rates of growth over the period, the largest is between 0 ÷ 1 year and 10 ÷ 14 years.
Research on proportion showed that body segments change over time, unevenly, for which it is recommended that the products design for children to be achieved on age groups, taking into account the actual body proportions.
This paper can be considered as a foundation basis in characterizing proportions for children, on age groups, with actual use in practice for sizing the clothing patterns for children.
REFERENCES
Filipescu E., Structura şi proiectarea confecŃiilor. Performantica Publ. House, Iaşi
(2003) Beskorovania G.P., Konstruirovanie odejdî dlia individualinovo potreblenia, 2-izdanie,
Lrgkaia promîşlennosti. Academia Moskva (2004). Brumariu A., Proiectarea îmbrăcămintei. “Gheorghe Asachi” Technical University
Publ. House, Iaşi (1989).
70 Emilia Filipescu et al.
Filipescu E., Olaru S., Filipescu E., Cercetarea antropo-morfologică a corpului uman în
scopul proiectării îmbrăcămintei individualizate. Buletinul AGIR, Vol. EducaŃie. Cercetare. Progres Tehnologic, 3, 121−126 (2013).
CERCETĂRI PRIVIND DINAMICA DIMENSIUNILOR ANTROPOMETRICE CARACTERIZÂND
POPULAłIA INFANTILĂ DIN ROMÂNIA
(Rezumat)
Baza de date obŃinute din studiul antropometric realizat în 2010 în România pe populaŃia infantilă, folosind un sistem de scanare 3D, a permis caracterizarea morfologică a acesteia din punct de vedere al vârstei, caracterizare necesară în proiectarea îmbrăcămintei. În cadrul cercetării s-au definit şi au fost studiaŃi prin analiză statistică indici de evaluare ai proporŃiilor precum echilbru antero-posterior şi perimetrelor pe grupele de vârstă. Aceste date permit compararea cu studii antropometrice realizate în alte Ńări din Comunitatea Europeană.
Rezultatele acestui studiu stau la baza standardului antropometric dezvoltat în România în 2011, care reglementează sistemul de conformaŃii pentru populaŃia cu vârstă cuprinsă între 6 şi 19 ani. Valorile indicilor de proporŃie parŃiali rezultaŃi în urma cercetării pot fi utilizaŃi pentru stabilirea dimensiunilor pentru produsele de îmbrăcăminte cu sprijin pe umăr şi în talie în cazul populaŃiei infantile cu grupele de vărstă studiate.
BULETINUL INSTITUTULUI POLITEHNIC DIN IAŞI Publicat de
Universitatea Tehnică „Gheorghe Asachi” din Iaşi Tomul LX (LXIV), Fasc. 1-4, 2014
Secţia TEXTILE. PIELĂRIE
CRASHING PERT/CPM NETWORK: A MATHEMATICAL AND NUMERICAL APPROACH
BY
M. NAZRUL ISLAM, M. SHARIF UDDIN and AMINUR R. KHAN
Department of Mathematics
Jahangirnagar University, Bangladesh
Received: November 09, 2014 Accepted for publication: December 14, 2014
Abstract. Objective of this paper is to analyze some project management
techniques and propose a mathematical model for time minimization in project crashing. The model minimize the total project time by reducing the pessimistic time of critical activities through the PERT network by investing additional amount of money to the project. The increment of the investment, not only decrease the pessimistic time of the activities along the critical path, but it also decreases the expected time of the activities along the critical path and the whole project duration. As a result, the probability or percent chance of completing the project on or before the completion time will show increasingly. This model is used in a hypothetical project and showed how the probability of project time is increasing after investing extra amount of money. The results are also analyzed statistically and presented in some probability curves.
Keywords: Project Evaluation and Review Technique (PERT); Critical
Path Method (CPM); Project Crashing; Linear Programming Problem (LPP).
Corresponding author: e-mail: [email protected]
72 M. Nazrul Islam, M. Sharif Uddin and Aminur R. Khan
1. Introduction
Successful project management is the supervision of project resources,
which involves project completion within the allocated time period and within the budget cost. Time (indicated as a given schedule), cost (constrained by the budget) and performance (described as quality requirements for given specifications) are the three main project management dimensions (Meredith et al., 1995). Time and cost are variables that should be minimized.
The objective of project management is to predict as many dangers and problems as possible and to plan, organize and control activities so that projects are completed successfully in spite of all the risks.
Project managers have been planning, scheduling, monitoring and controlling large-scale projects for hundreds of years, but it has only been in the last 60 years that management science techniques have been applied to major projects.
Project Evaluation and Review Techniques (PERT) and Critical Path Method (CPM) have been the subject of hundreds of research papers since the year of their development. Potential uncertainties and project changes should be considered during the preliminary planning stage for a project, otherwise these changes may generate extra cost and time.
PERT was developed by the special project office of the U.S. Navy in 1958 to plan and control the Polaris missile program. The first publication on PERT is Malcon et al. (1959) which contained much of the same material as the Navy report. CPM was developed by Kelly of Remington-Rand and Walker of Du Pont in 1957. CPM was used to assist in the building and maintenance of chemical plants at Dupont.
The aim of Crashing PERT/CPM networks is to meet the desired deadline with the lowest amount of cost by reducing the original project duration.
Fulkerson (1961) and Premachandra (1992) reformulate the problem of crashing PERT network as a linear program, reducing the time required to find the optimal solution. Moore et al. (1978) reformulate the problem using goal programming. Foldes and Sourmis (1993) present a reformulation of crashing networks when the cost-time tradeoff is represented by non-linear, non-differentiable convex function. Nazrul Islam et al. (2012) proposed a concept of mathematical programming model for maximizing the project completion probability in project crashing. Ten Wei Peng et al. (2010) analyzed numerical results of crashing CPM/PERT network to the increase of the probability or percentage of completing the project on or before the completion time by reducing pessimistic time of critical activities. There exist an example in Nicholas & Steyn (2008) that the probability of the project will be finished
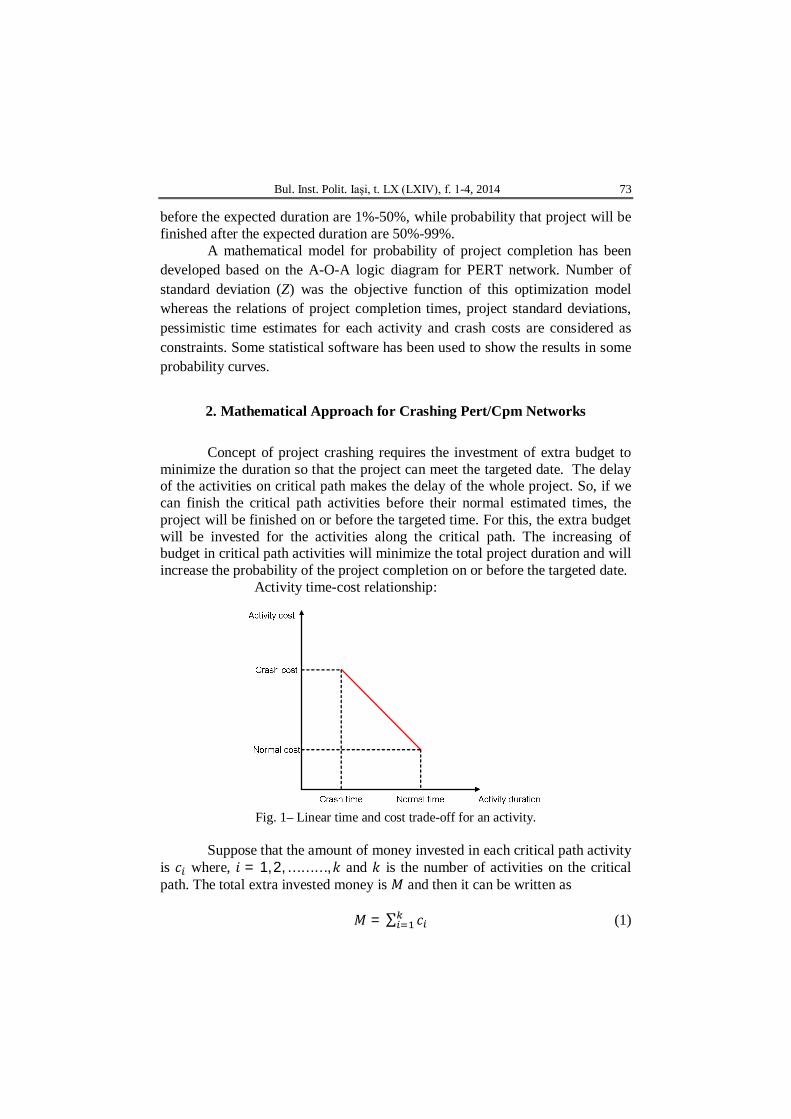
Bul. Inst. Polit. Iaşi, t. LX (LXIV), f. 1-4, 2014 73
before the expected duration are 1%-50%, while probability that project will be finished after the expected duration are 50%-99%.
A mathematical model for probability of project completion has been developed based on the A-O-A logic diagram for PERT network. Number of standard deviation (Z) was the objective function of this optimization model whereas the relations of project completion times, project standard deviations, pessimistic time estimates for each activity and crash costs are considered as constraints. Some statistical software has been used to show the results in some probability curves.
2. Mathematical Approach for Crashing Pert/Cpm Networks Concept of project crashing requires the investment of extra budget to
minimize the duration so that the project can meet the targeted date. The delay of the activities on critical path makes the delay of the whole project. So, if we can finish the critical path activities before their normal estimated times, the project will be finished on or before the targeted time. For this, the extra budget will be invested for the activities along the critical path. The increasing of budget in critical path activities will minimize the total project duration and will increase the probability of the project completion on or before the targeted date.
Activity time-cost relationship:
Fig. 1– Linear time and cost trade-off for an activity.
Suppose that the amount of money invested in each critical path activity
is 푐 where, 푖 = 1, 2, … … … ,푘 and 푘 is the number of activities on the critical path. The total extra invested money is 푀 and then it can be written as
푀 = ∑ 푐 (1)
74 M. Nazrul Islam, M. Sharif Uddin and Aminur R. Khan
We reduce the pessimistic time of critical activities 푏 to 푏∗ which minimize the expected project duration 푇 to 푇∗ and project standard deviation 휎 to 휎∗. Then the mathematical models for new 푇 and 휎 stand
푇∗ = min.푇 (2) Then the PERT formula of new expected time for critical path activities
becomes
푡∗ =∗ (3)
where: bi*≤ bi .
The decreasing of pessimistic time 푏 of the critical path activities depends on the increasing of cost 푐 for each activity on critical path. Therefore, it means that the decrease in both expected time and variance of the activities will be a function ∅ and 휑 of the additional investment. Then the new pessimistic time and variance of the activities for the critical path activities will be
푏∗ = 푏 − ∅(푐 ) and 휎∗ = 휎 − 휑(푐 ) (4) with
푐 ≥ 0. (5) Combining all the constraints from (3) and (4) along with the time
function (2), we get the following mathematical model: 푇∗ = min.푇 (6)
푠/푡. 푡∗ =푎 + 4푚 + 푏∗
6
푏∗ = 푏 − ∅(푐 ) 휎∗ = 휎 − 휑(푐 )
where 푏∗ ≤ 푏 and 푐 ≥ 0. After reducing the expected time, the probability of the project
completion on or before the targeted time increased to Z*. Then the mathematical form of the objective function can be written as
푍∗ = max.푍 = ∗
∗ . (7)
For getting the increased probability we have to decrease the project duration 푇 and to decrease the project standard deviation σr, which can be written as
푇∗ < 푇 (8) and
휎∗ < 휎 . (9) Combining all the constraints from (8), (9), (6) and (4) accordingly
along with the probability function (7), Nazrul Islam et al. (2012) formulate the following mathematical model
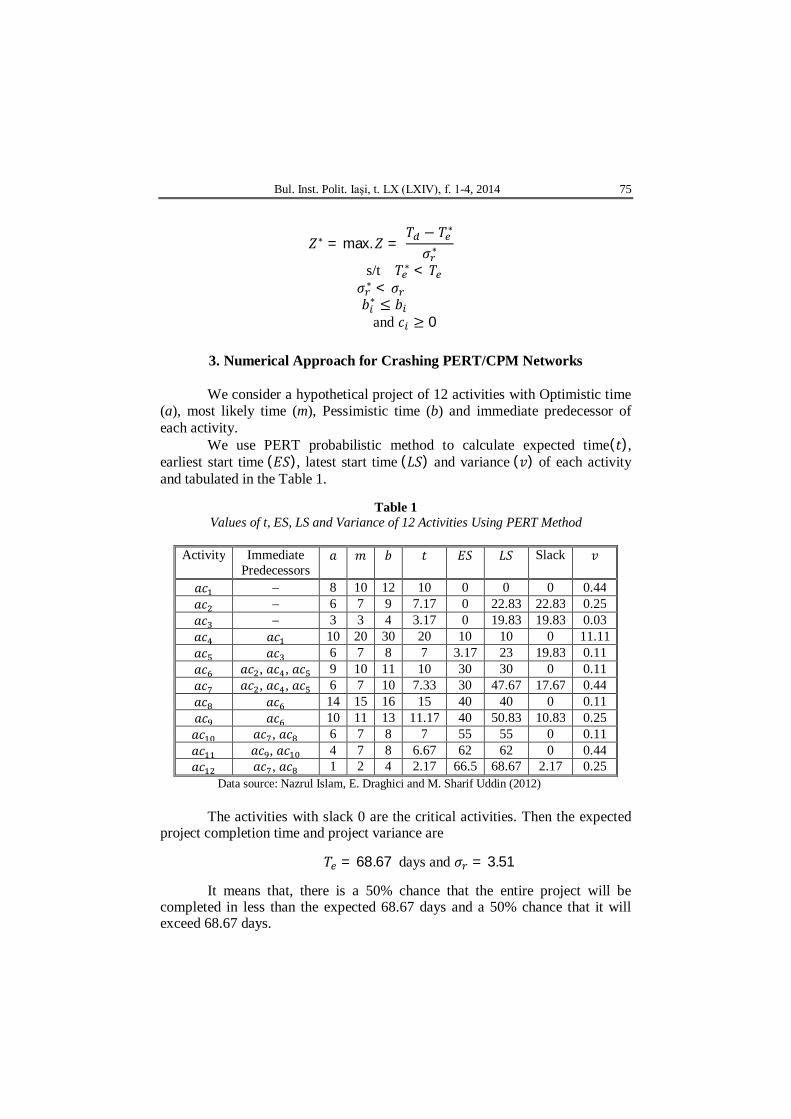
Bul. Inst. Polit. Iaşi, t. LX (LXIV), f. 1-4, 2014 75
푍∗ = max.푍 = 푇 − 푇∗
휎∗
s/t 푇∗ < 푇 휎∗ < 휎 푏∗ ≤ 푏
and 푐 ≥ 0
3. Numerical Approach for Crashing PERT/CPM Networks We consider a hypothetical project of 12 activities with Optimistic time
(a), most likely time (m), Pessimistic time (b) and immediate predecessor of each activity.
We use PERT probabilistic method to calculate expected time(푡), earliest start time (퐸푆), latest start time (퐿푆) and variance (푣) of each activity and tabulated in the Table 1.
Table 1
Values of t, ES, LS and Variance of 12 Activities Using PERT Method
Activity Immediate Predecessors
푎 푚 푏 푡 퐸푆 퐿푆 Slack 푣
푎푐 – 8 10 12 10 0 0 0 0.44 푎푐 – 6 7 9 7.17 0 22.83 22.83 0.25 푎푐 – 3 3 4 3.17 0 19.83 19.83 0.03 푎푐 푎푐 10 20 30 20 10 10 0 11.11 푎푐 푎푐 6 7 8 7 3.17 23 19.83 0.11 푎푐 푎푐 , 푎푐 , 푎푐 9 10 11 10 30 30 0 0.11 푎푐 푎푐 , 푎푐 , 푎푐 6 7 10 7.33 30 47.67 17.67 0.44 푎푐 푎푐 14 15 16 15 40 40 0 0.11 푎푐 푎푐 10 11 13 11.17 40 50.83 10.83 0.25 푎푐 푎푐 , 푎푐 6 7 8 7 55 55 0 0.11 푎푐 푎푐 , 푎푐 4 7 8 6.67 62 62 0 0.44 푎푐 푎푐 , 푎푐 1 2 4 2.17 66.5 68.67 2.17 0.25
Data source: Nazrul Islam, E. Draghici and M. Sharif Uddin (2012)
The activities with slack 0 are the critical activities. Then the expected project completion time and project variance are
푇 = 68.67 days and 휎 = 3.51
It means that, there is a 50% chance that the entire project will be
completed in less than the expected 68.67 days and a 50% chance that it will exceed 68.67 days.
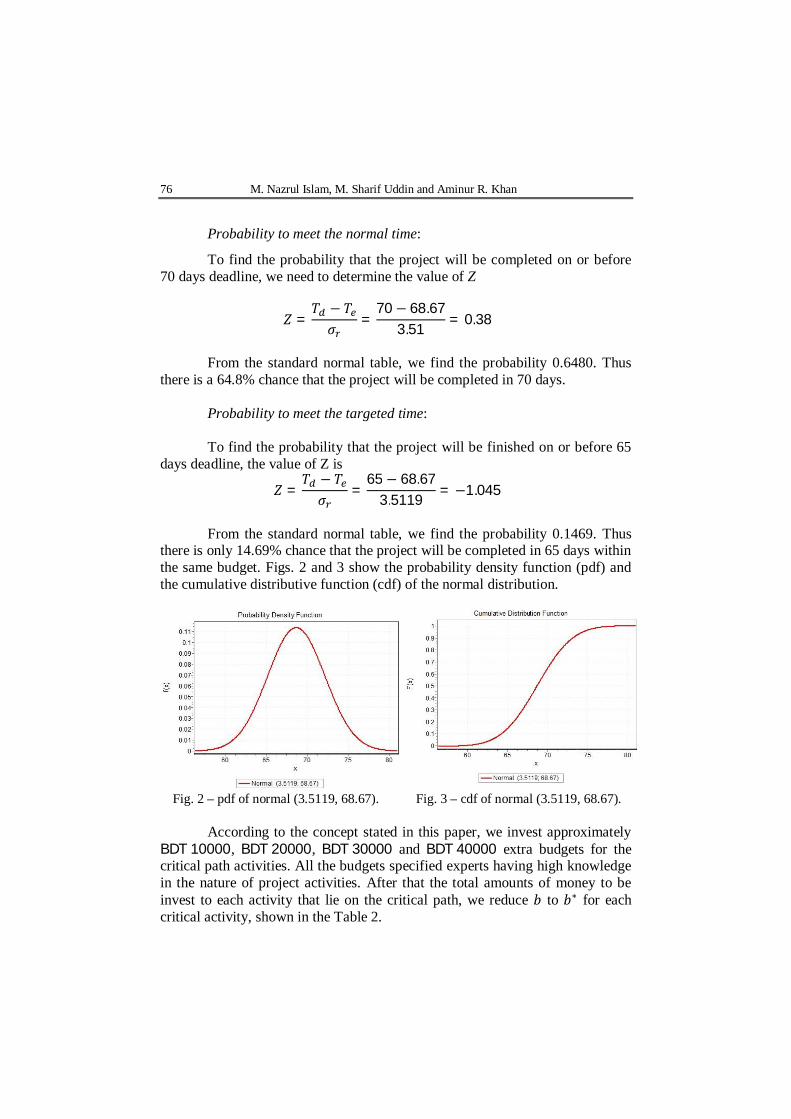
76 M. Nazrul Islam, M. Sharif Uddin and Aminur R. Khan
Probability to meet the normal time:
To find the probability that the project will be completed on or before 70 days deadline, we need to determine the value of Z
푍 =푇 − 푇휎
=70 − 68.67
3.51= 0.38
From the standard normal table, we find the probability 0.6480. Thus
there is a 64.8% chance that the project will be completed in 70 days. Probability to meet the targeted time: To find the probability that the project will be finished on or before 65
days deadline, the value of Z is
푍 =푇 − 푇휎
=65 − 68.67
3.5119= −1.045
From the standard normal table, we find the probability 0.1469. Thus
there is only 14.69% chance that the project will be completed in 65 days within the same budget. Figs. 2 and 3 show the probability density function (pdf) and the cumulative distributive function (cdf) of the normal distribution.
Fig. 2 – pdf of normal (3.5119, 68.67). Fig. 3 – cdf of normal (3.5119, 68.67).
According to the concept stated in this paper, we invest approximately
BDT 10000, BDT 20000, BDT 30000 and BDT 40000 extra budgets for the critical path activities. All the budgets specified experts having high knowledge in the nature of project activities. After that the total amounts of money to be invest to each activity that lie on the critical path, we reduce 푏 to 푏∗ for each critical activity, shown in the Table 2.
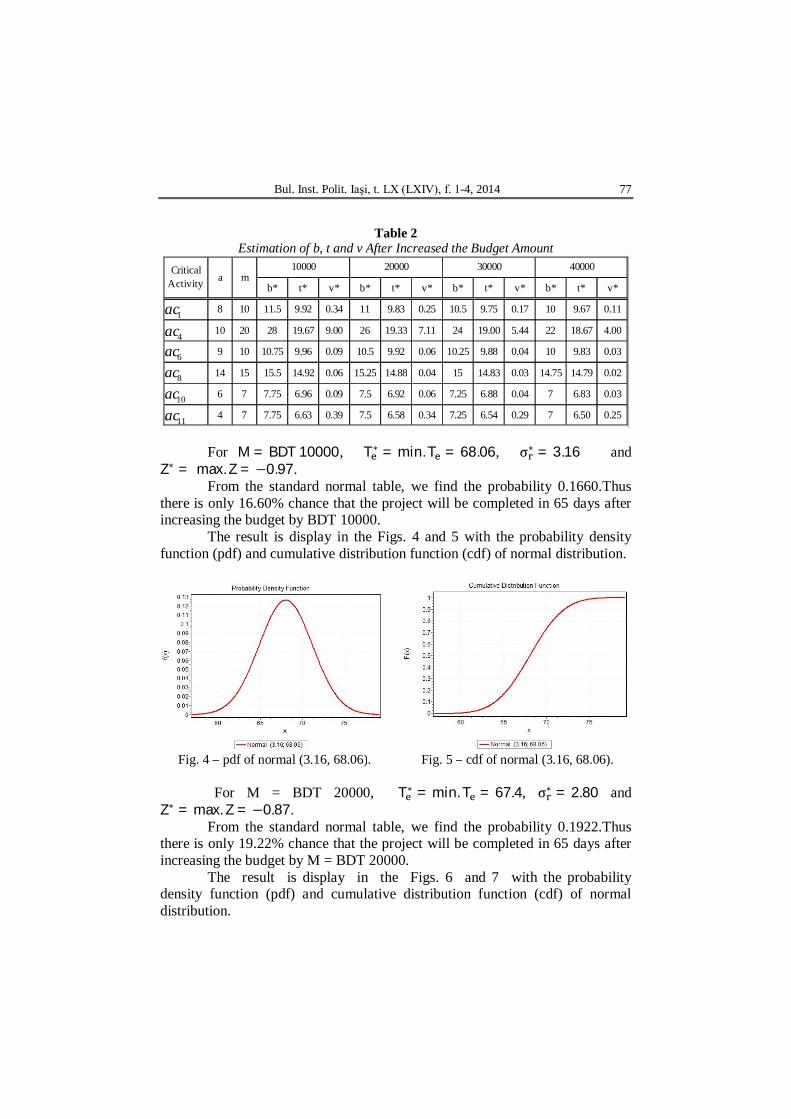
Bul. Inst. Polit. Iaşi, t. LX (LXIV), f. 1-4, 2014 77
Table 2
Estimation of b, t and v After Increased the Budget Amount
b* t* v* b* t* v* b* t* v* b* t* v*
8 10 11.5 9.92 0.34 11 9.83 0.25 10.5 9.75 0.17 10 9.67 0.11
10 20 28 19.67 9.00 26 19.33 7.11 24 19.00 5.44 22 18.67 4.00
9 10 10.75 9.96 0.09 10.5 9.92 0.06 10.25 9.88 0.04 10 9.83 0.03
14 15 15.5 14.92 0.06 15.25 14.88 0.04 15 14.83 0.03 14.75 14.79 0.02
6 7 7.75 6.96 0.09 7.5 6.92 0.06 7.25 6.88 0.04 7 6.83 0.03
4 7 7.75 6.63 0.39 7.5 6.58 0.34 7.25 6.54 0.29 7 6.50 0.25
40000Critical Activity a m
10000 20000 30000
1ac
4ac6ac8ac
10ac
11ac For M = BDT 10000, T∗ = min. T = 68.06, σ∗ = 3.16 and
Z∗ = max. Z = −0.97. From the standard normal table, we find the probability 0.1660.Thus
there is only 16.60% chance that the project will be completed in 65 days after increasing the budget by BDT 10000.
The result is display in the Figs. 4 and 5 with the probability density function (pdf) and cumulative distribution function (cdf) of normal distribution.
Fig. 4 – pdf of normal (3.16, 68.06). Fig. 5 – cdf of normal (3.16, 68.06).
For M = BDT 20000, T∗ = min. T = 67.4, σ∗ = 2.80 and
Z∗ = max. Z = −0.87. From the standard normal table, we find the probability 0.1922.Thus
there is only 19.22% chance that the project will be completed in 65 days after increasing the budget by M = BDT 20000.
The result is display in the Figs. 6 and 7 with the probability density function (pdf) and cumulative distribution function (cdf) of normal distribution.
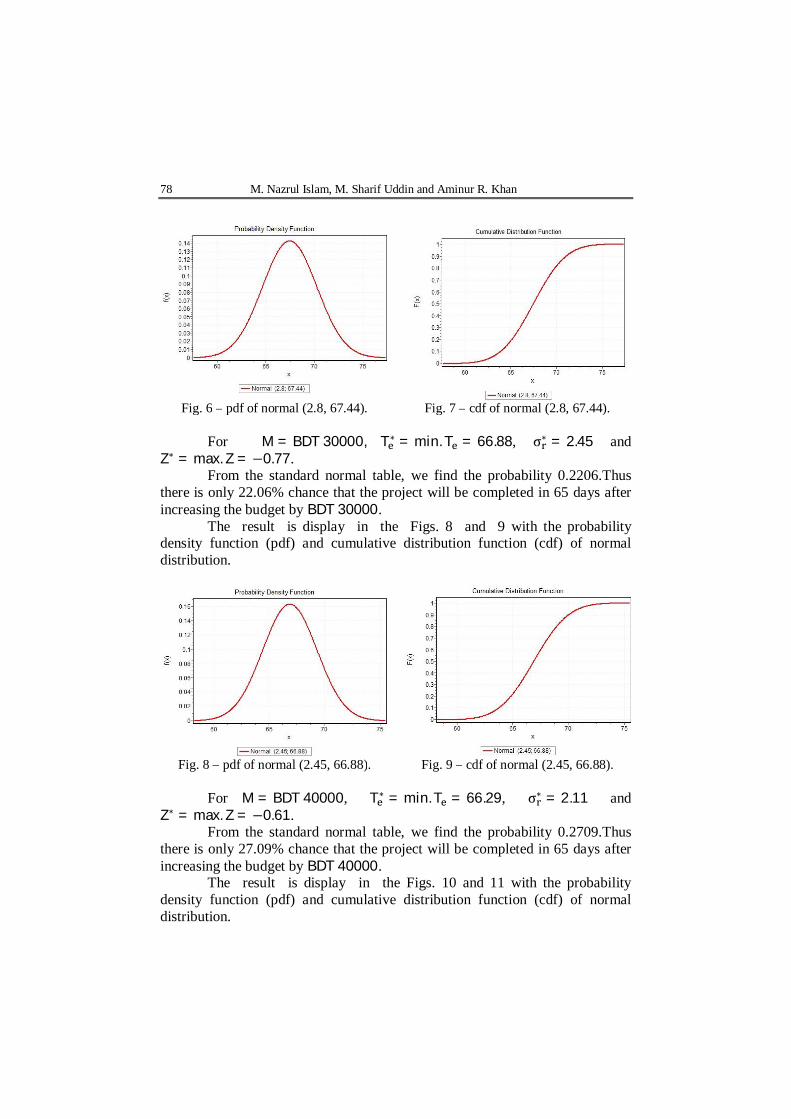
78 M. Nazrul Islam, M. Sharif Uddin and Aminur R. Khan
Fig. 6 – pdf of normal (2.8, 67.44). Fig. 7 – cdf of normal (2.8, 67.44).
For M = BDT 30000, T∗ = min. T = 66.88, σ∗ = 2.45 and
Z∗ = max. Z = −0.77. From the standard normal table, we find the probability 0.2206.Thus
there is only 22.06% chance that the project will be completed in 65 days after increasing the budget by BDT 30000.
The result is display in the Figs. 8 and 9 with the probability density function (pdf) and cumulative distribution function (cdf) of normal distribution.
Fig. 8 – pdf of normal (2.45, 66.88). Fig. 9 – cdf of normal (2.45, 66.88).
For M = BDT 40000, T∗ = min. T = 66.29, σ∗ = 2.11 and
Z∗ = max. Z = −0.61. From the standard normal table, we find the probability 0.2709.Thus
there is only 27.09% chance that the project will be completed in 65 days after increasing the budget by BDT 40000.
The result is display in the Figs. 10 and 11 with the probability density function (pdf) and cumulative distribution function (cdf) of normal distribution.
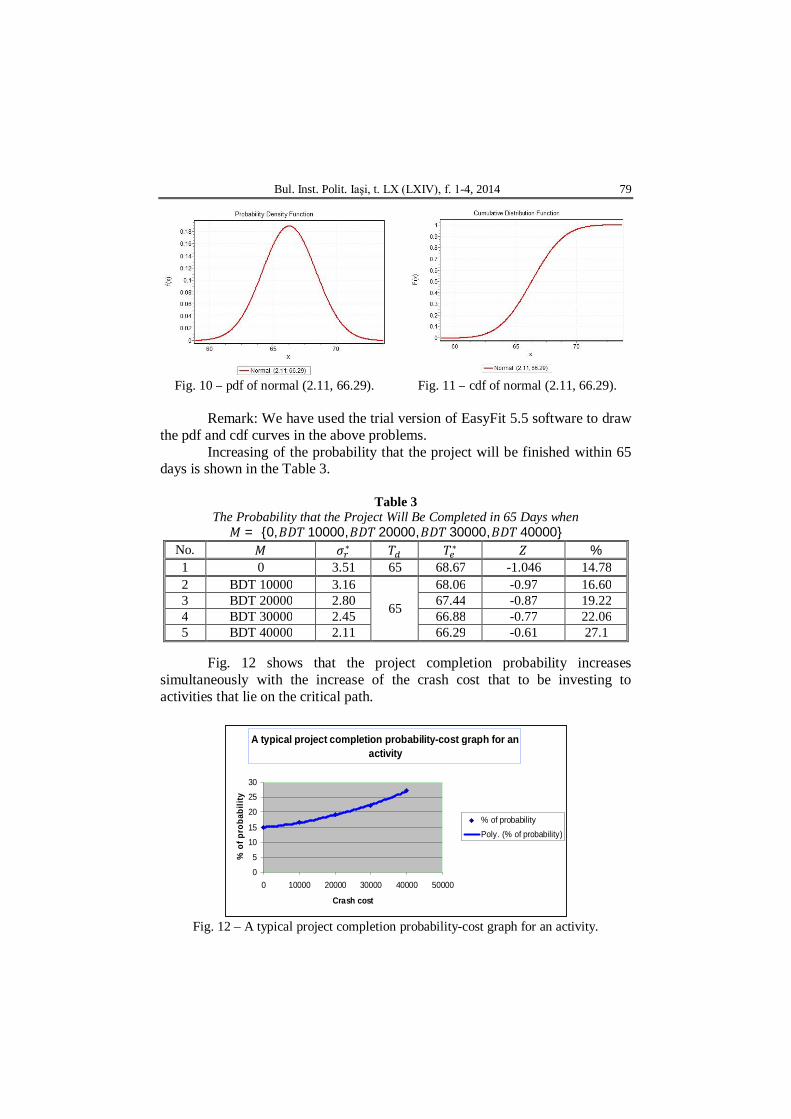
Bul. Inst. Polit. Iaşi, t. LX (LXIV), f. 1-4, 2014 79
Fig. 10 – pdf of normal (2.11, 66.29). Fig. 11 – cdf of normal (2.11, 66.29).
Remark: We have used the trial version of EasyFit 5.5 software to draw
the pdf and cdf curves in the above problems. Increasing of the probability that the project will be finished within 65
days is shown in the Table 3.
Table 3 The Probability that the Project Will Be Completed in 65 Days when
푀 = {0,퐵퐷푇 10000,퐵퐷푇 20000,퐵퐷푇 30000,퐵퐷푇 40000} No. 푀 휎∗ 푇 푇∗ 푍 % 1 0 3.51 65 68.67 -1.046 14.78 2 BDT 10000 3.16
65
68.06 -0.97 16.60 3 BDT 20000 2.80 67.44 -0.87 19.22 4 BDT 30000 2.45 66.88 -0.77 22.06 5 BDT 40000 2.11 66.29 -0.61 27.1
Fig. 12 shows that the project completion probability increases
simultaneously with the increase of the crash cost that to be investing to activities that lie on the critical path.
Fig. 12 – A typical project completion probability-cost graph for an activity.
A typical project completion probability-cost graph for an activity
0
5
10
15
20
25
30
0 10000 20000 30000 40000 50000
Crash cost
% o
f pro
babi
lity
% of probabilityPoly. (% of probability)
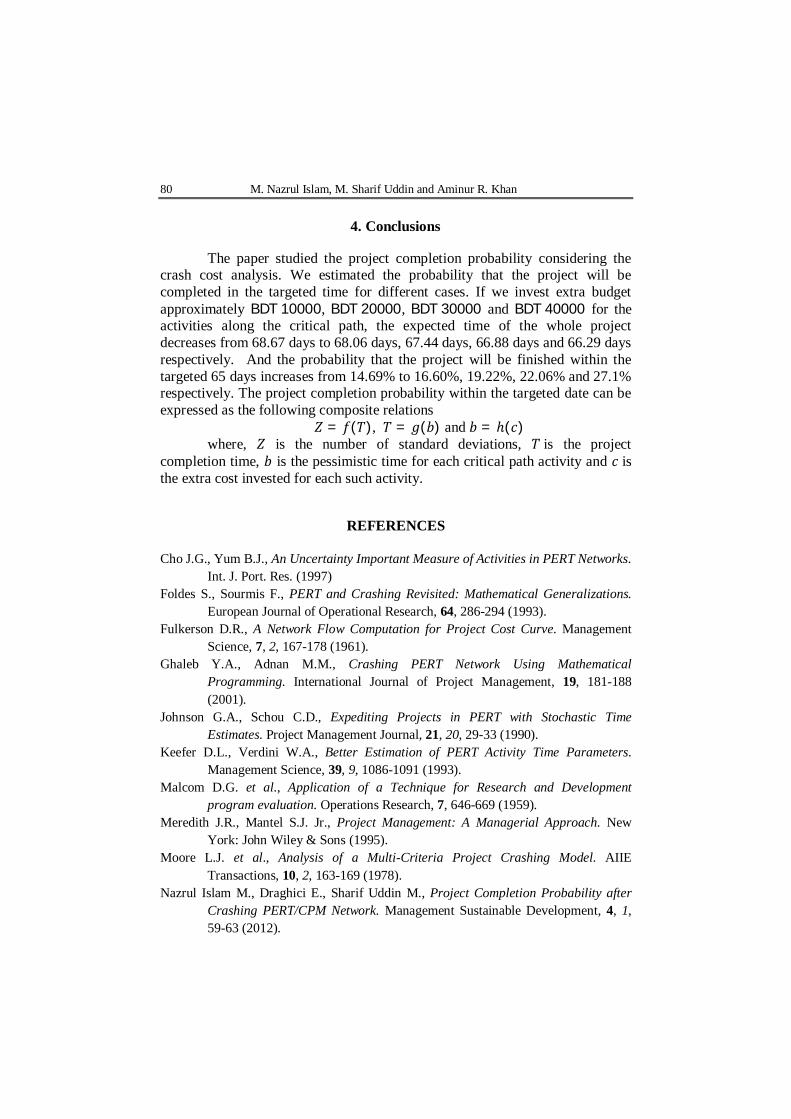
80 M. Nazrul Islam, M. Sharif Uddin and Aminur R. Khan
4. Conclusions
The paper studied the project completion probability considering the crash cost analysis. We estimated the probability that the project will be completed in the targeted time for different cases. If we invest extra budget approximately BDT 10000, BDT 20000, BDT 30000 and BDT 40000 for the activities along the critical path, the expected time of the whole project decreases from 68.67 days to 68.06 days, 67.44 days, 66.88 days and 66.29 days respectively. And the probability that the project will be finished within the targeted 65 days increases from 14.69% to 16.60%, 19.22%, 22.06% and 27.1% respectively. The project completion probability within the targeted date can be expressed as the following composite relations
푍 = 푓(푇), 푇 = 푔(푏) and 푏 = ℎ(푐) where, 푍 is the number of standard deviations, 푇 is the project
completion time, 푏 is the pessimistic time for each critical path activity and 푐 is the extra cost invested for each such activity.
REFERENCES
Cho J.G., Yum B.J., An Uncertainty Important Measure of Activities in PERT Networks. Int. J. Port. Res. (1997)
Foldes S., Sourmis F., PERT and Crashing Revisited: Mathematical Generalizations. European Journal of Operational Research, 64, 286-294 (1993).
Fulkerson D.R., A Network Flow Computation for Project Cost Curve. Management Science, 7, 2, 167-178 (1961).
Ghaleb Y.A., Adnan M.M., Crashing PERT Network Using Mathematical Programming. International Journal of Project Management, 19, 181-188 (2001).
Johnson G.A., Schou C.D., Expediting Projects in PERT with Stochastic Time Estimates. Project Management Journal, 21, 20, 29-33 (1990).
Keefer D.L., Verdini W.A., Better Estimation of PERT Activity Time Parameters. Management Science, 39, 9, 1086-1091 (1993).
Malcom D.G. et al., Application of a Technique for Research and Development program evaluation. Operations Research, 7, 646-669 (1959).
Meredith J.R., Mantel S.J. Jr., Project Management: A Managerial Approach. New York: John Wiley & Sons (1995).
Moore L.J. et al., Analysis of a Multi-Criteria Project Crashing Model. AIIE Transactions, 10, 2, 163-169 (1978).
Nazrul Islam M., Draghici E., Sharif Uddin M., Project Completion Probability after Crashing PERT/CPM Network. Management Sustainable Development, 4, 1, 59-63 (2012).
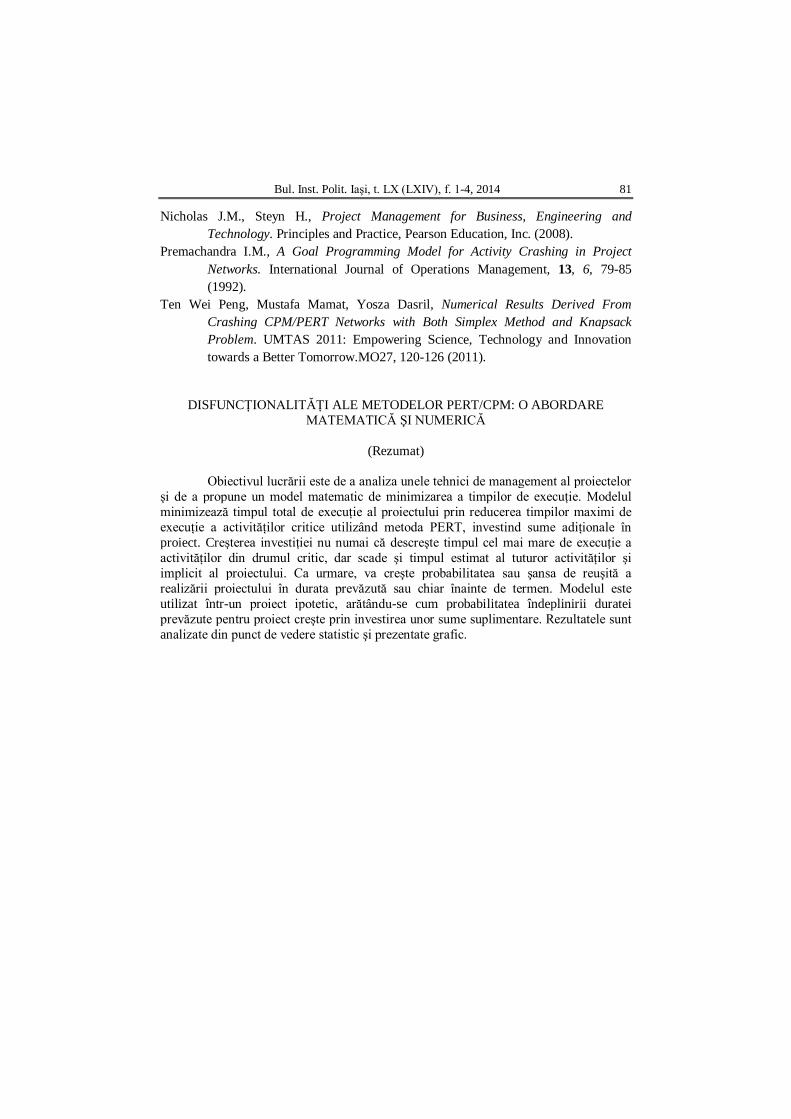
Bul. Inst. Polit. Iaşi, t. LX (LXIV), f. 1-4, 2014 81
Nicholas J.M., Steyn H., Project Management for Business, Engineering and Technology. Principles and Practice, Pearson Education, Inc. (2008).
Premachandra I.M., A Goal Programming Model for Activity Crashing in Project Networks. International Journal of Operations Management, 13, 6, 79-85 (1992).
Ten Wei Peng, Mustafa Mamat, Yosza Dasril, Numerical Results Derived From Crashing CPM/PERT Networks with Both Simplex Method and Knapsack Problem. UMTAS 2011: Empowering Science, Technology and Innovation towards a Better Tomorrow.MO27, 120-126 (2011).
DISFUNCŢIONALITĂŢI ALE METODELOR PERT/CPM: O ABORDARE MATEMATICĂ ŞI NUMERICĂ
(Rezumat)
Obiectivul lucrării este de a analiza unele tehnici de management al proiectelor
şi de a propune un model matematic de minimizarea a timpilor de execuţie. Modelul minimizează timpul total de execuţie al proiectului prin reducerea timpilor maximi de execuţie a activităţilor critice utilizând metoda PERT, investind sume adiţionale în proiect. Creşterea investiţiei nu numai că descreşte timpul cel mai mare de execuţie a activităţilor din drumul critic, dar scade şi timpul estimat al tuturor activităţilor şi implicit al proiectului. Ca urmare, va creşte probabilitatea sau şansa de reuşită a realizării proiectului în durata prevăzută sau chiar înainte de termen. Modelul este utilizat într-un proiect ipotetic, arătându-se cum probabilitatea îndeplinirii duratei prevăzute pentru proiect creşte prin investirea unor sume suplimentare. Rezultatele sunt analizate din punct de vedere statistic şi prezentate grafic.

BULETINUL INSTITUTULUI POLITEHNIC DIN IAŞI Publicat de
Universitatea Tehnică „Gheorghe Asachi” din Iaşi Tomul LX (LXIV), Fasc. 1-4, 2014
SecŃia TEXTILE. PIELĂRIE
GHEORGHE CHIRIłĂ
1926−2011
He was born September, 22, 1926 in Bacău, where he went to high
school and then the Faculty of Industrial Chemistry, specialisation Leather. He graduated in 1951 with diploma of excellence. Due to his results during the academic years, in December 1950 he was accepted as staff member of the Department of Leather Industry at the Faculty of Chemistry from the Polytechnic Institute of Iasi. He followed an academic career and in 1968 he became Professor.
In 1957 he defended his PhD thesis in the domain of Leather Industry and fat matter under the guidance of Prof. Gheorghe Alexa, PhD, Docent, Eng. and his decent thesis in 1971. He followed several training stages in the Czech Republic, Bulgaria, France and USA.
Prof. ChiriŃă lectured on different subjects: Technology of the Leather Substitutes between 1958 and 1960, Technology of Leather and Furs (1960-1990) and Leather Chemistry (collagen, keratins) between 1976 and 1990.
He wrote and edited manuals and treaties in main publishing houses (10 titles in 15 volumes, over 5,000 pages) addressed to students and engineers, researchers and designers.
He always took interest in the material basis and the modernisation of the laboratories in the Department with equipment and installations that ensured best conditions for the academic and research activities. He created and coordinated the station for the extraction of plant tannins and the pilot factory for leather and fur tanning, the latter starting with 1978.
He organised the first 5 National Conferences of Chemistry and Leather Technology and Leather Goods in 1977, 1980, 1983 and 1989.
From 1969 he was a PhD tutor and 10 theses were written and defended under his guidance.
Apart from his academic activity, Prof. ChiriŃă had an intense scientific research activity. As a scientists, his results include over 200 papers, with original contributions, published in national and international journals, patents
84
and research projects in the domains of leather tanning, combined tanning, plant tannins, chrome tannin salts, leather substitutes, chemical auxiliaries for leather industry, waste waters.
Prof. ChiriŃă has special merits for being the founder of a new research field in our country: chemistry of the collagen and its valorisation from leather wastes, as well as the production of surgical threads, dress wounds for burns, auxiliaries for the leather industry. In this domain, Prof. ChiriŃă tutored several PhD thesis, published scientific papers here and abroad, obtained several patents for his researches and published courses and manuals: Leather Chemistry, in 1980 and 1987, Animal Skin, Technical Publ. House, 1983 and Treaty of Biomolecules, two volumes, Sedcom Libris Publ. House, 2009.
Within the “Petru Poni” Institute of Macromolecular Chemistry, Prof. ChiriŃă coordinated the team researching leather substitutes and worked to produce synthetic leather using polyurethanes produced in the Institute.
He was an active participant to international Congresses: in Bruxelles - 1962, Hague - 1963, Lyon - 1965. Lucerne - 1967, Budapest - 1964, as well as to national chemistry Conferences in Cluj (1962), Iaşi (1964), Timişoara (1966) and Bucharest (1969). Prof. ChiriŃă also had several positions: Head of Department for 16 years, Vice Dean of the Faculty of Industrial Chemistry for 4 years, Vice Rector of the Polytechnic Institute for 8 years, when he remarkable contributions to the research activities and production units of the Institute.
He was a member in the Faculty Council of the Faculty of Industrial Chemistry (1965-1967), Faculty of Textile Industry (1969-1990), a member in the Senate of the Polytechnic Institute (1969-1990), member of the editorial board of the Bulletin of Polytechnic Institute, and a member of Scientific Council of the Petru Poni Institute for 4 years. He was also part of the College of Leather Chemists, as a member from 1964 and vice president from 1976.
After 1990, Prof. ChiriŃă initiated the Romanian Society of Chemists and Technicians in the Leather Industry and activated as president until 1996. He also was the editor of the Journal of Leather Industry for 5 years. He was a member of the International Union of the Chemists from the Leather Industry.
As recognition of his achievements, Prof. ChiriŃă was awarded the Order of Work, third class and several medals.
Prof. Dr. Doc. Gh. ChiriŃă was the most remarkable disciple, collaborator and he carried on the work of Prof. Gh. Alexa. In his 40 years of work, he conducted impressive academic, editorial, research and management activities that wore the print of his strong and original personality. He died in 2011, leaving behind special results in the education and formation of numerous generations of students and contributing to the academic progress in the field of leather.