Embed Size (px)
Citation preview

52 | ENERGY FUTURE: Think Efficiency American Physical Society • September 2008
B u i l d i n g s
1. In this report energy used by buildings includes energy used by building contents—appliances, vending machines, com-puters, etc., the so-called “plug loads.” It also includes external loads, such as parking lot lights and swimming pools, that use energy on building properties.
2. Sunlight, oil, natural gas, nuclear, coal, etc. are primary forms of energy–forms that are available on earth to be collected and used. Electricity is a secondary form of energy—a convenient energy carrier that must be produced from primary en-ergy.
3. All CO2 emissions are reported in metric tons (1000 kg). 1 Mt = 1 megaton = 1 million metric tons; 1Gt = 1 gigaton = 1 billion metric tons.
Commercial and residential buildings consume only one-ninth as much petroleum as the transportation sector, but they still account for almost two-fifths of our nation’s primary energy usage and more than one-third of our nation’s carbon emissions. The technological potential for reducing energy consumption and carbon emissions in the buildings sector is considerable. However, as this chapter demonstrates, significant progress likely will occur only if public policies are adopted that address imperfections in the marketplace. This is true even though the measures we suggest will result in net savings for consumers.
This chapter identifies technologies and policies that can increase the efficiency of energy use in commercial and residential buildings. There are substantial opportunities for achieving gains across the entire sector, including structures, systems and appliances. In the case of commercial buildings, a concept called integrated design provides extremely fertile ground for research, development and demonstration projects.
Introduction
Americans spend 90 percent of their time indoors, working, living, shopping and entertaining in buildings that consume enormous amounts of energy.1 In 2006, buildings — more than 118 million residential and commercial structures —
were responsible for 39 percent of the nation’s primary energy consumption, a level of energy use that has a significant impact on global climate change and potentially on U.S. energy security.2
Since most of their energy comes directly or indirectly from fossil fuels, buildings are responsible for large quantities of greenhouse gas (GHG) emissions — about 36 percent of the of CO2 associated with the nation’s total annual energy consumption.3 Building energy consumption and the resulting GHG emissions, which have been steadily rising, are projected by the Energy Information Administration (EIA) to increase another 30 percent by 2030.
Yet a large fraction of the energy delivered to buildings is wasted because of inefficient building technologies. How much of this energy can ultimately be saved is an open question — as much as 70 percent by the year 2030 in new buildings and perhaps more
CH
AP
TE
R 3
CH
AP
TE
R 3

American Physical Society • September 2008 ENERGY FUTURE: Think Efficiency | 53
than 90 percent in the long term if there were pressing reasons to go that far. These energy savings can be made not by reducing the standard of living, but by utilizing more efficient technologies to provide the same, or higher, levels of comfort and convenience we have come to enjoy and appreciate. Some of these technologies are available today; others are beyond our present grasp, but achievable in the future with strong investment in research and development (R&D). Today significant energy can be saved by making cost-effective efficiency improvements in buildings and their equipment—which will reduce our nation’s energy consumption and GHG emissions and provide significant economic savings to consumers.
Buildings consume 72 percent of the nation’s electricity, more than 50 percent of which is generated from coal, our nation’s most abundant energy resource but one with CO2 emissions greater than other fossil fuels, according to the EIA. The advantage of electricity is that it is a form of energy that can be fully converted to work and is easy to distribute over the electric grid. Its disadvantage is that it is generated and distributed with 31 percent efficiency—which means 69 percent of the primary energy used to generate electricity is lost as waste heat before reaching the end user.
Building structures pose a more difficult problem than either the equipment they contain or automobiles due to their long lifetimes and slow replacement rates. Whereas vehicles and appliances wear out after a decade or so, buildings typically last for the better part of a century. Most buildings were constructed during the years when energy was cheap, and as a result, they were not designed or built with energy efficiency in mind. The overall number of buildings in the United States is growing by only 1 to 2 percent per year. Hence a major reduction in building energy consumption must involve both improvements in existing buildings and new construction.
Fortunately, widespread use of existing energy efficiency technologies and those that can be developed over the near term would eliminate a sizable portion of the current waste of energy, significantly reducing building energy consumption and greenhouse gas emissions. For the foreseeable future, reducing primary energy consumption through improved efficiency is likely to remain far cheaper than expanding renewable energy production [Glicksman, 2008]. (For a detailed definition of energy efficiency. (See Endnote 1.)
Residential BuildingsIn 2005, residential buildings in the United States consisted of 113 million residences totaling an
estimated 180 billion gross square feet, including standalone houses and mobile homes, as well as dwellings located in apartment buildings and other multiresidence units [2007 Building Energy Data Book, p. 2-1].
Figure 18
Residential energy end usageIn 2006 the residential sector consumed 21.8 quads4 of primary energy. This chart shows the relative amounts going to various residential end uses.5
Electronics Cooking Computers
20 40 60 80 100
OtherLighting Refrigeration Wet cleaningWater heatingSpace coolingSpace heating 6
32% 13% 13% 12% 8% 8% 5% 5% 3%
1%
Source: Energy Data Book (2007); EERE, U.S. Department of Energy
4. 1 Btu = British thermal unit, the amount of heat it takes to raise the temperature of 1 pound of water by 1 degree Fahrenheit. 1 quad = 1 quadrillion Btu = 1015 Btu. 1 Btu is also equal to 1054 joules, 1 joule being the metric unit of energy.
5. Numbers differ slightly from those in the DOE Building Energy Databook as the 4.7% adjustment has been eliminated and distributed proportionally to all other categories.
6. Energy for “space heating” is the energy used to heat a building. Energy used to heat domestic hot water is included in the category “wet cleaning

54 | ENERGY FUTURE: Think Efficiency American Physical Society • September 2008
Data from recent Department of Housing and Urban Development surveys show that the average rate of new construction is about 1.4 percent per year, and when demolition, condemnation, and conversion of residences are factored in, the net growth per year is about 1.2 percent. Once built, a residential building is likely to be usable for about one hundred years [Johnstone, 2001].
In 2000 (the latest year for which data are available), the average existing residential unit consisted of 1,591 square feet and a household size of 2.7 people [2007 Building Energy Data Book, pp.2-1]. Although the housing market is currently extremely volatile, the trend for at least a half-century has been toward larger residences. The average new single-family home constructed in 2006 was 2,470 square feet, 42 percent larger than in 1980 [2007 Building Energy Data Book, p. 2-3].
Primary energy consumption based on end use for residential buildings in 2005 is summarized in Figure 18. The single largest end use is space heating (32%), followed by air conditioning or space cooling (13%), water heating (13%) and lighting (12%). Note that these four combined account for 70% of the energy consumption.
Commercial BuildingsIn the United States in 2000, 4.7 million commercial buildings provided 68.5 billion square feet.
From 2000 to 2005, the commercial building stock grew by 15 percent to 74.3 billion square feet,
double the growth rate of the residential sector [2007 Building Energy Data Book, p.2-5].
The commercial space breaks down as follows: offices (17%), mercantile (16%), education (14%), warehouse and storage (14%) and lodging (7%), with numerous other functions making up the remaining 32 percent.
Primary energy consumption based on end use for commercial buildings for 2005 is summarized in Figure 19. The single largest end use is lighting (27%), followed by space heating (15%), space cooling (14%) and water heating (7%).7 Together these four end-uses account for 63 percent of primary energy consumption, somewhat lower than the case for the residential sector. Although commercial buildings presently consume less primary energy than residential buildings, the energy use in the commercial sector is experiencing nearly double the growth rate. (See Figure 20.)
7.NumbersdifferslightlyfromthoseintheDOEBuildingEnergyDatabookasthe5.5%adjustmenthasbeeneliminatedanddistributedproportionallytoallothercategories.Non-buildingcommercialuseincludeselectricityforstreet lights,water treatmentplants,airportlights,etc.Allthesenumbersforenergyusesshouldbeviewedasroughapproximations—moreusefulforcomparingtherelativesizesofvariousenergyusesthanasprecisefiguresofanyspecificenergyuse.
8.Sincelightingandspacecoolingarepredominantlyaccomplishedwithelectricenergy,theirrelativeimportancecomparedtootherendusesdependsstronglyonwhetherthefocusisonprimary(source)energyorsiteenergy.
Source: Energy Data Book (2007); EERE, U.S. Department of Energy
0 20
OtherCookingComputers
RefrigerationVentilation
ElectronicsWater heating
Space cooling 8Space heatingLighting 8
27% 15% 14% 7% 7% 6% 4% 3% 2% 15%
Figure 19
Commercial energy end usageIn 2006 the commercial sector consumed 17.9 quads of primary energy. This chart shows the relative amounts going to various end uses.7 The category “Other” includes non-building commercial use such as street lighting, lighting in garages, etc.
0

American Physical Society • September 2008 ENERGY FUTURE: Think Efficiency | 55
Figure 20
Total primary energy consumptions for buildingsPrimary energy use (including that associated with electric use) for the residential and commercial sectors in Quad (1015 Btu).
Source: EIA 2008 Annual Energy Outlook
1950 1960 1970 1980 1990 2000 2010 2020 2030
30
25
20
15
30
5
0
Residential
CommercialQ
uadr
illio
n (B
TU)
Numbers after 2006 are projections.
8.Sincelightingandspacecoolingarepredominantlyaccomplishedwithelectricenergy,theirrelativeimportancecomparedtootherendusesdependsstronglyonwhetherthefocusisonprimary(source)energyorsiteenergy.
9.NotethattheseprojectionsdonotincludetheimpactoftheEnergyIndependenceandSecurityActof2007.
Primary EnergyFigure 20 is a graph of
primary energy used by the residential and commercial sectors from 1950 to the present and projected out to 2030. The graph indicates that energy consumption in the commercial sector is expected to grow faster than that in the residential sector. By 2030 combined primary energy in the two sectors is expected to reach 51 quads, a 30 percent increase over 2006 consumption.9
Energy consumption has been growing despite some improvements in efficiency. The main driving forces are population growth and increased standard of living associated with more and more ways to use energy. As compared with 30 years ago, Americans have larger homes; more air-conditioners, televisions, and computers; and a variety of other devices that use energy.
Currently available, cost-effective technologies could significantly reduce the energy consumption of residential and commercial buildings, and the United States is making inadequate use of these measures. But further technologically feasible advances could reduce consumption far more.
Using current and emerging technologies — those already in the pipeline – widespread construction of cost-effective, zero-energy new single-family homes could be achieved in 10 to 15 years, except possibly in hot, humid climates such as those in the Southeast. (By zero energy, we mean buildings that use no fossil fuels. In general, that means reducing a building’s energy use by about 70 percent from today’s average and fulfilling the remaining power needs with on-site or off-site renewable energy.) Widespread construction of zero-energy commercial buildings will be harder to achieve, but should be possible within 15 to 25 years, with a focused, sustained effort. Achieving 70 percent reductions in energy consumption for new commercial buildings will require both new technologies and greatly expanded use of the concept of integrated design. Such advances are unlikely to occur without greatly expanded research, development and demonstration (RD&D) efforts.
R&D will also be needed to develop more ways to improve energy efficiency in existing buildings through such measures as better wall insulation and windows.
But new technology alone will not assure efficiency improvements. Achieving maximum efficiency in our nation’s buildings will require expanded use of policy tools such as appliance efficiency standards, building energy codes and utility demand side management programs in order to encourage efficiency.

56 | ENERGY FUTURE: Think Efficiency American Physical Society • September 2008
Clearly, reducing building energy consumption is critical to our nation’s future. A first step on the path to limiting greenhouse gas emissions, reducing the national energy bill, avoiding unnecessary construction of power plants and diminishing stresses on fossil energy resources is recognizing that buildings (including factories) as well vehicles now consume vastly more energy than they need to operate efficiently. (See Endnote 2.)
Finding 1:If current and emerging cost-effective energy efficiency measures10 are employed in new buildings,
and in existing buildings as their heating, cooling, lighting and other equipment are replaced, the growth in energy demand by the building sector could be reduced from the projected 30 percent increase to zero between now and 2030. (See Endnote 3.)
Discussion: There are a wide variety of technologies and strategies now available that can significantly
lower building energy consumption without any loss of service or comfort. Some are appropriate for residential buildings, some for commercial buildings, and some for both. We are not suggesting that all of these items are cost-effective in all cases.
Space heating is the largest residential user of energy, and cooling is a close second. Focusing on those two systems, measures for both new construction and renovation that can save significant amounts of energy include:
Increasing insulation in walls, roof, floor and basement to cost-effective levels. •
Using window coatings, chosen based on climate, to reduce the amount of heat gain and •loss through thermal transmission.
Moving heating and cooling ducts into the conditioned space (so that air from leaks is •not lost to the outside) for new construction and reducing leakage for new and existing homes.
Improving heating systems through the use of furnaces that send less than 10% of their •heat out the flue, variable-speed and higher efficiency motors/fans for air circulation and efficient ground-source or gas-fired heat pumps.
Upgrading equipment for cooling to achieve better heat transfer from an air conditioner’s •evaporator and condenser coils. Using variable-speed drives that allow units to operate efficiently at partial load (rather than turning on and off frequently). In addition to saving energy, this partial load operation also controls humidity more effectively and reduces the internal heat loads on the air conditioner.
Changing ventilation system installation (mostly for new construction) from the current •practice of relying on construction errors and accidental leakage to provide sufficient fresh air to a process that uses the proper amount of mechanical ventilation while sealing the home to nearly airtight standards.
Controlling ventilation can mitigate problems with indoor air quality and mold, while also •recovering energy from the exhaust air stream.
10.By“emergingtechnologies,”wemeantechnologiesthatarelikelytobeavailableinthecoming5–10years,assumingcontinuationofthepresentlevelofR&D.By“costeffective,”wemeanatechnologythatiscost-effectivefortheindividualconsumer.Thatis,atcurrentenergyprices,theconsumerwouldsavemoreinreducedenergyconsumptionoverthelifetimeofthetechnologythanhewouldpaytopurchaseandinstallthetechnology,assumingarealdiscountrateof7percent.

American Physical Society • September 2008 ENERGY FUTURE: Think Efficiency | 57
11.Thereducedwaterusagearisesnotfromchangesinbehavior,butfromusingdishwashersandclotheswashersthatprovidethesameutilitywhileusinglesshotwater.
Expanding use of evaporative cooling, using direct evaporation in arid climates, and •evaporation combined with an air-to-air heat exchanger in more humid climates.
Constructing buildings with “cool” roofs that reflect rather than absorb infrared radiation in •warm and hot climates.
Integrating passive solar heating and cooling into home designs. There are considerable •difficulties of custom-designing the orientation and thermal characteristics of individual homes, but when it is done correctly, passive solar construction is a very cost-effective measure for saving energy.
The remaining measures focus on the other high-energy end-uses: hot-water heating, lighting, refrigeration, electronics/computers and other appliances.
In the residential sector, water heating uses as much energy as air cooling. This energy use in all buildings can be cut by utilizing more efficient water heaters, reducing distribution losses in the plumbing system, and reducing the heaviest demands for hot water in the home through water-saving appliances (dishwashers and clothes washers).11
Experience indicates a great deal of energy can be saved through increasing the efficiency of appliances. The best example may be refrigerators. Today’s refrigerators use one-fifth as much energy as comparable refrigerators did 35 years ago. Also they cost less, after inflation. These energy efficiency improvements have come about at least in part in response to federal regulations that require manufacturers to meet appliance energy efficiency standards that are increasingly strict over time.
Additional equipment that will result in significant energy savings in commercial buildings from available technology include:
More efficient lamps, ballasts and luminaires.•
Improved glazing with lower heat loss and appropriate solar gain.•
Improved controls for air conditioning systems.•
Variable speed fans/drives and pumps.•
Lower-pressure fan systems.•
Occupancy sensors for controlling lights and ventilation.•
Efficient designs for building elevators and escalators.•
Although analyses of energy savings stemming from single systems are the easiest to understand, they miss many of the big-picture, cost-effective options that come from integrating systems, such as:
The use of lighting designs that optimize the distribution of light so that it is brightest •where the most light is needed and less intense elsewhere.
The use of envelope designs that permit daylighting (described in the next section), while •controlling solar loads and glare.
Reduction in size and/or complexity of heating, ventilation, and air-conditioning (HVAC) •systems made possible as a consequence of better insulation in walls, roofs, and floors; improved windows; and reduced air leakage.

58 | ENERGY FUTURE: Think Efficiency American Physical Society • September 2008
The use of separate space conditioning and fresh air ventilation systems that allow oc-•cupants to control the systems based on need.
Separate control of cooling and dehumidification, so that cooling systems can be sized •to address cooling alone.
Lighting and window energy-efficiency technologies and strategies are common to residential and commercial buildings, though some lighting technologies are only appropriate for commercial applications. Lighting presents perhaps the greatest opportunity for immediate, cost-effective energy savings in buildings.
Incandescent lamps, a century-old technology, are the major source of light for residential buildings despite converting only 5 percent of their electric energy into light. Electric energy is generated and delivered to end-use sectors with an average of 31 percent efficiency. (See Endnote 2.) This means the overall efficiency of converting primary energy into incandescent light is only 1–2 percent. Clearly lighting is an area in which there is great room for improved efficiency. Figure 21 shows the status of lighting technology in the United States as of 2001.12
One widely available alternative is the compact fluorescent light (CFL), which uses one-quarter of the energy of an incandescent bulb to deliver the same light intensity and quality. Mercury is an environmental concern in all fluorescent lamps; however, replacing incandescent lamps with CFLs releases less mercury into the environment than traditional light bulbs when the mercury released through the burning of coal for electricity generation is taken into account (at current allowable rates of mercury emissions) [U.S. EPA, 2008].
12.PresumablytheexpandedsaleofCFLssince2001hasreducedenergyusedbyincandescentlamps,butwewerenotabletolocatemorerecentdata.
13.Electricenergyistypicallymeasuredinunitsofkilowatt-hours(kWh).1kWh=3,600,000joules.1TWh=1terawatt-hour=1billionkWh.
Figure 21
National lighting energy consumptionIn 2001, the U.S. consumed 8.2 quads of primary energy (corresponding to 765 TWh13 of delivered electricity) for incandescent, fluorescent, high-intensity discharge (HID) and light-emitting diode (LED) lighting technologies. Incandescent lamps remain the dominant lighting technology in the residential sector.
390 billion kWh used for lighting in all commerical buildings in 2001
Annual energy consumption (TWh / year)
Lighting energy consumptionby major sector and light source Breakdown of lighting energy
Sources: Navigant Consulting, Inc., U.S. Lighting Market Characterizations, Volume I, National Lighting Inventory and Energy Consumption Estimate, Final Report for Department of Energy, 2002
0 100 200 300 300 500
Outdoorstationary
Residential27%
Industrial14%
Outdoor stationary 8%
Commercial 51%
Industrial
Residential
Commercial
IncandescentFluorescent
Incandescent40%
LED (<.1%)
HID22%
Fluorescent38%
High intensitydischarge

American Physical Society • September 2008 ENERGY FUTURE: Think Efficiency | 59
To get a sense of the rough potential of improving lighting efficiency, assume that all incandescent lamps in use in 2001 were replaced by lamps that use one-fourth the energy, such as CFLs. The annual electric savings would be about 240 TWh, corresponding to 2.6 quads of primary energy. (No doubt some of these upgrades have been accomplished since 2001, particularly in the commercial sector.) A more precise recent analysis of lighting upgrades found that annual electric energy could be reduced by 120 TWh (1.3 quads primary energy) by upgrading residential incandescent lamps and upgrading ballasts and lamps in commercial buildings [McMahon, 2007].
Lighting upgrades will accelerate due to the enactment of the federal Energy Independence and Security Act of 2007, which phases in limits on the sale of incandescent bulbs. CFL sales are already booming, with annual sales now at 400 million units compared to 50 million units just 5 years ago. Solid-state lighting now being developed promises to produce lamps that double the energy savings from CFLs.
Expanding the use of natural lighting—so-called “daylighting”—can save an estimated 30–60 percent in lighting energy in many commercial buildings [Loftness, 2004]. Daylighting uses sensors and controls to adjust artificial lighting in response to changing natural light coming through windows and skylights. Wal-Mart used this approach to upgrade lighting in its 2,100 stores worldwide with energy savings that have a two-year payback in energy costs alone [Zimmerman, 2007].
Lighting energy can also be reduced by making better use of task lighting combined with sensors and controls that deliver light at appropriate levels where and when needed. Ironically, commercial buildings use about five times as much energy for lighting (per square foot) as do residential buildings, even though residential buildings are used more at night. One of the primary reasons for this is that residential buildings make better use of natural lighting and task lighting.
The rapid expansion of modern electronic equipment has resulted in homes and businesses containing dozens of smaller electronic loads such as computers, printers, faxes, copiers, microwaves, televisions, VCRs, DVD players and cable boxes. Many of these devices go into a standby mode and continue to use power even when turned off. A recent study estimated that an average California home contained more than forty products constantly drawing power. Together, those products consumed nearly 1000 kWh/year while off or in a low-power mode [Meier, 2008]. This represents about 8% of the average U.S. household electric energy consumption. Replacing such devices with Energy Star (http://www.energystar.gov/) rated devices would significantly lower energy consumption, particularly in standby or low-power mode.
––––––––––––––––––––––––––––––––––––––––––
We pause here to discuss combined heat and power (CHP) because it would enable buildings to make more efficient use of electrical generation plants. However, unlike the technologies mentioned above, CHP would require significant additional R&D to be practical in many cases. Also, CHP is not assumed in reaching the 30 percent energy efficiency improvement cited in Finding 1.
In addition to energy efficiency in a building, an energy supply technology directly associated with the building—combined heat and power (CHP)—represents a significant opportunity for energy savings, yet one that remains largely unexploited in the United States. The electric power sector discharges roughly two-thirds of its energy—nearly 26 quads annually—to the environment in the form of low-grade heat. That low-grade heat is being lost at the same time residential and commercial buildings are consuming 7.5 quads of natural gas to produce low-grade heat. Clearly a great deal of energy could be saved if waste heat could be delivered to places that need it. It sounds simple, but is very difficult to accomplish with centralized electric power stations. A few power plants do capture this waste heat and distribute it in district heating systems, but those types of plants are more common in Europe.

60 | ENERGY FUTURE: Think Efficiency American Physical Society • September 2008
For U.S. buildings, existing CHP opportunities are mostly limited to large building complexes such as those associated with colleges, universities and hospitals, which provide heating and cooling from a centralized natural gas or coal plant. These plants have the opportunity to produce both electricity and steam, with improved efficiency over plants that just produce heat or electricity. More opportunities could present themselves if communities develop more compact land use patterns, which is desirable from a transportation systems perspective as well. (See Chapter 2.)
CHP for individual buildings has been demonstrated using natural gas microturbines and fuel cells,14 which generate both electricity and heat for space heating and domestic hot water. Balancing the heat and electric demands proves challenging for a single building. For these technologies to achieve widespread use, R&D efforts are needed to bring down the costs of microturbines and fuel cells and to address a variety of technical and financial challenges [Marnay et al., 2007].
––––––––––––––––––––––––––––––––––––––––––
In determining what efficiency gains are possible with current and emerging technologies, it is useful to start by looking at what is happening under current standard practices. Contractors focused on energy upgrades to existing residential buildings achieve energy efficiency improvements ranging from 15 to 35 percent by installing better and more efficient insulation, windows (in some instances) and lights; by eliminating infiltration and duct leakage; by upgrading furnaces, boilers and air conditioners; by replacing the power supplies that waste electricity when their devices are in standby or low-power mode; and by replacing old appliances with newer, more efficient ones.15
Energy service companies (ESCOs) regularly work with larger commercial customers to perform energy audits followed by upgrades in lighting, HVAC equipment and system controls, by which they achieve cost-effective energy savings. We were unable to locate performance data for U.S. ESCOs. In Berlin, Germany, however, ESCOs have improved the energy efficiency of 1,400 buildings by an average of 24 percent at no cost to building owners and a profit to the ESCO that paid for the upgrade [C40 Cities, 2008]. U.S. results are likely to be similar. Generally, it is easier to achieve efficiency gains in new buildings than in existing ones.
Finding 1 is also based on an analysis conducted in 2000 as part of the Clean Energy Futures study [Brown et al., 2001] and recently updated to determine the potential for improvements in buildings [Brown, Borgeson and Koomey, 2008]. The analysis concludes that using currently available technology upgrades as they become cost-effective for current and new buildings would result in a 30 percent decrease in the annual energy consumption by residential and commercial buildings in 2030. (Endnote 3 explains why Finding 1 is worded more conservatively than the Clean Energy Futures study.) It turns out that the reduction erases the projected increase in energy consumption for the buildings sector, so that 2030 consumption by buildings could be the same as it is today.
Far more energy savings are technologically achievable, but not cost effective between now and 2030 for the individual consumer. Additional upgrades would be cost-effective if societal costs and benefits were taken into account.
As discussed later in this chapter, even the cost-effective energy savings will not be achieved by market forces alone; significant policy tools and incentives will be required. And the policy tools will also likely result in unexpected improvements coming into the marketplace, as has happened in the past.16
15.AnalysisprovidedbyDavidLeeoftheEnvironmentalProtectionAgency’sEnergyStarprogramprojectsthatEnergyStar–recom-mendedcost-effectiveenergyimprovementstoexistinghomesshouldyieldefficiencyincreasesrangingfrom8to38percent,witha28percentnationalaverage.
16.Forexample,refrigeratorsfrom1975topresent;clotheswashersfromabout1990topresent(therewerenostandardsandincentivesbeforethat);andCalifornia’sreductioninhomecoolingenergy[GoldsteinandHoffman,2004].
14.Buildingsuseseveralkindsofhydrogenfuelcells(phosphoricacid,moltencarbonate,solidoxideandPEM)forgeneratingelectricity.Thehydrogenforthesecellsisextractedfromnaturalgaswithareformerbeforegoingtothefuelcell.

American Physical Society • September 2008 ENERGY FUTURE: Think Efficiency | 61
17.Thismayproveimpossibleformultistorycommercialbuildings,inwhichcaseoff-siterenewableenergysourcesmayberequiredtoachievenetzeroenergy.
18.DOE’sEnergyEfficiencyandRenewableEnergy(EERE)BuildingTechnologiesProgramhassetthegoalof2025forZEBcommer-cialbuildings.
Recommendation 1:The federal government should set a goal that the U.S. building sector will use no more primary
energy in 2030 than it does in 2008. That goal should be reviewed every 5 years in light of the available technology and revised to reflect even more aggressive goals if justified by technological improvements. Achieving the goal will require that the federal government implement a set of policies and programs such as those discussed later in this chapter.
––––––––––––––––––––––––––––––––––––––––––Finding 2:
The goal of achieving significant levels of construction of cost-effective new zero-energy commercial buildings by 2030 is not obtainable without significant advancement in building technology and without the development and widespread adoption of integrated building design and operation practices.
Discussion: Zero-energy buildings (ZEBs), or “net-zero buildings,” are an attractive concept achievable by
merging efficient grid-connected buildings with renewable energy generation. The ideal is to use on-site renewable energy sources, typically a photovoltaic (PV) array, to annually generate as much energy as the building uses. A building, at times, buys energy from the grid while at other times, sells energy back to the grid. A ZEB is one that annually sells as much energy as it buys, or more. ZEBs are being built today, but are generally not yet cost-effective. Indeed, if cost and footprint are not constrained, one can simply add whatever renewable energy sources are necessary to achieve net-zero energy, no matter the efficiency of the building. But widespread construction of ZEBs requires that they be cost-effective and that the renewable energy sources fit into the building footprint.17 Since efficiency measures are much cheaper per unit energy than on-site renewable energy, both cost and footprint constraint lead to the requirement that such buildings first be made very efficient. Efficiency is also important to reduce energy consumption so that the required renewable energy sources can fit into the building footprint. A 70 percent reduction in energy consumption (as compared with conventional buildings) has been adopted as a consensus target for ZEB—though it is an estimate.
Various organizations, including the U.S. Congress (in the case of federal buildings), the American Institute of Architects (AIA) and the State of California, have called for all new commercial buildings to be ZEB by 2030.18 The AIA and California have established a 2020 goal for ZEB for all new residential buildings.
Commercial buildings serve a large and widely varying set of occupants and needs. For example, auditoriums and stores may at times be unoccupied, and at other times be crowded with hundreds of people. Some buildings are no larger than small homes while others accommodate 60,000 football fans or 20,000 office workers. And although there are examples of standardized commercial buildings, the largest buildings are often “one-of-a-kind” buildings with specialized criteria. Comfort and health require appropriate ventilation, heating, or more likely, cooling. Design engineers, rightly concerned about liability, commonly design systems for the maximum occupancy, and these systems typically waste enormous amounts of energy when occupancy is low.
There has been growing interest in the construction of green and energy-efficient commercial buildings. The Leadership in Energy and Environmental Design (LEED) certification, introduced in 2000 has rapidly grown in popularity and demand.19 Despite this growing interest there has been relatively little progress in reducing energy consumption in new commercial buildings.
62 | ENERGY FUTURE: Think Efficiency American Physical Society • September 2008
Information about hundreds of green commercial building projects may be found on the internet, many with impressive claims about their projected energy consumption. But obtaining actual energy consumption data for green commercial buildings is difficult. There are a growing number of LEED-certified new commercial buildings (552 through 2006), and the public assumes they are energy efficient, but the only study of their energy use is a recent New Buildings Institute review. The Institute obtained energy performance data for only 21 or 22 percent, of the buildings [Turner and Frenkel, 2008]. Of those, only six achieved site energy consumption levels per square foot that were 70 percent below the average for all commercial buildings per square foot. Only three of the buildings achieved that level of savings in primary energy consumption.20 Still, the New Buildings Institute concluded that the LEED buildings it examined were 25 to 30 percent more efficient than the average new commercial building, but not everyone would reach the same conclusion from the data. Whatever their efficiency, these 121 LEED buildings consume more total energy per square foot (either site or primary) than the average for the entire commercial building stock.
It should be noted that energy efficiency is but one of many criteria for LEED building certification and credits for energy efficiency are awarded based on design simulations, not measured building energy performance. There has been very little work on validating whether projections of performance correspond to actual building performance; that is an area requiring further research. What’s needed is a comprehensive system for rating building energy efficiency. More often than not, constructed buildings actually use more energy than predicted by energy simulations performed during the design process [Sacari et al., 2007]. This may be due to flaws in simulation tools; failures in the design, construction or operation of the building; or energy intensive “plug-loads” that were not included in energy simulations.21 Monthly energy bills cannot distinguish between energy used by building systems (lighting, heating, ventilation, air-conditioning, etc.) and plug-loads. Monthly energy bills for a very efficient hospital are likely to be higher than those for an inefficient elementary school. Neither design energy simulations nor monthly energy bills provide the complete picture of a building’s energy efficiency.
Very-low-energy commercial buildings are so rare largely because they are very difficult to design, construct and operate. The biggest barrier is the complexity of the buildings and their HVAC systems, and the important interactions between the various building systems and components. Significant efficiency improvements have been achieved when all of these factors were taken into account—using a process called “integrated design.”
Integrated design is a process in which all of the design variables are considered together, and hundreds or even thousands of combinations are analyzed to arrive at the optimal design which meets user requirements and minimizes energy consumption. The usual linear design process simply fails to account for interactions between the various building components—and these can have important energy and cost implications. (See Endnote 5.) For instance, the direct energy savings associated with choosing a better window technology may not justify the cost – and the linear design process rejects the upgrade. But the integrated design process goes on to determine that the window upgrade allows a smaller, more efficient HVAC system—with total cost savings that justify the window technology upgrade.
An experimental program run by Pacific Gas and Electric (PG&E) in the 1990s showed that 55–65% energy reduction could be accomplished using an integrated design approach [Brohard et al., 1997]. But the process was time-consuming and hard to replicate. The six low-energy LEED buildings offer further proof that 70% reduction in energy use can be accomplished. The challenge is to develop easily-replicable design and construction processes that achieve such results cost-effectively.
19.Seehttp://www.usgbc.org/.
20.StudydataweremadeavailabletousbyCathyTurneroftheNewBuildingsInstitute.Datafor98buildingsweresufficientlydetailedtocalculateprimaryenergy.Averagesiteandsourceenergyintensityforallnon-vacantcommercialbuildingswereobtainedfromtheEIA2003CommercialBuildingEnergyConsumptionSurvey(CBECS)database,andare95and198kBtu/sf,respectively.
21.Plug-loadsareelectricloadsassociatedwithequipmentandappliancesthatarepluggedintopowerreceptacles,andnotdirectlyassoci-atedwiththeoperatingofthebuildingitself.(LightingandHVACarenotplugloads).
American Physical Society • September 2008 ENERGY FUTURE: Think Efficiency | 63
Although it is a crucial component of the solution, integrated design cannot guarantee low-energy commercial building performance. Even the best-designed buildings, with well-thought-out integrated systems, can suffer in their construction by contractors who lack the skills and experience to implement the details faithfully. And facility managers may not know how to operate a new system properly. A $100 home appliance comes with a setup and operating manual; many buildings do not.
Recommendation 2:To achieve the ZEB goal for commercial buildings by 2030 the federal government should create
a research, development, and demonstration program with the goal of making integrated design and operation of buildings standard practice. Such a program should be carried out co-operatively between the federal government, state governments and electric utilities, with funding coming from all three entities.
Since reducing energy consumption and carbon footprint is one of the most important goals for green buildings, any green building rating system, such as LEED, should give energy efficiency the highest priority, based in part on actual energy performance, and require reporting of energy consumption data.
––––––––––––––––––––––––––––––––––––––––––Finding 3:
The goal of achieving significant levels of construction of cost-effective zero-energy residential buildings by 2020 is feasible, except perhaps for hot, humid climates. Most of the required technology to compete with traditional housing is available but inadequately demonstrated. To achieve this goal in hot, humid climates will require increased R&D to develop low-energy dehumidification and cooling technologies and strategies.
Discussion: Cost-effective zero energy homes are not available today, but there has been significant progress
in developing efficient single-family homes. Employment of cost-effective efficient technologies has resulted in new, low-budget, single-family homes that use half as much primary energy as comparable conventional homes [Norton et al., 2005; Christian, 2007]. And 80 to 90% reduction in energy used for heating (though not total energy) has been achieved by passive solar homes22 in Germany, Austria, Switzerland, Sweden and France [Schnieders, 2008].
The U.S. Department of Energy’s Building America program directly addresses the fundamental problems of bringing energy efficiency to new residential buildings. The program provides technical support for builders to construct very energy-efficient residential buildings at low or no increased first cost to the consumer. Building America works with builders who are responsible for more than 50 percent of new residential construction in the United States. More than 50,000 competitively priced houses have been constructed under the program, with an average energy use for heating and cooling that is 30 to 40 percent less than that of typical new residences. DOE’s new Builders Challenge sets a more ambitious goal of 30 percent savings in total building energy. Still, this program has a long way to go to meet the ultimate goal of constructing and selling zero-energy houses by 2020.
Building America addresses two basic problems in commercializing zero-energy houses: assuring the cost and energy performance of state-of-the art technologies and acquainting the building industry with the techniques to build such houses. There is an R&D effort associated with this program that supports the need to reduce costs, improve energy performance and address the cooling and dehumidification requirements of hot, humid climates.
22.Apassivesolarhomeusesawell-insulatedandtightlysealedthermalenvelopealongwithveryefficientwindowstoreduceheatingload,andmeetsmuchoftheremainingheatingrequirementwithsolarheating.

64 | ENERGY FUTURE: Think Efficiency American Physical Society • September 2008
The Building America approach is an effective way to create new markets for energy-efficient housing. Funds to support more demonstration activities could speed up the process of commercializing very-low-energy houses. Promoting Building America along with programs that show the value of building energy codes and strict efficiency standards for appliances will produce very large gains in energy savings in new houses.
––––––––––––––––––––––––––––––––––––––––––Finding 4:
The federal government is not investing sufficient funds in R&D for next-generation building technologies, for training building scientists or for supporting the associated national laboratory, university and private sector research programs.
Discussion:Federal funding is especially important in the building sector, which is highly fragmented and
consists largely of smaller firms that are unable to conduct R&D or have no economic incentive to do so because of an inability to capture the benefits of R&D. Yet funding for energy efficiency R&D for buildings, especially commercial buildings, has declined significantly.
In the 1980s, when levels of effort were much higher than today, federal R&D on energy efficiency in buildings achieved notable success. A National Academy study [NAP, 2001] estimated the economic benefits from advanced window coatings and electronic fluorescent ballasts to be $23 billion (in 2000 dollars). Both technologies resulted from federally funded energy efficiency R&D efforts that expended far less than $23 billion.
Examples of research, development and demonstration that could enable the achievement of deep savings for the majority of new commercial buildings include:
Computer tools:• Improved computer tools are needed to facilitate integrated design by ana-lyzing interactions among building elements that affect energy use. In addition to continued development of complex computer tools such as EnergyPlus, the simulation developed over years by DOE, there is a need for tools that are simpler to use and appropriate during the early stages of design when key decisions are made. These simpler tools need not be crude; indeed, with the low cost of computing, complex programs like EnergyPlus could be made much more user-friendly to meet this need. Such programs could also be used for building labels.
Monitoring and control technologies: • Advanced technologies are needed to support diag-nostics, fault detection and control in real time for a variety of building energy systems.
More efficient building components:• Among the needs are advances in air conditioning and ventilation systems; advances in LED and conventional lighting and their controls; advanced, affordable coatings for windows; envelope systems that optimize air transfer, wa-ter transfer and heat transfer together on a climate-sensitive basis; and building-integrated photovoltaic systems.
Test facilities: • Controlled experiments for commercial buildings in different climate re-gions would benefit from the creation of test facilities. These facilities would allow tests of advanced facades (walls, roofs and windows) coupled with innovative HVAC systems and next-generation controls and monitoring. Such facilities are needed in different climate zones: cold winter/hot summer; hot humid summer; and mild winter/summer.
Demonstration programs:• Demonstration programs showing that commercial buildings can be built to use 70 percent less energy than current structures would encourage the build-

American Physical Society • September 2008 ENERGY FUTURE: Think Efficiency | 65
ing industry to pay more attention to integrated design and other energy efficiency practices. Unlike demonstrations for residential buildings, such commercial demonstration programs should be seen as R&D rather than straightforward commercialization of a process.
Static insulation: • Nanotechnology developed for direct energy conversion devices can also be applied to create high-performance thermal insulation materials for various thermal sys-tems. Materials with nanometer-sized channels hold the promise of reducing heat transfer, which will open the possibility of a thin, rigid, high R-value (a measure of insulation effec-tiveness) insulation panel for retrofit of interior surfaces of exterior walls. Such technology could also be applied to improve the performance of foam and fiberglass insulation.
Dynamic insulation:• Nanotechnology has the potential to develop switchable insulations in which the thermal conductivity could be varied by an order of magnitude. For example, this type of insulation would allow interior thermal mass elements to be “charged” during the evening by night cooling, insulated in the morning and then used during peak afternoon periods.
Lighting:• Solid-state lights can be used to increase lighting efficiency and applied to tailor lighting distribution to specific needs within a commercial building. They are potentially twice as efficient as fluorescent lamps
Windows:• Current research is developing windows with high insulation values and selective control of the solar spectrum. Advanced materials for coatings and frames have the potential to produce window systems that achieve net energy gains during the winter and substantially reduced air conditioning loads in the summer.
Active building facades: • Long-term R&D could lead to active building facades that can modulate daylighting, solar gains and ventilation in response to monitoring of interior condi-tions. For example, application of innovative materials and mirrored systems could distrib-ute daylight much deeper into commercial building interiors and might lead to reductions in lighting energy requirements by 50 percent or more.
Advanced air conditioners and heat pump systems:• Today’s systems operate at about one-fourth of ideal efficiencies. R&D on systems optimization, heat transfer enhancement and advanced controls can lead to much higher efficiency in space conditioning.
Natural ventilation: • Properly designed and operated natural ventilation systems can reduce cooling loads in commercial buildings by 50 percent or more in many U.S. climates. Pre-diction of air flow and thermal conditions in large, open-plan buildings is needed to assure proper operation under a variety of climatic conditions.
Energy performance data and analysis:• Buildings will be increasingly monitored for their energy performance. The creation of these data on a broad scale opens enormous research opportunities to understand energy performance of buildings in the real world. Compilation and analysis of these data is of great importance in informing policy and guiding R&D.
Indoor environmental quality, health and productivity:• Concerns exist that very-energy-efficient buildings can degrade health and productivity of building occupants. R&D is need-ed to identify when and if such problems arise from high efficiency and to establish measures to mitigate adverse effects if they occur.

66 | ENERGY FUTURE: Think Efficiency American Physical Society • September 2008
As a means to insuring that R&D on energy use in buildings is able to thrive over the long term, it is essential to train this and future generations of building researchers and leaders among building energy professionals in government and the private sector. For scientists and engineers, gradu-ate programs with opportunities to pursue energy efficiency research need to be established and expanded.
Recommendation 3:The federal government should increase its investment in R&D to achieve the ZEB goal of 2030
for commercial buildings and 2020 for residential buildings. The current investment of somewhat more than $100 million per year is considerably less in constant dollars than the research program of 1980, which led to important innovations. The 1980 program in today’s dollars would be about $250 million, and we recommend that funding for building R&D be increased to that level in the next 3 to 5 years, after which it should be carefully reviewed. The review should determine the level of continuing federal funding needed for the program to reach its goals, including examining what technology is ready to go to market. One use of the additional spending should be to expand the existing demonstration program for low-energy construction of residential buildings, along with associated research, as noted in Finding 3.
––––––––––––––––––––––––––––––––––––––––––Finding 5:
A wide range of market barriers and market failures discourage investment in energy-efficient technologies.
Discussion:If so many energy efficiency measures are cost-effective why are they not adopted? This question
has stimulated considerable discussion [IEA, 2007; NAP, 1992; Cavanagh, 2004; Goldstein, 2007]. Consider the barriers that inhibit adoption of cost-effective technologies—barriers faced by consumers, manufacturers, builders, designers and suppliers of efficient products.
These include:
Not knowing:• The utility customer knows her total bill but not the contribution of the dif-ferent appliances and the heating and cooling equipment, nor the thermal integrity of the house. Policies such as Energy Star labels and appliance and building standards and labels are essential to overcome this barrier. Even with labels, consumers may not always be aware of highly efficient products on the market or be willing or able to calculate the payback from an initial higher purchase price.
Not caring:• For most consumers, energy is a small cost compared with other expenditures. For example, prior to 2002 typical TVs with remote controls used 5 to 7 watts of standby power when turned off to permit the instant-on feature to function. In 2002 TVs were re-quired to reduce standby power to 3 watts or less to qualify for Energy Star. On November 1, 2008, standby power must be reduced to 1 watt or less for new standalone TVs to qualify. For the individual consumer, the reduction from 6 watts to 1 watt represents just a few dol-lars in savings per TV per year. That sounds trivial, but applied to 300 million televisions across the United States, it represents about $1 billion in electric savings. The cost of making the improvement is small, so the manufacturer has a strong incentive to reduce the standby power to 1 watt to qualify for the Energy Star label. But given the overall cost of operating a TV, the consumer is not likely to care about the slight improvement in standby power ef-ficiency. Split incentives:• If the energy-using equipment or building is owned by a person who does not pay the energy bill, there is little or no incentive to invest in efficiency. Landlords who do not pay for energy, which is typical, are not likely to gain an advantage from installing energy

American Physical Society • September 2008 ENERGY FUTURE: Think Efficiency | 67
efficiency measures. In residential buildings, about one-third of all dwellings are occupied by renters. Split incentives can also apply within a single company: Often the capital budget for building improvements is under one manager while the operating budget is controlled by another.
Stalled demand for innovation:• If manufacturers do not produce energy-efficient products, consumers cannot purchase them. And if consumers do not demand energy efficiency, then producers have little incentive to make their products more efficient. This “chicken and egg” problem applies to appliance manufacturers as well as to builders and building designers. The circle can be broken by policy decisions but is not likely to be resolved by market forces alone.
Reluctance to change: • An important barrier to improved efficiency is inertia. For many years, manufacturers produced appliances with little concern about energy efficiency. After appliance standards were implemented, first by California in 1978, and then by the federal government in 1990, electricity consumption by new refrigerators declined over a 30-year period from 1,72523 to 498 kWh/yr while increasing considerably in size.24 The same phe-nomenon occurred for other appliances, although to a lesser degree. Prior to the standards, energy use had been increasing; for refrigerators it was increasing at 6 percent annually.
Utility profits coupled to sales: • Traditionally utilities (typically electric and natural gas companies) have rate structures that connect their profits to energy sales—the more energy they sell, the more money they make. This offers a disincentive for the utility company to help customers become more efficient and use less energy. Yet utility companies are best positioned to assist customers in identifying ways to improve energy efficiency. Establish-ing rate structures in which utility profits are decoupled from sales removes one of the most important barriers to energy efficiency.
To make the situation even more difficult, the design process itself provides disincentives to incorporate energy efficiency into buildings. For commercial buildings, the lack of coordination between engineers and architects, the payment of design fees that discourage integrated design (which adds to design costs as it later saves in operational costs) and the lack of the required complex knowledge to make the building energy efficient all discourage the use of the best—that is, integrated—approaches to design and construction.
Not only do fragmentation and inefficient design processes provide justification for more federal energy efficiency R&D, they also mean that innovative energy-saving products are unlikely to be produced by manufacturers and thus will not be available to consumers. This problem in the building industry accounts for the inability of the industry to develop first-rate tools for integrated design and operation of buildings.
The example of fluorescent light ballasts makes clear the need for policies to promote energy efficiency. Standard core-coil ballasts were far less efficient than newer ballasts. There was no difference in performance between the two ballasts, and the payback period for the efficient ballast was approximately two years at 1987 electricity prices. In short, the inefficient ballasts made no economic sense. Yet outside of five states that had banned the standard ballasts, inefficient ballasts captured 90 percent of the market in 1987. (The efficient ballasts cost an average of $4.40 more than the inefficient one—$15.40 versus $11—and produced an average savings of $2.15 per year—hence the two-year payback.)
23.Thisincludesmanualdefrost;theaveragefortopfreezerautomaticdefrostinthatyearwas2121kWh/yr.
24.Therefrigeratorstandardthatproducedthegreatestsavings—the1993standard—didnotemergeinavacuumbutwasinformedbysuccessfulOakRidgeNationalLaboratorycompressorresearchthatdemonstratedwhatwaspossible.ThisexampleillustrateshowR&Dandpolicytoolsworktogethertoadvanceefficiency

68 | ENERGY FUTURE: Think Efficiency American Physical Society • September 2008
It is worth noting that the largest portion of purchasers of fluorescent lights are managers of commercial buildings, who might be expected to make purchases with high paybacks and be familiar with technology as simple as fluorescent ballasts. But it took the passage of a federal ban through a 1988 amendment to the National Appliance Energy Conservation Act of 1987 to move the market away from the inefficient ballasts.
These barriers are not unique to the United States. They are observed all over the world. Even developing economies and centrally planned economies are subject to the same failures.
__________________________________________________
Experience has shown that particularly in the case of buildings, even the best cost-effective technologies are not readily adopted without policies to pull them into the market place. This may be especially true for the buildings sector, where unnecessary energy costs that may make little difference to the individual consumer can have large cumulative effects.
Below we discuss several policy tools that we believe should be part of a portfolio of efforts to promote energy efficiency in buildings. The detail about how to apply these tools is beyond the scope of this study, and this is not meant to be a comprehensive list. For example, we do not discuss electric rate decoupling, which would enable utilities to make money from reducing consumption, as mentioned above. Our main point is to emphasize yet again the absolute need for both research and policy to make progress in energy efficiency.
Finding 6:Among the most effective tools for increasing energy efficiency in buildings are building energy
codes, labeling, audit programs and tax and other incentives for the purchase of efficient technology. For appliances, heating and cooling equipment and lighting, both mandatory efficiency standards (e.g. for appliances), voluntary standards (e.g., industry consensus guidelines for lighting usage), and energy labels (e.g., the Energy Star label developed and promoted by the Environmental Protection Agency and DOE) have been effective. Utility demand-side management (DSM) programs that provide
incentives for energy efficiency have been very successful.
Discussion:We limit our discussion to appli-
ance standards, building energy codes, and utility DSM programs, as those have been especially effective in the United States. Figure 22 shows the impact of the three programs in California, calculated conservatively by the California Energy Commission. Since the mid-1970s electric energy use per capita nationally has risen steadily while for California it has remained relatively flat. Today Californians use about 5,000 kWh per person per year less than the average American. Appliance standards, building energy codes, and
Figure 22
Electric savings from California’s energy efficiency programsAnnual electric energy savings in California since 1975 associated with appliance standards, building energy standards and utility DSM programs.
Source: Art Rosenfeld, California Energy Commission
0
5,000
10,000
15,000
20,000
25,000
30,000
35,000
40,000
45,000
GW
h pe
r yea
r
Appliance standards
15% of annual electricity use in California in 2003
Utility efficiency programs
Building standards

American Physical Society • September 2008 ENERGY FUTURE: Think Efficiency | 69
utility DSM programs are estimated to be responsible for one-fourth [Sudarshan, 2008] to one-third [Rosenfeld, 2008] of the difference.25
Appliance StandardsIn 2000, appliance standards reduced U.S. electricity use by approximately 88 billion kWh,
2.5% of total U.S. electricity use. That same year, the standards reduced peak generating needs by approximately 21 GW (roughly equivalent to 21 large power plants).26 Over the 1990–2000 period, standards have reduced consumer energy bills by approximately $50 billion, with benefits being more than three times the cost of meeting the standards [ACEEE, 2008].
By 2010, existing appliance standards are estimated to cut annual U.S. electricity use by 268 billion kWh per year, and that figure is expected to grow to 483 billion kWh by 2020. This means expected reductions of about 7 percent and 11 percent of projected electricity use in 2010 and 2020, respectively. Peak electricity savings are estimated to increase from 72 GW in 2010 to 158 GW in 2020, and annual carbon dioxide savings from 240 Mt in 2010 to 375 Mt in 2020. The net savings from these standards approaches $300 billion [Nadel et al., 2007]. New standards adopted after 2008 could increase these totals substantially. Preliminary estimates by the American Council for an Energy Efficient Economy (ACEEE) are that new standards to be implemented by mid-2011 have the potential to increase annual savings levels by another 190 billion kWh per year, increase peak demand savings by an additional 80 GW and cut annual carbon dioxide emissions by another 165 Mt by 2030. Figure 23 shows the effect of the appliance standards on the efficiency of three major appliances.
Utility Demand-Side Management Directed at Customer Energy EfficiencyDemand-side management (DSM) programs are programs in which some central agency, often an
electric or natural gas utility, invests money to assist customers in becoming more energy efficient. The investment may be in education programs or customer rebates to encourage purchase of more
25.ThebulkofthegapmaybeexplainedbyCalifornia’smoderateclimateandotherstructuralfactors,includingshiftsinindustry[Su-darshan,2008].NotethataccordingtoFigure5theseprogramsaccountforaboutone-fifthofthegap.
26.Theunitofpoweris1watt=1joulepersecond.Largenuclearpowerplantsproduceenergyatarateofroughly1GW=1gigawatt=109watts
Figure 23
Impact of standards on efficiency of 3 household appliancesGas furnaces
Central air conditioners
Refrigerators
Refrigerators
Central air conditioners
Source: A. Rosenfeld, California Energy Commission; S. Nadel, ACEEE, in ECEEE 2003 Summer Study, www.eceee.org
1972 1976 1980 1984 1988 1992 1996 200020
30
40
50
60
70
80
90
100
75%
60%
25%
Inde
x (1
972
= 10
0)
110 Effective dates of national standards
Effective dates of state standards
Gas furnaces

70 | ENERGY FUTURE: Think Efficiency American Physical Society • September 2008
efficient appliances, or the agent may pay for the bulk of the efficiency upgrade, as in weatherization programs for low-income customers. (See Endnote 4)
DSM programs involving customer energy efficiency have reduced growth in electricity sales in the short run by providing financial incentives for energy efficiency purchases by consumers. Utility DSM has also served to transform markets by aiding the commercialization of new energy-efficient products.
Analysis of specific DSM programs has shown benefits greater than costs. For the nation, total annual utility expenditures on customer energy efficiency from 1995 through 2006 have varied from a low of $880 million in 1998 to a high of $1,700 million in 1995. DSM is returning as a favored utility program, with expenditure in 2008 estimated to be higher than the 1995 level. Levels are expected to continue to increase for the foreseeable future.
Building Energy Codes
Energy codes are adopted at the state or occasionally local level in the United States and are enforced by local code officials at the city or county level. Most states follow national models established by the two nonprofit organizations that write model codes, the International Code Council and the American Society of Heating, Refrigerating and Air-Conditioning Engineers (ASHRAE).
California is one of the states that has not followed these models; it has been a leader in building energy standards that it develops itself. Energy codes adopted since 1975 in California reduced peak power demand in 2003 by 5.75 GW while reducing electric energy use by 11 TWh/yr. The economic value of energy savings is more than $30 billion or more than $2000 per household. The electric energy needed to cool a new home in California has declined by two-thirds (about 2400 kWh/yr to 800) from 1970 to 2006, despite the fact that today’s new home is about 50 percent bigger and is in a warmer climate as new development occurs farther from the coast. The California energy code was revised in 2002, 2005, and 2008; each revision cut energy use by 10–15 percent compared to the previous iteration. This is an annual rate of improvement of about 4 percent.
There is little federal involvement in establishing building energy codes. The federal government, through the Department of Housing and Urban Development, sets standards for manufactured housing and DOE provides modest technical assistance to the model codes organizations.
While energy codes are often thought of in a context limited to new construction, they also save energy in existing buildings. When a new tenant moves into a space in a commercial building and replaces the lights or the HVAC system, that action triggers the energy code requirements. When a home is remodeled, the systems affected must meet energy code: Thus, a kitchen remodel requiring changes to the electrical system in California triggers the need to meet the lighting efficacy standards. A few localities also require retrofits at time of sale for both commercial and residential properties.
Energy codes typically offer two methods of compliance: a prescriptive checklist approach and a performance-based approach that relies on simulated energy performance of the proposed building compared to a comparable reference building. The performance approach is preferred overwhelmingly by builders in states where a usable method of calculating and displaying performance is available, because it allows the builder to meet the energy goal at the lowest first cost. Calculations software that is accessible for use by architectural and engineering firms and consulting companies that provide technical expertise in meeting codes is available nationally for homes, but only widely in California for commercial buildings. The European Union (EU) has requirements that a building energy label be developed for all new buildings and that energy evaluation needs to take place when a building is sold. These will result in easily used software throughout the EU. Efforts are under way to harmonize this development within EU member states and with the residential system used in the United States.

American Physical Society • September 2008 ENERGY FUTURE: Think Efficiency | 71
Recommendation 4:DOE should promulgate appliance efficiency standards at levels that are cost-effective and
technically achievable, as required by the federal legislation enabling the standards. DOE should promulgate standards for all products for which it has been granted authority to do so, including those appliances for which there is not a specific congressional mandate. A streamlined procedure is needed to avoid delays in releasing the standards.
Recommendation 5:Considering the cost effectiveness of utility DSM to date, and the fact that many states have
hesitated in creating such programs, the federal government should encourage states to initiate DSM programs through their utilities. The federal role could be to provide rewards to states that have significant and effective DSM programs and disincentives to those that do not.
Recommendation 6:
Building energy standards, such as those promulgated in California, should be implemented nationwide. States should be strongly encouraged to set standards for residential buildings and require localities to enforce them. For commercial buildings, performance-based standards that rely on computer software to compare a building design with a reference building are implemented only in California. The federal government should develop a computer software tool much like that used in California to enable states to adopt performance standards for commercial buildings. States should set standards that are tight enough to spur innovation in their building industries.

72 | ENERGY FUTURE: Think Efficiency American Physical Society • September 2008
Endnote 1. Energy EfficiencyEnergy efficiency is traditionally defined as the ratio of the “useful energy” to the energy consumed
or taken in.27 A typical coal electric power plant takes in 100 units of coal energy and produces 34 units of electric energy, making the plant 34 percent efficient. As noted in the introduction, an 80 percent efficient natural gas furnace delivers 80 units of heat (useful energy) to a house for every 100 units of natural gas energy consumed, with the remaining 20 units of energy lost as exhaust through the flue.
This traditional definition of energy efficiency is not adequate in identifying many opportunities for reducing (primary) energy consumption through improved technology and alternate strategies. Consider, for instance, two otherwise identical houses, one having no thermal insulation and the other being well-insulated. Both are heated by 80 percent efficient natural gas furnaces. Let us suppose the insulated house uses one-fifth as much energy for heating as does the uninsulated house. We view the insulated house as being more energy efficient—but in what sense? In both cases the energy used to heat is considered “useful energy”; hence both homes by our traditional definition are 80% efficient. But the uninsulated house uses 5 times as much “useful energy.”
Another problem with the traditional definition arises when we consider electric resistive heat. Electric resistive heaters are, in the traditional sense, 100% efficient at converting electric energy into heat (useful energy). Hence replacing the aforementioned natural gas furnace with electric heat would appear to be an improvement in energy efficiency. Yet if we trace the electric energy back to its primary sources we see that the electric-heated home uses considerable more primary energy—and is not to be regarded as more efficient.
Here we adopt a more general definition of energy efficiency that avoids these problems. This definition of energy efficiency is the ratio of the minimum primary energy required to perform a task divided by the actual primary energy consumed by the specific process.28 This second definition tells you how well you are doing as compared with the best possible solution. For the electric power generation from coal described earlier this yields the same 34% efficiency. We note that it is frequently difficult or even impossible to determine the minimum primary energy required to accomplish a certain task. But even without knowing that number, we can compare the efficiencies of two different methods of performing the same task and determine their ratio. Applying this more general definition to our earlier example of two houses, we find the insulated house to be 5 times as efficient (with respect to heating) as the uninsulated house.29
With this new definition of energy efficiency it is instructive to consider again the typical natural gas furnace, providing heat to keep the inside of a house at 70 ºF when the outside temperature is 32º F. The task that this furnace achieves is use of natural gas to deliver heat to the interior of a house. What is the minimum primary energy required? You could start with natural gas to produce electricity with greater than 50% efficiency, then use the electricity to run a heat pump that pumps heat into the house from the outside air or ground with a heating coefficient of performance (COP) that theoretically could be as high as 14 (i.e., it delivers 14 units of heat for 1 unit of electric energy used). Present heat pumps have COPs closer to 3, but, in theory, they could be as high as 14 for the inside and outside temperatures mentioned above [Carnahan et al., 1975]. This method would use less than one-seventh of the energy of our original natural gas furnace. It is a common misconception to believe that there isn’t much room to improve the efficiency of an “efficient” natural gas furnace.
C h a p t e r 3 E n d n o t e s
27.Inthe1975AmericanPhysicalSociety(APS)EnergyEfficiencyStudythiswastermed“first-lawefficiency”[Carnahan et al.,1975].
28.Inthe1975APSEnergyEfficiencyStudythiswastermed,“second-lawefficiency”[Carnahan et al.,1975].
29.Toactuallydeterminetheefficiencyofeitherofthehousesonemustfirstdeterminetheminimumprimaryenergythatmustbesuppliedtoheatthem—thisisasmallnumber,possiblyevenzeroasoccupantsandsunlightmaybesufficienttoheathomes.

American Physical Society • September 2008 ENERGY FUTURE: Think Efficiency | 73
Endnote 2. Electricity, Primary Energy and Site EnergyMost of our energy comes from fossil fuels—oil, natural gas and coal. These are primary energy
sources, as are nuclear, hydro, biomass and a variety of renewable sources including wind and solar. A few primary energy sources, most notably natural gas, are delivered directly to buildings and used on site. Other forms of primary energy, such as nuclear and hydro, are not delivered directly to buildings, but instead are used off site for generating electricity. In the United States, energy content of primary sources is generally measured in British thermal units (Btu), the amount of heat that is required to raise the temperature of one pound of water by one degree Fahrenheit. One quad is equal to one quadrillion or 1015 Btu.30 One Btu is equal to 1054 joules (J), where the joule is the metric unit for energy.
Electricity is a secondary form of energy. It cannot be gathered, mined or pumped from the ground but instead must be produced from primary energy sources. Most of our electric energy is generated from heat produced from coal, natural gas or nuclear energy with an average efficiency of 34 percent—that is, roughly two-thirds of the primary energy used is lost to waste heat, and only one-third is converted into electric energy.31 Moreover, 6-7 percent of the electric energy generated is used at the generating plant or lost in transmission. As a result, only 31 percent of the primary energy consumed is delivered for end use; the remaining 69 percent is lost as waste heat.
Electric energy is measured in kilowatt-hours (kWh) or their common multiples.32 The watt is a measure of power, the rate of use (or production) of energy. One watt is equal to one joule per second. One kWh = 3,600,000 J, the amount of energy used for the length of time of one hour at a rate of 1000 W. This is also equal to 3,416 Btu.
Though electricity is produced with much inefficiency, it is also a far more useful form of energy than heat—it powers motors, advanced lighting, computers, and a host of other devices that require work rather than heat energy. Hence electric energy is vital for buildings. But it is important to recognize that it comes with a particularly high cost in terms of primary energy and associated greenhouse gas emission (GHG).
Seventy-two percent of all electric energy in the United States is consumed by the commercial and residential sectors, with industry and, to a very small degree, transportation, using the rest. Figure 24 shows the flow of primary energy into the electric power sector, and the distribution of electricity generated to the commercial, residential, industrial and transportation end-use sectors.
The heavy reliance of buildings on electric energy combined with the large losses in generation and distribution of electricity complicate the process of tracing building energy consumption back to the primary energy sources. It is far easier simply to total up monthly energy bills and calculate the energy used at the building itself—the so-called site energy.33 From Figure 24 we see that buildings use 2,646 TWh of electric energy, corresponding to 9.0 quads of site energy due to electricity. But the source energy34 or primary energy consumed off-site to provide this electric energy is 28.6 quads. And, since each primary energy source has a different carbon emission factor35, an even more detailed accounting of primary energy is required to determine greenhouse gas emission associated with building energy consumption.
30.Onequadisalsoequalto1.054exajoules,ortheamountofenergycontainedin170millionbarrelsofoil.
31.Newercombined-cyclenaturalgasplantshavemuchhigherefficienciesbutdonotmakeupasignificantfractionofthenation’selectricitygeneratingcapacity.
32.TheseincludeMWh(megawatt-hour=1millionkWh),GWh(gigawatt-hour=1billionkWh),andTWh(terawatt-hour=1trillionkWh).

74 | ENERGY FUTURE: Think Efficiency American Physical Society • September 2008
The primary energy used by buildings directly as fuels (i.e., delivered to buildings) and indirectly through electricity is listed in Table 2. Buildings use a total of 10.3 quads of primary sources on site for fuel, mostly natural gas and petroleum (specifically, home heating oil). Nearly three times as much primary energy, 28.6 quads, is used by buildings indirectly in the form of electricity, which brings total primary energy consumption by buildings to 38.9 quads. The last column of the table lists the associated greenhouse gas emissions in millions of metric tons (megatons) CO2 (MtCO2). Clearly, coal used for generating electricity—nearly 15 quads—is the dominant source of GHG emission associated with buildings.
The large disparity between electric site and source energy leads to considerable confusion when reporting building energy consumption. In this report we use Btu if and only if we are referring to primary energy and kWh when referring to end-use electric energy. Any exception to this convention is made explicit in the text.
It is also clear that site energy, while relatively easy to calculate and of some use in comparing buildings with the same fuel mix, is not a useful concept in determining either GHG emission or energy security. In general, to have a positive national impact on GHG emission and energy security, the goal of energy efficiency must be to reduce primary energy consumption, not site energy consumption.
2006 flows of primary energy into the four end-use sectors (Commercial, Residential, Industrial, and Transportation) by way of the Electric Power Sector. The electric power sector took in 39.7 quads of primary energy and produced 3,900 TWh of electric energy, 3,650 of which were delivered to end-use sectors and 250 TWh either used internally or lost in transmission. The overall efficiency of delivering energy to end-use sectors from primary energy was 31%.
Coal
Coal
35.5%
51.6%
20.7%
15.8%
9.7%
1.6%
0.6%250 TWhT&D Loss
3,650TWhSales
39.7 quads 3,900 TWh
Waste heat26.3 quads
37.0%
27.3%
0.2%
Commercial
Residential
Industrial
Transportation
Nuclear
Natural gas
Renewables
Petroleum
Other
The flow of electric energy by sector
33.Forindividualbuildings,thesiteenergyintensityinBtu/sfisfoundbyaddinguptheannualpurchasedenergyinBtuanddividingbythegrosssquarefootageofthebuilding.Forthiscalculation,1kWhofelectricenergyisequivalentto3,416Btu,ignoringanylossesas-sociatedwithgeneratinganddeliveringelectricenergy.
34.Forindividualbuildings,thesourceenergyintensityinBtu/sfisobtainedsimilarlytothesiteenergyintensity,butbyassigning10,800BtuofprimaryenergytoeachkWhofelectricenergy,therebyaccountingforthe69%averagelossesintheelectricpowersector.
35.CarbonemissionfactorsprovidethemassofcarbonemittedperBtuofenergyreleased.
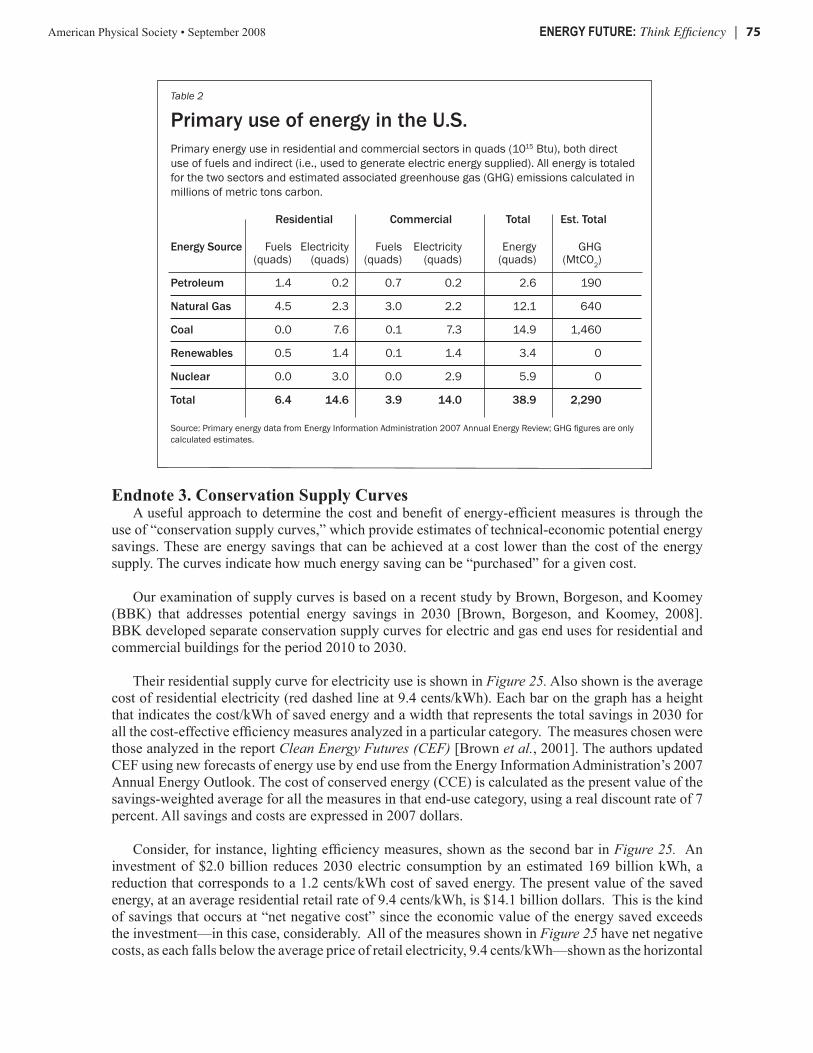
American Physical Society • September 2008 ENERGY FUTURE: Think Efficiency | 75
Endnote 3. Conservation Supply CurvesA useful approach to determine the cost and benefit of energy-efficient measures is through the
use of “conservation supply curves,” which provide estimates of technical-economic potential energy savings. These are energy savings that can be achieved at a cost lower than the cost of the energy supply. The curves indicate how much energy saving can be “purchased” for a given cost.
Our examination of supply curves is based on a recent study by Brown, Borgeson, and Koomey (BBK) that addresses potential energy savings in 2030 [Brown, Borgeson, and Koomey, 2008]. BBK developed separate conservation supply curves for electric and gas end uses for residential and commercial buildings for the period 2010 to 2030.
Their residential supply curve for electricity use is shown in Figure 25. Also shown is the average cost of residential electricity (red dashed line at 9.4 cents/kWh). Each bar on the graph has a height that indicates the cost/kWh of saved energy and a width that represents the total savings in 2030 for all the cost-effective efficiency measures analyzed in a particular category. The measures chosen were those analyzed in the report Clean Energy Futures (CEF) [Brown et al., 2001]. The authors updated CEF using new forecasts of energy use by end use from the Energy Information Administration’s 2007 Annual Energy Outlook. The cost of conserved energy (CCE) is calculated as the present value of the savings-weighted average for all the measures in that end-use category, using a real discount rate of 7 percent. All savings and costs are expressed in 2007 dollars.
Consider, for instance, lighting efficiency measures, shown as the second bar in Figure 25. An investment of $2.0 billion reduces 2030 electric consumption by an estimated 169 billion kWh, a reduction that corresponds to a 1.2 cents/kWh cost of saved energy. The present value of the saved energy, at an average residential retail rate of 9.4 cents/kWh, is $14.1 billion dollars. This is the kind of savings that occurs at “net negative cost” since the economic value of the energy saved exceeds the investment—in this case, considerably. All of the measures shown in Figure 25 have net negative costs, as each falls below the average price of retail electricity, 9.4 cents/kWh—shown as the horizontal
Table 2
Primary use of energy in the U.S.Primary energy use in residential and commercial sectors in quads (1015 Btu), both direct use of fuels and indirect (i.e., used to generate electric energy supplied). All energy is totaled for the two sectors and estimated associated greenhouse gas (GHG) emissions calculated in millions of metric tons carbon.
Residential Commercial Total Est. Total
Energy Source Fuels Electricity Fuels Electricity Energy GHG (quads) (quads) (quads) (quads) (quads) (MtCO2)
Petroleum 1.4 0.2 0.7 0.2 2.6 190
Natural Gas 4.5 2.3 3.0 2.2 12.1 640
Coal 0.0 7.6 0.1 7.3 14.9 1,460
Renewables 0.5 1.4 0.1 1.4 3.4 0
Nuclear 0.0 3.0 0.0 2.9 5.9 0
Total 6.4 14.6 3.9 14.0 38.9 2,290
Source: Primary energy data from Energy Information Administration 2007 Annual Energy Review; GHG figures are only calculated estimates.

76 | ENERGY FUTURE: Think Efficiency American Physical Society • September 2008
red line in the figure.36 If all of the measures shown in Figure 25 were deployed, they would save 572 billion kWh in 2030 for an investment of $5.2 billion. The value of the saved energy in 2030 at current prices is $54 billion.
Each of the four supply curves estimated by BBK (of which only one, for residential electricity, is shown here) indicate that the forecasted building-sector consumption in 2030 can be reduced by about 30% at a cost less than current retail energy prices. These results are similar to results of conservation supply curves that have been developed over many years. Typically, the cost-effective potential is on the order of 10 to 15% in the very near term (five years) because of low turnover, 25 to 30% in the intermediate term (10–20 years), and much higher (depending on the development and experience with new technologies) in the longer term [Nadel, Shipley and Elliott, 2004].
This approach, like all others, is a simplification. The estimates of technical-economic potentials are undoubtedly low because they ignore any technologies for which market experience is limited, fail to consider system integration (e.g., integrated design of lighting, windows, and air conditioning), do not account for future advances in technology, ignore the economic benefits of reductions in energy prices due to demand reductions and exclude a variety of other factors.
It is also important to note that there can be a large difference between the estimates of cost-effective energy savings and those that can be expected in the real world. Because the conservation supply curve underestimates the technical-economic potential over a 20-year time horizon, we believe it is possible to achieve these levels even in the face of market barriers. This cannot happen, however, without strong energy efficiency policies.37
This 30 percent savings will not be achieved by market forces alone. Significant policy tools and incentives will be required to achieve these results. Yet the committee is skeptical that any reasonable policies will achieve the 100 percent deployment of cost-effective technologies assumed in this study. On the other hand, experience shows that some technological advances will occur between now and 2030 and will provide even further efficiency improvements than those included in the BBK study.
Figure 25
Residential electric savings potential for year 2030Conservation supply curve for electric energy-efficiency improvements in the residential sector. For each measure considered, (the energy savings is achieved at a cost per kWh less than the average residential retail price of 9.4 cents/kWh, shown as the horizontal red dashed line.
0 100 200 300 400 500 600
Cost
of c
onse
rved
ene
rgy
(cen
ts/k
Wh)
2030 Energy savings (TWh)
10
9
8
7
6
5
0
1
2
3
4
Color TV LightingOther uses
Waterheating
Space heaterFurnace fans
Personal computers Space coolingDishwasher
Freezer
Refrigeration
Savings potentialof 572 TWh 30% of reference case
9.4¢ / KWh
Clothes washer
572 TWh
36.ForthosefamiliarwiththeMcKinseyconservationsupplycurve—these“negativecost”measurescorrespondtotheleft-handsideoftheMcKinseycurve.

American Physical Society • September 2008 ENERGY FUTURE: Think Efficiency | 77
The committee believes these two factors are offsetting, so that the 30 percent savings is indeed achievable.
Historically, three policies have had especially important impacts on energy use in buildings in the United States—appliance efficiency standards, building energy codes and utility demand-side management. These are discussed briefly in the text. Here we provide more information.
Endnote 4. Policies That Work
Appliance Standards38
Efficiency standards require products such as refrigerators, electric motors and air conditioners to meet specific energy requirements. Minimum efficiency standards apply to new equipment sold in the United States. Consumers still can choose from a range of efficient products with desired attributes and features.
A History of Federal Support
Minimum efficiency standards for appliances and other equipment were adopted by the federal government in order to address market failures, replace a patchwork of state standards, save consumers money and reduce energy use and peak electrical demand. They were first adopted by states, many of which continue to utilize standards to the extent permitted by federal law. In California, by far the most active state in setting appliance efficiency standards, the initiative to upgrade and extend standards has been a hallmark of both Democratic and Republican governors’ programs.
In 1986, appliance manufacturers and energy efficiency supporters agreed to support uniform •national standards on an array of products. In 1987, President Reagan signed the National Appliance Energy Conservation Act (NAECA). Standards for fluorescent lamp ballasts were added by Congress in 1988, and in 1992, President Bush signed the Energy Policy Act that included efficiency standards for certain types of lamps, electric motors and commercial heating and cooling equipment.
In 1989 and 1991, the elder Bush administration issued tougher standards for refrigerators, •clothes washers and dryers, and dishwashers, and began work on several additional standards, laying the groundwork for the Clinton administration to set new standards for refrigerators, room air conditioners, ballasts, clothes washers, water heaters and residential central air conditioners and heat pumps. (The George W. Bush administration reaffirmed the Clinton clothes washer and water heater standards but tried to weaken the new air conditioner standard to a seasonal energy efficiency ratio (SEER) of 12, down from SEER 13. That attempt was overturned in court.)
Efficiency Standards Overcome Market FailuresMinimum-efficiency standards are needed to overcome market failures that restrict the use of
more efficient products. Among these failures are:
Third-party decision makers (e.g., landlords and builders) who purchase appliances but do not •pay the operating costs of the products they purchase;
Panic purchases that leave little time for consumers to become educated;•
37.Basedonpreviousexperience,especiallythatofCalifornia,whichhashadstrongpoliciestopromoteenergyefficiencyinbuildings,ithasinfactbeenpossibletoachievethetechnical-economicpotentialovera20-yearperiod,thusattainingmuchlowerelectricitygrowththanhadbeenforecast.
38.Source:FactsheetfromtheAmericanCouncilforanEnergyEfficientEconomy,athttp://www.aceee.org/energy/applstnd.htm.
78 | ENERGY FUTURE: Think Efficiency American Physical Society • September 2008
Inadequate and misleading information about the relative energy performance of products; •and
High first costs for efficient equipment due to small production quantities and the fact that •manufacturers frequently combine efficiency features with extra non-energy features in expen-sive trade-up models.
Energy Efficiency Standards Provide Substantial Public Benefits Standards enacted to date are having a significant impact on U.S. energy use while saving
consumers and businesses billions of dollars. Appliance standards rank with automobile fuel economy standards as the two most effective federal energy-saving policies.
In 2000, according to analyses by the U.S. Department of Energy and the American Coun-•cil for an Energy Efficient Economy (ACEEE), standards reduced U.S. electricity use by approximately 88 billion kWh and reduced U.S. total energy use by approximately 1,200 trillion Btu. These savings are 2.5% and 1.3% of U.S. electricity and energy use in 2000, respectively.
In 2000, standards reduced peak generating needs by approximately 21,000 MW — equiv-•alent to displacing seventy 300 MW power plants. Without those savings, the shortages during the electricity crisis in California in 2000 and 2001 would have been significantly worse than they were.
Over the 1990–2000 period, standards have reduced consumer energy bills by approxi-•mately $50 billion. Under standards, equipment prices have risen modestly, but estimates by the Lawrence Berkeley National Laboratory and ACEEE indicate that the benefits are more than three times the costs on a net present value basis.
As old appliances and equipment wear out and are replaced, savings from existing stan-•dards will steadily grow. By 2010, savings will total more than 250 billion kWh (6.5% of projected electricity use) and reduce peak demand by approximately 66,000 MW (a 7.6% reduction). Over 1990–2030, consumers and businesses are projected to save approximate-ly $186 billion (1997 dollars) from standards already adopted.
To meet standards, manufacturers often make investments in improving products, but fiscal •impacts on manufacturers are generally modest. For example, in its 1990 Annual Report, Mor-Flo, a major water heater manufacturer, noted that since NAECA: (1) “we no lon-ger have to produce models to address the varying state energy efficiency standards;” (2) “price increases on ... minimum standard models have more than offset the corresponding cost increases resulting in an improved gross profit margin;” and (3) since the standards took effect, “the Company has been selling a larger number of ‘step-up’ models.”
Building Energy Codes Energy codes have a large influence on energy efficiency in states where they are considered
important. In California, energy codes adopted in 1975 have resulted in energy savings of more than $30 billion, or more than $2,000 per household. To illustrate how effective the codes have been, the California Energy Commission compiled data on the energy needed to cool a new home, and the figure decreased by two-thirds from 1970 to 2006. That decrease came despite the fact that the new homes in 2006 were about 50 percent bigger than the 1970 homes.
California’s code development process shows the value of continuous updating. The state’s energy code was revised in 2002, 2005, and 2008, and each revision cut energy use by another 10 to 15 percent.

American Physical Society • September 2008 ENERGY FUTURE: Think Efficiency | 79
Unlike California, most states don’t develop their own energy codes but instead follow national model codes established by the International Codes Council and the American Society of Heating, Refrigerating and Air-Conditioning Engineers, both nonprofit organizations. ICC and ASHRAE are not mandated to set strict energy efficient standards, and they have routinely produced weaker model standards based on consensus rather than on rigorous evaluation of the cost effectiveness of more stringent standards.
There is little federal presence in this area. The Energy Policy and Conservation Act of 1975 required DOE to set a national code, but the act was repealed in 1981. The only direct federal influence on codes is for manufactured housing, where the Department of Housing and Urban Development (HUD) established a national code decades ago. That code hasn’t been revised since 1994 and is significantly weaker than the International Energy Conservation Codes. DOE has some code modeling programs, but the annual budget is less than $10 million, and the department has not taken a leading role in supporting major improvements in efficiency.
Codes are enforced at the local level, not by the organizations that develop and adopt the codes, and this split responsibility is a cause of inadequate enforcement. The effectiveness of code enforcement has not been measured very often or very rigorously, but the available evidence suggests that states that put a priority on effective enforcement through adequate staffing and training programs get results within 10 percent of the expected energy consumption. States without such programs do considerably worse.
The California Energy Commission has estimated that a good nationwide program to enhance energy code enforcement would cost about $50 million annually. If it improved energy performance in new construction by only 10 percent, it would save about $300 million a year.
Utility Demand-Side Management Directed at Customer Energy EfficiencyDemand-side management (DSM) programs, as noted in the body of the report, assist customers
in becoming more energy efficient through education programs, efficient appliance purchase rebates, weatherization programs and other methods typically financed by utilities. DSM programs involving customer energy efficiency improvements have played two important roles. First, they have provided subsidies for energy efficiency purchases by consumers, reducing growth of kWh in the short term. Second, utility DSM programs have transformed markets by bringing energy-efficient products into widespread use.
Analysis of specific DSM programs has shown benefits greater than costs. Such analysis would
ideally consider the amount spent on energy-efficiency programs in a given year along with the total energy savings (in that and all future years) resulting from the investment. Such data are not readily available. Instead, the Energy Information Administration asks utilities to annually report the amount spent on energy efficiency programs and load management programs,39 along with the estimated energy savings achieved in that same year due to these and all previous such investments.
Table 3 shows these data for 1995 through 2006. The direct expenditure (in millions of dollars) on energy efficiency programs is shown in column 2, the direct expenditure on load management programs in column 3 and the indirect expenses for administering both programs in column 4. To obtain the total spent on just energy efficiency, we distribute the indirect costs to energy efficiency and load management in the same proportion as their direct costs and arrive at the total spent on energy efficiency in column 5. The last column gives the total electric energy saved in that year due to these and all previous investments. For the 12 consecutive years, $13.8 billion was spent on DSM energy efficiency programs resulting in roughly 650 TWh of saved electric energy.
Endnote 5. Integrated DesignBecause designing, constructing and operating very-low-energy commercial buildings is so difficult,
39.DiscussionswithEnergyInformationAdministrationstaff

80 | ENERGY FUTURE: Think Efficiency American Physical Society • September 2008
they are rare. The two major databases that collect information on high-performance buildings both show a paucity of very-low-energy buildings. One database is maintained by DOE (http://www.eere.energy.gov/buildings/database/index.cfm) and the other is compiled by the New Buildings Institute on buildings that meet the Leadership on Energy and Environmental Design (LEED) standard (http://newbuildings.org/).41 Together they contain energy consumption data for 159 commercial buildings, which are intended to represent the most energy-efficient commercial buildings in the United States. In these databases we find only 17 U.S. commercial buildings with measured annual site energy intensity that is 70 percent lower than the national average for all commercial buildings. And these very-low-energy buildings are usually the smaller ones—
together they contain less than 4% of the gross square footage of the 159 buildings. Even more disconcerting is the fact that the average annual site energy intensity (on a per square foot basis) for these 159 relatively new, “green” buildings is actually higher than the average for the entire U.S. commercial building stock—calculated either as site or primary energy..42
Although it is impossible to extrapolate from these limited databases to all new commercial building construction, it is clear that the number of very-low-energy commercial buildings constructed annually in the United States is small. On the positive side, the 17 buildings that have achieved the 70 percent reduced energy level demonstrate that it can be done.
Why are so few such low-energy commercial buildings being constructed?
A “commercial building is a complex system, with the energy use and performance of any one part of the system affecting the energy use of the building as a whole through a complex cascade of interactions. However, the typical design process for commercial buildings is a linear, sequential process that precludes the analysis and design of the buildings as an integrated system. In order to achieve deep savings in energy use, an integrated and iterative design process, involving all members of the design team, is required” [Harvey, 2006].
The integrated process may be defined as one in which “all of the design variables that affect one another are considered together and resolved in an optimal fashion” [Lewis, 2004]. The sequence
Table 3
Demand-side management programs Demand-side management program direct and indirect costs (in millions of dollars)Indirect costs are overhead costs not attributable to specific programs. Total energyefficiency cost is the sum of direct EE plus a proportional amount of the indirect costs 40
Energy Load Indirect Total energy Energy savings
efficiency mgmt. cost efficiency (GWh) 1995 $1,409 $569 $419 $1,701 55,328 1996 $1,052 $572 $279 $1,232 59,853 1997 $892 $455 $289 $1,084 55,453
1998 $766 $467 $188 $883 48,775
1999 $820 $431 $173 $934 49,691 2000 $939 $446 $181 $1,061 52,827 2001 $1,098 $358 $175 $1,229 52,946
2002 $1,007 $414 $205 $1,152 52,285 2003 $807 $352 $138 $903 48,245 2004 $910 $515 $132 $995 52,662 2005 $1,169 $626 $127 1,252 58,891 2006 $1,258 $666 $127 $1,342 62,951
TOTAL: $12,128 $5,896 $2,429 $13,768 649,907
Source: Energy Information Administration
40.Source:EnergyInformationAdministration,FormEIA-861,“AnnualElectricPowerIndustryReport.”
41.Thedataforthe121LEEDbuildingsweremadeavailabletousbyCathyTurner,NewBuildingsInstitute.
42.TheEIA’s2003CommercialBuildingEnergyConsumptionSurvey.estimatestheaverageannualsiteenergyintensityfornearly4.7millionnon-vacantbuildingstobe95kBtu/sf,whichis23percentlowerthantheaverageforthese159buildings.Primaryenergydataareavailablefor132ofthe159buildings.Averageprimaryorsourceenergyconsumptionforthissubsetis38%higherthantheCBECSaverageof198kBtu/sf.

American Physical Society • September 2008 ENERGY FUTURE: Think Efficiency | 81
of steps that is typically followed today often leads to solutions that are far from optimal. For example, HVAC capacity and equipment are often decided before the major contributors to the internal loads of a building are known.
Significant interactions among all design elements of a building affect heating and cooling loads (e.g., window size, placement, and thermal characteristics; window shading types and placement; lighting locations, efficacy and local controls; building orientation; number and wattage of plug loads; and the volume of outside air that is circulated into a building).
All of these elements need to be considered in light of advanced technology options (e.g., on-site generation, passive ventilation, thermal mass with night ventilation, chilled ceiling displacement ventilation, dehumidification and daylighting). Control strategies and operating conditions for all of the equipment in the building strongly affect the effectiveness of the design and technology choices for the building.
Finally, all of these complex design and engineering issues must themselves be integrated with decisions on structural issues, space planning, site context, materials selection and other issues, all within the context of tight budgets and schedules.
To address these interactions among the different components of a building, integrated design and operation requires cooperation among the major decision makers in a building project—architects, engineers, and builders—to evaluate the projected energy consumption for a variety of designs. Building professionals must also enjoy a comfort level in using results of computer tools to underpin important design decisions. Software that is understandable to everyone involved is needed, so that the group’s collective knowledge is codified and used as different problems and solutions are addressed in the design, construction, and eventually the operation of the building.
The need goes beyond the design process. Even the best-designed buildings, with well-thought-out integrated systems, can suffer in their construction by contractors who lack the skills and experience to implement the details faithfully. And facility managers may not know how to operate a new system properly. A $100 home appliance comes with a setup and operating manual; many buildings do not.
Just as any complex machine gets out of tune with use, commercial buildings decline in performance if problems are not corrected. A recent study of U.S. commercial buildings found that HVAC equipment that is either faulty or not operated properly accounts for between 2 and 11 percent of energy consumption [TIAX, 2005]. Performance would be improved by an advanced diagnostic and control system, running alongside a real-time building energy simulator, with sensors to collect operating data, identify problems as they occur and recommend adjustments.

82 | ENERGY FUTURE: Think Efficiency American Physical Society • September 2008
Figure 26
A commercial building with integrated systems design and operationsThis diagram of a large commercial building shows various aspects and systems whose interactions are important for optimum building operation and minimum energy consumption.
Source: Lawrence Berkeley National Lab
RoofFuel cell PV panels
Detailed area
Weather station for loadprediction and control
Dimming ballasts withefficient fixtures
Occupancy controlsair quality sensors
Intergrated controls with real time modeling, fault diagnostics and optimization
Efficient boiler with heat recovery
Efficient chiller with heat recovery
Light shelves
Awnings
Automated blinds
Automated blinds
Electrochromatic glazingintegrated with thermal
and daylighting systems
VAV boxes with duct pressure reset
Electric load optimization with real time pricing among multiple buildings
Oversized coolingtower
Figure 26 is a schematic diagram of the technologies that could enable integrated operation of a commercial building of the future.

American Physical Society • September 2008 ENERGY FUTURE: Think Efficiency | 83
2007 Buildings Energy Data Book,• prepared for the Buildings Technologies Program and Office of Planning, Budget, and Analysis, Energy Efficiency and Renewable Energy, U.S. Department of Energy by D&R International, Ltd., September 2007.
American Council for an Energy Efficient Economy (ACEEE), • http://www.aceee.org/energy/applstnd.htm (2008).
G. J. Brohard • et al., Advanced Customer Technology Test for Maximum Energy Efficiency (ACT2) Project: The Final Report, Pacific Gas & Electric, 1997.
M. A. Brown, M. D. Levine, W. Short and J. G. Koomey, “Scenarios for a Clean Energy • Future,” Energy Policy 29, 1179-1196 (2001).
R. Brown, S. Borgeson and J. Koomey, • Building-Sector Energy Efficiency Potential Based on the Clean Energy Futures Study, 2008, to be published.
C40 Cities Climate Leadership Group, • http://www.c40cities.org/bestpractices/buildings/berlin_efficiency.jsp, 2008.
W. Carnahan, K. W. Ford, A. Prosperetti, G. I. Rochlin, A. Rosenfeld, M. Ross, J. Rothberg, G. • Seidel and R. H. Socolow, eds., Technical Aspects of the More Efficient Utilization of Energy, Conference Series, vol. 25, American Institute of Physics, New York (1975).
R. Cavanagh, • Energy Efficiency in Buildings and Equipment: Remedies for Pervasive Market Failures, National Commission on Energy Policy, 2004.
J. Christian, • Affordable and Demand Responsive Net Zero House, draft report, private communication (2008).
Committee on Benefits of DOE R&D on Energy Efficiency and Fossil Energy, Energy Research • at DOE: Was It Worth It? Energy Efficiency and Fossil Energy Research 1978 to 2000 National Academy Press, Washington, DC (2001).
L. R. Glicksman, “Energy Efficiency in the Built Environment,” • Physics Today, July 2008, p. 35.
D. B. Goldstein, • Saving Energy, Growing Jobs, Bay Tree Publishing, Berkeley, CA (2007).
D. B. Goldstein and M. G. Hoffman, “Forecasting an Increasing Role for Energy Efficiency in • Meeting Global Climate Goals,” Proceedings of the 2004 Summer Study on Energy Efficiency in Buildings, American Council for an Energy Efficient Economy, Washington, DC, August 2004.
L. D. Danny Harvey, ed., • A Handbook on Low-Energy Buildings and District-Energy Systems: Fundamentals, Techniques and Examples, Earthscan Publications Ltd., London, 2006.
International Energy Agency, • Mind the Gap: Quantifying Principal-Agent Problems in Energy Efficiency, IEA, Paris, 2007.
I. Johnstone, • “Energy and Mass Flows of Housing: Estimating Mortality,” Building and Environment, v.36, pp.43-51 (2001).
C h a p t e r 3 R e f e r e n c e s

84 | ENERGY FUTURE: Think Efficiency American Physical Society • September 2008
M. Lewis, • “Integrated Design for Sustainable Buildings, Building for the Future, ASHRAE Journal, Supplement, p. S22 (September 2004).
V. Loftness, “Improving Building Energy Efficiency in the U.S: Technologies and Policies • for 2010 to 2050,” in proceedings of the workshop, The 10-50 Solution: Technologies and Policies for a Low-Carbon Future, sponsored by the Pew Center on Global Climate Change and the National Commission on Energy Policy (2004).
C. Marnay, G. Venkataramanan, M. Stadler, A. S. Siddiqui, R. Firestone and B. Chandran, • “Optimal Technology Selection and Operation of Commercial-Building Microgrids,” IEEE Transactions on Power Systems (2007), and references therein.
J. McMahon, “Buildings: Energy Efficiency Options,” presentation at the Haas School, • University of California, Berkeley, Nov. 27, 2007.
A. Meier, Lawrence Berkeley National Laboratory, private communication (2008).•
S. Nadel, A. M. Shipley and R. N. Elliott • The Technical, Economic, and Achievable Potential for Energy Efficiency in the United States: A Meta-Analysis of Recent Studies, American Council for an Energy Efficient Economy, (Washington, DC, 2004).
S. Nadel • et al., Leading the Way: Continued Opportunities for New State Appliance and Equipment Standards, ACEEE, Washington DC (2006); also see Energy Bill Savings Estimates as Passed by the Senate, ACEEE, Washington DC (December 14, 2007), posted at http://www.aceee.org/energy/index.htm.
P. Norton • et al., Affordable High-Performance Homes: A Cold-Climate Case Study, NREL/TP-550-31650, National Renewable Energy Laboratory, Golden, CO, April 2005.
Panel on Policy Implications of Greenhouse Warming, • Policy Implications of Greenhouse Warming: Mitigation, Adaptation, and the Science Base, National Academy Press, Washington, DC (1992).
A. Rosenfeld, California Energy Commission, private communication (2008).•
J. L. Barrientos Sacari, U. Bhattacharjee, T. Martinez and J. J. Duffy,• “Green Buildings in Massachusetts: Comparison Between Actual and Predicted Energy Performance,” Proceedings of the American Solar Energy Society, Cleveland, OH, July 9-13, 2007.
J. Schnieders, “CEPHEUS—Measurement Results from More than 100 Dwelling Units in • Passive Houses,” posted at http://www.cepheus.de/eng/index.html.
A. Sudarshan and J. Sweeney, “Deconstructing the ‘Rosenfeld Curve’,” submitted to • Energy Journal (2008).
TIAX LLC,• Energy Impact of Commercial Building Controls and Performance Diagnostics: Market Characterization, Energy Impact of Building Faults and Energy Savings Potential, final report prepared for the U.S. Department of Energy Building Technologies Program, Washington, DC (November 2005).
C. Turner and M. Frankel, • Energy Performance of LEEP for New Construction Buildings, Final Report, New Buildings Institute, White Salmon, WA, 2008

American Physical Society • September 2008 ENERGY FUTURE: Think Efficiency | 85
U.S. Environmental Protection Agency, Energy Star Program, • Frequently Asked Questions: Information on Compact Fluorescent Light Bulbs (CFLs) and Mercury, http://www.energystar.gov/ia/partners/promotions/change_light/downloads/Fact_Sheet_Mercury.pdf, June 2008.
C. Zimmerman, Wal-Mart, “The Continuing Evolution of Sustainable Facilities at Wal-Mart,” • private communication, (2008).