Embed Size (px)
Citation preview

Disclaimer: Attention of readers is drawn to important disclaimers printed at the end of this document
Live Company Group Building value – brick by brick
Live Company Group (LVCG) remains a young company, founded effectively in Q4 2017,
with only five employees reported in the FY17 accounts. 2018 was a transformational
year for the Group on many levels, which saw it entering 2019 as a stronger business
with exciting international growth potential, capturing a higher proportion of the value-
added edutainment proposition it offers to its primarily family-centred customers. The
most important of these transformational changes in our view was the acquisition of its
major supplier, Bright Bricks, for £8.5m in October 2018.
► Bright Bricks acquisition – Live Company had already grown to become Bright Brick’s major customer, when Live Company announced its acquisition of Bright Bricks in October 2018. This vertical integration greatly expands the Intellectual Property (IP) of Live Company, enhances speed to market, increases competitive advantage and raises barriers to entry. It also secures supply of bricks for future expansion and will consolidate enhanced financial margins at all levels of the P&L.
► BRICKLIVE Touring introduced – In April 2018, Live Company announced a £1m equity raise to fund the creation of a set of touring assets under the BRICKLIVE Touring sub-brand. This was in effect taking assets - previously used only within its shows - on tour. The first set, Animal Paradise, comprised 65 animal models with an educational element on endangered species. This added a new channel for LVCG’s build assets, complementing its larger multi-themed and multi-zoned shows. The development of related themes, such as “Brickosaurs” and the recently-launched “Ocean”, enables LVCG to offer multi-year deals, with zoo clients for example, on a rotating basis.
► Major multi-year contracts won – LVCG has announced three multi-year contracts in the Far East, a multi-year agreement with AWC in Germany and most recently a five-year deal with Nickelodeon UK, underlining the importance of finding the right commercial partners and the appeal of LVCG’s experiential edutainment offering. We believe the deal with Nickelodeon, a global IP owner and children’s entertainment brand, could potentially be more transformative and create more shareholder value over the longer-term than last year’s acquisition of Bright Bricks.
► FY18 prelims – These reflect the impact of the transformational events and equity raises of 2018 with a pre-exceptional loss before tax of £1.3m and post-exceptional loss of £2.6m. The number of shows and events hosted increased to 34 in 2018 from 18 in 2017, with international revenue share moving to 88.1% from 67.1% in FY17.
► Forecasts and valuation - Our forecasts move into profitability in the current FY19E year with PXPBT of £0.2m, followed by £1.7m in FY20E and £3.6m in FY21E, with a concomitant rise in net cash balances across the period to £2.5m by FY21E. Top line growth is strong across the period (27% three-year CAGR to FY21E), driven by a rising number of events, with growth anticipated across all geographies. Based on our compco valuation analysis, we believe an appropriate valuation range on a one year view for Live Company is 73p – 89p. This suggests limited downside risk, with strong potential to outperform as newsflow underpins its longer-term growth prospects.
FOR QUALIFIED AND PROFESSIONAL INVESTORS ONLY 14 June 2019
Market data Ticker LVCG Price (p) 69.9 12m High (p) 104.99 12m Low (p) 40.1 Shares (m) 70.4 Mkt Cap (£m) 50.0 Market AIM
LVCG share price chart LN Media
Description Live Company is a content producer and provider, specialising in creative and educational play based on interlocking bricks, best exemplified by LEGO® bricks. This is delivered to consumers through live events and shows under its proprietary BRICKLIVE brand. BRICKLIVE is a family entertainment specialist, promoting the benefits of interlocking bricks as educational tools through interactive play and creative live experiences. Live Company’s strategic objective is to build BRICKLIVE as a leading global children’s entertainment and education brand.
Company Information
Exec Chairman – David Ciclitira
CSO – Andrew Smith
CFO – Bryan Lawrie
www.livecompanygroup.com
Corporate Broking
Damon Health
+44 207 186 9952
Analyst
David Jeary
Live Company Group
14 June 2019 2
Contents
Investment Case .................................................................................................... 3
Introduction to Live Company ................................................................................ 6
BRICKLIVE principles and market backdrop .......................................................... 10
Physical play underpins cognitive development .................................................. 10
Promotion of social interaction through play ...................................................... 11
Delivery of educational entertainment – ‘Edutainment’ ..................................... 12
Increasing footfall to key attractions ................................................................... 13
Out of Home Entertainment ................................................................................ 13
Exhibition Market ................................................................................................ 14
Detailed overview of Live Company ..................................................................... 16
The BRICKLIVE brand ........................................................................................... 16
Bright Bricks ......................................................................................................... 17
Other commercial interests ................................................................................. 21
Bricklive Shows .................................................................................................... 22
Global partners .................................................................................................... 26
BRICKLIVE Touring ............................................................................................... 27
Zoos ..................................................................................................................... 27
Other tours .......................................................................................................... 28
The economics of touring assets ......................................................................... 30
Revenue model .................................................................................................... 32
FY18 prelims ........................................................................................................ 34
Recent newsflow.................................................................................................. 36
Estimates ............................................................................................................. 36
Valuation ............................................................................................................. 40
Peer analysis ........................................................................................................ 40
Valuation discussion ............................................................................................ 42
Valuation conclusion ............................................................................................ 44
Senior Management and Board of Directors ........................................................ 45
Board of Directors ................................................................................................ 45
Key Senior Management...................................................................................... 47
Risks .................................................................................................................... 49
Major shareholders.............................................................................................. 51
Summary Financials ............................................................................................. 52
Disclaimer ............................................................................................................ 54

Live Company Group
14 June 2019 3
Investment Case ➢ Unique investment opportunity: Live Company represents a unique investment opportunity as a content developer,
producer and provider, specialising in creative and educational play based on interlocking bricks. This content is delivered to its target audience of families and children through a combination of shows, exhibitions and other live events under its proprietary BRICKLIVE brand. Following the acquisition of its main content builder, Bright Bricks, in 2018, the ownership of its own proprietary computer software, its own design studio and its own in-house production facility provide both significant competitive advantages as well as significant barriers to entry and protection of its Intellectual Property (IP). Live Company’s strategic objective is to build BRICKLIVE as a leading global children’s entertainment and education brand.
➢ Specialist skills in developing interactive experiences: LVCG has a specialist design hub, which develops concepts to create interactive experiences in all its shows and events. Examples include the introduction of features such as interactive educational trails, graffiti walls, selfie zones, map build zones and brick pits. These are core interactive features, in which LVCG is quickly becoming a specialist. These features help to drive footfall, to attract families and visitors and to increase dwell time at events, which is important to and highly valued by venue operators. This unique knowledge base for creating interactive and family entertainment experiences will be further enhanced by the Group working with Nickelodeon UK, the leading children’s TV network.
➢ Nickelodeon deal potentially more transformational than Bright Bricks acquisition: The deal with a global children’s entertainment brand is a massive endorsement for LVCG and its product/service proposition. To date, the Group has used its world class model building production hub to produce popular tour assets that are generic (eg animals, dinosaurs) and over which no third party holds IP rights. The Nickelodeon deal creates a marriage of world class content from a global IP owner with the world class model building skills of LVCG in a mutually beneficial arrangement. LVCG benefits commercially from leasing these touring assets, while Nickelodeon receives extensive marketing exposure to existing and potential customers (in addition to a royalty fee based on tour revenues). It is not difficult to imagine such a deal being rolled into other geographies with Nickelodeon if successful, nor to imagine potential deals with other IP content owners. Were this deal to be extended in the fullness of time and/or similar deals struck with other IP owners, this would have considerable positive implications for LVCG and value creation for shareholders.
➢ Universal appeal of interlocking bricks: BRICKLIVE promotes the benefits of interlocking bricks, as exemplified by LEGO®, as educational tools through interactive play and experience. The universal appeal of such bricks is evidenced by many statistics on the sale of LEGO bricks and its global fan base. LEGO sells over 70 billion elements per annum in over 130 countries. This equates to just over 9 LEGO elements per capita for the global population (of 7.6bn) and over 50 elements per capita for children aged 5 – 14. There are more than 340 recognised LEGO User Groups (LUGs), with more than 500,000 registered members known as Adult Fans of LEGO (AFOLs). Live Company plays directly into this extensive universal appeal of interlocking bricks.
➢ Positive market fundamentals: The market fundamentals for BRICKLIVE shows and events are strong. Leisure spending has shown historic long-term growth, and is forecast to grow further, as average working hours have declined and disposable income has risen. International tourism has shown positive growth, including a trend towards a rising number of shorter breaks rather than the previous tradition of fewer longer breaks. The growth of emerging economies, along with their growing middle class cadre with rising disposable incomes, is also fuelling the travel and leisure industries.
➢ Multiple growth drivers: Live Company benefits from multiple ways of leveraging its IP assets and content development. These include:
1. Content producer and provider: The Company designs, builds and produces brick-based content for shows, exhibitions and events around the world and continues to extend its product offering.
2. Geographic expansion – winning clients in more countries and geographies, in addition to driving market penetration in markets where they are already present.

Live Company Group
14 June 2019 4
3. BRICKLIVE asset base and brand extensions – with the introduction of touring assets in 2018, BRICKLIVE can create a number of touring assets under different BRICKLIVE sub-brands to optimise utilisation of the content it has built. The number of themed tours and sets of touring assets within the BRICKLIVE brand has grown significantly and is forecast to continue to grow, with BRICKLIVE sub-brands able to cater for a wide range of host locations.
4. Content creation for third party IP owners – Live Company can create brick models and statues of characters – under licence – for third party IP owners and their own promotional activities, as evidenced by the recent announcement with Nickelodeon UK Ltd.
5. Sales of kits and branded merchandise – providing an incremental revenue stream at BRICKLIVE shows and tours
6. Sponsorship – with BRICKLIVE’s growing global presence, the brand is becoming more attractive for a potential sponsorship deal.
➢ Flexible business model with footfall-driving characteristics - Live Company’s business model is based on the principle of thinking globally and acting locally. This enables it both to maintain a strong strategic focus on its BRICKLIVE brand and also to tailor its offering to cater for and appeal to local audiences, thereby increasing customer satisfaction and enhancing its brand equity. Careful selection of its international partners therefore plays an important role in its commercial success. This flexibility also manifests itself in the variety of hosting locations seeking to benefit from BRICKLIVE’s footfall-driving characteristics. In addition to exhibition centres and zoos, clients are now being won in locations including museums, hotels and shopping centres.
➢ Forecasts indicate strong growth prospects and high margin business model: Our forecasts move into profitability in the current FY19E year, with strong top line growth across the period (27% three-year CAGR to FY21E). Top line growth is driven by a rising number of events, with growth anticipated across all geographies.
Number of BRICKLIVE events – 2017 – 2019E
Source: LVCG
Integration of Bright Bricks underpins a significant increase in the gross margin to the high 60’s level, which - combined with modest increases in operating expenses – sees EBITDA margins rising strongly across the period, reaching a
8 8
1 1
1820
10
13
34
8
35
3
0
46
14
40
3 3
60
0
10
20
30
40
50
60
70
Asia Europe North America South America Total
No
of
Eve
nts
2017 2018 2019 Q4 2019 (projected)

Live Company Group
14 June 2019 5
forecast level of 41.8% in FY21E. Such a level of cash profit margin should underpin robust valuation metrics, especially on EV/EBITDA and EV/sales metrics, over the medium-term, as a profitable track record is established.
Summary of key financial forecasts – FY18 to FY21E
Source: Shard Capital, LVCG
➢ Management: The management team has been extended and strengthened over the past 18 months, giving greater depth to its operational resources and the company’s ability to grow in a controlled and disciplined way. Live Company has introduced measures such as an LTIP to motivate, reward and retain key personnel. The Executive Chairman, David Ciclitira, has 38.86% of the company’s share capital, with an NED and two other senior managers each owning around 4%. This aligns company interests with those of other shareholders.
➢ Impediments to realisation of the investment case: The principal risk factors are laid out in the Risks section of this note. As a jobbing business, the main risk in our view is that of the top line falling short of forecasts from a failure to win new contracts at the rate expected, loss of existing clients, or a combination of both factors. Our note includes a sensitivity analysis on changes in turnover and gross margin assumptions.
➢ Valuation risk weighted to the upside: We have established a valuation range on a 12-month view, based on the valuation metrics of a basket of comparator companies (compcos), drawn primarily from the Media and Leisure sectors, along with two smaller AIM-listed companies, together with a selection of high growth companies. We believe an appropriate valuation range for Live Company is 73p – 89p. The lower end of this range is based on the average of the FY21E implied valuations, including the drag effect of the EV/sales metric. This underpins the shares and their future prospects on a similar relative valuation to the compco group, and suggests downside risk should be limited from their current trading level. The top end of our valuation range is pitched at the upper end of the FY21E valuations. We believe that newsflow on new business gains, with existing or new clients, will be viewed positively by the market, as it will increase investor confidence and reduce perceived risk relative to future earnings. This in turn could push the shares towards or indeed through the 100p level, reflecting the valuations implied by the application of the FY21E metrics of our selected high growth compco sub-group. Such a valuation would be underpinned by LVCG’s superior growth prospects, with an FY19E – FY21E two-year revenue CAGR of 28.7% compared with an average 9.2% for the compco group, and the prospect of a 40%+ EBITDA margin.
FY18 FY19E FY20E FY21E 2-yr CAGR to FY21E
Turnover (£m) 5.4 6.6 8.8 10.9 28.7%
EBITDA (£m) (0.9) 1.1 2.5 4.5 102.4%
PXPBT (£m) (1.3) 0.2 1.7 3.6 279.4%
Net (debt)/cash (£m) (0.9) (0.5) (0.5) 2.5 n.a.
Adjusted EPS (p) (4.7) 0.4 2.4 5.0 279.4%
Live Company Group
14 June 2019 6
Introduction to Live Company
Live Company Group plc (“LVCG”, the “Company” or the “Group”) is a live events and entertainment company, founded in
2017 by its Chairman, David Ciclitira. The Company was admitted to trading on AIM in December 2017, following the reverse
acquisition of Brick Live Group and Parallel Live Group by Parallel Media Group plc. The Company has therefore been trading
for nearly 18 months.
Live Company Group owns the BRICKLIVE brand, which is a brick-based live events show and content provider. BRICKLIVE
promotes the benefits of plastic interlocking bricks as an educational tool through interactive play and experience. Live
Company is seeking to build BRICKLIVE as the global children's entertainment and education content provider.
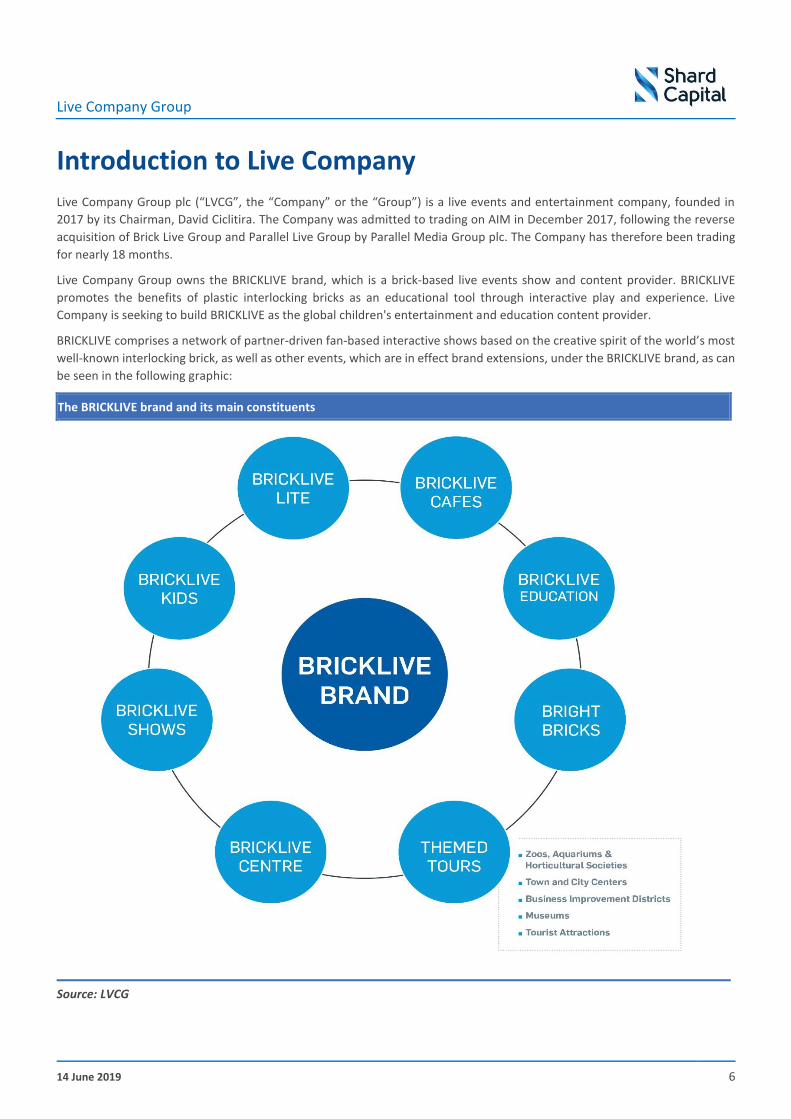
BRICKLIVE comprises a network of partner-driven fan-based interactive shows based on the creative spirit of the world’s most
well-known interlocking brick, as well as other events, which are in effect brand extensions, under the BRICKLIVE brand, as can
be seen in the following graphic:
The BRICKLIVE brand and its main constituents
Source: LVCG

Live Company Group
14 June 2019 7
These brand extensions include BRICKLIVE Touring, BRICKLIVE Zoos, BRICKLIVE Centres, BRICKLIVE Education, BRICKLIVE Kids
Cafe and BRICKLIVE Lite/Pop up events. The Company has launched shows around the world and has been active over the past
eighteen months on four continents, namely Europe, North America, South America and Asia.
BRICKLIVE Is a content provider to brick based shows and owns the Intellectual Property (IP) rights for all of BRICKLIVE activities
and brand extensions. BRICKLIVE owns the models and statues associated with the BRICKLIVE content that is exhibited under
the BRICKLIVE brand across the world, with the exception of China, where its JV commissions and purchases statues from Live
Company Group. BRICKLIVE is an independent producer, is not associated with and is independent of the LEGO Group.
BRICKLIVE, through its brand extensions, is aiming to become the number one brick-based exhibition content provider in the
world. As a successful global brand, BRICKLIVE has strict guidelines for all staff and on brand marketing, and has been
assiduously active in obtaining trademarks to protect its brand. The maintenance of brand integrity and consistent application
of its brand guidelines can be seen in the examples of event logos below:
To date, revenue generated from BRICKLIVE events has typically been derived from content and license fees and from time to
time, self-promoted events. Some licence agreements also include a revenue sharing arrangement, with the Group taking a
nominal share of the revenue earned by its licensee partner from the sale of tickets, merchandise and other products at their
events. However, in March 2019, Live Company announced the NEC flagship show would in future be operated, managed and
promoted by the Group. Going forward, LVCG is looking to develop more venue-based partnerships, similar to the Monaco
model, whereby the Group provides the content and the exhibitor provides the venue with the profits after costs shared
equally.
BRICKLIVE is a global brand that focusses on creating physical educational and entertainment experiences through play and
has been rapidly growing its presence in Europe, Asia, South America and USA. In 2018, 34 events were held and in 2019 to
date 46 events have already been contracted, with the company anticipating 60 events across the whole year. The Company
is working with exhibition promoters, zoos, local authorities, Business Improvement Districts (BIDs), museums and other tourist
attractions to exhibit these touring assets. LVCG will be active in multiple venues across the world and this will continue to
grow over the medium-term.
Bright Bricks was originally founded in 2010 by Duncan Titmarsh with Ed Diment joining shortly afterwards as co-founder.
Simon Horgan joined Bright Bricks in 2016 as Chairman. Bright Bricks is one of the world's premier brick-building companies,
having built models for corporate clients including Jaguar Land Rover, John Lewis, Force India (Formula 1), McLaren and
Chiquita to name a few.

Live Company Group
14 June 2019 8
In 2018, Live Company was Bright Bricks’ largest customer for the production of its touring models and statues for show
content. In October 2018, Live Company made the strategic decision to acquire Bright Bricks, which has become Live Company’s
dedicated in-house production facility. The strategic benefits of bringing the model-building capabilities and capacity in-house
created significant opportunities for Live Company to further develop and expand its content and its Intellectual Property (IP),
thereby enhancing its product offering to commercial partners, enhancing brand equity and driving shareholder value.
Global BRICKLIVE events (actual for 2017 and 2018; actual and planned for 2019)
Source: LVCG
Live Company Group
14 June 2019 9
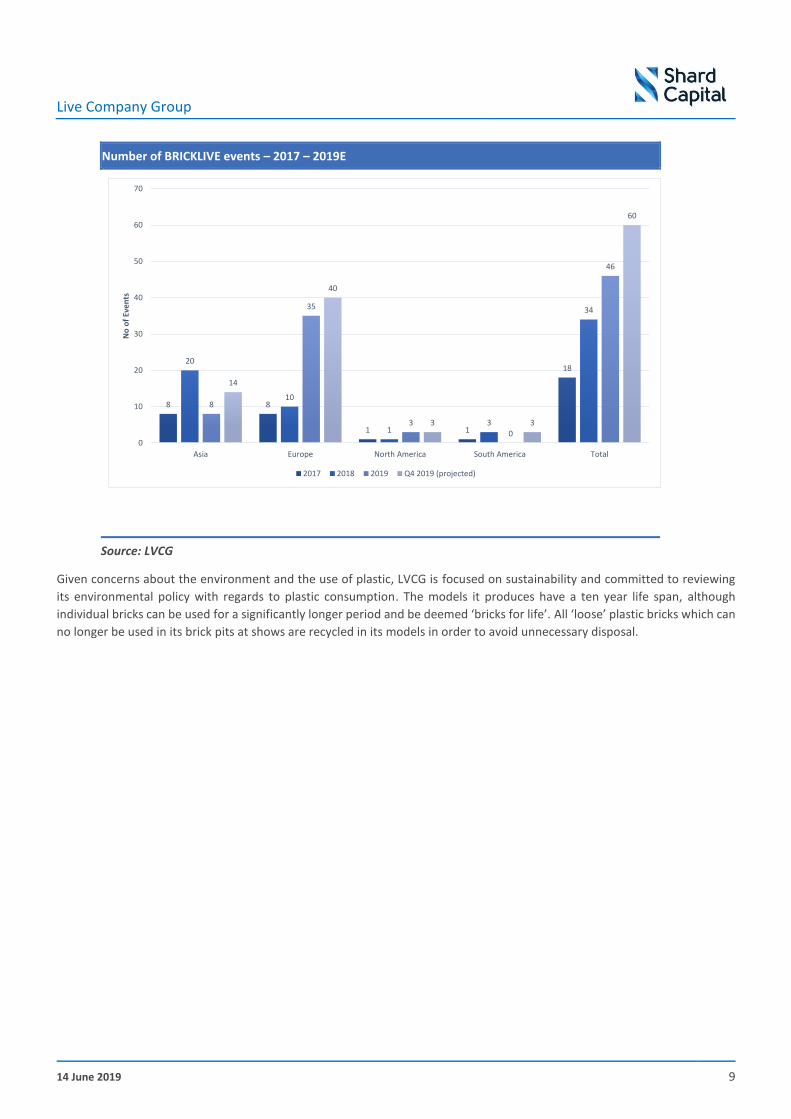
Number of BRICKLIVE events – 2017 – 2019E
Source: LVCG
Given concerns about the environment and the use of plastic, LVCG is focused on sustainability and committed to reviewing
its environmental policy with regards to plastic consumption. The models it produces have a ten year life span, although
individual bricks can be used for a significantly longer period and be deemed ‘bricks for life’. All ‘loose’ plastic bricks which can
no longer be used in its brick pits at shows are recycled in its models in order to avoid unnecessary disposal.
8 8
1 1
1820
10
13
34
8
35
3
0
46
14
40
3 3
60
0
10
20
30
40
50
60
70
Asia Europe North America South America Total
No
of
Eve
nts
2017 2018 2019 Q4 2019 (projected)

Live Company Group
14 June 2019 10
BRICKLIVE principles and market backdrop
With its stated ambition to establish BRICKLIVE as a leading global children’s entertainment and education brand, it is
interesting to consider the overall backdrop against which Live Company Group operates and sources of competition for
consumers’ expenditure at BRICKLIVE events. This backdrop will include pure play competitors within both the broader
education and entertainment sectors. By pure physical play, we mean operators focusing on education, whose output or
deliverable could broadly be described as learning or knowledge, and operators focusing purely on entertainment, whose
output or deliverable could broadly be described as enjoyment or fun. As most readers will know from their own experience,
not all education delivers fun and enjoyment, and similarly, not all entertainment delivers learning and knowledge. A visit to a
BRICKLIVE event or hands-on scientific museums, such as the Science Museum in London, the NEMO Science Museum in
Amsterdam or the Exploratorium in San Francisco, would deliver both fun and learning in line with the brand’s core values and
principles.
BRICKLIVE – brand values and core principles
Source: LVCG
Physical play underpins cognitive development
The Oxford English dictionary defines play as “Engaging in activity for enjoyment and recreation rather than a serious or practical purpose”. It is an activity where the direction is personally chosen, develops dexterity and supports the development of learning. It has been suggested that play promotes positive emotions and feelings while promoting positive physical and mental wellbeing, because it is fun and enjoyable. Active play can increase one’s attention span while improving the efficiency of thinking and problem solving.
Play supports brain development. Given the unstructured nature of play, frequent engagement in plays allows children to develop the ability to cope with changing circumstances confidently. The rise of technology has not changed the way in which children approach play but has led to diminishing opportunities for free play. In addition, changes in society have led to less freedom for children to experience outdoor play and schools are increasingly replacing free creative time with structured activities.
The progression of development in early years has been shown to improve materially with quality parental involvement and toys, which promote free play. An adult engaging in play with a child, not as a guiding figure but as a partner, provides the greatest benefit to both the child and also the adult, through the promotion of creativity and extended learning. Playing with blocks has also been shown to promote language development.

Live Company Group
14 June 2019 11
Hands on play is actively encouraged at BRICKLIVE events
Source: LVCG
BRICKLIVE’s shows and events promote play and the developmental learning benefits in a safe and structured environment.
Promotion of social interaction through play
Social media has changed the way we live our lives. From the way we get our news to the way we interact with our loved ones and friends. Social media has become a dominant part of our daily lives and this trend is expected to continue to grow.
There are nearly 3.2 billion people using social media which equates to approximately 42% of the global population. Every second, there are 11 new people using social media for the first time. A poll in 2018 found that 25% of children aged six and under already have their own mobile and nearly half of these spend up to 21 hours per week on their devices.
The BRICKLIVE brand promotes social interaction through play, fostering creativity and innovation through interactive physical play, a move away from digital entertainment.
LVCG has a specialist design hub, which develops concepts to create interactive experiences in all events. Examples include the introduction of features such as interactive educational trails, graffiti walls, selfie zones, map build zones and brick pits. These are core interactive features, in which LVCG is quickly becoming a specialist. These features help to attract and retain families and visitors and as importantly to increase dwell time at events, which is important for venue operators. This unique knowledge base for creating interactive and family entertainment experiences will be further enhanced by the Group working with Nickelodeon UK, the leading children’s TV network comprising seven dedicated entertainment channels.

Live Company Group
14 June 2019 12
Promoting social interaction through play
Source: LVCG
Delivery of educational entertainment – ‘Edutainment’
Educational entertainment is a medium designed to educate through entertainment. Most often it includes content intended to teach but has the dual effect of providing entertainment value. It is often referred to as edutainment and can be delivered through a variety of media, including film, radio, museums, exhibitions and toys. Toys are a specific subset of educational entertainment, which allow both children to learn about themselves as well as parents and adults to interact with and to learn about children. Toys used as tools can provide education about specific subject matters, historical events or the basics of numeracy and literacy. They can also help to develop motor skills, encourage role-playing and teamwork. Lego® for instance appeals to both children and adults as its use and resulting designs can range from the most basic to the highly complex.
Theme parks like Epcot Centre and Disney’s Animal Kingdom are also forms of educational entertainment. The Disney Corporation was one of the founding forces behind educational entertainment dating back to productions it made in conjunction with the US government in the 1940’s. The Seaworld theme parks in the USA and Puy du Fou in France are also well-known educational entertainment venues, the former focusing on marine and aquatic life and the latter on French history.
The convergence of the out of home entertainment market and the educational entertainment market has been driven by the introduction of technology. Many theme parks, zoos and museums have introduced technology such as electronic games and apps for visitors to interact with, as they embrace the notion that more effective and engaging storytelling will increase and promote learning with the beneficial dual effect of increasing visitor numbers. Museums, zoos and other traditional educational
venues can increasingly be seen as businesses competing for entertainment spend from the general public.
The BRICKLIVE brand ethos is to promote education and entertainment through physical play in its shows, touring assets and centres.
Live Company Group
14 June 2019 13
Increasing footfall to key attractions
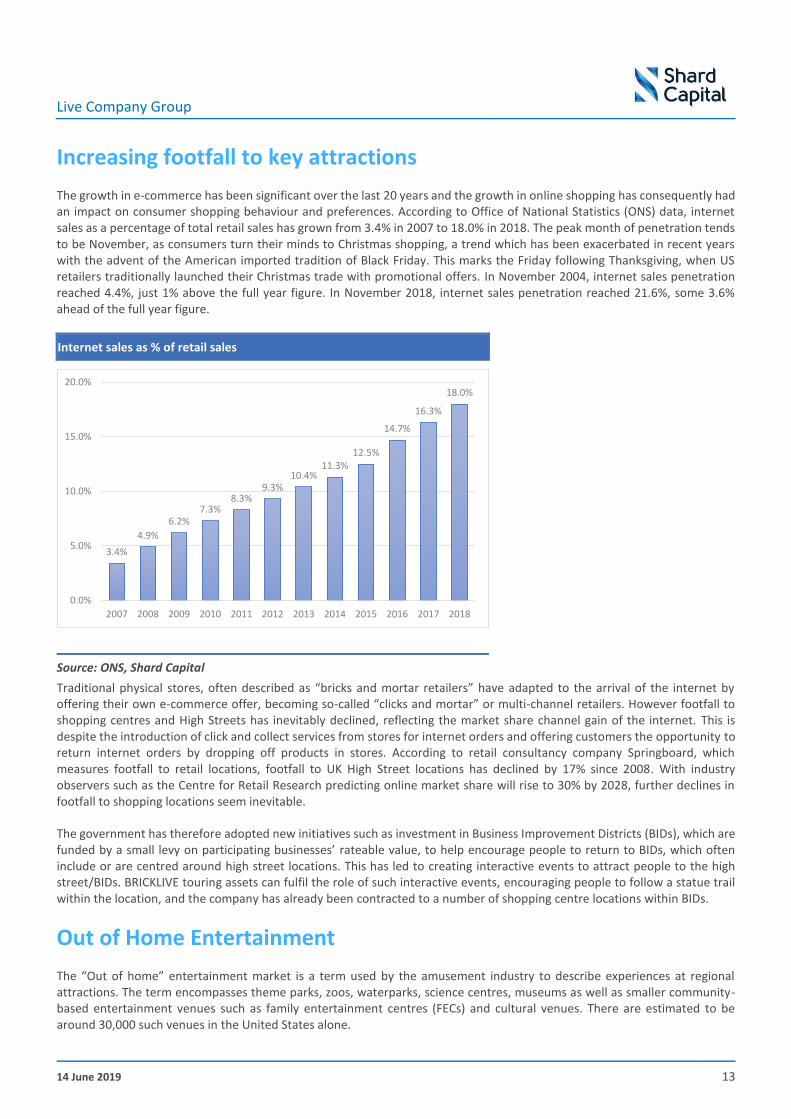
The growth in e-commerce has been significant over the last 20 years and the growth in online shopping has consequently had an impact on consumer shopping behaviour and preferences. According to Office of National Statistics (ONS) data, internet sales as a percentage of total retail sales has grown from 3.4% in 2007 to 18.0% in 2018. The peak month of penetration tends to be November, as consumers turn their minds to Christmas shopping, a trend which has been exacerbated in recent years with the advent of the American imported tradition of Black Friday. This marks the Friday following Thanksgiving, when US retailers traditionally launched their Christmas trade with promotional offers. In November 2004, internet sales penetration reached 4.4%, just 1% above the full year figure. In November 2018, internet sales penetration reached 21.6%, some 3.6% ahead of the full year figure.
Internet sales as % of retail sales
Source: ONS, Shard Capital
Traditional physical stores, often described as “bricks and mortar retailers” have adapted to the arrival of the internet by offering their own e-commerce offer, becoming so-called “clicks and mortar” or multi-channel retailers. However footfall to shopping centres and High Streets has inevitably declined, reflecting the market share channel gain of the internet. This is despite the introduction of click and collect services from stores for internet orders and offering customers the opportunity to return internet orders by dropping off products in stores. According to retail consultancy company Springboard, which measures footfall to retail locations, footfall to UK High Street locations has declined by 17% since 2008. With industry observers such as the Centre for Retail Research predicting online market share will rise to 30% by 2028, further declines in footfall to shopping locations seem inevitable.
The government has therefore adopted new initiatives such as investment in Business Improvement Districts (BIDs), which are funded by a small levy on participating businesses’ rateable value, to help encourage people to return to BIDs, which often include or are centred around high street locations. This has led to creating interactive events to attract people to the high street/BIDs. BRICKLIVE touring assets can fulfil the role of such interactive events, encouraging people to follow a statue trail within the location, and the company has already been contracted to a number of shopping centre locations within BIDs.
Out of Home Entertainment
The “Out of home” entertainment market is a term used by the amusement industry to describe experiences at regional attractions. The term encompasses theme parks, zoos, waterparks, science centres, museums as well as smaller community-based entertainment venues such as family entertainment centres (FECs) and cultural venues. There are estimated to be around 30,000 such venues in the United States alone.
3.4%
4.9%
6.2%7.3%
8.3%9.3%
10.4%11.3%
12.5%
14.7%
16.3%
18.0%
0.0%
5.0%
10.0%
15.0%
20.0%
2007 2008 2009 2010 2011 2012 2013 2014 2015 2016 2017 2018

Live Company Group
14 June 2019 14
Models create excitement and drive footfall
Source: LVCG
Exhibition Market
In 2017, the total number of venues with a minimum of 5,000 sqm of indoor exhibition space around the world was 1,217 and the total indoor exhibition space reached 34.7 million square metres. This equates to an increase of 1.3% on average each year since 2011. Additional venue space has become available in almost all regions of the world and substantial venue investments and upgrades have taken place to increase venue capacities.
Fifteen countries make up c.80% of the indoor exhibition space with the USA being the largest with 19.7% of the global exhibition space followed by China with 16.6%. Regionally Europe offers the greatest collective exhibition venue capacity with 45% of global capacity, followed by Asia Pacific with 23.7%, North America with 23.5%, with the remainder split between the Middle East, Central & South America and Africa.
China has been adding additional venue space faster than other countries to satisfy the growing market in the region, with Asia Pacific consequently the only region to increase its share of global capacity since 2011, by some 330 basis points. Venue space in China has grown by 26.5% since 2011, equating to a compound annual growth rate of 4.0%.
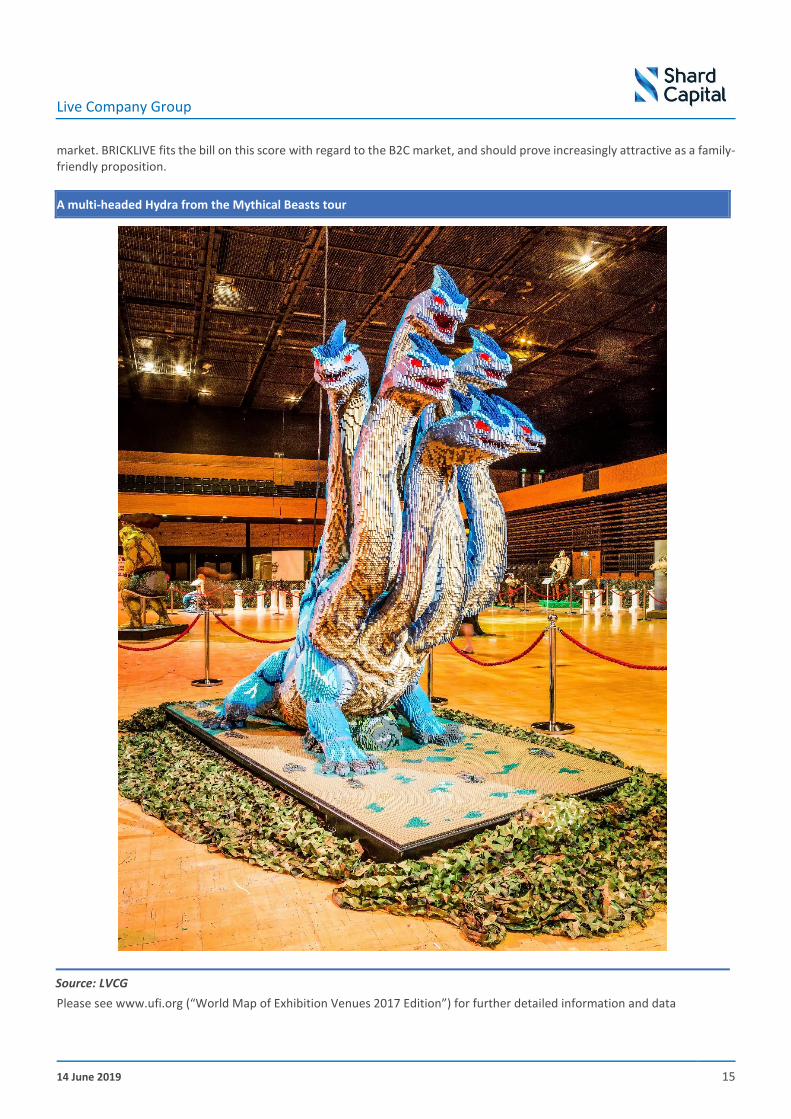
Growth in exhibition space and venues is important to Live Company, as owners of exhibition space will be seeking differentiated and traffic-driving attractions to optimise the utilisation of their assets in the B2C market as well as the B2B
Live Company Group
14 June 2019 15
market. BRICKLIVE fits the bill on this score with regard to the B2C market, and should prove increasingly attractive as a family-friendly proposition.
A multi-headed Hydra from the Mythical Beasts tour
Source: LVCG
Please see www.ufi.org (“World Map of Exhibition Venues 2017 Edition”) for further detailed information and data

Live Company Group
14 June 2019 16
Detailed overview of Live Company The Live Company Group is a leading live events and entertainment company, which is passionate about supporting and in many cases introducing free play into children’s lives. The BRICKLIVE concept supports learning, development and creativity among its visitors, who are typically children between the ages of 4-12, their parents and Adult Friends of LEGO® (AFOLs). The Group encourages the notion that no creation is better than another to nurture its visitor’s appetite for design and support interlocking bricks as an art form. The Group seeks to create an equal playing field among children and between children and their parents. Its concepts support and kickstart a continuing creative experience as children go home and play with interlocking bricks given the excitement and enthusiasm a BRICKLIVE event instils. Other out of home entertainment experiences, such as trips to a theme park, typically end when the visitor walks out of the park gates.
Live Company Group works with licensee partners globally to organise and deliver BRICKLIVE events. The Group’s licensee partners are normally granted 3 to 5-year agreements for a specified territory. These agreements are subject to strict adherence to the Group’s global compliance policy to ensure its partners maintain the integrity of the BRICKLIVE brand. Agreement may be immediately terminated by LVCG in the event a licensee partner is in breach of any of the Group’s compliance policies. The licensee is required to stage a minimum number of events per year under the contractual terms. Failure to do so may result in the licence arrangement being terminated. It should be noted that some agreements can be terminated after one year subject to agreement by both parties.
The Group requires its licensee partners to adhere to comply with all statutory health and safety standards, with a particular focus on child safety. They also outline the material and content the Group believes uphold the educational, creative and family ethos that the Group promotes.
As highlighted previously LVCG has no direct relationship with LEGO®. The Group maintains a mutually respectful relationship with Lego systems while allowing itself the freedom to offer a variety of attractions and extensions of the interlocking brick concept within its exhibitions. For instance, brand extensions - such as the use of a Play Station 4 station and Warrior bots - support the appeal of a BRICKLIVE show to older teen age groups.
The BRICKLIVE brand
BRICKLIVE is the principal brand of Live Company Group. This name was originally associated solely with large shows based in large arenas or exhibition spaces, such as the early UK shows at ExCel and the NEC. A typical BRICKLIVE show is held in a centre offering a floorspace of between 4000 sq metres 10,000 sq metres. The Group has complemented this large format with a pop-up concept that is able to occupy smaller spaces in the region of 1000sq metres. In addition, a number of other BRICKLIVE brand extensions to the original BRICKLIVE Shows have been and are being introduced around the globe. These include:
• BRICKLIVE Touring
A new division created in April 2018 to deliver concepts and content for touring themed events across the globe in locations including zoos, museums and city centres.
• BRICKLIVE Kids Cafes
these are branded BRICKLIVE cafes, featuring a range of play activities including a brick pit, graffiti wall and race tracks- as well as family dining. The initial contract for this concept was signed in China with a subsequent contract signed in Korea with celebrity chef, Hino.

Live Company Group
14 June 2019 17
• BRICKLIVE Centres
Permanent hotel- or shopping mall-based fixtures of a play zone of around 100 sq metres, launched in Korea. There are currently four in Korea and two in China.
• BRICKLIVE Kids
These are smaller versions of Bricklive Centres, which include permanent childcare crèches, offering professionally supervised play areas for children in shopping centres, while parents go shopping, launched in the New Yan Sha mall in Beijing,China.
• BRICKLIVE Education
This wholly-owned subsidiary was formed when LVCG entered an agreement with ImmersiveMinds to develop and enhance educational content for BRICKLIVE shows globally. ImmersiveMinds founder, Stephen Reid, became a director of BLE and received a 20% stake in BLE in return for his services. ImmersiveMinds ran the Coding Corner section of the BRICKLIVE Dallas show in January 2019
• BRICKLIVE Lite
The Lite format covers 400 to 1000 sqm in venues such as shopping malls and hotels for up to 10 days, launched in Korea
Bright Bricks
Bright Bricks was established in 2010. The company produces bespoke models for clients and produces consumer and corporate kits. The company has an incredible track record, having built over 1,000 models made from more than 60 million interlocking bricks since its inception. Clients include major blue-chip companies such as: Rolls-Royce, Google, BT, Land Rover, General Electric, The National Gallery, Maersk and Lufthansa. The models created by the Company for corporate clients and the Group have won seven Guinness World Records. In addition to these bespoke commissions, Bright Bricks also created Bright Bricks Touring, which exhibited themed tours, such as Safari and Big Cats, predominantly in the UK. Bright Brick’s revenue was historically driven primarily by its commissions for third parties, but with a growing contribution more recently from its touring assets.
Live Company Group announced the conditional acquisition of Bright Bricks on the 5th of October 2018, for a total consideration of £8.5m, of which the initial contribution of £2.2m was in cash (from a placing of 4.615million shares at 65p) with a deferred consideration of £0.8m to be paid on the one-year anniversary of the closing of the acquisition. The Group also satisfied £5.5m of the purchase price through the issue of 8.462 million Consideration shares.

Live Company Group
14 June 2019 18
Guinness World Records held by Bright Bricks
Source: LVCG
LVCG had grown to become the largest client of Bright Bricks at the time of acquisition, demonstrating its ability to sell (Bright Bricks produced) content to its licensee partners. The acquisition of Bright Bricks will deliver some cost savings, and vertical integration will provide LVCG with security of supply, allowing it to expedite its growth plans in Europe and the United States.
The acquisition brings both valuable physical and human assets into the Live Company Group, with Bright Bricks employing around 56 employees, of whom 38 are involved in the design, building and production of models.
Bright Bricks’ revenue was predominately generated from corporate commissions and more recently from its touring assets as well. The group’s acquisition of Bright Bricks has substantially increased its asset and content base:
- Bright Bricks had eight sets of touring assets at the time of acquisition, namely Big Cats; Fantasy Kingdom, Metropolis; Britannia; Safari; Mythical Beasts; Animal Paradise; Brickosaurs, compared with one for Live Company. The number of tours in Q2 will be twelve and is set to increase to fifteen by Q4 2019 and twenty by Q4 2020.

Live Company Group
14 June 2019 19
Growth in the number of sets of touring assets
Source: LVCG
- Bright Bricks has boosted the group’s pre-acquisition stock of 32 million bricks to 112 million bricks at the end of March 2019
The Bright Bricks acquisition boosted the stock of bricks……….
Source: LVCG
- In terms of models, Live Company owned 70 prior to the acquisition. The current number of models stands in excess of 650.
1
9
12
15
20
0
5
10
15
20
25
BeforeAcquisition ofBright Bricks
AfterAcquisition ofBright Bricks
Q2 2019 Q4 2019 Q4 2020
NU
MB
ER O
F TO
UR
S
32
112
- 40 80 120
Before Bright Bricks Acquisition
As of 31/03/2019
MILLION

Live Company Group
14 June 2019 20
………and the number of models
Source: LVCG
Bright Bricks also has a Research and Development Department and Design Department to bring initial concepts to development. The company has bespoke CAD software to develop concepts through to detailed design and is now the Intellectual Property of LVCG. The Marketing Department promotes the brand’s ability to deliver complex and sophisticated engineered models.
Force India Formula 1 racing car – a special commission built by Bright Bricks
Source: LVCG
70
650
- 100 200 300 400 500 600 700
Before Bright Bricks Acquisition
As of 31/03/2019
Live Company Group
14 June 2019 21
There is a high level of demand for bricks in the market and the £8.5m purchase price is arguably below the open market value of the assets. However, the monetary value is a fraction of the strategic value of the assets and acquired skill set when integrated into the LVCG group. For the year ended 31 March 2018, Bright Bricks reported revenues of just over £2.5m with an EBITDA profit of £1.2m on a UK GAAP reporting basis. On an assumption of the sale being debt and cash free, the purchase price equates to a trailing EV/sales multiple of 3.4x and an EV/EBITDA multiple of 7.1x.
Bright Bricks was historically a LEGO Certified Partner (LCP). Live Company Group has made the strategic decision to no longer utilise that designation, empowering the division to construct with other interlocking bricks, which are compatible with Lego, and usually at a lower cost. The shift reduces risk of supply constraints for the division, as bricks may be sourced from more than one supplier. In addition, moving away from the designation permits the division to sell to a wide variety of out of home entertainment segments and other buyers without the strict restrictions of LEGO brand compliance. A model is generally constructed with a structure of steel, with interlocking bricks on both the inner and outer layers of the design.
On 1 November 2018, the group agreed Bright Bricks would become the production hub of the group with Brick Live International being the sales arm of the business. Content and access to content is essential for LVCG with its ambition and role of a value-added generator of exclusive intellectual property for its business partners and licensees. By vertically integrating, the Group is not only reducing risk through security of supply but also has a greater influence on the quality of its most important input.
As a result of the acquisition, LVCG acquired a number of touring assets to add to the BRICKLIVE Touring division. LVCG will also continue to supply external corporate and events markets under the Bright Bricks name, where the brand is well-known and highly respected. Access to the LVCG sales and marketing team will assist with the utilisation of its assets and skill set. The Group expects a higher operating margin than historically attained for its external sales, due to owning a greater share of the supply or value chain post the Bright Bricks acquisition.
The acquisition and integration of Bright Bricks brings a number of benefits, which strengthen LVCG’S future growth potential and profit generation. These include:
1. Enhanced operating profitability – with Bright Bricks’ gross margin consolidated into Live’s financial reporting
2. Cost savings - from areas of overlapping or duplicated activities and functions
3. Helping to future proof the business – by securing substantial physical assets (bricks), touring assets and know how (people and software)
4. Strengthened management team – particularly in operational areas, such as sales and marketing
5. Acceleration of growth plans – LVCG’s ambition to expand in the US and Europe will require additional content, which can now be delivered and resourced from in-house facilities
6. Greater optionality and opportunities for partnership models – such as the integration of touring assets to create partnerships and approach smaller venues in Europe, such as the BRICKLIVE Monaco deal, where the costs are underwritten and both parties split the upside
Other commercial interests
Live Company Group has a commercial interest in two other companies, which are not 100% owned subsidiaries. The first of these is a 50:50 joint venture, Parallel Three Six Zero Inc (PTSZ), formed and announced in September 2018. Live’s 50% holding in PTSZ is held by its fully-owned US subsidiary, Parallel Live Group Ltd, the other partner in the joint venture being Three Six Zero. The new JV has been granted exclusive rights by Parallel Live to promote BRICKLIVE events in the US and Canada, with content provided by Brick Live International (BLI). PTSZ has agreed terms with Live Nation Entertainment Inc, on an exclusive basis, to promote BRICKLIVE events in North America and Canada, initially for one show (at The Star in Frisco, Texas on 26-27 January 2019), with a minimum of two further shows if successful. The initial US show featured 30 models from the Animal Paradise Tour, along with other activities and zones typically featured within BRICKLIVE events. Attendance was said to be in line with company expectations and the joint venture is in early discussions on other BRICKLIVE events within the US.

Live Company Group
14 June 2019 22
The second of these relates to commercial activities in China, which are transacted through Bricklive Centre Education Technology (BLCET), in which LVCG holds a 49% interest through its 100% owned and Hong Kong registered subsidiary, Brick Live Far East (BLFE). The majority 51% interest is held by Fortune Access. Fortune Access is a Hong Kong incorporated entity, focusing on the education sector in mainland China, primarily in winter sports education ahead of the 2022 Winter Olympics to be held in Beijing. In July 2018, Brick Live International entered an initial three-year agreement with Bricklive Centre Education Technology, for the exclusive right to sub-license the staging and promotion of BRICKLIVE Animal Paradise in China. Such a sub-licensing agreement has been agreed with Decheng Holding Industrial Co Ltd for a tour of Animal Paradise across 20 cities until September 2021, with an option to extend the agreement for a further three-year term, hosting the show in another 20 cities. The initial three-year contract has a value to BLI of USD $3.1m, for content and show licence fees. BLCET has funded the development of this show, and will receive a guaranteed percentage of sponsorship and ticket revenue from Decheng. The show will have an educational focus on endangered species. The Group’s share of BLCET’s financial results will be reported as a share of associates in the P&L account.
Bricklive Shows
BRICKLIVE shows are primarily run and operated by licensee partners, using content provided by LVCG for the shows. The only exception to this in the future will be the annual show held at the NEC in Birmingham. This will be fully operated by LVCG, acting as the global flagship for BRICKLIVE shows. As such, it will showcase the very best of and latest content innovations, so full ownership and quality control is therefore essential to set a benchmark for its commercial partners. Management has indicated that around 75% of the NEC content will be new, while complementing many of the old favourites for visitors, such as the brick pits.
When a show or event is agreed, LVCG and the licensee partner agree the layout of the exhibition arena. The layout will therefore vary, depending on the geographic location of the event, as well as the physical space (size and configuration), in which the show is to be held. The map below shows the layout of the BRICKLIVE event held in January 2019 in Dallas. While each event format is individually agreed, the layout in the exhibit below is fairly typical of a c. 10,000 sq metre venue.

Live Company Group
14 June 2019 23
BRICKLIVE Floor Map – Dallas 2019
Source: LVCG
The appeal of these events is wide-ranging, as shown by the large number of different areas. As one can see, there are areas, which target younger children in the soft play and Duplo section as well as areas appealing to older children, such as warrior bots and the gaming zone. Large brick pits, such as the one below, filled with over 200,000 bricks, have a wow factor to many visitors, who have never seen as many bricks in one place, and freely available to play with. These events clearly show that interlocking bricks are an educational experience that can be enjoyed by the whole family, including parents and grandparents.

Live Company Group
14 June 2019 24
Families can share building in the Brick Pits
Source: LVCG
The Build Map zone encourages visitors to create models of their own choice, which are then placed in the appropriate geographic location on a large floor map. These can range from their own homes to historic buildings and other well-known landmarks, thereby creating a miniature three dimensional brick-based map of their home country. The bespoke map relates purely to the city or country where the event is being held.
Lego Map – Glasgow 2018
Source: LVCG, Shard Capital

Live Company Group
14 June 2019 25
Other areas include the following features:
• Graffiti wall – where visitors can leave their own messages
• Race tracks – where visitors can build and race their own constructed cars
• Live stage – for interactive events with visitors of all ages
• Fan zone – where Adult Fans of LEGO (AFOLs) display their own brick creations
• Statues – professionally built statues and other creations from interlocking bricks
• Minecraft zone – a software-based block building programme in a three-dimensional generated world, with many educational benefits
• Other specialist zones – typically other specialised or themed sub-brands, such as LEGO City, LEGO Star Wars, LEGO Architecture and LEGO Ninjago
Visitors are also able to watch – and join in with – professional model builders at work, creating some of the amazing brick models possible through the application of ingenuity and imagination.
Come build with me
Source: LVCG, Shard Capital
Security is clearly important at such events, where children are involved, to provide a safe environment. This is similarly the case with cleanliness. Displays and bricks are disinfected nightly and then a major deep clean is carried out when the show moves location.
Live Company Group
14 June 2019 26
Global partners
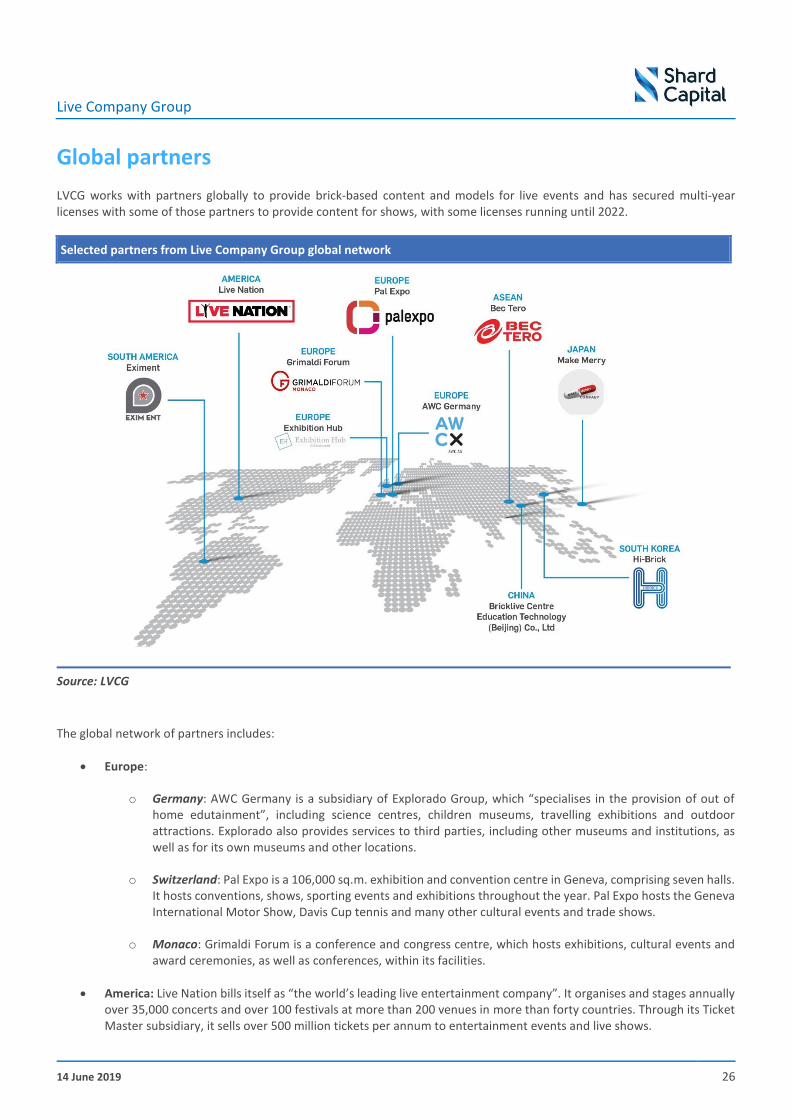
LVCG works with partners globally to provide brick-based content and models for live events and has secured multi-year licenses with some of those partners to provide content for shows, with some licenses running until 2022.
Selected partners from Live Company Group global network
Source: LVCG
The global network of partners includes:
• Europe:
o Germany: AWC Germany is a subsidiary of Explorado Group, which “specialises in the provision of out of home edutainment”, including science centres, children museums, travelling exhibitions and outdoor attractions. Explorado also provides services to third parties, including other museums and institutions, as well as for its own museums and other locations.
o Switzerland: Pal Expo is a 106,000 sq.m. exhibition and convention centre in Geneva, comprising seven halls. It hosts conventions, shows, sporting events and exhibitions throughout the year. Pal Expo hosts the Geneva International Motor Show, Davis Cup tennis and many other cultural events and trade shows.
o Monaco: Grimaldi Forum is a conference and congress centre, which hosts exhibitions, cultural events and award ceremonies, as well as conferences, within its facilities.
• America: Live Nation bills itself as “the world’s leading live entertainment company”. It organises and stages annually over 35,000 concerts and over 100 festivals at more than 200 venues in more than forty countries. Through its Ticket Master subsidiary, it sells over 500 million tickets per annum to entertainment events and live shows.

Live Company Group
14 June 2019 27
• South America: EXIM Entertainment a specialist entertainment promoter, which operates across most South American and Latin American countries.
• ASEAN: BEC-Tero is an entertainment conglomerate with interests across many media including TV programming, radio stations, music, sports and concerts and events in ASEAN.
• Japan: Make Merry, an advertising and promotions company.
BRICKLIVE Touring
The concept of going on tour with an exhibition of exclusive content around a specific theme was formally crystallised by LVCG in April 2018, several months before the acquisition of Bright Bricks, with the formation of BRICKLIVE Touring. This announcement was accompanied by a placing to raise £350,000 to support the initiative and commission additional builds for the initial themed show, BRICKLIVE Animal Paradise.
The creation of BRICKLIVE Touring was seen as another channel to assist the Group’s planned expansion into the important European and US markets. BRICKLIVE Touring is a series of themed tours exhibited around the world in venues such as:
▪ Zoos, aquariums & horticultural societies ▪ Museums ▪ Tourist attractions ▪ Town and city centres ▪ Business Improvement Districts (BIDs)
Tours typically have between 15 and 80 models, with smaller shows created or adapted to meet the requirements of smaller venues.
Prior to the acquisition of Bright Bricks, LVCG had one touring asset, BRICKLIVE Animal Paradise, which comprised more than 65 animals, including a full-sized African elephant and snow leopard designed around the theme of endangered species, which transcends national boundaries and geographies, appealing in effect to the global community. A number of touring contracts have already been agreed, most notably in China and America.
Following the acquisition, LVCG owned nine themed tours, Animal Paradise (x2), Big Cats; Fantasy Kingdom, Metropolis; Britannia; Safari; Mythical Beasts and Brickosaurs. Since the acquisition, LVCG has produced three additional tours, BRICKLIVE Force, BRICKLIVE Ocean and BRICKLIVE Outer Space. Further tours are in design development and it is expected this will increase to fifteen tours by Q4 2019 and twenty by the end of 2020.
The expansion of the touring assets represents a significant growth opportunity, on which the company is actively seeking to capitalise.
Zoos
The global potential from the BRICKLIVE Zoo initiative is significant when one considers the number of zoos and animal parks in operation around the world. There are a number of sources quoting numbers on this, although definitions vary and appear to overlap from organisation to organisation. For example, the American Zoo and Aquarium Association (AZA), which has some 233 accredited zoos and aquariums in nine countries as members, has estimated there were around 10,000 zoos worldwide in 2003, with some 2,400 “animal exhibitors” licensed by the US Department of Agriculture. This seems a very high number compared with other sources, and presumably includes some quite small establishments.
Another source in Germany, park scout, (see www.parkscout.de) puts the current number of zoos and animal parks at 1487, which includes some 345 aquariums and terrariums. Of this total, some 764 are in Europe, 444 in the US and 279 in the rest of the world. These appear to be based on EU definitions. This will therefore presumably understate the overall number, as it will be based on a number of criteria, and will partially explain the difference with the number cited by the AZA. However, even
Live Company Group
14 June 2019 28
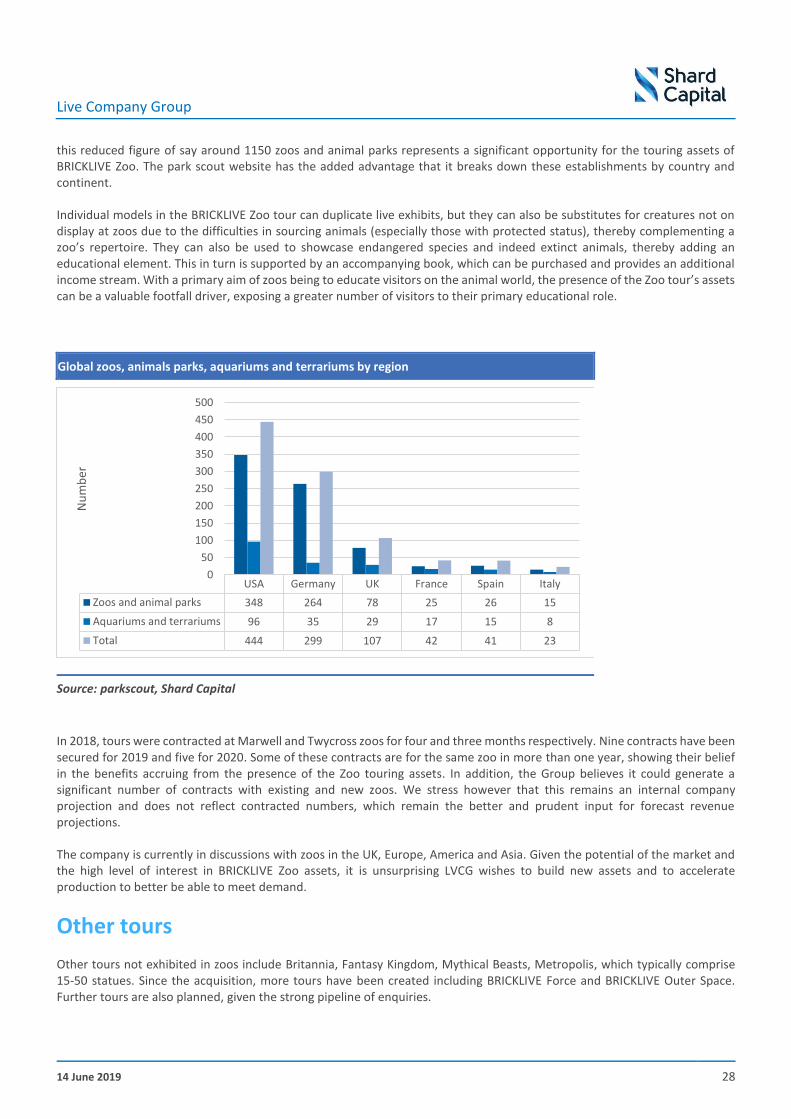
this reduced figure of say around 1150 zoos and animal parks represents a significant opportunity for the touring assets of BRICKLIVE Zoo. The park scout website has the added advantage that it breaks down these establishments by country and continent.
Individual models in the BRICKLIVE Zoo tour can duplicate live exhibits, but they can also be substitutes for creatures not on display at zoos due to the difficulties in sourcing animals (especially those with protected status), thereby complementing a zoo’s repertoire. They can also be used to showcase endangered species and indeed extinct animals, thereby adding an educational element. This in turn is supported by an accompanying book, which can be purchased and provides an additional income stream. With a primary aim of zoos being to educate visitors on the animal world, the presence of the Zoo tour’s assets can be a valuable footfall driver, exposing a greater number of visitors to their primary educational role.
Global zoos, animals parks, aquariums and terrariums by region
Source: parkscout, Shard Capital
In 2018, tours were contracted at Marwell and Twycross zoos for four and three months respectively. Nine contracts have been secured for 2019 and five for 2020. Some of these contracts are for the same zoo in more than one year, showing their belief in the benefits accruing from the presence of the Zoo touring assets. In addition, the Group believes it could generate a significant number of contracts with existing and new zoos. We stress however that this remains an internal company projection and does not reflect contracted numbers, which remain the better and prudent input for forecast revenue projections.
The company is currently in discussions with zoos in the UK, Europe, America and Asia. Given the potential of the market and the high level of interest in BRICKLIVE Zoo assets, it is unsurprising LVCG wishes to build new assets and to accelerate production to better be able to meet demand.
Other tours
Other tours not exhibited in zoos include Britannia, Fantasy Kingdom, Mythical Beasts, Metropolis, which typically comprise 15-50 statues. Since the acquisition, more tours have been created including BRICKLIVE Force and BRICKLIVE Outer Space. Further tours are also planned, given the strong pipeline of enquiries.
USA Germany UK France Spain Italy
Zoos and animal parks 348 264 78 25 26 15
Aquariums and terrariums 96 35 29 17 15 8
Total 444 299 107 42 41 23
0
50
100
150
200
250
300
350
400
450
500
Nu
mb
er

Live Company Group
14 June 2019 29
These tours are typically exhibited in museums, town and city centres and other tourist attractions, principally as a means of attracting people to and driving incremental footfall into these locations. This includes the high street, which has seen a fall in footfall in recent years given the rise of online shopping, as described earlier in this note. LVCG is working with a number of BIDs across the UK, exhibiting smaller touring assets in key shopping areas as seen in Paisley BID, Basingstoke BID and Sheffield Centre, with more in advanced discussions with other local authorities.
This represents a significant growth area for LVCG, as the tours assets can be displayed within buildings or under cover, and are therefore not subject to the seasonal and weather constraints associated with the larger tours than are usually exhibited in the open air.
The visual below illustrates the logos of some of the group’s principal touring assets.
BRICKLIVE tour logos
Source: LVCG

Live Company Group
14 June 2019 30
The economics of touring assets
The economics of the Zoo touring assets are highly compelling. A large set of assets typically takes three months to build and costs around £300,000, of which steel, which provides the core support of the structures, represents almost half. Specialist bricks, not necessarily held in stock at Bright Bricks, also represent another significant cost, with around 4,000 different types of bricks used to create the Zoo assets. Assuming a theoretical 100% asset utilisation, which cannot be achieved in practise, each set of touring assets could yield up to an estimated £600,000 of revenue per annum at peak rates and a gross profit, at an 80% margin, of £480,000. This equates to an annual return on investment of 160% and a cash payback of seven and a half months. In reality, given the need to move these assets between locations, with cleaning and any routine maintenance also required, 100% asset utilisation is impossible to achieve. However with high demand and careful planning, asset utilisation rates of at least nine months are perfectly feasible.
Earl Grey – a life sized elephant exhibit
Source: LVCG, Shard Capital
A simple model of such a touring asset allows us to undertake a sensitivity analysis around some of the key variables – monthly fee, utilisation and gross margin. We stress however that these sensitivities cannot and should not be simply and universally applied to all tours. Our analysis relates to a large or major tour comprising at least 40 to 50 models, such as for zoos in most instances. There are many more tours that are smaller in nature, exhibiting a smaller number of models with a lower levels of fees. Rental fees will also vary according to other factors, such as number of models, seasonality, location and holiday periods.
Our first sensitivity analysis models the sensitivity of annual gross profit (£K) to the number of months of utilisation and gross margin percentage, assuming a £50K monthly rental fee. We have capped this analysis at a peak 10-month utilisation for the reasons outlined above.
Live Company Group
14 June 2019 31
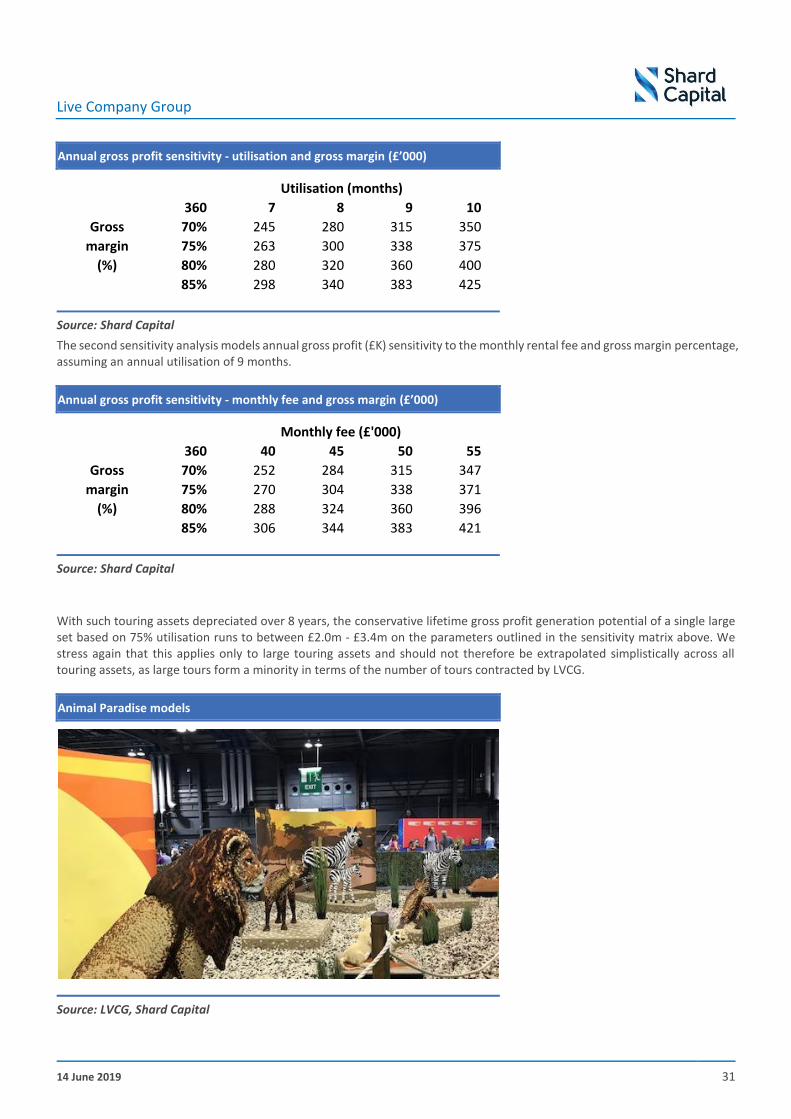
Annual gross profit sensitivity - utilisation and gross margin (£’000)
Source: Shard Capital
The second sensitivity analysis models annual gross profit (£K) sensitivity to the monthly rental fee and gross margin percentage, assuming an annual utilisation of 9 months.
Annual gross profit sensitivity - monthly fee and gross margin (£’000)
Source: Shard Capital
With such touring assets depreciated over 8 years, the conservative lifetime gross profit generation potential of a single large set based on 75% utilisation runs to between £2.0m - £3.4m on the parameters outlined in the sensitivity matrix above. We stress again that this applies only to large touring assets and should not therefore be extrapolated simplistically across all touring assets, as large tours form a minority in terms of the number of tours contracted by LVCG.
Animal Paradise models
Source: LVCG, Shard Capital
Utilisation (months)
360 7 8 9 10
Gross 70% 245 280 315 350
margin 75% 263 300 338 375
(%) 80% 280 320 360 400
85% 298 340 383 425
Monthly fee (£'000)
360 40 45 50 55
Gross 70% 252 284 315 347
margin 75% 270 304 338 371
(%) 80% 288 324 360 396
85% 306 344 383 421
Live Company Group
14 June 2019 32
Revenue model
The Group will have four key income streams going forward, which are:
• Shows and Exhibitions: license and content fees
• Touring assets: content rental fees
• Corporate commissions
• Sales of branded merchandise and kits
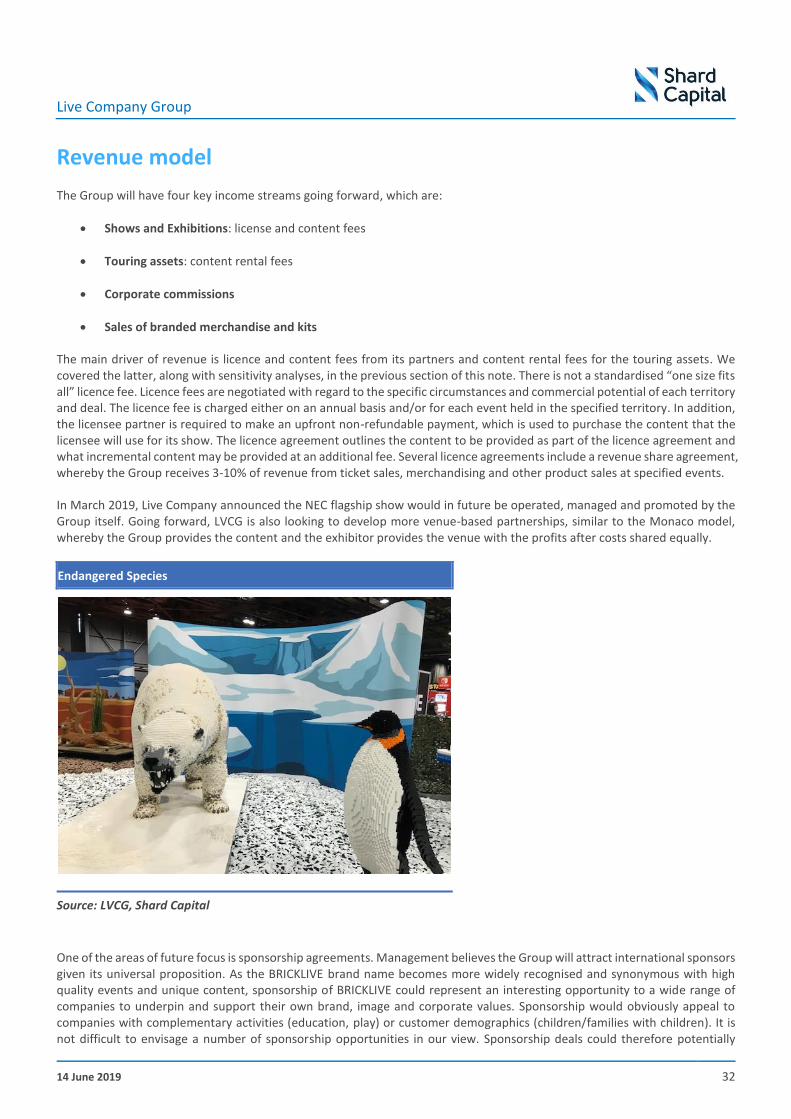
The main driver of revenue is licence and content fees from its partners and content rental fees for the touring assets. We covered the latter, along with sensitivity analyses, in the previous section of this note. There is not a standardised “one size fits all” licence fee. Licence fees are negotiated with regard to the specific circumstances and commercial potential of each territory and deal. The licence fee is charged either on an annual basis and/or for each event held in the specified territory. In addition, the licensee partner is required to make an upfront non-refundable payment, which is used to purchase the content that the licensee will use for its show. The licence agreement outlines the content to be provided as part of the licence agreement and what incremental content may be provided at an additional fee. Several licence agreements include a revenue share agreement, whereby the Group receives 3-10% of revenue from ticket sales, merchandising and other product sales at specified events.
In March 2019, Live Company announced the NEC flagship show would in future be operated, managed and promoted by the Group itself. Going forward, LVCG is also looking to develop more venue-based partnerships, similar to the Monaco model, whereby the Group provides the content and the exhibitor provides the venue with the profits after costs shared equally.
Endangered Species
Source: LVCG, Shard Capital
One of the areas of future focus is sponsorship agreements. Management believes the Group will attract international sponsors given its universal proposition. As the BRICKLIVE brand name becomes more widely recognised and synonymous with high quality events and unique content, sponsorship of BRICKLIVE could represent an interesting opportunity to a wide range of companies to underpin and support their own brand, image and corporate values. Sponsorship would obviously appeal to companies with complementary activities (education, play) or customer demographics (children/families with children). It is not difficult to envisage a number of sponsorship opportunities in our view. Sponsorship deals could therefore potentially

Live Company Group
14 June 2019 33
provide an incremental income stream for the Group, with a very high level of drop-through to the bottom line profitability of the group. Our forecasts assume no revenue from sponsorship deals at this stage in order to remain conservative and prudent.

Live Company Group
14 June 2019 34
FY18 prelims As has been previously noted, FY18 was a transformational year for LVCG, most notably with the successful strategic acquisition of Bright Bricks, its main content builder, in October 2018 for a total consideration of £8.5m. Bright Bricks was consolidated into the group numbers for Q4, reporting an external loss of £809K for the period. The prime reason for this loss arises from the decision to turn Bright Bricks into the group’s production hub. This changed Bright Bricks in effect from a profit centre to a cost centre, with Brick Live International (BLI) becoming the sales arm of the business through which turnover is booked.
Live Company has acquired an asset rich company in Bright Bricks. This point is evidenced by the fact that goodwill arising on acquisition amounted to only £86K. Brick stock was valued at £5.9m and content (completed statues) at £2.7m.
Bright Bricks was acquired through an equity placing and the issue of consideration shares to the vendors. There were two other equity raises in FY18 to support the expansion of the BRICKLIVE network and the start-up of the BRICKLIVE Touring programme. Given the success of the latter and increased demand for its touring assets, especially from zoos, a subsequent equity raise was announced in February 2019 to fund the building of five more sets and for general working capital purposes.
Equity raises (including consideration, fee and commission shares)
Date Gross raise (£m) Shares (m) Price (p) Shares post admission (m)
BRICKLIVE expansion
8 January 2018 1.60 4.571 35 52.779
BRICKLIVE Touring
13 April 2018 0.35 1.000 35 53.779
Bright Bricks acquisition
5 October 2018 3.00 4.615 65 58.395
0.00 8.462 65 66.856
0.00 0.238 65 67.095
BRICKLIVE Zoo expansion
11 February 2019 0.00 0.069 65
1.36 2.085 65 69.248
0.00 0.046 65 0.84 1.300 65 70.595
Source: Shard Capital, LVCG
Another factor impacting on FY18 performance relates to the LEGO® LIVE show held in New York in February 2018, as highlighted in the group’s interim results published in September 2018. This was a self-promoted event, and while it received positive reviews, the operation has been treated as discontinued as the Group is no longer promoting or operating LEGO® LIVE events. This loss came about from a number of factors including regulations on ticket sales, which resulted in lower than expected ticket revenues, and staff union costs. However the Group continues to promote BRICKLIVE events in America
The table below summarises the key FY18 results, isolating the continuing business and the discontinued business within the total, together with the FY17 figures for reference, when Live Company was in effect founded and listed on AIM. We would highlight the fact that LVCG made a pre-exceptional operating profit of £46K, excluding the Q4 £809K loss attributable to the Bright Bricks acquisition within the total continuing business operating loss of £763K. This is an impressive recovery in underlying performance compared with the £391K operating loss recorded in FY17. Excluding the Bright Bricks EBITDA loss of £726K, LVCG reported an underlying positive EBITDA of £333K, compared with the prior year EBITDA loss of £273K. EBITDA is stated after ongoing plc headquarter corporate costs of £999K.

Live Company Group
14 June 2019 35
Live Company Group - Prelims results summary FY18 and FY17 (£m unless stated)
Source: LVCG, Shard Capital
The balance sheet has also expanded, with reported net assets of £10.6m at the end of FY18, compared with £2.8m at the end of FY17, driven primarily by the acquisition of Bright Bricks. Net debt at the year-end stood at £880K.
The company has made significant progress over the past 18 months in terms of building its revenue base, extending its share of the value chain and IP ownership through the acquisition of Bright Bricks, and investing in its human resource base to support future growth. Henceforth, the focus will be on driving profitable sales growth internationally, enhancing the brand equity of BRICKLIVE and thereby shareholder returns.
Revenue by geographic region – FY17 and FY18 (£’000)
Source: LVCG
FY18 FY18 FY18 FY17
Continuing Discontinued Total Total
Turnover 4.920 0.431 5.351 1.928
Gross profit 2.258 (0.500) 1.758 1.102
Operating costs (3.021) (3.021) (1.493)
Operating loss (0.763) (0.500) (1.263) (0.391)
Finance costs (0.008) (0.008) (0.012)
Pre-tax loss (0.771) (0.500) (1.271) (0.403)
Exceptionals (1.339) (1.339) (5.037)
Tax 0 0 0
Post tax loss (2.110) (0.500) (2.610) (5.440)
EPS (p) (3.8) (0.9) (4.7) (11.0)
EBITDA (0.393) (0.500) (0.893) (0.273)
Live Company Group
14 June 2019 36
Recent newsflow
In terms of more recent newsflow, in February 2019, Live Company Group announced an agreement with AWC AG, one of
Germany’s leading exhibition promoters. This will see three BRICKLIVE events staged within the first twelve months, with AWC
also working to promote the BRICKLIVE Zoo touring programme in Germany and providing logistical support to Live, including
warehousing for the group’s touring models. At the same time, Live announced an equity raise of £2.2m gross to fund future
growth initiatives. With growing interest in and demand for the group’s BRICKLIVE Zoo programme, around £1.4m of the
proceeds will be used to build an additional five touring assets, with the remainder to provide additional working capital for
the group.
On 22 May, LVCG announced that it had entered a licensing and merchandising agreement with Licensing Management
International Ltd (LMI). LMI’s remit is to act as LVCG’s agent in identifying partners for the licensing and merchandising of
BRICKLIVE branded products to be sold at the group’s BRICKLIVE events. LMI has a strong pedigree in this field with current
clients including Game of Thrones, Nestle and Shell. The agreement runs until the end of 2025 and underlines the increased
emphasis LVCG is placing on the sale of merchandise at its BRICKLIVE events. This represents a winning formula for both LVCG
(in terms of an incremental revenue stream) and those attending its shows, tours and events (in terms of re-inforcing the
experience and as a reminder of the experience).
On 12 June, LVCG announced an exciting new agreement with Nickelodeon UK Ltd. Under this agreement, LVCG has obtained
the Intellectual Property (IP) rights to produce themed tours associated with the Nickelodeon brand and its children’s TV
programmes, such as PAW Patrol and Nick Jr. The five-year agreement grants LVCG the rights to licence and produce
Nickelodeon themed tours for the UK market. LVCG will pay a royalty fee to LVCG based on the revenues of the themed tours.
With Nickelodeon’s channels reaching an audience of 10 million viewers per month in UK and Ireland, the appeal of such tours
will be enormous to both site operators and family visitors, while re-inforcing Nickelodeon’s brand to both existing and
potential new customers. The initial PAW Patrol tour, comprising fifteen model, will launch in Summer 2019, followed by
another tour to be launched in Autumn 2019 featuring fifteen models of characters from Nickelodeon’s shows Top Wing and
Shimmer and Shine. Further models based on the Nickelodeon brand will be built for tours to be launched in 2020.
It is worth adding some additional commentary around the implications of this deal, which could be as - if not more -
transformational for LVCG than the acquisition of Bright Bricks. This deal with a global children’s entertainment brand is a
massive endorsement for LVCG and its product/service proposition. To date, the Group has used its world class model building
production hub to produce popular tour assets that are generic (eg animals, dinosaurs) and over which no third party holds IP
rights. The Nickelodeon deal creates a marriage of world class content from a global IP owner with the world class model
building skills of LVCG in a mutually beneficial win/win arrangement. LVCG benefits commercially from leasing these touring
assets, while Nickelodeon receives extensive marketing exposure to existing and potential customers (in addition to a royalty
fee based on tour revenues). It is not difficult to imagine such a deal being rolled into other geographies with Nickelodeon if
successful, nor to imagine potential deals with other IP content owners. Putting aside for one moment the question of the cash
required to build multiple tour assets, were this deal to be extended in the fullness of time and/or other deals struck, this
would have substantial positive implications for LVCG and value creation for shareholders.
We now turn to our medium-term forecasts for Live.
Estimates
Our outer year forecasts are predicated on increased revenues across all core product channels and across all major geographies from an improved business model generating significantly higher margins at all levels. There are a number of reasons underpinning this growth outlook, though we would highlight two which we regard as key. First, the acquisition of its major supplier, Bright Bricks, has transformed and enhanced Live Company in a number of ways. It has consolidated another part of the value chain in-house, with Bright Brick’s gross margin now effectively incorporated into the Group. It has also secured long-term access to brick stocks, as well as acquiring significant IP rights, including proprietary computer design software and an in-house design studio. We also believe that speed to market will also improve with the benefit of a dedicated in-house production unit.
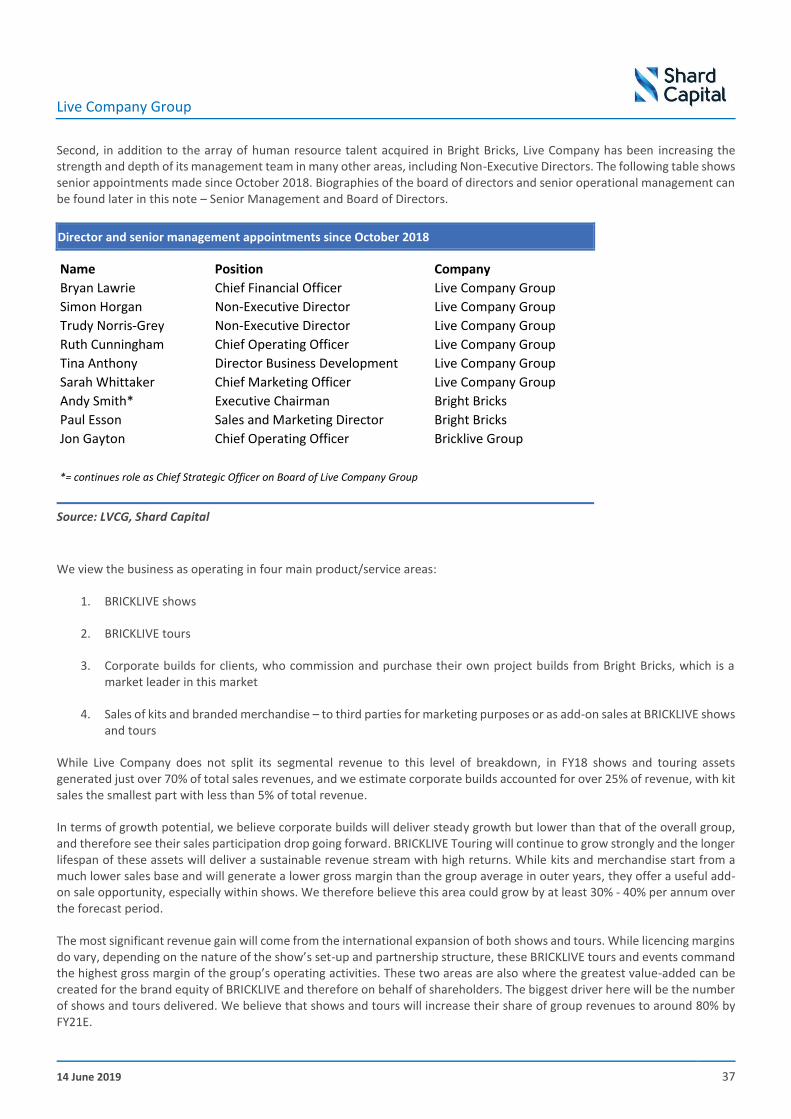
Live Company Group
14 June 2019 37
Second, in addition to the array of human resource talent acquired in Bright Bricks, Live Company has been increasing the strength and depth of its management team in many other areas, including Non-Executive Directors. The following table shows senior appointments made since October 2018. Biographies of the board of directors and senior operational management can be found later in this note – Senior Management and Board of Directors.
Director and senior management appointments since October 2018
Source: LVCG, Shard Capital
We view the business as operating in four main product/service areas:
1. BRICKLIVE shows
2. BRICKLIVE tours
3. Corporate builds for clients, who commission and purchase their own project builds from Bright Bricks, which is a market leader in this market
4. Sales of kits and branded merchandise – to third parties for marketing purposes or as add-on sales at BRICKLIVE shows and tours
While Live Company does not split its segmental revenue to this level of breakdown, in FY18 shows and touring assets generated just over 70% of total sales revenues, and we estimate corporate builds accounted for over 25% of revenue, with kit sales the smallest part with less than 5% of total revenue.
In terms of growth potential, we believe corporate builds will deliver steady growth but lower than that of the overall group, and therefore see their sales participation drop going forward. BRICKLIVE Touring will continue to grow strongly and the longer lifespan of these assets will deliver a sustainable revenue stream with high returns. While kits and merchandise start from a much lower sales base and will generate a lower gross margin than the group average in outer years, they offer a useful add-on sale opportunity, especially within shows. We therefore believe this area could grow by at least 30% - 40% per annum over the forecast period.
The most significant revenue gain will come from the international expansion of both shows and tours. While licencing margins do vary, depending on the nature of the show’s set-up and partnership structure, these BRICKLIVE tours and events command the highest gross margin of the group’s operating activities. These two areas are also where the greatest value-added can be created for the brand equity of BRICKLIVE and therefore on behalf of shareholders. The biggest driver here will be the number of shows and tours delivered. We believe that shows and tours will increase their share of group revenues to around 80% by FY21E.
Name Position Company
Bryan Lawrie Chief Financial Officer Live Company Group
Simon Horgan Non-Executive Director Live Company Group
Trudy Norris-Grey Non-Executive Director Live Company Group
Ruth Cunningham Chief Operating Officer Live Company Group
Tina Anthony Director Business Development Live Company Group
Sarah Whittaker Chief Marketing Officer Live Company Group
Andy Smith* Executive Chairman Bright Bricks
Paul Esson Sales and Marketing Director Bright Bricks
Jon Gayton Chief Operating Officer Bricklive Group
*= continues role as Chief Strategic Officer on Board of Live Company Group

Live Company Group
14 June 2019 38
We estimate that revenues will expand in all key geographies. With touring assets gaining significant traction, expanding their client base and securing repeat orders with some clients, we believe that the UK will be the most important single market for shows and tours, accounting for around a third of Group revenues. While Europe will remain a key growth area, especially in light of the recently announced partnership deals with AWC in Germany, Pal Expo in Geneva, and Exhibition Hub in Brussels, the greatest growth rate in this area will come from the combined Rest of World area, comprising Europe, the Far East (China, Japan, Korea) and the US.
The following table summarises and highlights the key details of our forecasts, along with the transitional year of FY18 as a base comparison (including the discontinued Parallel Live show in New York). With contract visibility lower over time, we have been more conservative with our FY21E revenue forecast, albeit with further improvement in gross, EBITDA, EBIT and PBT margins. Management tracks sales progress on a weekly basis against budgets, with a particular focus on contracts secured or out for signature, with the latter have virtually a 100% conversion rate. The FY18 report and accounts state that LVCG has already secured contracts with a value of £4.0m for 2019, equating to 61% of our FY19E revenue forecast. This is a reassuring indication for delivery of FY19 revenue at this stage of the year. In addition to this, contracts worth £1.3m have already been secured for 2020 and £0.7m for 2021. Our forecasts assume no tax is paid over our forecast horizon, given accumulated tax credits available to LVCG. The rising trend in profitability is reflected both in the EPS figure and the substantial growth in net cash over the forecast period.
Our forecasts show a three-year turnover compound annual growth rate (CAGR) for FY18 to FY21E of 26.6% and a two-year CAGR of 28.7% for FY19E to FY21E. We would therefore classify LVCG as a high growth company on this basis, especially with EBITDA and PBT showing a higher rate of compound growth, as shown in the Investment Case section of this note. The two-year CAGR for profit measures are even more impressive, with EBITDA growing by 102% and pre-exceptional PBT and adjusted EPS by 279%.
P&L Forecast Estimates – FY19 – FY21 (£m, unless otherwise stated)
Source: Shard Capital, LVCG
We would also point out our earlier commentary around the strong cash returns of the Zoo touring assets. Similar dynamics could be expected from other touring assets, and we expect the current portfolio and repertoire to be extended further over time. Management harbours ambitions to develop more themes to appeal to zoo clients and their visitors (eg Animal Paradise, Brickosaurs and Ocean). This would enable them to sell multi-year contracts to individual zoo clients, with a different theme displayed for a period of time each year to maintain freshness and change in the zoo’s offer and to encourage repeat visits from families over time. In this context, we would point to management’s expectation at the time of the equity raise in February 2019 that the existing touring assets combined with those built (over 15 months from February, thus not all of them) would “generate approximately £2.0m in revenue and £1.6m in gross profit in 2019”. This implies that touring assets should generate just over 30% of our forecast FY19E turnover.
FY18 FY19E FY20E FY21E
Turnover (£m) 5.351 6.555 8.751 10.860
- % increase 172% 23% 34% 24%
Gross profit (£m) 1.758 4.235 5.758 7.548
-gross margin (%) 32.9% 64.6% 65.8% 69.5%
EBITDA (£m) (0.893) 1.108 2.499 4.538
- EBITDA margin (%) (16.7%) 16.9% 28.6% 41.8%
Operating profit (£m) (1.263) 0.538 1.759 3.638
- operating margin (%) (23.6%) 8.2% 20.1% 33.5%
PXPBT (£m) (1.271) 0.248 1.684 3.563
Net (debt)/cash (£m) (0.880) (0.451) (0.505) 2.457
Adjusted EPS (p) (4.7) 0.4 2.4 5.0

Live Company Group
14 June 2019 39
In terms of operating expenses, we forecast very modest growth across our forecast period. This in essence reflects our view that the majority of LVCG’s operating costs are fixed rather than variable, with new content capitalised and depreciated over eight years and charged within Cost of Goods Sold (COGS). Live should therefore be able to leverage their forecast turnover (and profit) growth without requiring a corresponding rise in operating costs. Operating costs decline as a percentage of sales over our forecast period, which drives higher EBITDA and operating profit margins.
The degree of operational gearing – calculated as gross margin divided by operating margin - is relatively modest given the high gross margin and the rising operating margin over the forecast period. The degree of operational gearing acts as a simple proxy for the percentage increase in operating profit relative to a +/-1% change in revenue, assuming no change in gross margin and operating costs. The rising operating margin forecast means that operational gearing decreases over the forecast period.
This said, we believe it is still worthwhile and informative to examine forecast sensitivity to the key variables of revenue and gross margin. To establish the sensitivity of profits and EPS to revenue changes, we have looked at a +/-5% change in revenue relative to our actual forecasts. It should be noted that this change is applied to each year individually and not cumulatively across the period. Our revenue sensitivity model assumes no change in gross margin percentage or the monetary quantum of operating expenses. The results are summarised in the table below, showing our actual forecasts followed by the upside and downside scenarios. Given our simple modelling assumptions, the percentage change is identical under both the upside and downside scenarios for each year at the PBT and EPS levels. The percentage impact of a 5% move, up or down, in revenue is 85.5% for FY19E, 17.1% for FY20E and 10.6% for FY21E.
Sensitivity analysis of +/-5% change in forecast revenue (£m unless otherwise stated)
Source: Shard Capital
In looking at gross margin sensitivity, we have opted for a two percentage point change (+/-2%) in each year relative to our forecasts. We assume no changes in either our revenue or operating expense forecasts. As above this analysis looks at the impact on individual years and not cumulatively across the forecasting period. Likewise, the percentage change is identical in both the upside and downside scenarios at the PBT and EPS levels. The percentage impact of a 2% move, up or down, in gross margin percentage is 53.0% for FY19E, 10.4% for FY20E and 6.1% for FY21E.
Current estimates 2019E 2020E 2021E
Revenue 6.6 8.8 10.9
Gross margin (%) 64.6% 65.8% 69.5%
Adj EBITDA 1.1 2.5 4.5
Adjusted PBT 0.2 1.7 3.6
Adjusted EPS (p) 0.4 2.4 5.0
2019E 2020E 2021E
Upside scenario
Revenue 6.9 9.2 11.4
Adj EBITDA 1.3 2.8 4.9
Adjusted PBT 0.5 2.0 3.9
Adjusted EPS (p) 0.7 2.8 5.6
Downside Scenario
Revenue 6.2 8.3 10.3
Adj EBITDA 0.9 2.2 4.2
Adjusted PBT 0.0 1.4 3.2
Adjusted EPS (p) 0.1 2.0 4.5
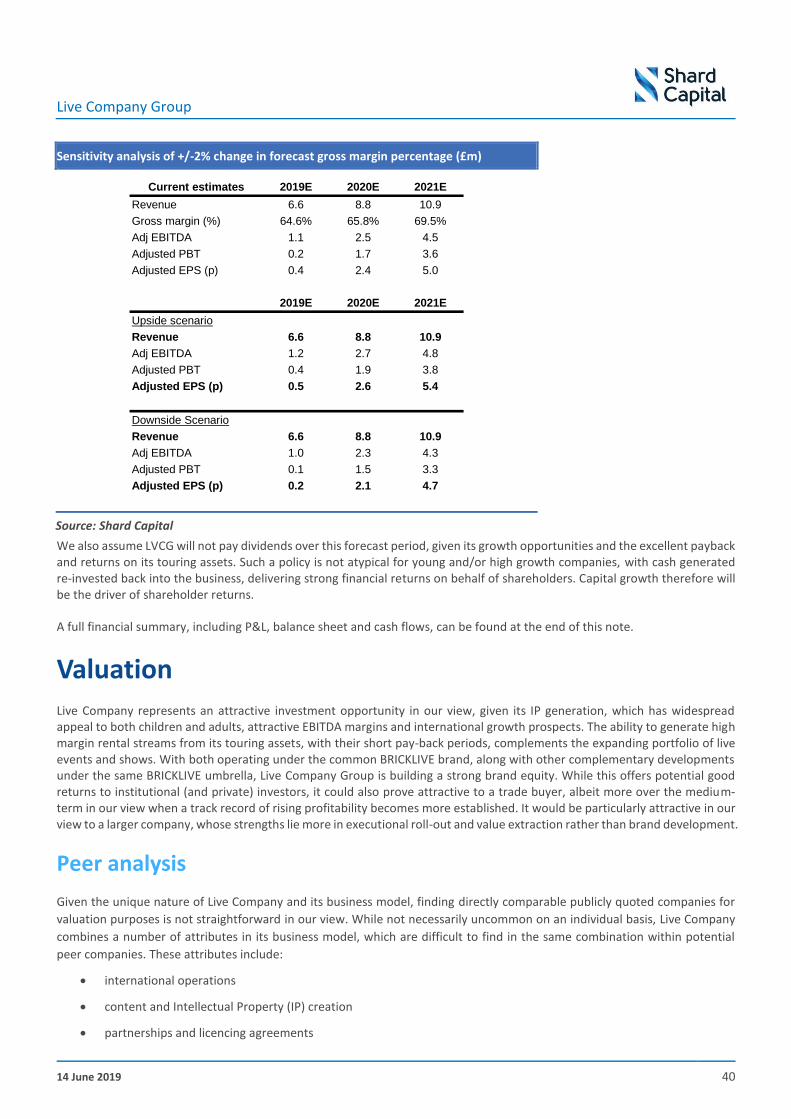
Live Company Group
14 June 2019 40
Sensitivity analysis of +/-2% change in forecast gross margin percentage (£m)
Source: Shard Capital
We also assume LVCG will not pay dividends over this forecast period, given its growth opportunities and the excellent payback and returns on its touring assets. Such a policy is not atypical for young and/or high growth companies, with cash generated re-invested back into the business, delivering strong financial returns on behalf of shareholders. Capital growth therefore will be the driver of shareholder returns.
A full financial summary, including P&L, balance sheet and cash flows, can be found at the end of this note.
Valuation
Live Company represents an attractive investment opportunity in our view, given its IP generation, which has widespread appeal to both children and adults, attractive EBITDA margins and international growth prospects. The ability to generate high margin rental streams from its touring assets, with their short pay-back periods, complements the expanding portfolio of live events and shows. With both operating under the common BRICKLIVE brand, along with other complementary developments under the same BRICKLIVE umbrella, Live Company Group is building a strong brand equity. While this offers potential good returns to institutional (and private) investors, it could also prove attractive to a trade buyer, albeit more over the medium-term in our view when a track record of rising profitability becomes more established. It would be particularly attractive in our view to a larger company, whose strengths lie more in executional roll-out and value extraction rather than brand development.
Peer analysis
Given the unique nature of Live Company and its business model, finding directly comparable publicly quoted companies for
valuation purposes is not straightforward in our view. While not necessarily uncommon on an individual basis, Live Company
combines a number of attributes in its business model, which are difficult to find in the same combination within potential
peer companies. These attributes include:
• international operations
• content and Intellectual Property (IP) creation
• partnerships and licencing agreements
Current estimates 2019E 2020E 2021E
Revenue 6.6 8.8 10.9
Gross margin (%) 64.6% 65.8% 69.5%
Adj EBITDA 1.1 2.5 4.5
Adjusted PBT 0.2 1.7 3.6
Adjusted EPS (p) 0.4 2.4 5.0
2019E 2020E 2021E
Upside scenario
Revenue 6.6 8.8 10.9
Adj EBITDA 1.2 2.7 4.8
Adjusted PBT 0.4 1.9 3.8
Adjusted EPS (p) 0.5 2.6 5.4
Downside Scenario
Revenue 6.6 8.8 10.9
Adj EBITDA 1.0 2.3 4.3
Adjusted PBT 0.1 1.5 3.3
Adjusted EPS (p) 0.2 2.1 4.7

Live Company Group
14 June 2019 41
• themed live events
• entertainment
• education
• high turnover and profit growth projections
• attractive EBITDA margins
We have therefore initially drawn on comparator companies (compcos) from business sectors, where companies exhibit a
combination of these attributes, looking initially at related sectors, such as Travel & Leisure and Media, sub-sectors of the latter
including Broadcasting & Entertainment and Publishing. Thus, we view theme park operators and exhibition/publishing
companies as matching several of these attributes and have therefore selected the majority of our peer comparators from
these sectors. Given the international nature of such operations, not all of these companies are listed on the UK market. While
this can arguably cause some issues with regard to comparative valuations, given different valuation metrics across
international market indices, we believe that the commonality of shared attributes is of greater importance and trumps
differences in particular market metrics.
The theme park operators we have selected are Merlin, Parques Reunidos Servicios Centrales, Six Flags Entertainment, Sea
World Entertainment, Cedar Fair and Walt Disney. With the exception of Walt Disney, which has significant operating divisions
in Media and Studio Entertainment, the other five operators derive the majority of their revenues and profits from the
operation (and management) of theme parks. Some eg Parques Reunidos have also developed formats to be operated within
shopping centres/malls, thereby adding another delivery channel to consumers. These companies typically generate EBITDA
margins of around 30% -35%. This is higher than our forecast 25% EBITDA margin for LVCG in FY19E, but around 5% - 15% lower
than our forecast EBITDA margins of 38.9% in FY20E and 44.5% in FY21E. It could clearly be argued that these superior margins
should be ascribed a premium in relation to the compcos. This could prove to be the case over time, but at this early stage of
LVCG’s development, the market will naturally ascribe a higher risk factor and discount future earnings accordingly through a
lower valuation metric. From a market perspective, the compcos, with their longer track records, and lower but sustainable
growth rates, are seen as lower risk investments and therefore currently attributed higher valuation metrics.
We have also selected two companies, Madison Square Garden and Live Nation Entertainment, which are focused on
entertainment venues and experiences, delivering live events to consumers. Informa and Relx are multi-divisional
organisations, which both include a major international exhibition division, primarily focused on B2B trade exhibitions. Comcast
is also a major media and business services conglomerate, which owns NBC Universal, an operator of theme parks.
We have also included two smaller companies within our compcos, in order to have reference to companies listed on AIM. It
has been difficult to select comparators from AIM for a number of reasons, including lack of track record and profitability. Our
two selections do not operate in the same field as LVCG, but do share some attributes, hence their inclusion. Bonhill is a B2B
media company, which delivers live events internationally, principally award ceremonies. Mind Gym describes itself as a “global
provider of human capital and business improvement solutions”. While this sounds far removed from LVCG, it shares two key
attributes – namely the development of value-added Intellectual Property (IP) and education.
As will be seen in the compco table below, we have split these companies into two sub-groups in order to show the average
valuation metrics for each group. This both shows variations and also allows readers to apply the valuation metrics of their
choice, rather than the overall average figures (with some minor adjustments), which we use. In addition to this grouping of
thirteen companies, we have included another sub-group of six companies. These are all quoted on UK markets and share the
characteristic of being high growth companies in terms of turnover and/or profits. With the exception of Bonhill and Mind
Gym, the other eleven companies from our initial compco selections are larger and typically show lower and steadier rates of
turnover and profit growth from a much larger base than LVCG. Our selection of high growth companies comprises two stocks
from the General Retailer sector, boohoo and ASOS; Kainos from the software/IT sector; Learning Technologies, which
specialises in workplace digital learning; Frontier Developments, a developer of non-game apps and video games for the
entertainment sector; and JTC, which operates within Financial services. This somewhat eclectic group does however share the
characteristic of high growth, which is reflected in generally higher valuation metrics.
In terms of specific valuation metrics, we have selected EV/Sales, EV/EBITDA and PER. These are based on market consensus
forecasts for the individual companies from Thomson Reuters. These have been adjusted for our compcos to reflect calendar

Live Company Group
14 June 2019 42
years 2019, 2020 and 2021, which correspond conveniently to the financial reporting period for Live Company Group and
therefore our outer year forecasts for its FY19E, FY20E and FY21E reporting periods. Where there is insufficient data to drive a
Year 3 forecast for a small minority of our compcos, this has been highlighted as ”n.a.”.
The following table summarises these valuation metrics for our compcos. We have included lines to show the average
unweighted metrics for the six companies designated as theme park operators, one for the other compcos combined, and one
for the high growth companies, as well as an overall average for the whole universe. Where metrics are unavailable for 2021,
the total and sub-sector averages have been adjusted accordingly.
As is usually the case, there are wide variations in valuation metrics across the selected compcos. The highest sub-grouping
multiples are unsurprisingly found for the high growth companies, with the live entertainment companies, Madison Square
Garden and Live Nation Entertainment, having the greatest distortive impact on the average basket of metrics, especially on
the PER metric. When looking at the compco average PER, we have chosen to eliminate the highly distortive effect of these
two companies’ PER ratios from the average. This brings the compco PER averages down to 23.5x, 20.2x and 17.7x from the
44.7x, 31.4x and 24.9x shown in the table below.
Valuation metrics for selected peer comparator companies (as at 30 May based on consensus forecasts)
Source: Thomson Reuters, Shard Capital
Valuation discussion
Having derived average comparator valuations, these can be applied to the relevant elements within our forecasts (EBITDA,
sales and pre-exceptional profit after tax) in order to derive an implied share price valuation for LVCG. We have based our
calculations on a share number count of 70.6m, namely the enlarged share capital following the £2.2m gross equity raise of
February 2019. Using this figure in effect assumes that the warrants issued to participants in February’s equity raise will not be
exercised. If exercised in full, these warrants would result in the issue of a further 4.23m new ordinary shares. The effect of
this would translate to just under a 6% dilution to the valuation ranges given.
It will also be seen in the summary table below that we have included two valuation ranges based on the PER metric. The
reason for this is that our forecasts assume that LVCG will not be liable for corporation tax over our medium-term forecast
period due to accumulated historic tax losses. This factor drives a higher valuation compared with companies paying taxes
(including those in our compco group). We have therefore addressed this by applying corporation tax at an assumed 18% rate
to our forecast pre-exceptional PBT, which consequently reduces the implied valuation.
EV/EBITDA EV/Sales PER
CY19E CY20E CY21E CY19E CY20E CY21E CY19E CY20E CY21E
Merlin Entertainments PLC 9.7 8.9 8.3 2.9 2.7 2.5 18.5 16.3 15.3
Parques Reunidos Servicios Centrales SA 11.6 11.0 n.a. 3.7 3.5 n.a. 17.2 16.0 n.a.
Walt Disney Co 16.2 15.0 13.8 4.3 3.6 3.4 20.7 20.4 18.6
Six Flags Entertainment Corp 12.6 11.9 11.2 4.8 4.6 4.4 19.3 17.8 15.9
SeaWorld Entertainment Inc 8.7 8.2 7.7 2.7 2.6 2.6 18.4 16.6 15.2
Cedar Fair LP 9.7 9.4 9.1 3.4 3.3 3.2 16.4 15.7 15.2
Theme park unweighted average 11.4 10.7 10.0 3.6 3.4 3.2 18.4 17.1 16.0
Madison Square Garden Co 30.4 26.2 23.0 3.8 3.5 3.3 230.9 148.6 96.1
Live Nation Entertainment Inc 15.5 13.9 12.4 1.2 1.1 1.0 218.5 104.8 60.8
Comcast Corp 8.8 8.3 8.0 2.8 2.6 2.5 14.4 13.0 12.0
Informa PLC 12.9 12.4 11.5 4.5 4.4 4.2 15.5 14.6 13.5
Relx PLC 14.9 14.3 13.6 5.3 5.0 4.9 19.8 18.5 17.5
Bonhill Group PLC 8.2 5.7 5.1 1.4 1.1 1.0 11.2 7.6 6.8
Mind Gym PLC 12.6 11.2 n.a. 3.0 2.4 n.a. 17.7 15.7 n.a.
Other compco unweighted average 14.7 13.1 12.3 3.1 2.9 2.8 75.4 46.1 34.4
Boohoo Group PLC 23.3 18.4 14.7 2.2 1.8 1.4 46.5 36.9 30.1
ASOS PLC 18.9 14.0 10.7 1.0 0.8 0.7 54.6 36.4 26.9
Kainos Group PLC 25.5 22.4 20.6 4.1 3.8 3.6 34.9 30.6 27.7
Learning Technologies Group PLC 16.2 14.6 12.7 4.8 4.5 4.1 22.6 20.6 17.9
Frontier Developments PLC 15.5 13.5 10.5 4.4 4.7 3.5 34.0 30.3 19.3
JTC PLC 14.7 13.0 11.6 4.9 4.4 4.1 17.6 15.8 14.1
Growth companies 19.0 16.0 13.5 3.6 3.3 2.9 35.0 28.4 22.7
Total compco unweighted average 15.0 13.3 12.0 3.4 3.2 3.0 44.7 31.4 24.9

Live Company Group
14 June 2019 43
Before commenting more specifically on these implied valuations, it is worth highlighting the difficulties in valuing high growth
companies, of whatever size, but especially in early years when they are building their businesses and are often both
unprofitable and consuming cash. This applies across all sectors, with the best-known examples probably in the tech and online
arenas, especially those with disruptive models challenging more traditional incumbents. Amazon, Tesla and ASOS would serve
as good examples here. When unprofitable, PER and EV/EBITDA multiples are of no use in deriving valuations, hence the use
of other metrics such as EV/sales. Sales are always visible, and typically high growth companies with higher gross (and EBITDA)
margins would be valued more highly on an EV/sales basis than those with lower gross margins – since each pound of sales
generates more cash and potential profit.
LVCG’s forecast revenue growth up to FY21E translates into compound growth rate of 26.6% on a three-year basis and 28.7%
on a two-year basis. On a two-year basis, the CAGR turnover growth of the compco group falls in a range of 2% - 24% with an
average of 9.2%. This is however heavily weighted by the high growth sub-grouping. Excluding these companies, the range is
2% - 19%, with an average of 6.9%. LVCG’s growth rate is therefore over four times greater than that of the more established
compco group. As with the EBITDA margin superiority outlined above, which should over time be ascribed a premium
(EV/EBITDA ratio) to the compcos, LVCG’s superior top line growth should over time be ascribed a premium (EV/sales ratio) to
its peer comparators as well.
Looking now to our compco driven valuations, it is immediately clear from the summary that the market is not valuing LVCG
on the basis of its near-term potential. The current share price is far in excess of the implied price ranges, based on our forecasts
for both FY19E and FY20E. This is understandable in our view given the shape of our forecasts and the underlying growth rates
in both turnover and EBITDA over the next three years. It is also a clear indication that the market is looking through the more
immediate prospects, as the company moves from loss to profit and starts to establish a new business model with significantly
improved EBITDA margins and cash generation. More importantly and pertinently, the market is clearly buying into to the
longer-term high growth prospects and opportunities.
When looking at the average 73p for the FY21E valuation range, the implication is that LVCG shares are firmly underpinned
around the current share price. The low end of the range (49p) is based on the EV/sales metric, which implies to us that the
market is not yet placing a premium rating on this metric, based on the combination of superior turnover growth and superior
EBITDA margins at LVCG in comparison with the compco group. To underline this point, if the highest EV/sales for FY21E – that
of Relx – is applied to our LVCG forecasts, the implied share price valuation jumps to 80p, which is more in line and keeping
with the other FY21E implied valuations. The top end of the FY21E valuation range (89p) implies that the shares are currently
undervalued against the compco group and therefore have good upside potential. The current shortfall may reflect a number
of factors. LVCG is a young company, and therefore lacks an established track record in relation to the better established
majority of our selected compcos. With less confidence and transparency on its Year 3 (FY21E) performance, compared with
the lower growth rates forecast for the larger compcos, markets and investors usually apply a larger risk factor to discount this.
As long as LVCG continues to perform well and deliver – and preferably beat – market expectations, the discount factor will
reduce and the valuation gap close over time.
Implied LVCG share price based on average compco valuation metrics
Source: Shard Capital
CY19E CY20E CY21E
EV/EBITDA 23 46 81
EV/sales 31 39 49
PER untaxed 8 48 89
PER taxed 7 39 73
Average 17 43 73

Live Company Group
14 June 2019 44
Valuation conclusion
On the basis of our compco valuation analysis, we believe an appropriate valuation range on a one year view for Live Company
is 73p – 89p. The lower end of this range is based on the average of the FY21E implied valuations, including the drag effect of
the EV/sales metric. This underpins the shares and their future prospects on a similar relative valuation to the compco group,
and suggests downside risk should be limited from their current trading level. The top end of our valuation range is pitched at
the upper end of the FY21E valuations. We believe that newsflow on new business gains, with existing or new clients, will be
viewed positively by the market, as it will increase investor confidence and reduce perceived risk relative to future earnings.
This in turn could push the shares towards or indeed through the 100p level, reflecting the valuations implied by the application
of the FY21E metrics of our selected high growth compco sub-group. Conversely, negative newsflow could have an adverse
impact on sentiment and share price with downside risk below our valuation range.

Live Company Group
14 June 2019 45
Senior Management and Board of Directors
Board of Directors
David Ciclitira, Executive Chairman
David has played a significant role in shaping today's satellite broadcasting and sponsorship landscape over his 35-year career.
He was one of the four original shareholders of Europe's first satellite television station, Satellite Television plc ('SATV'), which
was renamed SKY following the sale in 1983 of 65% of SATV to Rupert Murdoch's News Corporation. David remained with Sky
as Deputy Managing Director until the end of 1986. While at Sky Channel, David was responsible for establishing Sky's own
production company and for setting up of the first VPL and Pan-European PRS agreements, as well as the conception of, and
early involvement in, the setting up of Eurosport. During this time he also established the first ever World Music Video Awards.
In 1987, David founded Parallel Media Group plc (PMG). In 1998, under David's guidance PMG entered into a joint venture
with NBC for the formation of CNBC Sports International Limited, the international sports broadcasting arm of NBC which was
broadcast on its CNBC Europe and CNBC Asia platforms. David has been an instrumental force in changing the sports marketing
strategies of some of the world's leading Federations : working to take the European Tour golf out of Europe and into South
Africa and then Asia (including introducing the first professional golf tournament to China at Mission Hills), re-launching the
World Cup of Golf and bringing the event under the wing of the Five Tours, representing the World Nordic Ski Championship
on behalf of the FIS, overseeing the sponsorship and broadcast strategies of the Davis Cup, raising sponsorship for the first ever
Jordan Formula One team with 7Up, representing the commercial rights of the Ladies European Golf Tour, instigating the
commercialisation of the English and Italian Rugby Unions, and creating the Tour of China cycling race. PMG successfully sold
its shareholding in CNBC Sports to NBC in 2004.
David has also overseen the marketing strategies for some of the world's leading brands, including managing Pepsi's UK music
sponsorship strategy for several years, representing Heineken as its global sponsorship agency, creating the pan-European
Buckler Basketball Challenge and overseeing their activities in golf, as well as overseeing their sponsorship of the Whitbread
Round the World Yacht Race, acting as Omega's sponsorship agency of note, negotiating UBS's title sponsorship of the Hong
Kong Open, creating a sports tourism strategy for South Africa at the end of apartheid and launching the Ballantines
Championship in Korea for Pernod Ricard.
David's reputation as a leading marketer and dynamic entrepreneur in the Asian marketplace led to the establishment of a
joint venture with Live Nation to form Live Nation Marketing Partnership Asia Limited ('LNMPA'). In only two years since its
inception, under David's guidance, LNMPA raised many USD millions in funding for a new annual Electronic Daisy Carnival
festival in Tokyo, created a pan-Asian joint venture with Google/YouTube and negotiated various pan-regional sponsorship
relationships with leading multinational brands to sponsor concerts across the region.
In May 2016, David invested in Brick Live Group and became its Executive Chairman and majority shareholder. In December
2017, David reversed Brick Live Group and its sister company Parallel Live Group (the organiser of US LEGO-based shows) into
Live Company Group plc (LVCG), which trades on the AIM market of the London Stock Exchange.
David read law at Kings College London and became a Barrister within the Blackstone chambers prior joining the merchant
bank Guinness, Mahon & Co.
Andrew Smith, Executive Director and Managing Director of Brick Live
Andy joined Brick Live as Managing Director in November 2017 and became an Executive Director of the Company in December 2017. Andy was previously Director of Events at Multiplay (UK) Limited, which is part of Game Digital plc. Multiplay runs the Insomnia Gaming Festival (“Insomnia”), the UK’s largest games event and is one of one of Brick Live’s commercial partners. Andy joined Multiplay in 2015 where he was Director of The Insomnia Gaming Festival and Event Director, where he oversaw a team of 60 full time staff in the events and e-sports division. During his time with Multiplay, the annual footfall to Insomnia events in the UK more than doubled, attracting over 130,000 visitors annually.
Andy negotiated commercial agreements, on behalf of Multiplay, as a licensee partner, with Brick Live and successfully hosted the four BRICKLIVE events held in the UK in London, Birmingham, Glasgow and Belfast during 2017. Andy has experience in

Live Company Group
14 June 2019 46
coordinating a number of well-known international events on behalf of companies such as Microsoft, Island Records (Universal Music), Nintendo and Mojang, including Minecon, the largest single video game convention in the world.
Prior to joining Multiplay, Andy spent 8 years with the FTSE100 listed Compass Group PLC, where he was latterly a regional general manager with considerable experience in events and commercial operations, spearheading the sales and management of conferences, events, catering, hotels and match day experiences for clients such as the Ricoh Arena (home of Wasps Rugby Football Club and Coventry Football Club), Leicester City Football Club, Warwickshire County Cricket Club, Edgbaston Priory and Sheffield United Football Club.
Bryan Lawrie, Chief Financial Officer
Bryan was appointed Chief Financial Officer for LVCG in October 2018, having acted as interim CFO from June 2018.
Bryan started his career in the London office of PKF, a global network of accountancy firms, heading up the Business Support service team. This was followed with a period of providing CFO services on a portfolio basis and then founding CFO Partners in early 2015. As an experienced interim CFO, Bryan worked with CEO’s and other Board directors advising on both business and financial strategic matters, converting strategy into an action plan and working with all areas of the business to make it happen. A particular strength is automating finance functions and strengthening internal controls.
Ranjit Murugason, Non-Executive Director
Ranjit joined the Board of Parallel Media in 2010. He has a degree in law and history from SOAS, University of London. In addition, he holds a Masters degree in law from Corpus Christi College, Oxford. Ranjit has over 20 years’ experience in strategic advisory, corporate finance and investment banking and capital markets in Europe, Asia, the Middle East and the USA. Previously Ranjit served as a Managing Director of the investment banking division of ABN Amro, having previously worked in London for both Nomura Securities and UBS.
More recently he was a senior advisor to GMR Group, one of India’s largest multinational infrastructure businesses and chief executive officer of the international division with assets under management of over US$5 billion. He is the founder and Managing Director of Urban Strategic established in London in 2003 and currently headquartered in Singapore.
Trudy Norris Grey, Non-Executive Director
Trudy has accumulated a wealth of experience in the technology industry from over thirty years of working for a number of blue chip companies. Her positions have centred around sales, marketing, and channel management, as well as business development and portfolio transformation. She currently works for Microsoft as Managing Director of Business Development and Smart Cities (through the CityNext programme), and is based in Seattle. She has held senior roles before this at BT, Sun Microsystems and Oracle.
Trudy is Chair of WISE, a UK-based organisation seeking to add a million more women to the UK STEM (science, technology, engineering and mathematics) workforce. She is a past Chair of the CBI Committee on Innovation, Science & Technology and a member of the oversight committee of the UK’s national Technology Strategy Board, and was a founding member of the CBI Leadership Group on Climate Change. Trudy is a Fellow of the Chartered Association of Certified Accountants (FCCA).
Simon Horgan, Non-Executive Director
Simon brings a wealth of experience across several industry sectors, but most relevant to the future expansion of the LVCG’s business is his knowledge and track record in international exhibition and conference venue management, together with event and exhibition portfolio management and development. Simon has been involved in the events and exhibitions sector for over 30 years. For 6 years he was the CEO of the Abu Dhabi National Exhibition Centre (ADNEC) during which time he raised AED 1.4bn to establish a Capital Centre development for ADNEC and acquired London's flagship exhibition venue, ExCel, in a £318m deal for the Abu Dhabi government. Under his leadership, ExCel became the second venue for the 2012 London Olympics.
His legacy in the Emirates includes the successful conclusion of major construction projects such as the ADNEC Marina, several hotels and the Gulf’s largest indoor arena. Prior to joining ADNEC, Simon was the COO for the National Exhibition Centre in Birmingham, our regular venue for the largest UK BRICKLIVE show. He was responsible for all of the business activities of the

Live Company Group
14 June 2019 47
NEC, which represented 100% of the operating profit. He also acted as a consultant on the development of a further 10 exhibition centres.
Simon Horgan joined the board of LVCG following its acquisition of Bright Bricks, where he was Executive Chairman, having joined Bright Bricks in 2016.
Serenella Ciclitira, Non-Executive Director
Serenella joined the Board of Parallel Media in 2010. Between 1992 and 2000 Serenella was Group Managing Director of the pan-European satellite broadcaster Super Channel, which later became NBC Europe. She has worked extensively with art galleries and artists around the world. She has an Honours Degree in Art History from Trinity College, Dublin and since 1990 has been an Honorary Fellow at the Royal College of Art in London.
With David Ciclitira, she founded the Global Eye Programme, which aims to develop the art infrastructure for budding artists in Asia, where events have been held in Korea (2009 to 2012), Indonesia (2011), Hong Kong (2013), Malaysia (2014), Singapore (2015), Thailand (2016) and Vietnam (2017).
Key Senior Management
Ruth Cunningham, Chief Operating Officer, Live Company Group
Working in both the public and private Property sector for nearly 13 years, Ruth brings a wealth of experience to the company as COO, Live Company Group. She has two MSc's in Urban and Regional Planning and Real Estate Development. Between 2008 and 2015, Ruth worked as Planning Manager at Transport for London. She worked on a number of large planning schemes for new homes and stations around London.
Ruth also has a significant amount of expertise in the corporate environment, where she has worked and managed relationships with a number of business partners, third parties and stakeholders during this time. She also negotiated and oversaw the drafting of legal and contractual agreements as well as performed general project management duties.
Ruth joined Live Company Group in 2018.
Sarah Whittaker, Chief Marketing Officer, Live Company Group
Sarah will join the group in early May 2019, where she will have responsibility for running the UK flagship show at the NEC, as well as other BRICKLIVE shows in both the UK and Europe. Sarah managed BRICKLIVE events at the NEC for the previous promoter, so she brings highly relevant experience to the group. Prior to that, she had worked with the NEC for over five years.
Tina Anthony, LVCG Director Business Development
Tina has almost 30 years’ experience working in the global events industry. As Marketing Director for The NEC and General Manager of the ICC, Birmingham, she was involved in both overseas exhibitions and convention centre development projects in Europe, Hong Kong and Malaysia. She has also worked in the UAE, spending four years as Commercial Vice President for the Dubai World Trade Centre and four years as Projects Director, then Business Development Director for ADNEC.
Tina joins from Bright Bricks to this role, having been deeply involved in setting up consumer sales, identifying overseas opportunities and creating new touring shows.
Jon Gayton, Chief Operating Officer, BRICKLIVE Group
Jon joined the team at the end of 2017 and focused on new business development, working closely with the Chairman. Jon has nearly 10 years’ experience in the events industry running and developing events from concerts for global performers, sell out football matches and large-scale conventions. He moved into his new position within the group in November 2018.
Sonia Hong, Director Asia
Educated at University of California Berkley and Soon Chunhyang University in Seoul, Sonia has significant experience in launching international leisure and entertainment brands in Korea. Sonia represented the New Zealand tourist board in Korea from 1993 to 2006, receiving the Order of Merit from Queen Elizabeth for the help in promoting New Zealand in Korea. From

Live Company Group
14 June 2019 48
1999 to 2007, Sonia was the President of the International Tourism Network in Seoul and from 2007 to 2010 was the Secretary General for Visit Korea Committee. Sonia managed relations with a variety of government agencies and created innovative promotions with K-POP and other Korean Wave products, securing supporting sponsorships from Lotte, Asiana Airlines and Korean Airlines.
In 2010, Sonia joined PMG as its Korea President, responsible for numerous partnership and sponsorship relations with major brands including F1, Saatchi Gallery, Ballantine’s and AIA. Sonia joined BRICKLIVE Group as its Director of Asia in September 2016 and has overseen the inaugural BRICKLIVE exhibition in Seoul and the first two BRICKLIVE Centres

Live Company Group
14 June 2019 49
Risks All businesses face risks and uncertainties, which are of both a general nature and a specific nature, pertaining to the business. Live is a very different business now than a year ago, and several of the risks highlighted in the 2017 report and accounts have either been eliminated or considerably reduced. Most notably the “reliance on access to good quality content for BRICKLIVE events” and the “reliance on third parties “for content have been eliminated through the acquisition of Bright Bricks.
Similarly, while still a young company, the risks associated with “early stage of operations” (with a complement of just five employees at the end of 2017) should certainly be lower now than 15 months ago. It could be argued that these have been replaced by the integration risks (such as systems integration, employee morale and retention, corporate culture) following the acquisition of Bright Bricks. Given the continuing success in winning new contracts and new partners in the international arena, we see little evidence of this being the case.
Protection of Intellectual Property and wider litigation risk This has also significantly expanded the Group’s intellectual property (IP), which should increase its ability to protect and trade mark its in-house IP. While this is the case, it does not completely eliminate the risk of claims against the company by third parties regarding infringement of their proprietary rights, trademarks or patents. Litigation would be a significant distraction to the business, involving senior management and deflecting them from their focus on growing and managing the business.
Acquisition of new licensee partners The 2017 report and accounts clearly highlights revenue growth and the number of licence partners as two Key Performance Indicators (KPI’s). There can be no guarantee of successfully acquiring incremental licence or business partners, irrespective of management’s best efforts and intentions to do this. Given that lead times will vary in signing new contracts, it is important for Live to develop a pipeline of potential new business and partners, and to dedicate the time and money to this activity.
Business retention Just as gaining new partners and contracts is vital for incremental business growth, it is equally important to retain existing business and partners. Contract losses, especially those of a multi-year nature and/or of a significant size, would damage Live’s financial performance relative to internal budgets and the expectations of external shareholders and stakeholders. Developing good relationships with existing clients will usually require regular contact. Conversely, Live cannot control the activities of its partners on a day to day basis with regard to their delivering their contractual obligations to the expected standards. Failure to deliver these standards could in turn result in reputational risk and potentially damage to the value of the company and and the brand equity of BRICKLIVE.
Key staff retention The success of the company and its future development is dependent on the continued service and performance of senior management and other key personnel. The introduction of share awards has been one way of seeking to reward, motivate and retain such key staff.
There is always an element of key person risk within any business, but especially so within smaller fledgling businesses, where the founder is still actively involved. In such cases, the permanent or temporary loss of such key staff would clearly be detrimental to the business. We believe this would be the case with regard to David Ciclitira, who is the main ambassador of the business, responsible for securing many partner and contract gains for the company.
Live Company Group
14 June 2019 50
Production constraints to business growth Continued growth of the business will require the construction of more content for contracted shows and tours. In turn this will require access to bricks and model builders. We believe that access to bricks is unlikely to be an issue, given that the acquisition of Bright Bricks has secured a significant stock of bricks. Similarly, market access to purchase bricks, directly from manufacturers or via exchange platforms, does not appear to be an issue, to the extent that management is comfortable with the assumption that brick purchases will match brick usage (hence the flat stock position in our balance sheet forecasts. There could potentially be an issue in terms of the number of model builders available, although Bright Bricks has access to a number of skilled part-time builders and model enthusiasts, upon whom it can call to complement its full-time workforce.
Potential production bottlenecks could also be mitigated or avoided through the potential franchising of another model production facility. We understand that any such franchised production facility would not have access to or usage of the company’s proprietary design software, but would simply build models to plans and instructions delivered from the UK production facility.
Operating expenses rise faster than expected If operating costs were to rise faster than expected, this would have an adverse impact on profitability if they could not be recovered through increasing prices to clients or from internal efficiency measures and cost savings.
Geo-political risks across international and domestic markets Live is currently doing business across four continents, thereby working in different commercial and political environments with inherent risks from having a wide variety of political, legal, financial and economic factors to manage and contend with. Many of these risks are difficult to quantify, especially in markets with less developed regulatory environments. In some instances this could lead to difficulties in debtor collection and repatriation of funds. With many contracts designated and paid in US dollars, this also exposes the group to foreign exchange (FX) risk and the need to use financial instruments to hedge such risk. An economic downturn in any of the larger and more important markets to which Live is exposed, could lead to weaker consumer spending in general and therefore to Live’s consumer offerings.
Investment risks Investing in shares in publicly quoted carries a number of inherent risks, which include but are not limited to:
• stock markets and shares can fall as well as rise, often as a result of circumstances beyond the control of individual companies eg economic downturns, political events, Brexit, oil prices, terrorism
• company failure to meet forecasts and therefore market expectations
• the emergence of new competitors or industry disruptors
• equity raises may dilute the interests of existing shareholders

Live Company Group
14 June 2019 51
Major shareholders
Major Shareholders – as at 12 June 2019
Source: Thomson Reuters, Shard Capital
David Ciclitira 38.86%
Hyun Seok Kim 14.43%
Shard Capital Partners 6.49%
Clive Morton 5.76%
Fortune Access 4.26%
Ed Diment 4.00%
Simon Horgan 4.00%
Duncan Titmarsh 4.00%
Miton Asset Management 2.98%
Jarvis Investment Management 2.71%
Ranjit Murugason 1.73%
Brewin Dolphin 0.95%

Live Company Group
14 June 2019 52
Summary Financials
Profit and loss account and cash flow forecasts
Source: Company Information, Shard Capital
Profit and loss account
Year to December 2017 2018 2019E 2020E 2021E
Turnover 1.9 5.4 6.6 8.8 10.9
Cost of sales (0.8) (3.6) (2.3) (3.0) (3.3)
Gross profit 1.1 1.8 4.2 5.8 7.5
Gross margin (%) 57.2% 32.9% 64.6% 65.8% 69.5%
Operating costs (1.5) (3.0) (3.7) (4.0) (3.9)
Operating profit (0.4) (1.3) 0.5 1.8 3.6
Operating profit margin (%) -20.3% -23.6% 8.2% 20.1% 33.5%
Depreciation and amortisation (0.1) (0.4) (0.6) (0.7) (0.9)
EBITDA (0.3) (0.9) 1.1 2.5 4.5
EBITDA margin (%) -14.2% -16.7% 16.9% 28.6% 41.8%
Interest charge (0.0) (0.0) (0.3) (0.1) (0.1)
Pre-exceptional PBT (0.4) (1.3) 0.2 1.7 3.6
Exceptional charges (5.0) (1.3) 0.0 0.0 0.0
Profit before tax (5.4) (2.6) 0.2 1.7 3.6
Adjusted diluted EPS (p) (0.6) (2.3) 0.4 2.4 5.0
Diluted EPS (p) (11.0) (4.7) 0.4 2.4 5.0
Dividend (p) 0.0 0.000 0.0 0.0 0.0
Cash flow
Year to December 2017 2018 2019E 2020E 2021E
Operating profit (0.3) (2.6) 0.5 1.8 3.6
Depreciation and amortisation 0.1 0.4 0.6 0.7 0.9
Inventory (increase)/decrease 0.0 (0.1) 0.0 0.0 0.0
Debtors (increase)/decrease (0.0) 1.1 (0.1) (0.7) (0.3)
Creditors increase/(decrease) 2.9 (2.1) (1.1) (0.5) 0.1
Other (0.4) 0.0 0.0 0.0 0.0
Operating cash flow 2.4 (3.3) (0.2) 1.3 4.3
Interest (0.0) 0.0 (0.3) (0.1) (0.1)
Tax 0.0 0.0 0.0 0.0 0.0
Dividends 0.0 0.0 0.0 0.0 0.0
Capital expenditure 0.0 (1.0) (1.3) (1.3) (1.3)
Trading cash flow 2.4 (4.3) (1.8) (0.1) 3.0
Acquisition of businesses (0.7) (2.2) 0.0 0.0 0.0
Disposals of businesses 0.0 0.0 0.0 0.0 0.0
Share issues 1.3 4.7 2.2 0.0 0.0
Currency effects, other (1.9) (0.1) 0.0 0.0 0.0
Net cash inflow/(outflow) 1.0 (1.9) 0.4 (0.1) 3.0
Net (debt)/cash 1.0 (0.9) (0.5) (0.5) 2.5

Live Company Group
14 June 2019 53
Balance sheet forecasts
Source: Company Information, Shard Capital
Balance sheet
Year to December 2017 2018 2019E 2020E 2021E
Tangible fixed asssets 0.8 3.6 4.2 4.7 5.0
Intangible fixed assets 4.2 4.4 4.5 4.5 4.6
Investments and other 0.0 0.0 0.0 0.0 0.0
Total fixed assets 5.0 7.9 8.6 9.2 9.6
Stock 0.0 6.5 6.5 6.5 6.5
Trade and other receivables 1.1 0.7 0.8 1.5 1.8
Cash and short term deposits 0.9 0.1 0.5 0.5 3.5
Other 0.0 0.0 0.0 0.0 0.0
Current assets 2.0 7.3 7.9 8.5 11.8
Total assets 7.0 15.2 16.5 17.7 21.4
Trade and other payables (2.6) (2.6) (1.5) (1.0) (1.1)
Borrowings 0.0 (1.0) (1.0) (1.0) (1.0)
Other current liabilities (1.6) (0.8) (0.8) (0.8) (0.8)
Current liabilities (4.2) (4.5) (3.3) (2.8) (2.9)
Borrowings 0.0 0.0 0.0 0.0 0.0
Other non-current liabilities (0.0) (0.1) (0.1) (0.1) (0.1)
Non-current liabilities (0.0) (0.1) (0.1) (0.1) (0.1)
Total liabilities (4.2) (4.6) (3.4) (2.9) (3.1)
Net assets 2.8 10.6 13.1 14.8 18.3

Live Company Group
14 June 2019 54
Disclaimer This document has been prepared and issued by Shard Capital Partners LLP (“Shard Capital”), which is authorised and regulated by the Financial Conduct Authority.
This document constitutes a minor non-monetary benefit. This document is a marketing communication and not independent research. As such, it has not been prepared in accordance with legal requirements designed to promote the independence of investment research.
This document is published solely for information purposes and is not to be construed as a solicitation or an offer to buy or sell any securities, or related financial instruments. It does not constitute a personal recommendation as defined by the Financial Conduct Authority, nor does it take account of the particular investment objectives, financial situations or needs of individual investors. The information contained herein is obtained from public information and sources considered reliable. However, the accuracy thereof cannot be guaranteed.
The information contained in this document is solely for use by those persons to whom it is addressed and may not be reproduced, further distributed to any other person or published, in whole or in part, for any purpose, at any time, without the prior written consent of Shard Capital. This document is not intended for retail customers and may not be distributed to any persons (or groups of persons) to whom such distribution would contravene the UK Financial Services and Markets Act 2000. Moreover, this document is not directed at persons in any jurisdictions in which Shard Capital is prohibited or restricted by any legislation or regulation in those jurisdictions from making it available. Persons into whose possession this document comes should inform themselves about, and observe, any such restrictions.
Shard Capital or its employees may have a position in the securities and derivatives of the companies researched and this may impair the objectivity of this report. Shard Capital may act as principal in transactions in any relevant securities or provide advisory or other service to any issuer of relevant securities or any company connected therewith.
None of Shard Capital or any of its or their officers, employees or agents accept any responsibility or liability whatsoever for any loss however arising from any use of this document or its contents or otherwise arising in connection therewith. The value of the securities and the income from them may fluctuate. It should be remembered that past performance is not a guarantee of future performance. Investments may go down in value as well as up and you may not get back the full amount invested. The listing requirements for securities listed on AIM or ISDX are less demanding and trading in them may be less liquid than main markets. If you are unsure of the suitability of share dealing specifically for you then you should contact an Independent Financial Adviser, authorised by the Financial Conduct Authority. By accepting this document, the recipient agrees to the foregoing disclaimer and to be bound by its limitations and restrictions.
Shard Capital has in place a Conflicts of Interest Policy relating to its research and marketing communication activities, and disclosure and conflicts in general is available on request.