Embed Size (px)
Citation preview

Annual Report and Accounts 2017
Building the future

Contents
Strategic Report
Section One: Our Business4 Vesuvius at a Glance8 Our Markets10 Our Strategy12 Business Model
Section Two: Our Performance16 Chairman’s Statement18 Chief Executive’s Strategic Review20 Key Performance Indicators22 Risk26 Financial Review32 Innovation 36 Operating Review
36 Steel Flow Control40 Advanced Refractories44 Digital Services46 Foundry
50 Board of Directors52 Group Executive Committee
Section Three: Our Responsibility56 Our Principles60 Health and Safety64 Sustainability67 People and Community
Section Four: Governance 76 Chairman’s Governance Letter78 Governance Report85 Audit Committee93 Nomination Committee96 Directors’ Remuneration Report
96 Remuneration Overview98 Remuneration Policy 106 Annual Report on Directors’
Remuneration117 Directors’ Report121 Statement of Directors’
Responsibilities
Section Five: Financial Statements124 Independent Auditors’ Report130 Group Income Statement131 Group Statement of Comprehensive
Income132 Group Statement of Cash Flows133 Group Balance Sheet134 Group Statement of Changes of Equity135 Notes to the Group Financial
Statements181 Company Balance Sheet183 Notes to the Company Financial
Statements188 Five-year Summary: Divisional Results189 Shareholer Information191 Glossary
Financial PerformanceRevenue
£1,683.9m2016: £1,401.4m+20.2% on a reported basis+12.5% on an underlying basis1
Trading profi t2
£165.5m2016: £133.3m+24.2% on a reported basis +16.1% on an underlying basis1
Return on sales2
9.8%2016: 9.5%+30 basis points+30 basis points on an underlying basis1
Profi t before tax
£97.1m2016: £79.4m22.3% increase
Headline earnings per share3 40.7 pence 2016: 30.4 pence33.9% increase
Recommended fi nal dividend 12.50 pence per share18.00 pence Group full year dividend 2016: 16.55 pence Group full year dividend
Year-end net debt2 £274.3m 1.3x net debt to EBITDA ratio2016: £320.3m 1.8x
Revenue £m
17 1,683.9
16 1,401.4
15 1,322.0
Trading profit2 £m
Operating Profit £m Headline earnings2,3 £m
Statutory EPS pence Free cash flow2 £m
17 165.5
16 133.3
15 124.0
17 109.7
16 92.9
15 92.8
17 110.1
16 82.1
15 75.7
17 14.1
16 21.1
15 18.1
17 93.1
16 61.4
15 65.3
Forward-looking statements This Annual Report contains certain forward-looking statements with respect to the operations, strategy, performance, fi nancial condition, and growth opportunities of the Vesuvius Group. By their nature, these statements involve uncertainty and are based on assumptions and involve risks, uncertainties and other factors that could cause actual results and developments to differ materially from those anticipated. The forward-looking statements refl ect knowledge and information available at the date of preparation of this Annual Report and, other than in accordance with its legal and regulatory obligations, the Company undertakes no obligation to update these forward-looking statements. Nothing in this Annual Report should be construed as a profi t forecast.
1. Underlying basis is at constant currency and excludes separately reported items and the impact of acquisitions and disposals.
2. For defi nitions of alternative performance measures, refer to Note 4 of the Group Financial Statements.3. Headline results refer to continuing operations and exclude separately reported items.
1O
ur Business
At a Glance What we do & where
See page 4
Our Strategy Our aims
See page 10
InnovationOur R&D Focus
See page 32
Vesuvius is a global leader in molten metal fl ow engineering Vesuvius develops innovative, customised high-quality products, services and solutions, to be used in extremely demanding, high-temperature industrial environments. Our goal is to create value for our customers, using our expertise to improve the safety and effi ciency of their manufacturing processes, enhance their end product quality and reduce their costs. In doing this, we aim to deliver sustainable, profi table growth and provide our shareholders with a superior return on their investment, whilst providing each of our employees with a safe workplace where he or she is recognised, developed and properly rewarded.
ur Strategy ur aimsSee page 10
Melvin Bond, Plastic Operator & Union Steward, Chicago Heights, USA

2 Vesuvius plcAnnual Report and Accounts 2017
Section One
Our BusinessIn this section4 Vesuvius at a Glance
8 Our Markets
10 Our Strategy
12 Business Model
The Strategic Report set out on pages 1 to 73 contains a fair review of our businesses, strategy, and business model and the associated principal risks and uncertainties. We also deliver a review of our 2017 performance and set out an overview of our markets. Details of our principles, our people and community engagement, together with our focus on safety, are also contained in the Strategic Report.
Approved by the Board on 28 February 2018 and signed on its behalf by
Patrick André Guy Young Chief Executive Chief Financial Offi cer

3O
ur Business
“I joined Vesuvius in Brazil as part of Project Columbus”
Building on my degree in Chemical Engineering and several industry internships, I joined Vesuvius in Brazil in 2013, as part of Project Columbus, the Group’s international graduate programme. I always wanted to work overseas since fi rst starting college, and was excited to start my nine-month international assignment.
After initial training at home in Brazil, I moved to India where over the course of my nine month secondment, I developed three projects, focusing on resin production and machine maintenance at Foseco in Pune, and on VISO production in Vesuvius Calcutta . This enabled me to apply my interest and expertise in process management and optimisation. It also gave me the opportunity to immerse myself in a culturally very different operation.
Having enjoyed the challenge of working abroad, I then moved to Germany as a Production Manager Assistant at the newly acquired
mould powder plant in Mülheim. Whilst there, I worked on the optimisation of spraying processes, improved packaging standards and implemented other safety standards – all whilst learning to speak German. More recently, I was pleased to accept the additional responsibility of working as the Quality Coordinator at Mülheim, which allows me to work with Vesuvius’ many different departments and learn how the company works as a whole.
I have achieved a lot in my fi rst fi ve years at Vesuvius, developing technical skills, growing in experience and expanding my language capabilities and geographical horizons.
See more about Vesuvius careers People and community on p 67-73
Aline Barros, Quality Coordinator and Production Manager Assistant, Vesuvius Fluxes, Germany

4 Vesuvius plcAnnual Report and Accounts 2017
Vesuvius at a GlanceWe are a global group with a business model based on offering customised products, solutions and services from production facilities in close proximity to our customers.
See our Business Model on p12-13
See more about our Steel and Foundry divisions on p6-7
37Countries
6Continents
66Production sites
11,010Employees
88Sales offi ces
17R&D centres
Our global presence
Michelle Chapman, HR Associate, Pittsburgh West, USA
5
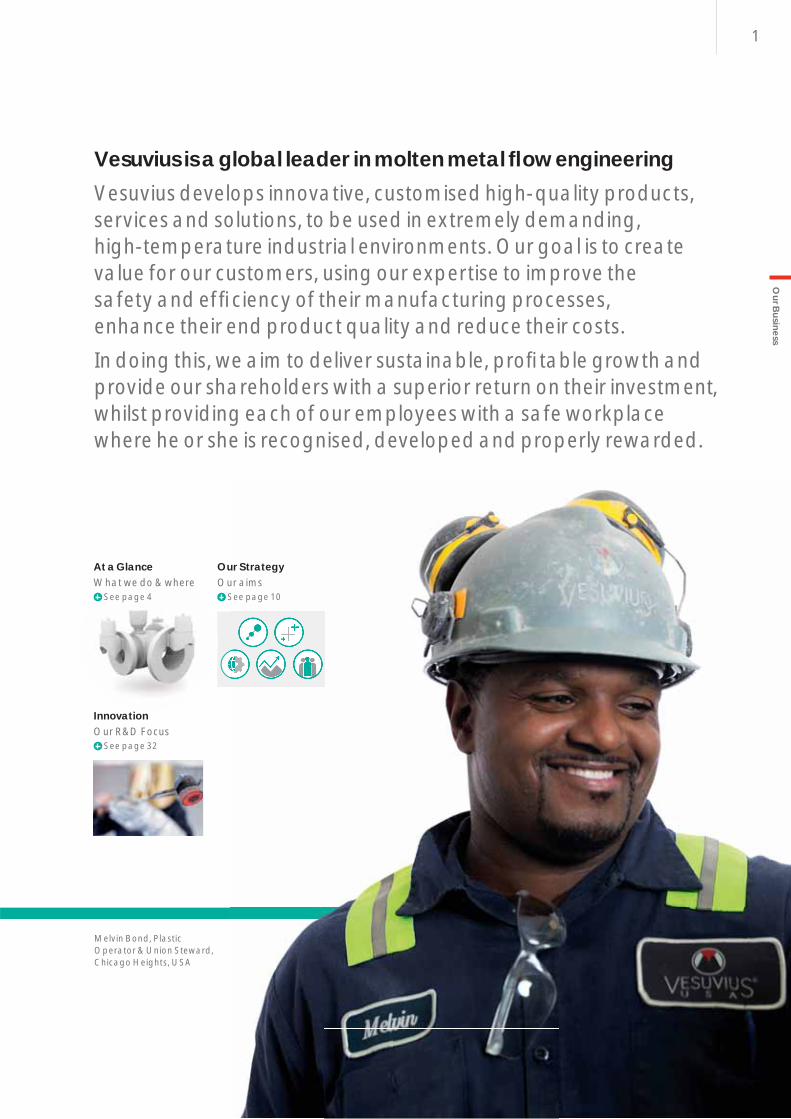
17Production sites
3,183Employees
5R&D centres
21Sales offi ces
30Production sites
4,472Employees
10R&D centres
34Sales offi ces
19Production sites
3,355Employees
2R&D centres
33Sales offi ces
Americas EMEA Asia-Pacifi c
£487.0mRevenue (2016: £415.3m)
77.2% Steel 22.8% Foundry
£735.2mRevenue (2016: £585.6m)
67.5% Steel 32.5% Foundry
£461.7mRevenue (2016: £400.5m)
59.9% Steel 40.1% Foundry
Our B
usiness
Steel Flow Control Operating Review See p36
Advanced Refractories Operating Review See p40
Foundry Operating Review See p46
Digital Services Operating Review See p44
The map shows our production, R&D and commercial sites worldwide

6 Vesuvius plcAnnual Report and Accounts 2017
BLA
ST FU
RNACE
CO
NV
ERTO
R AND REFINING LADLES
STEEL SLAB OR BLOO
M
CON
TINUOUS CASTER
Business Units
Steel Flow ControlSpecialised parts used to protect and control the fl ow of molten metal
Advanced RefractoriesSpecialised materials for lining vessels for steel making (furnaces, ladles and tundishes) and other high temperature industries
Digital ServicesDigital products focus on the capture, interpretation and use of key manufacturing data for process management
Key Strengths
Scale: One of the world’s largest manufacturers in our market
Technology: Leading products and services
Integration: Deep knowledge of customers’ processes allows us to offer bespoke systems
Innovation: Capability to develop new value-adding solutions
Proximity: Effective and effi cient supply to customers
Steel Division
Overview
Our customers are steel producers, manufacturers of steel production equipment and other high-temperature industries. Vesuvius is a world leader in the supply of refractory products, systems and solutions. These help our customers increase their effi ciency and productivity, enhance quality, improve safety and reduce their costs and their environmental impact.
Revenue
£1,148.7m2016: £942.0m
Trading profi t
£100.4m2016: £79.2m
Return on sales
8.7%2016: 8.4%
See Steel Flow Control, Advanced Refractories and Digital Services Operating Reviews on p36-45
The Steel Manufacturing Process
Steel manufacturing is a highly demanding process for which consistent quality and effi cient production is essential. Our products, systems and solutions enable this through every part of the process.
Ladle, slide gate, tube changer
Purging Plug
Stopper & rigging
Robotic arm
Robotic arm
Ladle shroudTemperature measurement
Mould level control
Mould fl ux
Linings, bottoms
Linings & bricks
Tap hole clay
Torpedo ladle
Linings
Impact pad
Ladle
Tundish
Mould
Iron trough
Tundish tube changer
Tundish slide gate
Technical servicesOur Technical Services offering spans all of our businesses.
Convertor and refi ning ladles
Continuous caster
Blast furnace
For more on Technical services , See p44-45
Stack repair
Convertor repair
Refi ning ladles
6 Vesuvius plcAnnual Report and Accounts 2017
7
POURIN
G INTO MOULD
MOULD PRODUCTION
Our B
usiness
Key Strengths
Product offering: Full range of high quality products and services
Innovation: Industry-leading technologies with a focus on continuous innovation
Integration: Detailed knowledge of customers’ processes allows us to provide customised solutions
Technical support: Access to Foseco’s extensive application engineering resources
Proximity: Global presence
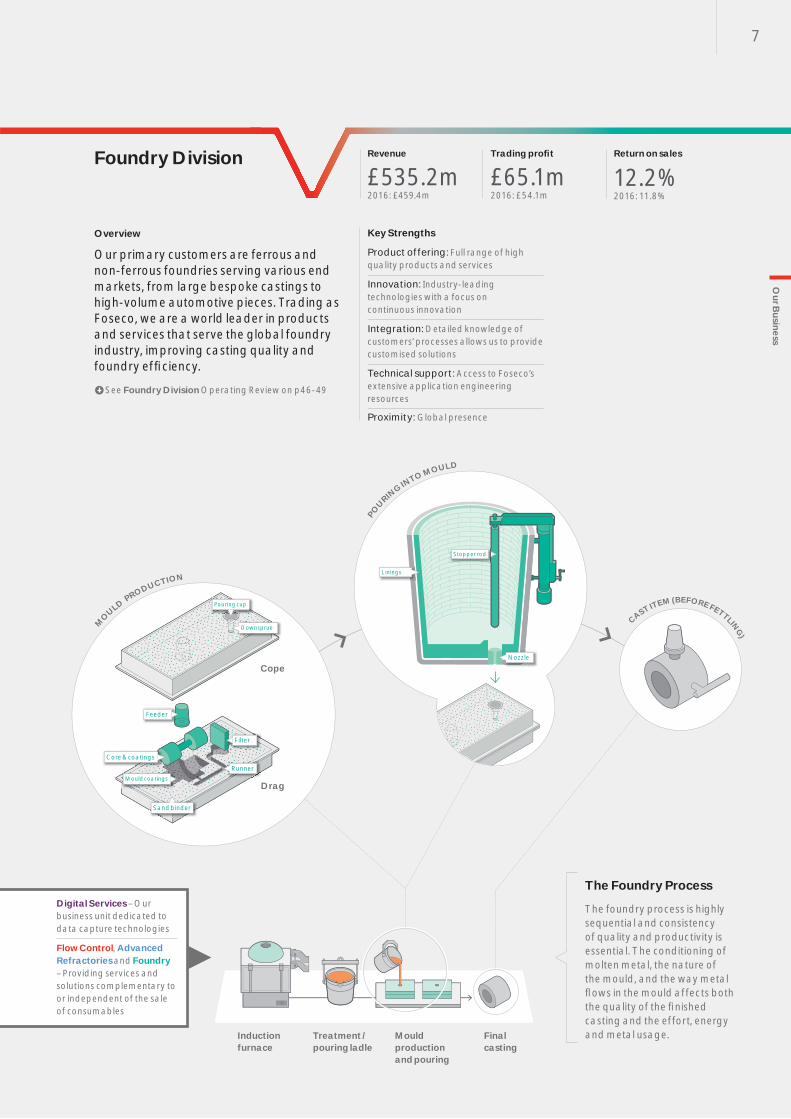
Foundry Division
Overview
Our primary customers are ferrous and non-ferrous foundries serving various end markets, from large bespoke castings to high-volume automotive pieces. Trading as Foseco, we are a world leader in products and services that serve the global foundry industry, improving casting quality and foundry effi ciency.
Revenue
£535.2m2016: £459.4m
Trading profi t
£65.1m2016: £54.1m
Return on sales
12.2%2016: 11.8%
See Foundry Division Operating Review on p46-49
The Foundry Process
The foundry process is highly sequential and consistency of quality and productivity is essential. The conditioning of molten metal, the nature of the mould, and the way metal fl ows in the mould affects both the quality of the fi nished casting and the effort, energy and metal usage.
Sand binder
Digital Services – Our business unit dedicated to data capture technologies
Flow Control, Advanced Refractories and Foundry – Providing services and solutions complementary to or independent of the sale of consumables
Treatment /pouring ladle
Final casting
Mould production and pouring
Induction furnace
CAST ITEM (BEFORE FETTLING)
Filter
Downsprue
Core & coatings
Feeder
RunnerMould coatings
Pouring cup
Nozzle
Stopper rod
Linings
Drag
Cope
8 Vesuvius plcAnnual Report and Accounts 2017
Our Markets
Steel
Customers of the Steel Division are principally steel producers and manufacturers of steel production equipment. Steel production volumes are the critical driver of demand as the Steel Division primarily sells products that are consumed during the steel making process. This is particularly true in the production of higher-quality steels where our highly technical products deliver the most value.
The Advanced Refractories business also supplies other high-temperature industries such as primary aluminium, copper, cement, petrochemical and energy from waste. Around 7% of revenues in the Steel Division arise from non-steel related process industries.
Steel production
Steel quality as a driver for demand
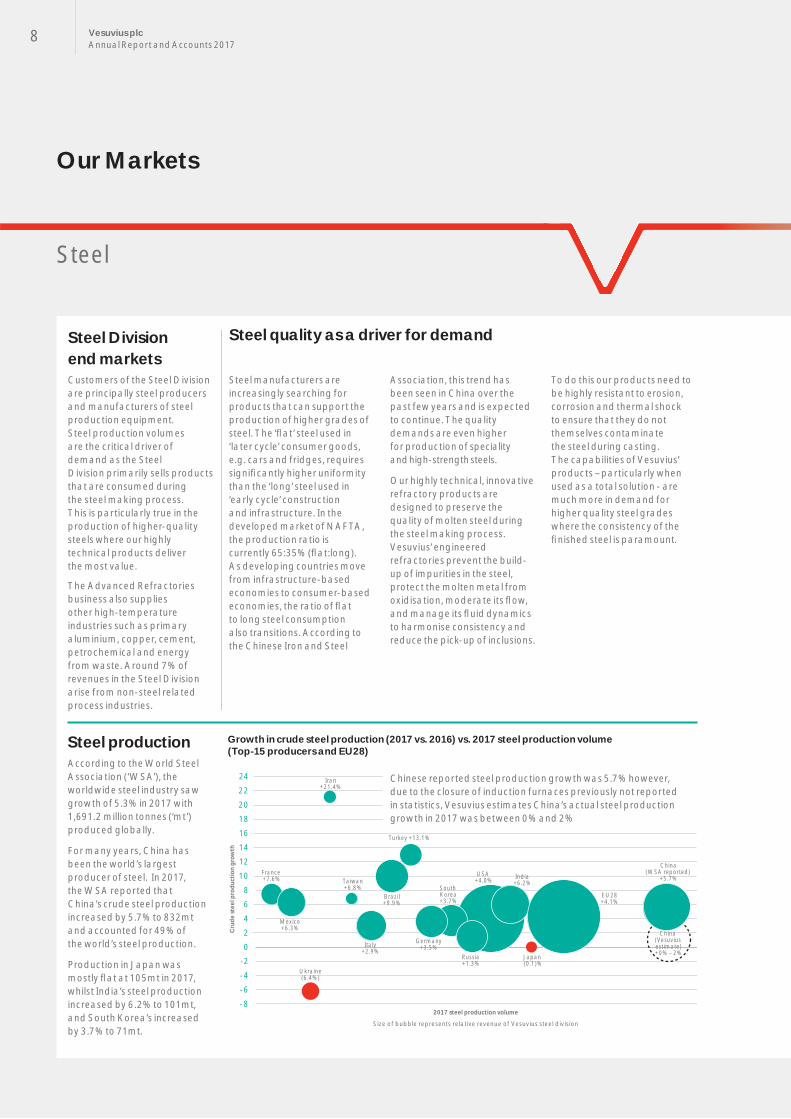
According to the World Steel Association (‘WSA’), the worldwide steel industry saw growth of 5.3% in 2017 with 1,691.2 million tonnes (‘mt’) produced globally.
For many years, China has been the world’s largest producer of steel. In 2017, the WSA reported that China’s crude steel production increased by 5.7% to 832mt and accounted for 49% of the world’s steel production.
Production in Japan was mostly fl at at 105mt in 2017, whilst India’s steel production increased by 6.2% to 101mt, and South Korea’s increased by 3.7% to 71mt.
Steel manufacturers are increasingly searching for products that can support the production of higher grades of steel. The ‘fl at’ steel used in ‘later cycle’ consumer goods, e.g. cars and fridges, requires signifi cantly higher uniformity than the ‘long’ steel used in ‘early cycle’ construction and infrastructure. In the developed market of NAFTA, the production ratio is currently 65:35% (fl at:long). As developing countries move from infrastructure-based economies to consumer-based economies, the ratio of fl at to long steel consumption also transitions. According to the Chinese Iron and Steel
Association, this trend has been seen in China over the past few years and is expected to continue. The quality demands are even higher for production of speciality and high-strength steels.
Our highly technical, innovative refractory products are designed to preserve the quality of molten steel during the steel making process. Vesuvius’ engineered refractories prevent the build-up of impurities in the steel, protect the molten metal from oxidisation, moderate its fl ow, and manage its fl uid dynamics to harmonise consistency and reduce the pick-up of inclusions.
To do this our products need to be highly resistant to erosion, corrosion and thermal shock to ensure that they do not themselves contaminate the steel during casting. The capabilities of Vesuvius’ products – particularly when used as a total solution - are much more in demand for higher quality steel grades where the consistency of the fi nished steel is paramount.
Steel Division end markets
Size of bubble represents relative revenue of Vesuvius steel division
24
20
16
-8
12
8
4
0
-4
France +7.6%
Iran+21.4%
Ukraine(6.4%)
Mexico+6.3%
Taiwan+6.8%
Italy+2.9%
Brazil+9.9%
Turkey +13.1%
Germany+3.5%
South Korea+3.7%
USA +4.0% India
+6.2%
Japan (0.1)%
EU28+4.1%
China(WSA reported)
+5.7%
China (Vesuvius estimate)+0% – 2%
2017 steel production volume
Russia+1.3%
22
18
14
10
6
2
-2
-6
Cru
de st
eel p
rodu
ctio
n gr
owth
Growth in crude steel production (2017 vs. 2016) vs. 2017 steel production volume (Top-15 producers and EU28)
Chinese reported steel production growth was 5.7% however, due to the closure of induction furnaces previously not reported in statistics, Vesuvius estimates China’s actual steel production growth in 2017 was between 0% and 2%

9O
ur Business
Foundry
The vehicle sector, comprising light vehicles (passenger cars and light trucks) and heavy trucks, is the largest end market for worldwide castings. Other end markets for foundry castings include machinery for the agricultural, construction
and mining industries, petrochemicals, power generation equipment, railroad and general engineering sectors. Our customers include the world’s major automotive OEMs, truck producers and equipment manufacturers.
Foundry Division end markets Casting quality as a driver for demand
Whilst Foseco products typically represent less than 5% of a foundry’s production cost, they contribute signifi cantly to improving product quality and manufacturing effi ciency, whilst reducing the environmental impact of the casting process and improving the ratio of fi nished castings to the amount of metal poured – a key parameter for foundry
effi ciency. As castings become increasingly complicated (driven in the case of automotive casting by the need for lightness), they demand cleaner metal, better fl ow into the mould, and more consistent solidifi cation. This supports the computer modelling, fl ow simulation and casting methoding capabilities that are central to the services provided by Foseco.
Demand drivers for castings
Light vehicle demand is largely driven by consumer confi dence and, in commercial purchasing, the age of the overall fl eet. Demand in the majority of the remaining casting end-markets is driven by the cost of capital and the level of current profi tability in the given sector. Certain sectors
are consumption-driven, such as construction, mining, agriculture and heavy truck, where usage drives demand for replacement parts (e.g. bulldozer blades, digger teeth, track pads and bowls, etc.) based on actual wear.
Technology changes and environmental driversNew technologies, such as 3D printing, are expected to continue to infl uence the metal casting industry, allowing for faster prototyping and production of smaller volume parts. Environmental regulations, driven by the desire to reduce volatile organic compound emissions
and the use of silica within the industry, are also expected to continue to tighten. This will drive the trend to fi nd processes and consumable products which support production effi ciency and reduce a foundry’s impact on the environment.
Steel casting Aluminium/Non-ferrous casting
Iron casting
Iron casting is split between grey and ductile iron with grey iron representing the majority of metal being cast. This is a cost-effi cient and robust process to produce components that do not need to tolerate extreme mechanical stress. All iron casting requires fi lters and coatings but grey iron is not as reliant on feeding
system utilisation due to its lower shrinkage on solidifi cation. Conversely, ductile iron production requires more sophisticated products to cope with the high shrinkages of metal whilst solidifying.
Steel is used in casting for manufacturing components with very high mechanical performance. Steel casting is the most demanding casting process due to higher melting temperatures and greater tendency for shrinkage, thus the greater demand for products and technical expertise in this segment.
Aluminium casting is the segment of the foundry market growing the fastest. It has captured a signifi cant share of the light vehicle market. Being molten below 700°C aluminium can be cast in iron moulds which can then be reused. Foseco concentrates on supplying fl uxes, fi lters and machines that refi ne the composition and cleanliness of the metal.

Vesuvius plcAnnual Report and Accounts 2017
10
Strategic Objectives
Vesuvius focuses on the following strategic objectives, which we measure and monitor through our Key Performance Indicators (KPI’s)
Our Strategy
Execution Priorities
Reinforce our technology leadership
See our Key performance indicators on p20-21
See p32-35
Increase penetration of value-creating solutions
Capture growth in developing markets
Improve cost leadership and margins
See p36-48
Develop our Technical Services offering
See p44-45
Deliver growth
Generate sustainable profi tability and create shareholder value
Maintain strong cash generation and an effi cient capital structure
Provide a safe working environment for our people
Be at the forefront of innovation
Run top-quality, cost-effi cient and sustainable operations
Foster talent, skill and motivation in our people

11
Vesuvius has articulated fi ve key execution priorities. These will enable us to achieve our core strategic objectives of delivering long-term sustainable and profi table growth.
Vesuvius was built and grew on technology breakthroughs. These enabled the steel continuous casting and foundry industries to improve their effi ciency and quality substantially. Focusing on technology leadership continues to drive our unique value proposition and underpins our ability to deliver ongoing value enhancement to our customers.
The percentage of revenue accounted for by ‘New Products’, that is products launched within the last fi ve years, grew from 8% in 2014 to nearly 15% in 2017. Our objective is for this to reach 20%. The new R&D centre for Advanced Refractories at Visakhapatnam, India, was inaugurated in November 2017. Our spend on R&D increased year-on-year to £33.2m, being 2.0% of our total revenue, and we increased the effi ciency of our R&D by focusing our efforts on a reduced number of potentially high-impact R&D projects. We also moved the R&D function closer to our customers, embedding R&D within the business units which will ensure a closer link between R&D activities and the return we receive on our investment.
Our B
usiness
Progress in 2017Description
Our technology has been widely adopted by the most sophisticated producers in the most developed markets. However, marked differences remain in the penetration of our solutions within the industry. Consequently, there is a wider audience of customers whom we believe can benefi t from them. As steel and foundry markets in developing markets become more quality focused, we have the opportunity to signifi cantly increase our penetration of these markets through offering value creating solutions.
Our outperformance in the majority of end markets across both our Steel and Foundry Divisions is evidence of the penetration gains we are achieving due to increased customer interest in our value-creating solutions. For our Steel Division, this outperformance is refl ected in our underlying 2017 revenue growth of 14.1% versus 5.3% growth in global steel production volumes. For our Foundry Division, underlying 2017 revenue growth of 9.3% is further evidence of this outperformance.
Building on our long-standing presence in all markets, we can leverage the high growth enjoyed by our customers’ industries in emerging markets which are large consumers of steel goods and foundry castings.
Our growth in developing markets is especially encouraging and we delivered outperformance relative to end markets, due to greater interest in our high value-added solutions. Our 2017 revenue growth rates for our key developing markets were as follows: China +9.2%; India +6.2%; South America +17.5%; Mexico +7.1%; EMEA excl. EU28 +37.0%. The acceleration of our revenue growth in China is also especially notable and we are benefi ting from several favourable market trends which are driving a shift towards our higher quality consumables and services.
In 2015, we initiated a restructuring programme throughout the Group to adapt our business and our cost base to the changing trading environment. This is core to our efforts to improve profitability. Furthermore, we have embedded the principles of Lean manufacturing across all our sites, continuously focusing on quality and productivity to enable us to maintain our margins. Our global presence allows us to benefi t from economies of scale and deliver excellent service from local sites.
We continued to make good progress with our previously announced restructuring programme, mainly focused on the Flow Control business, delivering savings of £16.2m in 2017, which was ahead of expectations. As a result, the total savings delivered since launching the programme in 2015 are now £43.2m. This programme is now expected to deliver £60m of savings at a total cost of £75m. We also commenced a completely new restructuring programme targeting the Foundry Division in Europe and NAFTA, the Advanced Refractories business unit in Europe, and Group corporate functions, from which we expect £15m of recurring savings by 2020.
Our customers’ processes require increasing levels of engineering services to reach the demanding levels of safety, accuracy and consistency required by their end-customers’ quality specifications. The key elements of Vesuvius’ Technical Services strategy are, firstly, the Digital Services business unit, which is focused on incubating our data capture technologies, and secondly, the business units which play a critical role in integrating these products into our broader consumables offering as well as ensuring customer access. In this way, our Technical Services strategy is progressively penetrating all activities of both our Steel and Foundry Divisions.
We saw good progress of our global Technical Services offering, which is now embedded in the operations of all our business units. Global Technical Services turnover across all business units reached £88m in 2017, growing by 14% year-on-year. In late 2017, we made a strategic investment in Sapotech Oy, a Finnish technology company offering optical measurement services for the continuous casting process. The Sapotech business will be managed by our Flow Control business unit.

12 Vesuvius plcAnnual Report and Accounts 2017
Business Model
A profi table, fl exible, cash-generative model focused on growth
We develop and manufacture high-technology products and solutions for supply to the steel and casting industries, operating a profi table, fl exible, cash-generative and growth-building business model. Over many years we have built the brand equity of our Vesuvius and Foseco products through reliability, technology and service.
The foundation of our business model is the supply of specialised and consumable products from a global presence. Our industry experts are embedded at many customer locations and are therefore ideally placed to collaborate with customers to identify their needs, and potential service and process improvements. This also enables us to grow our solutions and service portfolio.
Our model is resilient to end-market volatility due to the fl exibility of our diversifi ed manufacturing footprint and adjustable variable cost base. Our model is profi table by allowing value pricing for bespoke products and services. It generates growth as we enlarge our market with additional innovative products and solutions.
Key Resources
Financial capital We use the cash generated by our business to invest in innovation, people, operating assets, technology and sales to generate further growth.
Manufacturing capital We have a global footprint, with 66 production sites based on six continents, giving us close proximity to our customers.
Intellectual capital We have 17 R&D centres and over 300 R&D staff worldwide, generating innovative products and solutions for our customers.
Human capital We invest in developing our skilled and motivated workforce of approx. 11,000 people and provide them with a safe environment in which to work.
Social capital We champion our Values and our ethical conduct. We maintain strong relationships with customers and our wider stakeholder group.
Natural capital We utilise high-quality raw materials, secured through reliable and well-developed supply chains.
Global Presence
Using our global spread of expertise to identify and create market opportunities
Vesuvius is present on six continents, supporting the development of global steel and foundry manufacturing processes with new technologies. We have manufacturing capability in all the main steel and foundry markets and hire and train local engineers. They are progressively integrated within the Vesuvius network of experts, and offered international careers. Our local manufacturing, local expertise and global knowledge of our customers’ processes give us a special relationship with our customers, helping them to optimise their process and product performance. All over the world, new plants use Vesuvius and Foseco products to create the best possible conditions for success.
Optimised Manufacturing
Low-cost Lean manufacturing, close to customers, provides reliable, ‘just-in-time’ products
Our successfully tested products can be manufactured at a short distance from our customers’ plants, guaranteeing cost-competitive and time-effi cient delivery. We optimise our cost competitiveness by investing in the lowest cost production site in the area and have established manufacturing facilities in emerging markets from the beginning of their industrialisation. This, together with the high volume of pieces we are able to produce, provides our customers with the best balance between value, cost and service for our high-technology solutions.
See more about our global presence on p4-5 See more about sustainability on p64-66

13O
ur Business
Key Outputs
Value to shareholders Our effi cient use of capital generates annual profi ts, giving returns to our shareholders and underpinning sustainable growth.
High-quality products We deliver bespoke, high-quality refractory and consumable products and systems to industry-leading customers around the world.
Customer value Our investment in innovation creates cutting-edge products and solutions, delivering enhanced value for our customers and differentiating us from our competitors.
Expert delivery We embed technical experts with our customers, giving us a fundamental understanding of their needs and delivering them access to our global network of highly skilled individuals.
Sustainable business Our commitment to ethical business delivers strong, long-term, sustainable commercial relationships.
Environmental benefi ts We develop products that deliver effi ciency and energy savings to our customers. We focus on sustainability in our own business through the effi cient use of energy and natural resources.
Advanced Technology KnowledgeOur technology centres develop value-adding solutions involving engineered systems and high-value consumables
Our continuing investment in the Company’s R&D centres is refl ected in all areas of our offering. We have knowledge of the most advanced ceramic and metallurgical techniques using state-of-the-art equipment and the most advanced technologies of fl ow simulation and fi nite element analysis. We are therefore able to provide our customers with sophisticated, innovative, custom-designed solutions, with the highest level of confi dence in their suitability, creating value and helping them differentiate from their competition. We enhance this expertise with our growing capabilities in data capture and interpretation to deliver expert process management improvements to our customers.
Service and Consistency
Serving our customers reliably, competitively and consistently with consumables critical for their manufacturing processes
Alongside developing our global presence, we ensure a local service to our customers, from inventory management to high-quality technical support at their sites and the ability to swiftly modify production and supply to refl ect changes in customer requirements. Our knowledge of end-market processes, specifi cations and techniques around the world gives our experts an unparalleled ability to support our customers. This unique level of service relies on our technicians’ permanent presence at our customers’ sites, and their ability to leverage the worldwide expertise accumulated across the Vesuvius network.
Read more about innovation on p32-35 Read more about quality and reliability on p36-48
A growth-generating model
with our Customerat the centre
Global Presence
Advanced Technology
Knowledge
Optim
ised
Serv
ice
and
Con
sist
ency
Manufacturing
200+technical experts across six continents
17R&D centres
100+R&D PhDs and engineers
66manufacturing sites in 26 countries
14 Vesuvius plcAnnual Report and Accounts 2017

Enno HilgenhoenerDirector Solutions Group, Steel Flow Control,Borken, Germany
15
Section Two
Our PerformanceIn this section16 Chairman’s Statement
18 Chief Executive’s Strategic Review
20 Key Performance Indicators
22 Risk
26 Financial Review
32 Innovation
36 Operating Review 36 Steel Flow Control 40 Advanced Refractories 44 Digital Services 46 Foundry
50 Board of Directors
52 Group Executive Committee
Our Perform
ance
16 Vesuvius plcAnnual Report and Accounts 2017
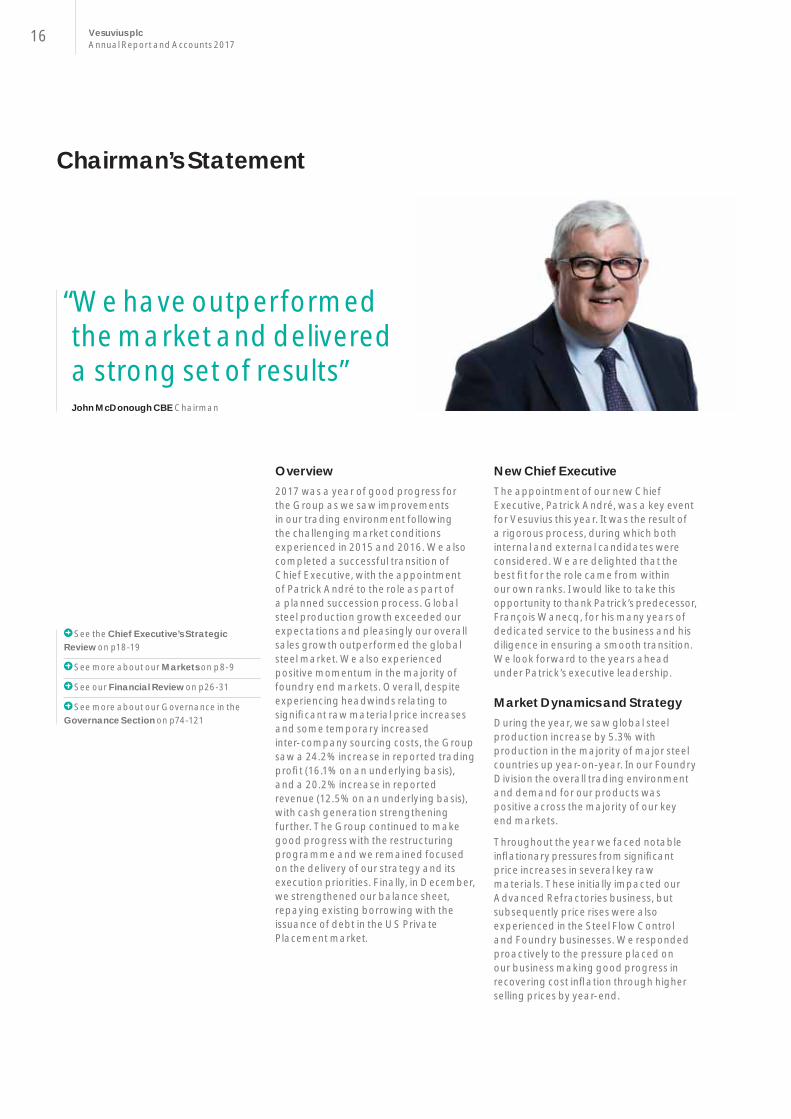
Chairman’s Statement
“We have outperformed the market and delivered a strong set of results”John McDonough CBE Chairman
Overview 2017 was a year of good progress for the Group as we saw improvements in our trading environment following the challenging market conditions experienced in 2015 and 2016. We also completed a successful transition of Chief Executive, with the appointment of Patrick André to the role as part of a planned succession process. Global steel production growth exceeded our expectations and pleasingly our overall sales growth outperformed the global steel market. We also experienced positive momentum in the majority of foundry end markets. Overall, despite experiencing headwinds relating to signifi cant raw material price increases and some temporary increased inter-company sourcing costs, the Group saw a 24.2% increase in reported trading profi t (16.1% on an underlying basis), and a 20.2% increase in reported revenue (12.5% on an underlying basis), with cash generation strengthening further. The Group continued to make good progress with the restructuring programme and we remained focused on the delivery of our strategy and its execution priorities. Finally, in December, we strengthened our balance sheet, repaying existing borrowing with the issuance of debt in the US Private Placement market.
New Chief Executive The appointment of our new Chief Executive, Patrick André, was a key event for Vesuvius this year. It was the result of a rigorous process, during which both internal and external candidates were considered. We are delighted that the best fi t for the role came from within our own ranks. I would like to take this opportunity to thank Patrick’s predecessor, François Wanecq, for his many years of dedicated service to the business and his diligence in ensuring a smooth transition. We look forward to the years ahead under Patrick’s executive leadership.
Market Dynamics and StrategyDuring the year, we saw global steel production increase by 5.3% with production in the majority of major steel countries up year-on-year. In our Foundry Division the overall trading environment and demand for our products was positive across the majority of our key end markets.
Throughout the year we faced notable infl ationary pressures from signifi cant price increases in several key raw materials. These initially impacted our Advanced Refractories business, but subsequently price rises were also experienced in the Steel Flow Control and Foundry businesses. We responded proactively to the pressure placed on our business making good progress in recovering cost infl ation through higher selling prices by year-end.
See the Chief Executive’s Strategic Review on p18-19
See more about our Markets on p8-9
See our Financial Review on p26-31
See more about our Governance in the Governance Section on p74-121
17
Against this backdrop, we continued to focus on the execution of our strategy and made good progress on our fi ve key execution priorities (see page 10). We remain confi dent that these will enable us to create value and deliver sustainable profi tability for our shareholders. We continue to recognise the fundamental importance to the Group of the capabilities of our people. Our highly talented leadership teams and operational staff ensure that we are able to drive our strategy forward, with quality underpinning not only the premium promise of our products, services and solutions, but also our overall approach to business excellence.
Performance and Dividend In 2017, reported sales were £1,683.9m, an increase from 2016 of 20.2%. Our margins improved to 9.8%, delivering reported trading profi t of £165.5m. Whilst we experienced some headwinds throughout the second half, over the year we outperformed our markets in terms of growth. These results serve to emphasise the strength of our management team and their ability to operate effectively against the backdrop of a volatile market. Vesuvius remains an intrinsically cash-generative business and we saw strong cash generation throughout 2017, ending the year with a stronger balance sheet than in previous years.
The Group continued to make good progress in delivering the previously announced restructuring programme which focused mainly on our Flow Control business. We also commenced a completely new programme focusing on the Foundry Division in Europe and NAFTA, the Advanced Refractories business unit in Europe, and Group corporate functions.
Our Headline PBT was £152.9m, 27.6% higher than last year on a reported basis. Including amortisation of £19.5m and restructuring costs of £36.3m, our PBT of £97.1m was 22.3% higher than 2016. Statutory EPS is 14.1p.
Our dividend policy aims to deliver long-term dividend growth, provided this is supported by cash fl ow and underlying earnings, and is justifi ed in the context of our capital expenditure requirements and the prevailing market outlook. With this in mind, the Board has recommended a fi nal dividend of 12.5 pence per share for the year ended
31 December 2017 (2016: 11.4 pence), which would result in a total dividend for the year of 18.0 pence per share (2016: 16.55 pence), an increase of 8.8%. If approved at the Annual General Meeting, this fi nal dividend will be paid on 25 May 2018 to shareholders on the register at 13 April 2018.
Board and GovernanceIn April 2017, we appointed Holly Koeppel as a Non-executive Director, replacing Nelda Connors, who resigned from the Board in late 2016. Holly has more than 35 years’ industry and fi nancial experience, and has worked with businesses in Australia, China, the UK and the US. We are delighted to have her signifi cant experience around the Board table.
The Board continues to place great importance on furthering our understanding of the Vesuvius business by visiting key operations and engaging with as many of our people as possible. This year, the full Board visited our Foundry operations and customers in Brazil, meeting management from all business lines and gaining a broader understanding of the overall South American business. As Chairman, I personally visited our operations in China in May and, during the year, other Non-executive Directors visited operations in Skawina in Poland, Cleveland and Pittsburgh in the US, and Borken in Germany. The Board will continue to visit sites across the Group, increasing individual knowledge and ensuring that we remain connected with our operations, management teams and people around the world.
The 2017 externally facilitated Board evaluation confi rmed that the Board continues to function effectively. We believe it remains well balanced, setting the right tone from the top, with a strong mix of relevant experience and skills, ensuring that a collaborative yet challenging culture is embedded throughout the Group.
Our PeopleIn 2016, I noted that to secure the current and future performance of the Group, the Board had widened its focus on succession planning issues, additionally reviewing the management level immediately below the Board. This continues to be a critical area
for Board attention, with the Board fully recognising the importance of developing talent and maintaining a cadre of diverse and highly capable people throughout the business. The need for greater diversity throughout the business is a goal upon which the Board remains focused.
As ever, I continue to be impressed by the way in which our leadership teams and our people go the ‘extra mile’ to exceed our own, and our customers’ expectations, as evidenced by our 2017 results. On behalf of the Board, I thank them all.
Annual General MeetingThe Annual General Meeting will be held on 10 May 2018. The Notice of Meeting and explanatory notes containing details of the resolutions to be put to the meeting accompany this Annual Report and Accounts and are available on our website (www.vesuvius.com). I and all my Board colleagues plan to attend the Annual General Meeting and we look forward to the opportunity to meet with as many shareholders as possible on the day.
John McDonough CBE Chairman
28 February 2018
Our Perform
ance

18 Vesuvius plcAnnual Report and Accounts 2017
Chief Executive’s Strategic Review
Introduction It is an honour to have been selected to lead Vesuvius and I am grateful to our Chairman, John McDonough, and the Board of Directors for their trust.
I would also like to thank François Wanecq for his exceptional commitment in leading Vesuvius over the past 12 years. Thanks to his achievements and the efforts of all our teams, the foundations of the Group are strong and sound. Our main objective is now to build on these foundations and to generate and accelerate the Group’s profitable growth over the coming years.
The strong performance of the Group in 2017 is an important first step in the implementation of this growth strategy.
Strong PerformanceIn a globally favourable economic environment, both our Steel and Foundry Divisions succeeded in outperforming the general market growth. This was particularly the case in China.
Thanks to this performance, Vesuvius’ global sales in 2017 reached £1,683.9m, an increase of 20.2% over 2016 on a reported basis. At constant currency, and adjusted for the effect of acquisitions, underlying revenue was up 12.5% as compared with 2016.
Our trading profit in 2017 reached £165.5m, an increase of 24.2% over 2016 on a reported basis and 16.1% on an underlying basis. Our return on sales improved from 9.5% to 9.8%. After the inclusion of amortisation of acquired
intangibles and restructuring costs, operating profit was £109.7m, 18.1% ahead of prior year on a reported basis.
Our financial performance would, however, have been even stronger in 2017 if we had not been impacted by two temporary headwinds.
Some of the key raw materials used by our Steel and Foundry Divisions experienced significant price increases in 2017, particularly during the second half of the year. The speed of these increases was such that it was not possible to fully recover the increased costs through the sales price of our finished products, as we were bound by contractual obligations with some customers. This situation improved towards the end of 2017 due to prices stabilising for several key raw materials and major progress being made in recovering cost inflation through higher selling prices. Whilst the price of magnesite, the largest contributor to raw material price inflation in 2017, has now stabilised, the price of other raw materials such as bauxite, silicon carbide and zirconia are still on an upward trend. As a result, the process of price adjustment will continue into 2018, until realised cost increases have been fully recovered.
Additionally, the very strong growth of our Flow Control sales in EMEA temporarily exceeded the capacity of our manufacturing plants in the region, requiring the import of products from our facilities in Asia and NAFTA, incurring additional freight, export duty and overtime costs. Measures were immediately taken to increase the
capacity of the Flow Control EMEA plants and this ramp-up is now complete, substituting imports from non-EMEA plants.
Improved Financial PositionDespite the strong growth in our turnover and increased capital investment of £44.3m in 2017 versus £35.2m in 2016, our cash conversion ratio increased to 104% in 2017 due to our focus on efficient working capital management. Our trade working capital to sales ratio decreased to 24.9% from 26.6% in 2016.
This strong cash flow generation reduced our net debt to £274.3m at 31 December 2017 versus £320.3m at 31 December 2016. We also partly refinanced our debt in December 2017 with the issuance of a €100m US Private Placement, resulting in a significant decrease of our financing costs going forward.
Strategic ProgressOur strategy remains centred around five key execution priorities, designed to ensure the achievement of our core strategic objectives of delivering long-term, sustainable and profitable growth.
Each of these execution priorities saw significant progress in 2017:
> Reinforce our technology leadership: With a global R&D spend of £33.2m in 2017 (2016:£28.6m), representing 2.0% of revenue, Vesuvius continues to lead the industry with a significantly larger R&D spend to sales ratio than most of our competitors. In 2017,
“Our main objective is to accelerate the implementation of our profitable growth strategy over the coming years”Patrick André Chief Executive
19
we continued to focus our R&D efforts on a reduced number of potentially high-impact R&D programmes. The new Advanced Refractory R&D centre in Visakhapatnam, India, was inaugurated in November, reinforcing our presence in this key market for our future growth, strengthening links with customers and enabling us to better tap into the growing talent pool of engineers and scientists in the country. The decision was also made to reorganise the Flow Control R&D network around three main R&D centres; in the US (Pittsburgh), Europe (Ghlin/Feignies) and China (Suzhou), operating under a common leadership. This structure will be fully operational in 2020 and will enable us to increase the efficiency of our research further, by reinforcing our proximity with customers and accessing a wider pool of worldwide scientific talents.
> Increase penetration of our value-creating solutions: The growth of sales in our Steel and Foundry Divisions outperformed underlying market growth in most areas, confirming the mounting interest of customers in our advanced solutions, enabling them to improve their manufacturing efficiency whilst at the same time raising the quality of their finished products. We were particularly pleased with our progress in China, where Steel Division sales increased by 7% and Foundry Division sales increased by 13% on an underlying basis.
> Capture growth in developing markets: Steel Division sales grew faster than the market in the key developing regions of China, India and the Middle East. However, sales growth in Latin America, while positive, was slightly below general steel market growth. Foundry sales also outperformed markets in most developing countries, with the exception of India where priority was given to the management of working capital and customer credit risk.
> Improve cost leadership and margins: Our previously announced Lean and self-help programme to improve the cost competitiveness and efficiency of our manufacturing network continued to develop in 2017, extending from Flow Control Europe to Flow Control NAFTA operations. £16.2m of savings were delivered in 2017, bringing the total savings delivered since launching the programme to £43.2m. This programme is expected to deliver
£60m of savings at a total cost of £75m. A completely new restructuring programme focused on the Foundry Division in Europe and NAFTA, the Advanced Refractories business unit in Europe and global corporate functions was launched at the end of 2017, with expected recurring savings of £15m by 2020. In parallel to these restructuring programmes, Vesuvius is reinforcing its focus on operational excellence and continuous improvement in its manufacturing operations.
> Develop our Technical Services offering: Our Technical Services offering has continued to develop in 2017, not only within our Digital Services business unit but also within Flow Control, Foundry and Advanced Refractories. Late in 2017, we made a strategic investment in Sapotech Oy, a Finnish technology company developing optical defect detection services in the steel continuous casting process. This investment will reinforce the Flow Control business unit.
Attracting, Developing and Retaining TalentThe success of our strategy ultimately relies on the quality and motivation of our people. In 2017, we continued our efforts to attract, develop and retain the best talents worldwide. This will intensify in 2018.
We believe in diversity of talents and origins and in the importance of an entrepreneurial and decentralised culture, with empowered, accountable, innovative and results-oriented managers, operating close to our markets and our customers.
I will strongly support the reinforcement of this culture within the Group going forward.
Stable Safety Performance in 2017With a lost time injury frequency rate of 1.63 per million hours in 2017, our safety performance improved slightly over 2016 (1.72).
The Group’s injury severity rate improved more markedly in 2017 with a severity rate of 62.8 days lost per million hours worked versus 74.6 days lost per million hours worked in 2016, highlighting the success of the Group’s efforts to address the most dangerous situations in our manufacturing plants.
Our objective is to improve this performance further year-on-year.
A new safety management organisation, updating responsibility and accountability for the management of safety across the Group, was established at the end of 2017 and will be fully operational in the first half of 2018.
Sustainability Vesuvius R&D reinforced its efforts in 2017 to develop products and services helping our Steel and Foundry customers to reduce their energy consumption and carbon footprint through the improved service life of our products and reduction of waste in their manufacturing processes. At the same time, we continued our efforts to reduce waste and energy consumption in our own manufacturing processes.
Outlook Our main Steel and Foundry markets remain positively oriented at the beginning of 2018. However, we expect a lower growth rate of steel production outside China in 2018 compared to 2017, as the significant decrease in Chinese steel exports which occurred in 2017 may not repeat in 2018. Our self-help and manufacturing optimisation programme will continue to develop and expand in 2018. The temporary raw material and product supply headwinds that impacted our 2017 results have now been mostly mitigated and will substantially unwind during the year, subject to any further raw material cost increases. We remain confident in our ability to further improve working capital management and generate strong operating cash flow. For these reasons, the Board is confident that in comparison to 2017, further strong progress will be made in 2018.
Patrick André Chief Executive
28 February 2018
Our Perform
ance

20 Vesuvius plcAnnual Report and Accounts 2017
Key Performance Indicators
The Board and management regularly monitor both financial and non-financial performance indicators to measure performance against objectives. The Board reviews these KPIs as part of its governance and risk management processes.
Generate sustainable profitability and create shareholder value
Trading profit and return on sales
Headline profit before tax
Used to assess the trading performance of Group businesses
Used to assess the financial performance of the Group as a whole
Deliver growth Provides an important indicator of organic (like-for-like) growth of Group businesses between reporting periods. This measure eliminates the impact of exchange rates, acquisitions, disposals and significant business closures
Strategic Alignment KPI Purpose
Return on net assets
Used to assess the financial performance and asset management of the Group
Headline earnings per share
Used to assess the underlying earnings performance of the Group as a whole
Underlying revenue growth
Maintain strong cash generation and an efficient capital structure
Free cash flow
Average working capital to sales ratio
Interest cover ratio
Ratio of net debt to EBITDA
Used to assess the underlying cash generation of the Group. One of the factors driving the generation of free cash flow is the average working capital to sales ratio, which indicates the level of working capital used in the business
Both ratios are used to assess the financial position of the Group and its ability to fund future growth
Non-financial KPIs
Provide a safe working environment for our people
Lost time injury frequency rate
PerformanceStrategic Alignment KPI
17 1.6
16
1.7
15
1.5
Lost time injury frequency rate*
Be at the forefront of innovation
R&D spend
17 33.2
16
28.6
15
25.8
Total R&D spend** £m
21
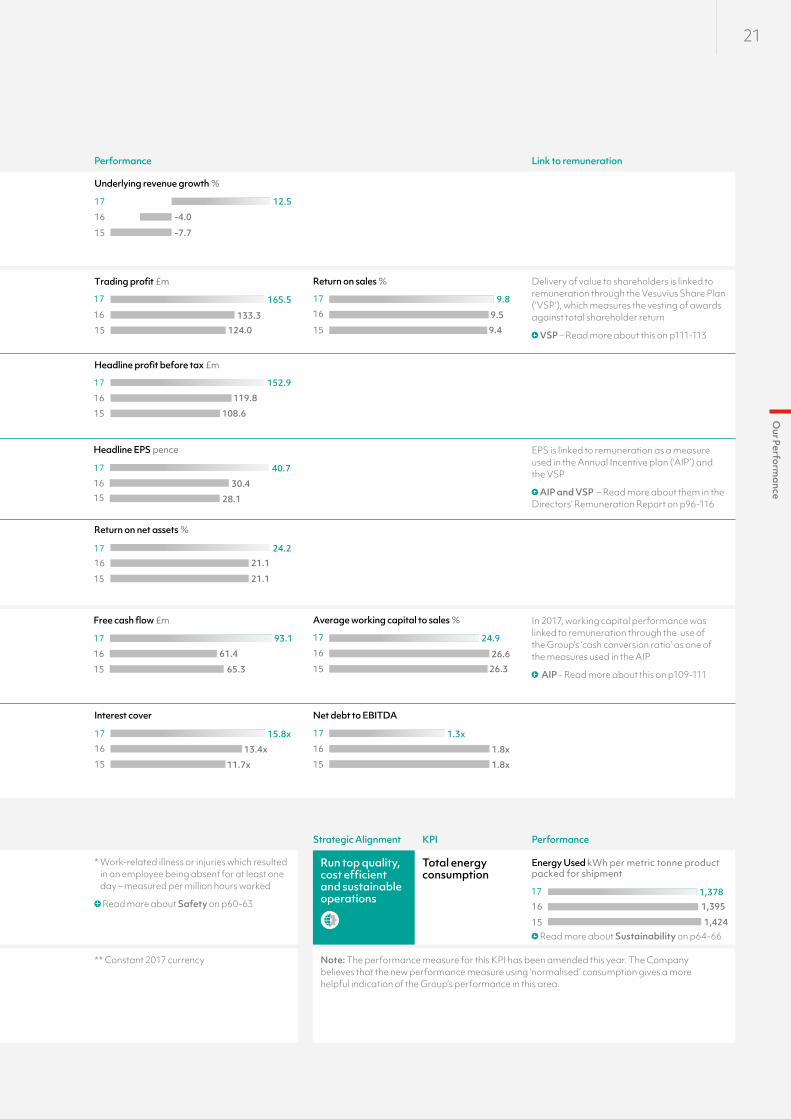
Delivery of value to shareholders is linked to remuneration through the Vesuvius Share Plan (‘VSP’), which measures the vesting of awards against total shareholder return
VSP – Read more about this on p111-113
EPS is linked to remuneration as a measure used in the Annual Incentive plan (‘AIP’) and the VSP
AIP and VSP – Read more about them in the Directors’ Remuneration Report on p96-116
Performance Link to remuneration
Run top quality, cost efficient and sustainable operations
Total energy consumption
Our Perform
ance
17 12.5
16
-4.0
15
-7.7
Underlying revenue growth %
17 165.5
16
133.315
124.0
Trading profit £m
17 152.9
16
119.8
15
108.6
Headline profit before tax £m
17 40.7
16
30.415
28.1
Headline EPS pence
17 24.216
21.1
15
21.1
Return on net assets %
In 2017, working capital performance was linked to remuneration through the use of the Group’s ‘cash conversion ratio’ as one of the measures used in the AIP
AIP - Read more about this on p109-111
17 93.1
16
61.4
15
65.3
Free cash flow £m
17 24.9
16
26.6
15
26.3
Average working capital to sales %
17 9.816
9.5
15
9.4
Return on sales %
* Work-related illness or injuries which resulted in an employee being absent for at least one day – measured per million hours worked
Read more about Safety on p60-63
** Constant 2017 currency
PerformanceStrategic Alignment KPI
Note: The performance measure for this KPI has been amended this year. The Company believes that the new performance measure using ‘normalised’ consumption gives a more helpful indication of the Group’s performance in this area.
17 1.3x
16
1.8x
15
1.8x
Net debt to EBITDA
Read more about Sustainability on p64-66
17 15.8x16
13.4x
15
11.7x
Interest cover
17 1,37816
1,395
15
1,424
Energy Used kWh per metric tonne product packed for shipment

22 Vesuvius plcAnnual Report and Accounts 2017
Risk
The Board continually monitors the internal and external risks which could signifi cantly impact the long-term performance of the Group
Risk Management in 2017The Board is responsible for setting the Group’s risk appetite and ensuring that appropriate risk management systems are in place. The Group undertakes a continuous process of risk identifi cation and review, which includes both a top-down and bottom-up process, independently gathering views on risk from each business unit, and from operational, functional and senior executive management, and the Board of Directors. Building on the process conducted in 2016, where a clean sheet review of the Group’s principal risks was undertaken, the Group’s assessment of principal risks has been reviewed and considered against a further group of emerging risks and uncertainties identifi ed through our 2017 Board process.
Changes to Risk in 2017The Board believes that there has been no material change to the Group’s principal risks and uncertainties during the year. However, the Board refl ected on the implications of certain emerging ‘macro’ trends during the year. These included the increase in automation in manufacturing as a competitive disruption and the potential for negative implications for the business from the Brexit process, the outcome of which remains unclear, but which is not expected to be material in the context of the Group. The Board also discussed the risks that could arise from a failure by the Group to foster the correct culture for success. In addition to these wider trends, the Board focused on identifi ed risks where issues had arisen during the year – the interruption of supply of quality raw materials, the related challenges of instigating price increases as input costs go up, the more protectionist approach being implemented in some major markets, and the potential for fi nancial instability and worldwide recession.
Finally, the Board continued its oversight of cyber issues as an emerging risk. The Board’s view on each of these issues was integrated into management discussions on risk and factored into the approach the Group takes to successful mitigation.
Risk MitigationThe risks identifi ed are actively managed in order to mitigate exposure. Senior management ‘owners’ are identifi ed for each principal risk to manage the mitigations of that specifi c risk and contribute to the analysis of its likelihood and materiality. This is reported to the Board. The risks are analysed in the context of our business structure which gives protection against a number of principal risks we face with diversifi ed currencies, a widespread customer base, local production matching the diversity of
Todd Steele, Technical Specialist,M&T – Ferrous, Foundry USA
plemented in some major and the potential for fi nancialand worldwide recession.
alist,

23
Viability Process
Identify
Viability time horizon and risk analysis framework
Assess
Principal risks and stress scenarios
Model
Viability against risk scenarios, examining probabilities and impacts
Report
See Viability Statement above
Our Perform
ance
our markets and intensive training of our employees. Additionally, we seek to mitigate risk through contractual measures. Where cost-effective, the risk is transferred to insurers.
Board MonitoringThe Board defines the Group’s risk appetite, considering the nature and extent of the principal risks that the Group should take. The Board’s oversight of principal risks also involves a Board review of the processes by which the Group manages those risks, establishing a clear understanding at Board level of the individuals and groups in the business formally responsible for the management of specifi c risks.
See more in Governance on pages74-121
Principal RisksThe risks identifi ed on pages 24 and 25 are those the Board considers to be the most relevant to the Group in relation to their potential impact on the achievement of its strategic objectives. All of the risks set out on pages 24 and 25 could materially affect the Group, its businesses, future operations and fi nancial condition and could cause actual results to differ materially from expected or historical results. These risks are not the only ones that the Group will face. Some risks are not yet known and some currently not deemed to be material could become so.
Viability StatementIn accordance with the UK Corporate Governance Code, the Directors have assessed the viability of the Group over a three year period to 31 December 2020, taking into account the Group’s current position and the potential impact of the principal risks and uncertainties.
The Directors have determined that a three year period is an appropriate period over which to provide the Viability Statement because this is the period that the strategic business plan focuses on and is suffi ciently funded by fi nancing facilities with average maturity terms of approximately six years.
In making this statement, the Directors have carried out a robust assessment of the principal risks that may threaten the business model, future performance, solvency and liquidity of the Group. This is embodied in the annual review of a three year bottom-up business plan process which includes a review of sensitivity to ‘business as usual’ risks, such as profi t growth and working capital variances, severe but plausible events and the impact on the central debt and headroom profi le analysis. The results take account of the availability and likely effectiveness of the mitigating actions that could be taken to avoid or reduce the impact or occurrence of the underlying risks.
Whilst the review has considered all the principal risks identifi ed by the Group, the following were selected for enhanced stress testing: an unplanned drop in customer demand, debt recovery risk due to customer default, raw material price infl ation, reduction in earnings from increased interest charges and the impact of volatility in foreign currency earnings. The Group’s prudent balance sheet management, fl exible cost base to react quickly to end market conditions, access to long-term capital at acceptable fi nancing costs and well diversifi ed international businesses in different currency earning profi les leaves it well placed to manage these principal risks.
In performing the stress testing, certain assumptions were made including that: customer failures result in write-offs of the full value of the receivables with no lost revenue replacement; and partial cash fl ow mitigation is possible from working capital releases, restricted capital expenditure and operating cost reductions. Under the enhanced stress testing described above, a potential breach of a covenant would only occur in the event of an unforeseen reduction in revenue greater than 35%.
Accordingly, the Directors confi rm that they have a reasonable expectation that the Group will be able to continue in operation and meet its liabilities as they fall due over the three year period to 31 December 2020.
24 Vesuvius plcAnnual Report and Accounts 2017
Risk continued
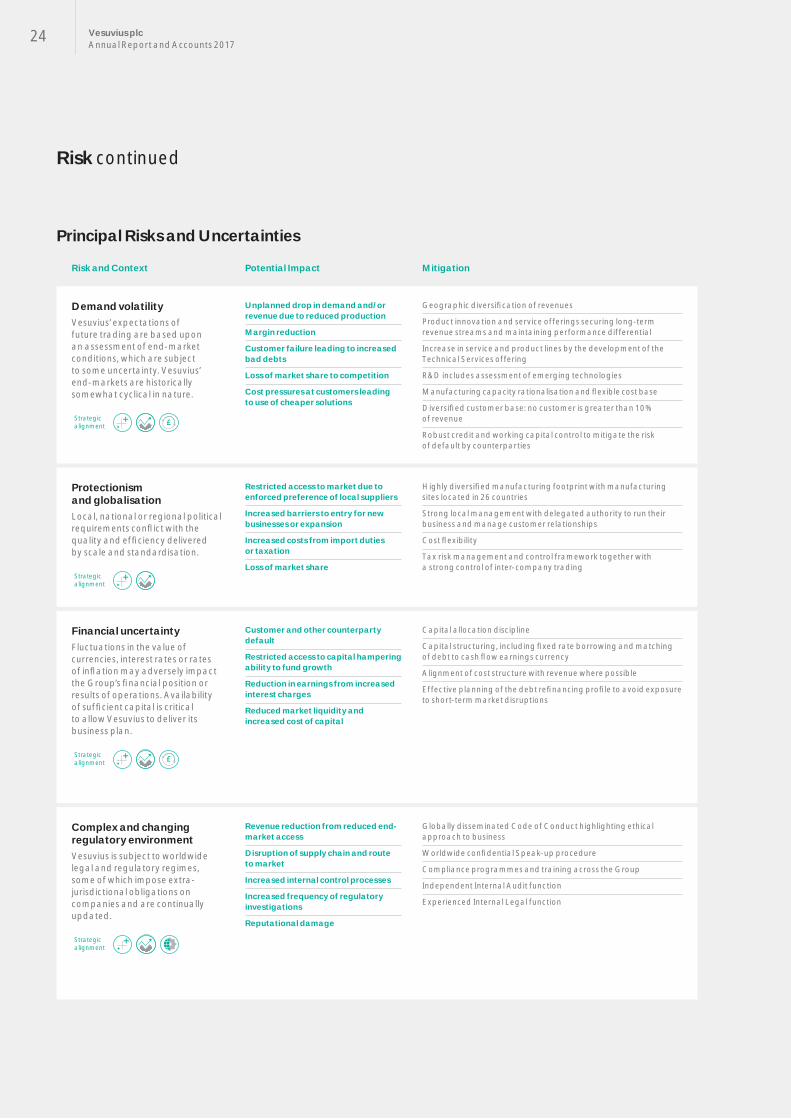
Principal Risks and Uncertainties
Risk and Context Potential Impact Mitigation
Demand volatilityVesuvius’ expectations of future trading are based upon an assessment of end-market conditions, which are subject to some uncertainty. Vesuvius’ end-markets are historically somewhat cyclical in nature.
Strategic alignment
Unplanned drop in demand and/or revenue due to reduced production
Margin reduction
Customer failure leading to increased bad debts
Loss of market share to competition
Cost pressures at customers leading to use of cheaper solutions
Geographic diversifi cation of revenues
Product innovation and service offerings securing long-term revenue streams and maintaining performance differential
Increase in service and product lines by the development of the Technical Services offering
R&D includes assessment of emerging technologies
Manufacturing capacity rationalisation and fl exible cost base
Diversifi ed customer base: no customer is greater than 10% of revenue
Robust credit and working capital control to mitigate the risk of default by counterparties
Protectionism and globalisationLocal, national or regional political requirements confl ict with the quality and effi ciency delivered by scale and standardisation.
Strategic alignment
Restricted access to market due to enforced preference of local suppliers
Increased barriers to entry for new businesses or expansion
Increased costs from import duties or taxation
Loss of market share
Highly diversifi ed manufacturing footprint with manufacturing sites located in 26 countries
Strong local management with delegated authority to run their business and manage customer relationships
Cost fl exibility
Tax risk management and control framework together with a strong control of inter-company trading
Financial uncertaintyFluctuations in the value of currencies, interest rates or rates of infl ation may adversely impact the Group’s fi nancial position or results of operations. Availability of suffi cient capital is critical to allow Vesuvius to deliver its business plan.
Strategic alignment
Customer and other counterparty default
Restricted access to capital hampering ability to fund growth
Reduction in earnings from increased interest charges
Reduced market liquidity and increased cost of capital
Capital allocation discipline
Capital structuring, including fi xed rate borrowing and matching of debt to cash fl ow earnings currency
Alignment of cost structure with revenue where possible
Effective planning of the debt refi nancing profi le to avoid exposure to short-term market disruptions
Complex and changing regulatory environmentVesuvius is subject to worldwide legal and regulatory regimes, some of which impose extra-jurisdictional obligations on companies and are continually updated.
Strategic alignment
Revenue reduction from reduced end-market access
Disruption of supply chain and route to market
Increased internal control processes
Increased frequency of regulatory investigations
Reputational damage
Globally disseminated Code of Conduct highlighting ethical approach to business
Worldwide confi dential Speak-up procedure
Compliance programmes and training across the Group
Independent Internal Audit function
Experienced Internal Legal function

25
Strategic Alignment Deliver growth Generate sustainable
profi tability and create shareholder value
Maintain strong cash generation and an effi cient capital structure
Provide a safe working environment for our people
Be at the forefront of innovation
Run top-quality, cost-effi cient and sustainable operations
Foster talent, skill and motivation in our people
See more about Our Strategy on p10-11
Risk and Context Potential Impact Mitigation
Business interruptionThe Group is subject to operational risks including natural catastrophe, terrorist action, fi re/explosion, environmental regulation, industrial action, supply chain issues and cyber risk.
Strategic alignment
Loss of a major plant temporarily or permanently impairing our ability to serve our customers
Damage to or restriction in ability to use assets
Denial of access to critical systems or control processes
Disruption of manufacturing processes
Inability to source critical raw materials
Diversifi ed manufacturing footprint
Disaster recovery planning
Business continuity planning with strategic maintenance of excess capacity
Physical and IT control systems security, access and training
Cyber risks integrated into wider risk-management structure
Well-established global insurance programme
Group-wide safety management programmes
Dual sourcing strategy and development of substitutes
Failure to secure innovationNot maintaining and/or developing the necessary sustainable differentiation in products, systems and services by driving innovative solutions. Competitive advantage derived from proprietary intellectual property is lost through inadequate protection.
Strategic alignment
Product substitution by customers
Increased competitive pressure through lack of differentiation of Vesuvius offering
Commoditisation of product portfolio through lack of development
Lack of response to changing customer needs
Loss of intellectual property protection
Enduring and signifi cant investment in R&D, with market-leading research
A shared strategy for innovation throughout the Group, deployed via our R&D centres
Stage gate process from innovation to commercialisation to foster innovation and increase alignment with strategy
Programme of Manufacturing and Process Excellence
Quality programme, focused on quality and consistency
Stringent intellectual property registration and defence
Attracting talent and performance managementFailure to attract suffi cient new talent to the Group based on industry perception and competition. Failure to maintain and develop a talent pipeline and internal succession options for middle and senior management positions.
Strategic alignment
Organisational culture of high performance is not achieved
Staff turnover in growing economies and regions
Stagnation of ideas and development opportunities
Loss of expertise and critical business knowledge
Reduced management pipeline for succession to senior positions
Internal focus on talent development and training, with tailored career-stage programmes and clear performance management strategies
Contacts with universities to identify and develop talent
Career path planning and global opportunities for high-potential staff
Internal programmes for the structured transfer of technical and other knowledge
Clearly elucidated values to underpin business culture
Quality, health and safetyVesuvius works in highly challenging manufacturing environments, providing products, systems and services that are mission critical and for which reliability is paramount.
Strategic alignment
Injury to staff and contractors
Product or application failures lead to adverse fi nancial impact or loss of reputation as technology leader
Health and safety breach, manufacturing downtime or damage to infrastructure from incident at customer plant
Customer claims from product quality issues
Active safety programmes, with ongoing wide-ranging monitoring and safety training
Quality management programmes including stringent quality control standards, monitoring and reporting
Experienced technical staff knowledgeable in the application of our products and technology
Targeted global insurance programme
Experienced Internal Legal function controlling third-party contracting
Our Perform
ance

26 Vesuvius plcAnnual Report and Accounts 2017
Financial Review
“Signifi cant progress has been made in improving the strength of our balance sheet through a focus on working capital and cash generation during a period of revenue growth”Guy Young Chief Financial Offi cer
Basis of Preparation All references in this fi nancial review are to headline performance unless stated otherwise. See Note 4 to the Group Financial Statements on page 138.
IntroductionWe have made good progress towards our previously stated aim to enable the business to improve shareholder returns and sustain growth, whilst optimising operating costs and maintaining an appropriate level of control and compliance. The key components of our strategy to achieve this were successfully launched in 2017, including structural and people changes to the Finance team, the building of a European shared service centre and improved performance reporting and measurement. Whilst there remains a lot still to do before all of our improvement plans are implemented, the pleasing progress to date is thanks to the dedication and professionalism of our fi nance personnel across the Group.
2017 Performance Overview In contrast to 2016, end-markets were stronger during 2017 and our revenue benefi ted from the improved demand for our products in both Steel and Foundry as a result, as well as business gains in many of our key markets, principally EMEA and NAFTA. Reported revenue increased by £282.5m over the prior year and by £186.4m on an underlying basis. The restructuring programme continued to deliver ahead of plan during 2017 with a total of £16.2m of incremental benefi ts reported. The increased revenue and restructuring benefi ts drove the higher reported trading profi t of £165.5m, which was 24.2% higher than prior year. Return on sales for 2017 on a reported basis at 9.8% was higher than the prior year by 30bps despite a number of higher costs in the period. The higher costs related to price increases on several key raw materials, as well as temporary costs associated with importing product into Europe from other facilities in the Group to satisfy the higher demand. In a year of strong sales growth, our cash management performance was strong, achieving a 104% cash conversion, due largely to better working capital management. As a result, we have decreased our net debt position and improved our leverage ratio of net debt to EBITDA to 1.3x from 1.8x at December 2016.
£1,683.9mRevenue
Reported Underlying1
+20.2% +12.5%
£165.5mTrading profi t2
Reported Underlying1
+24.2% +16.1%
14.1pStatutory EPS
Reported
-33.2%
9.8%Return on sales2
Reported Underlying1
+30bps +30bps
1. Underlying basis is at constant currency and excludes separately reported items and the impact of acquisitions and disposals.
2. For defi nitions of alternative performance measures, refer to Note 4 of the Group Financial Statements.
27
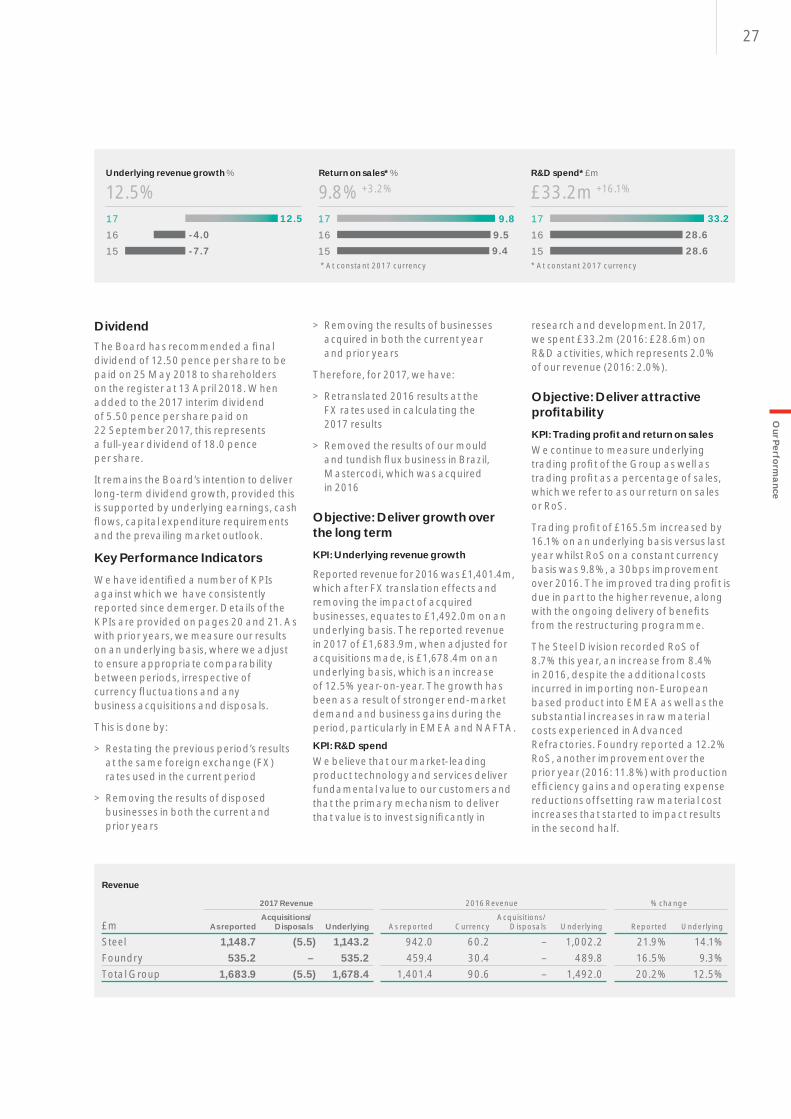
Dividend The Board has recommended a fi nal dividend of 12.50 pence per share to be paid on 25 May 2018 to shareholders on the register at 13 April 2018. When added to the 2017 interim dividend of 5.50 pence per share paid on 22 September 2017, this represents a full-year dividend of 18.0 pence per share.
It remains the Board’s intention to deliver long-term dividend growth, provided this is supported by underlying earnings, cash fl ows, capital expenditure requirements and the prevailing market outlook.
Key Performance Indicators We have identifi ed a number of KPIs against which we have consistently reported since demerger. Details of the KPIs are provided on pages 20 and 21. As with prior years, we measure our results on an underlying basis, where we adjust to ensure appropriate comparability between periods, irrespective of currency fl uctuations and any business acquisitions and disposals.
This is done by:
> Restating the previous period’s results at the same foreign exchange (FX) rates used in the current period
> Removing the results of disposed businesses in both the current and prior years
> Removing the results of businesses acquired in both the current year and prior years
Therefore, for 2017, we have:
> Retranslated 2016 results at the FX rates used in calculating the 2017 results
> Removed the results of our mould and tundish fl ux business in Brazil, Mastercodi, which was acquired in 2016
Objective: Deliver growth over the long termKPI: Underlying revenue growth
Reported revenue for 2016 was £1,401.4m, which after FX translation effects and removing the impact of acquired businesses, equates to £1,492.0m on an underlying basis. The reported revenue in 2017 of £1,683.9m, when adjusted for acquisitions made, is £1,678.4m on an underlying basis, which is an increase of 12.5% year-on-year. The growth has been as a result of stronger end-market demand and business gains during the period, particularly in EMEA and NAFTA.KPI: R&D spendWe believe that our market-leading product technology and services deliver fundamental value to our customers and that the primary mechanism to deliver that value is to invest signifi cantly in
research and development. In 2017, we spent £33.2m (2016: £28.6m) on R&D activities, which represents 2.0% of our revenue (2016: 2.0%).
Objective: Deliver attractive profi tabilityKPI: Trading profi t and return on salesWe continue to measure underlying trading profi t of the Group as well as trading profi t as a percentage of sales, which we refer to as our return on sales or RoS.
Trading profi t of £165.5m increased by 16.1% on an underlying basis versus last year whilst RoS on a constant currency basis was 9.8%, a 30bps improvement over 2016. The improved trading profi t is due in part to the higher revenue, along with the ongoing delivery of benefi ts from the restructuring programme.
The Steel Division recorded RoS of 8.7% this year, an increase from 8.4% in 2016, despite the additional costs incurred in importing non-European based product into EMEA as well as the substantial increases in raw material costs experienced in Advanced Refractories. Foundry reported a 12.2% RoS, another improvement over the prior year (2016: 11.8%) with production effi ciency gains and operating expense reductions offsetting raw material cost increases that started to impact results in the second half.
Revenue
2017 Revenue 2016 Revenue % change
£m As reportedAcquisitions/
Disposals Underlying As reported CurrencyAcquisitions/
Disposals Underlying Reported Underlying
Steel 1,148.7 (5.5) 1,143.2 942.0 60.2 – 1,002.2 21.9% 14.1%Foundry 535.2 – 535.2 459.4 30.4 – 489.8 16.5% 9.3%Total Group 1,683.9 (5.5) 1,678.4 1,401.4 90.6 – 1,492.0 20.2% 12.5%
Our Perform
ance
Underlying revenue growth %
12.5%17 12.516 -4.015 -7.7
R&D spend* £m
£33.2m +16.1%
* At constant 2017 currency
17 33.216 28.615 28.6
Return on sales* %
9.8% +3.2%
* At constant 2017 currency
17 9.816 9.515 9.4
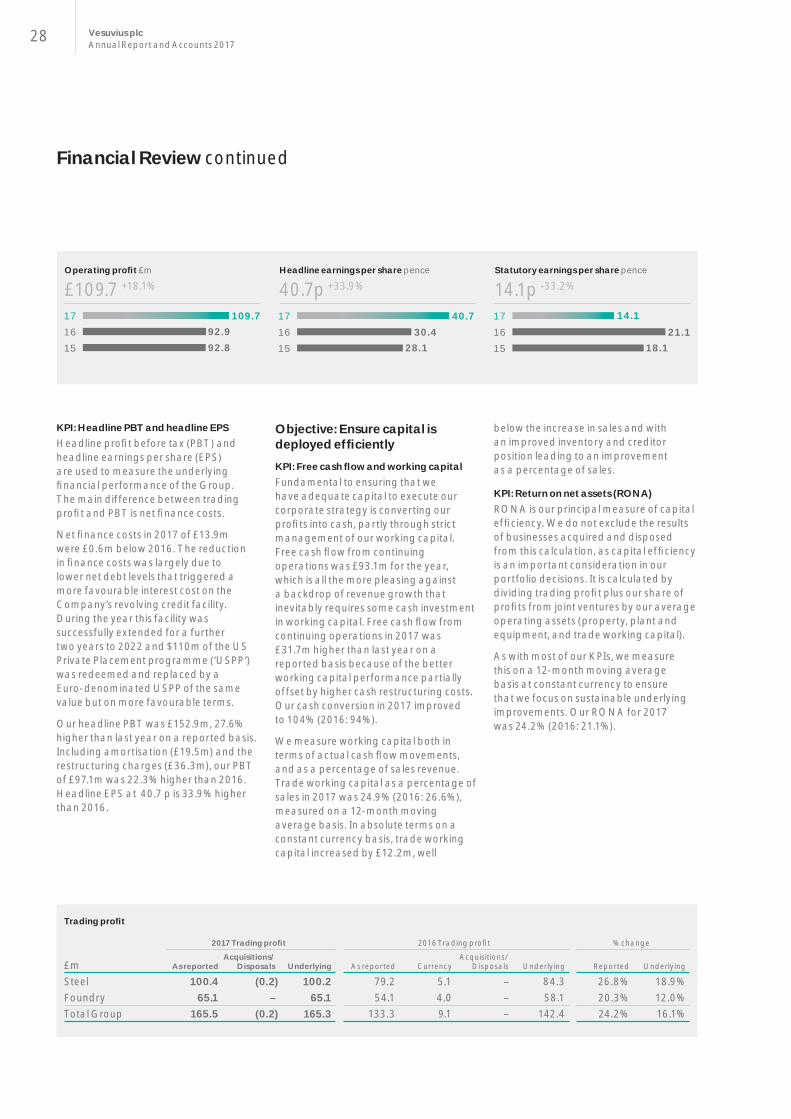
28 Vesuvius plcAnnual Report and Accounts 2017
KPI: Headline PBT and headline EPSHeadline profi t before tax (PBT) and headline earnings per share (EPS) are used to measure the underlying fi nancial performance of the Group. The main difference between trading profi t and PBT is net fi nance costs.
Net fi nance costs in 2017 of £13.9m were £0.6m below 2016. The reduction in fi nance costs was largely due to lower net debt levels that triggered a more favourable interest cost on the Company’s revolving credit facility. During the year this facility was successfully extended for a further two years to 2022 and $110m of the US Private Placement programme (‘USPP’)was redeemed and replaced by a Euro-denominated USPP of the same value but on more favourable terms.
Our headline PBT was £152.9m, 27.6% higher than last year on a reported basis. Including amortisation (£19.5m) and the restructuring charges (£36.3m), our PBT of £97.1m was 22.3% higher than 2016. Headline EPS at 40.7 p is 33.9% higher than 2016.
Objective: Ensure capital is deployed effi cientlyKPI: Free cash fl ow and working capitalFundamental to ensuring that we have adequate capital to execute our corporate strategy is converting our profi ts into cash, partly through strict management of our working capital. Free cash fl ow from continuing operations was £93.1m for the year, which is all the more pleasing against a backdrop of revenue growth that inevitably requires some cash investment in working capital. Free cash fl ow from continuing operations in 2017 was £31.7m higher than last year on a reported basis because of the better working capital performance partially offset by higher cash restructuring costs. Our cash conversion in 2017 improved to 104% (2016: 94%).
We measure working capital both in terms of actual cash fl ow movements, and as a percentage of sales revenue. Trade working capital as a percentage of sales in 2017 was 24.9% (2016: 26.6%), measured on a 12-month moving average basis. In absolute terms on a constant currency basis, trade working capital increased by £12.2m, well
below the increase in sales and with an improved inventory and creditor position leading to an improvement as a percentage of sales.
KPI: Return on net assets (RONA)RONA is our principal measure of capital effi ciency. We do not exclude the results of businesses acquired and disposed from this calculation, as capital effi ciency is an important consideration in our portfolio decisions. It is calculated by dividing trading profi t plus our share of profi ts from joint ventures by our average operating assets (property, plant and equipment, and trade working capital).
As with most of our KPIs, we measure this on a 12-month moving average basis at constant currency to ensure that we focus on sustainable underlying improvements. Our RONA for 2017 was 24.2% (2016: 21.1%).
Financial Review continued
Trading profi t
2017 Trading profi t 2016 Trading profi t % change
£m As reportedAcquisitions/
Disposals Underlying As reported CurrencyAcquisitions/
Disposals Underlying Reported Underlying
Steel 100.4 (0.2) 100.2 79.2 5.1 – 84.3 26.8% 18.9%Foundry 65.1 – 65.1 54.1 4.0 – 58.1 20.3% 12.0%Total Group 165.5 (0.2) 165.3 133.3 9.1 – 142.4 24.2% 16.1%
Operating profi t £m
£109.7 +18.1%
17 109.716 92.915 92.8
Headline earnings per share pence
40.7p +33.9%
17 40.716 30.415 28.1
Statutory earnings per share pence
14.1p -33.2%
17 14.116 21.115 18.1

29
Objective: Maintain a strong fi nancial positionKPI: Interest cover and net debtAs at 31 December 2017, the Group had committed borrowing facilities of £563.4m (2016: £576.9m), of which £153.7m was undrawn (2016: £158.3m). The revolving credit facility term was extended to 2022 and $110m of the USPP was redeemed and replaced with a Euro-denominated USPP at better rates.
Net debt at 31 December 2017 was £274.3m, a £46.0m decrease from 2016, as a result of our good cash generation. The main drivers of the decrease were the impact of strong cash conversion partially offset by higher restructuring costs and tax payments.
The Group’s debt facilities have two fi nancial covenants: the ratios of net debt to EBITDA (maximum three times limit) and EBITDA to interest (minimum four times limit). These ratios are monitored regularly to ensure that the Group has suffi cient fi nancing available to run the business and fund future growth.
At the end of 2017, the net debt to EBITDA ratio was 1.3x, an improvement over last year (2016: 1.8x) and EBITDA to interest was 15.8x (2016: 13.4x).
Further information on our fi nance costs can be found in Note 9 to the Group Financial Statements on page 143.
Financial Risk FactorsThe Group undertakes regular risk reviews and, as a minimum, a full risk assessment process twice a year. As in previous years this included input from the Board in both the assessment of risk and the proposed mitigation. As referred to in the Principal Risks and Uncertainties and Viability Statement on pages 23,24 and 25, we consider the main fi nancial risks faced by the Group as being demand volatility and the impact of fi nancial uncertainty, leading to reduced revenue and profi t as well as potential customer default, and a lack of liquidity, brought on by market volatility. Important but lesser risk exists in interest rate movements and cost infl ation but
neither is expected to have a material impact on the business after considering the controls we have in place.
Our key mitigation of demand volatility is to manage the Group’s exposure through balancing our portfolio of business geographically and by end-market and to invest in product innovation. We do so through targeted capital investment in new and growing businesses and a combination of capital and human resource in emerging markets. The second main fi nancial risk of a lack of liquidity is mitigated by fi nancing using both the bank and private placement markets. The Group also seeks to avoid a concentration of debt maturities in any one period to spread its refi nancing risk. The Group’s undrawn committed bank facilities at 31 December 2017 were £153.7m. Counterparty risk and customer default are mitigated by our relatively widespread customer base – with no customer being greater than 10% of revenue – and credit control procedures.
Operating cash fl ow and cash conversion
2017£m
20163m
Cash generated from continuing operations 176.6 130.2Add: Outfl ows relating to restructuring charges 27.3 16.8Add: Net retirement benefi t obligations 4.8 7.7Less: Capital expenditure (39.0) (31.3)Add: Proceeds from the sale of property, plant and equipment 1.8 1.6Operating cash fl ow 171.5 125.0Trading profi t 165.5 133.3Cash conversion 104% 94%
Our Perform
ance
* For defi nitions of alternative performance measures, refer to Note 4 of the Group Financial Statements
RONA moving average* %
24.2%17 24.216 21.115 21.1
Net debt* £m
£274.3mUnutilised committed debt facilities £m
£153.7m17 274.3
16 320.315 291.6
17 153.716 158.315 181.1

30 Vesuvius plcAnnual Report and Accounts 2017
Other Relevant Financial InformationRestructuringWe continued to make good progress in implementing our previously announced restructuring programme, mainly in Flow Control, with £16.2m savings delivered in 2017, which was ahead of expectations. The total savings delivered since launching the programme are now £43.2m. In 2017, we reported £36.3m of restructuring costs (2016: £28.5m) that were predominantly made up of redundancy and plant closure costs, along with related consulting fees. These costs included the fi nal costs related to the previously announced restructuring plan as well as £4.8m of costs related to a completely new restructuring plan launched at the end of 2017, targeting the Foundry Division in Europe and NAFTA, the Advanced Refractories Business Unit in Europe, and Group corporate functions. The cash costs in 2017 were £27.3m (2016: £16.8m). We are carrying a restructuring provision forward into 2018 of £22.9m.
TaxationA key measure of tax performance is the effective tax rate, which the Group calculates on the income tax associated with headline performance, divided by the headline profi t before tax and before the Group’s share of post-tax profi t of joint ventures (2017: £151.6m, 2016: £118.8m). The Group’s effective tax rate,
based on the income tax costs associated with headline performance of £36.4m (2016: £31.4m), was 24.0% in 2017 (2016: 26.4%). This was lower than expected due largely to better profi t performance in countries where we had tax losses, the impact of the weakening of the peso on our Mexican tax position and the release of provisions due to favourable tax litigation outcomes.
The Group’s effective tax rate is sensitive to changes in the geographic mix of profi ts and level of profi ts, and refl ects a combination of higher rates in certain jurisdictions such as India, Mexico, Germany and Belgium, nil effective rates in the UK and US due to the availability of unutilised tax losses, and rates that lie somewhere in between.
Other key factors impacting the sustainability of the Group’s effective tax rate are set out in Note 10.6 to the Group Financial Statements.
The income tax charge on separately reported items of £18.0m (2016: £5.0m credit) comprises £6.0m non-cash deferred tax movements relating to the amortisation of a deferred tax liability arising from the 2008 acquisition of Foseco plc (2016: £3.7m), £4.3m tax credits relating to restructuring charges (2016: £3.8m), and a net reduction in the deferred tax asset previously recognised in respect of US tax losses and certain other temporary differences of £28.3m (2016: £2.1m) largely caused by US tax
reform enacted in late December 2017 in the form of the US Tax Cuts and Jobs Act (‘TCJA’). A combination of the reduction in the US Federal tax rate from 35% to 21%, the repatriation tolling charge and other provisions of TCJA caused a £25.7m reduction in our US deferred tax asset which, together with other normal movements and foreign exchange revaluation, reduced from £65.9m at the end of 2016 to £32.6m at the end of 2017. However, this write-down did not impact our Headline earnings after tax, as the change in the asset was refl ected through separately reported items.
Based on our initial interpretation, the Base Erosion and Anti-Abuse Tax provisions introduced by the Act may increase the Group’s effective tax rate by approximately 0.7% in 2018 and 1.2% in 2019.
We expect the Group’s effective tax rate from 2018 onwards to be between 27% and 28%, including the expected adverse impact of US tax reform, refl ecting the tax benefi t of initiatives being taken.
The net income tax charge recognised directly in the Group Statement of Comprehensive Income of £3.1m (2016: £0.7m) comprises a £2.4m charge (2016: £0.7m charge) in respect of deferred tax on pension obligations and £0.7m (2016: £nil) UK tax in respect of foreign exchange differences arising on hedged positions.
Financial Review continued

31
Capital ExpenditureCapital expenditure in 2017 of £44.3m (2016: £35.2m) comprised £34.0m in the Steel Division (2016: £23.7m) and £10.3m in the Foundry Division (2016: £11.5m). Capital expenditure on revenue-generating customer installation assets, primarily in Steel, has been increased to £10.7m (2016: £6.5m).
PensionsThe Group has a limited number of historical defi ned benefi t plans mainly in the UK, US, Germany and Belgium. The main plans in the UK and US are largely closed to further benefi t accruals and 56.5% of the liabilities in the UK have already been insured. The total net defi cit attributed to these defi ned benefi t obligations at the end of December 2017 was £16.5m (2016: £29.4m), representing an improvement of £12.9m. The key movements giving rise to this were increases of £1.8m to the defi cit arising out of changes to actuarial assumptions (attributable to increasing discount rates; updated mortality assumptions and pension membership data) and additional accrual and administrative expenditure paid for the year (£6.8m); offset by reductions to the defi cit of £10.2m from asset returns and cash contributions of £11.6m.
The majority of the ongoing pension plans are defi ned contribution plans, where our only obligation is to make contributions, with no further commitments on the level of post-retirement benefi ts. During 2017, cash contributions of £12.6m (2016: £10.8m) were made into the defi ned contribution plans and charged to trading profi t.
Corporate ActivityLate in 2017, we made a strategic investment in Sapotech Oy, a Finnish technology company with which we will be jointly developing predictive analytical service offerings to Steel customers. Acquisition opportunities remain part of our growth strategy and are evaluated on an ongoing basis.
Guy Young Chief Financial Offi cer
28 February 2018
Our Perform
ance
Net defi ned benefi t pension defi cit £m
£16.5m -43.9%
17 16.516 29.415 35.3

32 Vesuvius plcAnnual Report and Accounts 2017
Innovation
“We engage the creativity of our people across the entire organisation to drive innovation”Alan Charnock Vice President and Chief Technology Offi cer
Vesuvius’ R&D organisation has been a major factor in maintaining our technology leadership position. We are now three years into our initiative to engage the creativity of people across the whole organisation, and to drive innovation across the entire Group. Like all our other major Group initiatives – safety, quality and excellence – embedding a culture of innovation requires focus on leadership, structure, process, tools, training and incentivisation. The structures are in place with the necessary process and tools, which are constantly being streamlined and improved.
Digital Transformation Digital Transformation is a key theme for companies targeting signifi cant growth, strategic regeneration or market disruption with breakthrough technologies. For Vesuvius, this has been manifested by our Digital Services business unit. This also engages each of the Group’s other business units in adopting a business model complementary to and independent of their existing consumables business. Vesuvius is extremely well positioned to harness the digital transformation trend by creating this new market offering built on the reputation of over 100 years as a leader of innovation giving technical
support to the Steel and Foundry industries. Our customers already recognise our expertise in developing engineering solutions using our understanding of our own technology platforms and our customers’ processes. This is borne out of our long-term daily presence at customer plants, working in partnership with them to improve the performance of our products, and providing the continuous process improvement that our customers demand to maintain their own competitiveness.
Ideation Understanding our customers’ processes and the application of our products, knowing what to look for and then understanding what we see, are the fi rst essential ingredients of the creative process of ideation. Ideation links experience and knowledge with the situation in front of you, generating new ways to make improvements. Occasionally this can lead to breakthrough ideas giving a step change in performance or a disruptive new technology platform. It is this presence at, and interaction with, the customer that is at the heart of the Vesuvius business model. It is also illustrated in our Technical Services strategy: developing sensors, software tools and techniques to
£33.2mSpend on R&D2016: £28.6m
2.0%% of Revenue2016: 2.0%
14.5%% of new product sales1 2016: 14.2%
1. Sales of products launched within the last 5 years as a % of total revenue

33O
ur Performance
Katarzyna Szafraniec, Quality Engineer, Poland
“ As a Quality Engineer I continue to draw on my R&D experience.”
Having studied Chemical Technology at university, I joined Vesuvius in 2011, beginning as a R&D Assistant at the Vesuvius site in Skawina, Poland working on refractory material. In this role, I collaborated with engineers across numerous projects, conducting physical and chemical analysis. Using X-ray diffraction, Thermogravimetric Analysers and Scanning Electron Microscopy, I was able to gain a thorough understanding of Vesuvius’ products and their structure.
Two years later, I was promoted to the position of R&D Engineer at Skawina where part of my role was to conduct on-site product analysis for customers, solving production issues for them. I was also responsible for the development of new products such as the industrialisation of our spinel-forming self-fl ow castable. During this time, I also participated in Vesuvius’ in-house technical ‘HeaTt’ training.
In 2016, I was selected to join Skawina’s new Casting & Precast Department as a Quality Engineer, where I continue to draw on my R&D experience to monitor and further improve production processes. My career at Vesuvius has enabled me to develop my technical expertise, as well as understand production processes, develop training programmes and manage a team of motivated colleagues.
mance
and manage a team of motivated colleagues.

34 Vesuvius plcAnnual Report and Accounts 2017
Innovation continued
constantly monitor customer processes and our products in use, interpreting the data obtained, reacting with process adjustments in real time and allowing for new process and product developments. This model can create new services, add value to our existing product offering and accelerate our traditional ideation process.
Innovation is the creative process of converting ideas into value-creating technologies or creating value by doing things differently. But to be effective we need to identify and prioritise the right ideas, and have the courage to put the other ones aside.
Our new product introduction (‘NPI’) process has been in place for three years, enabling us to identify and focus on the ideas and projects which are most aligned with our strategic plans, injecting greater rigour into decision-making with a stage gate approach. Today, we have no shortage of ideas, but actively work on a much smaller number of prioritised projects than we worked on four years ago. We operate a continuous portfolio review process to ensure that the R&D technology roadmaps emphasise both current needs and the essential longer-term programmes.
In 2017, we launched an Ideation Platform where new ideas are reviewed and refi ned, with viable and valuable ideas funnelled into the NPI pipeline. The Ideation Platform is presently targeted only at new products and manufacturing processes, but our intention is to broaden its scope to include ideas on all topics for all functions, each with their own review process.
R&D Performance During 2017, our new product sales growth rate (for products launched within the last 5 years) slowed slightly after an initial two years of very healthy growth. By the end of 2017, we reached c. 15% from our starting position of 8% in 2014. We launched a total of 26 new products in 2017, with more than 30 new products planned for 2018 launch.
The R&D resource allocation to technology projects has steadily increased in all business units. The maturity of our NPI process means we can now monitor additional KPIs to provide a deeper level of analysis on our innovation performance so we can continue to improve and ensure that we achieve the targets we set ourselves. In 2018, we will introduce new input and output indicators for innovation to monitor our pipeline of breakthrough projects, how effi ciently we move projects through the NPI process, and how effective we are at achieving our forecasted project targets. We spend 2.0% of revenue on R&D, a signifi cantly larger proportion of sales than most of our competition and expect to deliver signifi cant benefi ts from this investment.
New Product DevelopmentEnabling Technologies, our fundamental research group, continues to pursue a range of new technology platforms. The team monitors technology trends across a broad range of industries, both inside and outside our own markets. The team looks for previously unimagined or unconventional ways to use materials and processes, fi ltering these concepts through our front-end innovation process and incubating them until they become new technology platforms. These can then be used by R&D departments across our business to foster new product or process development projects. Our NPI projects usually start from an identifi ed customer need but this front-end innovation process starts with no specifi c product or market in mind, meaning that the
new technology platforms may have applications across multiple business units, and be integrated into many different products, multiplying the value of the technology. Technology platforms that come from these unorthodox beginnings are more likely to lead to breakthrough and disruptive innovations. We have several such new technology platforms that are ready to move into the NPI process and therefore look forward to exciting prospects for these in the years ahead.
Another important group in Vesuvius’ drive for innovation is the Solutions Group. This group’s activities have become a differentiator for Vesuvius in our Steel market and an essential driver for the development of our Technical Services strategy. The team translates what we see in customer processes, either directly or through data analysis, into new solutions ranging from new designs for existing products, to new products and process control functionalities. More fundamentally, it looks at the entire customer process and all the products in use rather than just a single element, enabling the root cause of a problem to be identifi ed, rather than tackling individual symptoms.
The Solutions Group, combining its process application, modelling and metallurgical expertise, is in high demand from both the Vesuvius regional organisations and our customers because of the positive results it has demonstrated in solving complex problems.
IP portfolioThe protection of our IP is as important as its generation. In 2017, we tested, and are now ready to roll out, an enhanced audit process to measure the security of our IP across the Group starting with R&D and manufacturing locations in 2018. Our IP portfolio was reviewed in 2015 and 2016, and we continued with a stable level of fi lings in 2017 to maintain our portfolio at 156 families, 1,569 granted patents and 518 applications pending.

35
TrainingDuring 2017, we extended our training efforts to the broader Vesuvius community. To date, our project management training programme has included over 300 people, giving each an understanding of the full innovation process – covering not only their role in the process, but also providing them with the skills to function more effectively in the cross-functional teams required to deliver new product introduction. The training provided interactions with their future collaborators, identifying the good practices and operating skills necessary to drive our NPI projects to greater successes.
Training will continue with a new programme called ‘Quality in the NPI process’, specifi cally focusing on:
> Project defi nition: to ensure that projects going into the NPI process all have clear success criteria, converting the customer need/voice of the customer into SMART objectives
> Design Failure Mode and Effect Analysis (FMEA) and design of experiments: to accelerate the R&D stage of the NPI process, reducing the risk that the solutions developed and tested in the laboratory do not perform as expected in the fi eld, causing recycled developments and project delays
> Process FMEA: to ensure that our industrialisation process is effective and the product we ultimately manufacture consistently achieves the desired performance objectives as detailed in the project defi nition
Joining Up InnovationVesuvius consists of two divisions and four business units. Whilst this creates an opportunity to cross-fertilise products, services, processes and technologies, the divisional structure does not naturally facilitate the sharing of knowledge. In 2017, we launched a Technology Bridge Initiative, taking experts from the R&D department of each division, our fundamental research group and our central process development group.
The ‘bridges’ are structured around various technology themes related to materials, processes and the new technology platforms with the goal of:
> Promoting... new ideas and applications for technology
> Measuring... the evolution of technologies that are key to our industries
> Building... Technology Maps that will include internal and external information
> Constructing... a knowledge network
We launched the initiative with ten areas of focus and will gradually add new themes over time. All generated data is collated and stored in our R&D collaboration platform – TechConnect – making the sharing of information as simple as possible and avoiding duplication. The learning generated by these community practice groups will be converted into tutorial presentations to allow for dissemination throughout the technical community of Vesuvius. The ‘community of practice groups’ became the go to experts for these
specifi c topics ensuring that the resources with the most knowledge and experience in any fi eld are referenced, making for more effi cient progress of our projects.
Excellence Our innovation activities are supported by the Group Excellence programme, which allows for self-assessment against designated benchmarks. Within the R&D community, progress has already been made on the various Excellence roadmaps, not only in Innovation, but also with respect to other initiatives such as standardising the career ladder for R&D staff, developing standard job descriptions across all divisions, enhancing performance assessment, and supporting the career and personal development of our staff. Making steady progress along all the roads of the Excellence road map will ensure that the Innovation pillar of the Vesuvius strategy will continue to strengthen, maintaining a solid foundation on which we continue to build for the future.
Alan Charnock Vice President and Chief Technology Offi cer
IdeationUnderstanding our customers’ processes and the application of our products, knowing what to look for and then understanding what we see are the first essential ingredients of the creative process of ideation.
Global Research & Development centres
Barlborough UKBettsville USAEnschede NetherlandsFeignies FranceGhlin BelgiumPittsburgh USASuzhou ChinaVisakhapatnam India
Our Perform
ance
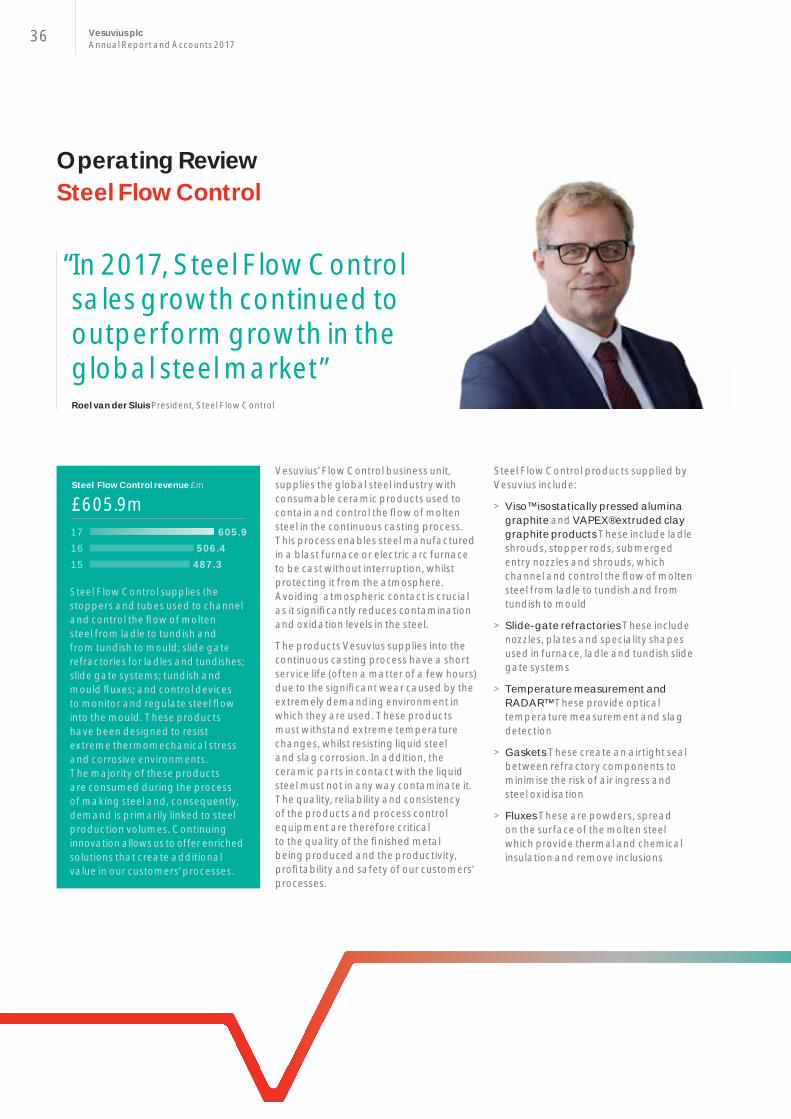
36 Vesuvius plcAnnual Report and Accounts 2017
Operating ReviewSteel Flow Control
Vesuvius’ Flow Control business unit, supplies the global steel industry with consumable ceramic products used to contain and control the fl ow of molten steel in the continuous casting process.This process enables steel manufactured in a blast furnace or electric arc furnace to be cast without interruption, whilst protecting it from the atmosphere. Avoiding atmospheric contact is crucial as it signifi cantly reduces contamination and oxidation levels in the steel.
The products Vesuvius supplies into the continuous casting process have a short service life (often a matter of a few hours) due to the signifi cant wear caused by the extremely demanding environment in which they are used. These products must withstand extreme temperature changes, whilst resisting liquid steel and slag corrosion. In addition, the ceramic parts in contact with the liquid steel must not in any way contaminate it. The quality, reliability and consistency of the products and process control equipment are therefore critical to the quality of the fi nished metal being produced and the productivity, profi tability and safety of our customers’ processes.
Steel Flow Control products supplied by Vesuvius include:
> Viso™ isostatically pressed alumina graphite and VAPEX® extruded clay graphite products These include ladle shrouds, stopper rods, submerged entry nozzles and shrouds, which channel and control the fl ow of molten steel from ladle to tundish and from tundish to mould
> Slide-gate refractories These include nozzles, plates and speciality shapes used in furnace, ladle and tundish slide gate systems
> Temperature measurement and RADAR™ These provide optical temperature measurement and slag detection
> Gaskets These create an airtight seal between refractory components to minimise the risk of air ingress and steel oxidisation
> Fluxes These are powders, spread on the surface of the molten steel which provide thermal and chemical insulation and remove inclusions
“In 2017, Steel Flow Control sales growth continued to outperform growth in the global steel market”Roel van der Sluis President, Steel Flow Control
Steel Flow Control revenue £m
£605.9m
Steel Flow Control supplies the stoppers and tubes used to channel and control the fl ow of molten steel from ladle to tundish and from tundish to mould; slide gate refractories for ladles and tundishes; slide gate systems; tundish and mould fl uxes; and control devices to monitor and regulate steel fl ow into the mould. These products have been designed to resist extreme thermomechanical stress and corrosive environments. The majority of these products are consumed during the process of making steel and, consequently, demand is primarily linked to steel production volumes. Continuing innovation allows us to offer enriched solutions that create additional value in our customers’ processes.
17 605.916 506.415 487.3

37
> Purging systems These are used to stir steel in the ladle
> Control devices These are used to monitor and regulate steel fl ow into the mould
2017 Performance Steel Flow Control sales growth has continued to outperform growth in the global steel market. In 2017, we reported revenues of £605.9m, an increase of 11.8% on an underlying basis compared with 2016. All regions outperformed underlying steel volume growth and EMEA was our fastest growing region.
Steel production in EMEA increased 4.9% in 2017, and Vesuvius outperformed the market with underlying revenue up 17.5% to £240.1m, refl ecting market share gains.
During 2017, we experienced very strong growth of our Flow Control sales in EMEA, which temporarily exceeded the capacity of our manufacturing plants in the region, requiring the import of products from our facilities in Asia and NAFTA, incurring additional freight, export duty and overtime costs. Measures were immediately taken to increase the capacity of the Flow Control EMEA plants and this ramp-up is now complete, substituting imports from non-EMEA plants.
In the Americas, Steel Flow Control’s underlying revenues increased 8.8% to £201.7m in 2017, against a 5.9% increase in steel production volumes. Our outperformance relative to steel production was due to market share gains in North America. In the US in particular, our market share is continuing to recover from the low point of the second half of 2015 when we were impacted by customer closures and volume losses due to market pricing pressure.
Our Perform
ance
“Our teams worked together to provide a solution for the customer utilising the fi rst worldwide application of new patented sealing technology”Andrew Morrison and Linna Sun, heads of NAFTA and Asia VISO Development teams
The ChallengeA large integrated steel producer in NAFTA resolved to convert most of their production to Vesuvius’ Flex Cold Start™ Tundish Shroud , which channels the fl ow of steel into the fi nal mould for solidifi cation. The cold-start technology eliminates the need for preheat, increasing the safety of the tube changing process, and reducing energy consumption. However, as cold start tubes require additional time to expand after production starts to form an airtight seal at the joint of the tundish and the tube to prevent air contamination, a preheat would still have been required for some specifi c automotive steel grades to improve sealing times.
Our SolutionDale Bower, leading the local NAFTA sales team, challenged the VISO
Global Development team to provide a solution. Andrew Morrison and Linna Sun, the heads of the NAFTA and Asia VISO Development teams respectively, collaborated in the development of an innovation born in our R&D centre in Suzhou, China: the combination of an intumescent coating and an integral groove sealant which provides a quicker gas tight seal by expanding many multiples of its original thickness on commencement, and for the duration, of service.
The Benefi ts This combination of the coating and groove sealant allows the customer to reliably use the cold start piece for higher steel grades. The new patented technology creates a tight seal within one minute of service commencement, resulting in immediate reduction in steel re-oxidation, reduced steel fi nishing, and overall improved steel quality.
ative to steel arket share n the US in are is m the low
of 2015 by customer es due to

38 Vesuvius plcAnnual Report and Accounts 2017
Underlying revenue increased by 7.8% in Asia-Pacifi c in 2017 to £164.1m, compared to a 5.7% increase in steel production volume in the region. Revenues increased faster than the steel market in the key regional markets of China, India and South Korea.
The benefi ts of the restructuring programme implemented during 2016 and 2017 started to deliver a positive impact on the fi nancial performance of the business unit.
Strategic Highlights from the YearFollowing the success of the manufacturing rationalisation programme in EMEA, a similar initiative was launched for the NAFTA region, where through a combination of improving effi ciency and adapting production volumes between plants, improvements in cost base have been made. We will continue to pursue this effort in 2018 in order to deliver further benefi ts.
We are now translating this methodology to new territories, through which we expect to drive further cost improvements. The additional projects identifi ed include a focus on industrial effi ciencies in Brazil and India.
In addition to these wider initiatives, we targeted process improvements aimed at increasing the output in specifi c areas, such as in our mix plant in China. Optimisation work performed here has allowed us to simplify our supply chain, make it more cost-effi cient and create capacity to absorb growth.
Over the last few years, Vesuvius has invested in developing robotics solutions which improve the safety and consistency of our customers’ operations while supporting our sales. Our unique value proposition is the result of the integration of specifi c refractory, system and robotic design - three core competencies inside Vesuvius. Several steel makers have been pioneers in adopting this technology,
delivering process effi ciency and removing personnel from the harsh environment around the caster. In 2017, we saw an increase in demand for robotics solutions and received orders to convert steel plants in South Korea, South America and Europe. This positions Vesuvius well to support our customers in facing the future challenges of automation and a greater focus on quality.
In 2017, we also further developed our capabilities in data capture and continuous temperature measurement. Our investment in, and exclusive distribution agreement with Sapotech Oy, a Finnish technology company offering optical defect detection services and real-time data on steel surface quality, now places us well to address the requirements for data management at our customers. From the start of 2018, this business is being managed within the Steel Flow Control business unit.
Our R&D efforts also delivered new products to support the growth in the ladle slide-gate business with the introduction of our next generation slide-gate mechanism, which is robot-ready and uses optimised refractory plates creating value for our customers in terms of ergonomics, safety and reliability while reducing their operating cost. In addition, we launched our new Flex Cold Start™ Tundish Shroud, which allows customers to operate their casters with more fl exibility in terms of sequence length and daily operation as well as
reducing their waste and cost. As shown in the case study on page 37, we have also developed complementary technology to allow for the use of this product in higher grade steel production.
We continued to develop our service offering helping our customers to understand better their mould fl ow pattern. This is a key element in the casting process, as it is the last step between liquid and solid steel. This audit service is carried out by our process experts using specifi cally designed tools and software to measure fl ow pattern through monitoring temperature, mould level and meniscus velocity. We can then compare this with the data generated from our Computational Fluid Dynamic simulation capabilities. Comparing the data allows us to recommend improved solutions to our customers. More details on the work of our Solutions Group are contained in the Innovation Section on pages 32 to 35.
Looking AheadIt is our expectation that, despite the relatively high growth achieved in 2017 and a broadly positive outlook for 2018, steel production in the mature economies of Europe and North America will not exhibit material growth in the medium/long term, given that the nature of economic growth requires less steel than in the past. This is a key driver behind the efforts to adapt our manufacturing footprint and overhead structure in the mature markets.
Operating Review continuedSteel Flow Control
An SEM 3085 tube changer, for the robotic tube changing process
The glowing VISO sub-entry nozzle channels molten steel into the mould

39
China is the world’s largest producer of steel, accounting for approximately 50% of global production. The adjustment of the Chinese steel industry from producing ‘long’ steel for infrastructure to producing ‘fl at’ steel, typically used for consumer products and automotives, is highly benefi cial for Vesuvius. Flat steel typically uses three times as much Vesuvius products by value and as a result we believe the accessible market for Vesuvius’ Flow Control business in China could grow signifi cantly in the long term.
Furthermore, China’s Government is focused on a comprehensive upgrade of Chinese manufacturing, making it innovation-driven, emphasising quality over quantity and achieving ‘green’ development though ‘Made in China 2025’. This trend towards higher quality industrial manufacturing is benefi cial to Vesuvius’ steel division. Our current strong position in this market will help us to benefi t from these trends.
India is another key growth market and one where we enjoy high penetration rates. It was one of the fastest growing steel markets in 2017 and closely tied to the Government’s economic development plans is the target to increase steel capacity to 300 million tonnes per annum by 2030, versus a production level in 2017 of c.101 million tonnes. As a result, Vesuvius also considers that this market presents an opportunity for Vesuvius to grow sales by a factor of approximately three times in the long term.
We also remain optimistic about the outlook for future steel production growth in countries such as Brazil, Mexico, Turkey, the Middle East, Russia and Vietnam.
Roel van der Sluis President, Steel Flow Control
Our Perform
ance
Effi cient technology transfer improves customer production reliability and reduces costJoe Gu, Production Manager of Slide Gate Refractories and Purge Plugs, North Asia
The ChallengeThe Castrip® process is a recent technology developed to directly cast steel in a thin strip. This enables the production of steel coils with less energy consumption and a reduced production cost compared with the conventional process which requires hot rolling after casting to reduce slab thickness.
For this technology, Vesuvius has developed specifi c technology for core refractory materials and designs, as well as associated know-how on operational best practices from our experience at sites running this technology in NAFTA. Recently, Castrip® machines were installed at a Chinese steel producer, who required local refractory sourcing.
Our Solution A Transfer of Technology team was formed inside Vesuvius before the fi rst Castrip® machine commenced production in China. Joe Gu was appointed as the Chinese team leader for this project, which drew experts from the product lines of Advanced Refractories, VISO and Systems, the design and manufacturing teams, and the local sales team. He and his team identifi ed a solid benchmark based on Vesuvius’ experience in NAFTA,
visiting Vesuvius R&D sites and manufacturing plants, and also steel producers using the technology. Once suffi cient information had been gathered, the Chinese teams were trained on how to support the new Chinese customers, covering refractory design and manufacturing, and on-site operational support.
The Benefi tsWith local production and support capabilities, we secured an important contract, offering the fi rst Chinese user of the Castrip® process the shortest delivery time at the best price, while maintaining the original product quality developed in NAFTA. The Chinese and NAFTA teams continue to share the expertise gained on this process to allow for a continuous improvement of the refractory parts.
was he ced s eader rts
ced, the
ms, and team sed
TA,

40 Vesuvius plcAnnual Report and Accounts 2017
Operating ReviewAdvanced Refractories
Advanced Refractories revenue £m
£499.1m
Advanced Refractories produces specialised refractory materials for lining steelmaking vessels such as blast furnaces, ladles and tundishes, which are subject to extreme temperatures, corrosion and abrasion. These materials are in the form of powder mixes, which are spray-applied or cast onto the vessel to be lined (‘monolithics’) and refractory shapes (e.g. bricks, pads and dams). Vesuvius is one of the world’s largest manufacturers of monolithic refractory linings. Advanced Refractories delivers installation technologies, products adapted to fi t customers’ specifi c processes and plants, and effective and effi cient logistics services. These factors are combined with signifi cant R&D, a deep knowledge of customers’ processes and project management capability to deliver market-leading solutions for our customers.
Customers of Advanced Refractories are principally steel producers and manufacturers of steel production equipment. Our products accompany the steel-making process from the early steps of the process all the way downstream to the fi nishing end in the rolling mill. This array of heat-intensive production processes and physical transformation of the iron ore into semi-fi nished products, accounts for two thirds of the revenue of the business unit. In addition, Vesuvius’ Advanced Refractories business services other high-temperature industries such as primary aluminium, copper, cement, petrochemicals and energy from waste. These refractory lining materials are supplied in the form of powder mixes, which are spray-applied or cast onto the vessels to be lined (‘monolithics’), or in pre-cast shapes and bricks.
An integral part of our success depends upon the level of collaboration with our customers. Our experts’ presence at our customers’ facilities allows us a fundamental understanding of their needs. The level of trust our business model creates makes it more resilient to market cycles enabling us to generate growth by adding new products and services throughout the business cycle.
17 499.116 398.815 378.7
The service life of the products Advanced Refractories supplies into the steel making process can vary (some a matter of hours and others for a period of years) based upon the type of refractory and the level of wear caused by the demanding environment in which they are used.
Advanced Refractories’ key products are:
> Blast furnace casthouse applications These are special refractories used to line the blast furnace and a network of runners to transfer molten iron from torpedo ladles to the melt shop for further processing into steel
> Blast furnace tap hole clay This is a refractory mass used to plug the tapping hole in a blast furnace. When molten iron is ready to be extracted from the blast furnace, a drilling machine perforates a hole through the solidifi ed clay to start the tapping process
> Steel ladle applications These are refractories (typically bricks) used to line a steel vessel which contains the molten metal and transports it from the furnace to a casting machine
“Our outperformance of steel production volume growth was supported by increased customer interest in our value-creating solutions”Tanmay Ganguly President, Advanced Refractories

41O
ur Performance
“Vesuvius has supported and rewarded my professional development”Andy Toner, Director of Marketing and Technology for Iron and Steel , NAFTA
My career at Vesuvius began in 2008, when I joined as a Service Technician, responsible for the preparation of tundishes at Gerdau’s steel manufacturing plant at Midlothian, Texas, in the United States. As a result of my work there, I was offered the opportunity to become the Application Specialist for Brick Products, based at our site at Pittsburgh, United States, but also working in steel manufacturing plants across America. I then moved on to work as an Application Specialist for Ladles, with a focus on ladle bottoms, working with customers in their steel mills to ensure that they were deriving the maximum benefi t from our products.
Two years after that, I was promoted to Product Manager for the Ladle Program and in 2014, I moved to become the Marketing Manager for our Advanced Refractory business not only for ladles, but also for the basic oxygen furnaces and electric arc furnaces operated by our steel manufacturing customers. In 2016, I became Regional Manager for the East Region USA in Steel Applications and fi nally in 2017, I was named Director of Marketing and Technology for Iron and Steel, NAFTA. In this role, I am responsible for the expansion of our product portfolio and the technical product development to support this growth across the entire NAFTA region.
At Vesuvius I have been supported , challenged and rewarded in the development of my professional and technical expertise. I have been given the opportunity to work in different areas of the business thereby broadening my experience and my career opportunities.

42 Vesuvius plcAnnual Report and Accounts 2017
Operating Review continuedAdvanced Refractories
Integrated material supply, robotic installation equipment and laser scanning for Electric Arc Furnace maintenanceThe ChallengeVesuvius has a historically well- established business in Electric Arc Furnace maintenance, using entirely manual application techniques. An ongoing dialogue with the customer identifi ed some key improvement opportunities. These improvements were centred around three main drivers: (1) the application of the material; (2) the accurate assessment of the condition of the active lining in service; and (3) safety for the operation and application teams.
Our Solution Working with established partner companies and cross-functional expertise, the Vesuvius team developed an optimised design for a Robotic Application unit for the customer’s furnaces. These units
were specifi cally constructed to suit the individual plant confi guration. Using the latest laser scanner devices from our subsidiary Process Metrix to identify the areas of the furnace lining that required repair, we achieved accurate, targeted and safe material placement.
The Benefi tsThe ability to safely repair refractory lining in a hot and diffi cult environment was a key demand. The robot arm and laser scanner signifi cantly improve the safe working conditions for the plant operations. The integration of the robot and laser equipment also enables more accurate gunning of refractory material in the areas where it is most required. This delivers better performance and improved material consumption rates for the customer.
> Steel tundish monolithics These are powder-mix refractories used to line the tundish, which receives molten steel from the ladle then acts as a reservoir to control the fl ow of the liquid metal and feed the continuous casting machine at the required rate
> Aluminium applications These products are used for secondary aluminium production, and are mostly used in furnace lining
> Cement applications Monolithic technology used in the pre-heater stage before materials are transferred into the rotary kiln during the continuous calcination process for cement making
2017 Performance Advanced Refractories reported revenues of £499.1m in 2017, an increase of 25.2% compared to 2016. On an underlying basis, the year-on-year increase was 17.4%. This outperformance relative to steel volume growth was supported by increased customer interest in our value-creating solutions and the successful launch of new products such as our Supergard™ Tundish refractory line, which is a patented tundish lining product for improving steel quality. We also benefi ted from customers seeking to diversify their supplier base in response to recent consolidation.
We achieved attractive underlying revenue growth in each of our key regions in 2017, with the Americas up 8.6%, EMEA up 28.4% and Asia-Pacifi c up 9.4%. The particularly high growth level in EMEA was due to signifi cant progress regaining market share in Europe despite competitive market conditions.
Some of the key raw materials used by Advanced Refractories experienced signifi cant price increases in 2017, particularly during the second half of the year. The speed of these increases was such that there was a time lag in recovering the increased costs through the sales price of our fi nished products,

43O
ur Performance
as we were bound by contractual obligations with some customers. We have made major progress in recovering this cost infl ation through higher selling prices. This process of price adjustment will continue into 2018, until realised cost increases have been fully recovered. This confi rms our ability to recover raw material cost infl ation through price rises over time.
Strategic Highlights from the YearThe addition of new customers in Europe in the melting and refi ning segment was a signifi cant contributor to our growth in 2017. This was also boosted by a positive volume growth in the steel industry in Europe.
An increased focus on value-added solutions in niche segments like steel fi nishing also allowed us to achieve good momentum during the period.
We continuously review and seek to improve our manufacturing effi ciency, with targeted capital investment delivering signifi cant benefi ts in process fl ow, inventory management and labour and energy effi ciency. In Brazil, we rationalised our manufacturing footprint and maximised capacity utilisation by relocating our Brazilian manufacturing facilities to Rio de Janeiro from Sao Paulo in 2017.
We also commenced a cost effi ciency study in Europe to review our manufacturing footprint as part of our wider focus on cost effi ciency. We are initiating a similar exercise in 2018 at our facilities in the NAFTA region.
Our business model is underpinned by our focus on value-creating solutions and maintaining technological leadership from investment in R&D. We improved our R&D footprint in 2017 with the inauguration of our newest R&D facility in Visakhapatnam, India. The addition of this state-of-the- art facility will allow us to complement our existing technical capabilities and tackle specifi c problems in the local market. Our investment in this new facility is proof of our commitment to staying at the forefront of new technology. Our existing R&D centres are well positioned to support our existing markets whilst this new facility is the next building block to support our future growth in developing markets.
Looking AheadAs 70% of Advanced Refractories’ revenue comes from the steel making industry, steel production is a key driver for the business. In mature economies, it is our expectation that these regions will not exhibit material growth in the medium/ long term, given that the nature of economic growth requires less steel than in the past. However, as growth in emerging markets moves forward and our business in mature markets continues to evolve, we are constantly developing our resource base to align with activity levels.
In the developed markets of Europe and North America, we are experiencing a greater demand for higher quality refractories. In response to recent consolidation, we are also seeing increased interest in certain segments, such as bricks, as customers in these regions seek to diversify their supplier base as well as market evolution towards other technologies like monolithic refractories. We expect this to continue going forward.
Improving the profi tability of Advanced Refractories is a key area of focus. Market share, whilst important, is not the main driver of our strategy as there is signifi cant fragmentation both on a global and regional basis in our area of the refractory supply business. Achieving consolidation at the expense of margins will not meet our goals for value creation. In the developing markets of India, China and Brazil, our focus is to capture or exceed the growth rate of the industry.
Our long-standing presence and local manufacturing capabilities position us well to take advantage of future growth opportunities in India. Solidifying our presence with the installation of our newest R&D facility in India is a strong step forward. As the country continues demanding more technology with the evolution of the market, we are well positioned to maintain our leadership position in the segments we currently operate in, whilst at the same time, look at new avenues for growth.
Tanmay Ganguly President, Advanced Refractories
Precast Monolithic Steel Ladle Bottom
Manufactured in Chicago Heights, USA

44 Vesuvius plcAnnual Report and Accounts 2017
Operating ReviewDigital Services
Digital Services revenue £m
£43.7m
Digital Services offers digitalised solutions to our customers to make their underlying processes more effi cient and reliable. Digital Services complements existing product lines by providing new services to our existing customers. Digital Services focuses on the capture and interpretation of key manufacturing data, complementing Vesuvius’ strong presence and expertise in molten metal engineering to create new technologies and integrate them into expert process management systems.
There are two key elements of Vesuvius’ Technical Services strategy: fi rstly, the Digital Services business unit, which focuses on incubating our data capture technologies, and, secondly, the other business units which play a critical role in integrating these products into our broader consumables offering as well as ensuring customer access. In this way, our Technical Services strategy is embedded in the activities of both our Steel and Foundry divisions which can work both with and independently of our Digital Services business.
Our digital services products assist our customers to meet the increasing end product consistency and quality requirements - enabling them to capture and analyse large quantities of production data and harness them to deliver reliable and auditable process and product improvements.
Key ProductsOur business focuses on providing solutions that enhance the control and monitoring of our customers’ production processes. During 2017, the business unit comprised four key product lines:
> Disposable sensors and probes These measure a variety of liquid metal characteristics, which are mostly used in the primary and secondary steel-making stages.Current solutions include temperature, oxygen, hydrogen, iron oxide and aluminium measurements as well as metal sampling at all production stages of steelmaking and casting
17 43.716 36.915 31.7
> Laser technology Technology used for measuring the wear of refractory materials in furnaces and ladles. This is an important area of focus as the market moves towards the use of ladle fl eets
> Continuous temperature measurement This provides real-time continuous temperature data in the tundish. This allows customers to better understand temperature correlations with steel quality, reduce energy costs and optimise caster speed. Current solutions include Accuoptix ™, Accucone ™, and the Accumetrix® continuous temperature measurement systems
> Mould level sensors and control systems These are critical to ensure the stable, controlled fl ow of metal during the casting process and have a signifi cant impact on slab quality.In addition, mould audit services, using our unique XMAT™ device, in combination with computerised fl ow modelling, provide our Steel customers with an ‘expert eye’ inside the mould, allowing them to gain an intimate understanding of liquid behaviour as steel is cast
By using each of these technologies, customers can focus on critical parameters within their processes, enabling them to refi ne their production methods to improve quality, lower production costs and maximise effi ciency. The information derived from these measurements can be included as a consulting service and used as support for improvements in refractory solutions.
“We are creating new offerings to participate in the digitalisation of our customers’ processes”Alexander Laugier-Werth President, Digital Services

45O
ur Performance
2017 Performance Digital Services generated revenues of £43.7m in 2017, an increase of 18.4% year-on-year on a reported basis. On an underlying basis, revenues increased 8.9%. This refl ected market share gains in North America and India, and the signifi cant success we experienced in South America as a result of increased penetration of our sensors and probes business.
In our Process Metrix lasers business, we had a record year of sales with shipments up over 50% versus 2016. Avemis, our mould level sensors and continuous temperature measurement products, also had a strong year with revenues up c.30%.
Strategic Highlights from the YearIn December 2017, we fi nalised a strategic investment in Sapotech Oy, a Finnish technology company developing optical defect detection services in the steel continuous casting process. This investment will be managed by the Flow Control business unit.
We continued to integrate the Digital Services companies, ECIL Met Tec and Sidermes into the existing Group sales networks. This enabled the businesses to access the wider footprint of the Vesuvius customer base. As a result, we made signifi cant product performance improvements in key lines such as probes for measuring hydrogen and oxygen.
We also initiated restructuring actions to optimise our cost base and manufacturing footprint, and to reduce operating costs.
We introduced a number of new features in laser technology in 2017 through completely revamped software and the Two Colour Pyrometer, which combines dimensional measurements with our most accurate surface temperature measurements to date.
Our focus on increasing sales in the continuous temperature measurement space began to drive sales volumes and profi ts in this area and we expect this to continue in the years ahead.
Looking aheadThe development of a digital offering for our customers, complementary to our consumables offering, remains a fundamental priority of our Group strategy. To ensure that we continue to maximise the opportunities to leverage our existing customer relationships to expand this area of business, the ongoing support of our Flow Control and Advanced Refractories business units is critical. Flow Control’s involvement is focused on developing value-added services around the tundish and the mould in the continuous casting part of the steel process. SERT, Avemis and the new investment in Sapotech Oy are key to these efforts. For Advanced Refractories, laser technology business Process Metrix has a key role to play in the development of its technical services offering.
Going forward we are optimising our manufacturing footprint for sensors and probes with the closure of a site in France and in Germany. To reduce operating costs further, we have initiated an investment programme to automate the manufacturing process.
We will continue to review acquisition opportunities for additional technological solutions to complement our existing customer offerings, focused on data gathering and information analysis to provide customers with the information they need to deliver process improvements. The amount of data generated by sensors is growing exponentially, so allied with this approach, we intend to focus on solutions for converting this data into valuable decision support information, maximising the value our various sensor technologies bring to customers.
Alexander Laugier-Werth President, Digital Services
Shaping of a thermocouple quartz tube

46 Vesuvius plcAnnual Report and Accounts 2017
Operating ReviewFoundry
“Our growth in 2017 was achieved through developing our business in China, gains in our established markets and new product launches”Glenn Cowie President, Foundry
Foundry revenue £m
£535.2m
Vesuvius’ Foundry Division, trading as Foseco, is a world leader in the supply of consumable products, solutions and associated services related to the foundry industry. The foundry process is highly sequential and is critically dependent on consistency of product quality and productivity optimisation. The Foundry Division’s products, solutions and use of advanced computer simulation techniques allow foundries to reduce defects and hence reduce labour intensive fettling and machining, minimise metal usage requirements, infl uence the metal solidifi cation process and automate moulding and casting, thus reducing cost, energy usage and mould size. The conditioning of molten metal, the nature of the mould used and, especially, the design of the way metal fl ows into the mould are key parameters in a foundry, determining both the quality of the fi nished castings and the labour, energy and metal usage effi ciency of the foundry. Vesuvius’ products and associated services to foundries improve these parameters.
The Foundry Division supplies ceramic consumables, such as fi lters and feeding systems, and chemical coatings and binders to foundries which use these products in the production of metal castings. Working alongside customers at their sites, our engineers provide on-site technical expertise in addition to simulation software to develop the best individualised solutions. Each of our products typically represents a small element of the overall cost of the foundry processes but contributes signifi cantly to product quality and yield.
We support our customer offering with the ‘Foseco University’, an online library of expertise in foundry practice which demonstrates our expertise and provides technical support to our engineers and customers across the globe.
Key ProductsFoseco’s key products are:
> Binders These are used to prepare the sand moulds and cores, the quality of which improves the precision and surface fi nish of the fi nal casting
> Coatings These are designed to protect both sand and permanent moulds from the effects of being fi lled with liquid metal. This is especially important on cores, where liquid metal may cover up to three sides of the sand
17 535.216 459.415 424.4
> Filtration Our fi ltration products remove impurities from the liquid metal before it enters the mould and reduce turbulence during pouring
> Feeding Systems Our specifi cally-shaped insulating and exothermic feeding systems allow for the effi cient supply of molten metal to key areas of complex or large castings, and prevent liquid shrinkage defects in the fi nished casting, improving yields and productivity by reducing the amount of molten metal required per casting. Our exothermic feeding aids also provide a secondary heat source which can also control metal cooling, minimising the adverse effects of shrinkage during solidifi cation
> Crucibles These are used in a wide range of melting and holding applications for non-ferrous alloys, particularly aluminium, copper and zinc. Each of these applications requires a crucible with specifi c properties to maximise productivity and minimise energy costs
> Other products These include innoculants used for ferrous and non-ferrous castings; fl ux degassing equipment for removing unwanted gas in liquid aluminium; and refractory materials used for the transportation of liquid metal

47O
ur Performance2017 Performance
There was positive momentum in the majority of Foundry end markets during 2017, with particular strength in heavy trucks and a recovery in mining equipment as well as construction and agricultural equipment after several years of weakness.
Revenue in the Foundry Division increased 16.5% to £535.2m in 2017 on a reported basis, whilst underlying revenue increased by 9.3%. Trading profi t improved by 12.0% on an underlying basis. Our 2017 performance benefi ted materially from our commitment to technological leadership through investment in R&D, which resulted in 13 new product launches during the year, the highest on record. These new product launches supported double-digit revenue growth across Foundry’s highest margin product lines – feeding systems, fi lters and coatings. Trading profi t also benefited from the ongoing organisational restructuring in North America, which commenced in 2016 and is focused on developing a fl atter, leaner structure.
In the Americas, underlying revenue increased 11.2% despite weakness in the light vehicle and rail sectors in North America and the closure of a number of customer plants in the steel foundry sector. This was offset by growth in heavy trucks as well as increases in iron casting output related to construction and agricultural equipment. We were successful in gaining market share as a result of new product introductions and we experienced signifi cant success in
Brazil growing our feeding systems, fi lters and non-ferrous metal treatment revenues.
Underlying revenue in EMEA increased 8.8% year-on-year as a result of growth across the majority of foundry end markets with particular strength in heavy trucks as well as high growth in the non-ferrous market. We were also successful in gaining market share as a result of new product introductions.
In Asia-Pacifi c, underlying revenue increased by 8.8%, with sales increasing in all major markets. Our revenues in China were up c.13%, due to booming demand in heavy truck production as well as our tangible progress in developing a strong local sales force and marketing organisation. In India, our revenues were up c.5%, benefi ting from growth in light vehicle production as well as strength in construction and agricultural equipment, and mining equipment. Our revenue growth in India could potentially have been higher, had it not been for high raw material costs and supply issues as well as an increased focus by Foseco on customer payment terms.
Strategic Highlights from the YearThe organisational restructuring in North America, which commenced in 2016, continued through the year with a focus on developing a fl atter, leaner structure. We also focused on improved succession planning with several key new employees joining during the year. Each of these initiatives saw a focus on improving
organisational culture and accountability, which has allowed us to move decision-making closer to the customer and improve our speed of doing business. We continued our efforts to rationalise our manufacturing footprint and maximise capacity utilisation with the closure of the Cleveland fi lter plant and Conneaut shank production. We also continued to focus on the implementation of Lean principles and improvement in our support and planning systems for operations.
In addition, we have initiated a cost effi ciency study at our facilities in Borken and Grossalmerode in Germany as part of our wider focus on cost effi ciency.
The investment in our world-class R&D facility in Enschede, The Netherlands, continues to generate new products. In 2017, New Product sales as a percentage of Foundry sales reached 10%.
To drive penetration into Japanese foundries in ASEAN, we appointed a Japanese business development manager in Thailand and also refocused our efforts on our business in Vietnam.
A new fi lter production line was launched in India and is expected to be completed by Q3 2018. The availability of a local fi lter source will improve customer service levels and support increased market penetration.
In China, the focus remains on further developing the local sales and marketing organisation and growing market share in our major product segments, mainly coatings, fi lters and feeding systems.
Our R&D facility in Enschede, Netherlands
Foseco offers a wide range of foundry products and services to meet the requirements of iron, steel and non ferrous foundries to help them to reduce defects, improve casting quality and optimise production costs.

48 Vesuvius plcAnnual Report and Accounts 2017
Looking AheadThe potential revenue per customer and per tonne of castings produced is strongly infl uenced by the technical sophistication of the customer, the end-market for the casting, and the processes used in its production. These factors tend to correlate with the level of industrial development within a given market. Therefore, we see signifi cant growth potential in markets where industrial development continues to gather momentum, particularly certain parts of Eastern Europe and Asia. To position Foseco to benefi t from this trend we are expanding our network of technical sales staff and application engineers within developing markets, ensuring that customers there have local access to the same high levels of expertise and technical support in all markets.
In Europe, we expect modest growth in the Foundry market for the next few years, with an improving outlook for growth in the steel foundry segment mainly due to growth in the construction and mining industries. Consolidation of the Foundry industry continues, reducing the gap between capacity on offer and real demand. We anticipate that plant closures and mergers and acquisitions will continue in the industry, as will the trend to transfer production from western countries to Eastern Europe and Turkey. Cheaper labour and energy costs, together with the availability of technical skills, remain key for the future development of the industrial footprint in these developing markets. In the automotive industry, the trend to develop lighter vehicles is pushing further growth of aluminium castings, increasing volumes in the non-ferrous foundry segment.
The foundry market in Mexico continues to see rapid growth, with foreign investment from Asia, Europe, and the US in new foundry facilities and the ongoing expansion of existing facilities. We are positioning ourselves to benefi t from this growth with a new manufacturing site in Monterrey. The market recovery in mining, agriculture and construction that started in 2017 is expected to accelerate in 2018 for both NAFTA and South America.
Further growth is also anticipated in India and South East Asia, with increasing quality requirements expected to drive increased penetration of Foseco’s feeding systems, fi ltration, coatings, and non-ferrous product lines.
Glenn Cowie President, Foundry
Operating Review continuedFoundry
Consistent application of coatings through automated density controlThe ChallengeWhen manufacturing a casting, applying the correct thickness of mould coating is critical in providing a protective barrier between the liquid metal and the core or mould surface. A challenge for all foundries is to ensure that coating is applied correctly. In a recent review we identifi ed one major problem - the coating is often diluted manually and its density is checked only periodically during a shift. Inevitably, this can lead to variations in performance, as coating that is too thick can compromise dimensional accuracy and gas permeability and coating that is too thin can fail to prevent steel penetration into the mould sand and can result in surface defects on the casting.
Our Solution The development team investigated potential solutions, but realised that available technology would either adversely affect the mixing of the coating or used delicate pipes and pumps that were impractical requiring extra cleaning and maintenance (and therefore potential production downtime). Working with a third-party engineering unit we developed a new design that did not impact the mixing process and provides very accurate continuous density and level measurement with no moving parts.
The Benefi tsThe Intelligent Coating Unit (ICU) helps our customers achieve better and more consistent casting results, by ensuring that at all points in the production cycle,
coating products are diluted to their optimum application density on a continuous basis. This signifi cantly reduces the risk of defects in the fi nished casting, reduces scrapped casting and lowers cleaning costs. The ICU also continuously records the application density data providing an audit trail for use in process optimisation and quality reviews.

49O
ur Performance
“Vesuvius has invested in my future”Kerstin Berndt, Product Manager, Germany
See more about Vesuvius careers in People and Community on pages 67-73
rformance
See more about Vesuvius careers in People and Community onpages 67-73
I started working in the Foundry Division of Vesuvius GmbH in 2006, following an apprenticeship as a chemical-technical assistant. I spent my fi rst two and a half years working in the SGI Organisation, covering international projects, including the development of data for the Coveral ® MTS 1582, which is now a leading product in the fi eld of Non-Ferrous Metal Treatment.
I was then moved to the R&D department, during which time I obtained two degrees: as a state-certifi ed technician and as a training supervisor through the German Chamber of Industry and Commerce.
Since 2015, I have worked as a Local Product Manager for non-ferrous metal treatment and am the customer contact for our Foundry Division’s chemical production lines in Germany, Austria, Switzerland and the Netherlands.
My time at Vesuvius has enabled me to gain important academic and professional qualifi cations, whilst at the same time receiving critical on-the-job technical experience. Whilst doing this, I have developed a considerable international network, working on a daily basis with Vesuvius colleagues in different countries.
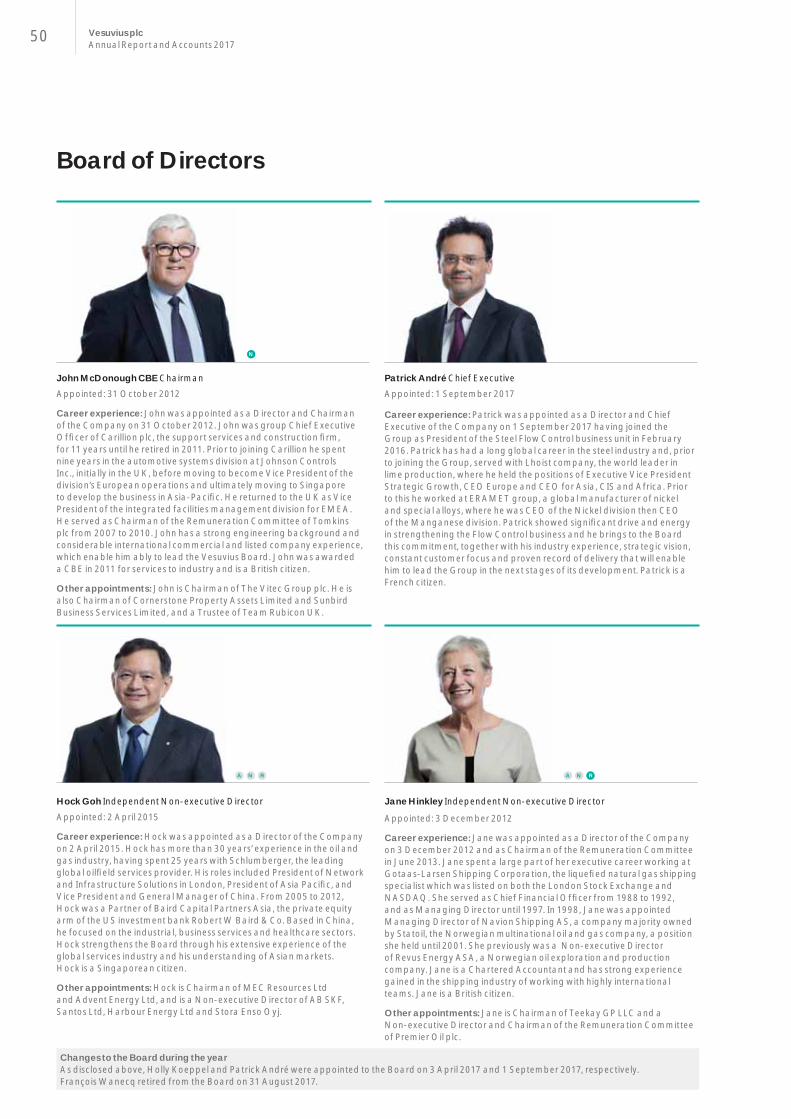
50 Vesuvius plcAnnual Report and Accounts 2017
Board of Directors
Hock Goh Independent Non-executive Director Appointed: 2 April 2015
Career experience: Hock was appointed as a Director of the Company on 2 April 2015. Hock has more than 30 years’ experience in the oil and gas industry, having spent 25 years with Schlumberger, the leading global oilfi eld services provider. His roles included President of Network and Infrastructure Solutions in London, President of Asia Pacifi c, and Vice President and General Manager of China. From 2005 to 2012, Hock was a Partner of Baird Capital Partners Asia, the private equity arm of the US investment bank Robert W Baird & Co. Based in China, he focused on the industrial, business services and healthcare sectors. Hock strengthens the Board through his extensive experience of the global services industry and his understanding of Asian markets. Hock is a Singaporean citizen.
Other appointments: Hock is Chairman of MEC Resources Ltd and Advent Energy Ltd, and is a Non-executive Director of AB SKF, Santos Ltd, Harbour Energy Ltd and Stora Enso Oyj.
Jane Hinkley Independent Non-executive Director
Appointed: 3 December 2012
Career experience: Jane was appointed as a Director of the Company on 3 December 2012 and as Chairman of the Remuneration Committee in June 2013. Jane spent a large part of her executive career working at Gotaas-Larsen Shipping Corporation, the liquefi ed natural gas shipping specialist which was listed on both the London Stock Exchange and NASDAQ. She served as Chief Financial Offi cer from 1988 to 1992, and as Managing Director until 1997. In 1998, Jane was appointed Managing Director of Navion Shipping AS, a company majority owned by Statoil, the Norwegian multinational oil and gas company, a position she held until 2001. She previously was a Non-executive Director of Revus Energy ASA, a Norwegian oil exploration and production company. Jane is a Chartered Accountant and has strong experience gained in the shipping industry of working with highly international teams. Jane is a British citizen.
Other appointments: Jane is Chairman of Teekay GP LLC and a Non-executive Director and Chairman of the Remuneration Committee of Premier Oil plc.
A N R
John McDonough CBE Chairman Appointed: 31 October 2012
Career experience: John was appointed as a Director and Chairman of the Company on 31 October 2012. John was group Chief Executive Offi cer of Carillion plc, the support services and construction fi rm, for 11 years until he retired in 2011. Prior to joining Carillion he spent nine years in the automotive systems division at Johnson Controls Inc., initially in the UK, before moving to become Vice President of the division’s European operations and ultimately moving to Singapore to develop the business in Asia-Pacifi c. He returned to the UK as Vice President of the integrated facilities management division for EMEA. He served as Chairman of the Remuneration Committee of Tomkins plc from 2007 to 2010. John has a strong engineering background and considerable international commercial and listed company experience, which enable him ably to lead the Vesuvius Board. John was awarded a CBE in 2011 for services to industry and is a British citizen.
Other appointments: John is Chairman of The Vitec Group plc. He is also Chairman of Cornerstone Property Assets Limited and Sunbird Business Services Limited, and a Trustee of Team Rubicon UK.
Patrick André Chief Executive Appointed: 1 September 2017
Career experience: Patrick was appointed as a Director and Chief Executive of the Company on 1 September 2017 having joined the Group as President of the Steel Flow Control business unit in February 2016. Patrick has had a long global career in the steel industry and, prior to joining the Group, served with Lhoist company, the world leader in lime production, where he held the positions of Executive Vice President Strategic Growth, CEO Europe and CEO for Asia, CIS and Africa. Prior to this he worked at ERAMET group, a global manufacturer of nickel and special alloys, where he was CEO of the Nickel division then CEO of the Manganese division. Patrick showed signifi cant drive and energy in strengthening the Flow Control business and he brings to the Board this commitment, together with his industry experience, strategic vision, constant customer focus and proven record of delivery that will enable him to lead the Group in the next stages of its development. Patrick is a French citizen.
N
A N R
Changes to the Board during the yearAs disclosed above, Holly Koeppel and Patrick André were appointed to the Board on 3 April 2017 and 1 September 2017, respectively. François Wanecq retired from the Board on 31 August 2017.
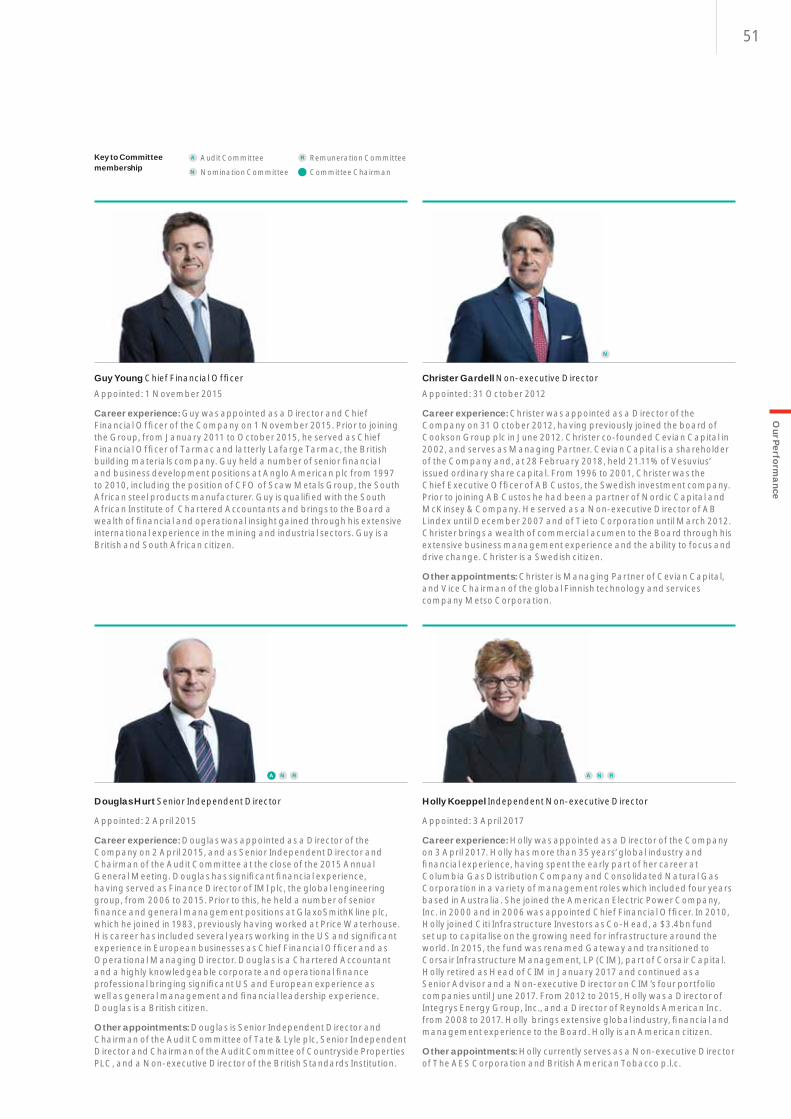
51
Douglas Hurt Senior Independent Director
Appointed: 2 April 2015
Career experience: Douglas was appointed as a Director of the Company on 2 April 2015, and as Senior Independent Director and Chairman of the Audit Committee at the close of the 2015 Annual General Meeting. Douglas has signifi cant fi nancial experience, having served as Finance Director of IMI plc, the global engineering group, from 2006 to 2015. Prior to this, he held a number of senior fi nance and general management positions at GlaxoSmithKline plc, which he joined in 1983, previously having worked at Price Waterhouse. His career has included several years working in the US and signifi cant experience in European businesses as Chief Financial Offi cer and as Operational Managing Director. Douglas is a Chartered Accountant and a highly knowledgeable corporate and operational fi nance professional bringing signifi cant US and European experience as well as general management and fi nancial leadership experience. Douglas is a British citizen.
Other appointments: Douglas is Senior Independent Director and Chairman of the Audit Committee of Tate & Lyle plc, Senior Independent Director and Chairman of the Audit Committee of Countryside Properties PLC, and a Non-executive Director of the British Standards Institution.
Holly Koeppel Independent Non-executive Director
Appointed: 3 April 2017
Career experience: Holly was appointed as a Director of the Company on 3 April 2017. Holly has more than 35 years’ global industry and fi nancial experience, having spent the early part of her career at Columbia Gas Distribution Company and Consolidated Natural Gas Corporation in a variety of management roles which included four years based in Australia. She joined the American Electric Power Company, Inc. in 2000 and in 2006 was appointed Chief Financial Offi cer. In 2010, Holly joined Citi Infrastructure Investors as Co-Head, a $3.4bn fund set up to capitalise on the growing need for infrastructure around the world. In 2015, the fund was renamed Gateway and transitioned to Corsair Infrastructure Management, LP (CIM), part of Corsair Capital. Holly retired as Head of CIM in January 2017 and continued as a Senior Advisor and a Non-executive Director on CIM’s four portfolio companies until June 2017. From 2012 to 2015, Holly was a Director of Integrys Energy Group, Inc., and a Director of Reynolds American Inc. from 2008 to 2017. Holly brings extensive global industry, fi nancial and management experience to the Board. Holly is an American citizen.
Other appointments: Holly currently serves as a Non-executive Director of The AES Corporation and British American Tobacco p.l.c.
A N R
Guy Young Chief Financial Offi cer Appointed: 1 November 2015
Career experience: Guy was appointed as a Director and Chief Financial Offi cer of the Company on 1 November 2015. Prior to joining the Group, from January 2011 to October 2015, he served as Chief Financial Offi cer of Tarmac and latterly Lafarge Tarmac, the British building materials company. Guy held a number of senior fi nancial and business development positions at Anglo American plc from 1997 to 2010, including the position of CFO of Scaw Metals Group, the South African steel products manufacturer. Guy is qualifi ed with the South African Institute of Chartered Accountants and brings to the Board a wealth of fi nancial and operational insight gained through his extensive international experience in the mining and industrial sectors. Guy is a British and South African citizen.
Christer Gardell Non-executive Director Appointed: 31 October 2012
Career experience: Christer was appointed as a Director of the Company on 31 October 2012, having previously joined the board of Cookson Group plc in June 2012. Christer co-founded Cevian Capital in 2002, and serves as Managing Partner. Cevian Capital is a shareholder of the Company and, at 28 February 2018, held 21.11% of Vesuvius’ issued ordinary share capital. From 1996 to 2001, Christer was the Chief Executive Offi cer of AB Custos, the Swedish investment company. Prior to joining AB Custos he had been a partner of Nordic Capital and McKinsey & Company. He served as a Non-executive Director of AB Lindex until December 2007 and of Tieto Corporation until March 2012. Christer brings a wealth of commercial acumen to the Board through his extensive business management experience and the ability to focus and drive change. Christer is a Swedish citizen.
Other appointments: Christer is Managing Partner of Cevian Capital, and Vice Chairman of the global Finnish technology and services company Metso Corporation.
N
Our Perform
ance
A N R
Key to Committee membership
A Audit CommitteeN Nomination Committee
R Remuneration CommitteeR Committee Chairman

52 Vesuvius plcAnnual Report and Accounts 2017
Group Executive Committee
1 Henry Knowles General Counsel & Company Secretary
Appointed September 2013 4 years with Group Based in London, UK and is a British citizen
2 Glenn Cowie President, Foundry Appointed November 2014
36 years with Group Based in Cleveland, US and is a South African and British citizen
3 Tanmay Ganguly President, Advanced Refractories
Appointed November 2014 10 years with Group Based in Barlborough, UK and is an Indian citizen
4 Guy Young Chief Financial Offi cer Appointed November 2015
2 years with GroupBased in London, UK and is a South African and British citizen
5 Roel van der Sluis President, Flow Control Appointed October 2017
27 years with Group Based in Ghlin, Belgium and is aDutch citizen
12
3 4
5

53O
ur Performance
6 Patrick Bikard President, Operations Appointed February 2014
9 years with Group Based in Ghlin, Belgium and is a French citizen
7 Alexander Laugier-Werth President, Digital Services
Appointed July 20169 years with GroupBased in Ghlin, Belgium and is a French and US citizen
8 Alan Charnock Vice President and Chief Technology Offi cer
Appointed April 2015 33 years with Group Based in Ghlin, Belgium and is a British citizen
9 Patrick André Chief Executive Appointed September 2017
2 years with Group Based in London, UK and is a French citizen
10 Ryan van der Aa Chief Human Resources Offi cer
Appointed May 2013 18 years with Group Based in London, UK and is a Dutch citizen
6
7
8
9
10
The date appointed is the date the individual was appointed to their current role.

54 Vesuvius plcAnnual Report and Accounts 2017

55O
ur Responsibility
Section Three
Our ResponsibilityIn this section56 Our Principles
60 Health and Safety
64 Sustainability
67 People and Community
Nancy HanHR GeneralistChangShu, China

56 Vesuvius plcAnnual Report and Accounts 2017
Vesuvius is a geographically and culturally diverse group, employing more than 11,000 people in 37 countries. This geographical diversity places us close to our customers across the globe, but also highlights the importance of maintaining and applying strong and consistent ethical values in our worldwide approach to business. Our employees’ engagement with our values and culture is vital to our success and the sustainable delivery of the Group’s strategy.
Vesuvius’ Values The behaviours we champion in our employees are represented by the six Vesuvius Values. They are an expression of the common culture of the Group, promoting our image to external stakeholders, and underpinning the commercial promise we provide to our customers. The Values are displayed in all our facilities and in Vesuvius offi ces at customer sites.
During 2017, we continued to engage our employees on the importance of the Vesuvius Values through the addition of a new value of ‘Excellence’. Our approach to our customers and business operations has always been to strive for Excellence, and the addition of this sixth Value reinforces our objective to integrate continuous improvement into our business approach.
Our Values are celebrated annually through the Group’s Living the Values Awards (‘LTVA’). In 2017, we came together to celebrate the outstanding individual contributions to the implementation of Vesuvius’ Values by 74 employees from 11 countries who were nominated by their peers.
See more about the Living the Values Awards in our People and Community section on p67-73
Our Values
CreativityOur commitment to technology and quality is the basis for our competitive advantage. Creativity allows us to develop innovative products and solutions and the continuous improvements that generate value through performance enhancement. Employees are actively encouraged to be innovative and to register their ideas in our newly developed Ideation database.
CooperationEncouraging internal and external cooperation enables us to create unique solutions with our partners. Through cooperation, each Vesuvius employee is committed to the success of their community of colleagues and customers and that of the wider Group.
ReliabilityOur solutions involve us in critical aspects of our customers’ manufacturing processes. Our commitment to deliver consistent products and services gives them the level of confi dence they require.
IntegrityAt the heart of our promise lies the trustworthiness of all Vesuvius employees in their acts and words. Integrity, honesty and transparency are essential in all our exchanges.
Embracing DiversityVesuvius is a global company built upona true respect for local customs and experience. We recognise and embrace the potential that comes from the coexistence of so many different cultures and of diversity in its broadest sense.
ExcellenceThis new value, introduced in 2017, represents our aim to deliver optimised performance to our customers and stakeholders, eliminating waste and striving for continuous improvement. Excellence is our attitude as we engage with our colleagues, our customers and our communities.
Our Principles
Working together as a community with shared values makes Vesuvius stronger.
Vesuvius has established a framework for explaining and delivering the culture and principles we consider to be fundamental to our sustained success:
Vesuvius’ Framework for Business Integrity
1.
Vesuvius’ Values
2.
Code of Conduct
3.
Policies and Procedures
4.
Training
5.
Monitoring and Evaluation

57
Code of Conduct Our Code of Conduct sets out the standards of conduct expected, without exception, of everyone who works for Vesuvius in any of its worldwide operations. The Code emphasises our commitment to ethics and compliance with the law, and covers every aspect of our approach to business, from the way that we engage with customers, employees, the markets, and each of our other stakeholders, to the safety of our employees and workplaces. Everyone within Vesuvius is individually accountable for upholding its requirements. We recognise that lasting business success is measured not only in our fi nancial performance, but in the way in which we deal with our customers, business associates, employees, investors and local communities. The Code of Conduct is published in our 29 major functional languages.
Policies and Procedures We continue to enhance the policies that underpin the principles set out in the Code of Conduct. These assist employees to comply with our ethical standards and the legal requirements of the jurisdictions in which we conduct our business. They also give practical guidance on how this can be achieved. Amongst these policies are:
Speak UpThe foundation of our compliance programme is the ability to speak up without fear of retaliation, either to Vesuvius management or independent of them. A third party-operated confi dential Employee Concern Helpline (Speak Up) is available for employees wishing to raise concerns anonymously or in situations where they feel unable to report internally. This independent helpline provides the ability to make reports online through a web portal, by phone or by voicemail. Ensuring global accessibility, employees can now speak with operators in any of our 29 functional languages. No individual is ever penalised or disadvantaged for reporting a legitimate concern in good faith.
Reports received via Speak Up are managed by the General Counsel, assisted by senior managers from the Legal Department and HR. All reports are investigated following a protocol for review, action, closure and feedback. For complex issues, formal investigation plans are drawn up, and support from external experts is engaged where necessary. Feedback is recognised as an important element of the Speak Up process and we aim to provide an update on all reports within 28 days of receipt.
Our Responsibility
Health, safety and the environment
Trading, customers, products and services
Anti-bribery and corruption
Employees and human rights
Disclosure and investors
Government, society and local communities
Confl icts of interest
Competitors
The Code of Conduct is available in 29 languages at www.vesuvius.com
Code of Conduct principles
Evaristo Beltran SaenzProcess Engineer, Slide Gate, Monterrey
58 Vesuvius plcAnnual Report and Accounts 2017
Anti-Bribery and Corruption and Working With Third PartiesVesuvius engages with various third-party representatives and intermediaries which can present an increased anti-bribery and corruption risk. Our procedure on working with third parties clearly outlines our zero-tolerance approach to bribery and provides practical guidance for our employees in identifying concerns and how to report them. Vesuvius engages with third-party sales agents, many of whom operate in countries where we do not have a physical presence. Our employees’ interaction with sales agents is supported by an ongoing training programme for those who have specifi c responsibility for these relationships.
Data ProtectionOur data protection policy requires a uniform approach in the handling of personal data to manage the privacy obligations of the Group. Everyone has rights in respect of how their personal data is handled. Our policy recognises that the lawful and correct treatment of personal data is vital to our continued success in an increasingly regulated global marketplace. During the course of our activities we may collect, store and process personal data about our staff, customers, suppliers and other third parties. We are committed to treating this data in an appropriate manner.
Human RightsThe Group human rights policy refl ects the principles contained within the United Nations Universal Declaration of Human Rights, the International Labour Organisation’s Fundamental Conventions on Labour Standards and the United Nations Global Compact. The policy applies to all Group employees. It sets out the principles for our actions and behaviour in conducting our business and provides guidance to those working for us on how we approach human rights issues. The Group commits not to discriminate in any of our employment practices and to offer equal opportunities to all. The Group respects the principles of freedom of association and the effective recognition of the right to collective bargaining and opposes the use of, and will not use, forced, compulsory or child labour. These principles have been integrated into the work of our procurement teams as we assess our suppliers and their business practices.
TrainingDuring the year we continued to operate our training programme on the principles contained in the Vesuvius Code of Conduct and associated anti-bribery, corruption and other compliance policies and procedures. Training gives our employees a clearer understanding of the scope of risks that exist as we conduct our business, and gives context to how the Group expects each one of us to respond to those risks. In 2017, our training processes have developed to include an integrated learning management system which allows us to deliver Vesuvius-specifi c e-learning modules to employees on topics relevant to their role through an online interactive platform.
Training provided during 2017 included:
> E-learning modules for modern slavery, data protection and trade sanctions
> Webex and video conference workshops on data protection
> Face-to-face training by the Legal and Compliance team to staff at several sites covering anti-bribery and corruption, gifts, hospitality and entertainment and trade sanctions
Our e-learning platform supplements the face-to-face training provided to employees by the Legal and Compliance team, enabling us to reach more employees, more quickly and in a more targeted way. In 2018, we will continue to develop our training processes and modules available in the e-learning platform to help our staff understand the Vesuvius policies and procedures relating to our Code of Conduct and regulatory compliance requirements.
Monitoring and EvaluationAlongside our training programme, we assist employees with the implementation and interpretation of the Group’s policies, and their application through a process of monitoring and evaluation. Part of this process involves performing ongoing and targeted due diligence to understand the background to policy design and application. This forms part of our compliance framework to ensure that our ethical and legal approach remains fi t for purpose and is understood throughout the business.
Our Principles continued

59
Speak UpThe Group continues to monitor the volume, geographic distribution and range of reports made to its Speak Up facility to ascertain not only whether there are signifi cant regional compliance concerns, but also whether there are countries where access to this facility is less well understood or publicised. The Audit Committee continues to monitor and oversee the Group’s procedures for reporting allegations of improper behaviour, and throughout 2017 the Audit Committee received updates on the volume of reports received from the confi dential Speak Up Helpline, key themes emerging from these reports and the results of any investigations undertaken. In 2017, we received 76 reports through the Speak Up facility, a number of which related to the same set of facts. Each one of these was investigated. A substantial majority of reports received in 2017 were human resource issues which indicated no compliance concerns, nor serious breaches of the Code of Conduct. In relation to the repetitive reports, even though these did not identify compliance concerns, steps were taken to ensure that changes were implemented locally, including in certain cases entity-wide management training, recommunication of policies and reinforcement of our business culture, supported by senior management oversight. Of the small number of reports received that contained allegations in breach of our Code of Conduct, thorough investigations were performed and, where appropriate, disciplinary action taken, including one termination.
Prevention of Slavery and Human Traffi ckingDuring 2017 we published our second transparency statement outlining the Group’s approach to the prevention of slavery and human traffi cking in our business and supply chain. You can fi nd a copy of our latest statement on our home page at www.vesuvius.com. Since the publication of our fi rst statement we have conducted a Group-wide risk assessment as well as developing our internal policies and enhancing our supplier assessment programme. To ensure effective communication of our Human Rights Policy we have provided training to our key purchasing staff and introduced an online e-learning module to upgrade the training given to all supplier-facing staff, which provides key guidance on the red fl ags associated with modern slavery to assist them in identifying these during supplier visits and accreditation.
Working with Third PartiesDuring 2017 the Group continued the review of our third-party representatives and intermediaries. This included detailed review of our due diligence activities for active sales agents across the Group. This process covers reputation, public information searches, regulatory searches and ultimate benefi cial ownership, and has been applied to each one of our active sales agents. The review of our due diligence processes will continue to be extended on a risk-based approach during 2018 and beyond.
Data ProtectionIn 2017, we spent considerable time reviewing our approach to data protection, in anticipation of the implementation of the EU General Data Protection Regulation in May. We formally identifi ed a Data Protection Offi cer (‘DPO’) in July 2017 whose role includes setting Group policy, implementing procedures, monitoring compliance with data protection provisions and championing Vesuvius’ approach to the protection of personal data. Our review involved Group-wide due diligence to clarify the data we control and process, the methods by which we do this, the security of the systems that hold our data and the assignment of responsibilities for responding to this.
The DPO is also responsible for raising awareness of data protection issues across the Group and training staff who undertake roles that involve the processing of data.
Other Due DiligenceThe Group continues to undertake focused, country- and function-specifi c risk assessments, reviewing fi nancial records and the quality of implementation of our policies and procedures, often engaging the assistance of external advisers. The outputs of these assessments are used to identify activities that require further improvement, ensure that our Group policies and procedures for the management of anti-bribery and corruption risk continue to be appropriate for the business, and ensure that within our business there is the necessary awareness and understanding to be able to manage risks appropriately.
Our Responsibility
Operations meeting Skawina, Poland

60 Vesuvius plcAnnual Report and Accounts 2017
Health and Safety
Vesuvius remains fundamentally committed to protecting the health and safety of employees, contractors, visitors, customers and any other persons affected by our activities.
Our approach to health and safety is based on the following beliefs
Health and safety is one of Vesuvius’ core principles, and our commitment to health and safety is embedded throughout the organisation. The Vesuvius ethos is to identify, eliminate, reduce or control all workplace risks and an ongoing system of training, assessment and improvement is in place to focus on achieving this.
Safety LeadershipSafety performance remains the fi rst item on the agenda at all our Group Executive Committee and management meetings, and safety performance is reported to the Board by the Chief Executive as a matter of priority at each Board meeting. Any site experiencing a serious dangerous occurrence or medically treated injury is required to carry out a full 8D investigation and incorporate the fi ndings into their site improvement plan. The Group Executive Committee reviews the more serious incidents and the responses from the sites. The Group remains fully committed to continuing safety improvement with a Group health and safety policy stating a clear goal of:
This goal is pursued through a range of policies, standards and procedures, which are reviewed and updated on an ongoing basis. In 2017, the accident and incident reporting, personal protective equipment, road vehicle and machine safety standards were all reviewed and updated to maintain their relevance to the current Vesuvius risk profi le.
Health and SafetyHealth and safety is regarded as a core management responsibility, with executives and line managers directly responsible for health and safety matters in the operations under their control. This tone from the top is demonstrated by the requirement for all senior managers to perform executive safety tours, report on their fi ndings to local operations management and follow up on improvement requirements. Management is accountable for health and safety performance against objectives and all employees understand that they have a responsibility to take care of themselves and others whilst at work. We expect everyone to participate positively in the task of preserving workplace health and safety.
Every business facility has an appointed health and safety manager, who works with management and all employees to review site health and safety, assess training needs and develop and implement site safety improvement plans. These local health and safety managers are assisted by a central team of experts who not only identify adverse trends and respond to them, but also enable the sharing of best practice across Vesuvius.
In 2017, a thorough review was undertaken of the operation of the health and safety function in Vesuvius. Following this review, the function was restructured with the creation of a new position of Group Vice President Quality, Health and Safety and the restructuring of central functions. The Vice President QHSE will be responsible for setting the Group’s policies for quality and safety and controlling their application, with the business units taking full responsibility for their implementation and accountability for performance against them. A new safety auditing team will be established, to develop and maintain policies and standards, improving them in the light of external and internal changes on a
Good health and safety is good business
Safety is everybody’s responsibility
Working safely is a condition of employment
All work-related injuries and work-related ill-health are preventable
No lost time injuries
No repeat injuries
No harm to our people or contractors
thowing ured
and al will
for ity
d,
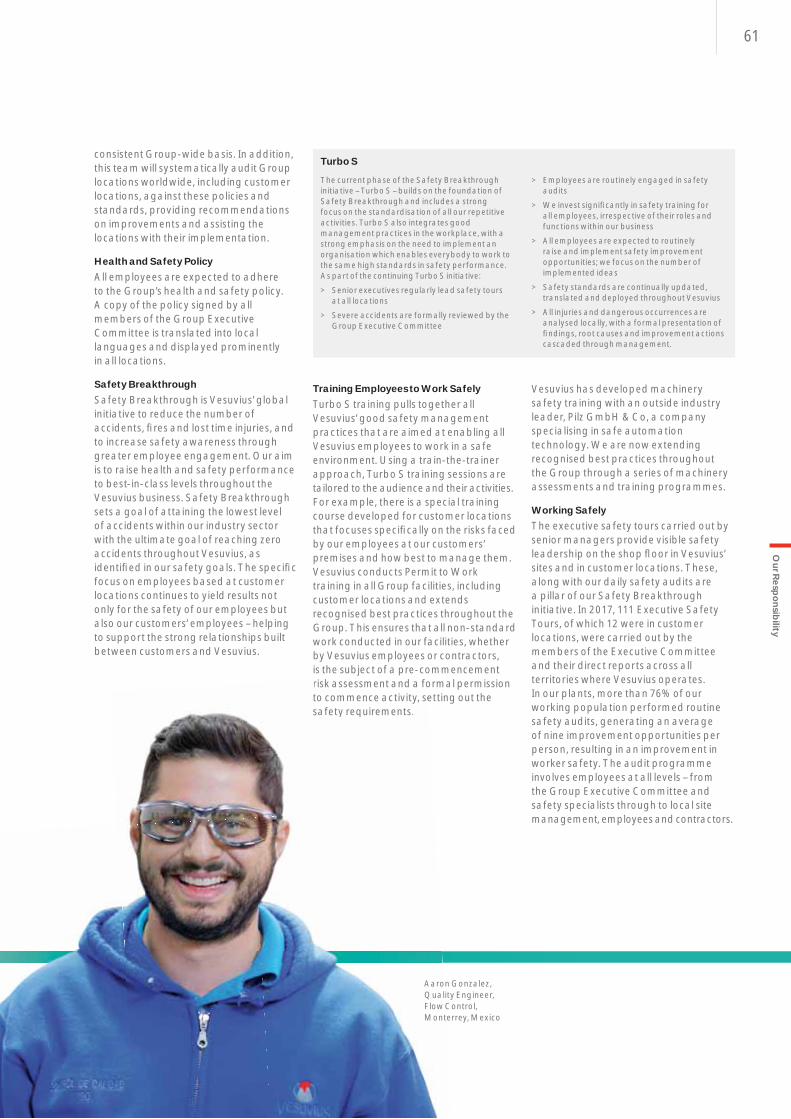
61
consistent Group-wide basis. In addition, this team will systematically audit Group locations worldwide, including customer locations, against these policies and standards, providing recommendations on improvements and assisting the locations with their implementation.
Health and Safety PolicyAll employees are expected to adhere to the Group’s health and safety policy. A copy of the policy signed by all members of the Group Executive Committee is translated into local languages and displayed prominently in all locations.
Safety BreakthroughSafety Breakthrough is Vesuvius’ global initiative to reduce the number of accidents, fi res and lost time injuries, and to increase safety awareness through greater employee engagement. Our aim is to raise health and safety performance to best-in-class levels throughout the Vesuvius business. Safety Breakthrough sets a goal of attaining the lowest level of accidents within our industry sector with the ultimate goal of reaching zero accidents throughout Vesuvius, as identifi ed in our safety goals. The specifi c focus on employees based at customer locations continues to yield results not only for the safety of our employees but also our customers’ employees – helping to support the strong relationships built between customers and Vesuvius.
Training Employees to Work Safely Turbo S training pulls together all Vesuvius’ good safety management practices that are aimed at enabling all Vesuvius employees to work in a safe environment. Using a train-the-trainer approach, Turbo S training sessions are tailored to the audience and their activities. For example, there is a special training course developed for customer locations that focuses specifi cally on the risks faced by our employees at our customers’ premises and how best to manage them. Vesuvius conducts Permit to Work training in all Group facilities, including customer locations and extends recognised best practices throughout the Group. This ensures that all non-standard work conducted in our facilities, whether by Vesuvius employees or contractors, is the subject of a pre-commencement risk assessment and a formal permission to commence activity, setting out the safety requirements.
Vesuvius has developed machinery safety training with an outside industry leader, Pilz GmbH & Co, a company specialising in safe automation technology. We are now extending recognised best practices throughout the Group through a series of machinery assessments and training programmes.
Working Safely The executive safety tours carried out by senior managers provide visible safety leadership on the shop fl oor in Vesuvius’ sites and in customer locations. These, along with our daily safety audits are a pillar of our Safety Breakthrough initiative. In 2017, 111 Executive Safety Tours, of which 12 were in customer locations, were carried out by the members of the Executive Committee and their direct reports across all territories where Vesuvius operates. In our plants, more than 76% of our working population performed routine safety audits, generating an average of nine improvement opportunities per person, resulting in an improvement in worker safety. The audit programme involves employees at all levels – from the Group Executive Committee and safety specialists through to local site management, employees and contractors.
Our Responsibility
Turbo S
The current phase of the Safety Breakthrough initiative – Turbo S – builds on the foundation of Safety Breakthrough and includes a strong focus on the standardisation of all our repetitive activities. Turbo S also integrates good management practices in the workplace, with a strong emphasis on the need to implement an organisation which enables everybody to work to the same high standards in safety performance. As part of the continuing Turbo S initiative:
> Senior executives regularly lead safety tours at all locations
> Severe accidents are formally reviewed by the Group Executive Committee
> Employees are routinely engaged in safety audits
> We invest signifi cantly in safety training for all employees, irrespective of their roles and functions within our business
> All employees are expected to routinely raise and implement safety improvement opportunities; we focus on the number of implemented ideas
> Safety standards are continually updated, translated and deployed throughout Vesuvius
> All injuries and dangerous occurrences are analysed locally, with a formal presentation of fi ndings, root causes and improvement actions cascaded through management.
prisk assessment and a foto commence activity, sesafety requirements.
Aaron Gonzalez, Quality Engineer, Flow Control, Monterrey, Mexico
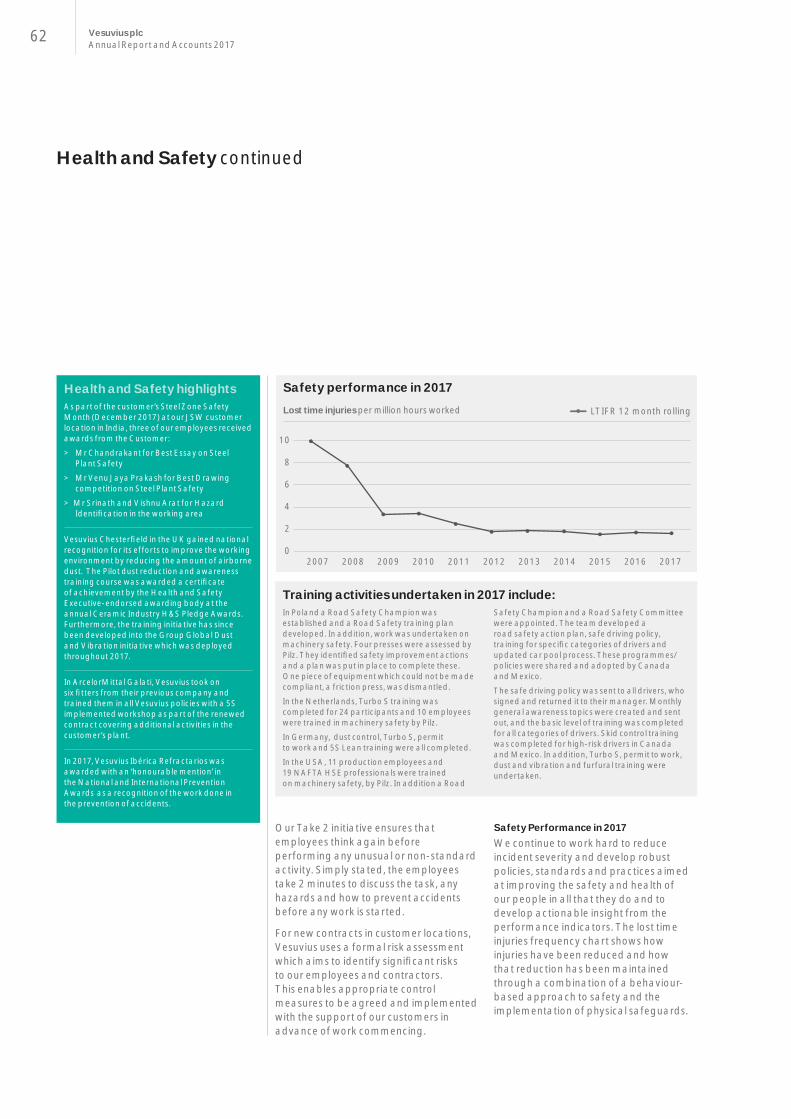
62 Vesuvius plcAnnual Report and Accounts 2017
Health and Safety continued
0
2
4
6
8
10
LTIFR 12 month rollingLost time injuries per million hours worked
20172016201520142013201220112010200920082007
Safety performance in 2017
Training activities undertaken in 2017 include: In Poland a Road Safety Champion was established and a Road Safety training plan developed. In addition, work was undertaken on machinery safety. Four presses were assessed by Pilz. They identifi ed safety improvement actions and a plan was put in place to complete these. One piece of equipment which could not be made compliant, a friction press, was dismantled.
In the Netherlands, Turbo S training was completed for 24 participants and 10 employees were trained in machinery safety by Pilz.
In Germany, dust control, Turbo S, permit to work and 5S Lean training were all completed.
In the USA, 11 production employees and 19 NAFTA HSE professionals were trained on machinery safety, by Pilz. In addition a Road
Safety Champion and a Road Safety Committee were appointed. The team developed a road safety action plan, safe driving policy, training for specifi c categories of drivers and updated car pool process. These programmes/policies were shared and adopted by Canada and Mexico.
The safe driving policy was sent to all drivers, who signed and returned it to their manager. Monthly general awareness topics were created and sent out, and the basic level of training was completed for all categories of drivers. Skid control training was completed for high-risk drivers in Canada and Mexico. In addition, Turbo S, permit to work, dust and vibration and furfural training were undertaken.
Health and Safety highlightsAs part of the customer’s Steel Zone Safety Month (December 2017) at our JSW customer location in India, three of our employees received awards from the Customer:
> Mr Chandrakant for Best Essay on Steel Plant Safety
> Mr Venu Jaya Prakash for Best Drawing competition on Steel Plant Safety
> Mr Srinath and Vishnu Arat for Hazard Identifi cation in the working area
Vesuvius Chesterfi eld in the UK gained national recognition for its efforts to improve the working environment by reducing the amount of airborne dust. The Pilot dust reduction and awareness training course was awarded a certifi cate of achievement by the Health and Safety Executive-endorsed awarding body at the annual Ceramic Industry H&S Pledge Awards. Furthermore, the training initiative has since been developed into the Group Global Dust and Vibration initiative which was deployed throughout 2017.
In ArcelorMittal Galati, Vesuvius took on six fi tters from their previous company and trained them in all Vesuvius policies with a 5S implemented workshop as part of the renewed contract covering additional activities in the customer’s plant.
In 2017, Vesuvius Ibérica Refractarios was awarded with an ‘honourable mention’ in the National and International Prevention Awards as a recognition of the work done in the prevention of accidents.
Our Take 2 initiative ensures that employees think again before performing any unusual or non-standard activity. Simply stated, the employees take 2 minutes to discuss the task, any hazards and how to prevent accidents before any work is started.
For new contracts in customer locations, Vesuvius uses a formal risk assessment which aims to identify signifi cant risks to our employees and contractors. This enables appropriate control measures to be agreed and implemented with the support of our customers in advance of work commencing.
Safety Performance in 2017We continue to work hard to reduce incident severity and develop robust policies, standards and practices aimed at improving the safety and health of our people in all that they do and to develop actionable insight from the performance indicators. The lost time injuries frequency chart shows how injuries have been reduced and how that reduction has been maintained through a combination of a behaviour-based approach to safety and the implementation of physical safeguards.

63
In 2018, the business units will continue to build on the embedded behaviour-based safety approach taken to date to drive continual improvement in safety performance.
Working in Tidy PlantsThe continuing use of 5S, the workplace organisation method, throughout the Group has driven signifi cant improvements in our workplace environment. Employees are encouraged to develop ownership of their working areas, and take pride in their cleanliness and organisation. The added support of Vesuvius Lean specialists has been key to improving plant safety by removing hazards for employees and offering a clear, bright and safe working environment. Daily 5S audits led by team leaders ensure continuous improvement of working conditions and promote a safer workplace.
Accident and Incident Reporting and Analysis
A signifi cant investment in time and resources has been made over recent years to develop robust, comprehensive and timely reporting of incidents (including all fi res, explosions and any major spill or other chemical releases). In its internal standards, Vesuvius continues to use more stringent defi nitions for lost time injuries (LTIs) and ‘severe accidents’ than the defi nitions used by local regulatory bodies. This extends investigation to all medically treated injuries and serious dangerous occurrences. Vesuvius has implemented a full investigation based on the 8D Practical Problem Solving (‘8D’) tool to identify the true root causes to prevent repeat incidents with a formal presentation of fi ndings, 8D-based root causes and improvement actions
cascaded through management.As part of management reporting, the Board receives a monthly update on all lost time injuries.
Involving Accountable Management for Safety PerformanceSite safety improvement plans are now in place for all production sites with deployment being the direct responsibility of local managers. Any site experiencing a dangerous occurrence or severe injury is required to investigate using 8D and to share their incident investigation and action plans across the Group. In 2017, there were no severe injuries, but 407 dangerous occurrences. Vesuvius encourages the reporting of all dangerous occurrences and injuries as only through a sound root cause analysis and preventative action plan implementation can future occurrences be prevented.
D1
D5
D3
D7
D2
D6
D4
D8
clarify the problem
defi ne countermeasures
contain and set target
check results
grasp the current situation
execute and track progress
analyse causes
standardise and establish control
Vesuvius 8D Practical Problem Solving Methodology
Our Responsibility
111 Executive Safety Tours
ChinaEuropeIndiaNAFTANorth AsiaSouth AmericaSouth Asia
Executive Safety Tours carried out in 2017
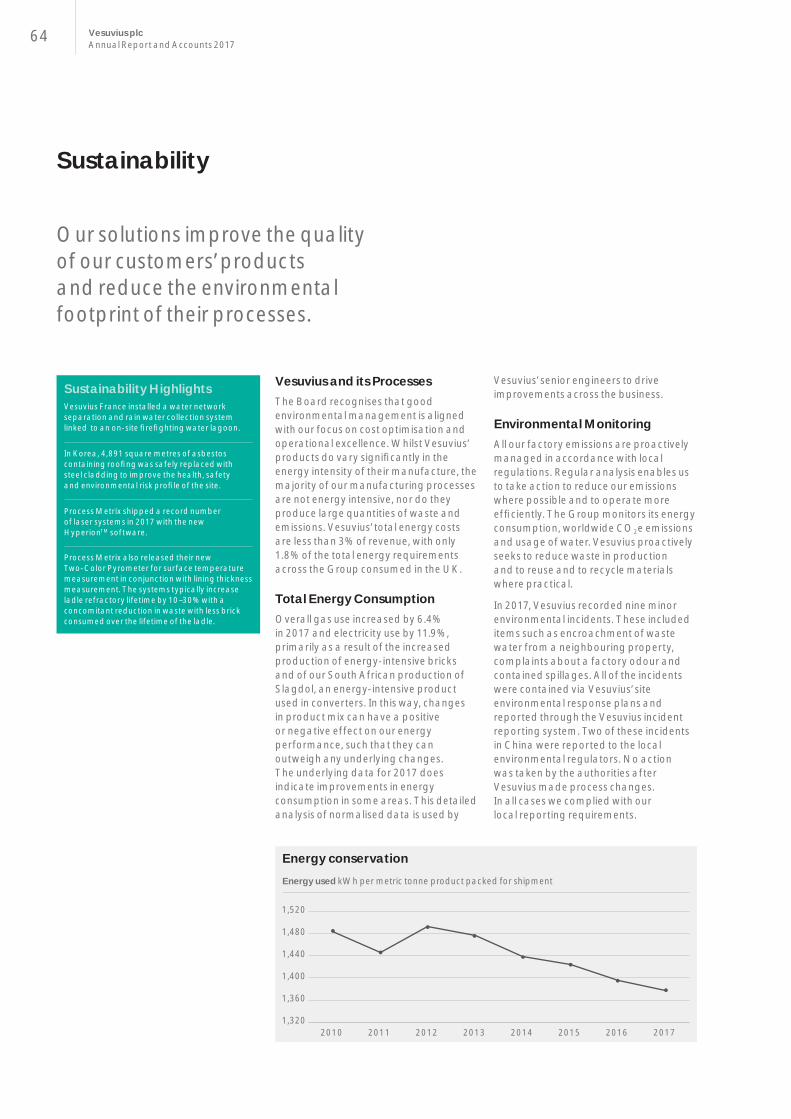
64 Vesuvius plcAnnual Report and Accounts 2017
Sustainability
Our solutions improve the quality of our customers’ products and reduce the environmental footprint of their processes.
Vesuvius and its ProcessesThe Board recognises that good environmental management is aligned with our focus on cost optimisation and operational excellence. Whilst Vesuvius’ products do vary signifi cantly in the energy intensity of their manufacture, the majority of our manufacturing processes are not energy intensive, nor do they produce large quantities of waste and emissions. Vesuvius’ total energy costs are less than 3% of revenue, with only 1.8% of the total energy requirements across the Group consumed in the UK.
Total Energy ConsumptionOverall gas use increased by 6.4% in 2017 and electricity use by 11.9%, primarily as a result of the increased production of energy-intensive bricks and of our South African production of Slagdol, an energy-intensive product used in converters. In this way, changes in product mix can have a positive or negative effect on our energy performance, such that they can outweigh any underlying changes. The underlying data for 2017 does indicate improvements in energy consumption in some areas. This detailed analysis of normalised data is used by
Vesuvius’ senior engineers to drive improvements across the business.
Environmental MonitoringAll our factory emissions are proactively managed in accordance with local regulations. Regular analysis enables us to take action to reduce our emissions where possible and to operate more effi ciently. The Group monitors its energy consumption, worldwide CO2e emissions and usage of water. Vesuvius proactively seeks to reduce waste in production and to reuse and to recycle materials where practical.
In 2017, Vesuvius recorded nine minor environmental incidents. These included items such as encroachment of waste water from a neighbouring property, complaints about a factory odour and contained spillages. All of the incidents were contained via Vesuvius’ site environmental response plans and reported through the Vesuvius incident reporting system. Two of these incidents in China were reported to the local environmental regulators. No action was taken by the authorities after Vesuvius made process changes. In all cases we complied with our local reporting requirements.
Energy used kWh per metric tonne product packed for shipment
20172016201520142013201220112010
Energy conservation
1,320
1,360
1,400
1,440
1,480
1,520
Sustainability HighlightsVesuvius France installed a water network separation and rain water collection system linked to an on-site fi refi ghting water lagoon.
In Korea, 4,891 square metres of asbestos containing roofi ng was safely replaced with steel cladding to improve the health, safety and environmental risk profi le of the site.
Process Metrix shipped a record number of laser systems in 2017 with the new HyperionTM software.
Process Metrix also released their new Two-Color Pyrometer for surface temperature measurement in conjunction with lining thickness measurement. The systems typically increase ladle refractory lifetime by 10–30% with a concomitant reduction in waste with less brick consumed over the lifetime of the ladle.

65
Greenhouse Gas ReportingIn line with our total energy consumption, both total emissions and normalised emissions increased in 2017, driven predominantly by the issue mentioned above – the increased production of Slagdol which generated high process CO2 emissions, and increase in production of our brick plants, although we also undertook a switch from coal to a cleaner gas fuel during the year in our Chinese brick plant. In 2017, Vesuvius also included the emission from our newly acquired fl ux plant in Brazil. If these products are excluded, then there is an underlying downward year-on-year trend in normalised emissions of CO2e of 7.7% and of normalised energy consumption of 7.3%.
In reporting greenhouse gas (‘GHG’)emissions, we have used the GHG Protocol Corporate Accounting and Reporting Standard (revised edition) methodology to identify our GHG inventory of Scope 1 (direct) and Scope 2 (indirect) CO2e. We report in kg of CO2 equivalent (‘CO2e’).
The Group also meets all of its obligations in relation to the Carbon Reduction Commitment (‘CRC’) Energy Effi ciency Scheme, the Producer Responsibility Packaging Waste regulations and the Energy Saving Opportunity Scheme by which the UK has implemented the EU Energy Effi ciency Directive.
Energy Conservation PlanThe Vesuvius Energy Conservation Plan was launched in 2011 with the objective of reducing our normalised energy consumption by 10% over the following three years. In June 2015, we reset our focus and set the objective of a 10% improvement (using 2014 as our base year) by 2018. Against that 2014 base, a 4.2% improvement has been realised towards this target (making a 7.1% improvement since 2010). Managing our energy intensity not only has an environmental benefi t but is also part of our long-term strategy to enhance our cost competitiveness.
Our Responsibility
Global GHG emissions (kg of CO2e)2017 2016
Emissions sourceCombustion of fuel and operation of facilities 396m 340mElectricity, heat, steam and cooling purchased for own use 120m 98mTotal GHG emissions 516m 438m
+17.9%
Vesuvius’ chosen intensity measurementEmissions reported above, normalised to per tonne of product output
526.4 +3.0%
511.0
Methodology We have reported to the extent reasonably practicable on all the emission sources required under Part 7 of the Accounting Regulations which fall within our consolidated fi nancial statements.
Scope 1 covers emissions from fuels used in our factories and offi ces.
Scope 2 relates to the indirect emissions resulting from the generation of electricity, heat, steam and hot water we purchase to supply our offi ces and factories. We have used data gathered to fulfi l our requirements under the CRC Energy Effi ciency scheme and emission factors from UK Government’s and the IEA GHG Conversion Factors for Company Reporting 2016 in the calculation of our GHG.
New Insural® furnace lining system increases productivity and casting quality
The ChallengeThe need to improve productivity, commercial competitiveness and environmental impact is increasingly driving the adoption of energy effi cient furnaces in aluminium foundries. However, the effi ciency of these furnaces is often undermined by the choice of the refractory lining.
Our Solution Foseco has developed a new, multi-part and highly insulating lining made of Insural material. The lining is delivered ready to install, and combines energy saving potential with long service life and resistance to oxide build-up.
The Benefi ts As most of the lining system is made of pre-cast Insural shapes, the installation can be completed in under three days unlike traditional linings which require several weeks to fully stabilise. In addition, no sintering is necessary. The furnace just needs to be pre-heated and maintained at working temperature for 48 hours and is then ready for service.
The Insural furnace lining system is completely water free. Consequently, hydrogen pick-up from the new lining system is negligible and the aluminium melt density index specifi cation can be achieved immediately following installation. Furnace downtime is dramatically reduced and the risk of increased rejects associated with re-lining work is avoided.
With conventional linings, the external furnace body temperature often runs in excess of 100° C, while with Insural furnace lining systems installed an external furnace body temperature of only 64°C can be achieved. This signifi cantly improves the foundry working environment and reduces energy loss. Our tests show that Insural lining runs on 33% less energy than a tradional lining.
The Insural furnace lining system offers the foundry a reduction in cost, increased productivity and security in casting quality.

66 Vesuvius plcAnnual Report and Accounts 2017
Water ConservationWhilst water is not a scarce resource in the places where Vesuvius operates, Vesuvius works to reduce the consumption of water in its manufacturing processes by recycling and improving processes to reduce consumption. Normalised consumption of water does vary with product mix; however, there is an overall downward trend for both absolute water consumption, and normalised water consumption – that is water use per tonne of product manufactured.
Our Customers and Their ProcessesUnder the Vesuvius and Foseco brands, we deliver a wide range of solutions that help our customers improve the productivity of their operations. These solutions also improve the quality of our customers’ products and reduce the environmental footprint of their processes.
Thermal optimisation and reject reduction are key factors in the processes for which we supply solutions. We contribute to the reduction of our customers’ energy usage and subsequent CO2 emissions through insulating materials, metal fl ow management, facilitating extended manufacturing sequences (meaning less reheating) and reduced downtime.
The iron and steel industry accounts for approximately 6.7% of total world CO2 emissions and 18% of industrial CO2 emissions, with, on average, 1.8 tonnes of CO2 being emitted for every tonne of steel produced. With around 10 kg of refractory material required per tonne of steel produced, careful selection of energy-saving refractories can benefi cially impact on the net emission of CO2.
In the foundry process, the amount of metal melted versus the amount sold is critical to a foundry’s profi tability. Foseco continuously works with its customers to increase the ratio of metal sold to metal melted. Sometimes this is as low as 40% and we work with them to increase it to 70%.
How Does Vesuvius Contribute? Since 2011 we have used a CO2 impact stamp to highlight the most energy-effi cient solutions in our portfolio of products and services and to support the deployment of energy-effi cient and sustainable solutions engineered by our technology departments.
Vesuvius products and services facilitate environmental benefi ts by:
> Enabling lighter, thinner and stronger components, leading to lighter vehicles and less energy consumption
> Improving customer processes through the supply of innovative consumables to reduce energy intensity and the CO2e intensity ratio
> Reducing customers’ refractory usage per tonne of steel produced through higher-quality, longer service-life products
> Increasing the level of sound castings produced per tonne of metal melted through improved mould design and the application of molten metal fi ltration and feeding systems
Sustainability continued
0
200,000
400,000
600,000
800,000
1,000,000
1,200,000
20172016201520142013201220112010
Water conservation
0.0
0.2
0.4
0.6
0.8
1.0
1.2 Water used in metric tonnes
Water used in metric tonnes per metric tonne of product packed for shipment

67
People and Community
Our people are unique and important to us. We are unequivocally committed to helping them to be the best they can at what they do.
Our aim at Vesuvius is to foster a working environment that is inclusive and diverse, where people can be themselves without fear of harassment, bullying or discrimination. We recognise that the dedication and professionalism of our people, their capacity for owning their roles and their drive for results, are the most signifi cant contributors to Vesuvius’ success. In order to get the best from our people, we emphasise that one of the most important tasks of being a manager in Vesuvius is the development of their direct reports. We recognise that we attain our goals through our people.
Line and functional managers are guided in managing and developing their people by a central HR function, head-quartered in London delivering support through its expertise in Reward, Talent Management, and Global Mobility, and backed up by modern HR information systems. Management in the business units and regional and local HR staff draw upon this expertise and cascade it to their respective business units and local organisations. Much care is taken to ensure that Corporate HR initiatives are properly communicated and implemented at local level, with the cooperation of identifi ed employee representatives.
The main area of attention for the central HR function is identifying and fostering talent across the organisation and making sure that those individuals identifi ed as having high potential are seen as a company-wide resource, with appropriate development plans put in place. In recruiting talent, whether it be recent graduates or seasoned professionals, we are looking for individuals who embody an entrepreneurial mindset and an international outlook. Special attention is paid in addressing matters such as gender balance and the employment of a diverse workforce.
For 2018, a strengthening of both the Talent Management and Reward functions is planned, to equip them better for the ever-increasing battle for talent in the marketplace.
Talent ManagementStrengthening the leadership pipeline and facilitating people development throughout the organisation remain key areas of focus for Vesuvius. We work hard to ensure that across all operational and functional areas of the business, at a
senior managerial level, there is the appropriate level of alignment in strategic outlook and performance goals. This increases accountability and drives results. We encourage and reward high performance, foster talent and aim to create an environment where all can realise their individual potential. To meet the demands of the business and add rigour to our employee value proposition, we have launched a number of programmes to assist our employees in growing their careers through utilising world-class learning opportunities.
Our Responsibility
Our Training Programmes
ADVANCEThis is a fi rst generation management development programme aimed at developing individual contributors who are likely to occupy a line management role in the short to medium term and managers who have no direct reports but need to be familiar with a broad range of people management skills to use in one-off projects. In its fi rst year, the programme is designed to take place over 12 months, and includes a blended learning approach of online learning, face-to-face workshops and individual projects. Participants are supported by line management and HR business partners throughout the duration of the programme and thereafter where additional support is needed. The programme includes a 360° assessment of each participant to enable them to compile a personal development plan for the next stage of their career.
WINGSThis is the Vesuvius middle management development programme aimed at those who manage other managers. Wings, now in its eighth year, is held in Spring each year at Vlerick University in Belgium. In 2017, 26 employees successfully completed the course. The programme entails an introduction to general management theory and practice and, like the ADVANCE programme, includes a 360° assessment of each participant.
ASCENTThis is the Vesuvius high potential and senior leadership development programme, which Vesuvius offers in partnership with Insead. It is aimed at accelerating the development of top talent within the organisation. The programme
is highly structured and takes place over a nine-month period, involving initial online modules, face-to-face workshops and individual and group projects, in which participants are assessed individually and also against each other. Participants are supported by senior executives and senior HR management for the duration of the programme and thereafter. Participants on this programme are those identifi ed as being potential future senior management of the Group.
HeaTtThese courses form part of the Vesuvius Technical University aimed at the continuous technical development of Vesuvius personnel. Courses range from entry to expert levels, and are continuously updated to keep pace with developing technology, thereby guaranteeing that Vesuvius staff are at the forefront of technical innovation.
HR4HR During 2016/17, under the Vesuvius HR4HR project, 30 HR professionals underwent accredited professional training in psychometric assessment and evaluation, and simulation of key talent management processes, each achieving ‘Expert’ status. These HR4HR graduates will act now as catalysts for implementing innovative recruitment and talent identifi cation techniques across the business. The project will be progressed in 2018.

68 Vesuvius plcAnnual Report and Accounts 2017
SuccessFactorsVesuvius has invested heavily in a new people platform and key digital products. The SuccessFactors HRIS project was launched globally in January 2017. It provides greater transparency across the business, facilitating better performance management and focused talent identifi cation and development, and has been implemented across all our businesses and geographies.
RewardVesuvius’ reward systems are designed to create a market competitive and fair pay environment for all of our employees
and to reinforce the vision, strategy and expectations set by the Board.
We have adopted the Willis Towers Watson job grading model, which enables us to compare roles and deploy a structured assessment methodology across countries and specialisms to ensure that roles are rewarded consistently throughout the organisation. Employees can also visualise their potential career paths within Vesuvius on the grade map. Vesuvius is committed to creating reward systems which are transparent and objective, where employees receive equal pay for work of equal value, regardless of their age,
race, disability, sexual orientation, gender, marital, civil partnership or parental status, religion or beliefs.
The Corporate Annual Incentive Plan for managers ensures that our people are motivated to achieve their objectives, with awards linked to business performance. The Mid-Term Incentive Plan for managers and senior managers acts as a retention tool for key talent, reducing employee turnover and diversifying our pay methods. The Vesuvius Share Plan for Executive Directors and Group Executive Committee members encourages decisions based on long-term goals rather than short-term gains and works to align the interests of participants and shareholders.
People and Community continued
Following an early career in construction and refractory manufacturing, I joined Vesuvius Canada as a Sales Account Manager in 2000. I was gradually promoted to the roles of District Manager and Steel Sales Manager, before becoming General Manager of the Canadian business in 2005. My fi rst international posting was to Suzhou, China where I became Vice President Advanced Refractories , Asia Pacifi c. There I oversaw all of our Advanced Refractories operations for the Asia Pacifi c region, covering Korea, Japan, Taiwan and China, including our Chinese joint venture with Angang Steel. My next move was to Australia, where I became the General Manager, overseeing the opening of the new Port Kembla manufacturing site and the sale of some of our non-core businesses.
In 2013, I moved back to Canada to take over the General Manager role once again and, in November 2015, became the Operations Director for Advanced Refractories NAFTA, responsible for managing our production sites in the US, Canada and Mexico. Finally, in May 2017, I moved to Pittsburgh to take on the position of Vice President of Advanced Refractories NAFTA, leading the business in this region. Vesuvius has given me the chance to work overseas gaining international and intercultural experience enabling me to take on senior management roles around the world.
“My fi rst international posting was to Suzhou, China”Bill Cousineau, Vice President Advanced Refractories, NAFTA
al
ced le tes
n
e
k and
ng ent
A

69
Global Mobility Although Vesuvius is active worldwide, we keep the number of international assignments as low as possible as we
believe that local Vesuvius companies should be managed and staffed by local personnel. International assignments are
therefore limited in time, usually to three years. Currently 29 employees are on long-term assignments.
Employee DiversityVesuvius believes that the diversity of its employees is one of the core strengths of the Group. Having a balance of cultures, ethnicities and genders helps to promote the innovation and creativity that is key to our success. We recognise that, in line with other engineering companies of our size and nature, we have an unbalanced gender representation. We are seeking to address this as part of our wider commitment to diversity.
Female Male Total Female Male
Group Executive Committee member 0 10 10 0% 100%Senior management1 9 94 103 9% 91%Middle management 41 305 346 12% 88%Directors of subsidiaries included in consolidation2 35 447 482 7% 93%All other employees 1,368 9,183 10,551 13% 87%Grand total 1,418 9,592 11,010 13% 87%
1. Of these 103 senior managers, 42 directly report to members of the Group Executive Committee, and of these, three are women.
2. 482 individuals in the Group are Directors of Group subsidiaries. Of these 7% are women. This disclosure is made to comply with regulatory requirements. It includes Directors of dormant companies and those with multiple directorships.
Our Responsibility
Global mobility at Vesuvius
> Providing Vesuvius companies with skills that are not locally available and that are required at short notice. This typically occurs in countries where we are establishing a new presence. The number of expatriates working on this basis diminishes over time as the organisation matures and we recruit and train local talent to take over
> Career development. We believe that the personal development plan of any employee being developed for a senior management, or senior expert position should include a posting outside their home country. This encourages them to develop the skills necessary to function successfully in an international environment. These postings are tailored to the needs of the organisation and the needs of the individual
> Enhancing diversity. Management teams benefi t from having a mix of gender and cultures. In specifi c cases we use international assignments to achieve this goal
Vesuvius expatriates do not come from one or two countries alone, we have a truly international mix of nationalities in our expatriate population. Individuals move not only within a region, but also between regions, with existing assignments including Malaysia to China, China to Germany, Poland to the USA and Brazil to China. Our mobility
programme shows that our expatriate population is as diverse as our Group.
Vesuvius operates a number of international assignment policies to provide for the different circumstances of these assignments – whether they be short term, longer term, or require extended commuting. These policies are supplemented with clearly identifi ed
benefi ts, delivering support appropriate to the nature of the assignment. By accessing this broad range of policies, we can manage our international assignments with greater fl exibility, thus catering for changing expectations and demands from employees, whilst at the same time meeting the demands of the business.

70 Vesuvius plcAnnual Report and Accounts 2017
Employee Consultation and Industrial RelationsIn most of the countries in which we operate we discuss matters concerning the Vesuvius business with local works councils and trade unions. These processes and procedures are regulated by local law and we fi nd that the constructive dialogue that takes place between employee representatives and management provides benefi t to our business. In addition to local employee representation we operate a European Works Council (‘EWC’) that contains representatives from each of the EU countries where Vesuvius has employees. European management and the EWC meet formally once a year. At this meeting management provides an update on the performance of the business, with a particular focus on developments likely to impact European employees. Additional ‘Special Event Meetings’ are held when the Group is required to consult with the EWC about particular matters, including proposed restructurings in the European organisation. One such meeting was held in 2017. The EWC Select Committee also meets twice a year to receive additional updates, and the Chief Human Resources Offi cer of Vesuvius joins part of these meetings. All EWC representatives receive four dedicated training days per year, to ensure they are appropriately equipped to fulfi l their duties.
In addition to formal discussion and consultation mechanisms, in many countries our operations hold ‘town hall’ meetings on a regular basis. These provide an opportunity for local management to meet with staff and provide an update on corporate developments and matters material to the business.
Valuing our EmployeesVesuvius operates a number of awards and initiatives aimed at recognising the contribution of particular individuals and disseminating best practice throughout the Group. Examples of these include the Living the Values Awards and the EMEA 8D PPS Awards.
Our Living the Values Awards programme is central to maintaining our Group’s collective focus on Vesuvius’ Values. On 14 December 2017, we gathered for our fi fth awards ceremony to celebrate and acknowledge the efforts of 74 employees. Awards were presented to 14 individuals and 13 teams from 11 different countries, all of whom, nominated by their peers, were credited with embodying Vesuvius’ Values. They were rewarded with a specially designed trophy, with Vesuvius making a fi nancial contribution to each winner’s chosen charity.
The EMEA 8D PPS Awards 2017 took place in Pavia, Italy, in October. These awards showcase the benefi ts of the 8 Disciplines approach to practical problem-solving. They were launched to reinforce the messages of our intensive training courses, to promote the use of practical problem-solving in the business
and to recognise excellence in quality. During a two-day programme, Vesuvius employees were invited to present case studies evidencing the application of the 8D methodology to offer to customers sustainable business solutions. A panel, chaired by Vesuvius’ Chief Executive, judged the presentations, selecting the winning team from Olifantsfontein, South Africa. This team demonstrated outstanding capabilities in pushing the boundaries in high temperature solutions. Their case study demonstrated the use of 8D in a joint effort between the customer and our fi eld service engineers, to develop a unique solution for the customer’s team to increase operational effi ciency, and to develop new business for Vesuvius.
Vesuvius in the Local CommunityOur social responsibility activities complement our values in driving our culture. Our operating sites engage with their local communities through various social action projects.
In Germany, Vesuvius GmbH opened its doors to junior researchers from Borken kindergartens. About 30 children interested in research, accompanied by their nursery school teachers, turned the Vesuvius canteen into an exciting research island. At ten research stations the boys and girls experimented with colours, sowed herbs, and built noise protectors and boats.
People and Community continued

71
Our employees
A
C B
E
D
F G
A
C
B
Employees by employment type Employees by region
A. China 1,884 E. North Asia 337
B. Europe 4,472 F. South America 1,009
C. India 838 G. South Asia 296
D. NAFTA 2,174
A. Salaried 3,983
B. Hourly 5,897
C. Temps 1,130
AC
B
DE
F
Employees by business unit
A. Flow Control 4,302 D. Digital Services 526
B. Foundry 2,836 E. Head Offi ce 49
C. Advanced Ref 2,474 F. Others 823
Our Responsibility
In the Netherlands, Foseco Nederland BV operates an employee charity donation competition. Employees write an essay explaining why the charity organisation with which they have a connection, should win the donation. In June 2017, Marloes Goorhuis won the award for her contribution to an organisation named MeeReizen. MeeReizen organises holidays for mentally disabled people, providing the participants with an exciting adventure and their carers with some respite at home. Marloes has been a volunteer on these holidays for years. The trip is paid for by the participants themselves, so there is a very limited budget. Additional donations are used to provide additional experiences such as a visit to the zoo, a theme park or a museum.
In France, colleagues from Vesuvius France SA trained a futsal (a special form of football team), to participate in an inter-company competition organised by the local association. This annual competition is organised to support the charity L’Enfant Bleu which fi ghts against the maltreatment of children.
In addition, Vesuvius France SA again worked with Feignies’ local fi re brigades, this time conducting four major exercises to learn more about managing chemical risk at high temperatures. We helped them explore how best to assess situations without prior knowledge, how to evaluate circumstantial and environmental factors under pressure, as well as how to communicate effectively with teams when facing specifi c chemical fl ow hazards.
In China, Vesuvius Suzhou sponsors primary school pupils from lower income families so that they can join in with extracurricular activities. Now in its seventh year, our Vesuvius Youth Team project at the China-Singapore Suzhou Industrial Park Youth and Children Centre originally began with three teams: unicycle, aerobics and chorus. Since then, the project has grown to include jump rope and music teams, with 30–40 children in each team.
Vesuvius International Scholarship Programme The Vesuvius International Scholarship Programme is set up to assist qualifi ed dependent children of Vesuvius employees in helping to fi nance under-graduate and graduate education at accredited institutions. Awards are granted globally without regard to race, colour, creed, religion, sexual orientation, age, gender, disability or national origin. Vesuvius has been involved in this programme for 22 years, during which period Vesuvius has assisted 902 students to achieve their higher education goals at a cost of $1.08m. Individual scholarships have been awarded to employees’ children living in: Belgium, Brazil, China, the Czech Republic, France, India, Indonesia, Malaysia, Netherlands, Poland, Romania, South Africa, Spain, UAE and the UK.
8D Awards 2017
The Awards champion unique solutions designed to address customers’ requirements
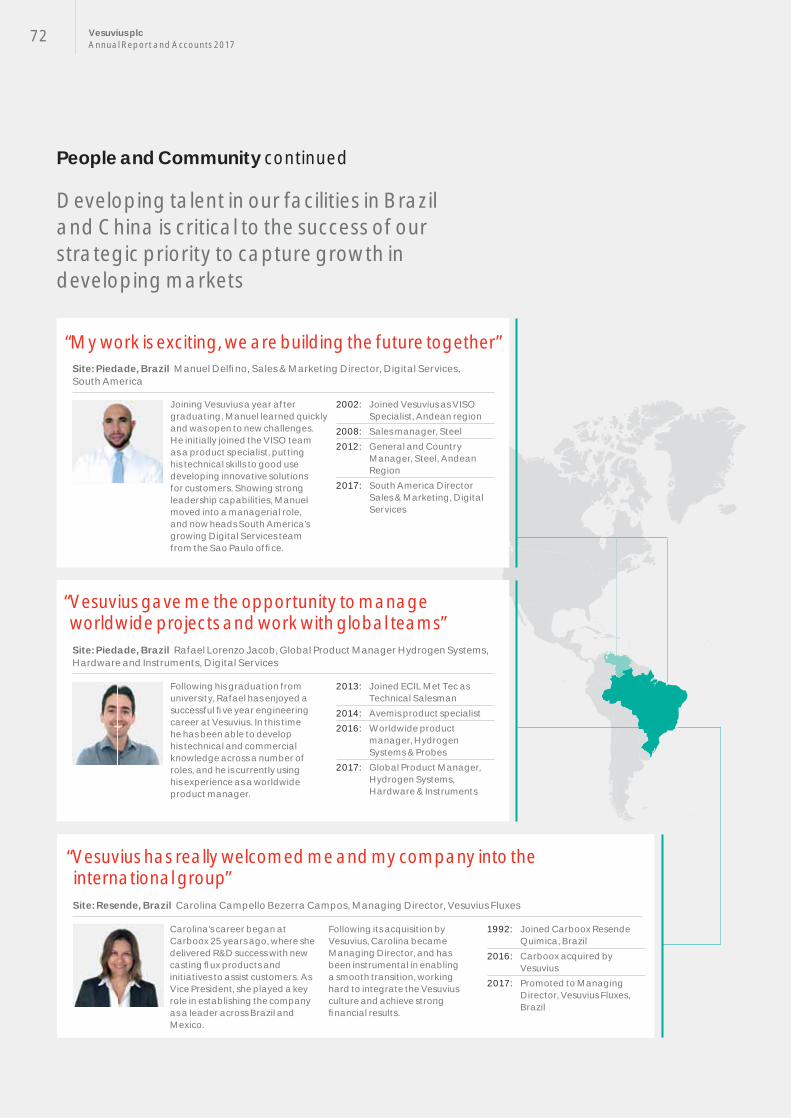
72 Vesuvius plcAnnual Report and Accounts 2017
Developing talent in our facilities in Brazil and China is critical to the success of our strategic priority to capture growth in developing markets
Carolina’s career began at Carboox 25 years ago, where she delivered R&D success with new casting fl ux products and initiatives to assist customers. As Vice President, she played a key role in establishing the company as a leader across Brazil and Mexico.
Following its acquisition by Vesuvius, Carolina became Managing Director, and has been instrumental in enabling a smooth transition, working hard to integrate the Vesuvius culture and achieve strong fi nancial results.
1992: Joined Carboox Resende Quimica, Brazil
2016: Carboox acquired by Vesuvius
2017: Promoted to Managing Director, Vesuvius Fluxes, Brazil
Joining Vesuvius a year after graduating, Manuel learned quickly and was open to new challenges. He initially joined the VISO team as a product specialist, putting his technical skills to good use developing innovative solutions for customers. Showing strong leadership capabilities, Manuel moved into a managerial role, and now heads South America’s growing Digital Services team from the Sao Paulo offi ce.
2002: Joined Vesuvius as VISO Specialist, Andean region
2008: Sales manager, Steel2012: General and Country
Manager, Steel, Andean Region
2017: South America Director Sales & Marketing, Digital Services
Following his graduation from university, Rafael has enjoyed a successful fi ve year engineering career at Vesuvius. In this time he has been able to develop his technical and commercial knowledge across a number of roles, and he is currently using his experience as a worldwide product manager.
2013: Joined ECIL Met Tec as Technical Salesman
2014: Avemis product specialist2016: Worldwide product
manager, Hydrogen Systems & Probes
2017: Global Product Manager, Hydrogen Systems, Hardware & Instruments
“Vesuvius has really welcomed me and my company into the international group”
“My work is exciting, we are building the future together”
“ Vesuvius gave me the opportunity to manage worldwide projects and work with global teams”
Site: Resende, Brazil Carolina Campello Bezerra Campos, Managing Director, Vesuvius Fluxes
Site: Piedade, Brazil Manuel Delfi no, Sales & Marketing Director, Digital Services, South America
Site: Piedade, Brazil Rafael Lorenzo Jacob, Global Product Manager Hydrogen Systems, Hardware and Instruments, Digital Services
People and Community continued

73
“ I can use the knowledge I acquired in the Steel division to benefi t the Foundry business”
Four years after university, Benny joined Vesuvius as a Sales Engineer, applying his technical expertise to enhance product excellence for customers across China. A series of promotions enabled Benny to grow his commercial responsibility, where he
fostered a successful partnership, improved product quality and grew market share. Most recently, as Manager of the Foundry team, he oversaw a good set of fi nancial results last year.
1999: Joined Vesuvius as Sales Engineer
2001: Slide Gate Refractories (‘SGR’)/Purging Plugs (‘PP’) Product Specialist
2006: SGR/PP Technical Director 2012: General Manager, WG2016: Foundry Manager, China
“ I am proud to be able to share my technical expertise with my colleagues around the world”
Site: ChangShu, China Benny Yang, BU Manager, Foundry China
Jerry joined Vesuvius on an internship, learning about the value of IT to every part of the company. Always seeking to understand the needs of other functions, he soon built a strong culture around him.
After growing his remit across European operations, leading a number of projects in Europe, Jerry became Director of IT Asia Pacifi c, managing a loyal team that he ensures have access to many overseas opportunities.
2002: Graduated and joined Vesuvius as intern
2004: IT Specialist2006: IT Manager2013: IT Manager, Borken,
Germany2015: IT Director-Asia Pacifi c
“My family and I had a great experience working in Germany”Site: Suzhou, China Jerry Huang, IT Director-Asia Pacifi c
Site: Kobe, Japan Shigeru Takii, Marketing Manager, Foundry
Shigeru built up a strong track record after beginning his career as part of Japan’s sales team. He was promoted to Manager of Filter Products following nine years at the company, where he was successful despite inheriting a challenging market. Last year he became Marketing Manager of Steel and Non-Ferrous Products, where he has grown a global network across the company and continues to deliver strong results.
1996: Sales team, Foseco, Japan2004: Application Engineer, Kobe,
Japan2007: Manager, Filter Products2010: Manager, Metal Treatment
Products 2017: Marketing Manager, Steel
and Non Ferrous Products
Our Responsibility

74 Vesuvius plcAnnual Report and Accounts 2017
Section Four
GovernanceIn this section76 Chairman’s Governance Letter
78 Governance Report
85 Audit Committee
93 Nomination Committee
96 Directors’ Remuneration Report 96 Remuneration Overview 98 Remuneration Policy 106 Annual Report on Directors’
Remuneration
117 Directors’ Report
121 Statement of Directors’ Responsibilities

75G
overnance
“I moved from Mexico to Brussels to join the Corporate HR team.”Carlos Bersoza, Human Resources Director, Advanced Refractories, NAFTA
See more about Vesuvius careers People and community on p67-73
I joined Vesuvius in 2006, taking the role of HR Coordinator at Monterrey, Mexico whilst Vesuvius was expanding the production lines at its Mexico facility. Following the inauguration of the new Pre-Cast production line, I was offered the opportunity to join the Corporate HR team, and in 2008 I moved to Brussels to work as the HR Project Coordinator for the head offi ce team. Whilst there, I helped to organise the Group’s expatriation processes, develop internal training modules and worked on the HR SAP implementation project.
Following the completion of this 5-year assignment in Brussels, I returned to Mexico in 2013 as Operations HR Business Partner, supporting the deployment and training of standardised working teams across the facility. I continued to travel internationally to deliver workshops and train company leaders in China, Brazil, Poland and the US on the basis of my experience in Mexico.
Two years later, I was promoted to HR Director for Advanced Refractories NAFTA, moving to Pittsburgh. In this role, as well as
my responsibilities for HR across the US, Canada and Mexico, I also support the Digital Services business unit, as their HR contact.
Moving around the world has given me an international mindset, enabling me to support and guide Vesuvius colleagues in HR matters.

76 Vesuvius plcAnnual Report and Accounts 2017
Dear shareholder,On behalf of the Board I am delighted to present the 2017 Corporate Governance Report. As a Board, we remain committed to applying the highest standards of corporate governance, recognising that robust governance and culture underpin business success. This year the Company is reporting against the 2016 UK Corporate Governance Code (the ‘Code’). This version of the Code includes minor changes following the implementation of the European Union’s Audit Regulation and Directive. I am pleased to report that the Company is fully compliant with the Code.
There was much debate in 2017 about the future direction of corporate governance, with the publication in April of the Business, Energy and Industrial Strategy (BEIS) Select Committee’s report on corporate governance, and the Government’s publication of its response to the Green Paper on Corporate Governance Reform in August. During the year, institutions and voting agencies also issued guidance on governance and voting issues, and the FRC produced commentaries on key governance issues and responded to the Government’s announcements. This culminated in December with the FRC’s publication of its consultation on a new draft of the UK Corporate Governance Code. The Board monitored each of these developments, and remains focused on ensuring that the Company continues to comply with all its governance obligations, including full compliance with the UK Corporate Governance Code.
Board Composition2017 has been a year of signifi cant development for the Board, with two new Board appointments.
In April, the Board was strengthened by the appointment of Holly Koeppel as an independent Non-executive Director, replacing Nelda Connors, who resigned from the Board in 2016. Having spent 35 years working in global utility, power and infrastructure businesses, Holly brings with her extensive international experience.
In September, we welcomed Patrick André to the Board as Chief Executive, replacing François Wanecq who retired from the Board on 31 August 2017. Patrick was appointed as part of a planned succession process, which involved a comprehensive review of external and internal candidates. Patrick joined the Group in early 2016, and has displayed signifi cant drive and energy since then, strengthening the Flow Control business, and exhibiting strong leadership skills and a constant customer focus. The Board believes that Patrick is the ideal candidate to lead the Group in the next stages of its development.
Following a period of transition, François Wanecq retired from the Group on 31 December 2017. François led the business through a period of signifi cant challenges and change. He worked tirelessly to strengthen Vesuvius’ business and to
champion safety and quality throughout the Group. We thank him for his dedication, leadership and stewardship of the Group.
Prior to undertaking these new appointments, the Nomination Committee spent time refl ecting on the balance of skills and experience of the existing Board members, and considering these against the future needs of the business. Balancing independence with the skills, knowledge and experience required on the Board, and on the Committees which support it, is crucial to the Group’s success. With the appointments of Holly and Patrick we are confi dent that the Board has the appropriate composition to ensure the continued long-term success of the business. Consequently, I encourage all shareholders to support the election and re-election of our incumbent Directors at the 2018 Annual General Meeting.
Further details about the recruitment processes for Patrick and Holly can be found in the Nomination Committee Report.
Culture and DiversityCorporate culture continues to be an important focus for our organisation. Following the recruitment of a new Chief Executive, the Board looks to him to continue the work of his predecessor in ensuring that appropriate values and a robust ethical stance are refl ected consistently in our behaviour as we conduct our business. One of the key strengths of Vesuvius has always been in the diversity of our employees. With a wide geographic spread and local hiring of the clear majority of staff, the Group encompasses individuals from a multitude of different nationalities and ethnicities. At a Board level we recognise the signifi cant benefi ts of diversity in our business, and understand its importance in supporting candid and constructive boardroom debate. During 2017, the Board refl ected further on this theme, monitoring the recommendations of the Hampton-Alexander, Parker and McGregor-Smith Reviews on gender and ethnic diversity, and approving a Board diversity policy. This policy sets out our commitment to diversity and explains the actions we will take to affi rm this going forward. Whilst recognising that the Hampton-Alexander Review has set a target of 33% female representation on FTSE 350 Boards by 2020, the Board considers its diversity, size and composition to be appropriate for the requirements of the business, and does not believe that at this time it needs to accelerate the usual rotation of Directors to meet this target. However, the Board will continue to consider the acknowledged benefi ts of greater diversity in all future Director recruitment decisions. With respect to the Group as a whole, we recognise that our commitment to diversity is not currently refl ected in the gender diversity of our employees. Like many other industrial engineering companies, we know that our organisation must work harder to attract, develop and retain talented women.
A copy of the Board Diversity Policy can be found in the Governance Report.
Chairman’s Governance Letter
77
Board Evaluation and TrainingThis year the Board’s formal evaluation process was again externally facilitated by the corporate advisory fi rm, Lintstock. It utilised a fresh approach, with the key element constituting one-on-one interviews with each Director conducted by Lintstock, aimed at gaining a deeper insight into Directors’ responses. Overall, the evaluation concluded that the Board remained of a high calibre and was functioning well, with open and challenging debate and transparent information fl ow. The Nomination Committee was felt to have dealt successfully with Board succession during the year, identifying an accomplished candidate to replace François Wanecq as Chief Executive and securing an excellent new Non-executive Director. Similarly, the Audit Committee continued to deliver robust challenge to management on fi nancial matters and had overseen a smooth transition of external auditor. Finally, the Remuneration Committee had prepared and recommended an updated Remuneration Policy for 2017.
The evaluation highlighted a number of Board priorities for 2018 including the need to integrate the new Chief Executive, an ongoing emphasis on strategy and its delivery, and the need for the Board to continue to set the right tone from the top and monitor the culture of the Group. The development of senior management level talent, and succession plans for them, was again noted as being a key area for focus in 2018, with new training programmes implemented, and continuing initiatives in place to ensure greater Board access to these high-potential individuals.
As Chairman, I recognise that I am responsible for ensuring that the Board continues to operate effectively, and that part of this role is to ensure that all Directors attain an appropriate understanding of the business, and continue to refresh their skills and knowledge. During the year, both new Directors undertook a tailored induction programme to ensure that they quickly gained a good understanding of the Group and their responsibilities and obligations. As well as receiving briefi ngs and updates on key fi nancial, legal and governance issues impacting the organisation, the Directors furthered their knowledge by undertaking visits to various operations during the year. The Board visited Group operations and a customer’s facilities in Brazil, I visited our operations in China and other Non-executive Directors visited operations in Poland, the US and Germany. During 2018, the Non-executive Directors will continue to broaden their understanding of the Group through individual site visits as well as scheduled Board visits.
Financial Reporting and Risk In 2016, the Audit Committee conducted a competitive tender for the external audit which led to the appointment of PricewaterhouseCoopers LLP (‘PwC’) as the Company’s new auditor in 2017. PwC formulated a detailed transition plan, working with people across the business to build on their understanding of the Group and refi ne the planned approach to the audit. During the year PwC provided regular updates to the Audit Committee on the status and progress of the auditor transition plan, along with valuable insights into the Group’s audit environment. Further details about the transition process are contained in the Audit Committee Report.
The Board continually assesses the Group’s key risks, and the methods by which we manage our risks. The impacts of the risks are also reviewed and tested as part of our ongoing risk management approach. This process continued in 2017. A number of emerging risks were raised and discussed, refl ecting developing ‘macro’ trends and identifi ed risks where issues had arisen during the year. Whilst none of these was considered signifi cant enough to change the overall characterisation of the Group’s risks and uncertainties, the Board’s view on each of these issues was integrated into management discussions on risk and factored into the approach the Group takes to mitigation. The Board continues to monitor all perceived risks and the methods by which these are managed.
Yours sincerely
John McDonough CBE Chairman
28 February 2018
In this section: Board effectiveness on p80
Board accountability on p83
Audit Committee Reporton p85
Nomination Committee Report on p93
Directors’ Remuneration Report on p96
Also see: Risk on p22
Principles on p56
Governance

78 Vesuvius plcAnnual Report and Accounts 2017
Governance Report
The Board of Vesuvius plc (the ‘Company’) is responsible for the Group’s system of corporate governance and is committed to maintaining high standards of governance and to developing them to refl ect progression in best practice. This report describes the Company’s corporate governance structure and explains how, during the year ended 31 December 2017, Vesuvius applied the Main Principles of the UK Corporate Governance Code 2016 issued by the Financial Reporting Council (the ‘Code’). Throughout the year and up until the date of this report, Vesuvius was in full compliance with the requirements of the Code. The Board has noted the consultation that has commenced regarding a new revised UK Corporate Governance Code, and has begun to consider the changes that the Company would need to make to its existing practices and procedures to ensure continuing full compliance in the future. A number of the proposed new requirements are already refl ected in the Company’s approach to governance.
A copy of the current Code can be found on the FRC website at: https://frc.org.uk/directors/corporate-governance-and-stewardship/uk-corporate-governance-code
Roles and Responsibilities of the BoardUltimate responsibility for the management of the Group rests with the Board of Directors.
The Board focuses primarily upon strategic and policy issues and is responsible for the Group’s long-term success. It sets the Group’s strategy, oversees the allocation of resources and
monitors the performance of the Group. It is responsible for effective risk assessment and management.
The BoardThe Board has a formal schedule of matters reserved to it and delegates certain matters to its Committees. It is anticipated that the Board will convene on seven occasions during 2018, holding ad hoc meetings to consider non-scheduled business if required.
The Chairman and Chief Executive The division of responsibilities between the Chairman and the Chief Executive is set out in writing. This was reviewed during the year on the appointment of our new Chief Executive, as well as being part of the Company’s annual corporate governance review. No amendments were considered necessary. The interactions in the governance process are shown in the schematic below.
Board CommitteesThe principal governance Committees of the Board are the Audit, Remuneration and Nomination Committees. Each Committee has written terms of reference, which were reviewed during the year. No amendments were considered to be required. These are available to view on the Company’s website www.vesuvius.com.
For biographical details see Board of Directors on pages 50 and 51.
Governance Committees
Board
Administrative CommitteesAudit CommitteeTo monitor the integrity of fi nancial reporting and to assist the Board in its review of the effectiveness of the Group’s internal controls and risk management systems
Chairman:Douglas Hurt
Membership:All independent Non-executive Directors
Remuneration CommitteeTo determine the appropriate remuneration packages for the Group’s Chairman, Executive Directors and Company Secretary, and to recommend and monitor the level and structure of remuneration for other senior management
Chairman:Jane Hinkley
Membership:All independent Non-executive Directors
Nomination CommitteeTo advise the Board on appointments, retirements and resignations from the Board and its Committees and to review succession planning and talent development for the Board and senior management
Chairman:John McDonough, Chairman(except when considering his own succession, in which case the Committee is chaired by an appropriate Non-executive Director)
Membership:Chairman and any threeNon-executive Directors
In addition, the Board delegates certain responsibilities on an ad hoc basis to a Finance Committee and Share Scheme Committee, which operate in accordance with the delegated authority agreed by the Board
Finance CommitteeTo approve specifi c funding and Treasury-related matters in accordance with the Group’s delegated authorities or as delegated by the Board
Chairman:John McDonough, Chairman
Membership:Chairman, Chief Executive, Chief Financial Offi cer and Group Head of Corporate Finance
Share Scheme CommitteeTo facilitate the administration of the Company’s share schemes
Chairman:Any Board member
Membership:Any two Directors or a Director and the Company Secretary
Group Executive CommitteeThe Group also operates a Group Executive Committee (‘GEC’), which is convened and chaired by the Chief Executive and assists him in discharging his responsibilities. The GEC comprises the Chief Executive, Chief Financial Offi cer, the four Business Unit Presidents, the Chief Human Resources Offi cer, the Chief Technology Offi cer, the President Operations, and the General Counsel and Company Secretary. The GEC met six times during 2017 and is scheduled to meet seven times during 2018. Its meetings are generally held at major operational sites or in the London head offi ce. Having reviewed the role of the GEC, the new Chief Executive has chosen to maintain its operation in its current form.

79G
overnance
Board and Committee AttendanceThe attendance of Directors at the Board meetings and at meetings of the principal Committees of which they are members held during 2017 is shown in the table below. The maximum number of meetings in the period during which the individual was a Board or Committee member is shown in brackets.
BoardAudit
CommitteeRemuneration
CommitteeNomination Committee
ChairmanJohn McDonough CBE 8 (9) – – 6 (6)Executive DirectorsPatrick André (appointed 1 September 2017) 3 (3) – – –Guy Young 9 (9) – – –François Wanecq (retired 31 August 2017) 6 (6) – – –Non-Executive DirectorsChrister Gardell 9 (9) – – 5 (6)Hock Goh 8 (9) 4 (5) 3 (5) 5 (6)Jane Hinkley 9 (9) 5 (5) 5 (5) 6 (6)Douglas Hurt 8 (9) 5 (5) 4 (5) 6 (6)Holly Koeppel (appointed 3 April 2017) 7 (7) 2 (3) 4 (4) 4 (4)
John McDonough was absent from a Board meeting due to a family emergency. The meeting was chaired in his absence by the Senior Independent Director (‘SID’), Douglas Hurt. Hock Goh and Douglas Hurt were unable to make additional Board and Remuneration Committee meetings, scheduled at short notice, due to prior engagements.
To the extent that Directors are unable to attend scheduled meetings, or additional meetings called on short notice, they receive the papers in advance and relay their comments to the Chairman for communication at the meeting. The Chairman follows up after the meeting in relation to the decisions taken. In 2017, the Chairman sought Hock Goh and Douglas Hurt’s views on the matters to be discussed at the Board meeting they were due to miss, in each case prior to the meeting, and provided feedback to them on the outcome of discussions. The Committee Chairmen likewise contacted those Directors who were unable to attend Committee meetings in advance of those meetings, to canvass their views and understand any issues they wished to raise in respect of the subject matters being discussed. The SID maintained contact with the Chairman regarding his priorities for the meeting he was unable to attend, together with the discussions undertaken and the action points that stemmed from that meeting.
Governance Structure
Non-executive Directors
Exercise a strong, independent voice, challenging and supporting Executive Directors. Scrutinise performance against objectives and monitor fi nancial reporting. Monitor and oversee risks and controls, determine Executive Director remuneration and manage Board succession through their Committee responsibilities
Chairman
Provides leadership and guidance for the Board, promoting a high standard of corporate governance. Sets the Board agenda and manages meetings. Independent on appointment, he is the link between the Executive and Non-executive Directors
Chief Executive
Develops strategy for review and approval of the Board. Directs, monitors and maintains the operational performance of the Company. Responsible for the application of Group policies, implementation of Group strategy and the resources for their delivery. Accountable to the Board for Group performance
Senior Independent Director
Acts as a sounding board for the Chairman, an alternative contact for shareholders and an intermediary for other Non-executive Directors. Leads the annual evaluation of the Chairman and recruitment process for his/her replacement, when required
Company Secretary
Advises the Chairman on governance, together with updates on regulatory and compliance matters. Supports the Board agenda with clear information fl ow. Acts as a link between the Board and its Committees and between Non-executive Directors and senior management
The Board
Responsible for Group strategy, risk management, succession and policy issues. Sets the tone, values and culture for the Group. Monitors the Group’s progress against the targets set

80 Vesuvius plcAnnual Report and Accounts 2017
Governance Report continued
Board Effectiveness
Board CompositionThe Board comprises eight Directors – the Non-executive Chairman, John McDonough CBE; the Chief Executive, Patrick André; the Chief Financial Offi cer, Guy Young; and fi ve Non-executive Directors. Patrick André joined the Board as Chief Executive on 1 September 2017, replacing François Wanecq who retired from the Board on 31 August 2017 as part of a planned succession process. Holly Koeppel joined the Board as an independent Non-executive Director on 3 April 2017. Douglas Hurt is the Senior Independent Director. Henry Knowles is the Company Secretary.
The Board focuses on ensuring that both it, and its Committees, have the appropriate range of diversity, skills, experience, independence and knowledge of the Company, and the markets in which it operates, to enable it to discharge its duties and responsibilities effectively. The Board continues to look at diversity in its broadest sense – refl ected in the range of backgrounds and experience of our Board members who are drawn from different nationalities and have managed a variety of complex global businesses. During the year, the Board refl ected on the recommendations of the Hampton-Alexander, Parker and McGregor-Smith reviews on gender and ethnic diversity and formalised its approach to diversity with the approval of a Board Diversity Policy. The policy sets out the Board’s objectives with regard to diversity to ensure that the Company maintains the optimum Board and Committee composition, underpinning the fundamental requirement to maintain the right balance of independence, skills and knowledge in the boardroom. Details of the Nomination Committee’s activities in compliance with the policy during the year are included in the Nomination Committee Report.
The Board’s overall skills and experience, as well as Non-executive Director independence, were reviewed during the year as part of the process of recruiting the two new Directors. The Board’s composition also formed part of the Board evaluation process. Two of the eight Directors (25%) are women and four (50%) are non-UK citizens. The Board also contains individuals from a range of ethnic backgrounds. The Board consequently considers its diversity, size and composition to be appropriate for the requirements of the business, and in line with its adopted policy. The Board recognises that the Hampton-Alexander Review has set a target of 33% female representation on FTSE 350 Boards by 2020. Whilst the Board does not believe that it is appropriate to accelerate its planned rotation of Directors purely to meet this target, it will continue to consider the benefi ts of greater diversity in all future Director recruitment decisions.
Board Diversity PolicyPurposeThis policy sets out the approach to diversity in respect of the Board of Directors of Vesuvius plc. The policy is intended to assist the Board, through the work of the Nomination Committee, in creating and maintaining optimum Board and Committee composition.
The broad principles of diversity contained in this policy apply to all employees of the Vesuvius Group. The Vesuvius Code of Conduct refl ects Vesuvius’ commitment to diversity and respect for its employees.
Policy StatementVesuvius plc recognises the value of a diverse and skilled workforce and is committed to creating and maintaining an inclusive and collaborative workplace culture that will provide sustainability for the organisation into the future.
Policy ObjectivesThe Nomination Committee will focus on ensuring that it, the Board and the Board’s other Committees have the appropriate range of diversity, skills, experience, independence and knowledge of the Company to enable them to discharge their duties and responsibilities effectively.
The Nomination Committee will ensure that all appointments to the Board are based on merit with each candidate assessed against objective criteria focused on the skills, experience and knowledge required of the position, and with due regard to the benefi ts of diversity on the Board.
The Nomination Committee will engage with executive search fi rms in a manner which ensures that opportunities are taken for a diverse range of candidates to be considered for appointment. This will include ensuring that the Committee only uses search fi rms that are signed up to the Voluntary Code of Conduct for Executive Search Firms.
The Nomination Committee supports senior management efforts to increase diversity in the senior management pipeline to facilitate succession planning towards executive Board positions.
With respect to the representation of women on the Board, highlighted by the Davies and Hampton-Alexander Reviews, the Board is supportive of the initiative to increase the proportion of women on the boards of FTSE 350 companies. Vesuvius, which at the date of this policy has a Board comprising 25% female membership, will continue to ensure that the Board of Vesuvius plc refl ects this level, or greater levels of gender diversity, as are appropriate for its size and dynamics, to enable it to continue to deliver on the requirements of the Vesuvius business.
Monitoring and ReportingThis policy and progress against its objectives will be reviewed annually.
The Nomination Committee is responsible for the implementation of this policy and for monitoring progress towards the achievement of its objectives.
Board Composition
Number of Directors with key skills and experienceChairman, Chief Executive or CFO experienceSafety and RiskFinancialGlobal engineering and manufacturingRelated industrial experienceOperational leadershipStrategic planning
4
6 4
7
7
4
8
81G
overnance
Committee composition is set out in the relevant Committee reports. No one, other than the Committee Chairman and members of the Committee, is entitled to participate in meetings of the Audit, Nomination and Remuneration Committees. However, as detailed in the Committee reports, where the agenda permits, other Directors and senior management regularly attend by invitation, supporting the operation of each of the Committees in an open and consensual manner.
The Board considers that, for the purposes of the UK Corporate Governance Code, four Non-executive Directors (excluding the Non-executive Chairman), namely Hock Goh, Jane Hinkley, Douglas Hurt and Holly Koeppel, are independent of management and free from any business or other relationship which could affect the exercise of their independent judgement. Christer Gardell is Managing Partner of Cevian Capital which holds 21.11% of Vesuvius’ issued ordinary share capital and is not considered to be independent. He brings a wealth of commercial acumen to the Board. The Chairman satisfi ed the independence criteria on his appointment to the Board. Biographical details of the Directors are set out on pages 50 and 51.
Appointment to the BoardRecommendations for appointments to the Board are made by the Nomination Committee. Further information is set out in the Nomination Committee report on pages 93 to 95.
Time Commitment of the Chairman and the Non-executive Directors The Chairman and Non-executive Directors each have a letter of appointment which sets out the terms and conditions of their directorship. An indication of the anticipated time commitment is provided in any recruitment role specifi cation, and each Non-executive Director’s letter of appointment provides details of the meetings that they are expected to attend, along with the need to accommodate travelling time. Non-executive Directors are required to set aside suffi cient time to prepare for meetings, and regularly to refresh and update their skills and knowledge. All Non-executive Directors have agreed to commit suffi cient time for the proper performance of their responsibilities, acknowledging that this will vary from year to year depending on the Group’s activities, and will involve visiting manufacturing and customer sites around the Group. The Chairman in particular dedicates a signifi cant amount of time to Vesuvius in discharging his duties. The Board notes that the Chairman holds chairmanships other than Vesuvius, but that only one of these is for a listed company. The other two chairmanships are for much smaller private companies where the time commitment is limited.
All Directors are expected to attend all scheduled Board and Committee meetings and any additional meetings as required. Each Director’s other signifi cant commitments are disclosed to the Board during the process for their appointment and they are required to notify the Board of any subsequent changes. The Company has reviewed the availability of the Chairman and the Non-executive Directors and considers that each of them can, and in practice does, devote the necessary amount of time to the Company’s business.
At the time of her appointment, Holly Koeppel served on a number of Boards and was in the process of adjusting her portfolio and retiring from her executive positions. During 2017, she stepped down from all but one of her board appointments, and now only serves as a Non-executive Director on two other boards, having taken on a new Non-executive position at British American Tobacco plc in July 2017.
The Board notes that Hock Goh holds a number of other directorships, but that these other commitments typically only require a total of 25 days’ work per year. MEC Resources Ltd is the listed parent company of Advent Energy Ltd, an investment company that is not currently operational. As a result, Hok Goh’s commitments as Chairman of these companies are currently minimal and he is only required to attend two Board meetings a year. His other directorships require attendance at a small number of Board meetings each year. Having reviewed this, the Board believes that Hock’s additional commitments do not prevent him from properly fulfi lling his duties as a Non-executive Director of Vesuvius plc.
Information and Support The Board ensures that it receives, in a timely manner, information of an appropriate quality to enable it adequately to discharge its responsibilities. Papers are provided to the Directors in advance of the relevant Board or Committee meeting to enable them to make further enquiries about any matters prior to the meeting should they so wish. This also allows Directors who are unable to attend to submit views in advance of the meeting.
In addition to the formal Board processes, the Chief Executive provides written updates on important Company business issues between meetings, and the Board is provided with a comprehensive monthly report of key fi nancial and management information. Regular updates on shareholder issues are provided to the Directors, who also receive copies of analysts’ notes issued on the Company. For the distribution of all information, Directors have access to a secure online portal, which contains a reference section containing background information on the Company.
All Directors have access to the advice and services of the Company Secretary. There is also an agreed procedure in place for Non-executive Directors, in the furtherance of their duties, to take independent legal advice at the Company’s expense.
Induction and TrainingA comprehensive induction programme is available to new Directors. The core of the induction programme is designed in compliance with the UK Corporate Governance Code, and is tailored to meet the requirements of the individual appointee and the dynamics of the Group. This process was undertaken twice during the year, on the appointment of Holly Koeppel as a Non executive Director and the appointment of Patrick André as Chief Executive.
The Chairman, through the Company Secretary, continues to ensure that there is an ongoing process to review training and development needs. Directors are provided with details of seminars and training courses relevant to their role, and are

82 Vesuvius plcAnnual Report and Accounts 2017
encouraged and supported by the Company in attending them. In 2017, regulatory updates were provided as a standing item at each Board meeting in a Secretary’s Report. External input on legal and regulatory developments impacting the business was also given, with specialist advisers invited to the Board and its Committees to provide briefi ngs on overall market and economic developments including Brexit, forthcoming accounting changes, legal developments in data protection and tax matters, and other general corporate governance issues.
In addition, in 2017 the full Board visited our operations and customers in Brazil, gaining a broader understanding of the South American business. The Chairman visited our operations in China in May, and other Non-executive Directors visited operations in Poland, the US and Germany during the year. In 2018, the Non-executive Directors will continue to broaden their understanding of the Group through further site visits.
Governance in Action – Chief Executive Induction1. Following his appointment as Chief Executive, the Board requested that
the Company Secretary arrange a comprehensive induction programme for Patrick André. This recognised his prior employment with the Group as President, Flow Control and was therefore tailored to focus on the corporate aspects of his new role and the work of the other business units.
2. Reference materials were provided, including information about the Board, its Committees, procedures for dealing in the Company’s shares and other regulatory and governance matters. All aspects of risk and its management through insurance, compliance and relevant corporate policies and procedures were covered. Patrick was advised of his legal and other duties, and obligations as a Director of a listed company. These matters were discussed in detail in a series of meetings conducted by internal management and external advisers.
3. Patrick held one-to-one meetings with all other Board members, and conducted meetings with key executives throughout the Group, including regular meetings and joint site and customer visits with the outgoing Chief Executive. He also held a week of off-site meetings with the Group Executive Committee to strengthen the relationship with his new team and focus on the organisational structure of the key functions of the Group.
4. Since his appointment Patrick has been undertaking a comprehensive programme of site visits, with a view to visiting all the Group’s key R&D and manufacturing facilities.
5. Patrick has met with the Group’s principal advisers, the Company’s brokers and investor community, using this as an opportunity to understand their roles and the corporate governance environment in greater detail.
6. The Board monitored the induction process, and asked the Company Secretary to provide updates on its progress.
Performance EvaluationThe Board carries out an evaluation of its performance and that of its Committees every year. In 2017, this evaluation took place in the fourth quarter and was again externally facilitated by the corporate advisory fi rm, Lintstock. The Group subscribes to access Lintstock’s Insider database, but has no other connection with the organisation. This year’s evaluation utilised a fresh approach. Rather than conducting the evaluation via a series of questionnaires, this year Lintstock issued a short questionnaire and then conducted a series of in-depth interviews with each Director and the Company Secretary aimed at analysing and gaining further insight into their responses. As with previous years, the evaluation not only covered the performance of the Board but also that of its Committees, along with individual reviews of each Director and analysis of the performance of the Chairman. A narrative report, broken down into thematic areas, was then presented to the Board.
The 2016 evaluation had highlighted several priorities for 2017, including strategy and Board succession, and had also identifi ed areas for ongoing improvement, including greater efforts to support the development of staff members below senior management level. As part of the 2017 evaluation, the Board assessed that the Nomination Committee had dealt successfully with Board succession during the year, securing an excellent new Non-executive Director, and identifying an accomplished candidate to replace François Wanecq as Chief Executive. Overall, the Board felt that the transition of Chief Executive had been effectively managed. The development of staff members below senior management level continued during 2017 and remains a focus for 2018, with new training programmes implemented, and continuing initiatives in place to ensure greater Board access to these individuals.
Regarding priorities for 2018, the evaluation highlighted the need to continue to support the integration of the new Chief Executive, to ensure he establishes effective working relationships with members of the Board and senior management, and is supported in formulating and implementing his objectives for the Group. The Board noted there would be an ongoing emphasis on strategy, and recognising the increasing corporate governance focus on stakeholder communication, the Board would need to continue to develop plans to interact with stakeholders and oversee the culture of the Group. The evaluation also identifi ed a consistent theme regarding personal development plans. It was agreed that the Board would focus on this during its oversight of senior management. In respect of its own activities, individual Non-executive Directors would be encouraged to continue undertaking site visits to operations throughout the Group.
On more practical matters, there was a continuing need to improve Board processes, with the refi nement of Board packs, and the promotion of consistency in Board presentations. As in previous years, a set of action points was compiled from the output of the evaluation to ensure that its fi ndings are implemented into the Board’s activities. This is supervised by the Chairman and reviewed throughout the year.
The Chairman noted that, overall, the evaluation had concluded that the Board remained of a high calibre and was functioning well, with open debate and good information fl ow. The individual assessment of Directors concluded that all continued to contribute effectively, devoting adequate time to their duties and being engaged and proactive in debate at all meetings. Each of the Committees was considered to have operated effectively during the year, with recognition that the Remuneration Committee had overseen the successful implementation of the new Remuneration Policy, the Audit Committee had overseen the smooth transition in external auditor, and the Nomination Committee had undertaken two productive rounds of recruitment.
Appointment and Replacement of DirectorsBoard membership should not be fewer than fi ve nor more than 15 Directors, save that the Company may, by ordinary resolution, from time to time, vary this minimum and/or maximum number of Directors. Directors may be appointed by ordinary resolution or by the Board. A Director appointed by the Board must retire from offi ce at the fi rst Annual General
Governance Report continued
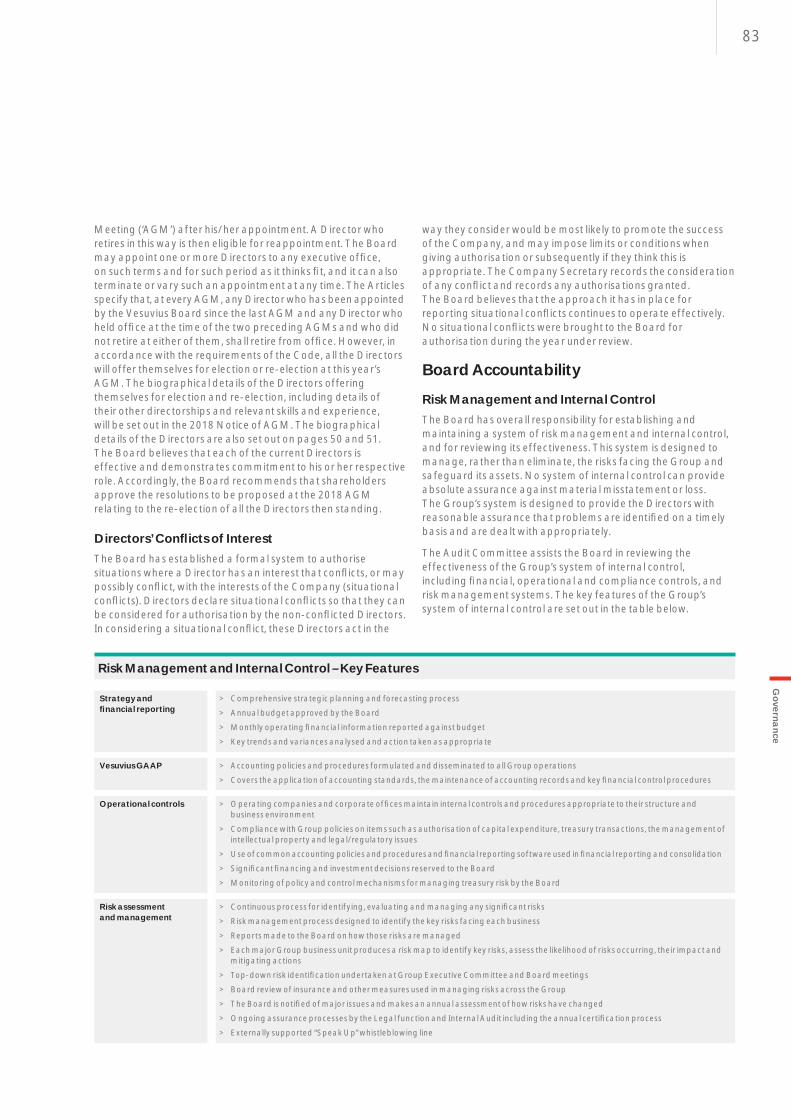
83
Meeting (‘AGM’) after his/her appointment. A Director who retires in this way is then eligible for reappointment. The Board may appoint one or more Directors to any executive offi ce, on such terms and for such period as it thinks fi t, and it can also terminate or vary such an appointment at any time. The Articles specify that, at every AGM, any Director who has been appointed by the Vesuvius Board since the last AGM and any Director who held offi ce at the time of the two preceding AGMs and who did not retire at either of them, shall retire from offi ce. However, in accordance with the requirements of the Code, all the Directors will offer themselves for election or re-election at this year’s AGM. The biographical details of the Directors offering themselves for election and re-election, including details of their other directorships and relevant skills and experience, will be set out in the 2018 Notice of AGM. The biographical details of the Directors are also set out on pages 50 and 51. The Board believes that each of the current Directors is effective and demonstrates commitment to his or her respective role. Accordingly, the Board recommends that shareholders approve the resolutions to be proposed at the 2018 AGM relating to the re-election of all the Directors then standing.
Directors’ Confl icts of InterestThe Board has established a formal system to authorise situations where a Director has an interest that confl icts, or may possibly confl ict, with the interests of the Company (situational confl icts). Directors declare situational confl icts so that they can be considered for authorisation by the non-confl icted Directors. In considering a situational confl ict, these Directors act in the
way they consider would be most likely to promote the success of the Company, and may impose limits or conditions when giving authorisation or subsequently if they think this is appropriate. The Company Secretary records the consideration of any confl ict and records any authorisations granted. The Board believes that the approach it has in place for reporting situational confl icts continues to operate effectively. No situational confl icts were brought to the Board for authorisation during the year under review.
Board Accountability
Risk Management and Internal ControlThe Board has overall responsibility for establishing and maintaining a system of risk management and internal control, and for reviewing its effectiveness. This system is designed to manage, rather than eliminate, the risks facing the Group and safeguard its assets. No system of internal control can provide absolute assurance against material misstatement or loss. The Group’s system is designed to provide the Directors with reasonable assurance that problems are identifi ed on a timely basis and are dealt with appropriately.
The Audit Committee assists the Board in reviewing the effectiveness of the Group’s system of internal control, including fi nancial, operational and compliance controls, and risk management systems. The key features of the Group’s system of internal control are set out in the table below.
Governance
Strategy and fi nancial reporting
> Comprehensive strategic planning and forecasting process
> Annual budget approved by the Board
> Monthly operating fi nancial information reported against budget
> Key trends and variances analysed and action taken as appropriate
Vesuvius GAAP > Accounting policies and procedures formulated and disseminated to all Group operations
> Covers the application of accounting standards, the maintenance of accounting records and key fi nancial control procedures
Operational controls > Operating companies and corporate offi ces maintain internal controls and procedures appropriate to their structure and business environment
> Compliance with Group policies on items such as authorisation of capital expenditure, treasury transactions, the management of intellectual property and legal/regulatory issues
> Use of common accounting policies and procedures and fi nancial reporting software used in fi nancial reporting and consolidation
> Signifi cant fi nancing and investment decisions reserved to the Board
> Monitoring of policy and control mechanisms for managing treasury risk by the Board
Risk assessment and management
> Continuous process for identifying, evaluating and managing any signifi cant risks
> Risk management process designed to identify the key risks facing each business
> Reports made to the Board on how those risks are managed
> Each major Group business unit produces a risk map to identify key risks, assess the likelihood of risks occurring, their impact and mitigating actions
> Top-down risk identifi cation undertaken at Group Executive Committee and Board meetings
> Board review of insurance and other measures used in managing risks across the Group
> The Board is notifi ed of major issues and makes an annual assessment of how risks have changed
> Ongoing assurance processes by the Legal function and Internal Audit including the annual certifi cation process
> Externally supported “Speak Up” whistleblowing line
Risk Management and Internal Control – Key Features

84 Vesuvius plcAnnual Report and Accounts 2017
Reviewing the Effectiveness of Risk Management and Internal ControlThe internal control system covers the Group as a whole, and is monitored and supported by the Group’s Internal Audit function, which conducts reviews of Vesuvius’ businesses and reports objectively both on the adequacy and effectiveness of the system of internal control and on those businesses’ compliance with Group policies and procedures. The Audit Committee receives reports from the Group Head of Internal Audit and reports to the Board on the results of its review.
As part of the Board’s process for reviewing the effectiveness of the system of internal control, it delegates certain matters to the Audit Committee.
Following the Audit Committee’s review of internal fi nancial controls and of the processes covering other controls, the Board annually evaluates the results of the internal control and risk management procedures conducted by senior management. This includes a self-certifi cation exercise by which senior fi nancial, operational and functional management certify the compliance throughout the year of the areas under their responsibility with the Group’s policies and procedures and highlight any material issues that have occurred during the year.Since the date of this review, there have been no signifi cant changes in internal controls or other matters identifi ed which could signifi cantly affect them.
In accordance with the provisions of the Code, the Directors confi rm that they have carried out a robust assessment of the principal risks facing the Company, including those that threaten its business model, future performance, solvency or liquidity. They have also reviewed the effectiveness of the Group’s system of internal control and confi rm that the necessary actions have been taken to remedy any control weaknesses identifi ed during the year.
The Group’s principal risks and how they are being managed or mitigated are detailed on pages 24 and 25, and the Viability Statement which considers the Group’s future prospects is detailed on page 23. Risk management and internal control is discussed in greater detail in the Audit Committee report.
The Audit CommitteeThe members of the Audit Committee are set out on page 85. The Audit Committee report which describes the Audit Committee’s work in discharging its responsibilities, is set out on pages 85 to 92.
Executive Compensation and RiskAll of the independent Non-executive Directors serve on both the Audit and Remuneration Committees. They therefore bring their experience and knowledge of the activities of each Committee to bear when considering critical areas of judgement. This means that, for example, the Directors are able to consider carefully the impact of incentive arrangements on the Group’s risk profi le and to ensure that the Group’s Remuneration Policy and programme are structured to align with the long-term objectives and risk appetite of the Company.
Share Capital and VotingDisclosure of the information regarding share capital, the authorisation received by Directors at the AGM regarding the issue of shares and the authority to purchase own shares, is contained on page 118 within the Directors’ Report. There are no restrictions on voting contained in the Company’s Articles of Association. Further details are set out in the Directors’ Report on page 119.
Relations with ShareholdersThe Board is committed to communicating with shareholders and other stakeholders in a clear and open manner, and seeks to ensure effective engagement through the Company’s regular communications, the AGM and other investor relations activities. The Company undertakes an ongoing programme of meetings with investors, which is managed by the Chief Executive and Chief Financial Offi cer. The majority of meetings with investors are led by them. Following the announcement of his appointment as Chief Executive, Patrick André accompanied Guy Young and François Wanecq on the investor roadshows conducted to communicate the half-year results. Since formally taking up his Chief Executive position, Patrick has been continuing to meet with investors, attending investor conferences and meeting with market analysts.
In advance of the 2017 AGM, we wrote to our largest shareholders inviting discussion on any questions they might like to raise and making the Chairmen of the Board, the Audit Committee and the Remuneration Committee available to meet shareholders should they so wish. In 2017, other than one institutional shareholder, no requests for discussions were received from shareholders following this communication. The Chairman, Senior Independent Director and Committee Chairmen remain available for discussion with shareholders throughout the year on matters under their areas of responsibility, either through contacting the Company Secretary or directly at the AGM.
The Company reports its fi nancial results to shareholders twice a year, with the publication of its annual and half-year fi nancial reports. In addition, to maintain transparency in performance, it also issued two scheduled trading updates during 2017. One was published immediately prior to the 2017 AGM on 10 May 2017, and the second was published on 14 November 2017. In conjunction with these announcements, presentations or teleconference calls were held by the Chief Executive and Chief Financial Offi cer with institutional investors and analysts.
All Directors are expected to attend the Company’s AGM, providing shareholders with the opportunity to question them about issues relating to the Group, either during the meeting or informally afterwards.
Governance Report continued

85
Dear shareholder,On behalf of the Audit Committee, I am pleased to present the Audit Committee Report for 2017. The Committee works largely to a recurring and structured programme of activities which are defi ned in an annual rolling Audit Committee timetable. Additional items are then added and the Committee agenda is modifi ed as the year progresses, to accommodate new topics and priorities. Signifi cant non-standard items that required Committee focus during the year were the appointment of the new external auditor and updating of the Internal Audit reporting process. The Committee also continued its review of ‘deep dive’ topics during the year, covering defi ned benefi t pension schemes and cyber security.
Following the completion of the formal audit tender in 2016, and the appointment of PricewaterhouseCoopers LLP (‘PwC’) in May 2017, the Committee oversaw the seamless transition of the external audit from KPMG LLP to PwC during the year. PwC followed a detailed transition plan, focused on gaining a good understanding of the Group and establishing contact with key management and local personnel. The Committee received regular updates on progress against this plan and benefi ted from PwC’s insights into the Group’s risk control framework as they conducted their initial meetings and reviews.
During the year, the approach to internal audit was updated to allow for clearer focus at the Audit Committee on key control issues, albeit that the overall scope and coverage of the annual Internal Audit plan remained as broad as in previous years. Internal audits are now identifi ed by separate designations – Compliance & Control (‘C&C’), or Effectiveness & Effi ciency (‘E&E’). C&C audit activities focus entirely on internal fi nancial control and key Board compliance issues, with the E&E audits examining a broader constituency of business performance issues. The Audit Committee receives detailed feedback on any issues identifi ed in C&C audit activity, and more general oversight of the results of E&E audit activity. The latter highlight broader performance issues identifi ed by the Internal Audit team for management response and remediation.
The Audit Committee Report describes the work of the Committee during the year including its role in monitoring the integrity of the Company’s fi nancial statements and the effectiveness of the internal and external audit processes. It provides an overview of the signifi cant issues the Committee has considered during the year and its material judgements. It also describes how the Committee fulfi lled its responsibilities to assist the Board in reviewing the effectiveness of the Group’s system of internal control, including fi nancial, operational and compliance controls, and risk management systems.
Yours sincerely
Douglas Hurt Chairman, Audit Committee
Committee MembersDouglas Hurt (Committee Chairman) Hock GohJane HinkleyHolly Koeppel (appointed on 3 April 2017)
The Audit CommitteeThe Audit Committee comprises all the independent Non-executive Directors of the Company, who bring a wide range of fi nancial and commercial expertise to the Committee’s decision-making and evaluation processes. Douglas Hurt is the Senior Independent Director and Chairman of the Audit Committee, having been appointed to these roles by the Board following the 2015 AGM. He was the Finance Director of IMI plc for nine years prior to that and has worked in various fi nancial roles throughout his career. Douglas is also Chairman of the Audit Committees of Countryside Properties PLC and Tate & Lyle plc, and a Chartered Accountant. This background provides him with the ‘recent and relevant fi nancial experience’ required under the Code. The Company Secretary is Secretary to the Committee.
The Code and Financial Conduct Authority Disclosure Guidance and Transparency Rules also contain requirements for the Audit Committee as a whole to have competence relevant to the sector in which the Company operates. Vesuvius’ Non-executive Directors have signifi cant breadth of experience and depth of knowledge on matters related to Vesuvius’ operations, both from their previous roles and from their induction and other activities since joining the Board of Vesuvius. The Directors’ biographies on pages 50 and 51 outline their range of multinational business-to-business experience and expertise in fi elds including engineering, manufacturing, services and logistics as well as fi nancial and commercial acumen. The Board therefore considers that the Audit Committee as a whole has competence relevant to Vesuvius’ business sector.
MeetingsThe Committee met fi ve times during 2017. The Committee has also met twice since the end of the fi nancial year and prior to the signing of this Annual Report. The Board Chairman, the non-independent Non-executive Director, the Chief Executive, the Chief Financial Offi cer, the Group Financial Controller, the Head of Internal Audit and the external auditor were all invited to each meeting. Other management staff were also invited to attend as appropriate. In preparation for their tenure as the new external auditor, PwC attended Audit Committee meetings prior to their formal appointment by shareholders at the 2017 AGM.
In February 2017, the Audit Committee held a preliminary meeting on year-end issues in advance of the fi nalisation of the fi nancial statements in early March. This approach was judged to be effective and has been integrated into the Audit Committee schedule going forward.
Audit Committee
Governance

86 Vesuvius plcAnnual Report and Accounts 2017
Audit Committee meetings are conducted to promote an open debate, to challenge constructively signifi cant accounting judgements, to provide guidance and oversight to management to ensure that the business maintains an appropriately robust control environment and to provide informed advice to the Board on fi nancial matters. The Chairman of the Audit Committee encourages open dialogue between the external auditors, the management team and the Head of Internal Audit between Audit Committee meetings to ensure that emerging issues are addressed in a timely manner.
During the year, as is the Audit Committee’s established practice, the Committee members met and discussed business and control matters with senior management during site visits, informal meetings and Board presentations. The Committee also met privately with the Head of Internal Audit, and the external auditor without any executives present.
The outcomes of Audit Committee meetings were reported to the Board and all members of the Board received the agenda, papers and minutes of the Committee.
Role and ResponsibilitiesThe main role and responsibilities of the Committee continue to be to:
> Monitor the integrity of the fi nancial statements of the Company and the Group, and any formal announcements relating to the Group’s fi nancial performance, informing the Board of the outcome of the audit
> Monitor and review the effectiveness of the Group’s internal fi nancial controls and the Group’s internal control and risk management systems
> Establish and review procedures for detecting fraud, systems and controls for the prevention of bribery and oversee the Company’s arrangements for employees to raise concerns about possible wrongdoing in fi nancial reporting or other matters
> Monitor and review the effectiveness of the Company’s Internal Audit function
> Make recommendations to the Board on the appointment, reappointment and removal of the external auditor and approve the remuneration and terms of engagement of the external auditor
> Monitor and review the external auditor’s independence, objectivity and effectiveness, taking into consideration any non-audit services provided, and the relevant UK professional and regulatory requirements
> Take account of the fi ndings and conclusions of any FRC audit inspection undertaken, when monitoring the performance of the audit
The Committee operates under formal terms of reference approved by the Board, which were reviewed during the year. They are available in the Investors/Corporate Governance section of the Company’s website, www.vesuvius.com.
Within these terms, the Committee and its individual members are empowered to obtain outside legal or other independent professional advice at the cost of the Company. These powers were not utilised during the year. The Committee may also secure the attendance at its meetings of any employee or other parties with relevant experience and expertise should it be considered necessary.
Activities in 20171. The Committee’s agenda covered the usual standing items – the review
of fi nancial results, the effectiveness of the Group’s internal fi nancial controls, and the review of the internal control and risk management systems – as well as non-standard items, including oversight of the transition of the external audit from KPMG to PwC.
2. The Audit Committee continued to devote time to ensure that initiatives to mitigate potential risks and fi nancial exposure remained robust and appropriate. The Committee challenged the adequacy of inventory and receivables provisions, the assumed growth rates and discount rates used for asset impairment assessments, as well as the accounting for and presentation of the Group-wide restructuring programme undertaken in response to the challenging conditions within our end-markets.
3. The Committee considered the Company’s going concern statement and challenged the nature, quantum and assessment of the signifi cant risks to the business model, future performance, solvency and liquidity of the Group that were modelled as part of the scenarios and stress testing undertaken to support the Viability Statement made by the Company in the 2016 Accounts. The 2017 Viability Statement, which was also critically reviewed, is contained within the Strategic Report and can be found on page 23.
4. The Committee monitored the resourcing and delivery of the 2017 Internal Audit plan and approved the 2018 Internal Audit plan. The Committee monitored both the responses from and follow-up by management to Internal Audit recommendations arising during the year and, where necessary, the Committee tasked management to verify their successful closure within defi ned timescales.
5. The Committee examined specifi c audit issues such as tax matters, including the judgements inherent in the partial recognition of deferred tax assets for US tax losses and undertook ‘deep dive’ reviews of cyber security and the Group’s defi ned benefi t pension arrangements.
6. The Committee considered the impact of new accounting standards including IFRS 9 Financial Instruments and IFRS 15 Revenue from contracts with customers – and reviewed the implementation plan for these in the 2018 fi nancial year. Based on an assessment of these standards, the Group does not believe there will be a signifi cant impact on its Group Financial Statements.
The Committee members believe that they received suffi cient, relevant and reliable information throughout the year from management and the external auditor to enable the Committee to fully discharge its responsibilities. The work of the Audit Committee is further elaborated in the paragraphs below.
Statement of compliance with the Competition and Markets Authority (‘CMA’) OrderThe Committee considers that the Company has complied with The Statutory Audit Services for Large Companies Market Investigation (Mandatory Use of Competitive Processes and Audit Committee Responsibilities) Order 2014 (Article 7.1), published by the CMA on 26 September 2014, including with respect to the Audit Committee’s responsibilities for agreeing the audit scope and fees and authorising non-audit services.
Audit Committee continued

87
Financial ReportingThe Committee fulfi lled its primary responsibility to review the integrity of the 2017 half-year and 2017 annual fi nancial statements and recommended their approval to the Board. The Committee also reviewed the two trading updates released during the year.
In forming its views, the Committee assessed:
> The quality, acceptability and consistency of the accounting policies and practices
> The clarity and consistency of the disclosures, including compliance with relevant fi nancial reporting standards and other reporting requirements
> Signifi cant issues where management judgements and/or estimates had been made that were material to the reporting or where discussions had taken place with the external auditor in arriving at the judgement or estimate
> In relation to the overall Annual Report, whether the Annual Report and Accounts taken as a whole was fair, balanced and understandable, taking into consideration all the information available to the Committee
> The application of the FRC’s guidance on clear and concise reporting
> The disclosure and presentation of alternative performance measures, in view of the new guidance from the European Securities and Markets Association
The Committee actively deliberated and challenged reports from the Chief Financial Offi cer and Group Financial Controller. These were well prepared and, for areas of judgement and/or estimation, set out the rationale for the accounting treatment and disclosures, and the pertinent assumptions and the sensitivities of the estimates to changes in the assumptions. PwC also delivered memoranda for the half-year and year-end, stating their views on the treatment of signifi cant issues. PwC provided a summary for each issue, including its assessment of the prudence of management’s judgements or estimates. The Committee considered the overall level of prudence applied this year, compared this with the prior year and concluded that it remained unchanged.
Signifi cant Issues and Material JudgementsThe Committee considered the following signifi cant issues in the context of the 2017 fi nancial statements. It considered these areas to be signifi cant taking into account the level of materiality and the degree of judgement exercised by management. The Committee resolved that the judgements and estimates made on each of the signifi cant issues detailed below were appropriate and acceptable.
Income TaxIncome tax remains a complex area where signifi cant judgements are required to estimate both uncertain tax liabilities and the value of deferred tax assets.
The Committee challenged the assumptions used to arrive at the £34.3m (2016: 34.9m) provided for income tax payable which includes £23.2m (2016: £24.5m) for uncertain tax provisions as set out in Note 10.5. After discussions with internal tax experts and considering the results of recent tax audits and the views of the external auditors, the Committee concurred with management’s judgement.
At the end of 2017, the Group recognised a US deferred tax asset of £32.6m (2016: £65.9m). The Group has signifi cant additional tax losses and other temporary differences in the US and elsewhere which have not been recognised, which are kept under review. The recognition of deferred tax assets for tax losses and other temporary differences is a highly technical area and the Committee has drawn on internal experts to understand the treatment. The future prospects for US profi tability were carefully modelled by management and challenged by the Committee, as was the impact of the signifi cant tax reform announced in late December 2017 in the US Tax Cuts and Jobs Act (‘TCJA’). The Committee particularly noted that this reform had a material impact on the Group’s deferred tax position, and of itself caused a write-down in Vesuvius’ US deferred tax asset of £25.7m which, in addition to other normal movements in the year and exchange revaluation, resulted in the signifi cant decrease in the value of this asset in 2017. The Committee also noted that, as there is uncertainty in how some of the provisions of TCJA will operate, subsequent guidance issued by US Treasury may impact Vesuvius’ reported tax position. The Committee reviewed the Group’s projections for trading in the US which had improved in 2017, and concurred with management that the US forecast profi ts are considered suffi cient to sustain the deferred tax asset in the US at the end of 2017.
Other ProvisionsThe Committee has been made aware of a number of potential exposures and claims arising from ongoing litigation, product quality issues, employee disputes, restructuring, environmental matters, onerous leases, indirect tax disputes and indemnities or warranties outstanding for disposed businesses. Due to the long gestation period before settlement can be reached, provisioning for these items requires careful judgement in order to establish a reasonable estimate of future liabilities. The Committee also assessed the strength of any insurance coverage for certain of these liabilities and challenged the accounting treatment for any amounts deemed to be recoverable from insurers. Subsequent to this challenge, certain insured liabilities have been represented in the balance sheet on a gross basis. After due consideration and challenge, with expert advice sought in certain areas, the Committee is satisfi ed that there are appropriate levels of provisions set aside to settle third-party claims and disputes (Note 32) and that adequate disclosure has been made under International Accounting Standards (IAS) 1 (paragraph 129) in respect of estimation uncertainties that might impact the accounts in the following
Governance

88 Vesuvius plcAnnual Report and Accounts 2017
fi nancial year. Where the outcome of an existing issue is uncertain, or where no reliable estimate of the potential liability can be made, no provision has been made and appropriate disclosure is included under contingent liabilities (Note 34).
Restructuring ChargesThe Group restructuring programme continued in 2017 in response to the structural changes in the end-markets that we serve. The Committee critically reviewed the treatment of the restructuring costs disclosed as separately reported items in 2017 and concluded that these have been treated consistently with the accounting policy. This ensures that only signifi cant restructuring programmes that have a defi ned scope and are material in nature are reported separately, which enables the reader more clearly to understand the underlying results of the Group.
Impairment of Intangible AssetsThe year-end carrying value of goodwill of £643.2m was tested against the current and planned performance of the Steel and Foundry cash-generating units (CGUs). The Committee challenged both the determination of the relevant CGUs, the planned and terminal growth assumptions as well as the discount rates used in the assessments and the relevant sensitivities that were evaluated. The detailed assumptions, provided in Note 17, refl ect both a reduction in global risk-free rates offset by the impact of the increasing contribution from the Group’s operations in emerging markets.
The Committee considered the Board-approved medium-term business plans, the range of industry longer-term projections and expert views on discount rates. Given that the models indicated that there remains signifi cant headroom between the value in use and the carrying value, the Committee concurred that no goodwill impairment charges were required.
Working Capital ProvisionsThe Committee challenged the level of provisions held against both receivables and inventories (Notes 18 and 19) and, after reviewing ageing analyses, regional analyses and specifi c customer accounts, concluded that the provisions held were appropriate.
PensionsDetermining the current value of the Group’s future pension obligations requires a number of assumptions. The appropriateness of assumptions used (described in Note 28) was questioned by the Committee, as small changes in the assumptions could have material effects and bond yields in particular have been volatile. The assumptions made by management for each of the major schemes were compared by PwC with other similar schemes. The Committee agreed the reasonableness of the assumptions.
Fair, Balanced and Understandable ReportingThe Committee considered all the information available to it in reviewing the overall content of the Annual Report and Accounts and the process by which it was compiled and reviewed, to enable it to provide advice to the Board that the Annual Report is fair, balanced and understandable. In doing so, the Committee ensured that time was again dedicated to the drafting and review process so that internal linkages were identifi ed and consistency was tested. The Committee welcomed the attention that had been paid in the 2017 Annual Report to explain further the strategy, markets, execution priorities and business model of the Group. Drafts of the Annual Report and Accounts were also reviewed by a senior executive not directly involved in the year-end process who reported to the Committee on his impressions of clarity, comprehensiveness, balance and disclosure in the document. On completion of the process, the Committee was satisfi ed that it could recommend to the Board that the Annual Report and Accounts is fair, balanced and understandable.
Risk Management and Internal ControlsAs highlighted in the reviews of strategy and principal risks in the Strategic Report, risk management is inherent in management’s thinking and is embedded in the business planning processes of the Group. The Board has overall responsibility for establishing and maintaining a system of risk management and internal control, and for reviewing its effectiveness. The Audit Committee assists the Board in reviewing the effectiveness of the Group’s system of internal control, including fi nancial, operational and compliance controls, and risk management systems. This framework is consistent with the Code.
As part of its review of the Group’s principal risks and uncertainties, the Committee supported the Board in its review of risks in 2017. As in previous years, a bottom-up mapping of the risks was constructed and reviewed in each major business unit, delivering a risk register that was then reviewed by the Head of Internal Audit, to deliver a coordinated picture of the key operational risks identifi ed by the business. In conjunction with this, all the members of the Committee and the Board contributed their individual views of top-down strategic risks facing the Group into this process – drawing on the broad commercial and fi nancial experience gained both inside and outside the Group. This information was collated by the Head of Internal Audit into a paper for discussion in the context of the Group’s identifi ed principal risks. This was reviewed and discussed at the Board, and, taking note of the Board’s comments, subsequently by the Group Executive Committee. In monitoring the overall process, Committee members also fully participated in the Board review of existing risks and ongoing mitigating actions. The Committee determined that this approach once again enhanced the Group’s process for identifying and understanding the Group’s principal risks and uncertainties, which are set out on pages 24 and 25. The Committee continues to consider that this process is robust and appropriate.
Audit Committee continued

89
The Committee considered the Company’s going concern statement and challenged the nature, quantum and combination of the unlikely but signifi cant risks to the business model, future performance, solvency and liquidity of the Group that were modelled as part of the scenarios and stress testing undertaken to support the Viability Statement. As part of this review, the Committee considered the Group’s forecast funding position over the next three years and analysed the impact of various scenarios based upon pertinent key risks faced by the Group and with reference to the Group’s debt covenants. The scenarios considered the impact of multiple risks occurring simultaneously and additional mitigating actions that the Group could take. The Committee noted that the Group’s debt profi le had improved in terms of maturity with the completion of a new placement of €100m USPP Notes, and that the resultant debt headroom was suffi cient to accommodate the modelled stress scenarios. As a result of their review, the Committee was satisfi ed that the going concern and Viability Statements had been prepared on an appropriate basis. The 2017 going concern statement is contained in the Directors’ Report on page 117 and the 2017 Viability Statement is contained within the Strategic Report and can be found on page 23.
The Committee also maintains a programme of in-depth reviews into specifi c fi nancial, operational and regulatory areas for the business. These reviews allow the Committee to meet with the business colleagues responsible for these areas and gain greater in-depth understanding about key areas for the Group. In 2017, the Committee undertook ‘deep dive’ reviews of pensions and cyber security. The former provided the Committee with a detailed overview of the Group’s principal liabilities under defi ned benefi t schemes and the steps that were being taken to manage these, noting that de-risking roadmaps are in place for each of the funds. The cyber review covered the assessment of the Group’s cyber security risks, the operation of the Group’s Cyber Security Steering Committee and the actions that were being taken throughout the organisation to improve cyber security. It was noted that improvements had been seen in overall cyber awareness following two successful training campaigns and that plans were in place to allocate additional resources to cyber security during 2018.
In addition, the Committee reviewed the draft UK Tax Strategy disclosure, noting that this had been prepared for publication on the Group’s website in line with statutory requirements, and recommended that it be approved by the Board.
The key features of the Group’s internal control system, which provides assurance on the accuracy and reliability of the Group’s fi nancial reporting are detailed in the Governance Report on page 83. During 2017, the Committee considered the process by which management evaluates internal controls across the Group. The Head of Internal Audit provided the Committee with a summary overview of the assurance provided by the Group’s control framework and the testing of these controls. PwC also reviewed controls in the businesses within the scope of its audit. This review indicated an appropriate control environment, with identifi ed improvement actions under careful management by the Group.
The Group is made up of several large operating units, but also many small units in geographically diverse locations. Consequently, segregation of duties, overlapping access controls on systems and remote management oversight can give rise to control vulnerabilities and fraud opportunities. The Group has not adopted a common Enterprise Resource Planning system as a Group-wide standard. Over time, management intends to move to more sharing of services, enabled by process and systems standardisation between businesses. This is likely to improve the overall internal controls in the smaller operating units.
The Group undertakes a range of activities to mitigate the risk of fraud. This framework is regularly reviewed to determine areas for improvement. In assessing the effectiveness of the Group’s internal controls, the Committee considered the following initiatives which had been implemented over the past two years:
> The publication of a revised Group authority matrix to emphasise a clear assignment of responsibilities and authorities
> A continued focus by regional fi nance directors and the central fi nance team on balance sheet reconciliations;
> The ongoing review by Internal Audit of the separation of duties and access rights at operating entities, to ensure that no one person is in sole control of all aspects of any transaction, to mitigate the risk of fraud
> An updated employee vetting process for prospective senior employees in higher-risk countries
> Ongoing internal communications on the heightened risk of social-engineering fraud, coupled with increased cyber security training to raise awareness of the use of malware
> The formation of a cyber security working group, to focus on enhancing the Group’s resilience to cyber risks
Eliminating the risk of fraud remains one of the key areas of focus for Internal Audit, forming a fundamental part of ‘full scope’ and fi nancial audits. These assess the quality of the balance sheet reconciliation, review key judgement matters, consider ERP access rights, review tenders and quotations, review the entity’s controls over master data changes, and controls over payments and associated applications.
During 2017 the Group continued its review of third-party representatives and intermediaries. This included detailed due diligence for active sales agents and, where required, updates to the contractual basis on which these agents are engaged. The review will be extended to other third-party representatives and intermediaries during 2018. The Committee continued its assessment of the Group’s potential exposure to bribery and corruption risks, noting the ongoing work conducted by the Group in this context, such as face-to-face visits to operations, providing focused, country-specifi c training and reviewing fi nancial records, sometimes with the assistance of external advisers. The output of these processes and previous risk assessments continue to be used to develop Group policies and procedures for the management of anti-bribery and corruption risk, refl ecting an appropriate level of control for the business.
Governance

90 Vesuvius plcAnnual Report and Accounts 2017
The Committee continues to monitor and oversee procedures regarding allegations of improper behaviour and employee complaints. Further details of the operation of the Group’s Speak-Up policy and helpline can be found in the ‘Our Principles’ section. Throughout the year the Audit Committee received updates on the volume of reports, key themes emerging from these reports and the results of investigations undertaken.
Each year the senior fi nancial, operational and functional management of the businesses self-certify compliance with Group policies and procedures for the areas of the business under their responsibility and confi rm the existence of adequate internal control systems throughout the year. The Committee reviews any exceptions noted in this bottom-up exercise.
After considering these various inputs, the Committee was able to provide assurance to the Board on the effectiveness of internal fi nancial control within the Group, and on the adequacy of the Group’s broader internal control systems.
Internal AuditThe Group’s Internal Audit function operates on a global basis through professionally qualifi ed and experienced individual members located around the world, including an auditor with specialist IT knowledge. They report to the Head of Internal Audit, based in London, who in turn reports directly to the Chairman of the Audit Committee.
During the year the approach to internal audit was updated, with audit activities subdivided into two different categories: Compliance & Control (‘C&C’), and Effectiveness & Effi ciency (‘E&E’). C&C audit activities focus entirely on internal fi nancial control and key Board compliance issues, whereas the E&E audit activities examine a broader constituency of business performance issues. Characterising the audit process in this way enables the Audit Committee to concentrate more specifi cally on key control issues for resolution, with reporting focused on C&C audit activity, and more general commentary provided on the outcome of E&E audit activities. The detailed outcomes of E&E audits are then used to engage management on the broader performance issues identifi ed by the Internal Audit team. During the year, the frequency of meetings between the Head of Internal Audit and the Business Unit Presidents was also increased, to ensure that engagement on the resolution of issues is clearly understood at all levels of the business and responsibility for remediation taken accordingly.
The Committee received, considered and approved the 2017 Internal Audit plan which was constructed using a risk-based approach to cover the Group’s control environment. The plan was based on the premise that all operating units are internally audited at least once in every three-year period, whilst maintaining a focus on smaller operating units. A third of operating units are now subject to internal audit twice in every three-year period, and Internal Audit annually audits each of the large operating entities located in Germany, the US, China, Mexico and Brazil. During the year the Committee also
considered and approved changes to the Internal Audit plan as required. These changes meant that the Internal Audit coverage was greater than in previous years and audits were carried out with more in-depth analysis across legal entities and operating units. In addition, in 2017 many project-based reviews were also undertaken.
In 2017, a total of 56 audit assignments, including three unplanned audits, were undertaken by Internal Audit, covering 65% of the Group’s revenue and 60% of the Group’s profi t before tax. The Committee received a ‘dashboard’ from the Head of Internal Audit at each of its meetings, detailing progress against the agreed plan and identifying key trends and fi ndings from Internal Audit reports, along with progress on the resolution of actions agreed. Common themes emerging from Internal Audit reports were discussed and these discussions have informed the compilation of the 2018 Internal Audit plan. When necessary Internal Audit uses external outsourced auditors to supplement Internal Audit on an ad-hoc basis. The outsourcing process provides valuable learning opportunities and we expect to continue to use outsourcing in specialist areas and geographies in the future. Where control issues or other problems are fl agged by the fi eldwork, they are recorded in a live web-based database into which management and operational entities are required to report progress against audit exceptions. In this way, Internal Audit monitors the progress and adequacy of the remediation steps taken. Additionally, regular meetings are held with each business unit President to discuss the progress against high-priority issues. Consequently, the Committee has oversight of appropriate and timely actions taken by the responsible management. The Audit Committee also involved senior management as necessary to provide an update against high-priority actions and Internal Audit provided follow-up reviews as required, to ensure that there was clarity on the responsibility for delivery of solutions to the audit fi ndings. In situations where audit fi ndings required longer-term solutions, the Committee oversaw the process for ensuring that adequate mitigation actions were taken while permanent solutions are pursued.
During the year, a review was undertaken of the effectiveness of the Internal Audit function. The review, which canvassed the views of Non-executive Directors and senior management, confi rmed that the Internal Audit function continued to operate to a high standard, with a good understanding of the business and an appropriate scope. Respondents noted the high degree of energy, professionalism and independence exhibited by the function, and welcomed the steps that had been taken to improve the interface with the management of each of the business units.
Having considered the work of the Internal Audit function during 2017, including progress against the 2017 Internal Audit plan, the quality of reports provided to the Committee, and the results of the review of the function’s effectiveness, the Committee concluded that the Internal Audit function operated effectively during 2017.
Audit Committee continued

91
External AuditAuditor AppointmentIn 2016, the Committee undertook a tender process to appoint a new statutory auditor for the fi nancial year ending 31 December 2017. The tender culminated in the appointment of PricewaterhouseCoopers LLP (‘PwC’) as external auditor and the appointment of Mazars LLP to audit the non-material entities within the Group. As a result, KPMG concluded its tenure as the Group’s external auditor during the year and, further to the approval of the Company’s shareholders at the 2017 AGM, PwC was appointed as the Group’s external auditor for the year ending 31 December 2017. PwC nominated Julian Jenkins as the audit partner responsible for the Group audit. In line with the regulations on auditor rotation, the external audit contract will be put out to tender at least every ten years. In addition, PwC will be required to rotate the audit partner every fi ve years.
Auditor Transition and 2017 Audit PlanPwC’s transition plan focused on exiting the non-audit services that PwC provided to the Group, and working with people from across the business to build on their understanding of the Group and refi ne the planned approach to the audit. Key elements of the transition plan included: meeting with senior management, local management, key functional heads and wider business stakeholders to gain insight into the business; meeting with KPMG and performing a detailed review of their working papers; attending Committee meetings prior to the formal appointment; undertaking a risk assessment to identify signifi cant and elevated audit risks; and formulating and communicating a detailed audit plan. During the year PwC provided regular updates to the Committee on the status and progress of the auditor transition plan, and valuable insights into the Group’s audit environment from the results of their review.
In February 2018, the Audit Committee held a preliminary meeting on year-end issues in advance of the fi nalisation of the fi nancial statements in early March. During the year, private sessions were held with PwC without management being present, covering reporting and control issues in the context of the resourcing of the Group Finance team. The Chairman of the Audit Committee met on a number of occasions with PwC to monitor the progress of the audit and discuss questions as they arose. The strength of the fi nance teams across the Group was also considered. In these sessions PwC confi rmed that its work had not been constrained in any way and that it was able to exercise appropriate professional scepticism and challenge throughout the audit process.
The Independent Auditors’ Report provided by PwC on pages 124 to 129 includes PwC’s assessment of the risks of material misstatement in the accounts. These risk areas are discussed in the signifi cant issues and material judgements comments above. The report also summarises the scope, coverage and materiality levels applied by PwC in its audit. As part of the audit planning process and based on a detailed risk assessment, the Committee agreed a materiality fi gure of £7.6m for Group fi nancial reporting purposes which is higher than last year (£4.0m) and, in line with similar groups, is set at 5% of headline
profi t before tax of £152.9m. Importantly, much lower levels of materiality are used in the audit fi eldwork on the individual businesses across the Group and these lower fi gures drive the scope and depth of audit work. Any misstatement at or above £0.4m was reported to the Committee.
There were no signifi cant changes this year to the coverage of the audit which stood at 68% of the Group’s revenue and 76% of headline profi t before tax. This coverage was considered to be suffi cient by the Committee. The audit coverage is refl ective of the long tail of smaller businesses within the Group that individually are not ‘material’ to the Group result.
The PwC audit fee approved by the Audit Committee was £1.3m. This was constructed bottom-up on a local currency basis and was assessed in light of the audit work required by the agreed materiality level and scope. It was agreed as part of the audit tender process and updated for changes in scope that were required during the year. The fee approved by Mazars for the audit of the non-material entities was £0.4m, resulting in a combined fee with PwC of £1.7m, compared to £2.0m paid to KPMG LLP in 2016. The reduction in fee follows from the tender and the utilisation of two audit fi rms. The Committee noted the ruling by the Securities Exchange Board of India regarding the prohibition placed on PwC network companies performing audits of listed entities for two years from 1 January 2018. The Committee is watching developments on this matter carefully in the context of the Group’s two listed Indian subsidiaries Foseco India Limited and Vesuvius India Limited.
Independence and ObjectivityThe Committee is responsible for safeguarding the independence and objectivity of the external auditors in order to ensure the integrity of the external audit process. In discharging this responsibility during 2017, the Committee:
> Sought regular confi rmation from the incumbent external auditor that it considered itself to be independent of the Company in its own professional judgement, and within the context of applicable professional standards
> Evaluated all the relationships between the external auditor and the Group, including compliance with the Group’s policy on the employment of former employees of the external auditor, to determine whether these impaired, or appear to impair, the auditor’s independence
> Reviewed compliance against the policy on the provision of non-audit services by the external auditor
> Reviewed details of the non-audit services provided by the external auditor and associated fees
The Committee noted that, in Sweden, a non-permitted service had been performed by PwC during the transition process, being supporting compliance in respect of payroll taxes. Given the de minimis nature of the fee incurred and balances involved, the Committee concluded that the conduct of this work had not affected PwC’s independence.
As a result of its review the Committee concluded that PwC remained appropriately independent.
Governance

92 Vesuvius plcAnnual Report and Accounts 2017
Non-audit ServicesVesuvius operates a policy for the approval of non-audit services. This was revised in 2016, with the new policy applying to the audit of the fi nancial year ended 31 December 2017 and for fi nancial years thereafter. A copy is available to view on the ‘Investors/Corporate Governance’ section of the Company’s website, www.vesuvius.com. Group companies are not permitted to use the external auditor for any “prohibited non-audit services” as specifi ed by the UK Financial Reporting Council’s (FRC’s) Revised Ethical Standard 2016, unless subject to a permitted derogation. The restrictions broadly prohibit external auditors’ involvement in tax services, any services that involve playing a part in management decision-making, preparing accounting records, designing or implementing internal control/risk management services or fi nancial systems, certain HR services and other legal, investment and share-dealing services. The external auditor can be invited to provide non-audit services which, in its position as external auditor, it must or is best placed to undertake and which do not impact auditor objectivity or independence. All audit-related and permissible non-audit services proposed to be carried out for any Group company worldwide by the external auditor must be pre-approved by the Chief Financial Offi cer, who thereafter will refer matters to be further approved by the Chairman of the Audit Committee or the full Audit Committee before an engagement is agreed. Any assignment proposed to be carried out by the external auditor must also have cleared the external auditor’s own internal pre-approval process to confi rm the fi rm’s ethical ability to do the work.
In practice, the Group did not seek to engage PwC for non-audit services during 2017 unless there were compelling advantages to doing so. In 2017, the fees for non-audit services payable to PwC amounted to £0.1m, similar to the non-audit fees of £0.1m payable to KPMG LLP last year. The 2017 fees represent payment for assurance services related to the review of the Company’s half-year fi nancial statements and quarterly reviews and tax accounts in India (required by regulation). Tax compliance and other non-audit services were for the previously mentioned Swedish service, and the transition of expatriate tax services to the new outsourced provider.
Effectiveness and Reappointment of PwC for 2018The Committee and the Board are committed to maintaining the high quality of the external audit process. Throughout the year the Committee assessed the performance of the external auditor, taking into consideration:
> The quality of reports provided to the Committee, and the quality of issues and challenges raised with the Committee and with management across the Group
> The level of insight exhibited in the feedback they provided as part of the transition process
> Management’s assessment of the transition process
> Their defi nition and completion of the 2017 audit plan
> Their performance during their review of the 2017 half year results
> The effectiveness of their relationship with the Committee, with management and with Internal Audit
> Feedback from the Chief Financial Offi cer and Group Financial Controller on the quality of local audit teams
The Committee also considered the FRC’s Audit Quality Inspection of PwC published in June 2017.
A process to formally assess PwC’s performance in respect of the 2017 fi nancial year will be completed following the completion of their year-end work, taking account of the guidance for audit committees prepared by the FRC. As part of this review, PwC will be asked to identify any issues they consider could pose a risk to audit quality.
In an initial assessment of PwC’s performance during their fi rst year of audit, the Committee concluded that PwC had provided an effective audit for 2017. They had exhibited a good understanding of the Group’s businesses and internal control environment (based on a signifi cant process of engagement with the business as part of audit transition) and had provided sound feedback to the Committee on the product of their transition work. They had established effective working relationships with the Committee and with management, and had exhibited an appropriate level of professional scepticism and robust challenge of management’s judgements as appropriate. The Committee has therefore recommended to the Board that PwC be reappointed for 2018. It confi rms that its recommendation is free from the infl uence of any third party and that there are no contractual restrictions on the choice of auditor. A resolution proposing the reappointment of PwC is included in the notice of AGM for 2018.
Audit Committee EvaluationThe Audit Committee’s performance was evaluated as part of the overall externally facilitated Board and Committee performance evaluation, which is described in depth on page 82. The performance of the Committee was rated highly, with its oversight seen to be of a very high standard. A number of areas of focus had been identifi ed by the 2016 evaluation and it was felt that these had all been managed effectively in 2017. The transition of the external auditor had progressed smoothly and the institution by the Audit Committee Chairman of more regular meetings with management outside formal Committee meetings had enhanced the fl ow of information with the Committee. The ‘deep dive’ initiative had once again proved useful in providing the Committee with detailed information on key topics and would be continued in 2018, and the implementation of an additional Audit Committee meeting early in the year end cycle had been positively received, and would be continued.
On behalf of the Audit Committee
Douglas Hurt Chairman, Audit Committee
28 February 2018
Audit Committee continued

93
Dear shareholder,On behalf of the Nomination Committee, I am pleased to present the Nomination Committee Report for 2017. The primary responsibility of the Nomination Committee is to focus on Board succession planning to ensure that the Board is made up of individuals with the appropriate drive, abilities and experience to lead the Company in the delivery of its strategy. In 2017 the Committee presided over the appointment of a new Chief Executive as part of a planned succession process for François Wanecq, who retired from his role as Chief Executive at the end of August 2017. We also appointed a new independent Non-executive Director, Holly Koeppel, in April 2017, who strengthens the Board in terms of its knowledge, skills and experience, replacing Nelda Connors who stepped down from the Board in late 2016.
The Committee reviews the current and future needs of the Board and its Committees on an ongoing basis. In line with this, during 2017, the Committee reviewed the tenure of all of the Directors and discussed future Board rotation.
In additon, as part of the annual corporate governance review conducted each year, the Committee examines the independence of the Board and the balance of skills, and development needs, of Board members. The output from this process was used to defi ne the recruitment requirements for the new Directors, with each then having a job specifi cation drawn up to target the attributes required.
The Committee’s succession planning activities do not exclusively relate to the Board, but also encompass the senior management levels immediately below the Board. The Committee is working to support and encourage the growth of a consistent pool of talent able to step up to the top roles in future years. The oversight of senior management succession planning and talent development will be a key area for emphasis in 2018.
During 2017 the Board formalised its approach to diversity, and approved a Board Diversity Policy. In line with this, the Committee continues to consider the mix of skills, experience and knowledge required on the Board, and to promote diversity not only on the Board but also throughout the wider business.
Yours sincerely
John McDonough CBE Chairman
Committee MembersJohn McDonough CBE (Committee Chairman) Christer Gardell Hock GohJane HinkleyDouglas HurtHolly Koeppel (appointed 3 April 2017)
The Nomination CommitteeThe Nomination Committee is made up of myself as Chairman of the Company and any three of the Non-executive Directors. During the year I continued as Chairman of the Committee, though I would not act as Chairman if the Committee was considering the appointment of my successor. In that case, the Chairman would be an appropriate Non-executive Director. The Company Secretary is Secretary to the Committee. Members’ biographies are set out on pages 50 and 51.
Key Activities during the Year> Completion of Chief Executive recruitment: The Committee
completed the Chief Executive succession process which culminated in the selection and recommended appointment of Patrick André as Chief Executive, succeeding François Wanecq on his retirement from the Company
> Non-executive appointment: The Committee led the search for a new Non-executive Director resulting in the selection and recommended appointment of Holly Koeppel
> Board composition: The Committee reviewed the skills, knowledge and experience required for the Board to continue to function effectively, and evaluated the current Board composition against an assessment of these future business needs
> Board succession: The Committee reviewed the ongoing requirements for Board rotation to maintain the correct skills, experience and diversity at Board level
> Directors’ elections: The Committee considered the Directors’ annual re-election at the 2017 AGM
> Committee evaluation: The Committee reviewed its performance and effectiveness during 2017
Role and ResponsibilitiesThe Nomination Committee’s foremost priorities are to ensure that the Company has the best possible leadership, maintains a clear plan for orderly Executive and Non-executive Director succession, and cultivates the appropriate skills, experience and diversity in the Board’s overall composition. Its primary focus is therefore on the strength of the Board, for which appointments are made on merit, against objective criteria, selecting the best candidate for the post. The Nomination Committee advises the Board on appointments, retirements and resignations from the Board and its Committees.
Nomination Committee
Governance
94 Vesuvius plcAnnual Report and Accounts 2017
The Committee operates under formal terms of reference which were reviewed and confi rmed during the year. The terms of reference are available on the Group’s website www.vesuvius.com.
The Committee and its members are empowered to obtain outside legal or other independent professional advice at the cost of the Company in relation to its deliberations. These rights were not exercised during the year. The Committee may also secure the attendance at its meetings of any employee or other parties it considers necessary.
Process for Board AppointmentsThe Committee follows formal, rigorous and transparent procedures for the appointment of new Directors. When considering a Board appointment, the Nomination Committee draws up a specifi cation for the role, taking into consideration the balance of skills, knowledge and experience of its existing members, the diversity of the Board, the independence of continuing Board members, and the ongoing requirements and anticipated strategic developments of the Group. The search process is then able to focus on appointing a candidate with the necessary attributes to enhance the Board’s performance. The Committee uses the services of search fi rms to identify appropriate candidates, ensuring that any selected fi rm is not in any way confl icted in the delivery of its role. In addition, the Committee will only use those fi rms that have adopted the Voluntary Code of Conduct addressing gender diversity and best practice in search assignments.
During 2017, the Committee oversaw a selection process to identify a new Chief Executive to succeed François Wanecq on his retirement from the Company, and the ongoing search for a new Non-executive Director, following Nelda Connors’ retirement from the Board in 2016. The Committee reviewed the skills and attributes required for each role, and agreed individual job specifi cations. The Committee utilised the services of specialist recruitment agencies to search for suitable candidates – Korn Ferry to identify prospective candidates for the Chief Executive role, and Spencer Stuart to search for a new Non-executive Director. Both agencies have adopted the Voluntary Code of Conduct, and neither have any other connection with the Group other than in respect of management recruitment work undertaken during normal trading activities. Each agency was selected for their assignment following a review of potential agencies based on their skills, expertise and price.
Chief ExecutiveAs part of the Group’s ongoing senior management succession planning processes, a detailed independent review of internal candidates was undertaken, to consider candidates for succession to the role of Chief Executive, with those individuals identifi ed as potential candidates fully integrated by Korn Ferry into the search process. The Nomination Committee also
engaged external assistance to benchmark the skills and experience required for the Chief Executive role, defi ning the issues fundamental to the Vesuvius role, given the Group’s business, scale, geographical diversity, performance and the stage of its development. The search was conducted globally and a long-list of potential appointees was produced, including external, internal, international and female candidates. The Committee reviewed the long-list and a shortlist of candidates for interview was drawn up for the role, based upon the objective criteria identifi ed at inception. The Chairman, and the Chairman of the Remuneration Committee interviewed an initial short-list of candidates, with a shorter list of candidates then interviewed by the Senior Independent Director and again by the Chairman. The two fi nal preferred candidates then met with all the other Board members. Finally, detailed external references were taken up and following this the Committee made formal recommendations to the Board for the appointment of Patrick André as the new Chief Executive. Patrick André was supported in undertaking due diligence on the Company in areas not connected to his previous role as President Flow Control.
Non-executive DirectorThe search was conducted globally and a long-list of potential appointees was produced by Spencer Stuart. The Committee reviewed the long-list and a short-list of candidates for interview was drawn up, based upon the objective criteria identifi ed at inception. The Chairman and the Chief Executive interviewed the short listed candidates, and the preferred candidate then met with all other Board members. Detailed external references were taken up and, following this, the Committee made a formal recommendation to the Board for the appointment of Holly Koeppel as a new Non-executive Director. Holly Koeppel was supported in undertaking her own due diligence on the Company and meeting with its advisers. She was also required to demonstrate that she had suffi cient time available to devote to the role and to identify any potential confl icts of interest. No confl icts were identifi ed.
Following their appointment, the Committee has continued to monitor the development and integration onto the Board of the two new Directors. Holly Koeppel and Patrick André both undertook a full induction programme and have continued to gain insight into the business and meet executives throughout the organisation.
Board CompositionOn an ongoing basis, the Committee reviews the current and future needs of the Board and its Committees – refl ecting on the balance of skills and experience of current Directors, and comparing this against the Board’s list of key skills. The Committee also considers existing lengths of tenure and the prospective rotation and retirement of Board members, so that it can plan accordingly. As part of the annual corporate
Nomination Committee continued

95G
overnance
governance review conducted during the year, the Committee examined the independence of the Board and the balance of skills, and development needs of Board members. Based on this analysis in 2016, the Committee concluded that the Board would benefi t from the appointment of a new Non-executive Director with expert knowledge of the industrial sector, together with a high degree of commercial acumen and global markets knowledge. The Non-executive Director search identifi ed above was commenced on this basis. In addition, the Nomination Committee considered the future needs of the business, its corporate strategy, culture and direction in assessing its requirements of a new Chief Executive and used this analysis to inform the recruitment process. The Committee recognised that the business needed an individual who had a proven track record of enhanced strategic thinking and managing complexity, who also excelled at managing and developing relationships with a cross-section of people.
DiversityAll Directors have served at a very senior level in global organisations, have international experience across a variety of industries, and most have spent a considerable amount of time resident outside the UK. The Nomination Committee believes that diversity underpins the successful operation of the Board. It recognises that this is a key ingredient in creating a balanced culture for discussions and minimising ‘group-think’, and continues with its policy to review the requirements for different skills, experience, background and gender in respect of the Board’s composition. During the year, the Board formalised its approach to diversity, and approved a Board Diversity Policy, details of which are set out on page 80. The Committee will continue to consider the mix of skills, experience and knowledge required on the Board, and promote diversity not only on the Board but also throughout the wider business.
Senior Management Succession During the year, the Committee’s succession planning activities did not exclusively relate to the Board, but continued to encompass the senior management levels immediately below the Board, aiming to support and encourage the growth of a consistent pool of talent able to step up to the top roles in future years. Consequently, the Committee continued to monitor the execution of development plans for the Group Executive Committee and supported the Board in understanding the process for the development of high potentials throughout the business. The Board met key executives throughout the Group to gain a greater understanding of the breadth and depth of management talent. This process included a series of presentations to the Board by business unit, functional and geographical heads providing the basis for a more informed approach to executive succession planning and talent development across the Group. As identifi ed by the Board evaluation process, the oversight of senior management succession planning will be a key area for emphasis in 2018.
Committee Evaluation The Committee’s activities were part of the externally facilitated evaluation of Board effectiveness during the year. The Committee was considered to have performed effectively over the past year and the oversight of the Chief Executive succession process was commented on favourably. Priorities for the Committee going forward include Board rotation over the longer term, as well as succession planning and talent development for senior management.
On behalf of the Nomination Committee
John McDonough CBE Chairman, Nomination Committee
28 February 2018

96 Vesuvius plcAnnual Report and Accounts 2017
Dear shareholder,On behalf of the Remuneration Committee, I am pleased to present the Directors’ Remuneration Report for 2017, which sets out details of the pay received by Directors in 2017 and how we intend to apply our Remuneration Policy in 2018. This report will be subject to an advisory shareholder vote at the 2018 AGM. In 2017, Shareholders approved a new Remuneration Policy for the Group. If no changes are made prior to the 2020 AGM, then the Company will next need to formally table a Remuneration Policy at that meeting. All payments received by Directors in 2017 were in line with our Remuneration Policy. I have set out details below of the key decisions made by the Committee during 2017. More details about these are included in the Annual Report on Directors’ Remuneration.
Performance in 2017As described in the Strategic Report, 2017 was a year of good progress for the Group with revenue growth of 20.2% outperforming end markets and the global steel market. Despite experiencing headwinds related to rising raw material prices and inter-company imports required by Flow Control in Europe, the Group saw a 24.2% increase in reported trading profi t, with cash generation remaining strong. Throughout the year, the Group remained focused on its strategic priorities and made good progress with the restructuring programme delivering increased annualised savings, strong progress in developing markets and further investment in R&D.
In 2017, Annual Incentive awards for the Executive Directors were based 60% on Group headline earnings per share (EPS), 20% on the Group’s cash conversion (defi ned as operating cash fl ow divided by trading profi t) and 20% on specifi ed personal objectives. In order to further align the interests of our Directors with those of our shareholders, we introduced a requirement in the 2017 Remuneration Policy for deferral of a proportion (normally 33%) of the Annual Incentive into awards over shares for three years. Given the appointment part way through the year of a new Chief Executive, both Mr Wanecq’s and Mr André’s awards, as Chief Executives, were accordingly pro-rated.
Directors’ Remuneration Report
Remuneration Overview
In 2017, our retranslated headline EPS of 39.1p was above the maximum Annual Incentive target of 35.6p. The Group’s 2017 cash conversion of 104% was between the threshold of 90% and the target of 105%. This results in awards of 75% and 11.38% of base salary respectively, being 86.38% in total for the current Executive Directors, Patrick André and Guy Young, and for François Wanecq, in respect of the fi nancial performance metrics. In addition, we assessed each Executive Director’s completion of the personal objectives they were set for 2017, awarding Mr André and Mr Young 19.65% and 15.75% respectively of their maximum entitlements of 25%, and Mr Wanecq 15.00%. As a result, the overall Annual Incentive payable to Mr André for 2017 is 106.03% of base salary (pro-rated in respect of his service as an Executive Director), Mr Young 102.13% of base salary, and Mr Wanecq 101.38% of base salary against maximum bonus opportunities of 125%. In addition, Mr André received an Annual Incentive payout of 65.04% of his pro-rated base salary for 2017, out of a maximum bonus opportunity of 80%, in respect of his tenure as President, Flow Control prior to his appointment as Chief Executive. Mr Wanecq received an Annual Incentive payout of 106.38% of his pro-rated base salary for the period of service from 1 September 2017 to 31 December 2017, when he had ceased to be a Director but remained as an employee of the Group.
The performance period for the awards made under the Vesuvius Share Plan in 2015 matured at the end of December 2017. Performance was measured equally by reference to Total Shareholder Return (TSR) relative to the FTSE 250 (excluding investment trusts) and headline EPS growth above compound annual GDP growth over the three-year period. Relative TSR performance was between median and upper quintile; as a result 27.1% of Performance Share awards will vest under the TSR element (out of a maximum 50%). The annual compound headline EPS growth above GDP for the period was 4.3%. As a result, 16.6% of Performance Share awards will vest under the EPS performance element (out of a maximum of 50%).
Remuneration Strategic Alignment Deliver growth Generate sustainable
profi tability and create shareholder value
Maintain strong cash generation and an effi cient capital structure
Provide a safe working environment for our people
Be at the forefront of innovation
Run top-quality, cost-effi cient and sustainable operations
Foster talent, skill and motivation in our people
Annual Incentive Plan
Vesuvius Share Plan

97G
overnance
In confi rming the vesting of the Performance Shares, the Committee reviewed the underlying performance of the Company to satisfy itself that the outcome was justifi ed. Awards will vest in April 2018.
Other Key Decisions made by the Committee for 2017Key decisions made by the Committee in 2017 included:
> Review, consideration and approval of an appropriate remuneration package for Patrick André, our new Chief Executive. The principal features of his remuneration package were announced at the time of his appointment and they are included in the applicable sections of this year’s Remuneration Report.
> In conjunction with the transition of Chief Executive, the Committee also considered the retirement arrangements for François Wanecq. A summary of these arrangements was included in the Section 430(2B) statement published on the Company’s website, and details are also included in this year’s Remuneration Report.
> The Remuneration Policy approved in 2017 states that, whilst an individual’s performance is reviewed annually, changes to base salary are normally appraised over a two or three-year period. In line with this policy, the Committee reviewed Guy Young’s salary in 2017. It was agreed that his salary should be increased by 7.7% to £350,000 with effect from 1 January 2018. This is the fi rst increase in Guy’s salary since he joined Vesuvius in 2015 and refl ects the considerable diligence and dedication he has brought to the role and his development in it since the time of his appointment.
> The Committee considered the structure of performance measures for incentives in 2018. Having reviewed the existing arrangements, the Committee intends to use the same framework for performance measures in 2018 that was used in 2017 for Executive Directors’ incentive awards, updating one of the metrics to refl ect more effectively the strategic demands of the business. Thus, these measures reward:
– Growth: through the EPS measure used in the Annual Incentive and the Vesuvius Share Plan – as in 2017
– Effective working capital management: through an updated target of working capital to sales ratio (based on the 12-month moving average) to be used in the Annual Incentive
– Delivery of shareholder value: through the TSR measure used in the Vesuvius Share Plan – as in 2017
> In addition, the Committee also took decisions about the grant and vesting of Share Plan awards in 2017 and the Annual Incentive Plan payments made in 2017 in respect of 2016.
Shareholders’ Views The Committee encourages dialogue with its major shareholders. It is satisfi ed that the current Remuneration Policy is designed to promote the long-term success of the Company, and that the performance-related elements of remuneration, which are kept under review, are transparent, stretching and rigorously applied. The Committee was encouraged by the signifi cant support shown for the new Remuneration Policy when it was tabled at the 2017 AGM (99% of votes in favour).
I remain keen to hear shareholders’ views on remuneration matters and look forward to an ongoing dialogue with shareholders and their continued support for our Directors’ Remuneration Report resolution at the AGM.
Yours sincerely
Jane Hinkley Chairman, Remuneration Committee
28 February 2018
98 Vesuvius plcAnnual Report and Accounts 2017
The Company’s existing Remuneration Policy was approved at the AGM held on 10 May 2017. The previous policy applied in its entirety up until this date and after this date those elements of the previous policy that related to remuneration that remained extant on this date (such as outstanding share awards) continued to apply until these commitments cease.
The full policy report, as approved by shareholders, can be found in the 2016 Annual Report (a copy of which is available under the Reports tab in the ‘Investors’ section of the Group website www.vesuvius.com). For the benefi t of shareholders, we have reprinted the Policy below. To ensure that the Policy is relevant to the 2018 fi nancial year, we have made minor textual changes to refer to the applicable fi nancial year in the following sections: Illustration of the Application of the Remuneration Policy for 2018 (which also contains, as described, 2017 data); and Consideration of Shareholder Views. We have amended the ‘Service contracts’ section to refer to the terms of the current Executive Directors and the ‘Terms of service’ section to refer to the dates of appointment of the current non-executive directors.
The Remuneration Committee reserves the right to make any remuneration payments and payments for loss of offi ce (including exercising any discretions available to it in connection with such payments), notwithstanding that they are not in line with the policy set out here, where the terms of the payment were agreed; (i) before the date the Company’s first Remuneration Policy approved by shareholders in accordance with section 439A of the Companies Act came into effect; (ii) before the policy set out here came into effect, provided that the terms of the payment were consistent with the shareholder-approved Remuneration Policy in force at the time they were agreed; or (iii) at a time when the relevant individual was not a Director of the Company and, in the opinion of the Remuneration Committee, the payment was not in consideration for the individual becoming a Director of the Company. For these purposes, ‘payments’ includes the Remuneration Committee satisfying awards of variable remuneration and, in relation to an award over shares, the terms of the payment are ‘agreed’ at the time the award is granted.
Remuneration Policy Table for Executive Directors
Directors’ Remuneration Report
Remuneration Policy
Base salaryAlignment/purposeHelps to recruit and retain key employees. Refl ects the individual’s experience, role and contribution within the Company.
OperationThe individual’s performance is reviewed annually, with changes to base salary normally appraised over a two to three-year period.
Any change will normally be effective from 1 January in the year of the increase.
Base salary is positioned to be market competitive when considered against other global industrial companies, and relevant international and FTSE 250 companies (excluding Investment Trusts).
Paid in cash, subject to local tax and social security regulations.
OpportunitySalary increases will normally be in line with the average increase awarded to other employees in the Group over a similar period. In considering any increase in base salary, the Committee will also consider:
(i) the role and value of the individual;
(ii) changes in job scope or responsibility;
(iii) progression in the role (e.g. for a new appointee);
(iv) a signifi cant increase in the scale of role and/or size, value or complexity of the Group; and
(v) the need to maintain market competitiveness.
In line with the two to three-year period for base salary appraisal, individual increases when paid are likely to be in excess of those for the wider population of employees for that year.
No absolute maximum has been set for Executive Director base salaries. Current Executive Directors’ salaries are set out in the Annual Report on Directors’ Remuneration section of this Remuneration Report.
PerformanceAny increase will take into account the individual’s performance, contribution and increasing experience.
Other benefi tsAlignment/purposeProvides normal market practice benefi ts.
OperationA range of standard benefi ts including, but not limited to: car allowance, private medical care (including spouse and
dependent children), life insurance, disability and health insurance, together with relocation allowance and expatriate benefi ts, in some instances grossed up for tax, in accordance with the Group’s policies, and participation in any employee share scheme operated by the Group.
OpportunityThere is no formal maximum as benefi t costs can fl uctuate depending on changes in provider, cost and individual circumstances.
PerformanceNone

99
PensionAlignment/purposeHelps to recruit and retain key employees. Ensures income in retirement.
OperationAn allowance is given as a percentage of base salary. This may be used to participate in Vesuvius’ pension arrangements, invested in own pension arrangements or taken as a cash supplement (or any combination of the above options).
OpportunityMaximum of 30% of base salary.
PerformanceNone
Annual IncentiveAlignment/purposeIncentivises Executive Directors to achieve key short-term fi nancial and strategic targets of the Group.
Additional alignment with shareholders’ interests through the operation of bonus deferral.
OperationNormally 33% of any Annual Incentive earned by Executive Directors will be deferred into awards over shares under the Vesuvius Deferred Share Bonus Plan which normally vest after at least three years, other than in specifi ed circumstances outlined elsewhere in this Policy. These may be cash or share settled.
The Committee has the discretion to determine that actual incentive payments should be lower than levels calculated by reference to achievement against targets if it considers this to be appropriate.
The Committee has the discretion to award participants the equivalent value of dividends accrued during the vesting period on any shares that vest.
Subject to malus and clawback.
OpportunityBelow threshold: 0%.
On-target: 62.5% of base salary.
Maximum: 125% of base salary.
Payments made between threshold and on-target and between on-target and maximum are pro-rated.
PerformanceAnnual Incentive is measured on targets set at the beginning of each year. The Committee establishes threshold and maximum performance targets for each fi nancial year. The majority of the Annual Incentive will be determined by measure(s) of Group fi nancial performance. The remainder of the Annual Incentive will be based on fi nancial, strategic or operational measures appropriate to the individual Director. Performance is measured over a one-year period. Actual performance targets will be disclosed after the performance period has ended. They are not disclosed in advance due to their commercial sensitivity.
Vesuvius Share PlanAlignment/purposeFlexible ‘umbrella’ plan.
Aligns Executive Directors’ interests with those of shareholders through the delivery of shares. Rewards Executive Directors for achieving the strategic objectives of growth in shareholder value and earnings.
Assists retention of Executive Directors over a three-year performance period.
OperationAwards may be granted as:
> Performance share awards
> Deferred share bonus awards
> Restricted share awards
> Market-price options
These may be cash or share settled.
Individuals are entitled to an aggregate annual maximum amount of awards. If more than one type of award is granted, the individual limit for all awards is reduced to remain within the maximum.
Awards vest three years after their award date, other than in specifi ed circumstances outlined elsewhere in this policy, subject to the achievement of specifi ed conditions.
The Committee may decide that the shares in respect of which an award vests are delivered to participants at that point or that awards will then be subject to an additional holding period before participants are entitled to receive their shares.
The Committee has the discretion to award participants the equivalent value of dividends accrued during the vesting period on any shares that vest.
Subject to malus and clawback.
OpportunityExecutive Directors are eligible to receive an annual award with a face value of up to 200% of base salary in Performance share awards.
Vesting at threshold performance is 25% rising to vesting of the full award at maximum.
PerformanceVesting of Performance Share awards is usually dependent on measures of Group EPS and relative TSR with the precise measures and weighting of the measures determined by the Committee ahead of each award. These details are disclosed in the Annual Report on Directors’ Remuneration section of this Remuneration Report.
The Company reserves the right only to disclose EPS performance targets after the performance period has ended, due to their commercial sensitivity.
Prior to any vesting, the Remuneration Committee also reviews the underlying fi nancial performance of the Company over the performance period to ensure the vesting is justifi ed.
Governance

100 Vesuvius plcAnnual Report and Accounts 2017
Malus/Clawback Arrangements The Executive Directors’ variable remuneration is subject to malus and clawback provisions. These provide the Committee with the fl exibility, if required, to withhold or recover payments made to Executive Directors under the Annual Incentive Plan (including deferred awards) and/or to withhold or recover share awards granted to Executive Directors under the Vesuvius Share Plan, including any dividends granted on such awards. The circumstances in which the Committee could potentially elect to apply malus and clawback provisions include: a material misstatement in the Company’s fi nancial statements; an error in the calculation of the extent of payment or vesting of an incentive; gross misconduct by an individual; or signifi cant fi nancial loss or serious reputational damage to Vesuvius plc resulting from an individual’s conduct, a material failure of risk management or a serious breach of health and safety. These malus and clawback provisions apply for a period of up to three years after the end of a performance period (or end of the deferral period in respect of deferred awards).
Performance MeasuresIn selecting performance measures for the Annual Incentive, the Committee seeks to refl ect key strategic aims and the need for a rigorous focus on fi nancial performance. Each year the Committee agrees challenging targets to ensure that underperformance is not rewarded. The Company will not be disclosing the specifi c fi nancial or personal objectives set until after the relevant performance period has ended because of commercial sensitivities. The personal objectives are all non-fi nancial or job-specifi c in nature and track performance against key strategic, organisational and operational goals.
In selecting performance measures for the Vesuvius Share Plan, the Committee seeks to focus Executive Directors on the execution of long-term strategy and also align their rewards with value created for shareholders. On this basis, the performance conditions for the Vesuvius Performance Share awards will usually be dependent on measures based on TSR and EPS performance.
Within the policy period, the Committee will continually review the performance measures used, including TSR and the applicable comparator group, and EPS and other fi nancial measures, to ensure that awards are made on the basis of challenging targets that clearly support the achievement of the Group’s strategic aims.
The Committee may vary or waive any performance condition(s) if circumstances occur which cause it to determine that the original condition(s) have ceased to be appropriate, provided that any such variation or waiver is fair, reasonable and not materially less diffi cult to satisfy than the original condition (in its opinion). In the event that the Committee were to make an adjustment of this sort, a full explanation would be provided in the next Remuneration Report.
The Committee may: (a) in the event of a variation of the Company’s share capital, demerger, special dividend or any other corporate event which it reasonably determines justifi es such an adjustment, adjust; and (b) amend the terms of awards granted under the share schemes referred to above in accordance with the rules of the relevant plans.
Share awards may be settled by the issue of new shares or by the transfer of existing shares. In line with prevailing best practice at the time this Policy Report was approved, any issuance of new shares is limited to 5% of share capital over a rolling ten-year period in relation to discretionary employee share schemes and 10% of share capital over a rolling ten-year period in relation to all employee share schemes.
Remuneration Policy continued
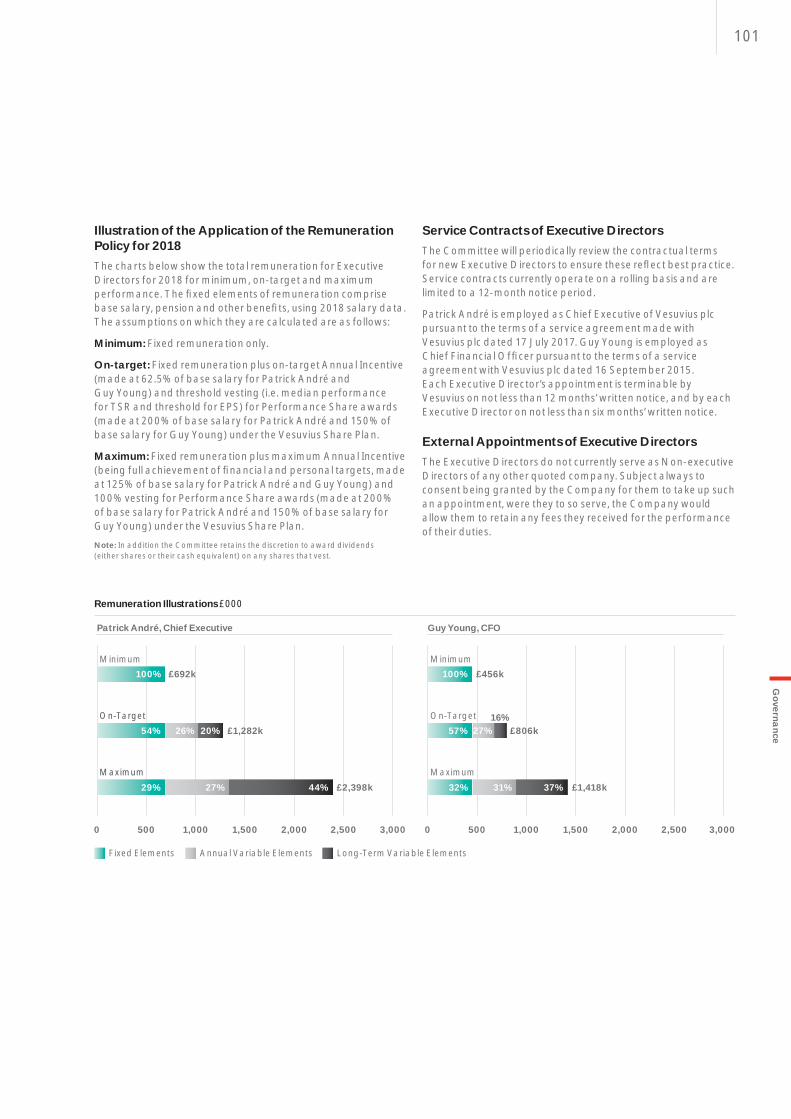
101
Illustration of the Application of the Remuneration Policy for 2018The charts below show the total remuneration for Executive Directors for 2018 for minimum, on-target and maximum performance. The fi xed elements of remuneration comprise base salary, pension and other benefi ts, using 2018 salary data. The assumptions on which they are calculated are as follows:
Minimum: Fixed remuneration only.
On-target: Fixed remuneration plus on-target Annual Incentive (made at 62.5% of base salary for Patrick André and Guy Young) and threshold vesting (i.e. median performance for TSR and threshold for EPS) for Performance Share awards (made at 200% of base salary for Patrick André and 150% of base salary for Guy Young) under the Vesuvius Share Plan.
Maximum: Fixed remuneration plus maximum Annual Incentive (being full achievement of fi nancial and personal targets, made at 125% of base salary for Patrick André and Guy Young) and 100% vesting for Performance Share awards (made at 200% of base salary for Patrick André and 150% of base salary for Guy Young) under the Vesuvius Share Plan.
Note: In addition the Committee retains the discretion to award dividends (either shares or their cash equivalent) on any shares that vest.
Service Contracts of Executive DirectorsThe Committee will periodically review the contractual terms for new Executive Directors to ensure these refl ect best practice. Service contracts currently operate on a rolling basis and are limited to a 12-month notice period.
Patrick André is employed as Chief Executive of Vesuvius plc pursuant to the terms of a service agreement made with Vesuvius plc dated 17 July 2017. Guy Young is employed as Chief Financial Offi cer pursuant to the terms of a service agreement with Vesuvius plc dated 16 September 2015. Each Executive Director’s appointment is terminable by Vesuvius on not less than 12 months’ written notice, and by each Executive Director on not less than six months’ written notice.
External Appointments of Executive DirectorsThe Executive Directors do not currently serve as Non-executive Directors of any other quoted company. Subject always to consent being granted by the Company for them to take up such an appointment, were they to so serve, the Company would allow them to retain any fees they received for the performance of their duties.
0 500 1,000 1,500 2,000 2,500 3,000 0 500 1,000 1,500 2,000 2,500 3,000
Patrick André, Chief Executive
Minimum100% £692k
54%
29% 27% 44% £2,398k
26% 20% £1,282kOn-Target
Maximum
Guy Young, CFO
Minimum100% £456k
57%
32% 31% 37% £1,418k
27%16%
£806kOn-Target
Maximum
Fixed Elements Annual Variable Elements Long-Term Variable Elements
Remuneration Illustrations £000
Governance
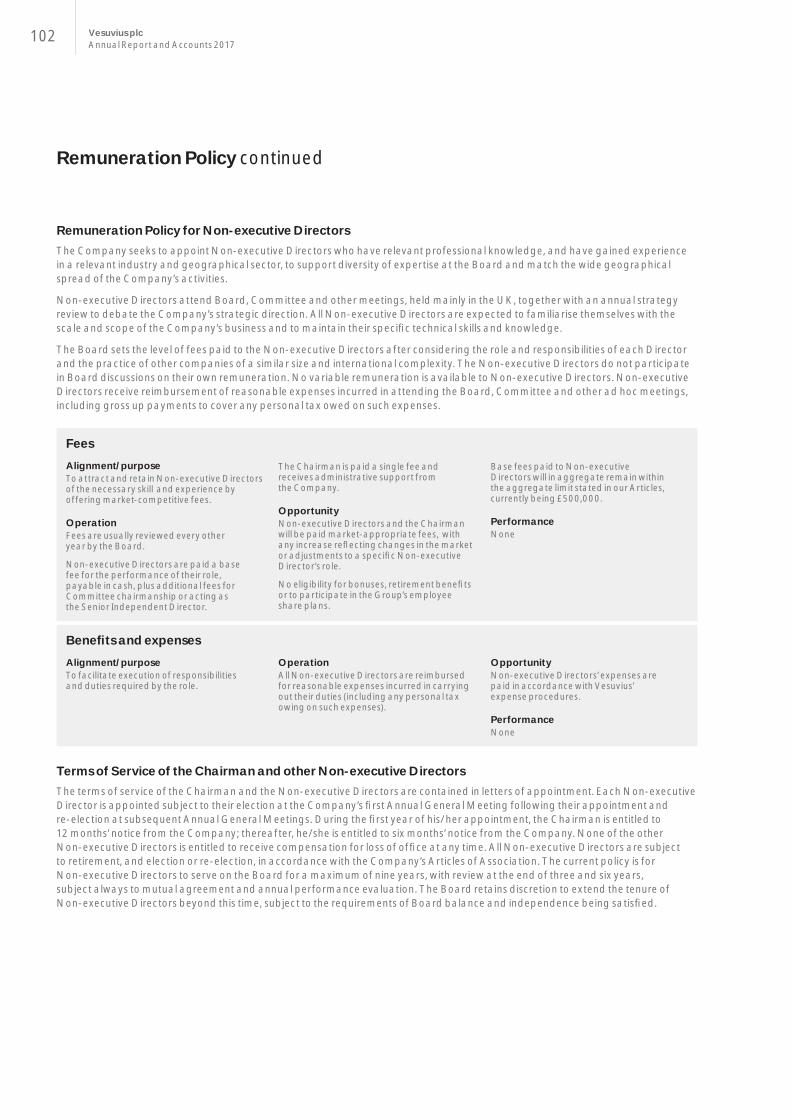
102 Vesuvius plcAnnual Report and Accounts 2017
Remuneration Policy for Non-executive DirectorsThe Company seeks to appoint Non-executive Directors who have relevant professional knowledge, and have gained experience in a relevant industry and geographical sector, to support diversity of expertise at the Board and match the wide geographical spread of the Company’s activities.
Non-executive Directors attend Board, Committee and other meetings, held mainly in the UK, together with an annual strategy review to debate the Company’s strategic direction. All Non-executive Directors are expected to familiarise themselves with the scale and scope of the Company’s business and to maintain their specifi c technical skills and knowledge.
The Board sets the level of fees paid to the Non-executive Directors after considering the role and responsibilities of each Director and the practice of other companies of a similar size and international complexity. The Non-executive Directors do not participate in Board discussions on their own remuneration. No variable remuneration is available to Non-executive Directors. Non-executive Directors receive reimbursement of reasonable expenses incurred in attending the Board, Committee and other ad hoc meetings, including gross up payments to cover any personal tax owed on such expenses.
Terms of Service of the Chairman and other Non-executive DirectorsThe terms of service of the Chairman and the Non-executive Directors are contained in letters of appointment. Each Non-executive Director is appointed subject to their election at the Company’s fi rst Annual General Meeting following their appointment and re-election at subsequent Annual General Meetings. During the fi rst year of his/her appointment, the Chairman is entitled to 12 months’ notice from the Company; thereafter, he/she is entitled to six months’ notice from the Company. None of the other Non-executive Directors is entitled to receive compensation for loss of offi ce at any time. All Non-executive Directors are subject to retirement, and election or re-election, in accordance with the Company’s Articles of Association. The current policy is for Non-executive Directors to serve on the Board for a maximum of nine years, with review at the end of three and six years, subject always to mutual agreement and annual performance evaluation. The Board retains discretion to extend the tenure of Non-executive Directors beyond this time, subject to the requirements of Board balance and independence being satisfi ed.
FeesAlignment/purposeTo attract and retain Non-executive Directors of the necessary skill and experience by offering market-competitive fees.
OperationFees are usually reviewed every other year by the Board.
Non-executive Directors are paid a base fee for the performance of their role, payable in cash, plus additional fees for Committee chairmanship or acting as the Senior Independent Director.
The Chairman is paid a single fee and receives administrative support from the Company.
OpportunityNon-executive Directors and the Chairman will be paid market-appropriate fees, with any increase refl ecting changes in the market or adjustments to a specifi c Non-executive Director’s role.
No eligibility for bonuses, retirement benefi ts or to participate in the Group’s employee share plans.
Base fees paid to Non-executive Directors will in aggregate remain within the aggregate limit stated in our Articles, currently being £500,000.
PerformanceNone
Benefi ts and expensesAlignment/purposeTo facilitate execution of responsibilities and duties required by the role.
OperationAll Non-executive Directors are reimbursed for reasonable expenses incurred in carrying out their duties (including any personal tax owing on such expenses).
OpportunityNon-executive Directors’ expenses are paid in accordance with Vesuvius’ expense procedures.
PerformanceNone
Remuneration Policy continued

103
The table below shows the date of appointment for each of the Non-executive Directors:
Non-Executive Director Date of Appointment
John Mc Donough CBE 31 October 2012Christer Gardell 31 October 2012Hock Goh 2 April 2015Jane Hinkley 3 December 2012Douglas Hurt 2 April 2015Holly Koeppel 3 April 2017
Recruitment PolicyOn appointment or promotion of a new Executive Director, the Committee will typically use the Remuneration Policy in force at the time of the Committee’s decision to determine ongoing remuneration.
Base salary levels will generally be set in accordance with the Remuneration Policy current at the time of the Committee’s decision, taking into account the experience and calibre of the appointee. If it is appropriate to appoint an individual on a base salary initially below what is adjudged to be market positioning, contingent on individual performance, the Committee retains the discretion to realign base salary over the one to three years following appointment, which may result in a higher rate of annualised increase than might otherwise be awarded under the policy. If the Committee intends to rely on this discretion, it will be noted in the fi rst Remuneration Report following an individual’s appointment. Other than in exceptional circumstances, other elements of annual remuneration will, typically, be set in line with the Remuneration Policy including a limit on awards under the Annual Incentive and Vesuvius Share Plan of 325% of salary in aggregate. The Committee retains the discretion to make the following further exceptions:
> In the event that an internal appointment is made, or where a Director is appointed as a result of transfer into the Group on an acquisition of another Company, the Committee may continue with existing remuneration provisions for this individual, including pension entitlements, where appropriate
> If necessary and appropriate to secure the appointment of a candidate who has to move locations as a result of the appointment, whether internal or external, the Committee may make additional payments linked to relocation, above those outlined in the policy table, and would authorise the payment of a relocation allowance and repatriation, as well as other associated international mobility terms. Such benefi ts would be set at a level which the Committee considers appropriate for the role and the individual’s circumstances
> If appropriate the Committee may apply different performance measures and/or targets to a Director’s fi rst incentive awards in his/her year of appointment
Service contracts will be entered into on terms similar to those for the existing Executive Directors, summarised in the ‘Service contracts of Executive Directors’ section above.
In addition to the annual remuneration elements noted above, the Committee may consider buying out terms, incentives and any other compensation arrangements forfeited on leaving a previous employer that an individual forfeits in accepting an appointment with Vesuvius. The Committee will have the authority to rely on Listing Rule 9.4.2R(2) or to apply the existing limits within the Vesuvius Share Plan to make Restricted Share awards on recruitment. In making any such awards, the Committee will review the terms of any forfeited awards, including, but not limited to, vesting periods, the expected value of such awards on vesting and the likelihood of the performance targets applicable to such awards being met, while retaining the discretion to make any buy-out award the Committee determines is necessary and appropriate. The Committee may also require the appointee to purchase shares in Vesuvius to a pre-agreed level prior to vesting of any such awards. The value of any buy-out award will be capped, to ensure its maximum value is no higher than the value of the awards that the individual forfeited on joining Vesuvius. Any such awards will be subject to malus and clawback.
With respect to the appointment of a new Chairman or Non-executive Director, appointment terms will be consistent with those applicable at the time the appointment is agreed. Variable pay will not be considered. With respect to Non-executive Directors, fees will be consistent with the policy at the time the appointment is agreed. If, in exceptional circumstances, a Non-executive Director was asked to assume an interim executive role, the Company retains the discretion to pay them appropriate executive compensation, in line with the policy.
Exit Payment PolicyVesuvius has the option to make a payment in lieu of part or all of the required notice period for Executive Directors. Any such payment in lieu will consist of the base salary, pension contributions and value of benefi ts to which the Director would have been entitled for the duration of the remaining notice period, net of statutory deductions in each case. Half of any payments in lieu of notice would be made in a lump sum, the remainder in equal monthly instalments commencing in the month in which the midpoint of their foregone notice period falls (and are reduced or extinguished by salary from any role undertaken by the departing Executive in this time). Executive Directors are subject to certain non-compete covenants for a period of nine months, and non-solicitation covenants for a period of 12 months, following the termination of their employment. Their service agreements are governed by English law.
Governance
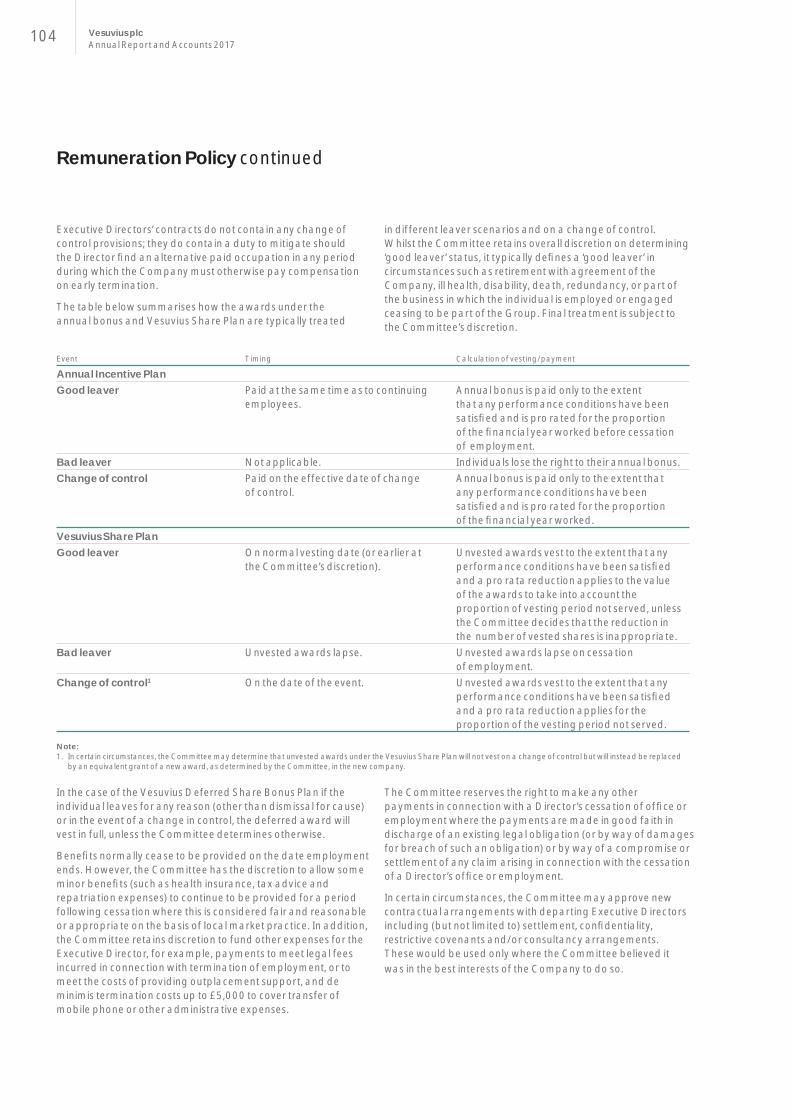
104 Vesuvius plcAnnual Report and Accounts 2017
Executive Directors’ contracts do not contain any change of control provisions; they do contain a duty to mitigate should the Director fi nd an alternative paid occupation in any period during which the Company must otherwise pay compensation on early termination.
The table below summarises how the awards under the annual bonus and Vesuvius Share Plan are typically treated
in different leaver scenarios and on a change of control. Whilst the Committee retains overall discretion on determining ‘good leaver’ status, it typically defi nes a ‘good leaver’ in circumstances such as retirement with agreement of the Company, ill health, disability, death, redundancy, or part of the business in which the individual is employed or engaged ceasing to be part of the Group. Final treatment is subject to the Committee’s discretion.
Event Timing Calculation of vesting/payment
Annual Incentive PlanGood leaver Paid at the same time as to continuing
employees.Annual bonus is paid only to the extent that any performance conditions have been satisfi ed and is pro rated for the proportion of the fi nancial year worked before cessation of employment.
Bad leaver Not applicable. Individuals lose the right to their annual bonus.Change of control Paid on the effective date of change
of control.Annual bonus is paid only to the extent that any performance conditions have been satisfi ed and is pro rated for the proportion of the fi nancial year worked.
Vesuvius Share PlanGood leaver On normal vesting date (or earlier at
the Committee’s discretion).Unvested awards vest to the extent that any performance conditions have been satisfi ed and a pro rata reduction applies to the value of the awards to take into account the proportion of vesting period not served, unless the Committee decides that the reduction in the number of vested shares is inappropriate.
Bad leaver Unvested awards lapse. Unvested awards lapse on cessation of employment.
Change of control1 On the date of the event. Unvested awards vest to the extent that any performance conditions have been satisfi ed and a pro rata reduction applies for the proportion of the vesting period not served.
Note:1. In certain circumstances, the Committee may determine that unvested awards under the Vesuvius Share Plan will not vest on a change of control but will instead be replaced
by an equivalent grant of a new award, as determined by the Committee, in the new company.
In the case of the Vesuvius Deferred Share Bonus Plan if the individual leaves for any reason (other than dismissal for cause) or in the event of a change in control, the deferred award will vest in full, unless the Committee determines otherwise.
Benefi ts normally cease to be provided on the date employment ends. However, the Committee has the discretion to allow some minor benefi ts (such as health insurance, tax advice and repatriation expenses) to continue to be provided for a period following cessation where this is considered fair and reasonable or appropriate on the basis of local market practice. In addition, the Committee retains discretion to fund other expenses for the Executive Director, for example, payments to meet legal fees incurred in connection with termination of employment, or to meet the costs of providing outplacement support, and de minimis termination costs up to £5,000 to cover transfer of mobile phone or other administrative expenses.
The Committee reserves the right to make any other payments in connection with a Director’s cessation of offi ce or employment where the payments are made in good faith in discharge of an existing legal obligation (or by way of damages for breach of such an obligation) or by way of a compromise or settlement of any claim arising in connection with the cessation of a Director’s offi ce or employment.
In certain circumstances, the Committee may approve new contractual arrangements with departing Executive Directors including (but not limited to) settlement, confi dentiality, restrictive covenants and/or consultancy arrangements. These would be used only where the Committee believed it was in the best interests of the Company to do so.
Remuneration Policy continued

105
Comparison of Remuneration Policy for Executive Directors with that for other EmployeesThe Remuneration Policy for Executive Directors is designed in line with the remuneration philosophy set out in this report – which also underpins remuneration for the wider Group. Remuneration arrangements for Executive Directors draw on the same elements as those for other employees – base salary, fi xed benefi ts and retirement benefi ts – with performance-related pay extending down into the management cadres and beyond. However, given that remuneration structures for other employees need to refl ect both seniority and local market practice, they differ from the policy for Executive Directors. In particular, Executive Directors receive a higher proportion of their remuneration in performance-related pay and share-based payments. Individual percentages of fi xed versus variable remuneration and participation in share-based structures decline as seniority decreases.
The process for delivering salary increases on a two to three-year cycle for Executive Directors is also applied to other members of the Group Executive Committee and their direct managerial reports. Whilst all employees receive an annual performance appraisal, other employees continue to receive salary reviews on an annual basis.
As with Executive Directors, middle and senior managers participate in the Annual Incentive Plan. For members of the Group Executive Committee and functional employees, the award is predominantly based on Group performance, with the remainder awarded against achievement of personal objectives. For operational employees, any potential award is based upon achieving three measures relating to Group performance, business unit performance, and individual achievement of personal objectives.
All members of the Group Executive Committee participate in the Vesuvius Share Plan and receive awards of Performance Shares, which vest in accordance with measures and targets set against EPS and TSR. The level of awards granted to members of the Group Executive Committee who don’t serve on the Board are lower than those payable to the Executive Directors.
For certain senior and middle managers, awards are made under the Vesuvius Medium Term Plan (‘MTP’). These managers participate in the MTP at varying percentage levels, and awards are based on the same measures and targets as the Annual Incentive Plan. Senior managers have their MTP awards made over Vesuvius shares, whilst middle managers receive their awards in cash. In each case, awards are granted following the end of the relevant fi nancial year. The MTP share awards vest on the second anniversary of the date of grant, subject to continuing employment.
Consideration of Conditions elsewhere in the Group in Developing PolicyThe Company does not consult directly with employees on Executive Directors’ remuneration arrangements. However, the Remuneration Committee will take into account the pay and employment conditions of other Group employees when determining Executive Directors’ remuneration, particularly when determining base salary increases, when the Committee will consider the salary increases for other Group employees in the same jurisdiction.
Consideration of Shareholder ViewsVesuvius is committed to open and transparent dialogue with its shareholders on remuneration as well as other governance matters. As Chairman of the Committee, Jane Hinkley welcomes shareholder engagement and is available for any discussions investors wish to have on remuneration matters. During 2017, remuneration matters were discussed at a number of meetings with investors. The feedback from such meetings is always shared with the Committee and taken into consideration when decisions are made about future remuneration strategy and arrangements.
Shareholding GuidelinesThe Remuneration Committee encourages Executive Directors to build and hold a shareholding in the Company. The required holding of the Chief Executive is to be equivalent in value to at least 2x salary and that required of other Executive Directors is to be equivalent in value to at least 1x salary.
Compliance with the shareholding policy is tested at the end of each year for application in the following year using the average of the closing prices of a Vesuvius ordinary share for the trading days in that December.
GeneralThe Committee may make minor amendments to the policy set out in this Policy Report (for regulatory, exchange control, tax or administrative purposes or to take account of a change in legislation) without obtaining shareholder approval for that amendment.
Governance

106 Vesuvius plcAnnual Report and Accounts 2017
Directors’ Remuneration Report
Annual Report on Directors’ Remuneration
Remuneration Committee StructureThe current members of the Remuneration Committee are all the independent Non-executive Directors of the Company. The Committee Chairman is Jane Hinkley. Jane Hinkley, Hock Goh and Douglas Hurt have all served on the Committee throughout 2017. Holly Koeppel has served on the Committee since her appointment to the Board on 3 April 2017. All continue in offi ce as at the date of this report. The Committee complies with the requirements of the UK Corporate Governance Code for the composition of remuneration committees. Each of the members brings a broad experience of international businesses and an understanding of their challenges to the work of the Committee. The Company Secretary is Secretary to the Committee. Members’ biographies are on pages 50 and 51.
MeetingsThe Committee met fi ve times during the year. The Group’s Chairman, Chief Executive and Chief Human Resources Offi cer were invited to each meeting, together with Christer Gardell, our non-independent Non-executive Director, though none of them participated in discussions regarding their own remuneration. In addition, a representative from Deloitte, the Remuneration Committee adviser, attended the majority of meetings and the Chief Financial Offi cer attended where the agenda of the meeting required it. The attendees supported the work of the Committee, giving critical insight into the operational demands of the business and their application to the overall remuneration strategy within the Group. In receiving views on remuneration matters from the Executive Directors and senior management, the Committee recognised the potential for confl icts of interest to arise and considered the advice accordingly. The Chairman of the Committee reported the outcomes of all meetings to the Board.
The Committee operates under formal terms of reference which were reviewed during the year. The terms of reference are available on the Group website www.vesuvius.com. The Committee members are permitted to obtain outside legal advice at the Company’s expense in relation to their deliberations. These powers were not exercised during the year. The Committee may also secure the attendance at its meetings of any employee or other parties it considers necessary.
Role and ResponsibilitiesThe Committee is responsible for:
> Determining the overall remuneration policy for the Executive Directors including the terms of their service agreements, pension rights and compensation payments
> Setting the appropriate remuneration for the Chairman, the Executive Directors and the Company Secretary
> Recommending and monitoring the level and structure of remuneration for senior management, being the fi rst layer of management below Board level and their direct reports
> Overseeing the operation of the executive share incentive plans
Advice Provided to the Remuneration CommitteeDeloitte is appointed directly by the Remuneration Committee to provide advice on executive remuneration matters, including remuneration structure and policy, updates on market practice and trends, and guidance on the implementation and operation of share incentive plans. The Committee appointed Deloitte, a signatory to the Remuneration Consultants Group Code of Conduct in relation to Executive Remuneration Consulting in the UK, following a formal tender process in 2014. Deloitte also provides the Remuneration Committee with ongoing calculations of total shareholder return (TSR) to enable the Committee to monitor the performance of long-term share incentive plans. In addition in 2017, within the wider Group, Deloitte was procured in various jurisdictions to provide accounting and tax advisory work. During 2017, Deloitte’s fees for advice to the Remuneration Committee, charged on a time spent basis, amounted to £71,975. The Committee conducted a review of the performance of Deloitte as remuneration adviser during the year and concluded that Deloitte continued to provide effective, objective and independent advice to the Committee. No confl ict of interest arises as a result of other services provided by Deloitte to the Group.
Activities of the Remuneration Committee The key matters the Remuneration Committee considered during its fi ve meetings in 2017 included:
> Considering, formulating and approving the remuneration arrangements for the new Chief Executive
> Agreeing the retirement arrangements for the outgoing Chief Executive
> Considering and approving the 2018 salary review proposals for the Chief Financial Offi cer and reviewing proposals for senior management, as appropriate
> Reviewing and approving achievement against performance targets for the 2016 annual incentive arrangements
> Setting performance targets and approving the structure of the 2017 annual incentive arrangements
> Reviewing and assessing the Company’s attainment of performance conditions applicable to the Vesuvius Performance Share awards made in 2014
> Setting the performance measures and targets, and authorising the grant of new awards in 2017 under the Vesuvius Share Plan and Medium Term Incentive Plan
> Considering the Company’s ongoing share sourcing requirements to meet obligations under the Company’s share plans, and funding of the ESOP
> In the light of advice received from the external advisers and trends in remuneration practice and governance, discussing the Company’s overall approach to executive remuneration and reviewing whether any changes should be made
> Reviewing the Remuneration Committee’s terms of reference
> Approving the 2016 Directors’ Remuneration Report and reviewing the 2017 Directors’ Remuneration Report

107
As in previous years, the Committee was the subject of an externally moderated performance evaluation. The performance of the Remuneration Committee was rated positively overall. Several items had been identifi ed in the 2016 evaluation, and it was noted that these had been effectively managed in 2017, with, in particular, the Committee gaining greater insight into the remuneration arrangements for employees below the senior management tier and global remuneration policies. Going forward, communication was identifi ed as an area of focus, with the Committee expressing the view that the appointment of the new Chief Executive should be taken as an opportunity to review the level of dialogue between the Committee Chairman, management and the external advisers. In addition, as with the Board in general, it was felt that the Remuneration Committee would benefi t from the more concise presentation of data in Committee papers.
Regulatory ComplianceThe Remuneration Policy, which is set out on pages 98 to 105 was prepared in accordance with the Companies Act 2006 and the Large and Medium-sized Companies and Groups (Accounts and Reports) (Amendment) Regulations 2013. It also meets the requirements of the Financial Conduct Authority’s Listing Rules and the Disclosure Guidance and Transparency Rules. This Remuneration Report sets out how the provisions of the UK Corporate Governance Code are applied by the Company in relation to matters of remuneration. We have complied for the year under review with these provisions.
Share UsageUnder the rules of the Vesuvius Share Plan, the Company has the discretion to satisfy awards either by the transfer of Treasury shares or other existing shares, or by the allotment of newly
issued shares. Awards made under the Deferred Share Bonus Plan, to satisfy shares awarded to Directors under the Annual Incentive, and awards made to senior managers by the Company over shares pursuant to the Medium Term Incentive Plan, must be satisfi ed out of Vesuvius shares held for this purpose by the Company’s employee share ownership plan trust (ESOP). The decision on how to satisfy awards is taken by the Remuneration Committee which considers the most prudent and appropriate sourcing arrangement for the Company.
At 31 December 2017, the Company held 7,271,174 ordinary shares in Treasury and 877,744 ordinary shares in the ESOP. The ESOP can be gifted Treasury shares by the Company, can purchase shares in the open market or can subscribe for newly issued shares, as required, to meet obligations to satisfy options and awards that vest.
The Vesuvius Share Plan complies with the current Investment Association guidelines on headroom which provide that overall dilution under all plans over a rolling ten-year period should not exceed 10% of the Company’s issued share capital, with a further limitation over a rolling ten-year period of 5% for discretionary share schemes. More than 9.9% of the 10% limit and more than 4.9% of the 5% limit is available as headroom for the issue of new shares or the transfer of Treasury shares for the Company. No Treasury shares have been transferred or newly issued shares allotted under the Vesuvius Share Plan during the year under review.
Policy ImplementationThe following section provides details of how the Company’s Remuneration Policy was implemented during the fi nancial year 2017 and how it will be implemented in the fi nancial year 2018.
Directors’ Remuneration – AuditedThe table below sets out the total remuneration received by Executive Directors in the fi nancial year under review:
Patrick André1 François Wanecq2 Guy Young
2017(£000)
2016(£000)
2017(£000)
2016(£000)
2017(£000)
2016(£000)
Total salary3 175 – 393 590 325 325Taxable benefi ts4 56 – 156 35 18 19Pension5 44 – 118 177 81 81Total fi xed pay6 275 – 667 802 424 425Annual Incentive7 186 – 399 371 332 166Long-term incentives8 – – 609 – – –Total variable pay9 186 – 1,008 371 332 166Total10 461 – 1,675 1,173 756 591
Governance
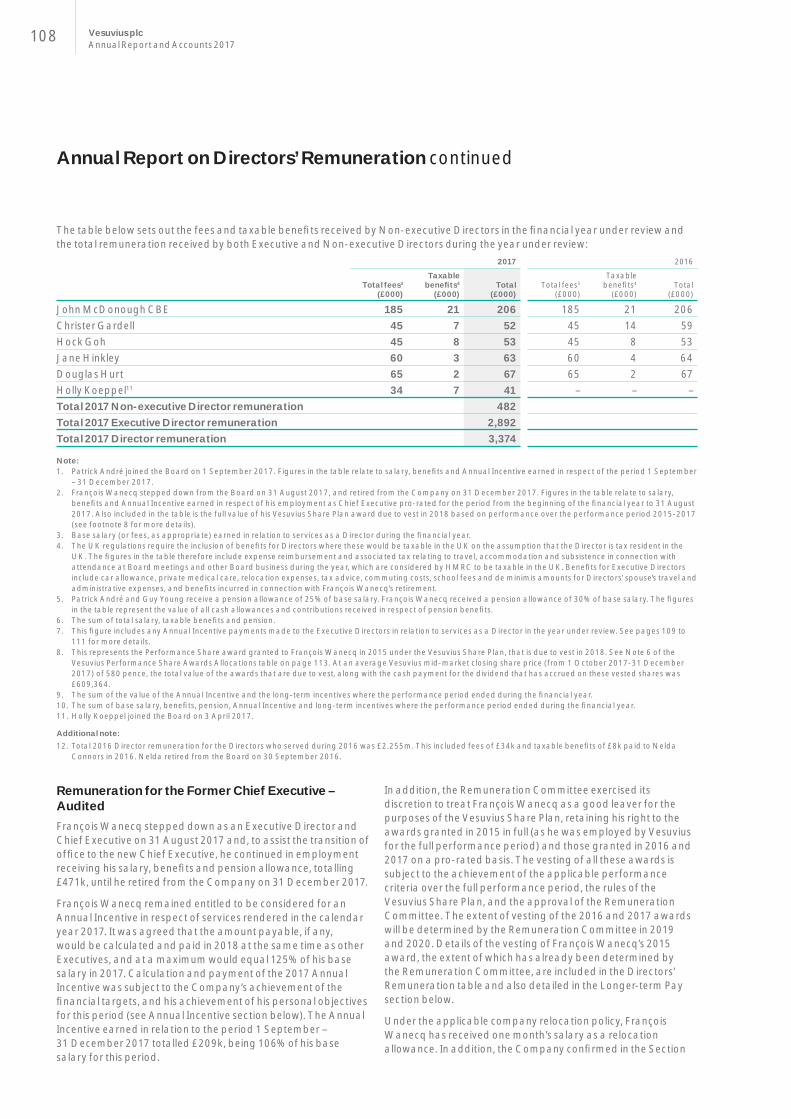
108 Vesuvius plcAnnual Report and Accounts 2017
The table below sets out the fees and taxable benefi ts received by Non-executive Directors in the fi nancial year under review and the total remuneration received by both Executive and Non-executive Directors during the year under review:
2017 2016
Total fees3
(£000)
Taxable benefi ts4
(£000)Total
(£000)Total fees3
(£000)
Taxable benefi ts4
(£000)Total
(£000)
John McDonough CBE 185 21 206 185 21 206Christer Gardell 45 7 52 45 14 59Hock Goh 45 8 53 45 8 53Jane Hinkley 60 3 63 60 4 64Douglas Hurt 65 2 67 65 2 67Holly Koeppel11 34 7 41 – – –Total 2017 Non-executive Director remuneration 482Total 2017 Executive Director remuneration 2,892Total 2017 Director remuneration 3,374
Note:1. Patrick André joined the Board on 1 September 2017. Figures in the table relate to salary, benefi ts and Annual Incentive earned in respect of the period 1 September
– 31 December 2017.2. François Wanecq stepped down from the Board on 31 August 2017, and retired from the Company on 31 December 2017. Figures in the table relate to salary,
benefi ts and Annual Incentive earned in respect of his employment as Chief Executive pro-rated for the period from the beginning of the fi nancial year to 31 August 2017. Also included in the table is the full value of his Vesuvius Share Plan award due to vest in 2018 based on performance over the performance period 2015-2017 (see footnote 8 for more details).
3. Base salary (or fees, as appropriate) earned in relation to services as a Director during the fi nancial year.4. The UK regulations require the inclusion of benefi ts for Directors where these would be taxable in the UK on the assumption that the Director is tax resident in the
UK. The fi gures in the table therefore include expense reimbursement and associated tax relating to travel, accommodation and subsistence in connection with attendance at Board meetings and other Board business during the year, which are considered by HMRC to be taxable in the UK. Benefi ts for Executive Directors include car allowance, private medical care, relocation expenses, tax advice, commuting costs, school fees and de minimis amounts for Directors’ spouse’s travel and administrative expenses, and benefi ts incurred in connection with François Wanecq’s retirement.
5. Patrick André and Guy Young receive a pension allowance of 25% of base salary. François Wanecq received a pension allowance of 30% of base salary. The fi gures in the table represent the value of all cash allowances and contributions received in respect of pension benefi ts.
6. The sum of total salary, taxable benefi ts and pension.7. This fi gure includes any Annual Incentive payments made to the Executive Directors in relation to services as a Director in the year under review. See pages 109 to
111 for more details.8. This represents the Performance Share award granted to François Wanecq in 2015 under the Vesuvius Share Plan, that is due to vest in 2018. See Note 6 of the
Vesuvius Performance Share Awards Allocations table on page 113. At an average Vesuvius mid-market closing share price (from 1 October 2017-31 December 2017) of 580 pence, the total value of the awards that are due to vest, along with the cash payment for the dividend that has accrued on these vested shares was £609,364.
9. The sum of the value of the Annual Incentive and the long-term incentives where the performance period ended during the fi nancial year.10. The sum of base salary, benefi ts, pension, Annual Incentive and long-term incentives where the performance period ended during the fi nancial year.11. Holly Koeppel joined the Board on 3 April 2017.
Additional note:12. Total 2016 Director remuneration for the Directors who served during 2016 was £2.255m. This included fees of £34k and taxable benefi ts of £8k paid to Nelda
Connors in 2016. Nelda retired from the Board on 30 September 2016.
Remuneration for the Former Chief Executive – AuditedFrançois Wanecq stepped down as an Executive Director and Chief Executive on 31 August 2017 and, to assist the transition of offi ce to the new Chief Executive, he continued in employment receiving his salary, benefi ts and pension allowance, totalling £471k, until he retired from the Company on 31 December 2017.
François Wanecq remained entitled to be considered for an Annual Incentive in respect of services rendered in the calendar year 2017. It was agreed that the amount payable, if any, would be calculated and paid in 2018 at the same time as other Executives, and at a maximum would equal 125% of his base salary in 2017. Calculation and payment of the 2017 Annual Incentive was subject to the Company’s achievement of the fi nancial targets, and his achievement of his personal objectives for this period (see Annual Incentive section below). The Annual Incentive earned in relation to the period 1 September – 31 December 2017 totalled £209k, being 106% of his base salary for this period.
In addition, the Remuneration Committee exercised its discretion to treat François Wanecq as a good leaver for the purposes of the Vesuvius Share Plan, retaining his right to the awards granted in 2015 in full (as he was employed by Vesuvius for the full performance period) and those granted in 2016 and 2017 on a pro-rated basis. The vesting of all these awards is subject to the achievement of the applicable performance criteria over the full performance period, the rules of the Vesuvius Share Plan, and the approval of the Remuneration Committee. The extent of vesting of the 2016 and 2017 awards will be determined by the Remuneration Committee in 2019 and 2020. Details of the vesting of François Wanecq’s 2015 award, the extent of which has already been determined by the Remuneration Committee, are included in the Directors’ Remuneration table and also detailed in the Longer-term Pay section below.
Under the applicable company relocation policy, François Wanecq has received one month’s salary as a relocation allowance. In addition, the Company confi rmed in the Section
Annual Report on Directors’ Remuneration continued

109
430(B) Statement that it would pay his removal costs, the reasonable costs of any international tax advice required in connection with his retirement from employment and any tax support to meet his ongoing obligations to correctly report income received from the Company for a three-year period following his retirement. In addition, the Statement confi rmed that the Company will also pay de minimis administrative expenses and benefi ts incurred in connection with his retirement.
No further termination payment will be made to Mr Wanecq.
There were no payments made to any Director for loss of offi ce during the year ended 31 December 2017, and no payments were made to any other past Directors of the Company during the year ended 31 December 2017.
Base Salary and FeesIn the year under review, the Chief Financial Offi cer received a base salary of £325,000 per annum. François Wanecq received a base salary of £590,000 per annum, and following his promotion to Chief Executive, Patrick André received a base salary of £525,000 per annum. The Non-executive Directors’ fees were set at £45,000 per annum. Supplementary fees of £15,000 per annum were paid to the Chairmen of the Audit and Remuneration Committees. A supplementary annual fee of £5,000 was also paid to the Senior Independent Director. The Chairman was paid an annual fee of £185,000. Neither the Chairman nor the other Non-executive Directors are members of the Group’s pension plans, nor do they participate in the Group’s incentive schemes.
In line with the Group’s longer-term approach of reviewing the salaries of Executive Directors and senior Executives every two to three years, Guy Young’s base salary was reviewed for application in 2018. This was the fi rst time his base salary had been reviewed since he joined the Company in 2015 and, following this review, it was resolved that his salary should be increased by 7.7%, with effect from 1 January 2018, up to £350,000 per annum, in recognition of his leadership of the Group’s Finance function over the past three years and his development in the role. In considering this increase, the Committee also noted that over the previous two years the average salary increase for UK salaried employees had been 3.36%. Following his recent promotion, there is no change to Patrick André’s salary in 2018, but, as announced at the time of his appointment, the Remuneration Committee has committed to review his salary annually for the fi rst three years of his appointment (January 2019, 2020 and 2021).
Pension Arrangements – AuditedIn accordance with their service agreements, Patrick André and Guy Young are entitled to pension allowances of 25% of base salary. (François Wanecq was entitled to a pension allowance of 30% of base salary up until the date of his retirement.) This allowance can be used to participate in Vesuvius’ pension arrangements, be invested in their own pension arrangements or be taken as a cash supplement (or any combination of these alternatives).
Annual IncentiveThe Executive Directors are eligible to receive an Annual Incentive calculated as a percentage of base salary, based on achievement against specifi ed fi nancial targets and personal objectives. Each year the Remuneration Committee establishes the performance criteria for the forthcoming year. The fi nancial targets are set by reference to the Company’s fi nancial budget. The target range is set to ensure that Annual Incentives are only paid out at maximum for signifi cantly exceeding performance expectations. The Remuneration Committee considers that the setting and attainment of these targets is important in the context of achievement of the Company’s longer-term strategic goals.
The Annual Incentive has a threshold level of performance below which no award is paid, a target level and a maximum performance level at which a maximum award is earned.
2017 Annual IncentiveFor 2017 the maximum Annual Incentive potential for the Executive Directors was 125% of base salary and their target Annual Incentive potential was 62.5% of base salary. Following his appointment as Chief Executive on 1 September 2017, it was agreed that Patrick André would participate in the Annual Incentive at these incentive levels with effect from that date. With respect to his service with the Group prior to that date he remained entitled to receive any payouts due under the Flow Control business unit Annual Incentive Plan.
Following his retirement as a Director, François Wanecq remained entitled to be considered for an Annual Incentive in respect of services rendered in the calendar year 2017. It was agreed that the amount payable, if any, would be calculated and paid in 2018 at the same time as other Executives.
For the fi nancial year 2017 the Executive Directors’ Annual Incentives were based 60% on Group headline earnings per share, 20% on the Group’s cash conversion (defi ned as operating cash fl ow divided by trading profi t) and 20% on specifi ed personal objectives.
Financial TargetsThe 2017 Vesuvius Group headline earnings per share performance targets set out below were set at the December 2016 full-year average foreign exchange rates, being the rates used for the 2017 budget process:
Threshold: 30.4 pence
On-target: 33.0 pence
Maximum: 35.6 pence
The 2017 Group’s cash conversion targets were set as follows:
Threshold: 90%
On-target: 105%
Maximum: 120%
In assessing the Group’s performance against these targets, the Committee uses a constant currency approach. Thus, the 2017 full-year EPS performance was retranslated at December 2016 full-year average foreign exchange rates to establish performance. This is consistent with practice in previous years.
Governance

110 Vesuvius plcAnnual Report and Accounts 2017
In 2017, Vesuvius’ retranslated EPS performance was 39.1 pence, and cash conversion was 104%. Consequently EPS performance was above maximum and the cash conversion performance was between threshold and target. Payments of 75% and 11.38% of base salary respectively, 86.38% in total were therefore due to the Executive Directors and François Wanecq under the Annual Incentive in respect of the fi nancial performance metrics.
Personal ObjectivesIn 2017, a proportion (20%) of the Annual Incentive for Executive Directors (representing 25% of the maximum 125% bonus entitlement) was based on the achievement of personal objectives. A summary of the objectives set and performance achieved is set out below.
Patrick AndréSummary of objective Summary outcome
Drive Group performance > Launched new incremental restructuring programme with different scope> Introduced and drove upgraded budget process for 2018
Transition to Chief Executive and engage the senior management team
> Completed tailored induction and handover of key contacts > Developed relationship with investor community> Developed relationships with senior teams in the Foundry, Advanced Refractories and
Digital Services business unitsManage the succession in Flow Control business unit leadership
> Selected successor, and continued to manage the Flow Control business unit until handover
> Assisted in induction of new Flow Control PresidentReview Group organisation and implement changes identifi ed
> Reviewed and confi rmed business unit leadership and updated organisational responsibility of business units
> Redefi ned corporate functional roles, organisation and leadership with clear communication
In summary, after considering performance as outlined above, the Committee approved an Annual Incentive payout of 19.65% of base salary, out of the 25%, in respect of the personal objectives of Patrick André for the period of his tenure as Chief Executive. For the period of his tenure as President Flow Control, Mr André was awarded 9.76% of base salary, out of 16%, in respect of his personal objectives.
Guy YoungSummary of objective Summary outcome
Develop people and team > Developed updated functional strategy and plans, including full team evaluation> Developed updated succession plans for key fi nance functions> Drove performance across the team
Improve working capital management process
> Implemented new supplier fi nance scheme> Introduced clearer working capital management and reporting processes, with
demonstrable impact on working capital performanceManage the Implementation of Shared Service Strategy
> Delivered strategy. Oversaw launch of project and commenced transition with appropriate performance metrics put in place
Develop Group IR strategy > Implemented updated strategy and broker performance reviews> Managed clear investor engagement and enhanced share register
Enhance processes for monitoring corporate activity
> Increased robustness of internal processes > Enhanced the capabilities for assessment of fi nancial performance for corporate activity
In summary, after considering performance as outlined above, the Committee approved an Annual Incentive payout of 15.75% of base salary out of the 25%, in respect of the personal objectives of Guy Young.
François WanecqSummary of objective Summary outcome
Drive Group performance for 2017 > Maintained clear control of capital expenditure> Reduced working capital percentage, improvement in cash conversion
Support the process for CEO succession
> Strong support of succession process with appropriate assistance provided> Effective transfer of key relationships both within and outside the Group
Complete implementation of agreed restructuring plan
> Delivered expected savings from existing plan > Existing plan perimeter extended to increase savings and return
Implement the Board approved strategy
> Increased performance focus on key growing markets of China and India> Continued the development of the Technical Service offering
Target corporate activity and business growth
> Continued focus on opportunities for corporate development> Supported incremental growth in key areas of strategic focus
Annual Report on Directors’ Remuneration continued

111
In summary, after considering performance as outlined above, the Committee approved an Annual Incentive payoutof 15% of pro-rated base salary, out of the 25%, in respect of the personal objectives of Francois Wanecq for the period of his tenure as Chief Executive during the year.
The total Annual Incentive awards payable to Patrick André and Guy Young in respect of their services as a Director during 2017 are therefore 106% of pro-rated salary and 102% of salary respectively. The total Annual Incentive award payable to François Wanecq in respect of 2017 is 101% of salary. François Wanecq will receive his Annual Incentive payment in cash in line with the Remuneration Policy. 33% of Patrick André and Guy Young’s Annual Incentive payments will be deferred into awards over shares, to be held for a period of three years.
2018 Annual IncentiveThe Remuneration Committee has determined that for 2018 the structure of the Annual Incentive will remain broadly the same as for 2017: 60% of the Executive Directors’ Annual Incentives will therefore be based on Group headline earnings per share, 20% on working capital using an updated objective of the Group’s working capital to sales ratio (based on the 12-month moving average) and 20% on the achievement of personal objectives. The Company will not be disclosing the targets set until after the relevant performance period has ended because of commercial sensitivities. The personal objectives for 2018 are all non-fi nancial or job-specifi c in nature and track performance against key strategic, organisational and operational goals. The maximum Annual Incentive potential for 2018 will be 125% of base salary. 33% of any Annual Incentive earned will be deferred into awards over shares, to be held for a period of three years.
Malus/Clawback Arrangements in 2018Vesuvius has malus and clawback arrangements in respect of Executive Directors’ variable remuneration. The structure of those arrangements is outlined in our Remuneration Policy.
Longer-term Pay (“LTIPs”) – AuditedPerformance Share awards are allocated to the Executive Directors under the Vesuvius Share Plan (VSP). In accordance with the Remuneration Policy and the rules of the VSP, they are eligible to receive, on an annual basis, a Performance Share award with a face value of up to 200% of salary. Vesting of 50% of shares awarded is based upon the Company’s three-year TSR performance relative to that of the constituent companies
of the FTSE 250 (excluding investment trusts), and 50% on headline EPS growth. The level of compound headline EPS growth specifi ed in the targets is set by the Remuneration Committee each year, taking into account the Group’s prospects and the broader global economic environment. The schedule of EPS targets is designed at the maximum level to be highly challenging, whilst remaining an effective incentive for the management team. The EPS and TSR measures operate independently. The use of these performance measures is intended to align executive remuneration with shareholders’ interests. UK Executives receive awards in the form of nil-cost options with a fl exible exercise date and non-UK Executives receive awards which are exercised on the date of vesting.
On 16 March 2017, François Wanecq and Guy Young received allocations of Performance Shares worth 200% and 150% of their base salaries, respectively. Following his appointment as Chief Executive on 1 September 2017, it was agreed that Patrick André would receive a pro-rated ‘top up’ of his 2017 Performance Share award. As a result on 1 September 2017, he was granted an additional Performance Share award of 42,257 shares. This award, in addition to the Performance Share award of 60,413 shares awarded to him on 16 March 2017, brought his total award of Performance Shares in 2017 to 200% of his salary on a pro-rated basis. It refl ected the increase in his Performance Share percentage entitlement and the increase in his salary for the fi nal four months of the year.
The Remuneration Committee has determined that Patrick André will receive a Performance Share award in 2018 equivalent in value to 200% of his base salary and Guy Young an award equivalent in value to 150% of his base salary.
The performance period applicable to the awards made in 2015 ended on 31 December 2017. The TSR performance during this three-year performance period was assessed against the comparator group and it was determined that the Company’s performance was between median and upper quintile. As a result, 27.1% of Performance Share awards will vest under the TSR performance element. The Committee reviewed statistics from various sources which gave a large range of outcomes of global GDP growth. The Committee concluded that 2½% p.a. was a reasonable base against which to measure the Company’s EPS growth of 6.8% p.a. for the 2015-2017 performance period. As a result the Group’s annual compound headline EPS growth above this GDP measure for the period was 4.3%. Therefore, 16.6% of Performance Share awards will vest under the EPS performance element. These awards will vest in April 2018.
Target for the 2015 Performance Share Awards – AuditedTSR ranking relative to FTSE 250excluding investment trusts Vesting percentage
Annual compound headlineEPS growth above global GDP Vesting percentage
Below median 0% Below 3% 0%Median 12.50% 3% 12.50%Between median and upper quintile
Pro rata between 12.50% and 50%
Between 3% and 15% Pro rata between 12.50% and 50%
Upper quintile 50% At or above 15% 50%
Governance
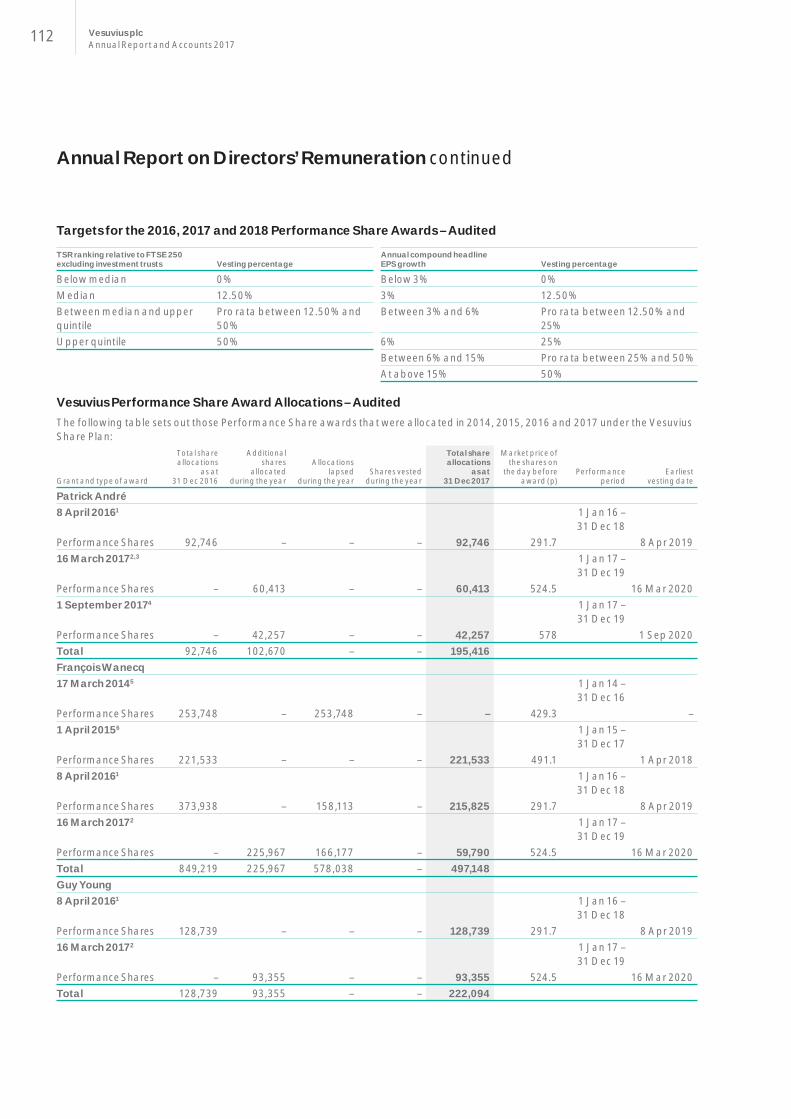
112 Vesuvius plcAnnual Report and Accounts 2017
Targets for the 2016, 2017 and 2018 Performance Share Awards – Audited
TSR ranking relative to FTSE 250excluding investment trusts Vesting percentage
Annual compound headlineEPS growth Vesting percentage
Below median 0% Below 3% 0%Median 12.50% 3% 12.50%Between median and upper quintile
Pro rata between 12.50% and 50%
Between 3% and 6% Pro rata between 12.50% and 25%
Upper quintile 50% 6% 25%Between 6% and 15% Pro rata between 25% and 50%At above 15% 50%
Vesuvius Performance Share Award Allocations – AuditedThe following table sets out those Performance Share awards that were allocated in 2014, 2015, 2016 and 2017 under the Vesuvius Share Plan:
Grant and type of award
Total share allocations
as at 31 Dec 2016
Additionalshares
allocatedduring the year
Allocationslapsed
during the yearShares vested
during the year
Total shareallocations
as at 31 Dec 2017
Market price ofthe shares on
the day beforeaward (p)
Performanceperiod
Earliestvesting date
Patrick André8 April 20161 1 Jan 16 –
31 Dec 18Performance Shares 92,746 – – – 92,746 291.7 8 Apr 201916 March 20172,3 1 Jan 17 –
31 Dec 19Performance Shares – 60,413 – – 60,413 524.5 16 Mar 20201 September 20174 1 Jan 17 –
31 Dec 19Performance Shares – 42,257 – – 42,257 578 1 Sep 2020Total 92,746 102,670 – – 195,416François Wanecq17 March 20145 1 Jan 14 –
31 Dec 16Performance Shares 253,748 – 253,748 – – 429.3 –1 April 20156 1 Jan 15 –
31 Dec 17Performance Shares 221,533 – – – 221,533 491.1 1 Apr 20188 April 20161 1 Jan 16 –
31 Dec 18Performance Shares 373,938 – 158,113 – 215,825 291.7 8 Apr 201916 March 20172 1 Jan 17 –
31 Dec 19Performance Shares – 225,967 166,177 – 59,790 524.5 16 Mar 2020Total 849,219 225,967 578,038 – 497,148Guy Young8 April 20161 1 Jan 16 –
31 Dec 18Performance Shares 128,739 – – – 128,739 291.7 8 Apr 201916 March 20172 1 Jan 17 –
31 Dec 19Performance Shares – 93,355 – – 93,355 524.5 16 Mar 2020Total 128,739 93,355 – – 222,094
Annual Report on Directors’ Remuneration continued

113
Note:1. In 2016, François Wanecq and Guy Young received allocations of Performance Shares worth 200% and 125% of their base salaries, being 373,938 shares and
128,739 shares respectively. In addition, prior to his appointment as Chief Executive, Patrick André received an award of 92,746 shares in respect of his role as President, Flow Control. On the date of his retirement from the Company on 31 December 2017, François Wanecq’s entitlement to the shares he was granted in 2016 was reduced pro-rata to refl ect his departure part way through the vesting period. As a result, 158,113 shares lapsed on this date.
2. On 16 March 2017, François Wanecq and Guy Young received allocations of Performance Shares worth 200% and 150% of their base salaries, being 225,967 shares and 93,355 shares respectively. In addition, prior to his appointment as Chief Executive, Patrick André received an award of 60,413 shares in respect of his role as President, Flow Control. These allocations were calculated based upon the average closing mid-market price of Vesuvius’ shares on the fi ve dealing days before the award was made, being £5.222. The total value of these awards based on this share price on the date of grant was £1,180,000, £487,500 and £315,477 respectively. On the date of his retirement from the Company on 31 December 2017, François Wanecq’s entitlement to the shares he was granted in 2017 was reduced pro-rata to refl ect his departure part way through the vesting period. As a result, 166,177 shares lapsed on this date.
3. Patrick André’s March 2017 Performance Share award is subject to Flow Control performance conditions. Under these, 7,552 of the 60,413 shares awarded are deemed to have met the performance condition applicable in the fi rst year. The achievement of the performance condition will be reassessed at the end of 2018, and 2019.
4. Following his promotion to Chief Executive on 1 September 2017, Patrick André received an additional award of 42,257 Performance Shares in the form of a conditional award. This award brought his total award of Performance Shares in 2017 to 200% of his salary on a pro-rated basis, which is the maximum annual award for the Chief Executive as determined by the Vesuvius Remuneration Policy. The allocation was calculated based upon the average closing mid-market price of Vesuvius’ shares on the fi ve dealing days before the award was made, being £5.794 per share. The total value of the award based on this share price on the date of grant was £244,837.
5. The Performance Shares that were allocated in 2014 had performance conditions to be tested over the fi nancial years 2014, 2015 and 2016. As the requisite performance was not achieved, François Wanecq’s award lapsed on the third anniversary of grant in March 2017.
6. The Performance Shares that were allocated in 2015 had performance conditions to be tested over the fi nancial years 2015,2016 and 2017. The performance period for the LTIP. In accordance with the Company’s achievement of the specifi ed performance conditions, 43.7% of François Wanecq’s Performance Shares,96,809 shares, are due to vest on 1 April 2018. In addition the Remuneration Committee has determined that Mr Wanecq will receive a cash payment of £47,872 which is equivalent to the value of the dividends that would have been paid on the number of shares that are due to vest in respect of dividend record dates occurring during the period between the award date and the date of vesting.
Additional notes: 7. All of François Wanecq and Guy Young’s awards have been made in the form of nil cost options with no exercise price. Patrick André’s award were made in the form of
conditional awards.8. If the performance conditions for these awards are not met then these awards will lapse. If the threshold level of either of the two performance conditions applicable
to these awards is met, then 12.50% of the award will vest.9. The Remuneration Committee also has the discretion to award cash or shares equivalent in value to the dividend that would have accrued during the vesting period
on the number of shares that vest.10. The mid-market closing price of Vesuvius’ shares during 2017 ranged between 400 pence and 606 pence per share and on 29 December 2017, the last dealing day
of the year, was 584 pence per share.
Restricted Share AwardOn Guy Young’s appointment as Chief Financial Offi cer in 2015, the Committee resolved that it would partially compensate him for long-term incentives that he forfeited as a result of joining Vesuvius by granting a one-off Restricted Share award over 17,115 shares under the Vesuvius Share Plan. The value of this award was included in the Directors’ Remuneration table in the 2015 Remuneration Report.
Half of this award vested in 2016, and the remainder vested on 1 November 2017, the second anniversary of the date of his commencement of employment. Details of the portion of the Restricted Share award that vested during 2017 are given in the table below:
Date of award
Outstanding share allocation
1 Jan 2017Shares vested
during the year1
Outstanding share allocation
31 Dec 2017
13 May 2016 8,557 8,557 –
Note:1. 8,557 shares vested to Guy Young on 1 November 2017. The mid-market closing price of the Company’s shares on the date of vesting was £5.885 per share. The total
value of shares that he received on the date of vesting was therefore £50,358. In addition, Guy Young received a cash payment of £2,838.78 to refl ect the dividends that would have accrued on the shares between his date of joining and the vesting date.
Governance

114 Vesuvius plcAnnual Report and Accounts 2017
Statement of Directors’ Shareholding – AuditedThe interests of Directors and their closely associated persons in ordinary shares as at 31 December 2017, including any interests in share options and shares provisionally awarded under the Vesuvius Share Plan are set out below:
Benefi cialholding
Outstandingincentive
awards1
Executive DirectorsPatrick André – 195,416François Wanecq 1,363,930 497,148Guy Young 14,551 222,094Non-executive DirectorsJohn Mc Donough CBE (Chairman) 100,000 –Christer Gardell2 – –Hock Goh 5,000 –Jane Hinkley 12,000 –Douglas Hurt 18,000 –Holly Koeppel 7,500 –
Note:1. Patrick André holds conditional awards of 195,416 shares, and François Wanecq and Guy Young hold 497,148 and 222,094 nil cost options respectively, granted as
Performance Shares under the Vesuvius Share Plan. These are all subject to performance conditions. 2. Christer Gardell is Managing Partner of, and has a fi nancial interest in, Cevian Capital which held 21.11% of Vesuvius’ issued share capital as at 31 December 2017
and at the date of this report.
Additional notes: 3. None of the other Directors, nor their spouses, nor their minor children, held non-benefi cial interests in the ordinary shares of the Company during the year. 4. There were no changes in the interests of the Directors in the ordinary shares of the Company in the period from 1 January 2018 to the date of this Report.5. All awards under the Vesuvius Share Plan are subject to performance conditions and continued employment until the relevant vesting date as set out on pages 112
and 113. 6. Full details of Directors’ shareholdings and incentive awards are given in the Company’s Register of Directors’ Interests, which is open to inspection at the Company’s
registered offi ce during normal business hours.
Shareholding GuidelinesThe Remuneration Committee encourages Executive Directors to build and hold a shareholding in the Company. The required holding of the Chief Executive is to be equivalent in value to at least 2x salary and that required of other Executive Directors is to be equivalent in value to at least 1x salary. To this end, Executive Directors are required to retain at least 50% (measured as the value after tax) of any shares received through the operation of share schemes; in addition, permission to sell shares held – whether acquired through the operation of share schemes or otherwise – will not be given, other than in exceptional circumstances, if, following the disposal, the shareholding requirements have not been achieved.
Compliance with the shareholding policy is tested at the end of each year for application in the following year using the average of the closing prices of a Vesuvius ordinary share for the trading days in that December.
Executive Directors’ Shareholdings – AuditedAs at 31 December 2017, the Executive Directors’ shareholdings against the current shareholding guidelines (using the Company’s share price averaged over the trading days of the period 1 December to 31 December 2017, of 565.97 pence per share) were as follows:
Director
Actual share ownership as a percentage of salary
at 31 Dec 2017Policy share ownership
as a percentage of salary Policy met?
Patrick André 0% 200% In the build-up periodGuy Young 25% 100% In the build-up period
Annual Report on Directors’ Remuneration continued

115
Annual Changes in Chief Executive Pay vs Employee PayThe table below shows the percentage change in the remuneration of the Chief Executive – comprising salary, taxable benefi ts and Annual Incentive – and comparable data for UK salaried employees. The UK salaried employee workforce was chosen as a fair representation of a suitable comparator group as both the former Chief Executive François Wanecq and the incumbent Chief Executive Patrick André are based in the UK (albeit with a global role and responsibilities) and levels of pay vary widely across the Group depending on geography and local market conditions.
Chief Executive
UK salaried employee workforce
(average per capita)
20171
(£000)2016
(£000) % change % change
Salary 568 590 (3.73) 1.01Taxable benefi ts2 212 35 505 0.89Annual bonus 585 371 57.68 55.30Note:1. Salary, taxable benefi ts and Annual Incentive amounts in respect of the Chief Executive for 2017 refl ect the sum of amounts payable to François Wanecq in respect
of service from 1 January 2017 to 31 August 2017, and amounts payable to Patrick André in respect of service from 1 September 2017 to 31 December 2017.
2. The increase in benefi ts principally results from the change in Chief Executive during the year. Further information on the benefi ts paid to Patrick André and François Wanecq during 2017 can be found in Note 4 to the Directors’ Remuneration table on page 108.
Annual Spend on Employee Pay vs Shareholders’ DistributionsThe charts below show the annual spend on all employees (including Executive Directors) compared with distributions made and proposed to be made to shareholders for 2016 and 2017:
RemunerationDividends
£441.5m
£48.6m
90%
10%
Relative importance of spend on pay (2017) £m
RemunerationDividends
£384.8m
£44.7m
90%
10%
Relative importance of spend on pay (2016) £m
B
(£m)2017
(£m)2016 Change
Group remuneration of continuing operations (see Note 8) 441.5 384.8 14.73%Dividends (based on fi nal proposed dividend) 48.6 44.7 8.72%
Governance

116 Vesuvius plcAnnual Report and Accounts 2017
TSR Performance and Chief Executive PayThe TSR performance graph compares Vesuvius TSR performance with that of the same investment in the FTSE 250 Index (excluding investment trusts). This index has been chosen as the comparator index to refl ect the size, international scope and diversity of the Company. TSR is the measure of the returns that a company has provided for its shareholders, refl ecting share price movements and assuming reinvestment of dividends. A spot rate has been used for this graph. The demerger of Vesuvius plc was effective on 19 December 2012 and therefore the graph shows the period from 19 December 2012 to 31 December 2017.
Vesuvius’ total shareholder return compared against total shareholder return of the FTSE 250 index (excluding investment trusts) since demerger
François Wanecq1 Patrick André2
Chief Executive pay – fi nancial year ending 31/12/12 31/12/13 31/12/14 31/12/15 31/12/16 31/12/17 31/12/17
Total remuneration (single fi gure (£000)) £1,227 £2,447 £1,519 £752 £1,173 1,675 461Annual variable pay (% of maximum) 0% 100% 64% 0% 63% 101% 106%Long-term variable pay (% of maximum) 67% 28% 27% 0% 0% 43.7% n/a
Note:1. Amounts shown in respect of François Wanecq for 2017 refl ect payments in respect of his service as Chief Executive from 1 January 2017 to 31 August 2017 and the
full value of his Vesuvius Share Plan award in relation to the performance period 2015–2017.2. Amounts shown in respect of Patrick André for 2017 refl ect payments in respect of his service as Chief Executive from 1 September 2017 to 31 December 2017.
Statement on Shareholder VotingAt the last AGM (which was held on 10 May 2017) the resolution concerning the advisory vote on the Remuneration Report for 2017 received 239,094,321 votes (98.99%) in favour and 2,434,510 votes against (1.01%); 1,432,104 votes were withheld. The Remuneration Policy received 238,743,173 (98.86%) in favour and 2,762,888 votes (1.14%) against; 1,454,874 votes were withheld. At the AGM to be held on 10 May 2018, shareholders will again be invited to participate in an advisory vote on the Remuneration Report.
The Directors’ Remuneration Report has been approved by the Board and is signed on its behalf by
Jane Hinkley Chairman, Remuneration Committee
28 February 2018
Annual Report on Directors’ Remuneration continued
FTSE 250 Index (excluding Investment Trusts)Vesuvius plc
19/12/12
50
100
150
200
250
117
Directors’ ReportThe Directors submit their Annual Report together with the audited accounts of the Group and of the Company, Vesuvius plc, registered in England and Wales No. 8217766, for the year ended 31 December 2017.
The Companies Act 2006 requires the Company to provide a Directors’ Report for Vesuvius plc for the year ended 31 December 2017. The information that fulfi ls this requirement and which is incorporated by reference into, and forms part of, this report is included in the following sections of the Annual Report:
> The Our Responsibility section
> The Governance section
> Financial Instruments: the information on fi nancial risk management objectives and policies contained in Notes 20 and 27 to the Group Financial Statements
This Directors’ Report and the Strategic Report contained in pages 1 to 73 together represent the management report for the purpose of compliance with DTR 4.1.8R of the UK Listing Authority’s Disclosure and Transparency Rules. The Company does not have any overseas branches within the meaning of the Companies Act 2006.
Going ConcernInformation on the business environment in which the Group operates, including the factors that are likely to impact the future prospects of the Group, is included in the Strategic Report. The principal risks and uncertainties that the Group faces throughout its global operations are shown on pages 24 and 25. The fi nancial position of the Group, its cash fl ows, liquidity position and debt facilities are also described in the Strategic Report. In addition, the Group’s Viability Statement is set out within the Strategic Report on page 23. Notes 20 and 27 to the Group Financial Statements set out the Group’s objectives, policies and processes for managing its capital; fi nancial risks; fi nancial instruments and hedging activities; and its exposures to credit, market (both currency and interest rate related) and liquidity risk. Further details of the Group’s cash balances and borrowings are included in Notes 13, 14 and 27 to the Group Financial Statements.
The Directors have prepared cash fl ow forecasts for the Group for a period in excess of 12 months from the date of approval of the 2017 fi nancial statements. These forecasts refl ect an assessment of current and future end-market conditions and their impact on the Group’s future trading performance. The forecasts show that the Group will be able to operate within the current committed debt facilities and show continued compliance with the Company’s fi nancial covenants. On the basis of the exercise described above and the Group’s available committed debt facilities, the Directors consider that the Group and Company have adequate resources to continue in operational existence for a period of at least 12 months from the date of signing of these accounts. Accordingly, they continue to adopt a going concern basis in preparing the fi nancial statements of the Group and the Company.
Research and DevelopmentThe Group’s investment in research and development (R&D) during the year under review amounted to £33.2m (representing approximately 2.0% of Group revenue (2016: 2.0%). Further details of the Group’s R&D activities can be found in the Innovation section of the Strategic Report.
DividendsAn interim dividend of 5.50 pence (2016: 5.15 pence) per Vesuvius ordinary share was paid on 22 September 2017 to Vesuvius shareholders. The Board is recommending a fi nal dividend in respect of 2017 of 12.50 pence (2016: 11.40 pence) per ordinary share which, if approved, will be paid on 25 May 2018 to shareholders on the register at 13 April 2018.
Accountability and AuditA responsibility statement of the Directors and a statement by the auditor about its reporting responsibilities can be found on pages 121 and 124 to 129 respectively. The Directors fulfi l the responsibilities set out in their statement within the context of an overall control environment of central strategic direction and delegated operating responsibility. As at the date of this report, so far as each Director of the Company is aware, there is no relevant audit information of which the Company’s auditor is unaware and each Director hereby confi rms that they have taken all the steps that they ought to have taken as a Director in order to make themselves aware of any relevant audit information and to establish that the Company’s auditor is aware of that information.
Auditor AppointmentsA competitive tender process for the appointment of a statutory auditor was conducted during 2016. Following the completion of this the Company recommended that PricewaterhouseCoopers LLP (PwC) be appointed as external auditor for Vesuvius plc for the year ended 31 December 2017, replacing KPMG LLP. Shareholder approval to confi rm the appointment of PwC was given at the 2017 AGM. PwC has expressed its willingness to continue in offi ce as auditor of the Company, and consequently, resolutions for the reappointment of PwC as auditor of the Company and to authorise the Directors to determine its remuneration are to be proposed at the AGM.
DirectorsThe Directors of the Company are Patrick André, Christer Gardell, Hock Goh, Jane Hinkley, Douglas Hurt, Holly Koeppel, John McDonough CBE and Guy Young. Patrick André joined the Board as Chief Executive on 1 September 2017, replacing François Wanecq who retired from the Board on 31 August 2017. Holly Koeppel joined the Board as an additional independent Non-executive Director on 3 April 2017. All the Directors will retire at the AGM and offer themselves for election or re-election at the AGM. Biographical information for the current Directors is given on pages 50 and 51. Further information on the remuneration of, and contractual
Directors’ Report
Governance
118 Vesuvius plcAnnual Report and Accounts 2017
Directors’ Report continued
arrangements for, the current Executive and Non-executive Directors is given on pages 96 to 116 in the Directors’ Remuneration Report. The Non-executive Directors do not have service agreements.
Directors’ IndemnitiesThe Directors have been granted qualifying third party indemnity provisions by the Company and the Directors of the Group’s UK Pension Plan Trustee Board (none of whom is a Director of Vesuvius plc) have been granted qualifying pension scheme indemnity provisions by Vesuvius Pension Plans Trustees Ltd. The indemnities for Directors of Vesuvius plc have been in force since the date of their appointment. The Pension Trustee indemnities were in force throughout the last fi nancial year and remain in force.
Annual General MeetingThe Annual General Meeting of the Company will be held at The Lincoln Centre, 18 Lincoln’s Inn Fields, London WC2A 3ED on Thursday 10 May 2018 at 11.00 am.
Amendments of Articles of AssociationThe Company may make amendments to the Articles by way of special resolution in accordance with the Companies Act.
Greenhouse Gas EmissionsInformation on our reporting of greenhouse gas emissions, and the methodology used to record these, is set out on page 65 of the Strategic Report.
DonationsIn accordance with Company policy, no political donations were made in 2017 (2016: nil).
Change of Control ProvisionsThe terms of the Group’s committed bank facility and US Private Placement Loan Notes contain provisions entitling the counterparties to exercise termination or other rights in the event of a change of control on takeover of the Company. A number of the arrangements to which the Company and its subsidiaries are party, such as other debt arrangements and share incentive plans, may also alter or terminate on a change of control in the event of a takeover. In the context of the Group as a whole, these other arrangements are not considered to be signifi cant.
Share CapitalAs at the date of this report, the Company had an issued share capital of 278,485,071 ordinary shares of 10 pence each; 7,271,174 of these ordinary shares are held in Treasury. Therefore, the total number of Vesuvius plc shares with voting rights is 271,213,897.
Further information relating to the Company’s issued share capital can be found in Note 8 to the Company Financial Statements.
The Company’s Articles specify that, subject to the authorisation of an appropriate resolution passed at a General Meeting of the Company, Directors can allot relevant securities under Section 551 of the Companies Act up to the aggregate nominal amount specifi ed by the relevant resolution. In addition, the Articles state that the Directors can seek the authority of shareholders in a General Meeting to allot equity securities for cash, without fi rst being required to offer such shares to existing ordinary shareholders in proportion to their existing holdings under Section 561 of the Companies Act, in connection with a rights issue and in other circumstances up to the aggregate nominal amount specifi ed by the relevant resolution.
At the Annual General Meeting on 10 May 2017, the Directors were authorised to issue relevant securities up to an aggregate nominal amount of £9,040,463, and, in connection with a rights issue, to issue relevant securities up to a further nominal value of £9,040,463. In addition, the Directors were empowered to allot equity securities, or sell Treasury Shares, for cash on a non pre-emptive basis up to an aggregate nominal amount of £1,356,069, and for the purposes of fi nancing (or refi nancing, if the authority is to be used within six months after the original transaction) a transaction which the Board of the Company determines to be an acquisition or other capital investment, to allot equity securities, or sell Treasury Shares, for cash on a non pre-emptive basis up to an additional nominal amount of £1,356,069. Each of the authorities given in these resolutions expires at the earlier of the date of the 2018 Annual General Meeting or 30 June 2018. The resolutions were all tabled in accordance with the terms of the Pre-Emption Group’s Statement of Principles. The Directors propose to renew these authorities at the 2018 Annual General Meeting for a further year. In the year ahead, other than in respect of Vesuvius’ ability to satisfy rights granted to employees under its various share-based incentive arrangements, the Directors have no present intention of issuing any share capital of Vesuvius plc.
Authority for Purchase of Own SharesSubject to the provisions of company law and any other applicable regulations, the Company may purchase its own shares. At the Annual General Meeting of the Company held on 10 May 2017, Vesuvius shareholders gave authority to the Company to make market purchases of up to 27,121,389 Vesuvius ordinary shares, representing 10% of the Company’s issued ordinary share capital as at the latest practicable day prior to the publication of the Notice of AGM. This authority expires on 30 June 2018 or the date of the AGM to be held in 2018, whichever is the earlier. The Directors will seek renewal of this authority at the forthcoming AGM.
In 2013 the Company acquired 7,271,174 ordinary shares, representing a nominal value of £727,117 and 2.6% of the entire called-up share capital of the Company prior to the purchase.

119
These shares were purchased pursuant to the Board’s commitment to return the majority of the net proceeds of the disposal of the Precious Metals Processing division to shareholders. These shares are currently held as Treasury shares. The Company has not subsequently disposed of any of the repurchased shares. During the year, the Company did not make any further acquisitions of shares, any acquisitions by nominee, nor did it dispose of any shares previously acquired. The Company does not have a lien over any of its shares.
Share PlansVesuvius operates a number of share-based incentive plans. Under these plans the Group can satisfy entitlements by the acquisition of existing shares, the transfer of Treasury shares or by the issue of new shares. Existing shares are held in an employee share ownership plan trust (‘ESOP’). The Trustee of the ESOP purchases shares in the open market as required to enable the Group to meet liabilities for the issue of shares to satisfy awards that vest. The Trustee does not register votes in respect of these shares and has waived the right to receive any dividends.
Restrictions on Transfer of Shares and VotingThe Company’s Articles of Association (‘Articles’) do not contain any specifi c restrictions on the size of a holding or on the transfer of shares. The Directors are not aware of any agreements between holders of the Company’s shares that may result in restrictions on the transfer of securities or voting rights.
No person has any special rights with regard to the control of the Company’s share capital and all issued shares are fully paid. This is a summary only and the relevant provisions of the Articles should be consulted if further information is required.
Interests in the Company’s SharesThe Company has been notifi ed in accordance with DTR 5 of the Disclosure and Transparency Rules of the following interests of 3%, or more, of its issued ordinary shares:
As at31 Dec 2017
As at28 Feb 2018
Cevian Capital 21.11 21.11Standard Life Aberdeen 5.92 5.92Artisan Partners 4.97 4.97Aberforth Partners 4.93 4.93Pelham Capital Management CfD 4.58 4.58Phoenix Asset Management 3.10 3.10
The interests of Directors and their connected persons in the ordinary shares of the Company as disclosed in accordance with the Listing Rules of the Financial Conduct Authority are as set out on pages 113 and 114 of the Directors’ Remuneration Report and details of the Directors’ long-term incentive awards are set out on page 114.
Equal Opportunities EmploymentVesuvius plc is an equal opportunities employer, and decisions on recruitment, development, training and promotion, and other employment-related issues are made solely on the grounds of individual ability, achievement, expertise and conduct. These principles are operated on a non-discriminatory basis, without regard to race, colour, nationality, culture, ethnic origin, religion, belief, gender, sexual orientation, age, disability or any other reason not related to job performance or prohibited by applicable law. In cases where employees are injured or disabled during employment with the Group, support, including appropriate training, is provided to those employees and workplace adjustments are made as appropriate in respect of their duties and working environment, supporting recovery and continued employment.
Employee CommunicationsVesuvius adopts an open and honest approach to employee communications, supported by regular updates from senior management across all businesses and operations within the Group. Regular communications include direct email updates on the fi nancial performance of the Company, the industry environment in which Vesuvius operates, and other signifi cant operational developments. The Company operates an employee intranet which distributes Company news and events, as well as local initiatives for employee engagement on a site-by-site basis. The HR department is the primary point of contact for employees on employment and workplace matters, operating with an open-door policy and advising employees of any local legal, tax, pension or other employment changes. There are numerous employee-sponsored and led representative bodies within Vesuvius which differ with respect to jurisdiction and geography. Senior management, supported and facilitated by the HR department, encourages open dialogue and seeks opportunities to consult with these employee representative bodies as appropriate.
PensionsIn each country in which the Group operates, the pension arrangements in place are considered to be consistent with good employment practice in that particular area. Independent advisers are used to ensure that the plans are operated in accordance with local legislation and the rules of each plan. Group policy prohibits direct investment of pension fund assets in the Company’s shares. Outside the UK, the US, Germany and Belgium, the majority of pension plans in the Group are of a defi ned contribution nature.
In 2016 the main German defi ned benefi t plan was closed for new entrants and existing members were offered a buy-out of their benefi ts under this plan. Those who accepted this buy-out then joined the new defi ned contribution plan.
The Group’s UK defi ned benefi ts plan (the ‘UK Plan’) and the main US defi ned benefi ts plans are closed to new entrants and have ceased providing future benefi ts accrual, with all eligible employees instead being provided with benefi ts through defi ned contribution arrangements.
Governance

120 Vesuvius plcAnnual Report and Accounts 2017
For the Group’s closed UK Plan, a Trustee Board exists comprising employees, former employees and an independent trustee. The Board currently comprises six trustee Directors, of whom two are member-nominated. The administration of the UK Plan is outsourced. The Company is mindful of its obligations under the Pensions Act 2004 and of the need to comply with the guidance issued by the Pensions Regulator. Regular dialogue is maintained between the Company and the Trustee Board of the UK Plan to ensure that both the Company and Trustee Board are apprised of the same fi nancial and other information about the Group and the UK Plan. This is pertinent to each being able to contribute to the effective functioning of the UK Plan.
Vesuvius continues to seek ways to de-risk its existing pension plans through a combination of asset matching, buy-in opportunities and, where prudent, voluntary cash contributions.
The Group’s worldwide net pension defi cit at 31 December 2017 was £16.5m (31 December 2016: £29.4m). The principal reasons for the £12.9m reduction were increases of £1.8m to the defi cit arising out of changes to actuarial assumptions (attributable to increasing discount rates; updated mortality assumptions and pension membership data) and additional accrual and administrative expenditure paid for the year (£6.8m); offest by reductions to the defi cit of £10.2m from asset returns and cash contributions of £11.6m.
The following disclosures are made in compliance with the Financial Conduct Authority’s Listing Rule 9.8.4C R:
Disclosure requirement under LR 9.8.6R Reference/Location
(1) Interest capitalised by the Group during the year See Note 9.1 on page 143(2) Publication of unaudited fi nancial information Not applicable(3) the appropriateness of adopting the going concern basis of accounting and the Directors assessment of the prospects of the Company
Page 117
(4) Details of any long-term incentive schemes Pages 99 and 100(5) Director waiver of emoluments Not applicable (6) Director waiver of future emoluments Not applicable(7) Allotment for cash of equity securities made during the year Not applicable (8) Allotment for cash of equity securities made by a major unlisted subsidiary during the year
Not applicable
(9) Details of participation of parent undertaking in any placing made during the year
Not applicable
(10) Details of relevant contracts in which a Director or controlling shareholder was interested during the year
Not applicable
(11) Contracts for the provision of services by a controlling shareholder during the year
Not applicable
(12) Details of any arrangement under which a shareholder has waived or agreed to waive any dividends
Vesuvius plc holds 7,271,174 of its £0.10 ordinary shares as Treasury shares. No dividends are payable on these shares. Cookson Investments (Jersey) Limited, the Trustee of the Company’s ESOP, has agreed to waive, on an ongoing basis, any dividends payable on shares it holds on trust for use under the Company’s Employee Share Plans, details of which can be found on pages 107, 118 and 119
(13) Details of where a shareholder has agreed to waive future dividends
See above
(14) Statements relating to controlling shareholders and ensuring company independence
Not applicable
The Directors’ Report has been approved by the Board and is signed on its behalf by
Henry Knowles Company Secretary
28 February 2018
Directors’ Report continued
121
The Directors are responsible for preparing the Annual Report and the fi nancial statements in accordance with applicable law and regulation.
Company law requires the Directors to prepare fi nancial statements for each fi nancial year. Under that law the Directors have prepared the Group fi nancial statements in accordance with International Financial Reporting Standards (IFRSs) as adopted by the European Union and Company fi nancial statements in accordance with United Kingdom Generally Accepted Accounting Practice (United Kingdom Accounting Standards, comprising FRS 101 “Reduced Disclosure Framework”, and applicable law). Under company law the Directors must not approve the fi nancial statements unless they are satisfi ed that they give a true and fair view of the state of affairs of the Group and Company and of the profi t of the Group for that period. In preparing the fi nancial statements, the Directors are required to:
> select suitable accounting policies and then apply themconsistently;
> state whether applicable IFRSs as adopted by the European Union have been followed for the Group fi nancial statements and United Kingdom Accounting Standards, comprising FRS 101, have been followed for the Company fi nancial statements, subject to any material departures disclosed and explained in the fi nancial statements;
> make judgements and accounting estimates that are reasonable and prudent; and
> prepare the fi nancial statements on the going concern basis unless it is inappropriate to presume that the Group and Company will continue in business.
The Directors are responsible for keeping adequate accounting records that are suffi cient to show and explain the Group and Company’s transactions and disclose with reasonable accuracy at any time the fi nancial position of the Group and Company and enable them to ensure that the fi nancial statements and the Directors’ Remuneration Report comply with the Companies Act 2006 and, as regards the Group fi nancial statements, Article 4 of the IAS Regulation.
The Directors are also responsible for safeguarding the assets of the Group and Company and hence for taking reasonable steps for the prevention and detection of fraud and other irregularities.
The Directors are responsible for the maintenance and integrity of the Company’s website. Legislation in the United Kingdom governing the preparation and dissemination of fi nancial statements may differ from legislation in other jurisdictions.
The Directors consider that the Annual Report and Accounts, taken as a whole, is fair, balanced and understandable and provides the information necessary for shareholders to assess the Group and Company’s performance, business model and strategy.
Responsibilities Statement of the Directors in respect of the Annual Financial ReportEach of the Directors confi rm that, to the best of their knowledge:
> the Company fi nancial statements, which have been prepared in accordance with United Kingdom Generally Accepted Accounting Practice (United Kingdom Accounting Standards, comprising FRS 101 “Reduced Disclosure Framework”, and applicable law), give a true and fair view of the assets, liabilities, fi nancial position and loss of the Company;
> the Group fi nancial statements, which have been prepared in accordance with IFRSs as adopted by the European Union, give a true and fair view of the assets, liabilities, fi nancial position and profi t of the Group; and
> the Directors’ Report includes a fair review of the development and performance of the business and the position of the Group and Company, together with a description of the principal risks and uncertainties that it faces.
The names and functions of the Directors of Vesuvius plc are as follows:
John McDonough CBE Chairman Patrick André Chief Executive Guy Young Chief Financial Offi cer Christer Gardell Non-executive Director Hock Goh Non-executive DirectorJane Hinkley Non-executive Director and Chairman of the Remuneration CommitteeDouglas Hurt Non-executive Director, Senior Independent Director and Chairman of the Audit CommitteeHolly Koeppel Non-executive Director
On behalf of the Board
Guy Young Chief Financial Offi cer
28 February 2018
Statement of Directors’ Responsibilities in respect of the Annual Report and Financial Statements
Governance

122 Vesuvius plcAnnual Report and Accounts 2017
Section Five
Financial StatementsIn this section124 Independent Auditors’ Report
130 Group Income Statement
131 Group Statement of Comprehensive Income
132 Group Statement of Cash Flows
133 Group Balance Sheet
134 Group Statement of Changes in Equity
135 Notes to the Group Financial Statements
181 Company Balance Sheet
183 Notes to the Company Financial Statements
188 Five-Year Summary: Divisional Results
189 Shareholder Information
191 Glossary

123Financial Statem
ents
Adam Liszka, Operations Director Advanced Refractories, NAFTA
“I relocated to the UAE to help set up our Ras Al Khaimah facility”
See more about Vesuvius careers People and Community on p67-73
My career with Vesuvius began in Poland in 2001, when I joined the Skawina Brick Plant as Production Coordinator. After a series of promotions, I became Production Manager for the whole Skawina Brick Plant in 2009.
I was later given the exciting opportunity to work overseas, relocating fi rst to the UAE in 2012 to help start operations at our brand-new manufacturing facility in Ras Al Khaimah, and later moved to the United States as Operations Manager at our plant in Chicago Heights, Illinois. Whilst there, I worked with our Chicago Heights team to set the foundations for the Yellowstone project, targeting increased manufacturing effi ciency at our site.
Following this project, I took on my next challenge, by becoming the Operations Director for Advanced Refractories NAFTA, responsible for the manufacturing operations of sites across the US, Canada and Mexico. My career at Vesuvius has brought me professional advancement, the opportunity to work across cultures and to become a real citizen of the world.

124 Vesuvius plcAnnual Report and Accounts 2017
Report on the audit of the fi nancial statements
OpinionIn our opinion:
> Vesuvius plc’s Group fi nancial statements and Company fi nancial statements (the ‘fi nancial statements’) give a true and fair view of the state of the Group’s and of the Company’s affairs as at 31 December 2017 and of the Group’s profi t and cash fl ows for the year then ended
> The Group fi nancial statements have been properly prepared in accordance with IFRSs as adopted by the European Union
> The Company fi nancial statements have been properly prepared in accordance with United Kingdom Generally Accepted Accounting Practice (United Kingdom Accounting Standards, comprising FRS 101 ‘Reduced Disclosure Framework’, and applicable law)
> The fi nancial statements have been prepared in accordance with the requirements of the Companies Act 2006 and, as regards the Group fi nancial statements, Article 4 of the IAS Regulation
We have audited the fi nancial statements, included within the Annual Report and Accounts (the ‘Annual Report’), which comprise: the Group and Company Balance Sheets as at 31 December 2017; the Group Income Statement and Statement of Comprehensive Income, the Group Statement of Cash Flows, and the Group and Company Statements of Changes in Equity for the year then ended; and the notes to the fi nancial statements, which include a description of the signifi cant accounting policies.
Our opinion is consistent with our reporting to the Audit Committee.
Basis for OpinionWe conducted our audit in accordance with International Standards on Auditing (UK) (‘ISAs (UK)’) and applicable law. Our responsibilities under ISAs (UK) are further described in the auditors’ responsibilities for the audit of the fi nancial statements section of our report. We believe that the audit evidence we have obtained is suffi cient and appropriate to provide a basis for our opinion.
IndependenceWe remained independent of the Group in accordance with the ethical requirements that are relevant to our audit of the fi nancial statements in the UK, which includes the FRC’s Ethical Standard, as applicable to listed public interest entities, and we have fulfi lled our other ethical responsibilities in accordance with these requirements.
During the period, we identifi ed that we had provided a prohibited tax compliance service in respect of payroll taxes to the Group in breach of paragraph 5.167R(a)(ii) of the FRC’s Ethical Standard. Total fees billed in the period in respect of the service amounted to £1,800. Upon identifying the breach, we immediately ceased providing this prohibited service. The prohibited service was provided to a component that did not form part of our audit evidence in respect of the audit of the Group. We confi rm that, based on our assessment of this breach, and the subsequent actions taken, we have not, in our view, compromised our independence.
Other than the matter referred to above, and to the best of our knowledge and belief, we declare that no non-audit services prohibited by the FRC’s Ethical Standard were provided to the Group or the Company.
Other than those disclosed in the Audit Committee’s Report, we have provided no other non-audit services to the Group or the Company in the period from 1 January 2017 to 31 December 2017.
Independent Auditors’ ReportTo the Members of Vesuvius plc
Materiality
> Overall Group materiality: £7.6m, based on 5% of profi t before tax and separately reported items (‘Headline profi t before tax’)
> Overall Company materiality: £7.6m, based on 1% of total assets, capped to the level of Group materiality
Audit scope
> Our audit included full-scope audits of 20 components and specifi ed procedures on certain balances and transactions for nine additional components
> Taken together, the components at which either full scope audit work or specifi ed audit procedures were performed enabled us to get coverage on 68% of revenue and 76% of Headline profi t before tax
Key audit matters
> Provisions for exposures
> Provisions for income tax uncertainties
> Recognition of deferred tax assets for tax losses
Our Audit Approach – Overview
Materiality
Audit scope
Key audit matters
125
The Scope of our AuditAs part of designing our audit, we determined materiality and assessed the risks of material misstatement in the fi nancial statements. In particular, we looked at where the Directors made subjective judgements, for example in respect of signifi cant accounting estimates that involved making assumptions and considering future events that are inherently uncertain.
We gained an understanding of the legal and regulatory framework applicable to the Group and the industry in which it operates, and considered the risk of acts by the Group which were contrary to applicable laws and regulations, including fraud. We designed audit procedures at the Group and signifi cant component level to respond to the risk, recognising that the risk of not detecting a material misstatement due to fraud is higher than the risk of not detecting one resulting from error, as fraud may involve deliberate concealment by, for example, forgery or intentional misrepresentations, or through collusion. We focused on laws and regulations that could give rise to a material misstatement in the Group and Company fi nancial statements, including, but not limited to, the UK Companies Act 2006, the Listing Rules, and global tax compliance matters. Our tests included, but were not limited to, review of the fi nancial statement disclosures to underlying supporting documentation, review of correspondence with legal advisers, enquiries of management, review of signifi cant component auditors’ work and review of Internal Audit reports in so far as they related to the fi nancial statements.
There are inherent limitations in the audit procedures described above and the further removed non-compliance with laws and regulations is from the events and transactions refl ected in the fi nancial statements, the less likely we would become aware of it.
We did not identify any key audit matters relating to irregularities, including fraud. As in all of our audits we also addressed the risk of management override of internal controls, including testing journals and evaluating whether there was evidence of bias by the directors that represented a risk of material misstatement due to fraud.
Key Audit MattersKey audit matters are those matters that, in the auditors’ professional judgement, were of most signifi cance in the audit of the fi nancial statements of the current period and include the most signifi cant assessed risks of material misstatement (whether or not due to fraud) identifi ed by the auditors, including those which had the greatest effect on: the overall audit strategy; the allocation of resources in the audit; and directing the efforts of the engagement team. These matters, and any comments we make on the results of our procedures thereon, were addressed in the context of our audit of the fi nancial statements as a whole, and in forming our opinion thereon, and we do not provide a separate opinion on these matters. This is not a complete list of all risks identifi ed by our audit.
Key audit matter How our audit addressed the key audit matter
Provisions for exposuresThe Group holds a number of provisions for exposures including those resulting from indirect tax, regulatory, legal and environmental matters as well as restructuring commitments.
Refer to Restructuring Charges (Note 7), Provisions (Note 32), Accounting Policies and Critical Accounting Judgements and Estimates (Note 3) and Signifi cant Issues and Material Judgements in the Audit Committee Report (page 87).
Determining the quantum of provisions requires the Directors to use judgement and estimation, and for certain provisions, obtain specialist knowledge.
We focused on this area due to the judgement and estimates involved.
We obtained an understanding for the basis of each signifi cant estimate and the key assumptions used for provisions and, in certain cases, the related insurance assets.
Restructuring costs related to the Group’s rationalisation of its operational and support functions. The costs predominantly included redundancies and severance payments, professional adviser fees and other impairment charges for obsolete inventories and property, plant and equipment.
> We have tested a sample of restructuring costs to determine that these are directly attributable to the Group’s restructuring activities
> For costs which are provided for at the year-end, we have verifi ed for a sample of transactions that a legal or constructive obligation exists
> From our procedures we concluded that restructuring costs were appropriately recognised and classifi ed within the fi nancial statements
For provisions for disposal and closure costs, including litigation matters:
> We obtained supporting computations for the estimated costs and tested the mathematical accuracy of these
> We discussed obligations arising with in-house and external legal counsel and inspected supporting evidence of the history of claims arising where these were used as inputs into client models used to estimate the provisions
> We also inspected evidence of available insurance cover and that this was appropriately presented gross of the associated provisions (within ‘Other receivables’) and considered the fi nancial condition of insurance providers
> We found no exceptions in respect of this work
Financial Statements

126 Vesuvius plcAnnual Report and Accounts 2017
Key audit matter How our audit addressed the key audit matter
For all provisions we considered whether there is a range of possible outcomes in respect of each estimate. Where appropriate, we verifi ed that disclosure is included within the Annual Report of this.
We also considered the impact of the provisions for exposures on the reporting and disclosure of separately reported items and Alternate Performance Measures in the fi nancial statements and verifi ed that appropriate disclosures are made in the Annual Report.
Provisions for income tax uncertaintiesThe Group holds a number of provisions for income tax exposures arising from tax structuring, transfer pricing and local authority reviews.
Refer to Income Tax (Note 10), Accounting Policies and Critical Accounting Judgements and Estimates (Note 3) and Signifi cant Issues and Material Judgements in the Audit Committee Report (page 87).
Determining the quantum of these provisions requires the Directors to make judgements and estimates, and for certain provisions, obtain specialist knowledge.
We utilised our tax specialists to provide a view of material judgements made. Our audit procedures included:
> Obtaining relevant computations and correspondence in respect of each material element of the provision for income tax uncertainty
> Understanding the key assumptions made by management in recognising the provision and forming an independent view on the reasonableness of the assumptions
> Assessing the consistency of approach used to determine provisions compared with prior periods, and considering whether such consistency remains appropriate
> Considering the range of possible outcomes in respect of the estimates and that the Annual Report discloses the nature of the estimation uncertainty
From our procedures we concluded that the estimates are reasonable and that appropriate disclosures have been included within the Annual Report.
Recognition of deferred tax assets for tax lossesIn certain territories such as the US, the Group has a material quantum of historical tax losses.
The determination of whether these will be utilised in the future is judgemental, particularly as to how much of these could be reasonably expected to be utilised.
In addition, the impact of US tax changes enacted in December 2017 requires reassessment of the calculation of total tax losses and the lives attached to these. There is a risk of error and judgement given these changes are complex and subject to interpretation.
Refer to Income Tax (Note 10), Accounting Policies and Critical Accounting Judgements and Estimates (Note 3) and Signifi cant Issues and Material Judgements in the Audit Committee Report (page 87).
We utilised our tax specialists to support with the audit testing of the quantum of tax losses in the US and that this is accurately determined, taking into account the year-end US tax reforms. We concluded the tax losses are accurately determined.
In addition to testing the quantum of tax losses:
> We tested management’s forecasts supporting the amounts recognised as a deferred tax asset, and considered the likelihood of forecasts being achieved
> We also considered a range of possible outcomes in the forecast and that an appropriate midpoint was taken in selecting the amount to recognise
> We considered alternative views and whether a full versus partial recognition approach was appropriate. We concluded that the current approach, which recognises tax losses as deferred tax assets to the extent there is profi t forecast against them which will be utilised, remains the most appropriate. We verifi ed that appropriate disclosure of the amount of deferred tax asset not recognised is included within the fi nancial statements
From our procedures we concluded that the estimate is reasonable and that appropriate disclosures have been included within the Annual Report.
We determined that there were no key audit matters applicable to the Company to communicate in our report.
Independent Auditors’ ReportTo the Members of Vesuvius plc continued

127
How We Tailored the Audit ScopeWe tailored the scope of our audit to ensure that we performed enough work to be able to give an opinion on the fi nancial statements as a whole, taking into account the structure of the Group and the Company, the accounting processes and controls, and the industry in which they operate.
Vesuvius has operations in 37 countries and has 66 production sites. The Group consolidates fi nancial information through reporting from its components which include divisions and functions at these sites.
Our audit scope was determined by considering the signifi cance of the entity’s contribution to revenue and contribution to individual fi nancial statement line items, with specifi c consideration to obtaining suffi cient coverage over areas of high risk and locations and entities where we identifi ed signifi cant or inherent risks.
We identifi ed one signifi cant component being the Group’s German operations which comprise 14% of the Group’s revenue. As the Group’s remaining revenue is spread across 74 fi nancial reporting components there were no other individually fi nancially signifi cant components. The audit scope, including Germany, comprised 20 components for which we determined that full-scope audits would need to be performed and nine components for which specifi c audit procedures on certain balances and transactions were performed. This collectively gave us coverage of 68% of the Group’s revenue and 76% of the Group’s Headline profi t before tax. This, together with the
additional procedures performed at the Group level, including testing the consolidation process, gave us the evidence we needed for our opinion on the fi nancial statements as a whole.
In establishing the overall approach to the Group audit, we determined the type of work that needed to be performed at the entities by us, as the Group engagement team, or by component auditors of other PwC network fi rms. Where the work was performed by component auditors, we determined the level of involvement and oversight we needed to have in the audit work at those reporting units to be able to conclude whether suffi cient appropriate audit evidence had been obtained as a basis for our opinion on the fi nancial statements as a whole. This was achieved through regular update meetings with the component auditors and visits to 17 of the 20 full-scope components by senior members of the Group audit team.
MaterialityThe scope of our audit was infl uenced by our application of materiality. We set certain quantitative thresholds for materiality. These, together with qualitative considerations, helped us to determine the scope of our audit and the nature, timing and extent of our audit procedures on the individual fi nancial statement line items and disclosures and in evaluating the effect of misstatements, both individually and in aggregate on the fi nancial statements as a whole.
Based on our professional judgement, we determined materiality for the fi nancial statements as a whole as follows:
Group fi nancial statements Company fi nancial statements
Overall materiality £7.6 million £7.6 millionHow we determined it 5% of profi t before tax and separately
reported items (‘Headline profi t before tax’)1% of total assets, capped to the level of Group overall materiality
Rationale for benchmark applied
We believe that profi t before tax and separately reported items (‘Headline profi t before tax’) provides us with an appropriate basis for determining our overall Group materiality given it is a key measure used by users of the fi nancial statements. Headline profi t before tax is an Alternative Performance Measure presented and defi ned in the Annual Report and Accounts.
We believe that total assets is an appropriate basis for determining materiality for the Parent Company, given this entity is an investment holding company and this is an accepted auditing benchmark. The materiality was capped to the level of Group overall materiality. The Company is not an in-scope component in our Group audit.
For each component in the scope of our Group audit, we allocated a materiality that is less than our overall Group materiality. The range of materiality allocated across components was between £0.1 million and £7.3 million. Certain components were audited to a local statutory audit materiality that was also less than our overall Group materiality.
We agreed with the Audit Committee that we would report to them misstatements identifi ed during our audit above £0.4 million (Group and Company audit) as well as misstatements below those amounts that, in our view, warranted reporting for qualitative reasons.
Financial Statements

128 Vesuvius plcAnnual Report and Accounts 2017
Going concernIn accordance with ISAs (UK) we report as follows:
Reporting obligation Outcome
We are required to report if we have anything material to add or draw attention to in respect of the Directors’ Statement in the fi nancial statements about whether the Directors considered it appropriate to adopt the going concern basis of accounting in preparing the fi nancial statements and the Directors’ identifi cation of any material uncertainties to the Group’s and the Company’s ability to continue as a going concern over a period of at least 12 months from the date of approval of the fi nancial statements.
We have nothing material to add or to draw attention to. However, because not all future events or conditions can be predicted, this statement is not a guarantee as to the Group’s and Company’s ability to continue as a going concern.
We are required to report if the Directors’ statement relating to going concern in accordance with Listing Rule 9.8.6R(3) is materially inconsistent with our knowledge obtained in the audit.
We have nothing to report.
Reporting on Other Information The other information comprises all of the information in the Annual Report other than the fi nancial statements and our Auditors’ Report thereon. The Directors are responsible for the other information. Our opinion on the fi nancial statements does not cover the other information and, accordingly, we do not express an audit opinion or, except to the extent otherwise explicitly stated in this report, any form of assurance thereon.
In connection with our audit of the fi nancial statements, our responsibility is to read the other information and, in doing so, consider whether the other information is materially inconsistent with the fi nancial statements or our knowledge obtained in the audit, or otherwise appears to be materially misstated. If we identify an apparent material inconsistency or material misstatement, we are required to perform procedures to conclude whether there is a material misstatement of the fi nancial statements or a material misstatement of the other information. If, based on the work we have performed, we conclude that there is a material misstatement of this other information, we are required to report that fact. We have nothing to report based on these responsibilities.
With respect to the Strategic Report and Directors’ Report, we also considered whether the disclosures required by the UK Companies Act 2006 have been included.
Based on the responsibilities described above and our work undertaken in the course of the audit, the Companies Act 2006, (CA06), ISAs (UK) and the Listing Rules of the Financial Conduct Authority (FCA) require us also to report certain opinions and matters as described below (required by ISAs (UK) unless otherwise stated).
Strategic Report and Directors’ ReportIn our opinion, based on the work undertaken in the course of the audit, the information given in the Strategic Report and Directors’ Report for the year ended 31 December 2017 is consistent with the fi nancial statements and has been prepared in accordance with applicable legal requirements (CA06).
In light of the knowledge and understanding of the Group and Company and their environment obtained in the course of the audit, we did not identify any material misstatements in the Strategic Report and Directors’ Report (CA06).
The Directors’ assessment of the prospects of the Group and of the principal risks that would threaten the solvency or liquidity of the GroupWe have nothing material to add or draw attention to regarding:
> The Directors’ confi rmation on page 23 of the Annual Report that they have carried out a robust assessment of the principal risks facing the Group, including those that would threaten its business model, future performance, solvency or liquidity
> The disclosures in the Annual Report that describe those risks and explain how they are being managed or mitigated
> The Directors’ explanation on page 23 of the Annual Report as to how they have assessed the prospects of the Group, over what period they have done so and why they consider that period to be appropriate, and their statement as to whether they have a reasonable expectation that the Group will be able to continue in operation and meet its liabilities as they fall due over the period of their assessment, including any related disclosures drawing attention to any necessary qualifi cations or assumptions
We have nothing to report having performed a review of the Directors’ Statement that they have carried out a robust assessment of the principal risks facing the Group and statement in relation to the longer-term viability of the Group. Our review was substantially less in scope than an audit and only consisted of making enquiries and considering the Directors’ process supporting their statements; checking that the statements are in alignment with the relevant provisions of the UK Corporate Governance Code (the ‘Code’); and considering whether the statements are consistent with the knowledge and understanding of the Group and Company and their environment obtained in the course of the audit (Listing Rules).
Independent Auditors’ ReportTo the Members of Vesuvius plc continued
129
Other Code ProvisionsWe have nothing to report in respect of our responsibility to report when:
> The statement given by the Directors, on page 121, that they consider the Annual Report taken as a whole to be fair, balanced and understandable, and provides the information necessary for the Members to assess the Group’s and Company’s position and performance, business model and strategy is materially inconsistent with our knowledge of the Group and Company obtained in the course of performing our audit
> The section of the Annual Report on pages 85 to 92 describing the work of the Audit Committee does not appropriately address matters communicated by us to the Audit Committee
> The Directors’ statement relating to the Company’s compliance with the Code does not properly disclose a departure from a relevant provision of the Code specifi ed, under the Listing Rules, for review by the auditors
Directors’ RemunerationIn our opinion, the part of the Directors’ Remuneration Report to be audited has been properly prepared in accordance with the Companies Act 2006 (CA06).
Responsibilities for the Financial Statements and the AuditResponsibilities of the Directors for the Financial StatementsAs explained more fully in the Statement of Directors’ Responsibilities in respect of the Annual Report and Financial Statements set out on page 121, the Directors are responsible for the preparation of the fi nancial statements in accordance with the applicable framework and for being satisfi ed that they give a true and fair view. The Directors are also responsible for such internal control as they determine is necessary to enable the preparation of fi nancial statements that are free from material misstatement, whether due to fraud or error.
In preparing the fi nancial statements, the Directors are responsible for assessing the Group’s and the Company’s ability to continue as a going concern, disclosing as applicable, matters related to going concern and using the going concern basis of accounting unless the Directors either intend to liquidate the Group or the Company or to cease operations, or have no realistic alternative but to do so.
Auditors’ Responsibilities for the Audit of the Financial StatementsOur objectives are to obtain reasonable assurance about whether the fi nancial statements as a whole are free from material misstatement, whether due to fraud or error, and to issue an auditor’s report that includes our opinion. Reasonable assurance is a high level of assurance, but is not a guarantee that an audit conducted in accordance with ISAs (UK) will always detect a material misstatement when it exists.
Misstatements can arise from fraud or error and are considered material if, individually or in the aggregate, they could reasonably be expected to infl uence the economic decisions of users taken on the basis of these fi nancial statements.
A further description of our responsibilities for the audit of the fi nancial statements is located on the FRC’s website at: www.frc.org.uk/auditorsresponsibilities. This description forms part of our Auditors’ Report.
Use of this ReportThis report, including the opinions, has been prepared for and only for the Company’s Members as a body in accordance with Chapter 3 of Part 16 of the Companies Act 2006 and for no other purpose. We do not, in giving these opinions, accept or assume responsibility for any other purpose or to any other person to whom this report is shown or into whose hands it may come save where expressly agreed by our prior consent in writing.
Other Required ReportingCompanies Act 2006 Exception ReportingUnder the Companies Act 2006 we are required to report to you if, in our opinion:
> We have not received all the information and explanations we require for our audit
> Adequate accounting records have not been kept by the Company, or returns adequate for our audit have not been received from branches not visited by us
> Certain disclosures of Directors’ remuneration specifi ed by law are not made
> The Company fi nancial statements and the part of the Directors’ Remuneration Report to be audited are not in agreement with the accounting records and returns
We have no exceptions to report arising from this responsibility.
AppointmentFollowing the recommendation of the Audit Committee, we were appointed by the Members on 10 May 2017 to audit the fi nancial statements for the year ended 31 December 2017 and subsequent fi nancial periods. This is therefore our fi rst year of uninterrupted engagement.
Julian Jenkins (Senior Statutory Auditor)for and on behalf of PricewaterhouseCoopers LLPChartered Accountants and Statutory AuditorsLondon
28 February 2018
Financial Statements

130 Vesuvius plcAnnual Report and Accounts 2017
Group Income Statement For the year ended 31 December 2017
Notes
2017 2016
(1)Headline performance
£m
(1) Separately reported
items£m
Total£m
(1)Headline performance
£m
(1) Separately reported
items£m
Total£m
Continuing operationsRevenue 4, 5 1,683.9 — 1,683.9 1,401.4 — 1,401.4Manufacturing costs (1,219.8) — (1,219.8) (1,018.6) — (1,018.6)Administration, selling and distribution costs (298.6) — (298.6) (249.5) — (249.5)Trading profi t 5 165.5 — 165.5 133.3 — 133.3Amortisation of acquired intangible assets 16 — (19.5) (19.5) — (17.1) (17.1)Restructuring charges 7 — (36.3) (36.3) — (28.5) (28.5)Gain on employee benefi t plan 28 — — — — 5.2 5.2Operating profi t/(loss) 165.5 (55.8) 109.7 133.3 (40.4) 92.9Finance expense (17.5) — (17.5) (17.4) — (17.4)Finance income 3.6 — 3.6 2.9 — 2.9Net fi nance costs 9 (13.9) — (13.9) (14.5) — (14.5)Share of post-tax profi t of joint ventures 35 1.3 — 1.3 1.0 — 1.0Profi t/(loss) before tax 152.9 (55.8) 97.1 119.8 (40.4) 79.4Income tax (charge)/credits 10 (36.4) (18.0) (54.4) (31.4) 5.0 (26.4)Profi t/(loss) from:Continuing operations 116.5 (73.8) 42.7 88.4 (35.4) 53.0Discontinued operations 22 — 1.7 1.7 — 10.2 10.2Profi t/(loss) 116.5 (72.1) 44.4 88.4 (25.2) 63.2
Profi t/(loss) attributable to:Owners of the parent 110.1 (72.1) 38.0 82.1 (25.2) 56.9Non-controlling interests 6.4 — 6.4 6.3 — 6.3Profi t/(loss) 116.5 (72.1) 44.4 88.4 (25.2) 63.2
Earnings per share — pence 11Continuing operations — basic 13.4 17.3 — diluted 13.4 17.3Total operations — basic 14.1 21.1 — diluted 14.0 21.0
(1) Headline performance is defi ned in Note 4.1 and separately reported items are defi ned in Note 2.5.
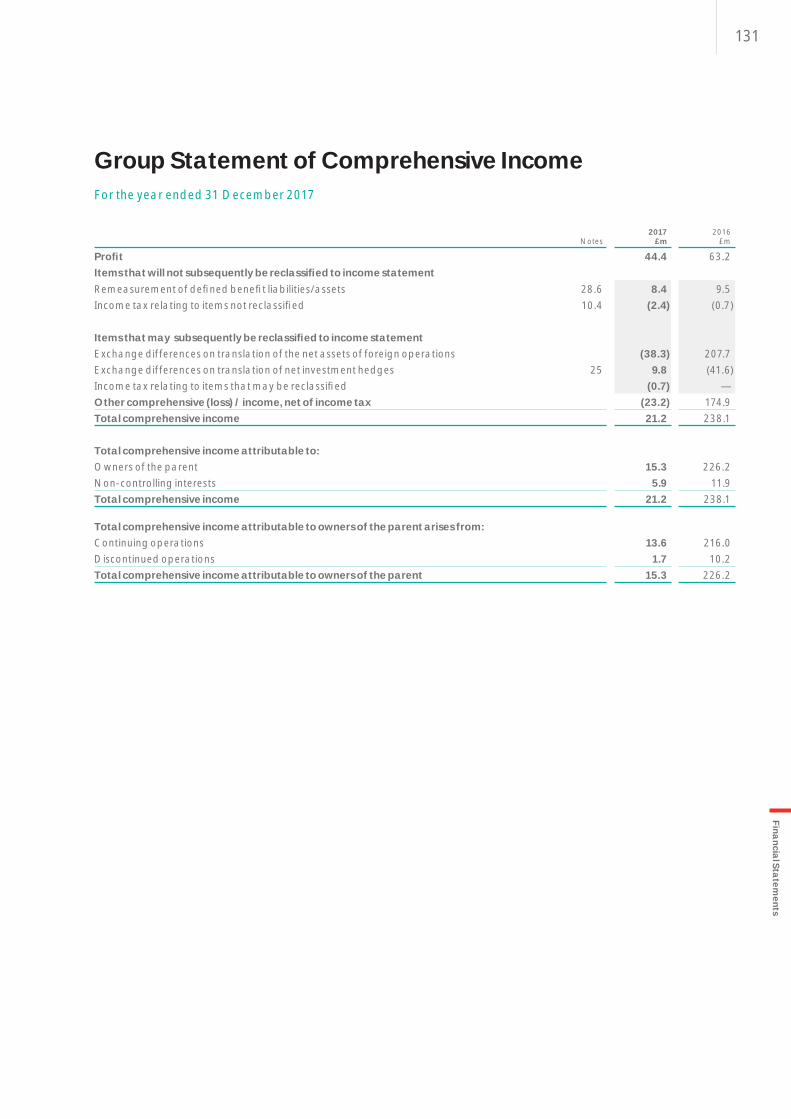
131Financial Statem
ents
Notes2017
£m2016
£m
Profi t 44.4 63.2Items that will not subsequently be reclassifi ed to income statementRemeasurement of defi ned benefi t liabilities/assets 28.6 8.4 9.5Income tax relating to items not reclassifi ed 10.4 (2.4) (0.7)
Items that may subsequently be reclassifi ed to income statementExchange differences on translation of the net assets of foreign operations (38.3) 207.7Exchange differences on translation of net investment hedges 25 9.8 (41.6)Income tax relating to items that may be reclassifi ed (0.7) —Other comprehensive (loss) / income, net of income tax (23.2) 174.9Total comprehensive income 21.2 238.1
Total comprehensive income attributable to:Owners of the parent 15.3 226.2Non-controlling interests 5.9 11.9Total comprehensive income 21.2 238.1
Total comprehensive income attributable to owners of the parent arises from:Continuing operations 13.6 216.0Discontinued operations 1.7 10.2Total comprehensive income attributable to owners of the parent 15.3 226.2
Group Statement of Comprehensive IncomeFor the year ended 31 December 2017

132 Vesuvius plcAnnual Report and Accounts 2017
Group Statement of Cash FlowsFor the year ended 31 December 2017
Notes2017
£m2016
£m
Cash fl ows from operating activitiesCash generated from operations 12 175.8 130.2Interest paid (15.6) (14.5)Interest received 3.5 2.4Net interest paid (12.1) (12.1)Income taxes paid (38.2) (34.2)Net cash infl ow from operating activities 125.5 83.9
Cash fl ows from investing activitiesCapital expenditure (39.0) (31.3)Proceeds from the sale of property, plant and equipment 1.8 1.6Acquisition of subsidiaries and joint ventures, net of cash acquired 21 — (7.7)Dividends received from joint ventures 1.7 2.0Net cash outfl ow from investing activities (35.5) (35.4)Net cash infl ow before fi nancing activities 90.0 48.5
Cash fl ows from fi nancing activitiesProceeds from borrowings 14 103.5 26.3Repayment of borrowings 14 (92.2) (25.5)Borrowing facility arrangement costs 14 (1.0) —Settlement of forward foreign exchange contracts (10.4) 20.6Dividends paid to equity shareholders 26 (45.6) (43.9)Dividends paid to non-controlling shareholders (2.5) (2.5)Net cash outfl ow from fi nancing activities (48.2) (25.0)Net increase in cash and cash equivalents 14 41.8 23.5Cash and cash equivalents at 1 January 101.0 67.0Effect of exchange rate fl uctuations on cash and cash equivalents 14 (2.8) 10.5Cash and cash equivalents at 31 December 13 140.0 101.0
Alternative performance measure (non-statutory):
Continuing operations
£m
Discontinued operations
£m
2017total
£m
Continuing operations
£m
Discontinued operations
£m
2016total
£m
Free cash fl ow (Note 4.10)Net cash infl ow/(outfl ow) from operating activities 126.3 (0.8) 125.5 83.9 — 83.9Net retirement benefi t obligations 4.8 — 4.8 7.7 — 7.7Capital expenditure (39.0) — (39.0) (31.3) — (31.3)Proceeds from the sale of property, plant and equipment 1.8 — 1.8 1.6 — 1.6Dividends received from joint ventures 1.7 — 1.7 2.0 — 2.0Dividends paid to non-controlling shareholders (2.5) — (2.5) (2.5) — (2.5)Free cash fl ow (Note 4.10) 93.1 (0.8) 92.3 61.4 — 61.4

133Financial Statem
ents
Notes2017
£m2016*
£m
AssetsProperty, plant and equipment 15 311.3 323.6Intangible assets 16 743.0 781.9Employee benefi ts – net surpluses 28 92.4 78.8Interests in joint ventures and associates 35 17.5 18.0Investments 1.4 2.6Income tax recoverable 10 0.4 1.0Deferred tax assets 10 61.0 92.1Other receivables 32 30.9 30.4Derivative fi nancial instruments 20 0.2 —Total non-current assets 1,258.1 1,328.4
Cash and short-term deposits 13 161.9 144.4Inventories 19 222.8 207.7Trade and other receivables 18 422.2 394.1Income tax recoverable 10 5.2 3.9Derivative fi nancial instruments 20 0.1 —Total current assets 812.2 750.1Total assets 2,070.3 2,078.5
EquityIssued share capital 23 27.8 27.8Retained earnings 24 2,370.3 2,370.0Other reserves 25 (1,369.4) (1,341.4)Equity attributable to the owners of the parent 1,028.7 1,056.4Non-controlling interests 45.4 42.1Total equity 1,074.1 1,098.5
LiabilitiesInterest-bearing borrowings 27.2 410.5 330.8Employee benefi ts – net liabilities 28 108.9 108.2Other payables 30 17.3 16.5Provisions 32 34.4 39.9Deferred tax liabilities 10 42.7 48.6Total non-current liabilities 613.8 544.0
Interest-bearing borrowings 27.2 25.7 133.9Trade and other payables 30 292.6 239.7Income tax payable 10 34.3 34.9Provisions 32 29.8 26.6Derivative fi nancial instruments 20 — 0.9Total current liabilities 382.4 436.0Total liabilities 996.2 980.0Total equity and liabilities 2,070.3 2,078.5
* Restated as a result of a change in accounting policy (Note 10.1) and the recording of a provision for which a related asset exists (Note 32).
The fi nancial statements were approved and authorised for issue by the Directors on 28 February 2018 and signed on their behalf by:
Patrick André Guy YoungChief Executive Chief Financial Offi cer
Group Balance SheetAs at 31 December 2017

134 Vesuvius plcAnnual Report and Accounts 2017
Group Statement of Changes in EquityFor the year ended 31 December 2017
Issued share capital
£m
Other reserves
£m
Retained earnings
£m
Owners of the parent
£m
Non-controlling
interests £m
Total equity
£m
As at 1 January 2016 27.8 (1,501.9) 2,346.5 872.4 32.7 905.1Profi t — — 56.9 56.9 6.3 63.2Remeasurement of defi ned benefi t liabilities/assets — — 9.5 9.5 — 9.5Income tax relating to items not reclassifi ed — — (0.7) (0.7) — (0.7)Exchange differences on translation of the net assets of foreign operations — 202.1 — 202.1 5.6 207.7Exchange differences on translation of net investment hedges — (41.6) — (41.6) — (41.6)Other comprehensive income, net of income tax — 160.5 8.8 169.3 5.6 174.9Total comprehensive income — 160.5 65.7 226.2 11.9 238.1Recognition of share-based payments — — 1.7 1.7 — 1.7Dividends paid (Note 26) — — (43.9) (43.9) (2.5) (46.4)Total transactions with owners — — (42.2) (42.2) (2.5) (44.7)As at 1 January 2017 27.8 (1,341.4) 2,370.0 1,056.4 42.1 1,098.5Profi t — — 38.0 38.0 6.4 44.4Remeasurement of defi ned benefi t liabilities/assets — — 8.4 8.4 — 8.4Income tax relating to items not reclassifi ed — — (2.4) (2.4) — (2.4)Exchange differences on translation of the net assets of foreign operations — (37.8) — (37.8) (0.5) (38.3)Exchange differences on translation of net investment hedges — 9.8 — 9.8 — 9.8Income tax relating to items that may be reclassifi ed — — (0.7) (0.7) — (0.7)Other comprehensive income / (loss) net of income tax — (28.0) 5.3 (22.7) (0.5) (23.2)Total comprehensive income / (loss) — (28.0) 43.3 15.3 5.9 21.2Recognition of share-based payments — — 2.6 2.6 — 2.6Dividends paid (Note 26) — — (45.6) (45.6) (2.6) (48.2)Total transactions with owners — — (43.0) (43.0) (2.6) (45.6)As at 31 December 2017 27.8 (1,369.4) 2,370.3 1,028.7 45.4 1,074.1
135Financial Statem
ents
1. General InformationVesuvius plc (‘Vesuvius’ or ‘the Company’) is a public company limited by shares. It is incorporated and domiciled in England and Wales and listed on the London Stock Exchange. The nature of the operations and principal activities of the Company and its subsidiary and joint venture companies (‘the Group’) is set out in the Strategic Report on pages 1 to 73 and its registered address is shown on page 189.
2. Basis of Preparation2.1 Basis of accounting
The Group Financial Statements have been prepared in accordance with International Financial Reporting Standards (IFRS) as adopted by the European Union and with the Companies Act 2006 applicable to companies reporting under IFRS. The fi nancial statements have been prepared under the historical cost convention, with the exception of defi ned benefi t pension plans, certain provisions, available-for-sale investments and derivative fi nancial instruments.
2.2 Basis of consolidationThe Group Financial Statements incorporate the fi nancial statements of the Company and entities controlled by the Company (its ‘subsidiaries’). Control exists when the Company has the power to direct the relevant activities of an entity that signifi cantly affect the entity’s return so as to have rights to the variable return from its activities. In assessing whether control exists, potential voting rights that are currently exercisable are taken into account. The results of subsidiaries acquired or disposed of during the year are included in the Group Income Statement from the effective date of acquisition or up to the effective date of disposal, as appropriate.
The principal accounting policies applied in the preparation of these Group Financial Statments are set out in the Notes. These policies have been consistently applied to all of the years presented, unless otherwise stated. Where necessary, adjustments are made to the fi nancial statements of subsidiaries to bring their accounting policies into line with those detailed herein to ensure that the Group fi nancial statements are prepared on a consistent basis. All intra-Group transactions, balances, income and expenses are eliminated on consolidation.
Non-controlling interests in the net assets of consolidated subsidiaries are identifi ed separately from the Group’s interest therein. Non-controlling interests consist of the amount of those interests at the date of the original business combination together with the non-controlling interests’ share of profi t or loss, each component of other comprehensive income, and dividends paid since the date of the combination. Total comprehensive income is attributed to the non-controlling interests even if this results in the non-controlling interests having a defi cit balance.
2.3 Going concernThe Directors have prepared cash fl ow forecasts for the Group for a period in excess of 12 months from the date of approval of the 2017 fi nancial statements. These forecasts refl ect an assessment of current and future end-market conditions and their impact on the Group’s future trading performance. The forecasts show that the Group will be able to operate within the current committed debt facilities and show continued compliance with the Company’s fi nancial covenants. On the basis of the exercise described above and the Group’s available committed debt facilities, the Directors consider that the Group and Company have adequate resources to continue in operational existence for a period of at least 12 months from the date of signing of these accounts. Accordingly, they continue to adopt a going concern basis in preparing the fi nancial statements of the Group and the Company.
2.4 Functional and presentation currencyThe fi nancial statements are presented in millions of pound sterling, which is the functional currency of the Company, and rounded to one decimal place. Foreign operations are included in accordance with the policies set out in Note 27.1.
2.5 Disclosure of ‘separately reported items’IAS 1 Presentation of Financial Statements encourages the disclosure of additional line items and the reordering of items presented on the face of the income statement when appropriate for a proper understanding of the entity’s fi nancial performance. The Company has adopted a columnar presentation for its Group Income Statement, to separately identify headline performance results, as the Directors consider that this gives a better view of the underlying results of the ongoing business. As part of this presentation format, the Company has adopted a policy of disclosing separately on the face of its Group Income Statement, within the column entitled ‘Separately reported items’, the effect of any components of fi nancial performance for which the Directors consider separate disclosure would assist both in a better understanding of the fi nancial performance achieved and in making projections of future results.
Both materiality and the nature and function of the components of income and expense are considered in deciding upon such presentation. Such items may include, inter alia, the fi nancial effect of exceptional items which occur infrequently, such as major restructuring activity, initial recognition and subsequent increase, decrease, utilisation and impact of tax reform on US deferred tax assets, together with items always reported separately, such as amortisation charges relating to acquired intangible assets, profi ts or losses arising on the disposal of continuing or discontinued operations and the taxation impact of the aforementioned exceptional items and items reported separately.
Notes to the Group Financial Statements

136 Vesuvius plcAnnual Report and Accounts 2017
Notes to the Group Financial Statements continued
2. Basis of Preparation (continued)
2.5 Disclosure of ‘separately reported items’ (continued)The amortisation charge in respect of intangible assets recognised on business combniations is excluded from the trading results of the Group since they are non-cash charges and are not considered reflective of the core trading performance of the Group. Restructuring charges are excluded from the trading results of the Group due to the material nature of these non-recurring transformational initiatives. In its adoption of this policy, the Company applies an even-handed approach to both gains and losses and aims to be both consistent and clear in its accounting and disclosure of such items.
2.6 New and revised IFRSCertain new accounting standards and interpretations have been published that are not mandatory for 31 December 2017 reporting periods and have not been early adopted by the Group. The Group’s assessment of the impact of these new standards and interpretations is set out below. Other new or amended standards or interpretations are not expected to have a signifi cant impact on the Group’s fi nancial statements.
IFRS 9 Financial InstrumentsIFRS 9 Financial Instruments (effective from 1 January 2018, for the year ending 2018) addresses the classifi cation, measurement and derecognition of fi nancial instruments, introduces new rules for hedge accounting and a new impairment model for fi nancial assets. It replaces IAS 39 Financial Instruments guidance and comprehensive updates have been made to IFRS 7 Financial Instrument: Disclosure and IAS 32 Financial Instruments: Presentation. The Group will apply IFRS 9 and the updated IFRS 7 disclosure requirements from their effective date.
The impact assessment performed by the Group included a review of the classifi cation and measurement of fi nancial instruments; the impairment of fi nancial assets and the group hedging policy which resulted in the following conclusions:
> The group reviewed the classifi cation and measurement of each of its fi nancial instruments. Although, the classifi cation of instruments is altered under IFRS 9, this does not result in any changes to the measurement approach apart from the impairment of trade receivables which is addressed below.
> The new impairment model for fi nancial assets requires the recognition of impairment provisions based on expected credit losses (“ECL”) rather than only incurred credit losses as is the case under IAS 39. The Group will apply the simplifi ed approach to its trade receivables as per the scope exception in IFRS 9 in which all loss allowances for trade receivables will be measured at initial recognition and throughout its life at an amount equal to lifetime ECL. This is consistent with the nature of the group’s trade receivables as they do not include a signifi cant fi nancing component. Based on the assessments undertaken to date, the group does not expect a material movement in the loss allowance for trade debtors.
> The new hedge accounting rules will align the accounting for hedging instruments more closely with the Group’s risk management practices. The Group has confi rmed that its current net investment hedge relationship will qualify as a continuing hedge upon the adoption of IFRS 9.
Based on our assessment of the adoption of IFRS 9, the Group does not believe there will be a material impact on its Group Financial Statements. From 1 January 2018 onwards, the Group will amend its fi nancial instruments and hedging accounting policies to refl ect IFRS 9 terminology and prepare the appropriate disclosures regarding the classifi cation and measurement of fi nancial instruments; impairment of fi nancial assets and hedging.
IFRS 15 Revenue from Contracts with CustomersIFRS 15 Revenue from Contracts with Customers (effective after 1 January 2018, for the year ending 2018) establishes a comprehensive framework for determining whether, how much and when revenue is recognised. It replaces existing revenue recognition guidance, including IAS 18 Revenue, IAS 11 Construction Contracts and IFRIC 13 Customer Loyalty Programmes. The Group will apply IFRS 15 from its effective date.
The impact assessment performed by the Group included a review of revenue streams and customer contracts to identify distinct performance obligations and the appropriate method for allocating the transaction price. Based on our assessment of the adoption of IFRS 15, the Group does not believe there will be a material impact on its Group Financial Statements. During 2018, the Group will revise the revenue recognition policy to refl ect IFRS 15 terminology, prepare the additional disclosures for the Group Financial Statements and continue to review contracts across all Segments. The Group will continue to disaggregate revenue over Steel and Foundry in the Segmental Analysis note.

137Financial Statem
ents
IFRS 16 LeasesIFRS 16 Leases (effective after 1 January 2019, for the year ending 2019) replaces the existing guidance in IAS 17 Leases. IFRS 16 provides a single lessee accounting model, requiring lessees to recognise assets and liabilities for all leases unless the lease term is 12 months or less or the underlying asset has a low value. The present value of the Group’s operating lease payments as defi ned under the new standard will be shown as lease liabilities on the balance sheet and included in net debt. There are a number of differences between the two defi nitions; for example, where there is an option to extend the lease, payments for the extension period will be included in the IFRS 16 liability if the Group is reasonably certain that it will exercise the option, but are not included as commitments under IAS 17.
The Group is currently assessing the potential impact on its Group Financial Statements resulting from the application of IFRS 16.
IFRIC 23 Uncertainty over Income Tax TreatmentsIFRIC 23 Uncertainty over Income Tax Treatments (effective from 1 January 2019, for the year ending 2019, not yet endorsed) clarifi es how to recognise and measure deferred and current income tax assets and liabilities where there is uncertainty over tax treatment under IAS 12. The Group is currently assessing the potential impact on its Group Financial Statements resulting from the application of IFRIC 23.
IFRIC Interpretation - Interest and Penalties on TaxThe impact of the interpretation regarding the accounting treatment of interest and penalties on tax is set out in Note 10.1.
3. Accounting Policies and Critical Accounting Judgements and EstimatesDetermining the carrying amount of some assets and liabilities requires estimation of the effect of uncertain future events. The major sources of estimation uncertainty that have a signifi cant risk of resulting in a material adjustment to the carrying amounts of assets or liabilities are noted below. All other accounting policies are included within the respective Notes to the fi nancial statements.
3.1 ProvisionsVesuvius has extensive international operations and is subject to various legal and regulatory regimes, including those covering taxation and environmental matters. Several of the Group’s subsidiaries are parties to legal proceedings, certain of which are insured claims arising in the ordinary course of the operations of the company involved, and are aware of a number of issues which are, or may be, the subject of dispute with tax authorities. Provisions are made for the expected amounts payable in respect of known or probable costs resulting both from legal or other regulatory requirements, or from third-party claims, as described in Note 32. As the settlement of many of the obligations for which provision is made is subject to legal or other regulatory process, the timing and amount of the associated outfl ows are subject to some uncertainty. The Directors use their judgement and experience to make appropriate estimates of provisions in the fi nancial statements for amounts relating to such matters.
3.2 Taxation
(a) Current taxTax benefi ts are not recognised unless it is probable that they will result in future economic benefi ts to the Group. In assessing the amount of the benefi t to be recognised in the fi nancial statements, the Directors exercise their judgement in considering the effect of negotiations, litigation and any other matters that they consider may impact upon the potential settlement. The Group operates internationally and is subject to tax in many different jurisdictions. As a consequence, the Group is routinely subject to tax audits and local enquiries which, by their very nature, can take a considerable period of time to conclude. Provisions are made for known issues based on all substantively enacted legislation, the Directors’ interpretation of country-specifi c tax law and their assessment of the likely outcome, taking into consideration the Group’s experience in agreeing tax liabilities with tax authorities and appropriate external advice. As indicated in Note 10.5, these provisions amount to £23.2m (2016: £24.5m) at the end of 2017. Further discussion of these provisions is contained in that Note. All income tax liabilities, provisions and assets are treated as income tax payable and recoverable in accordance with IAS 12.
(b) Deferred taxThe Group has recognised deferred tax assets in respect of unutilised losses and other timing differences arising in a number of the Group’s businesses, further details of which are given in Note 10.4. Account has been taken of future forecasts of taxable profi t in arriving at the values at which these assets are recognised. If these forecast profi ts do not materialise or change, or there are changes in tax rates or to the period over which the losses or timing differences might be recognised, then the value of deferred tax assets will need to be revised in a future period.

138 Vesuvius plcAnnual Report and Accounts 2017
3. Accounting Policies and Critical Accounting Judgements and Estimates (continued) (b) Deferred tax (continued)
The Group also has losses and other timing differences, also analysed in Note 10.4, for which no deferred tax assets have been recognised in these fi nancial statements, relating either to loss-making subsidiaries where the future economic benefi t of the timing difference is not probable or to where the timing difference is of such a nature that its value is dependent on certain types of profi t being earned, such as capital profi ts. If trading or other appropriate profi ts are earned in the future in these companies, these losses and other timing differences may yield benefi t to the Group in the form of a reduced tax charge.
As explained in Note 10.2, the US Tax Cuts and Jobs Act (‘TCJA’) enacted in late December 2017 had a material impact on the Group’s deferred tax position. TCJA was introduced very rapidly, and consequently there is much uncertainty about how some of the provisions will operate. As explained in Note 10.6, Vesuvius currently understands that the Base Erosion and Anti-Abuse Tax (‘BEAT’) will impact its tax charge in the US in 2018 and beyond, in relation to certain payments made to non-US related parties. Further clarifi cation is awaited from US Treasury so the precise impact of BEAT cannot be determined with certainty at this point.
Other reasonable estimations have been made in determining how US tax reform will impact on Vesuvius’ US 2017 deferred tax position in particular in relation to earnings and profi ts of Vesuvius’ non-US investments to be included in the deemed repatriation tolling charge calculations included in its 2017 taxable income.
As guidance is given by the US Treasury Department on how these, and other provisions of TCJA, are to operate, Vesuvius’ tax position may be impacted.
4. Alternative Performance MeasuresThe Company uses a number of alternative performance measures (APMs) in addition to those reported in accordance with IFRS. The Directors believe that these APMs, listed below, are important when assessing the underlying fi nancial and operating performance of the Group and its divisions, providing management with key insights and metrics in support of the ongoing management of the Group’s performance and cash fl ow. A number of these align with KPI’s and other key metrics used in the business and therefore are considered useful to also disclose to the users of the fi nancial statements. The following APMs do not have standardised meaning prescribed by IFRS and therefore may not be directly comparable with similar measures presented by other companies.
4.1 HeadlineHeadline performance, reported separately on the face of the Group Income Statement, is from continuing operations and before items reported separately on the face of the Group Income Statement.
4.2 Underlying revenue, underlying trading profi t and underlying return on salesUnderlying revenue, underlying trading profi t and underlying return on sales are the headline equivalents of these measures after adjustments to exclude the effects of changes in exchange rates, business acquisitions and disposals. Reconciliations of underlying revenue and underlying trading profi t can be found in the Financial Review. Underlying revenue growth is one of the Group’s key performance indicators and provides an important measure of organic growth of Group businesses between reporting periods, by eliminating the impact of exchange rates, acquisitions, disposals and signifi cant business closures.
4.3 Return on sales (ROS)ROS is calculated as trading profi t divided by revenue. It is one of the Group’s key performance indicators and is used to assess the trading performance of Group businesses. A reconciliation of ROS is included in Note 5.3.
4.4 Trading profi tTrading profi t, reported separately on the face of the Group Income Statement, is defi ned as operating profi t before separately reported items. It is one of the Group’s key performance indicators and is used to assess the trading performance of Group businesses. It is also used as one of the targets against which the annual bonuses of certain employees are measured.
4.5 Headline profi t before taxHeadline profi t before tax, reported separately on the face of the Group Income Statement, is calculated as the net total of trading profi t, plus the Group’s share of post-tax profi t of joint ventures and total net fi nance costs associated with headline performance. It is one of the Group’s key performance indicators and is used to assess the fi nancial performance of the Group as a whole.
4.6 Effective tax rate (ETR)The Group’s ETR is calculated on the income tax costs associated with headline performance, divided by headline profi t before tax and before the Group’s share of post-tax profi t of joint ventures.
Notes to the Group Financial Statements continued

139Financial Statem
ents
4.7 Headline earnings per share Headline earnings per share is calculated by dividing headline profi t before tax less associated income tax costs, attributable to owners of the parent by the weighted average number of ordinary shares in issue during the year. It is one of the Group’s key performance indicators and is used to assess the underlying earnings performance of the Group as a whole. It is also used as one of the targets against which the annual bonuses of certain employees are measured. Headline earnings per share is disclosed in Note 11.
4.8 Operating cash fl owOperating cash fl ow is cash generated from continuing operations before restructuring and net retirement benefi t obligations but after deducting capital expenditure net of asset disposals. It is used in calculating the Group’s cash conversion. A reconciliation of cash generated from operations to operating cash fl ow can be found in the Financial Review.
4.9 Cash conversionCash conversion is calculated as operating cash fl ow from continuing operations divided by trading profi t. It is useful for measuring the rate at which cash is generated from trading profi t. It is also used as one of the targets against which the annual bonuses of certain employees are measured. The calculation of cash conversion is detailed in the Financial Review.
4.10 Free cash fl owFree cash fl ow is defi ned as net cash fl ow from operating activities after net outlays for the purchase and sale of property, plant and equipment, dividends from joint ventures and dividends paid to non-controlling shareholders, but before additional funding contributions to Group pension plans. It is one of the Group’s key performance indicators and is used to assess the underlying cash generation of the Group and is one of the measures used in monitoring the Group’s capital. A reconciliation of free cash fl ow is included underneath the Group Statement of Cash Flows.
4.11 Average trade working capital to sales ratioThe average trade working capital to sales ratio is calculated as the percentage of average trade working capital balances to the total revenue for the year, at constant currency. Average trade working capital (comprising inventories, trade receivables and trade payables) is calculated as the average of the 12 previous month-end balances. It is one of the Group’s key performance indicators and is useful for measuring the level of working capital used in the business and is one of the measures used in monitoring the Group’s capital.
4.12 Earnings before interest, tax, depreciation and amortisation (EBITDA)EBITDA is calculated as the total of trading profi t before depreciation and amortisation of non-acquired intangible assets. It is used in the calculation of the Group’s interest cover and net debt to EBITDA ratios. A reconciliation of EBITDA is included in Note 12.
4.13 Net interestNet interest is calculated as interest payable on borrowings less interest receivable, excluding any item separately reported. It is used in the calculation of the Group’s interest cover ratio.
4.14 Interest coverInterest cover is the ratio of EBITDA to net interest. It is one of the Group’s key performance indicators and is used to assess the fi nancial position of the Group and its ability to fund future growth. This measure is also a component of the Group’s covenant calculations.
4.15 Net debtNet debt comprises the net total of current and non-current interest-bearing borrowings and cash and short-term deposits. Net debt is a measure of the Group’s net indebtedness to banks and other external fi nancial institutions. A reconciliation of the movement in net debt is included in Note 14 of the Group Financial Statements.
4.16 Net debt to EBITDANet debt to EBITDA is the ratio of net debt at the year-end to EBITDA for that year. It is one of the Group’s key performance indicators and is used to assess the fi nancial position of the Group and its ability to fund future growth and is one of the measures used in monitoring the Group’s capital.
4.17 Return on net assets (RONA)RONA is calculated as trading profi t plus share of post-tax profi t of joint ventures, divided by average net operating assets, at constant currency (being the average over the previous 12 months of property, plant and equipment, trade working capital and other operating receivables and payables). It is one of the Group’s key performance indicators and is used to assess the fi nancial performance and asset management of the Group and is one of the measures used in monitoring the Group’s capital.
4.18 Constant currencyFigures presented at constant currency represent 2016 amounts retranslated to average 2017 exchange rates.
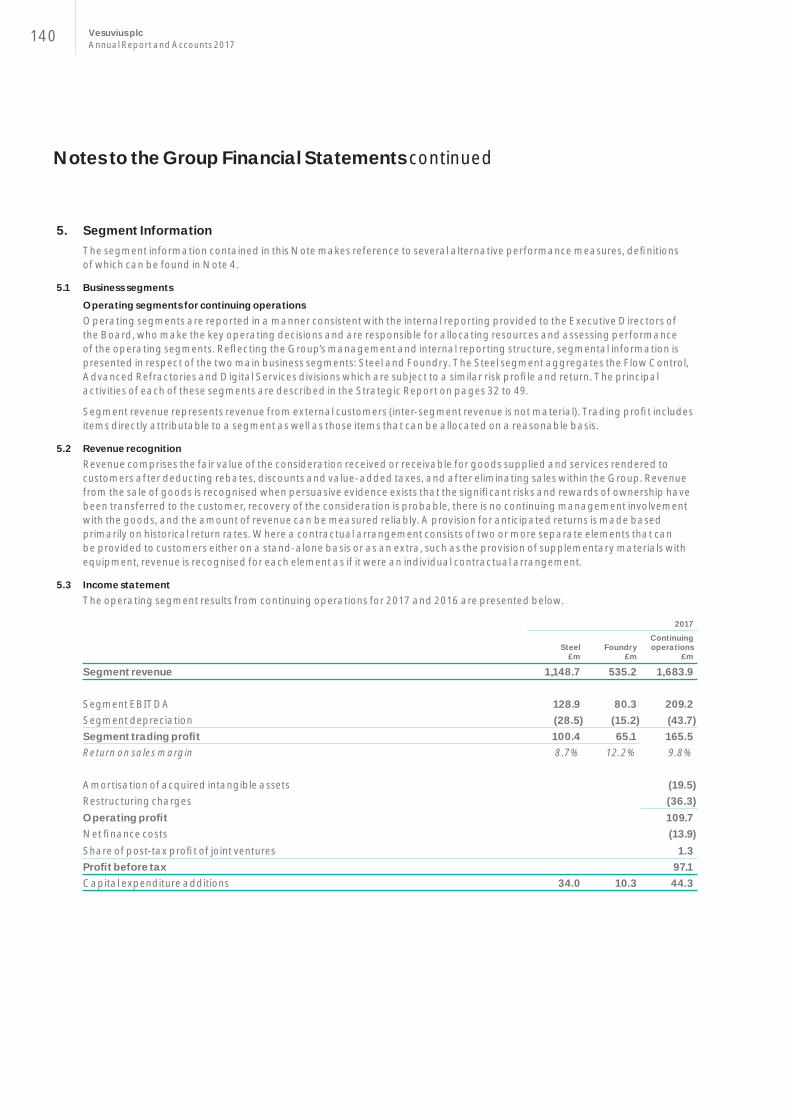
140 Vesuvius plcAnnual Report and Accounts 2017
5. Segment InformationThe segment information contained in this Note makes reference to several alternative performance measures, defi nitions of which can be found in Note 4.
5.1 Business segments
Operating segments for continuing operationsOperating segments are reported in a manner consistent with the internal reporting provided to the Executive Directors of the Board, who make the key operating decisions and are responsible for allocating resources and assessing performance of the operating segments. Refl ecting the Group’s management and internal reporting structure, segmental information is presented in respect of the two main business segments: Steel and Foundry. The Steel segment aggregates the Flow Control, Advanced Refractories and Digital Services divisions which are subject to a similar risk profi le and return. The principal activities of each of these segments are described in the Strategic Report on pages 32 to 49.
Segment revenue represents revenue from external customers (inter-segment revenue is not material). Trading profi t includes items directly attributable to a segment as well as those items that can be allocated on a reasonable basis.
5.2 Revenue recognitionRevenue comprises the fair value of the consideration received or receivable for goods supplied and services rendered to customers after deducting rebates, discounts and value-added taxes, and after eliminating sales within the Group. Revenue from the sale of goods is recognised when persuasive evidence exists that the signifi cant risks and rewards of ownership have been transferred to the customer, recovery of the consideration is probable, there is no continuing management involvement with the goods, and the amount of revenue can be measured reliably. A provision for anticipated returns is made based primarily on historical return rates. Where a contractual arrangement consists of two or more separate elements that can be provided to customers either on a stand-alone basis or as an extra, such as the provision of supplementary materials with equipment, revenue is recognised for each element as if it were an individual contractual arrangement.
5.3 Income statementThe operating segment results from continuing operations for 2017 and 2016 are presented below.
2017
Steel £m
Foundry£m
Continuing operations
£m
Segment revenue 1,148.7 535.2 1,683.9
Segment EBITDA 128.9 80.3 209.2Segment depreciation (28.5) (15.2) (43.7)Segment trading profi t 100.4 65.1 165.5Return on sales margin 8.7% 12.2% 9.8%
Amortisation of acquired intangible assets (19.5)Restructuring charges (36.3)Operating profi t 109.7Net fi nance costs (13.9)Share of post-tax profi t of joint ventures 1.3Profi t before tax 97.1Capital expenditure additions 34.0 10.3 44.3
Notes to the Group Financial Statements continued

141Financial Statem
ents
2016
Steel £m
Foundry£m
Continuing operations
£m
Segment revenue 942.0 459.4 1,401.4
Segment EBITDA 107.0 68.6 175.6Segment depreciation (27.8) (14.5) (42.3) Segment trading profi t 79.2 54.1 133.3Return on sales margin 8.4% 11.8% 9.5%
Amortisation of acquired intangible assets (17.1)Restructuring charges (28.5)Gain on employee benefi t plan 5.2Operating profi t 92.9Net fi nance costs (14.5)Share of post-tax profi t of joint ventures 1.0 Profi t before tax 79.4Capital expenditure additions 23.7 11.5 35.2
5.4 Geographical analysis
External revenue Non-current assets
2017£m
2016£m
2017£m
2016*£m
US 279.4 240.9 288.2 318.5Germany 232.1 192.4 101.0 121.5
India 136.5 119.2 42.7 39.7
China 127.6 113.1 86.9 93.2
Brazil 90.5 70.7 65.1 69.2
UK 64.0 59.4 107.2 119.5France 55.4 48.0 26.1 20.1Spain 49.4 42.5 31.9 27.7Rest of the world 649.0 515.2 355.6 349.0Continuing operations 1,683.9 1,401.4 1,104.7 1,158.4
* Restated as a result of the recording of a provision for which a related asset exists (Note 32).
External revenue disclosed in the table above is based upon the geographical location of the operation. Non-current assets exclude employee benefi ts net surpluses and deferred tax assets. Information relating to the Group’s products and services is given in the Strategic Report on pages 36 to 49. The Group is not dependent upon any single customer for its revenue and no single customer, for either of the years presented in the table above, accounts for more than 10% of the Group’s total external revenue.

142 Vesuvius plcAnnual Report and Accounts 2017
6. Amounts Payable to PricewaterhouseCoopers LLP and their Associates2017
£m2016
£m
Fees payable to the Company’s auditors and their associates for the audit of the parent Company and Consolidated Financial Statements 0.4 0.4Fees payable to the Company’s auditors and their associates for other services:Audit of the Company’s subsidiaries 0.8 1.5Audit-related assurance services 0.1 0.1Tax compliance and advisory — —Total auditors’ remuneration 1.3 2.0
PricewaterhouseCoopers LLP was appointed as the Group’s external auditor for the year ended 31 December 2017, replacing KPMG LLP.
Total auditors’ remuneration of £1.3m in 2017 all related to continuing operations, of which £1.2m related to audit fees and £0.1m of non-audit fees, in respect of the interim review fee (2016: £2.0m, including £1.9m of audit fees and £0.1m of non-audit fees, the latter comprising £0.1m in respect of the interim review fee and £nil for taxation advice).
Mazars LLP was appointed external auditor of the non-material entities within the Group for the year ended 31 December 2017. Total remuneration for the audit of the non-material entities was £0.4m in 2017. This amount is not included in the table above.
It is the Group’s policy not to use the Group’s auditors for non-audit services other than in very limited circumstances and when they are best placed to do so.
7. Restructuring ChargesThe 2017 restructuring charges were £36.3m (2016: £28.5m). The Group-wide restructuring programme initiated in 2015 continued, resulting in charges of £36.3m (2016: £28.5m) refl ecting redundancy costs of £22.8m (2016: £21.4m), plant closure costs of £0.5m (2016: £4.2m), consultancy fees of £6.8m (2016: £2.0m), an inventory/asset write-off of £5.5m (2016: £0.9m) and travel of £0.7m (2016: £nil). Further details of restructuring programmes are provided in the Financial Review.
The net tax credit attributable to the total restructuring charges was £4.3m (2016: £3.8m).
Cash costs of £27.3m (2016: £16.8m) (Note 12) were incurred in the year in respect of the restructuring programme, leaving provisions made but unspent of £22.9m (Note 32) as at 31 December 2017 (2016: £18.5m), of which £2.7m (2016: £2.7m) relates to future costs in respect of leases expiring between one and six years.
8. Employees 8.1 Employee benefi ts expense
2017£m
2016£m
Wages and salaries 344.0 301.6Social security costs 52.2 46.7Redundancy costs 22.8 21.4Other restructuring costs — 0.2Share-based payments (Note 29) 2.6 1.7Pension costs — defi ned contribution pension plans (Note 28) 12.5 10.7 — defi ned benefi t pension plans (Note 28) 7.0 2.1Other post-retirement benefi ts (Note 28) 0.4 0.4Total employee benefi ts expense 441.5 384.8
Of the total employee benefi ts expense of £441.5m (2016: £384.8m), £418.1m (2016: £367.1m) was charged in arriving at trading profi t, £nil (2016: £5.2m) was credited from settlement gains relating to employee benefi t plans, £0.6m (2016: £1.3m) was charged within ordinary net fi nance costs, and £22.8m (2016: £21.6m) was charged to restructuring costs. Within redundancy costs reported in the table above are £nil (2016: £0.3m) of defi ned benefi t pension plan costs and £0.1m (2016: £0.1m) of defi ned contribution pension plan costs.
At constant rates, the total employee benefi ts expense for 2016 was £409.6m.
Notes to the Group Financial Statements continued

143Financial Statem
ents
8.2 Average number of employees
2017no.
2016no.
Steel 7,868 7,725Foundry 3,106 3,101Continuing operations 10,974 10,826Discontinued operations — —Total average number of employees 10,974 10,826
As at 31 December 2017, the Group had 11,010 employees (2016: 10,840).
8.3 Remuneration of key management personnelThe remuneration of the Directors, who are the key management personnel of the Group, is set out below in aggregate for each of the categories specifi ed in IAS 24 Related Party Disclosures. Further information about the remuneration of individual Directors is provided in the audited part of the Directors’ Remuneration Report on pages 106 to 116.
2017£m
2016£m
Short-term employee benefi ts 1.9 1.5Post-employment benefi ts 0.2 0.3Share-based payments 0.7 0.5Total remuneration of key management personnel 2.8 2.3
9. Net Finance Costs9.1 Accounting policy
Borrowing costs that are directly attributable to the acquisition, construction or production of an asset that necessarily takes a substantial period of time to get ready for its intended use or sale are capitalised as part of the cost of that asset. Capitalised borrowing costs for 2017 were £nil (2016: £nil). All other borrowing costs are recognised as an expense in the Group Income Statement using the effective interest rate method.
9.2 Total net fi nance costs
2017£m
2016£m
Interest payable on borrowingsLoans, overdrafts and factoring arrangements 15.9 15.1Obligations under fi nance leases 0.2 0.2Amortisation of capitalised arrangement fees 0.6 0.5Total interest payable on borrowings 16.7 15.8Interest on net retirement benefi t obligations 0.6 1.3Adjustment to discounts on provisions and other liabilities 0.2 (0.2)Adjustment to discounts on receivables (0.1) 0.3Finance income (3.5) (2.7)Total net fi nance costs 13.9 14.5

144 Vesuvius plcAnnual Report and Accounts 2017
10. Income Tax10.1 Accounting policy
Tax expense represents the sum of current tax and deferred tax. Current and deferred tax are recognised in profi t or loss except to the extent that they relate to items charged or credited in the Group Statement of Comprehensive Income or Group Statement of Changes in Equity, in which case the associated tax is also recognised in those statements.
In arriving at its current tax charge, the Group also makes careful assessment of the likely impact of tax law changes. In particular, it has considered the impact of US tax reform enacted in December 2017 in the US Tax Cuts and Jobs Act (‘TCJA’) and other recently announced tax reform, for example in Belgium.
Current taxCurrent tax is based on taxable profi t for the year. Taxable profi t differs from profi t before tax as reported in the Group Income Statement because it excludes items of income or expense that are taxable or deductible in other years and it further excludes items that are never taxable or deductible. The Group’s liability for current tax is calculated using tax rates and laws that have been enacted, or substantively enacted, by the balance sheet date.
A provision is recognised when the Group considers it has a present tax obligation as the result of a past event and it is probable that the Group will be required to settle that obligation. Provisions established for such uncertain tax positions are made using a best estimate of the tax expected to be paid, based on a qualitative and quantitative assessment of all relevant information. Such a provision is typically required where the underlying tax issue is subject to interpretation and remains to be agreed, and therefore is uncertain as to outcome. Principally the uncertain tax positions for which a provision is made relate to the interpretation of tax legislation and guidance regarding transfer pricing arrangements that have been entered into in the normal course of business. In accordance with IAS 12, tax provisions are included as income tax payable on the face of the Group Balance Sheet, and movements in tax provisions are included within income tax charges or credits in the Group Income Statement.
In assessing any appropriate provision requirements for uncertain tax items, the Group considers progress made in discussions with the tax authorities, expert advice on the likely outcome and any recent developments in case law. Due to the uncertainty associated with such tax items, it is possible that at a future date, on conclusion of the open matters, the fi nal outcome may vary signifi cantly. Any such variations will affect the fi nancial results in the year in which such a determination is made.
Deferred taxDeferred tax is recognised on differences between the carrying amounts of assets and liabilities in the fi nancial statements and the corresponding tax bases used in the computation of taxable profi t and is accounted for using the balance sheet liability method. Deferred tax liabilities are generally recognised for all taxable temporary differences and deferred tax assets are recognised to the extent that it is probable that taxable profi ts will be available against which deductible temporary differences can be utilised. Such assets and liabilities are not recognised if the temporary difference arises from the initial recognition of goodwill or from the initial recognition (other than in a business combination) of other assets and liabilities in a transaction that affects neither the taxable profi t nor the accounting profi t. Deferred tax is calculated at the tax rates that are expected to apply in the period when the liability is settled or the asset is realised, based on tax rates and laws that have been enacted, or substantively enacted, by the balance sheet date.
Deferred tax liabilities are recognised for taxable temporary differences arising on investments in subsidiaries and interests in joint ventures, except where the Group is able to control the reversal of the temporary difference and it is probable that the temporary difference will not reverse in the foreseeable future. The carrying amount of deferred tax assets is reviewed at each balance sheet date and reduced to the extent that it is no longer probable that suffi cient taxable profi ts will be available to allow all or part of the asset to be recovered. Deferred tax assets and liabilities are offset when there is a legally enforceable right to set off current tax assets against current tax liabilities and when they relate to income taxes levied by the same taxation authority and the Group intends to settle its current tax assets and liabilities on a net basis.
Change in accounting policyPreviously, the common understanding and interpretation of IAS 12 allowed a company to include in its tax charges, liabilities and provisions any associated delayed settlement interest and penalties. Vesuvius followed this approach. The recent clarifi cation by the IFRS Interpretations Committee (previously the International Financial Reporting Interpretations Committee, IFRIC), however, is that a company should include in its tax charges, liabilities and provisions only items meeting the strict defi nition of taxes under IAS 12. It confi rmed that items not meeting that defi nition should be reported in accordance with IAS 37.
Notes to the Group Financial Statements continued

145Financial Statem
ents
Vesuvius has accordingly changed its accounting policy to include interest and penalties on tax in trade and other payables in accordance with IAS 37. This has resulted in a change to its Group Balance Sheet as at 31 December 2016 to reclassify £7.0m from its liabilities and provisions previously reported as tax to trade and other payables. The effect of this change on its 2016 performance statements is immaterial and no restatement is therefore required to be made.
10.2 Income tax charge
2017£m
2016£m
Current taxOverseas taxation 37.1 38.3Adjustments in respect of prior years (1.7) (2.9)Total current tax, continuing operations 35.4 35.4
Deferred taxOrigination and reversal of temporary taxable differences 19.0 (9.0)Adjustments in respect of prior years — —Total deferred tax, continuing operations 19.0 (9.0)Total income tax charge 54.4 26.4Total income tax charge attributable to:Continuing operations — headline performance 36.4 31.4 — separately reported 18.0 (5.0)Total income tax charge 54.4 26.4
Included in the Group’s total income tax charge are charges and credits meeting the criteria set out in Note 2.5, to be treated as separately reported items, as analysed in the following table:
Separately reported items2017
£m2016
£m
Impact of US tax reform 24.5 —Other utilisation of previously recognised US deferred tax asset 4.2 6.2Additional recognition of US deferred tax asset (0.4) (4.1)Net movement in US deferred tax asset 28.3 2.1Restructuring charges (4.3) (3.8)Gain on employee benefi t plan — 0.4Amortisation and utilisation of acquired intangibles (6.0) (3.7)Total tax charge/(credit) separately reported 18.0 (5.0)
The US Tax Cuts and Jobs Act (‘TCJA’) enacted in the US in December 2017 has had a material impact on the value of the deferred tax asset the Group recognises in the US. It has reduced the asset by $33.1m (£25.7m), of which $31.5m (£24.5m) is charged to the Group Income Statement and $1.6m (£1.2m) is charged to the Group Statement of Comprehensive Income, as it relates to the effect of the change in the US Federal rate of tax on the value of the deferred tax asset on pension defi cits recognised in that statement.
The reduction was principally due to the change in Federal tax rate from 35% to 21%, the deemed repatriation tolling charge and the impact of other changes when measuring the value of the asset which is recognised in the Group Balance Sheet. However, no current tax liability has resulted from these provisions in 2017, due to the availability of tax losses and foreign tax credits to offset the resultant additional taxable income. The impact of US tax reform, together with normal changes to the US deferred tax asset, resulted in the asset reducing from $81.3m (£65.9m) at the end of 2016 to $44.0m (£32.6m) at the end of 2017.
In 2017, Belgium reduced its tax rate to 29% in 2018 and 25% in 2020. This has had the impact of reducing the deferred tax asset in Belgium by £1.4m in 2017 (2016: £nil). This impact is included in the total deferred tax charge on continuing operations.
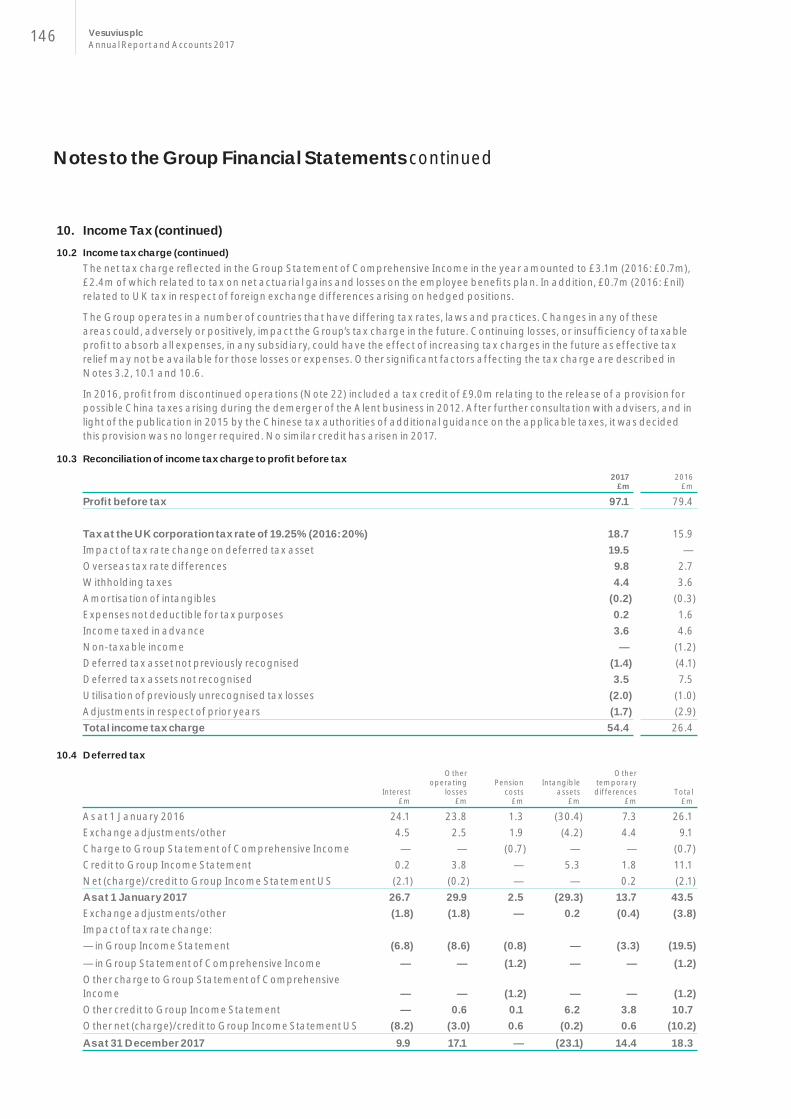
146 Vesuvius plcAnnual Report and Accounts 2017
10. Income Tax (continued)10.2 Income tax charge (continued)
The net tax charge refl ected in the Group Statement of Comprehensive Income in the year amounted to £3.1m (2016: £0.7m), £2.4m of which related to tax on net actuarial gains and losses on the employee benefi ts plan. In addition, £0.7m (2016: £nil)related to UK tax in respect of foreign exchange differences arising on hedged positions.
The Group operates in a number of countries that have differing tax rates, laws and practices. Changes in any of these areas could, adversely or positively, impact the Group’s tax charge in the future. Continuing losses, or insuffi ciency of taxable profi t to absorb all expenses, in any subsidiary, could have the effect of increasing tax charges in the future as effective tax relief may not be available for those losses or expenses. Other signifi cant factors affecting the tax charge are described in Notes 3.2, 10.1 and 10.6.
In 2016, profi t from discontinued operations (Note 22) included a tax credit of £9.0m relating to the release of a provision for possible China taxes arising during the demerger of the Alent business in 2012. After further consultation with advisers, and in light of the publication in 2015 by the Chinese tax authorities of additional guidance on the applicable taxes, it was decided this provision was no longer required. No similar credit has arisen in 2017.
10.3 Reconciliation of income tax charge to profi t before tax
2017£m
2016£m
Profi t before tax 97.1 79.4
Tax at the UK corporation tax rate of 19.25% (2016: 20%) 18.7 15.9Impact of tax rate change on deferred tax asset 19.5 —Overseas tax rate differences 9.8 2.7Withholding taxes 4.4 3.6Amortisation of intangibles (0.2) (0.3)Expenses not deductible for tax purposes 0.2 1.6Income taxed in advance 3.6 4.6Non-taxable income — (1.2)Deferred tax asset not previously recognised (1.4) (4.1)Deferred tax assets not recognised 3.5 7.5Utilisation of previously unrecognised tax losses (2.0) (1.0)Adjustments in respect of prior years (1.7) (2.9)Total income tax charge 54.4 26.4
10.4 Deferred tax
Interest£m
Other operating
losses£m
Pension costs
£m
Intangible assets
£m
Other temporary
differences£m
Total£m
As at 1 January 2016 24.1 23.8 1.3 (30.4) 7.3 26.1Exchange adjustments/other 4.5 2.5 1.9 (4.2) 4.4 9.1Charge to Group Statement of Comprehensive Income — — (0.7) — — (0.7)Credit to Group Income Statement 0.2 3.8 — 5.3 1.8 11.1Net (charge)/credit to Group Income Statement US (2.1) (0.2) — — 0.2 (2.1)As at 1 January 2017 26.7 29.9 2.5 (29.3) 13.7 43.5Exchange adjustments/other (1.8) (1.8) — 0.2 (0.4) (3.8)Impact of tax rate change: — in Group Income Statement (6.8) (8.6) (0.8) — (3.3) (19.5)— in Group Statement of Comprehensive Income — — (1.2) — — (1.2)Other charge to Group Statement of Comprehensive Income — — (1.2) — — (1.2)Other credit to Group Income Statement — 0.6 0.1 6.2 3.8 10.7Other net (charge)/credit to Group Income Statement US (8.2) (3.0) 0.6 (0.2) 0.6 (10.2)As at 31 December 2017 9.9 17.1 — (23.1) 14.4 18.3
Notes to the Group Financial Statements continued

147Financial Statem
ents
2017£m
2016£m
Recognised in the Group Balance Sheet as:Non-current deferred tax assets 61.0 92.1Non-current deferred tax liabilities (42.7) (48.6)Net total deferred tax assets 18.3 43.5
Included in these deferred tax assets and liabilities are amounts to be expected to be utilised in 2018 as follows:
2017£m
2016£m
Deferred tax assets 11.3 16.9Deferred tax liabilities (7.6) (6.7)
As discussed in Note 10.2, US tax reform enacted in TCJA has had a major impact on the Group’s US deferred tax position. Note 3.2 outlines the principal judgements and estimates taken in determining the impact of that reform on the valuation of this asset.
Included in non-current deferred tax assets is £32.6m (2016: £65.9m) in respect of the partial recognition of temporary differences arising in the US computed in accordance with the policy set out in Note 10.1 above. The Group remains confi dent of the recovery of this asset. £69.2m (2016: £100.4m) remains unrecognised.
In view of its material size and nature, any tax credit refl ected in the Group Income Statement arising from the recognition of this asset is presented separately from the tax charge on headline performance, in accordance with the principles outlined in Note 2.5. Subsequent increase, decrease and utilisation of the resultant deferred tax asset would similarly be expected to be presented in this manner, as the Directors consider that the separate identifi cation of deferred tax for material temporary differences would assist both in a better understanding of the fi nancial performance achieved, and in making projections of future results of the Group.
Tax loss carry-forwards and other temporary differences with a tax value of £1m (2016: £1.4m) were recognised by subsidiaries reporting a loss. On the basis of approved business plans of these subsidiaries, the Directors consider it probable that the tax loss carry-forwards and temporary differences can be offset against future taxable profi ts.
The total deferred tax assets not recognised as at 31 December 2017 were £219.9m (2016: £263.1m), as analysed below. In accordance with the accounting policy in Note 10.1, these items have not been recognised as deferred tax assets on the basis that their future economic benefi t is not probable. In total, there was a decrease of £43.2m (2016: £6.4m increase) in net unrecognised deferred tax assets during the year, principally due to the impact of the change in the US Federal tax rate from 35% to 21%, enacted in TCJA.
2017£m
2016£m
Operating losses (further described below) 102.3 118.6Unrelieved US interest (may be carried forward indefi nitely) 43.2 66.6Capital losses available to offset future UK capital gains (may be carried forward indefi nitely) 28.1 28.0UK ACT credits (may be carried forward indefi nitely) 13.1 13.1US tax credits 16.7 9.1Other temporary differences 16.5 27.7Total deferred tax assets not recognised 219.9 263.1
£5.5m relating to US tax credits has been reclassifi ed from other temporary differences to US tax credits in the 2016 comparative.
The Group has signifi cant net operating losses with a tax value of £119.4m (2016: £148.5m), only £17.1m (2016: £29.9m) of which meet the criteria set out in Note 10.1 to be recognised on the Group Balance Sheet.
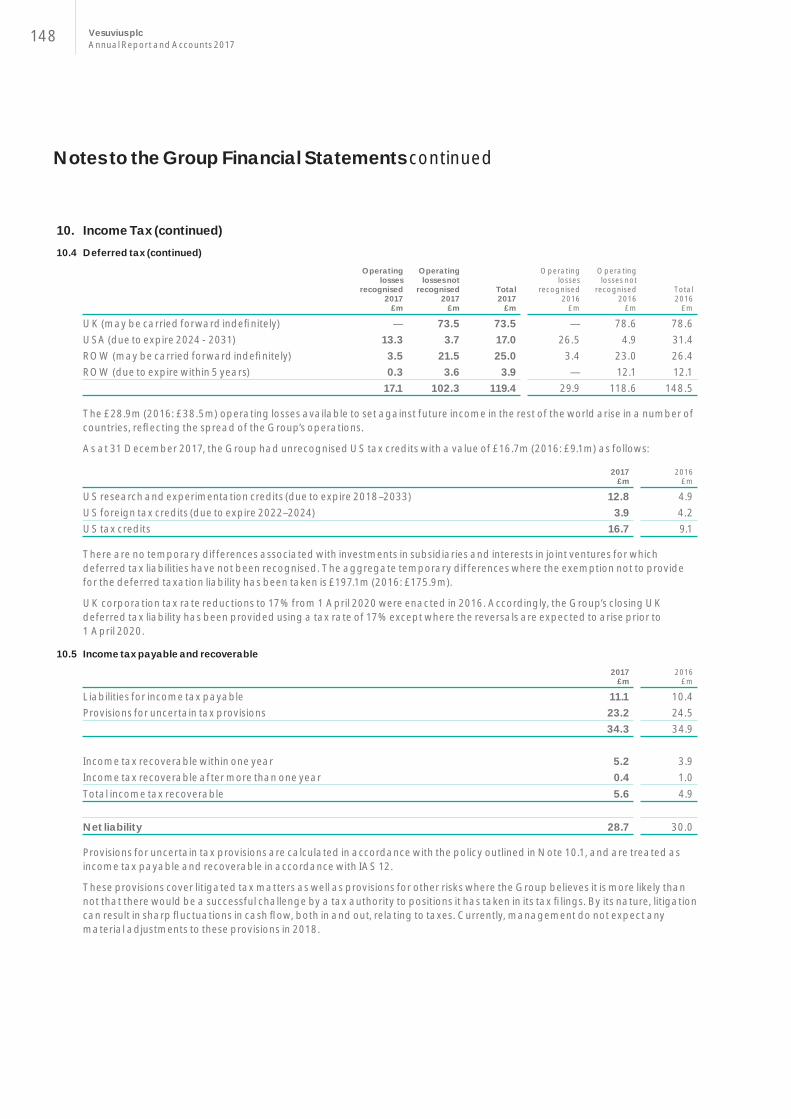
148 Vesuvius plcAnnual Report and Accounts 2017
10. Income Tax (continued)10.4 Deferred tax (continued)
Operating losses
recognised2017
£m
Operating losses not
recognised2017
£m
Total2017
£m
Operating losses
recognised2016
£m
Operating losses not
recognised2016
£m
Total2016
£m
UK (may be carried forward indefi nitely) — 73.5 73.5 — 78.6 78.6USA (due to expire 2024 - 2031) 13.3 3.7 17.0 26.5 4.9 31.4ROW (may be carried forward indefi nitely) 3.5 21.5 25.0 3.4 23.0 26.4ROW (due to expire within 5 years) 0.3 3.6 3.9 — 12.1 12.1
17.1 102.3 119.4 29.9 118.6 148.5
The £28.9m (2016: £38.5m) operating losses available to set against future income in the rest of the world arise in a number of countries, refl ecting the spread of the Group’s operations.
As at 31 December 2017, the Group had unrecognised US tax credits with a value of £16.7m (2016: £9.1m) as follows:
2017£m
2016£m
US research and experimentation credits (due to expire 2018–2033) 12.8 4.9US foreign tax credits (due to expire 2022–2024) 3.9 4.2US tax credits 16.7 9.1
There are no temporary differences associated with investments in subsidiaries and interests in joint ventures for which deferred tax liabilities have not been recognised. The aggregate temporary differences where the exemption not to provide for the deferred taxation liability has been taken is £197.1m (2016: £175.9m).
UK corporation tax rate reductions to 17% from 1 April 2020 were enacted in 2016. Accordingly, the Group’s closing UK deferred tax liability has been provided using a tax rate of 17% except where the reversals are expected to arise prior to 1 April 2020.
10.5 Income tax payable and recoverable
2017£m
2016£m
Liabilities for income tax payable 11.1 10.4Provisions for uncertain tax provisions 23.2 24.5
34.3 34.9
Income tax recoverable within one year 5.2 3.9Income tax recoverable after more than one year 0.4 1.0Total income tax recoverable 5.6 4.9
Net liability 28.7 30.0
Provisions for uncertain tax provisions are calculated in accordance with the policy outlined in Note 10.1, and are treated as income tax payable and recoverable in accordance with IAS 12.
These provisions cover litigated tax matters as well as provisions for other risks where the Group believes it is more likely than not that there would be a successful challenge by a tax authority to positions it has taken in its tax fi lings. By its nature, litigation can result in sharp fl uctuations in cash fl ow, both in and out, relating to taxes. Currently, management do not expect any material adjustments to these provisions in 2018.
Notes to the Group Financial Statements continued

149Financial Statem
ents
10.6 Key factors impacting the sustainability of the effective tax rate are as follows:
Material changes in the geographic mix of profi tsThe Group’s effective tax rate is sensitive to changes in the geographic mix of profi ts and level of profi ts, and refl ects a combination of higher rates in certain jurisdictions such as India, Mexico, Germany and Belgium, nil effective tax rates in the UK and the US due to the availability of unutilised tax losses, and rates that lie somewhere in between.
Changes in tax rates, tax reform and its interpretationChanges in tax rates and laws in the jurisdictions in which the Group operates could have a material effect on the Group’s effective tax rate. As stated in Note 10.1, the Group has taken into account the impact of US and other tax reform enacted in 2017.
One of the new taxes introduced by the US Tax Cuts and Jobs Act (‘TCJA’) in the US in December 2017 is the Base Erosion and Anti-Abuse Tax (‘BEAT’) (see also Note 3.2(b)). This is intended to counter what US tax authorities regard as erosion of the US tax base of a US company caused by payments, other than for cost of goods sold, to its to non-US affi liates. In its broadest sense, this would establish a base tax of 10% of a US company’s normal taxable income as grossed up by such payments. The rate of tax applied is 5% in 2018, increasing to 10% from 2019. Whilst this does not impact Vesuvius in 2017, it is currently estimated to result in a US cash tax cost from 2018 onwards and thus increase the Group’s effective rate of tax on Headline performance (before its share of joint venture income) going forward by 0.7% in 2018, and 1.2% in 2019. The Group’s effective tax rate for 2018 onwards is expected to be between 27% and 28%, including the expected adverse impact of US tax reform, refl ecting the benefi t of initiatives being taken.
TCJA is a major new piece of legislation, introduced very rapidly, consequently there is still much uncertainty about how some of the key provisions will operate. The international provisions in particular are extremely complex and, with little issued guidance from the US Treasury, are not yet fully understood by the business or adviser community. Vesuvius has taken advice on how TCJA is likely to impact on its tax position, but it is to be expected that, as guidance and interpretation clarifi es these new laws, then further changes to its tax charges and balances may need to be made.
Availability of tax advantaged ratesVesuvius in China qualifi es for a tax advantaged rate of 15% (rather than the headline rate of 25%), on part of its profi ts due to the high-technology nature of its business. Eligibility for this rate is reviewed on a regular basis by the Chinese tax authority, and was worth approximately £0.9m in 2017 (2016: £1.0m). Without that benefi t, the Group’s effective tax rate on headline performance would have been 0.6% higher in 2017 (2016: 0.8%).
Resolution of tax judgementsAt any one time, the Group can be subject to a number of challenges by tax authorities in the jurisdictions in which it operates. The outcome of these challenges is inherently uncertain, potentially resulting in a different tax charge from the amounts initially provided.
Recognition of tax benefi ts arising from brought forward losses and other temporary differences in the USIn accordance with the criteria set out in Note 10.1, movements in Vesuvius’ US deferred tax asset are recognised as separately reported items. Consequently, such movements have no impact on the Group’s effective tax rate on headline performance. Should, however, the 2017 profi ts earned in the US have been fully subject to US Federal and State taxes, then the Group’s effective tax rate on headline performance (excluding the Group’s share of post-tax profi t of joint ventures) would have been approximately 4.2% higher (2016: 3.4% higher).
Impact of Brexit on Vesuvius’ tax position How Brexit impacts on Vesuvius will depend on the terms of Brexit, which are as yet unclear and therefore it is not possible at this stage to provide precise guidance on how it will impact on the Group. If the EU Parent Subsidiary and Interest and Royalty directives were no longer to apply to dividend, interest and other payments to Vesuvius in the UK, additional withholding taxes would become payable subject to reliefs available under applicable tax treaties.

150 Vesuvius plcAnnual Report and Accounts 2017
11. Earnings per Share (EPS)11.1 Earnings for EPS
Basic and diluted EPS from continuing operations are based upon the profi t attributable to owners of the parent, as reported in the Group Income Statement, of £36.3m (2016: £46.7m), being the profi t for the year of £42.7m (2016: £53.0m) less non-controlling interests of £6.4m (2016: £6.3m); basic and diluted EPS from total operations are based on the profi t attributable to owners of the parent of £38.0m (2016: £56.9m); headline and diluted headline EPS are based upon headline profi t from continuing operations attributable to owners of the parent of £110.1m (2016: £82.1m). The table below reconciles these different profi t measures.
Continuing operations
£m
Discontinued operations
£m
2017total
£m
Continuing operations
£m
Discontinued operations
£m
2016total
£m
Profi t attributable to owners of the parent 36.3 1.7 38.0 46.7 10.2 56.9Adjustments for separately reported items:Amortisation of acquired intangible assets 19.5 17.1Restructuring charges 36.3 28.5Gain on employee benefi t plan — (5.2)Income tax charge / (credit) 18.0 (5.0)Headline profi t attributable to owners of the parent 110.1 82.1
11.2 Weighted average number of shares
2017millions
2016millions
For calculating basic and headline EPS 270.3 269.9Adjustment for potentially dilutive ordinary shares 1.3 0.8For calculating diluted and diluted headline EPS 271.6 270.7
For the purposes of calculating diluted and diluted headline EPS, the weighted average number of ordinary shares is adjusted to include the weighted average number of ordinary shares that would be issued on the conversion of all potentially dilutive ordinary shares expected to vest, relating to the Company’s share-based payment plans. Potential ordinary shares are only treated as dilutive when their conversion to ordinary shares would decrease EPS, or increase loss per share.
11.3 Per share amounts
Continuing operations
pence
Discontinued operations
pence
2017total
pence
Continuing operations
pence
Discontinued operations
pence
2016total
pence
Earnings per share — basic 13.4 0.7 14.1 17.3 3.8 21.1 — headline 40.7 30.4
— diluted 13.4 0.6 14.0 17.3 3.7 21.0 — diluted headline 40.5 30.3
Notes to the Group Financial Statements continued

151Financial Statem
ents
12. Cash Generated from OperationsContinuingoperations
£m
Discontinued operations
£m
2017total
£m
Continuingoperations
£m
Discontinued operations
£m
2016total
£m
Operating profi t 109.7 1.7 111.4 92.9 1.2 94.1Adjustments for:Amortisation of acquired intangible assets (Note 16) 19.5 — 19.5 17.1 — 17.1Restructuring charges 36.3 — 36.3 28.5 — 28.5Gains relating to employee benefi t plans — — — (5.2) — (5.2)Depreciation 43.7 — 43.7 42.3 — 42.3EBITDA (Note 4.12) 209.2 1.7 210.9 175.6 1.2 176.8Net increase in inventories (19.4) — (19.4) (8.9) — (8.9)Net increase in trade receivables (36.9) — (36.9) (18.6) — (18.6)Net increase in trade payables 44.1 — 44.1 14.5 — 14.5Net decrease/(increase) in other working capital 11.7 (2.5) 9.2 (7.9) (1.2) (9.1)Outfl ow related to restructuring charges (27.3) — (27.3) (16.8) — (16.8)Net retirement benefi t obligations (4.8) — (4.8) (7.7) — (7.7)Cash generated from operations 176.6 (0.8) 175.8 130.2 — 130.2
13. Cash and Cash Equivalents2017
£m2016
£m
Cash at bank and in hand 161.9 144.4Cash and short-term deposits 161.9 144.4Bank overdrafts (21.9) (43.4)Cash and cash equivalents in the Group Statement of Cash Flows 140.0 101.0
Bank overdrafts that are repayable on demand and form an integral part of the Group’s cash management are included as a component of cash and cash equivalents for the purpose of the Group Statement of Cash Flows.
14. Reconciliation of Movement in Net Debt
Balance as at 1 Jan 2017
£m
Foreignexchange
adjustments£m
Borrowing facility costs
capitalised£m
Non-cash movements
£mCash fl ow
£m
Balance as at 31 Dec 2017
£m
Cash and cash equivalentsCash at bank and in hand 144.4 (4.5) — — 22.0 161.9Bank overdrafts (43.4) 1.7 — — 19.8 (21.9)
101.0 (2.8) — — 41.8 140.0Borrowings, excluding bank overdraftsCurrent (91.1) 4.1 — — 82.7 (4.3)Non-current (331.9) 12.8 — — (93.0) (412.1)
(423.0) 16.9 — — (10.3) (416.4)Capitalised arrangement fees 1.7 — 1.0 (0.6) — 2.1Net debt (320.3) 14.1 1.0 (0.6) 31.5 (274.3)
Net debt is a measure of the Group’s net indebtedness to banks and other external fi nancial institutions and comprises the total of cash and short-term deposits and current and non-current interest-bearing borrowings.
15. Property, Plant and Equipment15.1 Accounting policy
Freehold land and construction in progress are carried at cost less accumulated impairment losses. Other items of property, plant and equipment are carried at cost less accumulated depreciation and accumulated impairment losses. Costs are capitalised only when it is probable that they will result in future economic benefi ts fl owing to the Group and when they can be measured reliably. Costs are capitalised to construction in progress where an asset is being developed. This is then transferred and depreciated when the asset is ready for use. All other repairs and maintenance expenditures are charged to the Group Income Statement in the period in which they are incurred.

152 Vesuvius plcAnnual Report and Accounts 2017
Notes to the Group Financial Statements continued
15. Property, Plant and Equipment (continued)15.1 Accounting policy (continued)
Freehold land is not depreciated, as it has an infi nite life. Depreciation on other items of property, plant and equipment begins when the asset is available for use and is charged to the Group Income Statement on a straight-line basis so as to write off the cost less residual value of the asset over its estimated useful life as follows:
Asset category Estimated useful lifeFreehold property between ten and 50 yearsLeasehold property the term of the leasePlant and equipment — motor vehicles and information technology equipment between one and fi ve years — other between three and 15 years
The depreciation method used, residual values and estimated useful lives are reviewed annually and changed, if appropriate. As described in Note 17.1, an asset’s carrying amount is immediately written down to its recoverable amount if its carrying amount is greater than its estimated recoverable amount. Gains and losses arising on disposals are determined by comparing sales proceeds with carrying amount and are recognised in the Group Income Statement.
15.2 Movement in net book valueFreehold property
£m
Leasehold property
£m
Plant and equipment
£m
Construction in progress
£mTotal
£m
CostAs at 1 January 2016 169.7 2.3 477.2 28.8 678.0Exchange adjustments 29.9 0.1 84.8 6.0 120.8Capital expenditure additions 1.3 — 18.3 15.6 35.2Acquisitions through business combinations — — 1.1 — 1.1Disposals (1.6) — (41.9) (0.2) (43.7)Reclassifi cations 4.0 — 10.5 (14.5) —As at 1 January 2017 203.3 2.4 550.0 35.7 791.4Exchange adjustments (3.4) (0.1) (10.3) (2.1) (15.9)Capital expenditure additions 1.4 — 19.4 23.5 44.3Disposals (5.1) — (13.5) — (18.6)Reclassifi cations 5.5 — 9.8 (15.3) —As at 31 December 2017 201.7 2.3 555.4 41.8 801.2
Accumulated depreciation and impairment lossesAs at 1 January 2016 64.7 1.4 326.6 — 392.7Exchange adjustments 11.9 — 59.5 — 71.4Depreciation charge 5.9 0.2 36.2 — 42.3Impairment charge 0.4 — — — 0.4Disposals (1.2) — (37.8) — (39.0)Reclassifi cations 1.2 — (1.2) — —As at 1 January 2017 82.9 1.6 383.3 — 467.8Exchange adjustments (2.0) (0.1) (7.7) — (9.8)Depreciation charge 6.1 0.3 37.3 — 43.7Disposals (1.8) — (10.0) — (11.8)Reclassifi cations 0.3 — (0.3) — —As at 31 December 2017 85.5 1.8 402.6 — 489.9
Net book value as at 31 December 2017 116.2 0.5 152.8 41.8 311.3
Net book value as at 31 December 2016 120.4 0.8 166.7 35.7 323.6
Net book value as at 1 January 2016 105.0 0.9 150.6 28.8 285.3

153Financial Statem
ents
The net book value of the Group’s property, plant and equipment assets held under fi nance lease contracts was £4.6m (2016: £4.7m). Capital expenditure on customer-installation assets was £10.7m (2016: £6.5m).
16. Intangible AssetsIntangible assets comprise goodwill and other intangible assets that have been acquired through business combinations.
16.1 Accounting policy
(a) GoodwillGoodwill arising in a business combination is initially recognised as an asset at cost, measured as the excess of the aggregate of the acquisition-date fair value of the consideration transferred and the amount of any non-controlling interest acquired over the net of the acquisition-date fair value amounts of the identifi able assets acquired and liabilities assumed. When the excess is negative, a bargain purchase gain is recognised immediately in profi t or loss. Goodwill is subsequently measured at cost less accumulated impairment losses, with impairment testing carried out annually, or more frequently when there is an indication that the cash-generating unit to which the goodwill has been allocated may be impaired. On disposal of a business, the attributable amount of goodwill is included in the calculation of the profi t or loss on disposal.
(b) Other intangible assetsIntangible assets other than goodwill are recognised on business combinations if they are separable, or if they arise from contractual or other legal rights, and their value can be measured reliably. They are initially measured at cost, which is equal to the acquisition-date fair value, and subsequently measured at cost less accumulated amortisation charges and accumulated impairment losses. Other intangible assets are subject to impairment testing when there is an indication that an impairment loss may have been incurred and are amortised over their estimated useful lives.
(c) Research and development costsThe Group’s research activity involves long-range, ‘blue sky’ investigation, the fi ndings from which may be used in the future to develop new or substantially improved products. Expenditure on research activities is recognised in the Group Income Statement as an expense in the year in which it is incurred.
Development is the application of research fi ndings for the production of new or substantially improved products, processes and services before the start of commercial production. Development expenditure is capitalised only if the expenditure can be measured reliably, the product or process is technically and commercially feasible, future economic benefi ts are probable and the Group intends to and has suffi cient resources to complete development and to use or sell the asset. Otherwise, it is recognised in the Group Income Statement as an expense in the year in which it is incurred. Capitalised development expenditure, where there is any, is stated at cost less accumulated amortisation and impairment losses.
In determining whether development expenditure is capitalised as an intangible asset, management considers whether the strict intangible asset recognition criteria set out in IAS 38, Intangible Assets, have been met at the time the expenditure is incurred. In making this determination, management recognise that a signifi cant amount of the development expenditure undertaken by the Group is focused on dealing with local customer technical support issues and incremental developments to existing products as opposed to new or substantially improved products, and that at the time the feasibility of the project is determined a signifi cant proportion of the development expenditure for that project has already been incurred. In 2017 no projects met the criteria for IAS 38 capitalisation.
16.2 Movement in net book value
Goodwill£m
Other intangible
assets£m
2017total
£mGoodwill
£m
Other intangible
assets£m
2016total
£m
CostAs at 1 January 662.2 271.9 934.1 562.1 250.7 812.8Exchange adjustments (19.3) (0.7) (20.0) 97.0 17.4 114.4Business combinations (Note 21) 0.3 — 0.3 3.1 3.8 6.9As at 31 December 643.2 271.2 914.4 662.2 271.9 934.1Accumulated amortisation and impairment lossesAs at 1 January — 152.2 152.2 — 128.2 128.2Exchange adjustments — (0.3) (0.3) — 6.9 6.9Amortisation charge for the year — 19.5 19.5 — 17.1 17.1As at 31 December — 171.4 171.4 — 152.2 152.2
Net book value as at 31 December 643.2 99.8 743.0 662.2 119.7 781.9

154 Vesuvius plcAnnual Report and Accounts 2017
16. Intangible Assets (continued)16.3 Analysis of goodwill by cash-generating unit (CGU)
Goodwill acquired in a business combination is allocated to each of the Group’s CGUs expected to benefi t from the synergies of the combination. For the purposes of impairment testing, the Directors consider that the Group has two CGUs: the Steel division and the Foundry division. These CGUs represent the lowest level within the Group at which goodwill is monitored.
2017£m
2016£m
Steel 426.3 438.7Foundry 216.9 223.5Total goodwill 643.2 662.2
16.4 Analysis of other intangible assetsOther intangible assets are amortised on a straight-line basis over their estimated useful lives. The assets acquired and their remaining useful lives are shown below.
Remaining useful life
years
Net book value as at
31 Dec 2017£m
Foseco — customer relationships (useful life: 20 years) 10.3 58.9— trade name (useful life: 20 years) 10.3 37.1— intellectual property rights (useful life: ten years) 0.3 2.0Mould and tundish business of Carboox — customer relationships (useful life: 20 years) 18.9 1.7— trade name (useful life: two years) 0.9 0.1Total 99.8
17. Impairment of Tangible and Intangible Assets17.1 Accounting policy
The Directors regularly review the performance of the business and the external business environment to determine whether there is any indication that the Group’s tangible and intangible assets have suffered an impairment loss. If such indication exists, the higher of the value in use and the fair value less costs to sell of the asset is estimated and compared with the carrying value in order to determine the extent, if any, of the impairment loss. Where it is not feasible to estimate the recoverable amount of an individual asset, the Directors estimate the recoverable amount of the CGU to which the asset belongs. In addition, goodwill is tested for impairment on an annual basis. Goodwill acquired in a business combination is allocated to each of the Group’s CGUs expected to benefi t from the synergies of the combination and the Directors carry out annual impairment testing of the carrying value of each CGU, to assess the need for any impairment of the carrying value of the associated goodwill and other intangible and tangible assets.
For the purpose of impairment testing, the recoverable amount of an asset or CGU is the higher of (i) its fair value less costs to sell and (ii) its value in use. If the recoverable amount of a CGU is less than its carrying amount, the resulting impairment loss is allocated fi rst to reduce the carrying amount of any goodwill allocated to the CGU and then to the other assets of the CGU pro rata on the basis of the carrying amount of each asset in the CGU. An impairment loss recognised for goodwill is not reversed in a subsequent period. An impairment loss recognised in a prior year for an asset other than goodwill may be reversed where there has been a change in the estimates used to measure the asset’s recoverable amount since the impairment loss was recognised.
17.2 Key assumptionsThe key assumptions used in determining value in use are projected cash fl ows, growth rates and discount rates. Projected cash fl ow assumptions are based on historical fi nancial information, adjusted to factor in the anticipated impact of restructuring and rationalisation plans already announced at the balance sheet date.
Notes to the Group Financial Statements continued

155Financial Statem
ents
The value in use calculations of the Group’s CGUs are based on three-year business plans and a terminal growth rate of 2.5% (2016: 2.5%). The cash fl ows are discounted to their current value using pre-tax discount rates, which represent each CGU’s weighted average cost of capital (WACC). Growth rates are determined with reference to: current market conditions; external forecasts and historical trends for the Group’s key end-markets of Steel and Foundry; and expected growth in output within the industries in which each major Group business unit operates. A perpetuity growth rate of 2.5% (2016: 2.5%) has been applied. The pre-tax discount rate is the WACC calculated for each CGU as at 31 December 2017 based on industry-specifi c beta coeffi cients for the industries in which the CGUs operate, risk-free rates, and equity risk premiums related to the major countries in which the CGUs are located, selecting countries which contribute at least 80% of total CGU revenue. The pre-tax discount rate used for the Steel CGU was 11.0% (2016: 10.9%) and for the Foundry CGU was 11.6% (2016: 13.2%). The decrease in Foundry’s pre-tax discount rate is driven by improved global economic performance which results in reduced market risk, and consequently, lower equity risk premiums; and the Foundry industry has performed well with limited volatility resulting in a reduced beta. In the Steel CGU, the impact of this decrease in equity risk premiums has been more than offset by increasing contributions from emerging markets, providing upward pressure on risk-free rates and equity risk premiums.
A sensitivity analysis undertaken in respect of the 2017 impairment testing, assuming a 1.0% increase in each of the CGU discount rates and a 1.0% perpetuity growth rate, still resulted in headroom remaining in which the recoverable amount of each CGU exceeded its carrying value. A pre-tax discount rate of 16.0% would result in an impairment of Steel intangible assets and 22.7% for Foundry.
17.3 Goodwill impairmentThe Directors use their judgement to determine the extent to which goodwill and other capitalised intangible assets have a value that will benefi t the performance of the Group over future periods. To assist in making this judgement, the Directors undertake an assessment, at least annually, of the carrying value of the Group’s capitalised goodwill and other intangible assets. The projection period is, in the opinion of the Directors, an appropriate period over which to view the future results of the Group’s businesses for this purpose. Changes to the assumptions used in making these forecasts could signifi cantly alter the Directors’ assessment of the carrying value of goodwill and other intangible assets.
In assessing goodwill for impairment, management performed its annual test at 31 October 2017 which is consistent with the prior year. The Directors made use of detailed calculations of the recoverable amount of the Group’s CGUs as at 31 October 2017. Those calculations resulted in recoverable amounts signifi cantly higher than the carrying values of the Group’s CGUs and consequently no impairment charges were recognised. A further assessment for triggers of goodwill impairment was made at the year end and the calculations were also checked against the carrying values of the Group’s CGUs as at 31 December 2017. No impairment triggers were identifi ed.
18. Trade and Other Receivables18.1 Accounting policy
Trade and other receivables are initially recognised at fair value and subsequently measured at amortised cost, using the effective interest method, less impairment losses.
18.2 Analysis of trade and other receivables
2017 2016*
Gross£m
Impairment£m
Net£m
Gross£m
Impairment£m
Net£m
Trade receivables — current 269.0 (0.7) 268.3 236.7 (1.1) 235.6 — 1 to 30 days past due 59.0 (0.8) 58.2 51.3 (0.5) 50.8 — 31 to 60 days past due 18.4 (0.3) 18.1 19.3 (0.2) 19.1 — 61 to 90 days past due 8.2 (0.5) 7.7 9.5 (0.2) 9.3 — over 90 days past due 43.2 (29.4) 13.8 52.8 (31.1) 21.7Trade receivables 397.8 (31.7) 366.1 369.6 (33.1) 336.5Other receivables 40.8 42.8Prepayments and accrued income 15.3 14.8Total trade and other receivables 422.2 394.1
*Restated as a result of the recording of a provision for which a related asset exists (Note 32).

156 Vesuvius plcAnnual Report and Accounts 2017
18. Trade and Other Receivables (continued)18.2 Analysis of trade and other receivables (continued)
All the Group’s operating companies have policies and procedures in place to assess the creditworthiness of the customers with whom they do business. Where objective evidence exists that a trade receivable balance may be impaired, provision is made for the difference between its carrying amount and the present value of the estimated cash that will be recovered. Evidence of impairment may include such factors as the customer being in breach of contract, or entering bankruptcy or fi nancial reorganisation proceedings. Impairment provisions are assessed on an individual customer basis for all signifi cant outstanding balances and collectively for all remaining balances, based upon historical loss experience. Historical experience has shown that the Group’s trade receivable provisions are maintained at levels that are suffi cient to absorb actual bad debt write-offs, without being excessive. The Group considers the credit quality of fi nancial assets that are neither past due nor impaired as good.
18.3 Movements on impairment provisions
2017£m
2016£m
As at 1 January 33.1 27.1Charge for the year 3.7 6.6Receivables written off during the year as uncollectable (4.8) (4.4)Exchange adjustments (0.3) 3.8As at 31 December 31.7 33.1
The charge for the year shown in the table above is recorded within administration, selling and distribution costs in the Group Income Statement.
19. Inventories19.1 Accounting policy
Inventories are stated at the lower of cost (using the fi rst in, fi rst out method) and net realisable value. Cost comprises expenditure incurred in purchasing or manufacturing inventories together with all other costs directly incurred in bringing the inventory to its present location and condition and, where appropriate, attributable production overheads based on normal activity levels. Net realisable value represents the estimated selling price less all estimated costs of completion and costs to be incurred in marketing, selling and distribution. The amount of any write-down of inventories to net realisable value is recognised as an expense in the year in which the write-down occurs.
19.2 Analysis of inventories
2017£m
2016£m
Raw materials 80.2 75.1Work-in-progress 20.2 18.7Finished goods 122.4 113.9Total inventories 222.8 207.7
The cost of inventories recognised as an expense and included in manufacturing costs of continuing operations in the Group Income Statement during the year was £609.6m (2016: £499.3m).
The net inventories of £222.8m include a provision for obsolete stock of £13.9m (2016: £14.4m) and inventory write-downs from cost to net realisable value of £1.7m (2016: £2.4m).
Notes to the Group Financial Statements continued

157Financial Statem
ents
20. Derivative Financial Instruments20.1 Accounting policy
The Group uses derivative fi nancial instruments (‘derivatives’), in the form of forward foreign currency contracts and interest rate swaps to manage the effects of its exposure to foreign exchange risk and interest rate risk. The way in which derivatives are used to manage the Group’s fi nancial risk is detailed in Note 27.
Derivatives are measured at fair value. The fair value of forward foreign currency contracts is calculated using market prices at the balance sheet date. The fair value of an interest rate swap is the estimated amount that the Group would receive or pay to terminate the swap at the balance sheet date, taking into account current interest rates and the creditworthiness of the swap counterparty.
The method of recognising the gain or loss on remeasurement to fair value depends upon whether the derivative is designated as a hedging instrument for hedge accounting purposes and, if so, the nature of the item being hedged. Strict conditions have to be satisfi ed in order to qualify for hedge accounting, including a determination both at inception of the hedge and on an ongoing basis that the hedge is expected to be highly effective in achieving offsetting changes in fair values or cash fl ows attributable to the hedged risk. The change in fair value of a derivative that is not designated as a hedging instrument for hedge accounting purposes is recognised immediately in the Group Income Statement. No derivatives are held for speculative purposes.
Net investment hedgesThe effective part of any gain or loss on a derivative that is designated as a hedge of a net investment in a foreign operation is recognised in other comprehensive income and presented in the translation reserve in equity, and is subsequently recognised in the Group Income Statement as part of the profi t or loss on disposal of the net investment. The ineffective portion of the gain or loss is recognised immediately within trading profi t in the Group Income Statement.
20.2 Analysis of derivative fi nancial instruments
2017 2016
Assets£m
Liabilities£m
Assets£m
Liabilities£m
Derivatives not designated for hedge accounting purposes 0.3 — — (0.9)Total derivative fi nancial instruments 0.3 — — (0.9)
All of the fair values shown in the table above are classifi ed under IFRS 13 as Level 2 measurements which have been calculated using quoted prices from active markets, where similar contracts are traded and the quotes refl ect actual transactions in similar instruments. All of the derivative assets and liabilities reported in the table above will mature within a year of the balance sheet date.

158 Vesuvius plcAnnual Report and Accounts 2017
21. Acquisition of Subsidiaries and Joint Ventures, Net of Cash AcquiredThe Group did not acquire any material interests in any companies during the year ended 31 December 2017.
Prior Year AcquisitionOn 1 December 2016, the Group acquired a 100% ownership interest in Mastercodi Industrial Ltda, the mould and tundish fl ux business of Carboox, for total consideration of £8.0m, of which £0.7m was deferred. The fair value of the net assets acquired was £4.9m and included identifi ed intangible assets relating to customer relationships and trade names of £3.8m. The transaction resulted in the recognition of £3.1m of goodwill attributable to the synergies which are expected from combining the business with the operations of the Group.
During 2017 the fair values of the acquired assets and liabilities were fi nalised and resulted in a £0.3m adjustment to trade and other receivables. The fi nal fair value of net assets acquired was £5.2m and the total goodwill recognised was £3.4m.
22. Discontinued OperationsDiscontinued operations income during 2017 of £1.7m related to a release of provisions no longer required.
Discontinued operations income during 2016 of £10.2m comprised a £9.0m tax credit relating to the release of a provision for possible China taxes (Note 10.2) and a £1.2m release of provisions no longer required.
22.1 Results of discontinued operations
2017£m
2016£m
Other income 1.7 10.2Profi t before tax — attributable to owners of the parent 1.7 10.2Earnings per share — penceBasic 0.7 3.8Diluted 0.6 3.7
22.2 Cash fl ows from discontinued operations
2017£m
2016£m
Net cash outfl ow from:— operating activities (0.7) —Net cash outfl ow for the year (0.7) —
23. Issued Share Capital23.1 Accounting policy
Equity instruments issued by the Company are recorded as the proceeds received, net of direct issue costs.
23.2 Analysis of issued share capitalThe issued and fully paid ordinary share capital of the Company as at 31 December 2017 was 278.5 million shares of 10 pence each (2016: 278.5 million shares of 10 pence each). Further information relating to the Company’s share capital is given in Note 8 attached to the Company’s fi nancial statements.
Notes to the Group Financial Statements continued
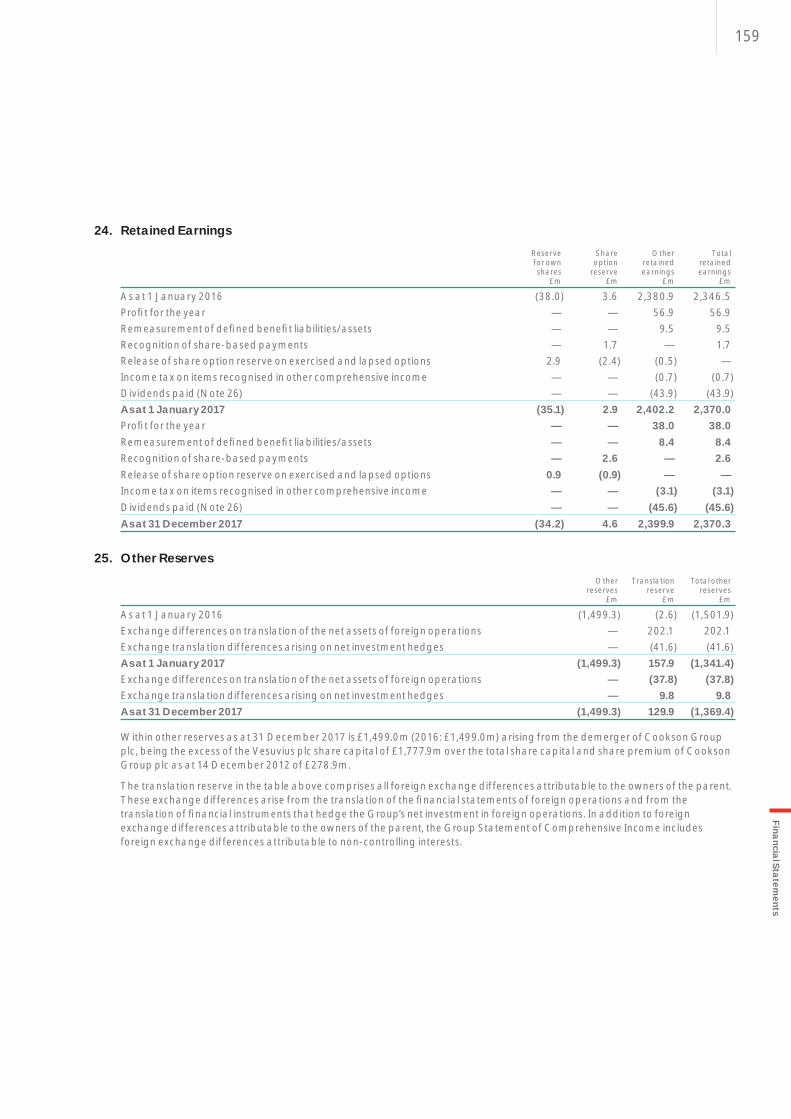
159Financial Statem
ents
24. Retained EarningsReserve for own shares
£m
Share option
reserve£m
Other retained earnings
£m
Total retained earnings
£m
As at 1 January 2016 (38.0) 3.6 2,380.9 2,346.5Profi t for the year — — 56.9 56.9Remeasurement of defi ned benefi t liabilities/assets — — 9.5 9.5Recognition of share-based payments — 1.7 — 1.7Release of share option reserve on exercised and lapsed options 2.9 (2.4) (0.5) —Income tax on items recognised in other comprehensive income — — (0.7) (0.7)Dividends paid (Note 26) — — (43.9) (43.9)As at 1 January 2017 (35.1) 2.9 2,402.2 2,370.0Profi t for the year — — 38.0 38.0Remeasurement of defi ned benefi t liabilities/assets — — 8.4 8.4Recognition of share-based payments — 2.6 — 2.6Release of share option reserve on exercised and lapsed options 0.9 (0.9) — —Income tax on items recognised in other comprehensive income — — (3.1) (3.1)Dividends paid (Note 26) — — (45.6) (45.6)As at 31 December 2017 (34.2) 4.6 2,399.9 2,370.3
25. Other ReservesOther
reserves£m
Translation reserve
£m
Total other reserves
£m
As at 1 January 2016 (1,499.3) (2.6) (1,501.9)Exchange differences on translation of the net assets of foreign operations — 202.1 202.1Exchange translation differences arising on net investment hedges — (41.6) (41.6)As at 1 January 2017 (1,499.3) 157.9 (1,341.4)Exchange differences on translation of the net assets of foreign operations — (37.8) (37.8)Exchange translation differences arising on net investment hedges — 9.8 9.8As at 31 December 2017 (1,499.3) 129.9 (1,369.4)
Within other reserves as at 31 December 2017 is £1,499.0m (2016: £1,499.0m) arising from the demerger of Cookson Group plc, being the excess of the Vesuvius plc share capital of £1,777.9m over the total share capital and share premium of Cookson Group plc as at 14 December 2012 of £278.9m.
The translation reserve in the table above comprises all foreign exchange differences attributable to the owners of the parent. These exchange differences arise from the translation of the fi nancial statements of foreign operations and from the translation of fi nancial instruments that hedge the Group’s net investment in foreign operations. In addition to foreign exchange differences attributable to the owners of the parent, the Group Statement of Comprehensive Income includes foreign exchange differences attributable to non-controlling interests.

Notes to the Group Financial Statements continued
160 Vesuvius plcAnnual Report and Accounts 2017
26. DividendsA fi nal dividend for the year ended 31 December 2016 of £30.8m (2015: £30.0m), equivalent to 11.40 pence (2015: 11.125 pence) per ordinary share, was paid in May 2017 (May 2016) and an interim dividend for the year ended 31 December 2017 of £14.8m (2016: £13.9m), equivalent to 5.50 pence (2016: 5.15 pence) per ordinary share, was paid in September 2017 (September 2016).
A proposed fi nal dividend for the year ended 31 December 2017 of £33.8m, equivalent to 12.5 pence per ordinary share, is subject to approval by shareholders at the Company’s Annual General Meeting and has not been included as a liability in these fi nancial statements. If approved by shareholders, the dividend will be paid on 25 May 2018 to ordinary shareholders on the register at 13 April 2018.
27. Financial Risk Management27.1 Accounting policy
(a) Non-derivative fi nancial instrumentsLoans and borrowings are initially recognised at fair value plus directly attributable transaction costs. After initial recognition they are measured at amortised cost, using the effective interest method.
(b) Foreign currenciesThe individual fi nancial statements of each Group entity are prepared in their functional currency, which is the currency of the primary economic environment in which that entity operates. For the purpose of the Consolidated Financial Statements, the results and fi nancial position of each entity are translated into pound sterling, which is the presentational currency of the Group.
Reporting foreign currency transactions in functional currencyTransactions in currencies other than the entity’s functional currency (foreign currencies) are initially recorded at the rates of exchange prevailing on the dates of the transactions. At each subsequent balance sheet date:
(i) Foreign currency monetary items are retranslated at the rates prevailing at the balance sheet date. Exchange differences arising on the settlement or retranslation of monetary items are recognised in the Group Income Statement
(ii) Non-monetary items measured at historical cost in a foreign currency are not retranslated
Translation from functional currency to presentational currencyWhen the functional currency of a Group entity is different from the Group’s presentational currency (pound sterling), its results and fi nancial position are translated into the presentational currency as follows:
(i) Assets and liabilities are translated using exchange rates prevailing at the balance sheet date
(ii) Income and expense items are translated at average exchange rates for the year, except where the use of such average rates does not approximate the exchange rate at the date of a specifi c transaction, in which case the transaction rate is used
(iii) All resulting exchange differences are recognised in other comprehensive income and presented in the translation reserve in equity and are reclassifi ed to profi t or loss in the period in which the foreign operation is disposed of
Net investment in foreign operationsExchange differences arising on a monetary item that forms part of a reporting entity’s net investment in a foreign operation are initially recognised in other comprehensive income and presented in the translation reserve in equity and reclassifi ed to profi t or loss on disposal of the net investment.
27.2 Financial risk factorsThe Group’s Treasury department, acting in accordance with policies approved by the Board, is principally responsible for managing the fi nancial risks faced by the Group. The Group’s activities expose it to a variety of fi nancial risks, the most signifi cant of which are market risk and liquidity risk.
(a) Market riskMarket risk is the risk that either the fair values or the cash fl ows of the Group’s fi nancial instruments may fl uctuate because of changes in market prices. The Group is principally exposed to market risk through fl uctuations in exchange rates (‘currency risk’) and interest rates (‘interest rate risk’).

Financial Statements
161
Currency riskThe Group is exposed to currency risk on its borrowings and fi nancial assets (being cash and short-term deposits) that are denominated in currencies other than pound sterling. The Group’s general policy is proportionally to match the currency profi le of its core borrowings with the currency profi le of its earnings and net assets. This is achieved, where necessary, by the use of forward foreign exchange contracts (‘FX swaps’). The currency profi le of the Group’s borrowings and fi nancial assets, refl ecting the effect of the FX swaps, is shown in the table below.
2017 2016
Borrowings before
FX swaps£m
FX swaps
£m
Borrowings after
FX swaps£m
Financial assets *
£m
Net debt
£m
Borrowings before
FX swaps£m
FX swaps
£m
Borrowings after
FX swaps£m
Financial assets
£m
Net debt
£m
Sterling 39.7 88.7 128.4 4.5 132.9 32.5 116.8 149.3 (9.2) 140.1United States dollar 159.9 (88.7) 71.2 (14.7) 56.5 301.6 (116.8) 184.8 (40.7) 144.2Euro 235.6 — 235.6 (45.2) 190.4 127.1 — 127.1 (22.6) 104.5Chinese renminbi — — — (34.5) (34.5) — — — (22.1) (22.1)Other 3.1 — 3.1 (72.0) (68.9) 5.2 — 5.2 (49.9) (44.7)Capitalised arrangement fees (2.1) — (2.1) — (2.1) (1.7) — (1.7) — (1.7)As at 31 December 436.2 — 436.2 (161.9) 274.3 464.7 — 464.7 (144.4) 320.3
* The overdrawn sterling balance of £4.5m above is included in the cash pooling arrangement s and offset by other currency balances in the pool.
Based upon the currency profi le shown in the table above, while not impacting reported profi t, the change in net debt arising from a 10% strengthening of sterling would increase reported equity by £13.0m (2016: £16.5m) and a corresponding 10% weakening of sterling would reduce equity by £15.9m (2016: £20.2m).
The tables below show the net unhedged monetary assets and liabilities of Group companies that are not denominated in their functional currency and which could give rise to exchange gains and losses in the Group Income Statement.
Net unhedged monetary assets/(liabilities)
Sterling£m
US dollar£m
Euro£m
Renminbi£m
Other£m
Total£m
Functional currencySterling — (2.5) (5.3) 0.1 6.1 (1.6)United States dollar — — 0.5 — (2.6) (2.1)Euro (0.5) 7.3 — — — 6.8Chinese renminbi (0.7) 15.0 0.4 — (0.1) 14.6Other (0.7) 14.6 (0.7) (0.2) 11.7 24.7As at 31 December 2017 (1.9) 34.4 (5.1) (0.1) 15.1 42.4
Net unhedged monetary assets/(liabilities)
Sterling£m
US dollar£m
Euro£m
Renminbi£m
Other£m
Total£m
Functional currencySterling — (0.9) 1.0 0.1 1.0 1.2United States dollar — — 13.5 — (3.6) 9.9Euro (0.2) (3.2) — — — (3.4)Chinese renminbi (0.7) 5.4 (0.5) — (0.1) 4.1Other (0.5) 13.4 2.2 1.3 18.0 34.4As at 31 December 2016 (1.4) 14.7 16.2 1.4 15.3 46.2
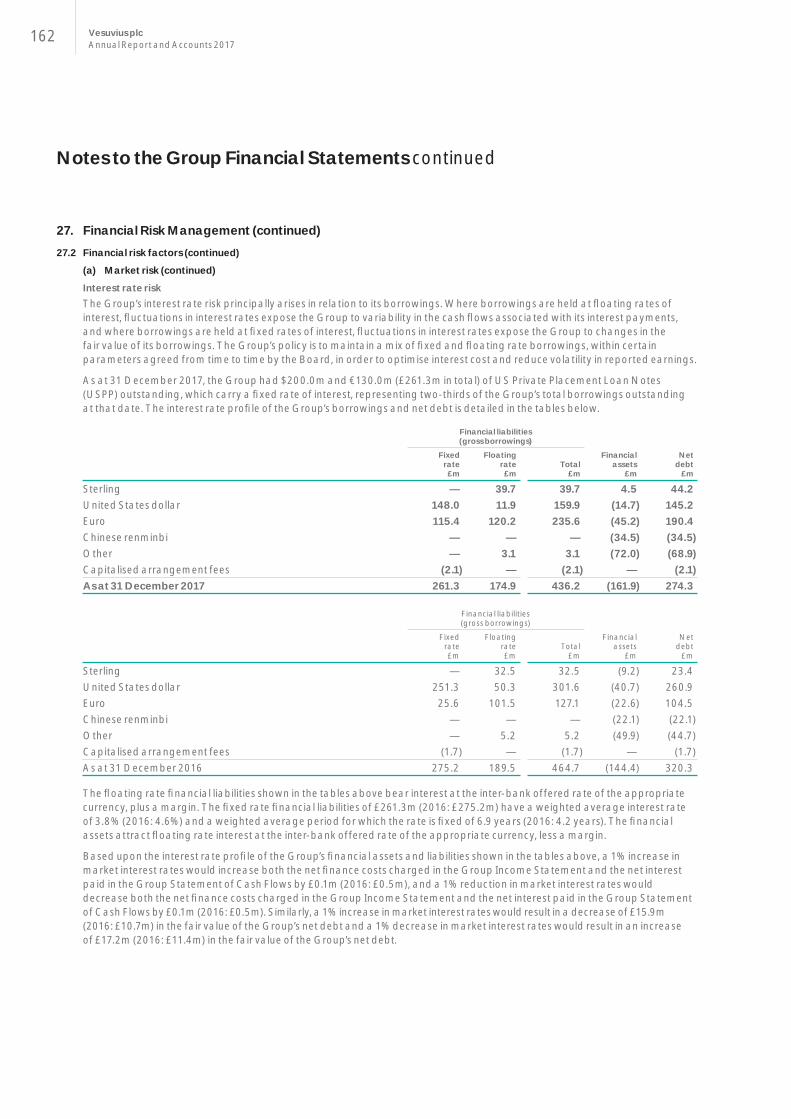
Notes to the Group Financial Statements continued
162 Vesuvius plcAnnual Report and Accounts 2017
27. Financial Risk Management (continued)27.2 Financial risk factors (continued)
(a) Market risk (continued)
Interest rate riskThe Group’s interest rate risk principally arises in relation to its borrowings. Where borrowings are held at fl oating rates of interest, fl uctuations in interest rates expose the Group to variability in the cash fl ows associated with its interest payments, and where borrowings are held at fi xed rates of interest, fl uctuations in interest rates expose the Group to changes in the fair value of its borrowings. The Group’s policy is to maintain a mix of fi xed and fl oating rate borrowings, within certain parameters agreed from time to time by the Board, in order to optimise interest cost and reduce volatility in reported earnings.
As at 31 December 2017, the Group had $200.0m and €130.0m (£261.3m in total) of US Private Placement Loan Notes (USPP) outstanding, which carry a fi xed rate of interest, representing two-thirds of the Group’s total borrowings outstanding at that date. The interest rate profi le of the Group’s borrowings and net debt is detailed in the tables below.
Financial liabilities (gross borrowings)
Financial assets
£m
Net debt
£m
Fixed rate
£m
Floating rate
£mTotal
£m
Sterling — 39.7 39.7 4.5 44.2United States dollar 148.0 11.9 159.9 (14.7) 145.2Euro 115.4 120.2 235.6 (45.2) 190.4Chinese renminbi — — — (34.5) (34.5)Other — 3.1 3.1 (72.0) (68.9)Capitalised arrangement fees (2.1) — (2.1) — (2.1)As at 31 December 2017 261.3 174.9 436.2 (161.9) 274.3
Financial liabilities (gross borrowings)
Financial assets
£m
Net debt
£m
Fixed rate£m
Floating rate£m
Total£m
Sterling — 32.5 32.5 (9.2) 23.4United States dollar 251.3 50.3 301.6 (40.7) 260.9Euro 25.6 101.5 127.1 (22.6) 104.5Chinese renminbi — — — (22.1) (22.1)Other — 5.2 5.2 (49.9) (44.7)Capitalised arrangement fees (1.7) — (1.7) — (1.7)As at 31 December 2016 275.2 189.5 464.7 (144.4) 320.3
The fl oating rate fi nancial liabilities shown in the tables above bear interest at the inter-bank offered rate of the appropriate currency, plus a margin. The fi xed rate fi nancial liabilities of £261.3m (2016: £275.2m) have a weighted average interest rate of 3.8% (2016: 4.6%) and a weighted average period for which the rate is fi xed of 6.9 years (2016: 4.2 years). The fi nancial assets attract fl oating rate interest at the inter-bank offered rate of the appropriate currency, less a margin.
Based upon the interest rate profi le of the Group’s fi nancial assets and liabilities shown in the tables above, a 1% increase in market interest rates would increase both the net fi nance costs charged in the Group Income Statement and the net interest paid in the Group Statement of Cash Flows by £0.1m (2016: £0.5m), and a 1% reduction in market interest rates would decrease both the net fi nance costs charged in the Group Income Statement and the net interest paid in the Group Statement of Cash Flows by £0.1m (2016: £0.5m). Similarly, a 1% increase in market interest rates would result in a decrease of £15.9m (2016: £10.7m) in the fair value of the Group’s net debt and a 1% decrease in market interest rates would result in an increase of £17.2m (2016: £11.4m) in the fair value of the Group’s net debt.

Financial Statements
163
(b) Liquidity riskLiquidity risk is the risk that the Group might have diffi culties in meeting its fi nancial obligations. The Group manages this risk by ensuring that it maintains suffi cient levels of committed borrowing facilities and cash and cash equivalents to ensure that it can meet its operational cash fl ow requirements and any maturing fi nancial liabilities, whilst at all times operating within its fi nancial covenants. The level of operational headroom provided by the Group’s committed borrowing facilities is reviewed at least annually as part of the Group’s three-year planning process. Where this process indicates a need for additional fi nance, this is normally addressed 12 to 18 months in advance by means of either additional committed bank facilities or raising fi nance in the capital markets.
In December 2017 the US dollar portion of the US Private Placement (‘USPP’) debt of $110m matured. This debt was replaced with a Euro-denominated USPP comprising two €50m tranches. These were issued with maturity dates of 2027 and 2029 respectively.
As at 31 December 2017, the Group had committed borrowing facilities of £563.4m (2016: £576.9m), of which £153.7m (2016: £158.3m) were undrawn. These undrawn facilities are due to expire in June 2022. The Group’s borrowing requirements are met by USPP and a multi-currency committed syndicated bank facility of £300.0m (2016: £300.0m). The USPP facility was fully drawn as at 31 December 2017 and amounted to £263.4m ($200.0m and €130.0m), of which $140.0m is repayable in 2020, €15.0m in 2021, $30.0m in 2023, €15.0m in 2025, €50.0m in 2027, $30.0m in 2028 and €50.0m in 2029. During 2017, an option was exercised to extend the maturity date of £300m syndicated bank facility from June 2020 to June 2022.
The maturity analysis of the Group’s gross borrowings is shown in the tables below.
Non-current Current Total
2017£m
2016£m
2017£m
2016£m
2017£m
2016£m
Loans and overdrafts 409.7 329.4 24.6 132.7 434.3 462.1Obligations under fi nance leases 2.4 2.6 1.6 1.7 4.0 4.3Capitalised arrangement fees (1.6) (1.2) (0.5) (0.5) (2.1) (1.7)Total interest-bearing borrowings 410.5 330.8 25.7 133.9 436.2 464.7
2017£m
2016£m
Interest-bearing borrowings repayableOn demand or within one year 22.4 134.4In the second year 1.4 1.2In the third year 252.8 0.9In the fourth year 13.4 255.7In the fi fth year 1.8 12.8After fi ve years 146.5 61.4Capitalised arrangement fees (2.1) (1.7)Total interest-bearing borrowings 436.2 464.7
Capitalised arrangement fees shown in the tables above, which have been recognised as a reduction in borrowings in the fi nancial statements, amounted to £2.1m as at 31 December 2017 (31 December 2016: £1.7m), of which £1.0m (2016: £0.7m) related to the USPP and £1.1m (2016: £1.0m) related to the syndicated bank facility.

Notes to the Group Financial Statements continued
164 Vesuvius plcAnnual Report and Accounts 2017
27. Financial Risk Management (continued)27.3 Capital management
The Company considers its capital to be equal to the sum of its total equity and net debt. It monitors its capital using a number of KPIs, including free cash fl ow, average working capital to sales ratios, net debt to EBITDA ratios and RONA (Note 4). The Group’s objectives when managing its capital are:
> To ensure that the Group and all of its businesses are able to operate as going concerns and ensure that the Group operates within the fi nancial covenants contained within its debt facilities
> To have available the necessary fi nancial resources to allow the Group to invest in areas that may deliver acceptable future returns to investors
> To maintain suffi cient fi nancial resources to mitigate against risks and unforeseen events
> To maximise shareholder value through maintaining an appropriate balance between the Group’s equity and net debt
The Group operated within the requirements of its debt covenants throughout the year and has suffi cient liquidity headroom within its committed debt facilities. Details of the Group’s covenant compliance and committed debt facilities can be found in the Strategic Report on page 29.
27.4 Cash pooling arrangementsThe Group enters into notional cash pooling arrangements as part of its ongoing Treasury management activities. Certain cash pooling arrangements meet the criteria for offsetting as clarifi ed in amendments to IAS 32 Financial Instruments, as regards a legally enforceable right of set-off both in the ordinary course of business and in the event of default. The following tables set out the amounts of recognised fi nancial assets and liabilities shown as cash and cash borrowings and those amounts which are subject to these agreements.
Gross amounts of recognised
fi nancial assets/liabilities
£m
Gross amounts of recognised
fi nancial assets/liabilities
offset in the statement of
fi nancial position£m
Net amounts of fi nancial assets/
liabilitiespresented in the
statement of fi nancial position
£m
Related amounts of fi nancial
assets/ liabilities not offset
in the statements of fi nancial
position£m
Net amount
£m
Financial assets/liabilitiesCash deposits 172.9 (11.0) 161.9 (9.5) 152.4Cash borrowings (32.9) 11.0 (21.9) 9.5 (12.4)As at 31 December 2017 140.0 — 140.0 — 140.0
Financial assets/liabilitiesCash deposits 160.8 (16.4) 144.4 (30.9) 113.5Cash borrowings (59.8) 16.4 (43.4) 30.9 (12.5)As at 31 December 2016 101.0 — 101.0 — 101.0
28. Employee Benefi ts28.1 Accounting policy
The net surplus or net liability recognised in the Group Balance Sheet for the Group’s defi ned benefi t plans is the present value of the defi ned benefi t obligation at the balance sheet date, less the fair value of the plan assets. The defi ned benefi t obligation is calculated by independent actuaries using the projected unit credit method and by discounting the estimated future cash fl ows using interest rates on high-quality corporate bonds that have terms to maturity approximating the terms of the related pension liability. Any asset recognised in respect of a surplus arising from this calculation is limited to the asset ceiling, where this is the present value of any economic benefi ts available in the form of refunds or reductions in future contributions in respect of the plans.
The expense for the Group’s defi ned benefi t plans is recognised in the Group Income Statement as shown in Note 28.8. Actuarial gains and losses arising on the assets and liabilities of the plans are reported within the Group Statement of Comprehensive Income; and gains and losses arising on settlements and curtailments are recognised in the Group Income Statement in the same line as the item that gave rise to the settlement or curtailment or, if material, separately reported as a component of operating profi t.

Financial Statements
165
28.2 Group post-retirement plansThe Group operates a number of pension plans around the world, both of the defi ned benefi t and defi ned contribution type, and accounts for them in accordance with IAS 19.
The Group’s principal defi ned benefi t pension plans are in the UK and the US, the benefi ts of which are based upon the fi nal pensionable salaries of plan members. The assets of these plans are held separately from the Group in trustee-administered funds. The trustees are required to act in the best interests of the plans’ benefi ciaries. The principal risks faced by these plans comprise: (i) the risk that the value of the plan assets is not suffi cient to meet all plan liabilities as they fall due; (ii) the risk that plan benefi ciaries live longer than envisaged, causing liabilities to exceed the available plan assets; and (iii) the risk that the market-based factors used to value plan liabilities and assets change materially adversely to increase plan liabilities over the value of available plan assets. The Group also has defi ned benefi t pension plans in other territories but, with the exception of those in Germany, these are not individually material in relation to the Group as a whole.
(a) Defi ned benefi t pension plans – UK
The Group’s main defi ned benefi t pension plan in the UK (‘the UK Plan’) is closed to new members and to future benefi t accrual. The existing plan was established under a trust deed and is subject to the Pensions Act 2004 and guidance issued by the UK Pensions Regulator.
A full actuarial valuation of the UK Plan is carried out every three years by an independent actuary for the UK Plan Trustee in line with the requirements of the Pensions Act 2004, and the last full valuation was carried out as at 31 December 2015. At that date, the market value of plan assets was £536.7m and this represented a funding level of 102% of the accrued plan benefi ts at the time of £526.4m. Calculated on a ‘buy-out’ basis (using an estimation of the cost of buying out the UK Plan benefi ts with an insurance company), the liabilities at that date were £687.5m, representing a funding level of 78%.
There is a “long-term scheme-specifi c funding standard” in Part 3 of the Pensions Act 2004. In terms of Part 3, the UK plan is subject to a requirement (“the statutory funding objective”) that it must have suffi cient and appropriate assets to cover its technical provisions. Such technical provisions are determined as part of the triennial valuation. Under the rules of the UK Plan, the Trustees, after consultation with the company, have the power to set the funding contributions taking into account the results of the triennial valuation, and the Pension Act 2004 legislation. Notwithstanding the latest funding valuation surplus, the Company agreed to make voluntary contributions of £2.0m in 2017. Thereafter, the Company will fund the administration cost relating to the management of the UK Plan.
The value of the UK Plan liabilities as at 31 December 2017 decreased to £490.8m (2016: £527.4m). The decrease in the liabilities was driven mainly by benefi ts paid from the scheme of £46.8m (2016: £28.1m) in line with the trust deed and relevant legislation requirements. Correspondingly, the UK Plan assets decreased to £580.3m (2016: £601.4m) as assets were liquidated to fund the benefi ts paid resulting in decreases in the values of the annuity insurance contract of £13.5m and the fi xed income holdings of £33.1m.
Proposed amendments to IFRIC 14, The Limit on a Defi ned Benefi t Asset, Minimum Funding Requirements and their interaction, address how the powers of other parties, such as the trustees of the plan, affect an entity’s right of refund of a surplus from the plan. The Group has assessed the likely impact of the application of the interaction and concluded that it would not impact its ability to continue to recognise a pension surplus.
(b) Defi ned benefi t pension plans – USThe Group has a number of defi ned benefi t pension plans in the US, providing retirement benefi ts based on fi nal salary or a fi xed benefi t. The Group’s principal US defi ned benefi t pension plans are closed to new members and also to future benefi t accrual for existing members. Actuarial valuations of the US defi ned benefi t pension plans are carried out every year and the last full valuation was carried out as at 31 December 2016. At that date the market value of the plan assets was £49.2m, representing a funding level of 66.0% of funded accrued plan benefi ts at that date (using the projected unit method of valuation) of £74.3m. Funding levels for the Group’s US defi ned benefi t pension plans are based upon annual valuations carried out by independent qualifi ed actuaries and are governed by US Government regulations. The value of US plan liabilities decreased to £82.0m (2016: £86.8m) in 2017, which was mainly attributable to benefi ts paid of £4.0m in line with scheme rules and exchange gains of £7.6m due to US dollar weakness. This signifi cant decrease was partially offset by an interest accrual of £3.1m and a loss of £3.8m due to the lower discount rate. The loss arising from changes in fi nancial assumptions is solely attributable to the decrease in the discount rates to 3.4% (2016: 3.8%).
The Group’s US defi ned benefi t pension plans are subject to the minimum contribution requirements of Internal Revenue Code Sections 412 and 430. Contributions are determined by trustees, in consultation with the Company, based on the annual valuations which are submitted to the Internal Revenue Service. For the plan year beginning 1 January 2017, the minimum required contribution was £nil as signifi cant company contributions of $6m were made in 2016. However, under these funding laws and based on the plan defi cit, minimum contributions in the period 2018-2020 are likely to be required and are expected to be in the $3m to $4m range. Voluntary contributions of $4m were made during 2017.
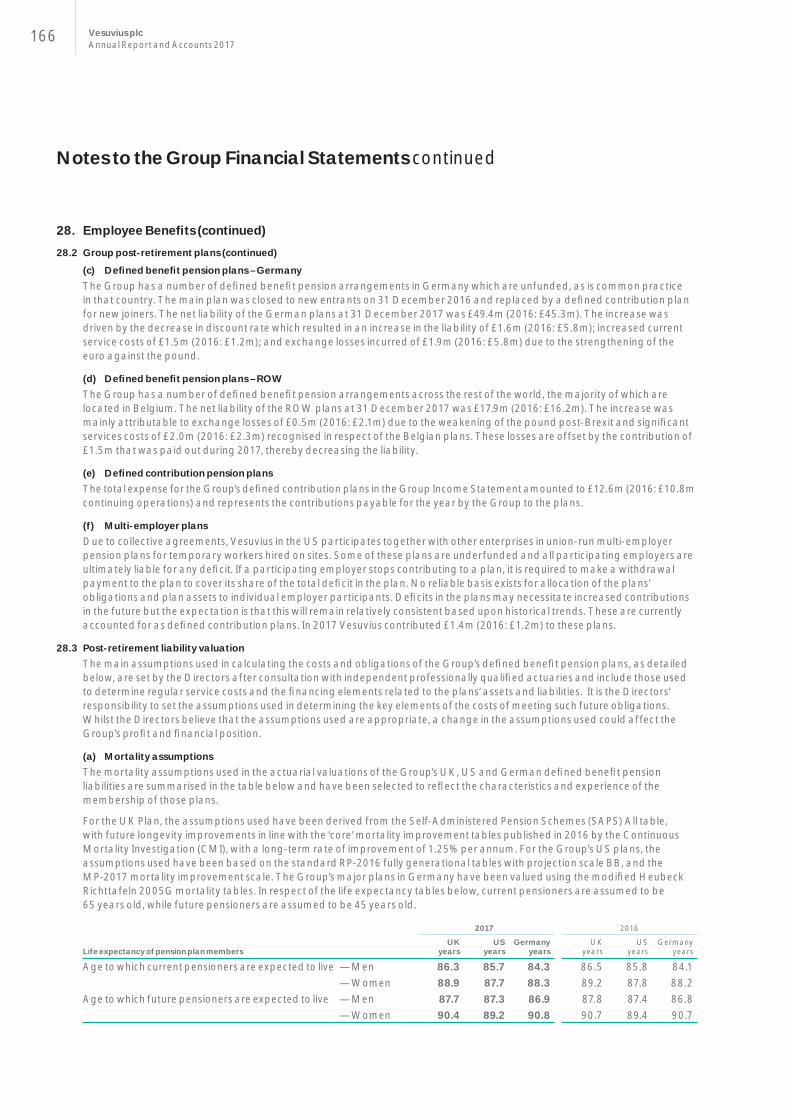
Notes to the Group Financial Statements continued
166 Vesuvius plcAnnual Report and Accounts 2017
28. Employee Benefi ts (continued)28.2 Group post-retirement plans (continued)
(c) Defi ned benefi t pension plans – GermanyThe Group has a number of defi ned benefi t pension arrangements in Germany which are unfunded, as is common practice in that country. The main plan was closed to new entrants on 31 December 2016 and replaced by a defi ned contribution plan for new joiners. The net liability of the German plans at 31 December 2017 was £49.4m (2016: £45.3m). The increase was driven by the decrease in discount rate which resulted in an increase in the liability of £1.6m (2016: £5.8m); increased current service costs of £1.5m (2016: £1.2m); and exchange losses incurred of £1.9m (2016: £5.8m) due to the strengthening of the euro against the pound.
(d) Defi ned benefi t pension plans – ROWThe Group has a number of defi ned benefi t pension arrangements across the rest of the world, the majority of which are located in Belgium. The net liability of the ROW plans at 31 December 2017 was £17.9m (2016: £16.2m). The increase was mainly attributable to exchange losses of £0.5m (2016: £2.1m) due to the weakening of the pound post-Brexit and signifi cant services costs of £2.0m (2016: £2.3m) recognised in respect of the Belgian plans. These losses are offset by the contribution of £1.5m that was paid out during 2017, thereby decreasing the liability.
(e) Defi ned contribution pension plansThe total expense for the Group’s defi ned contribution plans in the Group Income Statement amounted to £12.6m (2016: £10.8m continuing operations) and represents the contributions payable for the year by the Group to the plans.
(f) Multi-employer plansDue to collective agreements, Vesuvius in the US participates together with other enterprises in union-run multi-employer pension plans for temporary workers hired on sites. Some of these plans are underfunded and all participating employers are ultimately liable for any defi cit. If a participating employer stops contributing to a plan, it is required to make a withdrawal payment to the plan to cover its share of the total defi cit in the plan. No reliable basis exists for allocation of the plans’ obligations and plan assets to individual employer participants. Defi cits in the plans may necessitate increased contributions in the future but the expectation is that this will remain relatively consistent based upon historical trends. These are currently accounted for as defi ned contribution plans. In 2017 Vesuvius contributed £1.4m (2016: £1.2m) to these plans.
28.3 Post-retirement liability valuationThe main assumptions used in calculating the costs and obligations of the Group’s defi ned benefi t pension plans, as detailed below, are set by the Directors after consultation with independent professionally qualifi ed actuaries and include those used to determine regular service costs and the fi nancing elements related to the plans’ assets and liabilities. It is the Directors’ responsibility to set the assumptions used in determining the key elements of the costs of meeting such future obligations. Whilst the Directors believe that the assumptions used are appropriate, a change in the assumptions used could affect the Group’s profi t and fi nancial position.
(a) Mortality assumptionsThe mortality assumptions used in the actuarial valuations of the Group’s UK, US and German defi ned benefi t pension liabilities are summarised in the table below and have been selected to refl ect the characteristics and experience of the membership of those plans.
For the UK Plan, the assumptions used have been derived from the Self-Administered Pension Schemes (SAPS) All table, with future longevity improvements in line with the ‘core’ mortality improvement tables published in 2016 by the Continuous Mortality Investigation (CMI), with a long-term rate of improvement of 1.25% per annum. For the Group’s US plans, the assumptions used have been based on the standard RP-2016 fully generational tables with projection scale BB, and the MP-2017 mortality improvement scale. The Group’s major plans in Germany have been valued using the modifi ed Heubeck Richttafeln 2005G mortality tables. In respect of the life expectancy tables below, current pensioners are assumed to be 65 years old, while future pensioners are assumed to be 45 years old.
Life expectancy of pension plan members
2017 2016
UK years
USyears
Germanyyears
UK years
USyears
Germanyyears
Age to which current pensioners are expected to live — Men 86.3 85.7 84.3 86.5 85.8 84.1— Women 88.9 87.7 88.3 89.2 87.8 88.2
Age to which future pensioners are expected to live — Men 87.7 87.3 86.9 87.8 87.4 86.8— Women 90.4 89.2 90.8 90.7 89.4 90.7

Financial Statements
167
(b) Other main actuarial valuation assumptions
2017 2016
UK % p.a.
US% p.a.
Germany% p.a.
UK % p.a.
US% p.a.
Germany% p.a.
Discount rate 2.50 3.40 1.60 2.70 3.80 1.75Price infl ation — using RPI for UK 3.25 2.25 1.80 3.30 2.25 1.70
— using CPI for UK 2.15 n/a n/a 2.20 n/a n/aRate of increase in pensionable salaries n/a n/a 2.55 n/a n/a 2.45Rate of increase to pensions in payment 3.10 n/a 1.65 3.15 n/a 1.55
The discount rate used to determine the liabilities of the UK Plan for IAS 19 accounting purposes is required to be determined by reference to market yields on high-quality corporate bonds. The UK discount rate in the above table is based on the Aon Hewitt AA-rated corporate bond yield in conjunction with the most recent projected cash fl ow data relating to the UK Plan liabilities; the US discount rate is based on the Citigroup pension discount curve; and the Germany discount rate is based on the yield on the iBoxx over ten-year euro corporates AA index.
The assumptions for UK price infl ation are set by reference to the difference between yields on longer-term conventional government bonds and index-linked bonds, except for CPI, for which no appropriate bonds exist, which is assumed to be 1.1 points lower (2016: 1.1 points lower) than RPI-based infl ation.
(c) Sensitivity analysis of the impact of changes in signifi cant IAS 19 actuarial assumptionsThe following table analyses, for the Group’s main UK, US and Germany pension plans, the theoretical estimated impact on plan liabilities and assets resulting from changes to the most signifi cant actuarial assumptions used for IAS 19 valuation purposes, whilst holding all other assumptions constant.
Following the arrangement of buy-in agreements for the UK Plan pensioner liabilities in 2012,and the fact that US pensions are not infl ation linked, the rate of increase in pensionable salaries and of pensions in payment is not signifi cant to the valuation of the Group’s overall pension liabilities.
As stated above, during 2012 the UK Plan entered into pension insurance buy-in agreements which eliminate the infl ation, interest rate, investment and longevity risk in respect of the pensioner liabilities covered by the agreements. The policy and the associated valuation are updated annually. Please refer to Note 28.7 (a) for further detail. In respect of the liabilities so covered, which currently represent some 56.5% of the total liabilities of the UK Plan, any changes in the valuation assumptions which impact on the value of those liabilities, also impact on the associated annuity assets in an equal and opposite way, thereby fully mitigating the valuation risk. This is also refl ected in the following table which includes the sensitivity of the group’s material defi ned benefi t obligations and plan assets, where applicable, to changes in the weighted principal assumptions as follows:
Assumption Change in assumption UK US Germany
Discount rate
Increase/decrease by 0.1%— impact on plan liabilities Decrease/increase by £8.2m Decrease/increase by £1.0m Decrease/increase by £1.0m— impact on plan assets Decrease/increase by £3.0mn/a n/a
Price infl ation
Increase/decrease by 0.1%— impact on plan liabilities Increase/decrease by £5.6m n/a Increase/decrease by £0.3m— impact on plan assets Increase/decrease by £2.1m n/a n/a
Mortality Increase by one year— impact on plan liabilities Increase by £21.4m Increase by £2.9m Increase by £1.8m— impact on plan assets Increase by £14.6m n/a n/a

Notes to the Group Financial Statements continued
168 Vesuvius plcAnnual Report and Accounts 2017
28. Employee Benefi ts (continued)28.4 Defi ned benefi t obligation
The average duration of the obligations to which the liabilities of the Group’s principal pension plans relate is 18 years for the UK, 19 years for Germany and 11.6 years for the US.
Defi ned benefi t pension plans Other post-retirement
benefi tplans
£mUK£m
US£m
Germany£m
ROW£m
Total£m
Total£m
Present value as at 1 January 2017 527.4 86.8 45.3 41.0 700.5 6.9 707.4Exchange differences — (7.6) 1.9 1.3 (4.4) 0.1 (4.3)Current service cost — 0.5 1.5 3.2 5.2 0.2 5.4Past service cost — — — 0.1 0.1 — 0.1Interest cost 14.0 3.1 0.8 0.7 18.6 0.2 18.8Settlements — — — — — — —Remeasurement of liabilities:— demographic changes (5.4) (0.7) — 0.1 (6.0) — (6.0)— fi nancial assumptions 11.3 3.8 1.6 0.5 17.2 0.3 17.5— experience losses/(gains) (9.7) 0.1 (0.1) 0.1 (9.6) (0.1) (9.7)Benefi ts paid (46.8) (4.0) (1.6) (2.4) (54.8) (1.1) (55.9)Present value as at 31 December 2017 490.8 82.0 49.4 44.6 666.8 6.5 673.3
Defi ned benefi t pension plans Other post-retirement
benefi tplans
£mUK£m
US£m
Germany£m
ROW£m
Total£m
Total£m
Present value as at 1 January 2016 464.3 112.1 36.3 36.1 648.8 5.7 654.5Exchange differences — 17.6 5.8 6.0 29.4 0.6 30.0Current service cost — 0.5 1.2 3.1 4.8 0.1 4.9Past service cost — — — 0.2 0.2 0.1 0.3Interest cost 17.6 4.6 0.9 0.8 23.9 0.2 24.1Settlements — (45.1) (3.5) (1.5) (50.1) — (50.1)Remeasurement of liabilities:— demographic changes (12.3) (1.2) — — (13.5) — (13.5)— fi nancial assumptions 76.2 4.4 5.8 0.6 87.0 0.4 87.4— experience losses/(gains) 9.7 (0.4) 0.1 — 9.4 0.5 9.9Benefi ts paid (28.1) (5.7) (1.3) (4.3) (39.4) (0.7) (40.1)Present value as at 31 December 2016 527.4 86.8 45.3 41.0 700.5 6.9 707.4

Financial Statements
169
28.5 Fair value of plan assets
2017 2016
UK£m
US£m
ROW£m
Total£m
UK£m
US£m
ROW£m
Total£m
As at 1 January 604.1 49.1 24.8 678.0 522.0 74.4 22.8 619.2Exchange differences — (4.5) 0.5 (4.0) — 10.8 4.0 14.8Interest income 16.1 1.7 0.4 18.2 19.3 3.1 0.4 22.8Settlements — — — — — (41.6) (1.0) (42.6)Acquisitions — — — — — — — —Remeasurement of assets 5.7 3.8 0.7 10.2 89.7 3.4 0.2 93.3Contributions from employer 2.0 3.1 2.3 7.4 2.0 4.4 2.4 8.8Contributions from members — — — — — — — —Administration expenses paid (0.8) (0.5) — (1.3) (0.9) (0.6) — (1.5)Benefi ts paid (46.8) (2.9) (2.0) (51.7) (28.0) (4.8) (4.0) (36.8)As at 31 December 580.3 49.8 26.7 656.8 604.1 49.1 24.8 678.0
The Group’s pension plans in Germany are unfunded, as is common practice in that country, and accordingly there are no assets associated with these plans.
28.6 Remeasurement of defi ned benefi t liabilities/assets
2017total
£m
2016total
£m
Remeasurement of liabilities:— demographic changes 6.0 13.5— fi nancial assumptions (17.5) (87.4)— experience (losses)/gains 9.7 (9.9)Remeasurement of assets 10.2 93.3Total movement 8.4 9.5
The remeasurement of defi ned benefi t liabilities and assets of £8.4m (2016: £9.5m) is recognised in the Group Statement of Comprehensive Income.
28.7 Balance sheet recognitionThe amount recognised in the Group Balance Sheet in respect of the Group’s defi ned benefi t pension plans and other post-retirement benefi t plans is analysed in the following tables, which all relate to continuing operations. All equity securities and bonds have quoted prices in active markets.
Defi ned benefi t pension plans Other post-retirement
benefi tplans
£mUK£m
US£m
Germany£m
ROW£m
Total£m
2017total
£m
Equities 68.9 9.7 — 2.9 81.5 — 81.5Bonds 191.8 38.5 — 2.0 232.3 — 232.3Annuity insurance contracts 276.1 — — 17.8 293.9 — 293.9Other assets 43.5 1.6 — 4.0 49.1 — 49.1Fair value of plan assets 580.3 49.8 — 26.7 656.8 — 656.8Present value of funded obligations (488.9) (70.4) — (40.0) (599.3) — (599.3)
91.4 (20.6) — (13.3) 57.5 — 57.5Present value of unfunded obligations (1.9) (11.6) (49.4) (4.6) (67.5) (6.5) (74.0)Total net surpluses/(liabilities) 89.5 (32.2) (49.4) (17.9) (10.0) (6.5) (16.5)Recognised in the Group Balance Sheet as:Net surpluses 91.4 — — 1.0 92.4 — 92.4Net liabilities (1.9) (32.2) (49.4) (18.9) (102.4) (6.5) (108.9)
Total net surpluses/(liabilities) 89.5 (32.2) (49.4) (17.9) (10.0) (6.5) (16.5)

Notes to the Group Financial Statements continued
170 Vesuvius plcAnnual Report and Accounts 2017
28. Employee Benefi ts (continued)28.7 Balance sheet recognition (continued)
Based on a detailed assessment performed, none of the IFRIC 14 restrictions are applicable and, therefore, the surplus is recognised.
Defi ned benefi t pension plans Other post-retirement
benefi tplans
£mUK£m
US£m
Germany£m
ROW£m
Total£m
2016total
£m
Equities 73.8 10.0 — 2.6 86.4 — 86.4Bonds 216.3 35.9 — 2.0 254.2 — 254.2Annuity insurance contracts 289.6 — — 16.3 305.9 — 305.9Other assets 24.4 3.2 — 3.9 31.5 — 31.5Fair value of plan assets 604.1 49.1 — 24.8 678.0 — 678.0Present value of funded obligations (525.5) (74.3) — (37.3) (637.1) — (637.1)
78.6 (25.2) — (12.5) 40.9 — 40.9Present value of unfunded obligations (1.9) (12.5) (45.3) (3.7) (63.4) (6.9) (70.3)Total net surpluses/(liabilities) 76.7 (37.7) (45.3) (16.2) (22.5) (6.9) (29.4)Recognised in the Group Balance Sheet as:Net surpluses 78.6 — — 0.2 78.8 — 78.8Net liabilities (1.9) (37.7) (45.3) (16.4) (101.3) (6.9) (108.2)Total net surpluses/(liabilities) 76.7 (37.7) (45.3) (16.2) (22.5) (6.9) (29.4)
(a) UK Plan asset allocationAs at 31 December 2017, of the UK Plan’s total assets, 47.6% were represented by the annuity insurance contracts covering the UK Plan’s pension liabilities; 11.9% were allocated to equities; 33.0% to fi xed income securities; 5.1% to cash; and 2.4% to other assets. The fi xed income asset class of the UK Plan includes a liability-driven investment portfolio of fi nancial derivative contracts which reduces the risk that the UK Plan’s assets would fall materially, relative to the value of its economic liabilities.
The UK Plan Trustee has entered into a pension insurance buy-in agreement with the Pension Insurance Corporation (PIC), whereby the UK Plan Trustee has paid insurance premiums to PIC to insure a signifi cant portion of the UK Plan’s liabilities. Under this arrangement, the value of the PIC insurance contract matches the value of the liabilities because the infl ation, interest rate, investment and longevity risk for Vesuvius in respect of these liabilities are eliminated. As at 31 December 2017, the IAS 19 valuation of the PIC insurance contract value associated with the bought-in liabilities was £276.1m (2016: £289.6m). The buy-in agreement ensures that the UK pension plan obligations in respect of all its retired members and their approved dependants are insured. The policy and the associated valuation are updated annually to refl ect retirements and mortality. In the current year, the agreement based on specifi c membership data covers 56.5% of UK pension plan obligations, removing all fi nancial risks associated with this tranche of the liability.
(b) Defi ned benefi t contributions in 2018In 2018, the Group is expected to make contributions into its defi ned benefi t pension and other post-retirement benefi ts plans of around £5.3m with specifi c contributions of approximately £3.0m and £0.8m anticipated for the US Plan and UK Plan respectively.

Financial Statements
171
28.8 Income statement recognitionThe expense recognised in the Group Income Statement in respect of the Group’s defi ned benefi t retirement plans and other post-retirement benefi t plans is shown below.
2017 2016
Defi nedbenefi t
pensionplans
£m
Other post-
retirementbenefi t
plans£m
Total£m
Defi nedbenefi t
pensionplans
£m
Other post-
retirementbenefi t
plans£m
Total£m
Current service cost 5.2 0.2 5.4 4.8 0.1 4.9Past service cost 0.1 — 0.1 0.2 0.1 0.3Settlements — — — (5.2) — (5.2)Administration expenses 1.3 — 1.3 1.5 — 1.5Net interest cost 0.4 0.2 0.6 1.1 0.2 1.3Total net charge 7.0 0.4 7.4 2.4 0.4 2.8
No settlement gain arose in 2017 in contrast to the £5.2m recognised in 2016 in relation to the buy-out of members of the US Plan and German members moving their existing plans into a new defi ned contribution plan. These settlements reduced the Group’s defi ned benefi t obligations by £50.1m, effected by utilising £42.6m of pension assets and additionally, in respect of the unfunded German plan, £2.3m of the Group’s cash.
The total net charge of £7.4m (2016: £2.8m) recognised in the Group Income Statement in respect of the Group’s defi ned benefi t pension plans and other post-retirement benefi ts plans is recognised in the following table:
2017£m
2016£m
In arriving at trading profi t — within other manufacturing costs 2.4 2.0 — within administration, selling and distribution costs 4.4 4.4In arriving at profi t before tax — within restructuring charges — 0.3 — gain on employee benefi t plan — (5.2) — within net fi nance costs 0.6 1.3Total net charge 7.4 2.8
29. Share-based Payments29.1 Accounting policy
The Group operates equity-settled share-based payment arrangement for its employees. Equity-settled share-based payments are measured at fair value at the date of grant. The fair value determined at the grant date takes account of the effect of market-based conditions, such as total shareholder return target upon which vesting for some awards is conditional, and is expensed on a straight-line basis over the vesting period with a corresponding increase in equity. The cumulative expense recognised is adjusted for the best estimate of the shares that will eventually vest and for the effect of other non-market-based conditions, such as growth in headline earnings per share, which are not included in the fair value determined at the date of grant. For grants with market-based conditions attached to them, fair value is measured using a form of stochastic option pricing model. For all other grants, fair value is measured using the Black-Scholes option pricing model.
29.2 Income statement recognitionThe total expense recognised in the Group Income Statement is shown below.
2017£m
2016£m
Long Term Incentive Plan 1.8 1.0Other plans 0.8 0.7Total expense 2.6 1.7
The Group operates a number of different share-based payment plans, the most signifi cant of which is the Long Term Incentive Plan (LTIP), details of which can be found on pages 111 to 113 of the Directors’ Remuneration Report. The Group’s other share-based payment plans are not considered signifi cant in the context of the Group’s results or fi nancial position.

Notes to the Group Financial Statements continued
172 Vesuvius plcAnnual Report and Accounts 2017
29. Share-based Payments (continued)29.3 Details of outstanding options
Outstanding awards
As at 1 Jan 2017
no.Granted
no.Exercised
no.
Forfeited/lapsed
no.
As at 31 Dec 2017
no.
LTIP 2,398,185 825,653 — (943,745) 2,280,093Weighted average exercise price nil nil nil nil nilOther plans 219,479 118,722 (180,104) (5,660) 152,437Weighted average exercise price nil nil nil nil nil
For the options exercised during 2017, the share price at the date of exercise ranged from 402 pence to 592 pence. Outstanding awards
As at 1 Jan 2016
no.Granted
no.Exercised
no.
Forfeited/lapsed
no.
As at 31 Dec 2016
no.
LTIP 1,585,838 1,211,928 — (399,581) 2,398,185Weighted average exercise price nil nil nil nil nilOther plans 743,666 86,867 (607,139) (3,915) 219,479Weighted average exercise price nil nil nil nil nil
For the options exercised during 2016, the share price at the date of exercise ranged from 287 pence to 347 pence.
Details of market performance conditions are included in the Directors’ Remuneration Report.
2017 2016
Awardsexercisable
as at31 Dec 2017
no.
Weightedaverage
outstandingcontractual
life of awardsyears
Range ofexercise
pricespence
Awardsexercisable
as at31 Dec 2016
no.
Weightedaverage
outstandingcontractual
life of awardsyears
Range ofexercise
pricespence
LTIP — 4.8 — 5.2Weighted average exercise price — n/a — n/aOther plans — 1.0 — 0.4Weighted average exercise price — n/a — n/a
29.4 Options granted under the LTIP during the year
2017 (March Grant) 2017 (Sept Grant) 2016
EPSelement
TSRelement
EPSelement
TSRelement
EPSelement
TSRelement
Fair value of options granted (per share) 524.5p 401.0p 578.0p 467.0p 292.0p 112.0pShare price on date of grant (per share) 524.5p 524.5p 578.0p 578.0p 292.0p 292.0pExpected volatility n/a 30.9% n/a 33.00% n/a 26.0%Risk-free interest rate n/a 0.17% n/a 0.16% n/a 0.4%Exercise price (per share) nil nil nil nil nil nilExpected term (years) 3 3 3 3 4 4Expected dividend yield nil nil nil nil nil nil
The fair value of share options with non-market performance conditions has been calculated using the Black-Scholes option pricing model. The fair value of options with market-related performance conditions has been measured using the Monte Carlo model. Expected volatility was determined by calculating the historical volatility of the Group’s share price over the 2.8 years (2016: 2.75 years) prior to the grant date. The risk-free rate of return was assumed to be the yield to maturity on a UK fi xed gilt with the term to maturity equal to the expected life of the option. At the discretion of the Remuneration Committee, award holders receive the value of dividends that would have been paid on their vested shares in the period between grant and vesting. Accordingly, there is no discount to the valuation for dividends foregone during the vesting period.
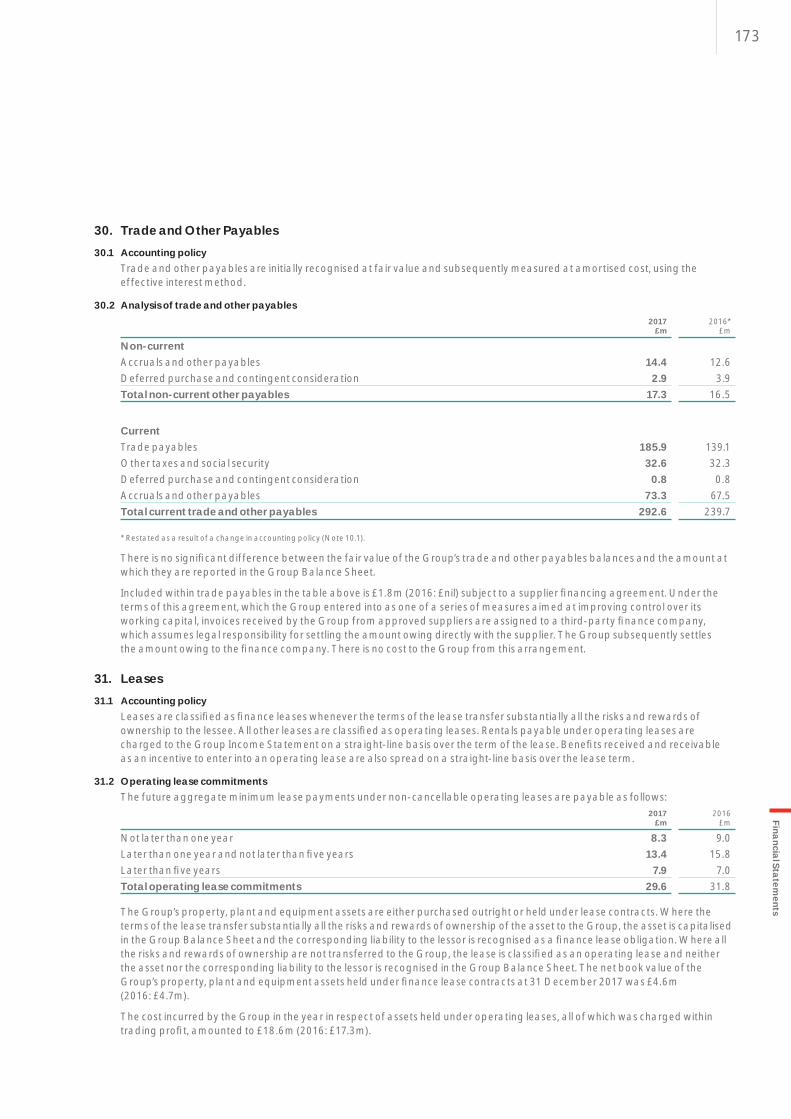
Financial Statements
173
30. Trade and Other Payables30.1 Accounting policy
Trade and other payables are initially recognised at fair value and subsequently measured at amortised cost, using the effective interest method.
30.2 Analysis of trade and other payables2017
£m2016*
£m
Non-currentAccruals and other payables 14.4 12.6Deferred purchase and contingent consideration 2.9 3.9Total non-current other payables 17.3 16.5
CurrentTrade payables 185.9 139.1Other taxes and social security 32.6 32.3Deferred purchase and contingent consideration 0.8 0.8Accruals and other payables 73.3 67.5Total current trade and other payables 292.6 239.7
* Restated as a result of a change in accounting policy (Note 10.1).
There is no signifi cant difference between the fair value of the Group’s trade and other payables balances and the amount at which they are reported in the Group Balance Sheet.
Included within trade payables in the table above is £1.8m (2016: £nil) subject to a supplier fi nancing agreement. Under the terms of this agreement, which the Group entered into as one of a series of measures aimed at improving control over its working capital, invoices received by the Group from approved suppliers are assigned to a third-party fi nance company, which assumes legal responsibility for settling the amount owing directly with the supplier. The Group subsequently settles the amount owing to the fi nance company. There is no cost to the Group from this arrangement.
31. Leases31.1 Accounting policy
Leases are classifi ed as fi nance leases whenever the terms of the lease transfer substantially all the risks and rewards of ownership to the lessee. All other leases are classifi ed as operating leases. Rentals payable under operating leases are charged to the Group Income Statement on a straight-line basis over the term of the lease. Benefi ts received and receivable as an incentive to enter into an operating lease are also spread on a straight-line basis over the lease term.
31.2 Operating lease commitmentsThe future aggregate minimum lease payments under non-cancellable operating leases are payable as follows:
2017£m
2016£m
Not later than one year 8.3 9.0Later than one year and not later than fi ve years 13.4 15.8Later than fi ve years 7.9 7.0Total operating lease commitments 29.6 31.8
The Group’s property, plant and equipment assets are either purchased outright or held under lease contracts. Where the terms of the lease transfer substantially all the risks and rewards of ownership of the asset to the Group, the asset is capitalised in the Group Balance Sheet and the corresponding liability to the lessor is recognised as a fi nance lease obligation. Where all the risks and rewards of ownership are not transferred to the Group, the lease is classifi ed as an operating lease and neither the asset nor the corresponding liability to the lessor is recognised in the Group Balance Sheet. The net book value of the Group’s property, plant and equipment assets held under fi nance lease contracts at 31 December 2017 was £4.6m (2016: £4.7m).
The cost incurred by the Group in the year in respect of assets held under operating leases, all of which was charged within trading profi t, amounted to £18.6m (2016: £17.3m).
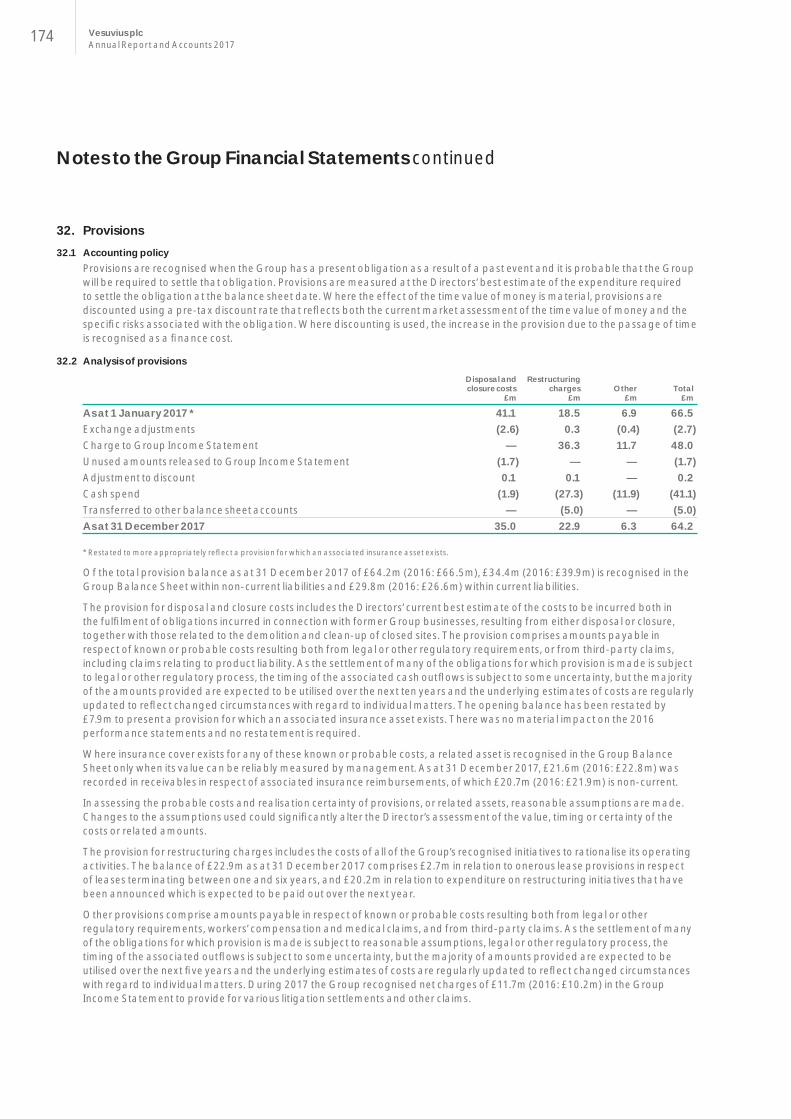
Notes to the Group Financial Statements continued
174 Vesuvius plcAnnual Report and Accounts 2017
32. Provisions32.1 Accounting policy
Provisions are recognised when the Group has a present obligation as a result of a past event and it is probable that the Group will be required to settle that obligation. Provisions are measured at the Directors’ best estimate of the expenditure required to settle the obligation at the balance sheet date. Where the effect of the time value of money is material, provisions are discounted using a pre-tax discount rate that refl ects both the current market assessment of the time value of money and the specifi c risks associated with the obligation. Where discounting is used, the increase in the provision due to the passage of time is recognised as a fi nance cost.
32.2 Analysis of provisions
Disposal andclosure costs
£m
Restructuringcharges
£mOther
£mTotal
£m
As at 1 January 2017 * 41.1 18.5 6.9 66.5Exchange adjustments (2.6) 0.3 (0.4) (2.7)Charge to Group Income Statement — 36.3 11.7 48.0Unused amounts released to Group Income Statement (1.7) — — (1.7)Adjustment to discount 0.1 0.1 — 0.2Cash spend (1.9) (27.3) (11.9) (41.1)Transferred to other balance sheet accounts — (5.0) — (5.0)As at 31 December 2017 35.0 22.9 6.3 64.2
* Restated to more appropriately refl ect a provision for which an associated insurance asset exists.
Of the total provision balance as at 31 December 2017 of £64.2m (2016: £66.5m), £34.4m (2016: £39.9m) is recognised in the Group Balance Sheet within non-current liabilities and £29.8m (2016: £26.6m) within current liabilities.
The provision for disposal and closure costs includes the Directors’ current best estimate of the costs to be incurred both in the fulfi lment of obligations incurred in connection with former Group businesses, resulting from either disposal or closure, together with those related to the demolition and clean-up of closed sites. The provision comprises amounts payable in respect of known or probable costs resulting both from legal or other regulatory requirements, or from third-party claims, including claims relating to product liability. As the settlement of many of the obligations for which provision is made is subject to legal or other regulatory process, the timing of the associated cash outfl ows is subject to some uncertainty, but the majority of the amounts provided are expected to be utilised over the next ten years and the underlying estimates of costs are regularly updated to refl ect changed circumstances with regard to individual matters. The opening balance has been restated by £7.9m to present a provision for which an associated insurance asset exists. There was no material impact on the 2016 performance statements and no restatement is required.
Where insurance cover exists for any of these known or probable costs, a related asset is recognised in the Group Balance Sheet only when its value can be reliably measured by management. As at 31 December 2017, £21.6m (2016: £22.8m) was recorded in receivables in respect of associated insurance reimbursements, of which £20.7m (2016: £21.9m) is non-current.
In assessing the probable costs and realisation certainty of provisions, or related assets, reasonable assumptions are made. Changes to the assumptions used could signifi cantly alter the Director’s assessment of the value, timing or certainty of the costs or related amounts.
The provision for restructuring charges includes the costs of all of the Group’s recognised initiatives to rationalise its operating activities. The balance of £22.9m as at 31 December 2017 comprises £2.7m in relation to onerous lease provisions in respect of leases terminating between one and six years, and £20.2m in relation to expenditure on restructuring initiatives that have been announced which is expected to be paid out over the next year.
Other provisions comprise amounts payable in respect of known or probable costs resulting both from legal or other regulatory requirements, workers’ compensation and medical claims, and from third-party claims. As the settlement of many of the obligations for which provision is made is subject to reasonable assumptions, legal or other regulatory process, the timing of the associated outfl ows is subject to some uncertainty, but the majority of amounts provided are expected to be utilised over the next fi ve years and the underlying estimates of costs are regularly updated to refl ect changed circumstances with regard to individual matters. During 2017 the Group recognised net charges of £11.7m (2016: £10.2m) in the Group Income Statement to provide for various litigation settlements and other claims.

Financial Statements
175
33. Off-Balance Sheet ArrangementsIn compliance with current reporting requirements, certain arrangements entered into by the Group in its normal course of business are not reported in the Group Balance Sheet. Of such arrangements, those considered material by the Directors are future lease payments in relation to assets used by the Group under non-cancellable operating leases (Note 31).
34. Contingent LiabilitiesGuarantees given by the Group under property leases of operations disposed of amounted to £1.1m (2016: £1.6m). Details of guarantees given by the Company, on behalf of the Group, are given in Note 10 to the Company Financial Statements.
Vesuvius has extensive international operations and is subject to various legal and regulatory regimes, including those covering taxation and environmental matters. Several of Vesuvius’ subsidiaries are parties to legal proceedings, certain of which are insured claims arising in the ordinary course of the operations of the company involved, and the Directors are aware of a number of issues which are, or may be, the subject of dispute with tax authorities. Provisions are made for the expected amounts payable in respect of known or probable costs resulting both from legal or other regulatory requirements, and from third-party claims.
Certain of Vesuvius’ subsidiaries are subject to lawsuits, predominantly in the US, relating to a small number of products containing asbestos manufactured prior to the acquisition of those subsidiaries by Vesuvius. These suits usually also name many other product manufacturers. To date, Vesuvius is not aware of there being any liability verdicts against any of these subsidiaries. A number of lawsuits have been withdrawn, dismissed or settled and the amount paid, including costs, in relation to this litigation has not had a material adverse effect on Vesuvius’ fi nancial position or results of operations.
As the settlement of many of the obligations for which reserve is made is subject to legal or other regulatory process, the timing and amount of the associated outfl ows is subject to some uncertainty (see Note 32 for further information).
35. Investments in Subsidiaries, Joint Ventures and Associates35.1 Investment in subsidiaries
A subsidiary is an entity over which the Group has control. The Group controls an entity when the Group is exposed to, or has rights to, variable returns from its involvement with the entity and can affect those returns through its power over the entity. Subsidiaries are fully consolidated from the date on which control is transferred to the Group.
The subsidiaries , joint ventures and associates of Vesuvius plc and the countries in which they are incorporated are set out below. With the exception of Vesuvius Holdings Limited, whose ordinary share capital was directly held by Vesuvius plc, the ordinary capital of the companies listed below was wholly owned by a Vesuvius plc subsidiary as at 31 December 2017.
Company legal name Registered offi ce address JurisdictionAdvent Process Engineering Inc.
333 Prince Charles Drive, Welland, Ontario, L3B 5P4, Canada
Canada (Ontario)
Avemis SAS Saint Symphorien Sur Coise (69590) au 2, Hotel d’Entreprises, ZI Grange Eglise, France
France
BMI Refractory Services Inc.
600 N 2nd Street, Suite 401, Harrisburg, PA 17101-1071, United States
US (Pennsylvania)
Brazil 1 Limited 165 Fleet Street, London, EC4A 2AE, England
England
Cookson Dominicana, SRL
Km 7 1/2, Autopista San Isidro, Edifi cio Modelo A, Zona Franca San Isidro, Santo Domingo Oeste, Dominican Republic
Dominican Republic
Cookson Investments (Jersey) Limited
13 Castle Street, St Helier, JE4 5UT, Jersey
Jersey
Cookson Jersey Limited
13 Castle Street, St Helier, JE4 5UT, Jersey
Jersey
East Moon Investment (HK Holding) Company Limited
36/F Tower Two Times Square, 1 Matheson Street, Causeway Bay, Hong Kong
Hong Kong
Company legal name Registered offi ce address Jurisdiction
Flo-Con Holding, Inc.
CT Corporation, 1209 Orange Street, The Corporation Trust Company, Wilmington, DE 19801, United States
US (Delaware)
Flo-Con Systems, LLC
CT Corporation, 208 South LaSalle Street, Chicago, Cook County, Illinois, IL 60604, United States
US (Illinois)
Foseco (FS) Limited
1 Midland Way, Central Park, Barlborough Links, Derbyshire, S43 4XA, England
England
Foseco (GB) Limited
165 Fleet Street, London, EC4A 2AE, England
England
Foseco (Jersey) Limited
44 Esplanade, St Helier, JE4 9WG, Jersey
Jersey
Foseco (MRL) Limited
165 Fleet Street, London, EC4A 2AE, England
England
Foseco (RUL) Limited
165 Fleet Street, London, EC4A 2AE, England
England
Foseco (UK) Limited
165 Fleet Street, London, EC4A 2AE, England
England
Foseco Canada Limited
181 Bay Street, Suite 1800, Toronto, Ontario, M5J 2T9, Canada
Canada (Ontario)
FosecoEspanola SA
5, Barrio Elizalde, Izurza, Bizkaia, 48213, Spain
Spain

Notes to the Group Financial Statements continued
176 Vesuvius plcAnnual Report and Accounts 2017
Company legal name Registered offi ce address Jurisdiction
Foseco Foundry (China) Limited
Room 819, Shekou Zhaoshang Building, Nanshan District, Shenzhen, China
China
Foseco Fundición Holding (Espanola), S.L.
5, Barrio Elizalde, Izurza, Bizkaia, 48213, Spain
Spain
Foseco Holding (Europe) Limited
165 Fleet Street, London, EC4A 2AE, England
England
Foseco Holding (South Africa) (Pty) Limited
12, Bosworth Street, Alrode, Aberton, 1449, South Africa
South Africa
Foseco Holding BV
165 Fleet Street, London, EC4A 2AE, England
Netherlands
Foseco Holding International Limited
165 Fleet Street, London, EC4A 2AE, England
England
Foseco Holding Limited
165 Fleet Street, London, EC4A 2AE, England
England
Foseco Industrial e Comercial Ltda
Km 15, Rodovia Raposo Tavares, Butanta Cep, São Paulo, 05577-100, Brazil
Brazil
Foseco International Holding (Thailand) Limited
170/69, 22nd Floor Ocean Tower 1, Ratchadapisek Road, Klongtoey, Bangkok, 10110, Thailand
Thailand
Foseco International Limited
1 Midland Way, Central Park, Barlborough Links, Derbyshire, S43 4XA, England
England
Foseco Japan Ltd 9th Floor, Orix Kobe Sannomiya Building, 6-1-10, Goko dori, Chuo-ku, Kobe Hyogo, 651-0087, Japan
Japan
Foseco KoreaLimited
74 Jeongju-ro, Wonmi-gu, Bucheon-si, Gyeonggi-do, 14523, South Korea
South Korea
Foseco Limited 165 Fleet Street, London, EC4A 2AE, England
England
Foseco Metallurgical Inc
CT Corporation, 1209 Orange Street, The Corporation Trust Company, Wilmington, DE 19801, United States
US (Delaware)
Foseco Nederland BV
Binnenhavenstraat 20, 7553 GJ Hengelo (OV), Netherlands
Netherlands
Foseco Overseas Limited
165 Fleet Street, London, EC4A 2AE, England
England
Foseco Pension Fund Trustee Limited
165 Fleet Street, London, EC4A 2AE, England
England
Foseco Philippines Inc
Unit 401, 4th Floor 8 Antonio Centre, Prime St. Madrigal Business Park 2, Ayala Alabang Muntinlupa City, Philippines
Philippines
Foseco Portugal Produtos para Fundiçâo Lda
Rua 25 de Abril, Lote 3, Aveleda – 4485-010 VCD, Vila do Conde, Portugal
Portugal
Foseco Pty Limited
7, Stuart Street, Padstow, NSW 2211, Australia
Australia
Foseco SAS Le Newton C, 7 Mail Barthélémy Thimonnier, 77185 Lognes, France
France
Company legal name Registered offi ce address Jurisdiction
Foseco Steel (Holdings) China Limited
165 Fleet Street, London, EC4A 2AE, England
England
Foseco Steel (UK) Limited
1 Midland Way, Central Park, Barlborough Links, Derbyshire, S43 4XA, England
England
Foseco Technology Limited
165 Fleet Street, London, EC4A 2AE, England
England
Foseco Transnational Limited
165 Fleet Street, London, EC4A 2AE, England
England
Foseco Vietnam Limited
R 717.1, Me Linh Point Tower, no 2 Ngo Duc Ke, Ben Nghe Ward, Dist 1, Ho Chi Minh, Vietnam
Vietnam
HGAC Participações Limitada
Street Duque de Caxias, 563 Room 2, Centro, Barueri, SP, 06401-010, Brazil
Brazil
ISID Limited Beaver House, 23-38 Hythe Bridge Street, Oxford, OX1 2EP, England
England
J.H. France Refractories Company
CT Corporation, 1209 Orange Street, The Corporation Trust Company, Wilmington, DE 19801, United States
US (Delaware)
John G. Stein & Company Limited
1 Midland Way, Central Park, Barlborough Links, Derbyshire, S43 4XA, England
England
Mainsail Insurance Company Limited
Canon’s Court, 22 Victoria Street, Hamilton, HM 12, Bermuda
Bermuda
Mascinco Empreendimentos e Participações Ltda
Avenida Brasil, 49550 - parte, Distrito Industrial de Palmares – Campo, Grande – Cep: 23065-480, Rio de Janeiro, RJ, Brazil
Brazil
Mastercodi Industrial Ltda
Avenida Giovanni Gronchi, 5174, suíte 11, Vila Andrade, 05724-002, São Paulo, State of São Paulo, Brazil
Brazil
Mercajoya, S.A. Capitán Haya, 56 - 1ºH, 28020 Madrid, Spain
Spain
Metal Way Equipamentos Metalurgicos Ltda
Estrada Santa Isabel, 7655 KM37, Bairro Do Una, Itaquaquecetuba, São Paulo – SP, CEP: 08580 000, Brazil
Brazil
Micro Jewels Limited
10 Frere Felix De Valois Street, Port Louis, Mauritius
Mauritius
Minerals Separation Limited
165 Fleet Street, London, EC4A 2AE, England
England
New Foseco (UK) Limited
1 Midland Way, Central Park, Barlborough Links, Derbyshire, S43 4XA, England
England
Premier Refractories (Belgium) S.A.
17 Rue de Douvrain, Ghlin, 7011, Belgium
Belgium
Process Metrix, LLC
6622 Owens Drive, Pleasanton, CA 94588, United States
US (California)
PT Foseco Indonesia
2/5, Jalan Rawagelam, Kawasan Industry, 2/No.5 Pulogadung, Jakarta Timur, 13930, Indonesia
Indonesia
PT Foseco Trading Indonesia
2/5, Jalan Rawagelam, Kawasan Industry, 2/No.5 Pulogadung, Jakarta Timur, 13930, Indonesia
Indonesia
35. Investments in Subsidiaries, Joint Ventures and Associates (continued)35.1 Investment in subsidiaries (continued)

Financial Statements
177
Company legal name Registered offi ce address Jurisdiction
Realisations 789, LLC
CT Corporation, 1209 Orange Street, The Corporation Trust Company, Wilmington, DE 19801, United States
US (Delaware)
S G Blair & Company Limited
1 Midland Way, Central Park, Barlborough Links, Derbyshire, S43 4XA, England
England
SERT-Metal SAS 3, Avenue de l’Europe, Parc, ‘Les Pivolles’, Decines-Charpieu 69150, France
France
SIDERMES Inc. 175, Calixa-Lavallée Verchêres, Québec J0L2R0, Canada
Canada
SIDERMES Latinoamericana CA
Zona Industrial, San Vicente Av., Anton Phillips Grupo Industrial, San Vicente Local 4, Maracay, Venezuela
Venezuela
SIDERMES S.A.
Urquiza 919 Piso 2 Rosario Santa Fe, Argentina, CP 2000
Argentina
SIDERMES S.p.A.
Via Mantova 10, 20835 Muggiò (MB), Italy
Italy
SIDERMES SENSORES TERMICOS DO BRASIL LTDA
Estrada Municipal PDD 436, S/N, Prédio ‘C’, Bairro da Boa Vista, Municipio de Piedade, Estado de São Paulo, Brazil
Brazil
SIR Feuerfestprodukte GmbH
Siegener Strasse 152, Kreuztal, D-57223, Germany
Germany
SOLED SAS Parc d’Activités, Belle Fontaine, 57780 Rosselange, France
France
Tamworth UK Limited
165 Fleet Street, London, EC4A 2AE, England
England
Thomas Marshall (Loxley) Limited
Beaver House, 23-38 Hythe Bridge Street, Oxford, OX1 2EP, England
England
Unicorn Industries Limited
165 Fleet Street, London, EC4A 2AE, England
England
Veservice Ltda Av Brasil, 49550, Distrito Industrial de Palmares, Campo Grande, Rio de Janeiro, 23065-480, Brazil
Brazil
Vesuvius (Thailand) Co., Ltd
170/69, 22nd Floor Ocean Tower 1, Ratchadapisek Road, Klongtoey, Bangkok, 10110, Thailand
Thailand
Vesuvius (V.E.A.R.) S.A.
Street Urquiza, 919,Floor 2, Rosario, Provincia de Santa Fé, Argentina
Argentina
Vesuvius Advanced Ceramics (China) Co., Ltd
221 Xing Ming Street, China-Singapore Suzhou Ind Park, Suzhou, Jiangsu Province, 215021, China
China
Vesuvius America, Inc.
1209 Orange Street, Wilmington, DE 19801, United States
US (Delaware)
Vesuvius Americas Holdings, Inc
Corporation Trust Center, 1209 Orange Street, Wilmington, New Castle County, DE 19801, United States
US (Delaware)
Vesuvius Australia (Holding) Pty Limited
40-46 Gloucester Boulevarde, Port Kembla, NSW, 2505, Australia
Australia
Vesuvius Australia Pty Ltd
40-46 Gloucester Boulevarde, Port Kembla, NSW, 2505, Australia
Australia
Vesuvius Belgium N.V.
Zandvoordestraat 366, Oostende, B-8400, Belgium
Belgium
Vesuvius Canada Inc
181 Bay Street, Suite 1800, Toronto, Ontario, M5J 2T9, Canada
Canada
Vesuvius Ceramics Limited
165 Fleet Street, London, EC4A 2AE, England
England
Company legal name Registered offi ce address Jurisdiction
Vesuvius China Holdings Co. Limited
Offi ce 813, 8/F, Paul Y centre, 51 Hung To Road, Kwun Tong, Kowloon, Hong Kong
Hong Kong
Vesuvius China Limited
165 Fleet Street, London, EC4A 2AE, England
England
Vesuvius Colombia SAS
Street 90, number 13 A - 31, fl oor 6, Bogota, Colombia
Colombia
Vesuvius Corporation S.A.
Salita delle Ginestre 10, Lugano Cassarate, CH 6900, Switzerland
Switzerland
Vesuvius Crucible Company
CT Corporation , 1209 Orange Street, The Corporation Trust Company, Wilmington, DE 19801, United States
US (Delaware)
Vesuvius CSD Sp z.o.o.
ul Pradnicka, nr 4, Krakow, 30-002, Poland
Poland
Vesuvius Emirates FZE
Warehouse No: 1J-09/3, P O Box 49261, Hamriyah Free Zone, Sharjah, United Arab Emirates
United Arab Emirates
Vesuvius Financial 1 Limited
165 Fleet Street, London, EC4A 2AE, England
England
Vesuvius Finland OY
Pajamäentie 10, 00360 Helsinki, Finland
Finland
Vesuvius Foundry Products (Suzhou) Co., Ltd.
12 Wei Wen Road, China-Singapore Suzhou Ind Park, Suzhou, Jiangsu Province, 215122, China
China
Vesuvius Foundry Technologies (Jiangsu) Co. Ltd
2 Changchun Road, Economic Development Area, Changshu, Jiangsu, China
China
Vesuvius France S.A.
Rue Paul Deudon 68, Boite Postale 19, Feignies 59750, France
France
Vesuvius GmbH Gelsenkirchener Strasse 10, Borken, D-46325, Germany
Germany
Vesuvius Group Limited
165 Fleet Street, London, EC4A 2AE, England
England
Vesuvius Group S.A. 17 Rue de Douvrain, Ghlin, 7011, Belgium
Belgium
Vesuvius Holding Deutschland GmbH
Gelsenkirchener Strasse 10, Borken, D-46325, Germany
Germany
Vesuvius Holding France S.A.S
68 Rue Paul Deudon, BP 19, Feignies 59750, France
France
Vesuvius Holding Italia - Società a Responsabilità Limitata
Piazza Borgo Pila 40, Genoa, Italy
Italy
Vesuvius Holdings Limited
165 Fleet Street, London, EC4A 2AE, England
England
Vesuvius Ibérica Refractarios S.A.
Capitán Haya, 56 - 1ºH, 28020 Madrid, Spain
Spain
Vesuvius International Corporation
CT Corporation, 1209 Orange Street, The Corporation Trust Company, Wilmington, DE 19801, United States
US (Delaware)
Vesuvius Investments Limited
165 Fleet Street, London, EC4A 2AE, England
England
Vesuvius Istanbul Sanayi ve Ticaret AS
Gebze OSB2 Mh. 1700., Sok No:1704/1, Cayirova, Kocaeli, 41420, Turkey
Turkey
Vesuvius Italia SPA Piazza Borgo Pila 40, Genoa, Italy ItalyVesuvius Japan Inc.
Daini-Naruse Akihabara Bldg. 3F, 27-10, 1-chome, Taito, Taito-ku, Tokyo, 110-0016, Japan
Japan

Notes to the Group Financial Statements continued
178 Vesuvius plcAnnual Report and Accounts 2017
Company legal name Registered offi ce address Jurisdiction
Vesuvius K.S.R. Limited
1 Midland Way, Central Park, Barlborough Links, Derbyshire S43 4XA, United Kingdom
England
Vesuvius Life Plan Trustee Limited
165 Fleet Street, London, EC4A 2AE, England
England
Vesuvius LLC 10, Ul. Kooperativnaya, Zhukovsky, Moscow, 140180, Russian Federation
Russia
Vesuvius Malaysia Sdn Bhd
Level 18, The Gardens North Tower, Mid Valley City, Lingkaran Syed Putra, Kuala Lumpur, 59200, Malaysia
Malaysia
Vesuvius Management Limited
165 Fleet Street, London, EC4A 2AE, England
England
Vesuvius Mexico S.A. de C.V.
Av. Ruiz Cortinez, Num. 140, Colonia Jardines de San Rafael, Guadalupe, Nuevo León, CP 67119, Mexico
Mexico
Vesuvius Mid-East Limited
56, rd 15, Apt 103, Maadi, Cairo, Egypt
Egypt
Vesuvius Minerals Limited
165 Fleet Street, London, EC4A 2AE, England
England
Vesuvius Moravia, s.r.l
Konska c.p. 740, Trinec, 739 61, Czech Republic
Czech Republic
Vesuvius New Zealand Limited
18 Cryers Road, East Tamaki, Auckland, New Zealand
New Zealand
Vesuvius OOO
Afanasyevsky, Pereulok 41 A, Moscow, Russia, 119019, Russian Federation
Russia
Vesuvius Overseas Investments Limited
165 Fleet Street, London, EC4A 2AE, England
England
Vesuvius Overseas Limited
165 Fleet Street, London, EC4A 2AE, England
England
Vesuvius Pension Plans Trustees Limited
165 Fleet Street, London, EC4A 2AE, England
England
Vesuvius Pigments (Holdings) Limited
165 Fleet Street, London, EC4A 2AE, England
England
Vesuvius Poland Spólka z.o.o
Ul Tyniecka 12, Skawina, 32-050, Poland
Poland
Vesuvius Ras Al Khaimah FZ-LLC
Street No. F14, RAK Investment Authority Free Zone, Al Hamra, Ras Al Khaimah, PO Box 86408, United Arab Emirates
United Arab Emirates
Vesuvius Refractarios de Chile SA
Street San Martin 870, Room 308, Tower B, Concepcion, Chile
Chile
Vesuvius Refractories (Tianjin) Co., Ltd
56, 13th Avenue, TEDA, Tianjin, 300457, China
China
Company legal name Registered offi ce address Jurisdiction
Vesuvius Refractories S.r.l.
Galati, Marea Unire avenue 107, Galati county, Romania
Romania
Vesuvius Refratários Ltda
Av Brasil, 49550, Distrito Industrial de Palmares, Campo Grande, Rio de Janeiro, 23065-480, Brazil
Brazil
Vesuvius Refractory India Private Limited
Room No. 9, 3rd Floor, 7 Ganesh Chandra Avenue, Kolkata, WB 700013, India
India
Vesuvius Scandinavia AB
4, Forradsgatan, Amal, S-662 34, Sweden
Sweden
Vesuvius Solar Crucible (Suzhou) Co., Ltd.
58, KuaChun Road, Kua Tang, China-Singapore Suzou Ind Park, Suzhou, Jiangsu Province, 215122, China
China
Vesuvius South Africa (Pty) Limited
Pebble Lane, Private Bag X2, Olifantsfontein, Gauteng Province, 1665, South Africa
South Africa
Vesuvius SSC Sp z.o.o.
ul Pradnicka, nr 4, Krakow, 30-002, Poland
Vesuvius UK Limited
1 Midland Way, Central Park, Barlborough Links, Derbyshire, S43 4XA, United Kingdom
England
Vesuvius Ukraine LLC
27, Udarnykiv Street, City of Dnipropetrovsk, Ukraine
Ukraine
Vesuvius USA Corporation
CT Corporation, 208 South LaSalle Street, Chicago, Cook County, IL 60604, United States
US (Illinois)
Vesuvius VA Limited 165 Fleet Street, London, EC4A 2AE, England
England
Vesuvius Zyalons Holdings Limited
Brown Street, Newmilns, Ayrshire, KA16 9AG, Scotland
Scotland
Vesuvius Zyarock Ceramics (Suzhou) Co., Ltd
58, KuaChun Road, Kua Tang, China-Singapore Suzou Ind Park, Suzhou, Jiangsu Province, 215122, China
China
Vesuvius-Premier Refractories (Holdings) Limited
1 Midland Way, Central Park, Barlborough Links, Derbyshire, S43 4XA, England
England
VSV Advanced Ceramics (Anshan) Co., Ltd
Xiaotaizi Village, Ningyuan Town, Qianshan District, Anshan, Liaoning Province, China
China
Wilkes-Lucas Limited
165 Fleet Street, London, EC4A 2AE, England
England
Yingkou Bayuquan Refractories Co., Ltd
Qing Long Shan Street, Bayuquan District, Liaoning Province, YingKou
China
35.2 Investment in joint ventures and associatesA joint venture is a type of joint arrangement whereby the parties that have joint control of the arrangement have rights to the net assets of the joint venture. Joint control is the contractually agreed sharing of control of the arrangement, which exists only when decisions about the relevant activities require unanimous consent of the parties sharing control. An associate is an entity over which the Group has signifi cant infl uence. Signifi cant infl uence is the power to participate in the fi nancial and operating policy decisions of an entity, but is not control or joint control over those policies.
35. Investments in Subsidiaries, Joint Ventures and Associates (continued)35.1 Investment in subsidiaries (continued)

Financial Statements
179
The Group’s investments in its associates and joint ventures are accounted for using the equity method from the date signifi cant infl uence/joint control is deemed to arise until the date on which signifi cant infl uence/joint control ceases to exist or when the interest becomes classifi ed as an asset held for sale. The Consolidated Income Statement refl ects the Group’s share of profi t after tax of the related associates and joint ventures. Investments in associates and joint ventures are carried in the Consolidated Balance Sheet at cost adjusted in respect of post-acquisition changes in the Group’s share of net assets, less any impairment in value.
2017£m
2016£m
At 1 January 18.0 16.1Additions 0.4 —Share of post-tax profi t of joint ventures 1.3 1.0Dividends received from joint ventures (1.7) (1.0)Foreign exchange (0.5) 1.9At 31 December 17.5 18.0
Joint venturesSet out below is the summarised fi nancial information in respect of joint ventures. Amounts relate to the Group’s share.
2017£m
2016£m
Revenue 53.9 44.6
Trading profi t 2.1 1.6Net fi nance costs 0.1 0.1Profi t before tax 2.2 1.6Income tax expense (0.9) (0.6)Profi t after tax 1.3 1.0
Non-current assets 5.9 7.6Current assets 41.7 42.0Non-current liabilities — —Current liabilities (30.8) (32.0)Net assets 16.8 17.6
The purpose of the Chinese joint venture companies is to research, develop, manufacture and sell refractory products. The role of Vesuvius is to provide technical personnel, training and access to the Group’s international sales network.
Name of entity Registered address Jurisdiction % ownership
Angang Vesuvius Refractory Company Ltd Taxi District, Anshan City, Liaoning Province, China China 50Wuhan Wugang-Vesuvius Advanced CCR Co., Ltd
Gongnong Village Qingshan District, Wuhan, Hubei Province, 430082, China
China 50
Wuhan Wugang-Vesuvius Advanced Ceramics Co., Ltd
Gongnong Village Qingshan District, Wuhan, Hubei Province, 430082, China
China 50
Beauvac Participações S/A Street Libero Badaro, 293, cj. 20D, São Paulo, Centro, 01009-000, Brazil
Brazil 50
INTAHSA SA Street Duque de Caxias 563, house 04, Room 01, Barueri, São Paulo, Centro, 06401-010, Brazil
Brazil 25
Newshelf 480 (Proprietary) Limited 44 Main Street, Johannesburg, 2001, South Africa
South Africa
45
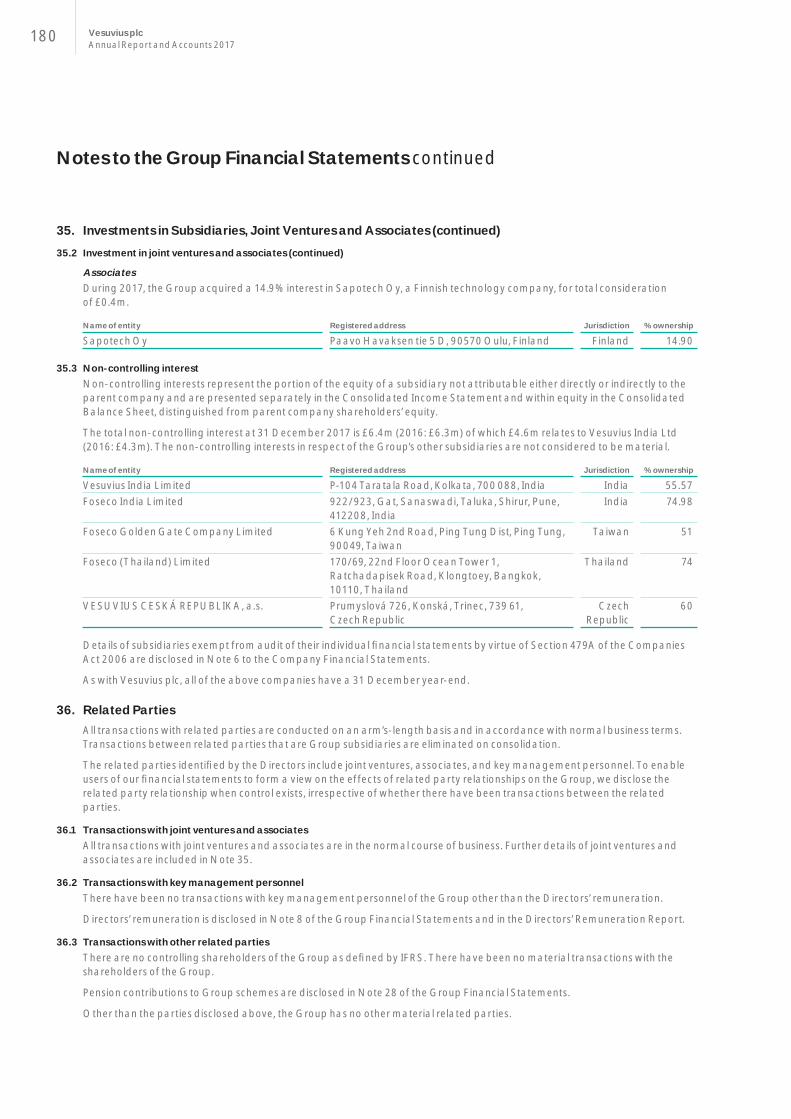
Notes to the Group Financial Statements continued
180 Vesuvius plcAnnual Report and Accounts 2017
35. Investments in Subsidiaries, Joint Ventures and Associates (continued)35.2 Investment in joint ventures and associates (continued)
AssociatesDuring 2017, the Group acquired a 14.9% interest in Sapotech Oy, a Finnish technology company, for total consideration of £0.4m.
Name of entity Registered address Jurisdiction % ownership
Sapotech Oy Paavo Havaksen tie 5 D, 90570 Oulu, Finland Finland 14.90
35.3 Non-controlling interest Non-controlling interests represent the portion of the equity of a subsidiary not attributable either directly or indirectly to the parent company and are presented separately in the Consolidated Income Statement and within equity in the Consolidated Balance Sheet, distinguished from parent company shareholders’ equity.
The total non-controlling interest at 31 December 2017 is £6.4m (2016: £6.3m) of which £4.6m relates to Vesuvius India Ltd (2016: £4.3m). The non-controlling interests in respect of the Group’s other subsidiaries are not considered to be material.
Name of entity Registered address Jurisdiction % ownership
Vesuvius India Limited P-104 Taratala Road, Kolkata, 700 088, India India 55.57Foseco India Limited 922/923, Gat, Sanaswadi, Taluka, Shirur, Pune,
412208, IndiaIndia 74.98
Foseco Golden Gate Company Limited 6 Kung Yeh 2nd Road, Ping Tung Dist, Ping Tung, 90049, Taiwan
Taiwan 51
Foseco (Thailand) Limited 170/69, 22nd Floor Ocean Tower 1, Ratchadapisek Road, Klongtoey, Bangkok, 10110, Thailand
Thailand 74
VESUVIUS CESKÁ REPUBLIKA, a.s. Prumyslová 726, Konská, Trinec, 739 61, Czech Republic
Czech Republic
60
Details of subsidiaries exempt from audit of their individual fi nancial statements by virtue of Section 479A of the Companies Act 2006 are disclosed in Note 6 to the Company Financial Statements.
As with Vesuvius plc, all of the above companies have a 31 December year-end.
36. Related PartiesAll transactions with related parties are conducted on an arm’s-length basis and in accordance with normal business terms. Transactions between related parties that are Group subsidiaries are eliminated on consolidation.
The related parties identifi ed by the Directors include joint ventures, associates, and key management personnel. To enable users of our fi nancial statements to form a view on the effects of related party relationships on the Group, we disclose the related party relationship when control exists, irrespective of whether there have been transactions between the related parties.
36.1 Transactions with joint ventures and associates All transactions with joint ventures and associates are in the normal course of business. Further details of joint ventures and associates are included in Note 35.
36.2 Transactions with key management personnelThere have been no transactions with key management personnel of the Group other than the Directors’ remuneration.
Directors’ remuneration is disclosed in Note 8 of the Group Financial Statements and in the Directors’ Remuneration Report.
36.3 Transactions with other related parties There are no controlling shareholders of the Group as defi ned by IFRS. There have been no material transactions with the shareholders of the Group.
Pension contributions to Group schemes are disclosed in Note 28 of the Group Financial Statements.
Other than the parties disclosed above, the Group has no other material related parties.
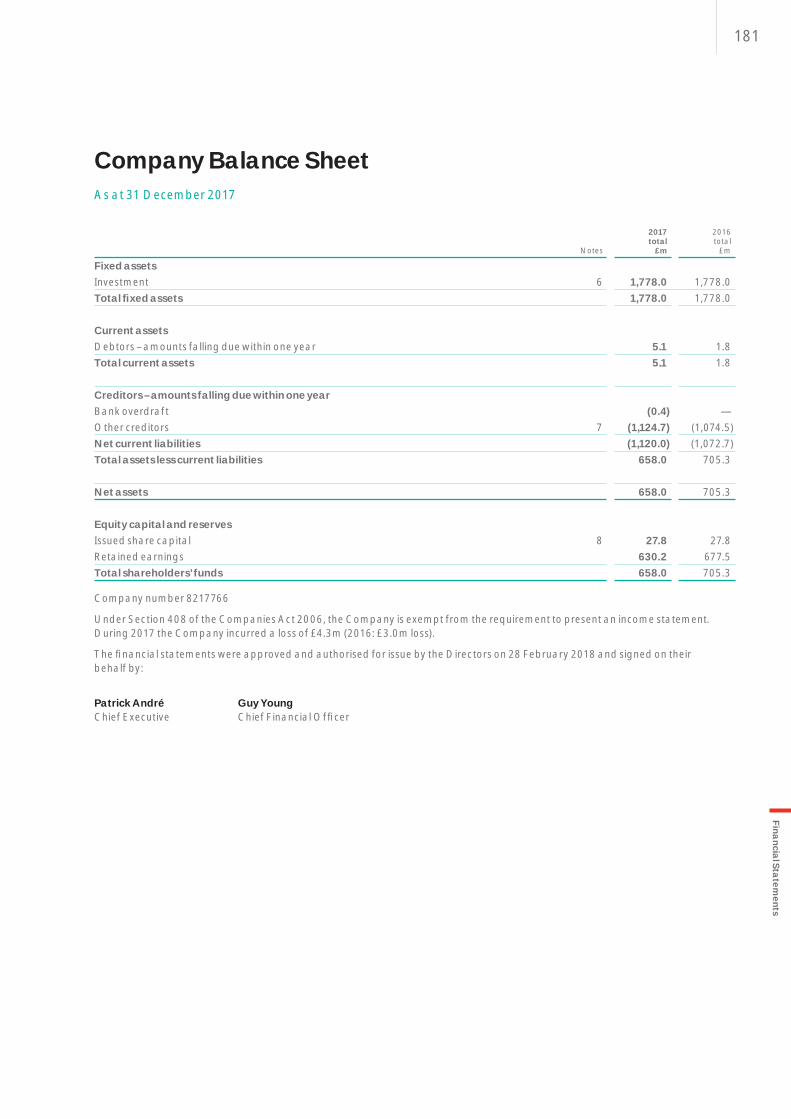
181Financial Statem
ents
Notes
2017total
£m
2016total
£m
Fixed assetsInvestment 6 1,778.0 1,778.0Total fi xed assets 1,778.0 1,778.0
Current assetsDebtors – amounts falling due within one year 5.1 1.8Total current assets 5.1 1.8
Creditors – amounts falling due within one yearBank overdraft (0.4) —Other creditors 7 (1,124.7) (1,074.5)Net current liabilities (1,120.0) (1,072.7)Total assets less current liabilities 658.0 705.3
Net assets 658.0 705.3
Equity capital and reservesIssued share capital 8 27.8 27.8Retained earnings 630.2 677.5Total shareholders’ funds 658.0 705.3
Company number 8217766
Under Section 408 of the Companies Act 2006, the Company is exempt from the requirement to present an income statement. During 2017 the Company incurred a loss of £4.3m (2016: £3.0m loss).
The fi nancial statements were approved and authorised for issue by the Directors on 28 February 2018 and signed on their behalf by:
Patrick André Guy YoungChief Executive Chief Financial Offi cer
Company Balance SheetAs at 31 December 2017

182 Vesuvius plcAnnual Report and Accounts 2017
Share capital
£m
Retained earnings
£mTotal
£m
As at 1 January 2016 27.8 722.7 750.5Loss recognised for the year — (3.0) (3.0)Recognition of share-based payments — 1.7 1.7Dividend paid — (43.9) (43.9)As at 1 January 2017 27.8 677.5 705.3Loss recognised for the year — (4.3) (4.3)Recognition of share-based payments — 2.6 2.6Dividend paid — (45.6) (45.6)As at 31 December 2017 27.8 630.2 658.0
The Company had distributable reserves of £630.2m as at 31 December 2017 (2016: £677.5m).
Company Statement of Changes in EquityAs at 31 December 2017

183Financial Statem
ents
1. General InformationVesuvius plc (‘Vesuvius’ or ‘the Company’) is a public company limited by shares. It is incorporated and domiciled in England and Wales and listed on the London Stock Exchange. The nature of the company is a holding company. The address of its registered offi ce is 165 Fleet Street, London EC4A 2AE.
2. Basis of Preparation2.1 Basis of accounting
The fi nancial statements of the Company have been prepared in accordance with Financial Reporting Standard 101, Reduced Disclosure Framework (FRS 101) and the Companies Act 2006. The fi nancial statements have been prepared under the historical cost convention.
In these fi nancial statements, the Company has applied the exemptions available under FRS 101 in respect of the following disclosures:
> A cash fl ow statement and related notes
> Disclosures in respect of transactions with wholly owned subsidiaries
> Disclosures in respect of capital management
> The effects of new but not yet effective IFRSs
> Disclosures in respect of the compensation of key management personnel
Under Section 408 of the Companies Act 2006, the Company is exempt from the requirement to present its own profi t and loss account.
The accounting policies set out below have, unless otherwise stated, been applied consistently to all periods presented in these fi nancial statements. There were no identifi ed critical accounting estimates or judgements.
2.2 Going concernThe Directors have a reasonable expectation that the Group and the Company have adequate resources to continue in operational existence for period of at least 12 months from the date of signing of these accounts. Accordingly, they continue to adopt a going concern basis in preparing the fi nancial statements of the Group and the Company.
2.3 Accounting policy
TaxationBoth current and deferred tax are calculated using tax rates and laws that have been enacted, or substantively enacted, by the balance sheet date.
Current tax payable is based on the taxable result for the year. Deferred taxation is recognised, without discounting, in respect of all timing differences that have originated, but not reversed, at the balance sheet date, with the exception that deferred taxation assets are only recognised if it is considered more likely than not that there will be suitable future profi ts from which the reversal of the underlying timing differences can be deducted. Provision is made for the tax that would arise on remittance of the retained earnings of overseas subsidiaries only to the extent that, at the balance sheet date, dividends have been accrued as receivable.
All other accounting policies are set out within the respective notes.
3. Employee Benefi ts Expense2017
£m2016
£m
Wages & Salaries 3.7 2.4Social security costs 0.6 0.4Share-based payments 0.7 0.6Pension costs – defi ned contribution pension plans — 0.1Total employee benefi ts expense 5.0 3.5
The total average number of employees for 2017 was 3 (2016: 3). As at 31 December, the Company had 4 employees.
Details of the Directors’ remuneration are disclosed in the Directors’ Remuneration Report.
Notes to the Company Financial Statements

184 Vesuvius plcAnnual Report and Accounts 2017
Notes to the Company Financial Statements continued
4. Audit and Non-Audit FeesAmounts payable to PricewaterhouseCoopers LLP in relation to audit and non-audit fees are disclosed within Note 6 to the Consolidated Financial Statements.
5. DividendsA fi nal dividend for the year ended 31 December 2016 of £30.8m (2015: £30.0m), equivalent to 11.40 pence (2015: 11.125 pence) per ordinary share, was paid in May 2017 (May 2016) and an interim dividend for the year ended 31 December 2017 of £14.8m (2016: £13.9m), equivalent to 5.50 pence (2016: 5.15 pence) per ordinary share, was paid in September 2017 (September 2016).
A proposed fi nal dividend for the year ended 31 December 2017 of £33.8m (2016: £30.8m), equivalent to 12.5 pence per ordinary share (2016: 11.40 pence), is subject to approval by shareholders at the Company’s Annual General Meeting and has not been included as a liability in these fi nancial statements. If approved by shareholders, the dividend will be paid on 25 May 2018 to ordinary shareholders on the register at 13 April 2018.
6. Investment in Subsidiaries, Associates and Joint Ventures6.1 Accounting policy
Shares in subsidiaries, associates and joint ventures are stated at cost less any impairment in value.
6.2 Analysis of investment in subsidiaries, associates and joint venturesShares in
subsidiaries£m
As at 1 January 2017 and 31 December 2017 1,778.0
The subsidiaries, joint ventures and associates of Vesuvius plc, their country of incorporation and % ownership is set out in Note 35 of the Notes to the Group Financial Statements. With the exception of Vesuvius Holdings Ltd, whose ordinary share capital was directly held by Vesuvius plc, the ordinary share capital of the other companies was owned by a Vesuvius plc subsidiary as at 31 December 2017.
6.3 Audit-exempt subsidiariesThe following UK subsidiaries are exempt from audit of their individual fi nancial statements by virtue of Section 479A of the Companies Act 2006.
Brazil 1 Limited John G. Stein & Company LimitedFoseco Limited S G Blair & Company LimitedFoseco Technology Limited Vesuvius China LimitedFoseco Transnational Limited Vesuvius Group LimitedFoseco (FS) Limited Vesuvius Minerals LimitedFoseco (GB) Limited Vesuvius Pigments (Holdings) LimitedFoseco Steel (Holdings) China Limited Vesuvius-Premier Refractories (Holdings) LimitedFoseco (UK) Limited Vesuvius VA Limited
7. Other Creditors2017
£m2016
£m
Amounts owned to subsidiary undertakings 1,122.4 1,073.2Accruals and other creditors 2.3 1.3Total amounts falling due within one year 1,124.7 1,074.5
Amounts owed to subsidiary undertakings are interest free, have no fi xed date of repayment and are repayable on demand.

185Financial Statem
ents
8. Issued Share Capital8.1 Accounting policy
Equity instruments issued by the Company are recorded at the proceeds received, net of direct issue costs.
8.2 Analysis of issued share capitalThe issued and fully paid ordinary share capital of the Company as at 31 December 2017 was 278.5 million shares of £0.10 each (2016: 278.5 million shares of £0.10 each). Of this, 7.3 million (2016: 7.3 million) shares were held in Treasury and 0.9 million (2016: 1.1 million) shares were held by the Vesuvius Group employee share ownership plan trust (ESOP). The Company only has one class of shares in issue, ordinary shares. All shareholders enjoy the same rights in relation to these shares, including rights in relation to voting at General Meetings of the Company, distribution of dividends and repayment of capital.
9. Share-based Payments9.1 Accounting policy
The Company operates equity-settled share-based payment arrangements for its employees. Equity-settled share-based payments are measured at fair value at the date of grant. The fair value determined at the grant date takes account of the effect of market-based conditions, such as the total shareholder return target upon which vesting for some of the awards is conditional, and is expensed on a straight-line basis over the vesting period with a corresponding increase in equity. The cumulative expense recognised is adjusted for the best estimate of the shares that will eventually vest and for the effect of other non-market-based vesting conditions, such as growth in headline earnings per share, which are not included in the fair value determined at the date of grant. For grants with market-based conditions attaching to them, fair value is measured using a form of stochastic option pricing model. For all other grants, fair value is measured using the Black-Scholes option pricing model.
9.2 Profi t and loss account recognitionThe Company operates a number of different share-based payment schemes, the main features of which are detailed between pages 99 to 105 of the Directors’ Remuneration Report. A total of £0.7m was charged to the profi t and loss account in the year with regard to share-based payments (2016: £0.5m).
9.3 Details of outstanding options
Outstanding awards
As at1 Jan2017
no.Granted
no.Exercised
no.
Forfeited/lapsed
no.
As at31 Dec
2017no.
Awardsexercisable
as at31 Dec
2017no.
Weightedaverage
outstandingcontractual
life ofawards
years
Range ofexercise
pricespence
LTIP 1,156,560 409,453 — (631,095) 934,918 — 4.8 n/aWeighted average exercise price nil nil nil nil nil — n/aOther plans 8,557 — (8,557) — — — — n/aWeighted average exercise price nil nil nil nil nil — n/a
For options exercised during 2017 included in ‘Other plans’, the share price at the date of exercise was 592 pence.
Outstanding awards
As at1 Jan2016
no.Granted
no.Exercised
no.
Forfeited/lapsed
no.
As at31 Dec
2016no.
Awardsexercisable
as at31 Dec
2016no.
Weightedaverage
outstandingcontractual
life ofawards
years
Range ofexercise
pricespence
LTIP 916,163 581,901 — (341,504) 1,156,560 — 8.5 n/aWeighted average exercise price nil nil nil nil nil — n/aOther plans 82,261 — (51,859) (21,845) 8,557 — 0.8 n/aWeighted average exercise price nil nil nil nil nil — n/a
For options exercised during 2016 included in ‘Other plans’, the share price at the date of exercise was 333 pence.

186 Vesuvius plcAnnual Report and Accounts 2017
Notes to the Company Financial Statements continued
9. Share-based Payments (continued)9.3 Details of outstanding options (continued)
Details of market performance conditions are included in the Directors’ Remuneration Report.
As at 31 December 2017, the total options exercisable by all Group employees over the £0.10 ordinary shares and capable of being satisfi ed through new allotments of shares or through shares held by the Company’s ESOP were as follows:
Years ofaward/grant
Optionprices (£)
Latest yearof exercise/
vesting
Numberof options/allocations
outstanding
Long Term Incentive Plan 2015–2017 nil 2017/2027 2,280,093Medium Term Incentive Plan 2016–2017 nil 2019 141,302Restricted rights 2016–2017 nil 2018/2020 11,135
Fair value of options granted under the LTIP during the year:
2017 (March Grant) 2017 (Sept Grant) 2016
EPSelement
TSRelement
EPSelement
TSRelement
EPSelement
TSRelement
Fair value of options granted (per share) 524.5p 401.0p 578.0p 467.0p 292.0p 112.0pShare price on date of grant (per share) 524.5p 524.5p 578.0p 578.0p 292.0p 292.0pExpected volatility n/a 30.90% n/a 33.00% n/a 26.00%Risk-free interest rate n/a 0.17% n/a 0.16% n/a 0.40%Exercise price (per share) nil nil nil nil nil nilExpected term (years) 3 3 3 3 4 4Expected dividend yield nil nil nil nil n/a n/a
The fair value of share options with non-market performance conditions has been calculated using the Black-Scholes option pricing model. The fair value of options with market-related performance conditions has been measured using the Monte Carlo model. Expected volatility was determined by calculating the historical volatility of the Group’s share price over the 2.8 years (2016: 2.75 years) prior to the grant date. The risk-free rate of return was assumed to be the yield to maturity on a UK fi xed gilt with the term to maturity equal to the expected life of the option. At the discretion of the Remuneration Committee, award holders receive the value of dividends that would have been paid on their vested shares in the period between grant and vesting. Accordingly, there is no discount to the valuation for dividends foregone during the vesting period.
10. Contingent LiabilitiesWhere the Company enters into fi nancial guarantee contracts to guarantee the indebtedness of other companies within its Group, the Company considers these to be insurance arrangements and accounts for them as such. In this respect, the Company treats the guarantee contract as a contingent liability until such time as it becomes probable that the Company will be required to make a payment under the guarantee. Guarantees provided by the Company as at 31 December 2017 in respect of the liabilities of its subsidiary companies amounted to £563.4m (2016: £569.4m), which includes guarantees of $200.0m and €130.0m (2016: $310.0m and €30.0m) in respect of US Private Placement Loan Notes and £146.3m (2016: £141.7m) in respect of drawings under the syndicated bank facility; together with £150.8m (2016: £150.8m) in relation to a guarantee provided to the Company’s UK subsidiary which acts as Trustee for the Group’s UK pension plan. The guarantee is over all present and future pension liabilities of the plan and the contingent liability amount represents the net defi cit on a buy-out basis as shown in the most recent triennial valuation.
Vesuvius has extensive international operations and is subject to various legal and regulatory regimes, including those covering taxation and environmental matters. Several of the Company’s subsidiaries are parties to legal proceedings, certain of which are insured claims arising in the ordinary course of the operations of the company involved, and are aware of a number of issues which are, or may be, the subject of dispute with tax authorities. Whilst the outcome of litigation and other disputes can never be predicted with certainty, having regard to legal advice received and the insurance arrangements of the Company and its subsidiaries, the Directors believe that none of these matters will, either individually or in the aggregate, have a materially adverse effect on the Company’s fi nancial condition or results of operations.

187Financial Statem
ents
11. Related PartiesAll transactions with related parties are conducted on an arm’s-length basis and in accordance with normal business terms. Transactions between related parties that are wholly owned Company subsidiaries are not disclosed in this Note.
The related parties identifi ed by the Directors include joint ventures, associates and key management personnel. To enable users of our fi nancial statements to form a view on the effects of related party relationships on the Company, we disclose the related party relationship when control exists, irrespective of whether there have been transactions between the related parties.
Transactions with joint ventures and associatesAll transactions with joint ventures and associates are in the normal course of business. Further details of joint ventures and associates is included in Note 35 of the Notes to the Group Financial Statements.
Transactions with key management personnelThere have been no transactions with key management personnel of the Company other than the Directors’ remuneration.
Directors’ remuneration is disclosed in the Annual Report on Directors’ Remuneration.
Transactions with other related partiesThere are no controlling shareholders of the Company as defi ned by IFRS. There have been no material transactions with the shareholders of the Company.
Pension contributions are disclosed in Note 28 of the Group Financial Statements.
Other than the parties disclosed above, the Company has no other material related parties.

188 Vesuvius plcAnnual Report and Accounts 2017
2017 2016 2015 2014 2013
Steel DivisionRevenue £m 1,148.7 942.0 897.6 981.4 1,017.5Trading profi t £m 100.4 79.2 79.5 96.4 88.7Return on sales % 8.7 8.4 8.9 9.8 8.7Employees: year-end no. 7,930 7,782 7,783 8,349 7,524Foundry DivisionRevenue £m 535.2 459.4 424.4 463.0 493.0Trading profi t £m 65.1 54.1 44.5 46.4 51.3Return on sales % 12.2 11.8 10.5 10.0 10.4Employees: year-end no. 3,080 3,058 3,129 3,443 3,330
Five-Year Summary: Divisional Results from Continuing Operations
189Financial Statem
ents
Shareholder Information
EnquiriesThe share register is managed by Equiniti, who can be contacted regarding shareholding queries.
Equiniti Limited Aspect House, Spencer Road Lancing, West Sussex BN99 6DA Tel (UK only) 0371 384 2335 Tel (non-UK) +44 121 415 7047
For the hard of hearing, Equiniti offers a Textel service which can be accessed by dialling 0371 384 2255 (or +44 121 415 7028 if calling from outside the UK).
Any shareholder enquiries not related to the share register should be sent by email to [email protected] or by letter to the Company Secretary at the registered offi ce.
Registered Offi ce and Group Head Offi ceVesuvius plc 165 Fleet Street London EC4A 2AE Tel +44 (0)20 7822 0000 Fax +44 (0)20 7822 0100 Registered in England and Wales No. 8217766
LEI: 213800ORZ521W585SY02
Vesuvius WebsiteShareholder and other information about the Company, including details of the current and historical share price, can be accessed on the Vesuvius website www.vesuvius.com.
Shareview and Electronic CommunicationEquiniti’s website www.shareview.co.uk enables shareholders to access details of their shareholdings online. The website provides answers to frequently asked questions and information useful for the management of investments. To access online information on your shareholding, you will require your shareholder reference number, which can be found at the top of your share certifi cate.
Shareholders can register to receive shareholder communications electronically, including the Company’s Annual Report and Accounts, rather than in paper form, using Shareview. The registration process requires shareholders to input their shareholder reference number (which can be found at the top of Vesuvius’ share certifi cates). In order to receive shareholder communications in electronic form, shareholders should select ‘email’ as their mailing preference. Once registered, shareholders will receive an email notifying them each time a shareholder communication has been published on the Vesuvius website.
Share Dealing ServiceThe Company’s shares can be traded through most banks, building societies or stockbrokers. UK resident shareholders can also buy and sell shares online or by telephone using Equiniti’s Shareview dealing service by either logging on to www.shareview.co.uk/dealing or by calling 0345 603 7037 between 8.00 am and 4.30 pm on any business day (excluding bank holidays). The shareholder reference number (found at the top of Vesuvius’ share certifi cates) is required to use the dealing facility.
ShareGiftShareGift, the charity share donation scheme, is a free service for shareholders wishing to give shares to charitable causes. It is particularly useful for those shareholders who may wish to dispose of a small quantity of shares where the market value makes it uneconomic to sell on a commission basis. Further information can be obtained from ShareGift’s website at www.sharegift.org; telephone +44 (0)20 7930 3737 or by emailing [email protected].
Dividend Reinvestment PlanEquiniti offers a dividend reinvestment plan, through which shareholders can use any cash dividends declared to buy additional shares in Vesuvius. Further details, including how to sign up, and the terms and conditions of the plan, are available from Equiniti by calling the Share Dividend Helpline on 0371 384 2268 (or +44 121 415 7173 if calling from outside the UK).
Overseas Payment ServiceEquiniti provides a dividend payment service in over 90 countries that automatically converts payments into local currency and pays the funds into a shareholder’s bank account. Further details, including an application form and the terms and conditions of the service, are available at www.shareview.co.uk or from Equiniti by calling +44 (0)121 415 7047 or writing to Equiniti, Aspect House, Spencer Road, Lancing, West Sussex BN99 6DA, United Kingdom (please quote Overseas Payment Service, the Company’s name and your shareholder reference number).
Financial Calendar2018 Annual General Meeting 10 May 2018
Announcement of 2018 half-year results 26 July 2018

190 Vesuvius plcAnnual Report and Accounts 2017
Analysis of ordinary shareholdersInvestor type Shareholdings
As at 31 December 2017 PrivateInstitutional
and other Total 1–1,000 1,001– 50,000 50,001– 500,000 500,001+
Number of holders 2,566 600 3,166 2,468 498 132 68Percentage of holders 81.05% 18.95% 100% 77.95% 15.73% 4.17% 2.15%Percentage of shares held 0.92% 99.08% 100% 0.13% 1.61% 8.26% 90.00%
Share Fraud – Spot the Warning SignsInvestment scams are designed to look like genuine investments.
Have you been…
> Contacted out of the blue
> Promised tempting returns and told the investment is safe
> Called repeatedly
> Told the offer is only available for a limited time?
If so, you might have been contacted by fraudsters.
How to Avoid Share Fraud
1. Reject cold callsIf you have been contacted by telephone, email or post, or via a third party or at a seminar or exhibition, with an offer to buy or sell shares, the chances are that it’s a high-risk investment or a scam. You should treat any offer with extreme caution. The safest thing to do is to ignore the approach and if you were contacted by phone to hang up on the call.
2. Check if the fi rm is authorised by the Financial Conduct Authority (FCA) and recorded on the Financial Services register at www.fca.org.uk/register The Financial Services Register is a public record of all the fi rms and individuals in the fi nancial services industry that are, or have been, regulated by the Prudential Regulation Authority and/or the FCA.
3. Get impartial advice Think about getting impartial fi nancial advice before you hand over any money. Seek advice from someone unconnected to the fi rm that has approached you.
Reporting a Scam If you suspect that you have been approached by fraudsters please tell the FCA by contacting them on 0800 111 6768 (or +44 20 7066 1000 from outside the UK) or by using the share fraud reporting form at www.fca.org.uk/scams, where you can fi nd out more about investment scams.
If you have lost money to investment fraud, you should report it to Action Fraud on 0300 123 2040 or online at www.actionfraud.police.uk.
Find out more at www.fca.org.uk/scamsmart.
Shareholder Information continued

Designed and produced by Friend. www.friendstudio.com Print: Pureprint Group
This report has been printed on Claro Bulk which is FSC® certifi ed and made from 100% Elemental Chlorine Free (ECF) pulp. The mill and the printer are both certifi ed to ISO 14001 environmental management system and registered to EMAS the eco management Audit Scheme. The report was printed using vegetable based inks by a CarbonNeutral® printer.
5S Five Steps to improve housekeeping and therefore workplace safety and effi ciency: separate, sort, shine, standardise and sustain
8D Eight Disciplines: an eight-step methodology to resolve customer, supplier and internal quality issues
AGM Annual General MeetingCIS Commonwealth of Independent States
(Russian Commonwealth)CO2 Carbon dioxideCO2e Carbon dioxide equivalent
Company Vesuvius plcDSBP Deferred Share Bonus PlanDTR The Disclosure and Transparency Rules of the
UK Financial Conduct Authority EBITDA Trading profi t before depreciation and
amortisation of non-acquired intangible chargesEMEA Europe, Middle East and AfricaEPS Earnings per shareEU European UnionFRC Financial Reporting CouncilFRS Financial Reporting StandardsFTSE 250 Equity index whose constituents are the
101st to 350th largest companies listed on the London Stock Exchange in terms of their market capitalisation
FX Foreign exchange
GHG Greenhouse gasGroup Vesuvius plc and its subsidiary companiesIAS International Accounting StandardIFRS International Financial Reporting StandardsKPI Key Performance IndicatorLTI Lost time injuryLTIFR Lost time injury frequency rate, a KPI which
calculates the number of LTIs per million hours worked
Median The middle number in a sorted list of numbersNAFTA The area to which the North American Free
Trade Agreement applies OEMs Original Equipment ManufacturersOrdinary share
An ordinary share of 10 pence in the capital of the Company
R&D Research and developmentTSR Total shareholder returnTurboS The Vesuvius safety training programme UK GAAP UK Generally Accepted Accounting PrinciplesVSP Vesuvius Share Plan
Glossary

Vesuvius plc165 Fleet StreetLondonEC4A 2AE
T +44 (0)20 7822 0000www.vesuvius.com