Embed Size (px)
Citation preview

Building the Forex Traders
Foundation
Greg Michalowski Email: [email protected] www.livestream.com/FXDD Twitter: gregmikefx

High Risk Warning: All news, opinions, research, data, or other information contained within this presentation are provided as general market commentary and do not constitute investment advice. FXDD expressly disclaims any liability for any lost principal or profits without limitation which may arise directly or indirectly from the use of or reliance on such information.
ADVISORY WARNING: FXDD provides sources of economic and market information during this broadcast as an educational service to its clients and prospects. The opinions or recommendations expressed during the broadcast are not intended as investment advice and are based on data reasonably believed to be accurate at the time of publication. Clients and prospects are advised to carefully consider the opinions and analysis offered in the context of your individual analysis and decision making. None of the statements of opinions or recommendations are to be considered as constituting a track record. Past performance is no guarantee of futures results and FXDD specifically advises clients and prospects to carefully review all claims and representations made during the broadcast in light of your particular analysis, trading style and objectives. All news, opinions, research, data, or other information contained within this website is provided as general market commentary and does not constitute investment or trading advice. FXDD expressly disclaims any liability for any lost principal or profits without limitation which may arise directly or indirectly from the use of or reliance on such information. As with all such advisory services, past results are never a guarantee of future results.
Disclaimer Di
scla
imer

Greg Michalowski • 28 years of market experience • 10 years with Citibank NY/London
as an interest rate derivatives trader
• 5 years with Credit Suisse First Boston as a trader
• Been with FXDD since Day 1 (2001) • Author: “Attacking Currency
Trends” (4.7 stars on Amazon.com) • Regular contributor on FXStreet • Quoted in the WSJ, Bloomberg,
Reuters, etc. • > 14,000 followers on Twitter.
www.twitter.com/gregmikefx
Who am I
EMAIL: [email protected] Commentary at
www.livestream.com/fxdd

Building the FOUNDATION for Trade Entry

VS.
More Important? REWARD or RISK
“I sold the EURUSD at 1.3525.
I am TARGETING 1.3475”
“I sold the EURUSD at 1.3525.
my STOP is at 1.3550”

Focusing on RISK is more important
“I sold the EURUSD at 1.3525.
I am targeting 1.3575”
“I sold the EURUSD at 1.3525.
my stop is at 1.3550”

Traders who focus on TARGETING
REWARD are saying RISK is potentially
UNLIMITED.
Targeting Reward = Risk Unlimited
UNLIMITED
LIMITED
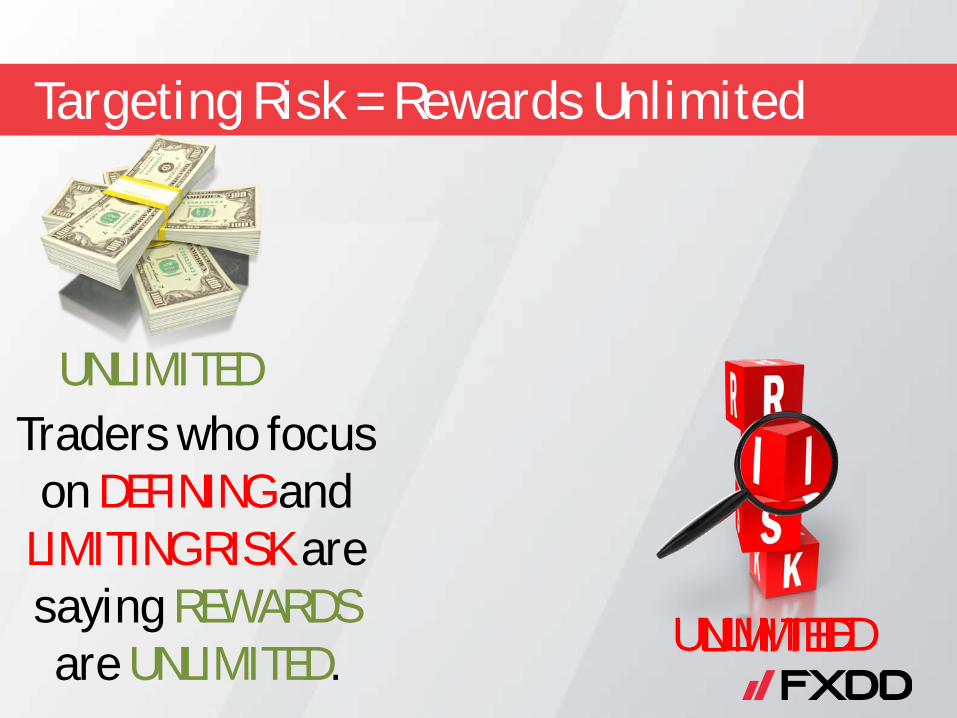
Traders who focus on DEFINING and
LIMITING RISK are saying REWARDS
are UNLIMITED.
Targeting Risk = Rewards Unlimited
UNLIMITED
UNLIMITED
LIMITED

RISK Focusing on
> REWARD

RISK How is
Defined and Limited?
QUESTION

By trading near key technical levels called
BORDERLINES
ANSWER
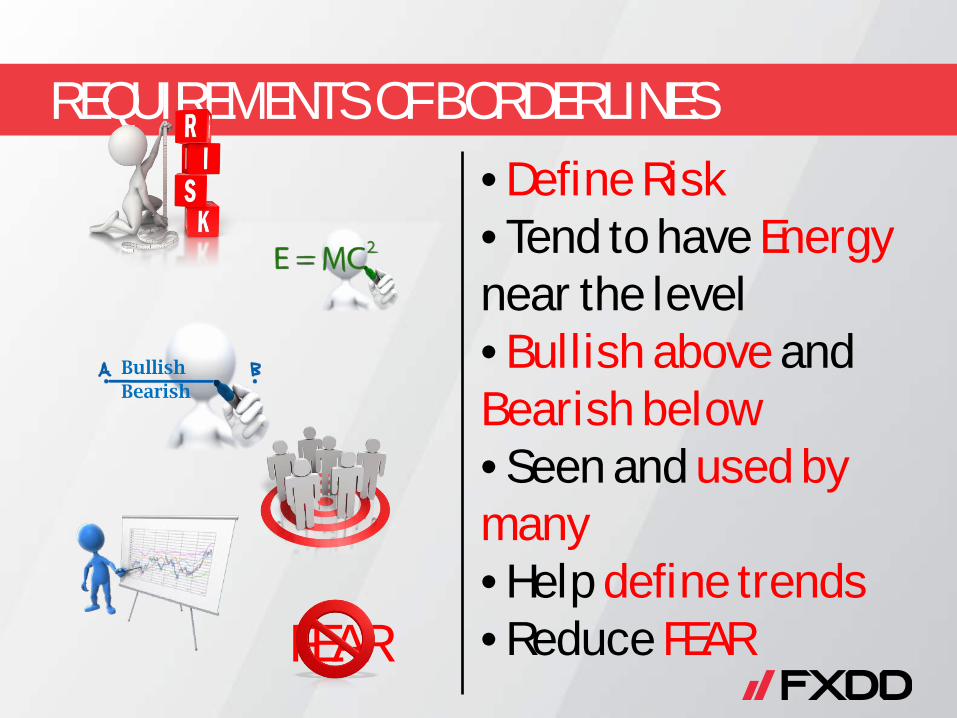
• Define Risk • Tend to have Energy near the level • Bullish above and Bearish below • Seen and used by many • Help define trends • Reduce FEAR
REQUIREMENTS OF BORDERLINES
Bullish Bearish
FEAR

TECHNICAL TOOLS for DEFINING BORDERLINES
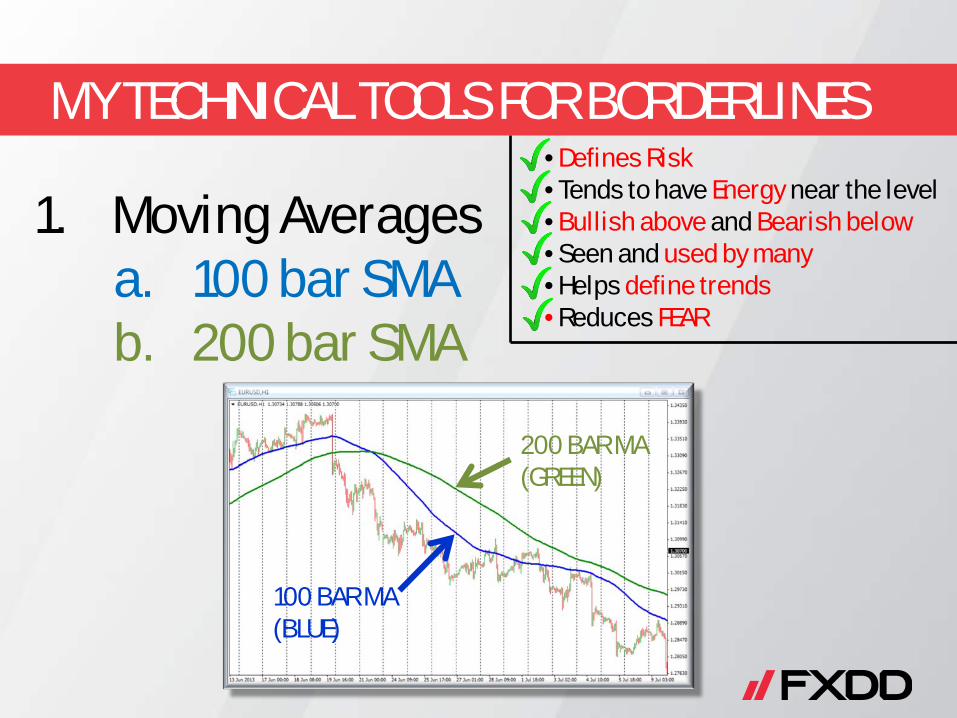
MY TECHNICAL TOOLS FOR BORDERLINES • Defines Risk • Tends to have Energy near the level • Bullish above and Bearish below • Seen and used by many • Helps define trends • Reduces FEAR
1. Moving Averages a. 100 bar SMA b. 200 bar SMA
100 BAR MA (BLUE)
200 BAR MA (GREEN)

SELL RISK -20
+71 REWARD
+114 REWARD
SELL
-23 RISK
+138 REWARD
BUY
-28 RISK
+78 REWARD
BUY
-20 RISK
+111 REWARD
LOSING TRADE

SELL -24 RISK
+101 REWARD
+197 REWARD
SELL -24 RISK
This is the same trade but just a little later. Define risk. Limit Risk. Reward is the unknown, but that is OK.
+75 REWARD
+172 REWARD

+72 REWARD
+52
BUY -21 RISK
+144 REWARD

BUY -25 RISK
STOPPED OUT Trading Account Loses
(25) Pips
What Happened?
UK Inflation Report came out which sent the price down on initial headlines. STOPPED OUT. EVENT RISK INCREASED.

100 hour MA (STOP LOSS LEVEL -24 pips)
200 hour MA
BUY here
What if you waited and BOUGHT here AFTER THE EVENT RISK and Failed BREAK?
Same STOP LOSS
Failed BREAK
What if BOUGHT here on the BREAK OF THE 200 bar MA on the 5 min. chart?
STOP LOSS
ORIGINAL TRADE
+156/+197

Other Borderline MA levels in the GBPUSD into September

MY TECHNICAL TOOLS FOR BORDERLINES • Defines Risk • Tends to have Energy near the level • Bullish above and Bearish below • Seen and used by many (Simple) • Helps define trends • Reduces FEAR
1. Moving Averages a. 100 bar SMA b. 200 bar SMA
2. Trend Lines

MY TECHNICAL TOOLS FOR BORDERLINES • Defines Risk • Tends to have Energy near the level • Bullish above and Bearish below • Seen and used by many (Simple) • Helps define trends • Reduces FEAR
1. Moving Averages a. 100 bar SMA b. 200 bar SMA
2. Trend Lines a. Up Trends b. Down Trends c. Channels d. Ceilings/Floors

1
2
3 BUY
-20 RISK
BUY #2 /RISK #2

FOMC DAY Event Risk is HIGH Liquidity Risk is High Market Risk is High BUT…..
BUY RISK
+30 Profit
Trend Line AND 100 hour MA AND Low define and limit risk BEFORE the release.

MY TECHNICAL TOOLS FOR BORDERLINES • Defines Risk • Tends to have Energy near the level • Bullish above and Bearish below • Seen and used by many (Simple) • Helps define trends • Reduces FEAR
1. Moving Averages a. 100 bar SMA b. 200 bar SMA
2. Trend Lines 3. Fibonacci Retracements

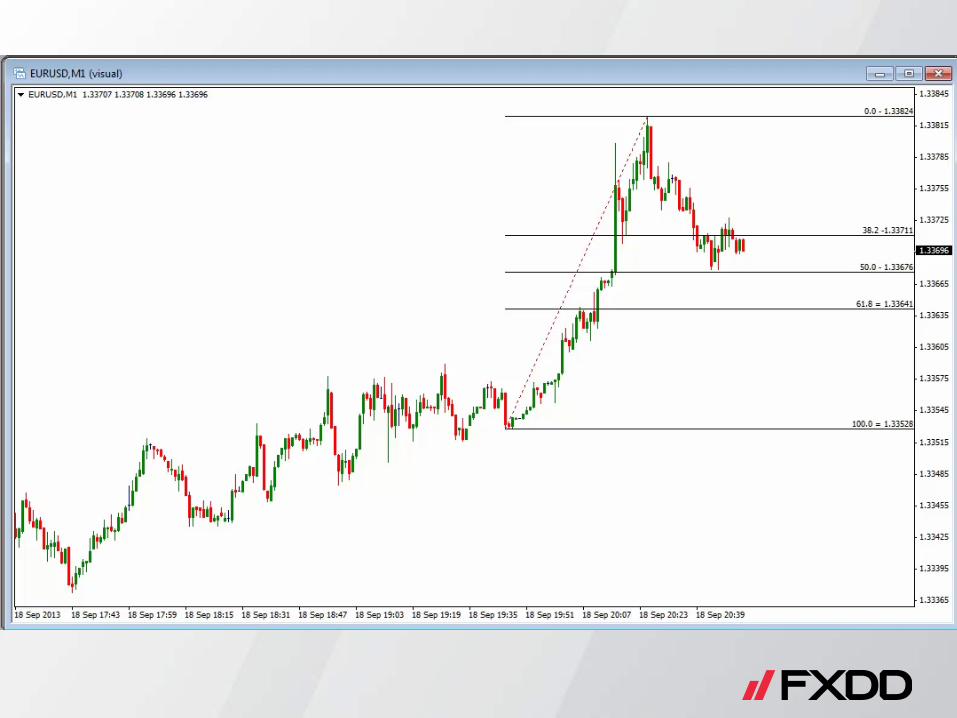
KEY FIBONACCI RETRACEMENT LEVELS
There are three main retracement levels
1. 38.2% 2. 50%
The 38.2% and 50% = Correction Zone 3. 61.8%
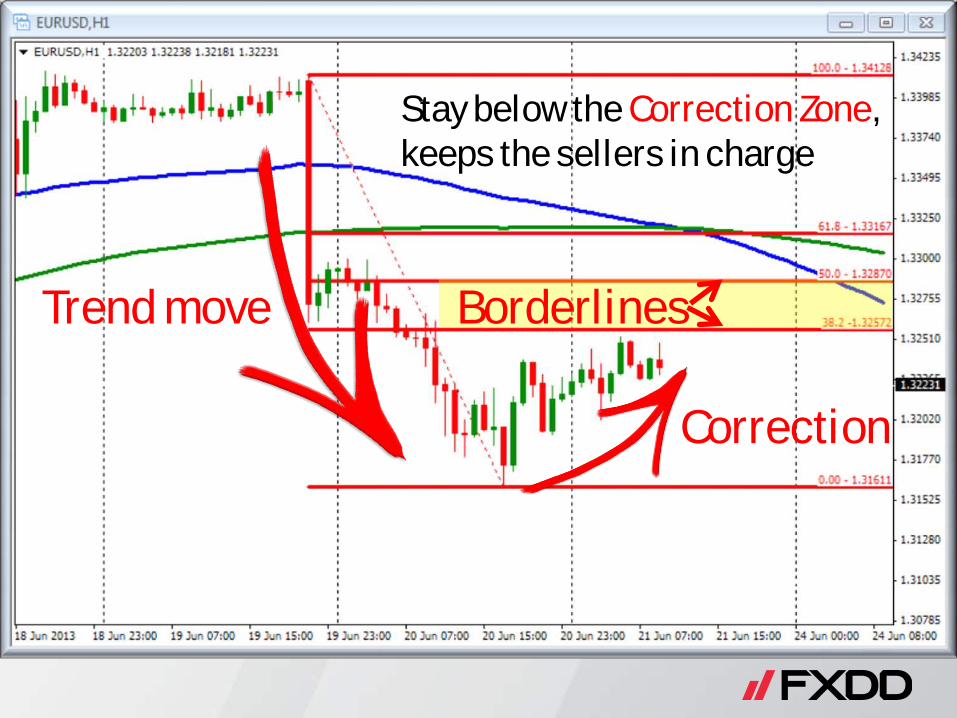
Trend move
Correction
Borderlines
Stay below the Correction Zone, keeps the sellers in charge

Trend move
Trend move
Borderlines
Price stays below the Correction Zone (Borderlines), and sellers reenter.

FOUNDATION SUMMARY 1. Focus on Risk. Reward may follow. 2. Trade near key technical levels
(Borderlines). 3. Three technical tools,
• Moving Averages (100 and 200 SMA) • Trend lines • Fibonacci Retracements

Increasing the Odds of Success
in your Forex Trading
Greg Michalowski Email: [email protected] www.livestream.com/FXDD Twitter: gregmikefx

High Risk Warning: All news, opinions, research, data, or other information contained within this presentation are provided as general market commentary and do not constitute investment advice. FXDD expressly disclaims any liability for any lost principal or profits without limitation which may arise directly or indirectly from the use of or reliance on such information.
ADVISORY WARNING: FXDD provides sources of economic and market information during this broadcast as an educational service to its clients and prospects. The opinions or recommendations expressed during the broadcast are not intended as investment advice and are based on data reasonably believed to be accurate at the time of publication. Clients and prospects are advised to carefully consider the opinions and analysis offered in the context of your individual analysis and decision making. None of the statements of opinions or recommendations are to be considered as constituting a track record. Past performance is no guarantee of futures results and FXDD specifically advises clients and prospects to carefully review all claims and representations made during the broadcast in light of your particular analysis, trading style and objectives. All news, opinions, research, data, or other information contained within this website is provided as general market commentary and does not constitute investment or trading advice. FXDD expressly disclaims any liability for any lost principal or profits without limitation which may arise directly or indirectly from the use of or reliance on such information. As with all such advisory services, past results are never a guarantee of future results.
Disclaimer Di
scla
imer

INCREASING THE ODDS OF SUCCESS

INCREASING THE ODDS OF SUCCESS Odds of success in your trading are
more in your favor simply by trading near BORDERLINES, DEFINING RISK, LIMITING RISK and hoping the market agrees with the TOOLS YOU USE and WHAT YOU SEE

INCREASING THE ODDS OF SUCCESS If the market is active (i.e., not sitting in a
narrow range), and you define your risk, you have the potential to:
RISK A LITTLE (LOSE)
MAKE MORE THAN A LITTLE (WIN) OR

Timing your Trade Entries

specifically

(E)NERGY in trading is created by having (M)ultiple reasons to trade which moves the market away from the point of the trade….sometimes fast (like a JET PLANE).
(E)nergy = (M)ass x C2 C = Speed of Light

More M = More E U L T I P L E
R E A S O N S
N E R G Y
t o T R A D E

= More Energy
Risk a Little Make More than a Little
= Odds of Success in our Favor

You just need to get the DIRECTION RIGHT
Some of the Times (40%-50%)

USDJPY

147 Pips
1 2 3 4 Days
100 HOUR MA
200 HOUR MA
CHART FACTS USDJPY
1 Hour Chart Current Price: 99.67
100 Simple MA: 99.90 200 Simple MA: 99.85
4+ Days 147 Pip Range
PRIMARY TOOL TRADING FACTS 1. Current Price < 100 SMA 2. Current Price < 200 SMA 3. Topside Trend line held 4. Price < Bottom Trend line
SECONDARY TRADING FACTS 1. 4 Day Range Narrow (147 Pips) 2. Current Day Range Narrow
(89 pips) 3. 100 and 200 Hour MA flat * 4. Two Moving Averages
Converging w/ the Price *
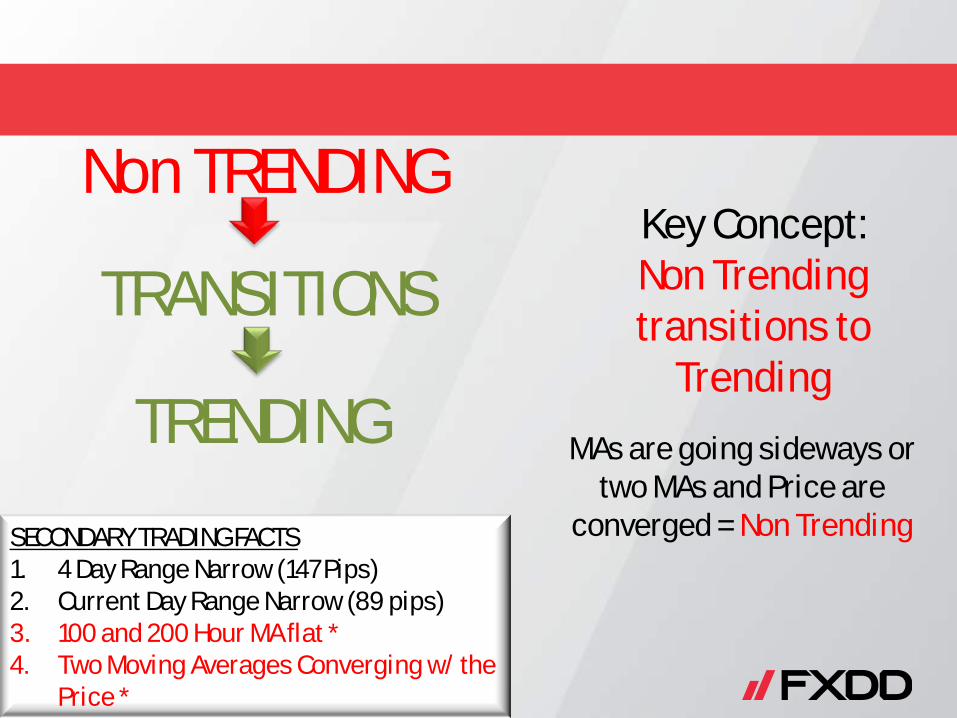
SECONDARY TRADING FACTS 1. 4 Day Range Narrow (147 Pips) 2. Current Day Range Narrow (89 pips) 3. 100 and 200 Hour MA flat * 4. Two Moving Averages Converging w/ the
Price *
Key Concept: Non Trending transitions to
Trending MAs are going sideways or
two MAs and Price are converged = Non Trending
Non TRENDING
TRENDING
TRANSITIONS

147 Pips
1 2 3 4 Days
100 HOUR MA
200 HOUR MA
SELL
BUY or SELL? STOP -25 RISK?

SELL
-25 STOP
SELL STOP -25
+82
+173 +208
Non Trend Transitions to Trend + Multiple Reasons to Trade = Odds in the Traders Favor (risk low)

GBPUSD

CHART FACTS GBPUSD
1 Hour Chart Current Price: 1.5357
100 Simple MA: 1.5354 200 Simple MA: Not in Play
In Correction Zone between 38.2% and 50%
of a Trend move higher
1.5354
CORRECTION ZONE
TREND MOVE

RISK? BUY or SELL?
-15 Risk is DEFINED RISK is LIMITED
MULTIPLE REASONS ACCEPT RISK?

-15
+42 +52 WHERE’S
THE ENERGY?
-39

38 H
60 Pips
1.5415 1.5412
100 H MA 1.5355
C-ZONE
1 2 3 4 5 6
170 Pips
1 2
WHERE’S THE ENERGY?
IT’S COMING Markets are Non Trending

LOOK AT OTHER TIME FRAMES By looking at key
technical level on other time period
charts, traders can often get additional clues for trade bias
and trade entries
I look at the : • 5 Minute • Hourly • Daily
LOOK AT OTHER TIME FRAMES 5 minute chart is a proxy for Intraday
Traders 1 hour chart is a proxy for Swing
Traders Daily chart is a proxy
for LT Traders
By looking at key technical level on other time period
charts, traders can often get additional clues for trade bias
and trade entries
What are the Longer Term
Traders focused on?

KEY BORDERLINE Time to Move
CHART FACTS GBPUSD
DAILY Chart Price is between the 100 and 200 day MAs but the
38.2% of year range is slowing the move. Also
area of ENERGY from past.

What are the Intraday Traders
focused on?

FAILED BREAK TWICE
SELL HERE?
CHART FACTS GBPUSD
5 Minute Chart Price above and below 100 and 200
bar MA (sideways/converged) Price failed on BREAK higher.
Need to BREAK below low. Range Narrow.
RISK HERE Price is going above and below MAs

What are the 3 types of Trader’s
Trading Bias? BULLISH or BEARISH?

Hourly: Non-Trending below ceiling
at 1.5415. Above 100 hour MA at
1.5360
1.5360
1.5415
BIAS: NEUTRAL, but LOOKING FOR A BREAK

Daily: Key
resistance against 38.2% retracement at 1.54124 is
holding.
1.54124
BIAS: BEARISH. Holding ceiling at 1.54124

5 Minute: Falls below
the converged
100 and 200 bar MA at
1.5387.
BIAS: BEARISH below 100 and 200 bar MA and Correction ZONE

If different TYPES OF TRADERS (i.e., Short Term, Swing and Long Term) are in agreement to bias
If risk can be DEFINED and LIMITED
If there are MULTIPLE REASONS to trade
TRADE

BREAK HOLD BREAK
BREAK
SELL 1.5360
RISK 1.5383
+131
+235
TRADE FACTS GBPUSD 1 HOUR Chart
• Price moved below 100 MA and stayed below • Price tested 200 MA,100 MA (between Goal Posts)
• Broke 100 MA • Price moves to channel trend line and stalls (+131) • Accelerates trend through trend line (liquidation)
• Stops at 1.5125 before consolidating (+235)

SUMMARY: PUTTING THE ODDS IN YOUR FAVOR
1. Trade near BORDERLINES 2. FIND Multiple Reasons to TRADE 3. RISK a LITTLE to MAKE MORE than a LITTLE
(DEFINE and LIMIT RISK) 4. NON TRENDING TRENDING 5. AGREEMENT from MULTIPLE TIME PERIODS

TRADE FACTS GBPUSD DAILY Chart
• Price holds below 38.2%. Borderline to lean against • Price BREAKS trend line at 1.5364 • Price BREAKS below 100 day MA
NOW WHAT? PUT in FIBONACCI FOR TARGETS.
BREAK BREAK

BREAK
KEY TARGET REACHED AT 50% FIBO.
TRADE FACTS GBPUSD DAILY Chart
• Price BREAKS 38.2% retracement. Trend continues.
• Price STOPS at 50% retracement target. Take profit at limit of Consolidation ZONE.
BREAK
Exiting your Forex Trades
with a purpose
Greg Michalowski Email: [email protected] www.livestream.com/FXDD Twitter: gregmikefx

High Risk Warning: All news, opinions, research, data, or other information contained within this presentation are provided as general market commentary and do not constitute investment advice. FXDD expressly disclaims any liability for any lost principal or profits without limitation which may arise directly or indirectly from the use of or reliance on such information.
ADVISORY WARNING: FXDD provides sources of economic and market information during this broadcast as an educational service to its clients and prospects. The opinions or recommendations expressed during the broadcast are not intended as investment advice and are based on data reasonably believed to be accurate at the time of publication. Clients and prospects are advised to carefully consider the opinions and analysis offered in the context of your individual analysis and decision making. None of the statements of opinions or recommendations are to be considered as constituting a track record. Past performance is no guarantee of futures results and FXDD specifically advises clients and prospects to carefully review all claims and representations made during the broadcast in light of your particular analysis, trading style and objectives. All news, opinions, research, data, or other information contained within this website is provided as general market commentary and does not constitute investment or trading advice. FXDD expressly disclaims any liability for any lost principal or profits without limitation which may arise directly or indirectly from the use of or reliance on such information. As with all such advisory services, past results are never a guarantee of future results.
Disclaimer Di
scla
imer

VS.
More Important? ENTRY or EXIT

VS.
Most Traders focus on….

What bothers me is….
How little

• “I made 20 pips.” • “I have a profit.” • “No one ever went broke taking a profit” • “Bulls and bears make money. Pigs get slaughtered” • “I am afraid the market will correct and my profit will disappear”
What are YOUR Reasons to Exit?
FEARING SUCCESS


Traders can look to ride winners – especially in a
trending market – to get ahead in your
trading.

After all, if we are going to work so hard in trying to increase the odds of success, why not take advantage of that work..,
…WITH CONFIDENCE

Mindset on a Trade Taken 1. Risk is Defined at the beginning of the trade. Either you lose or you win. DO NOT FEAR. LOSING IS PART OF TRADING

Mindset on a Trade Taken 1. Risk is Defined at the beginning of the trade. Either you
lose or you win. DO NOT FEAR. LOSING IS PART OF TRADING.
2. If you win - and want take profit - look to take partial profit where Pips Gained = Risk Pips on Trade Entry. Optional: Move stop closer to Breakeven

Mindset on a Trade Taken 1. Risk is Defined at the beginning of the trade. Either you
lose or you win. DO NOT FEAR. LOSING IS PART OF TRADING.
2. If you win - and want take profit - look to take partial profit where Pips Gained = Risk Pips on Trade Entry. Optional: Move stop closer to Breakeven 3. Define “targets” in the direction of the trade. When a target is reached, move stop.

Target = Defined Technical Borderline in the direction of the trade/trend
What is a Target?

Targets can be entry levels for traders looking to get in on the trade
What is a Target?

Targets get harder and harder to pass as a trend move continues. This leads to corrections.
What is a Target?

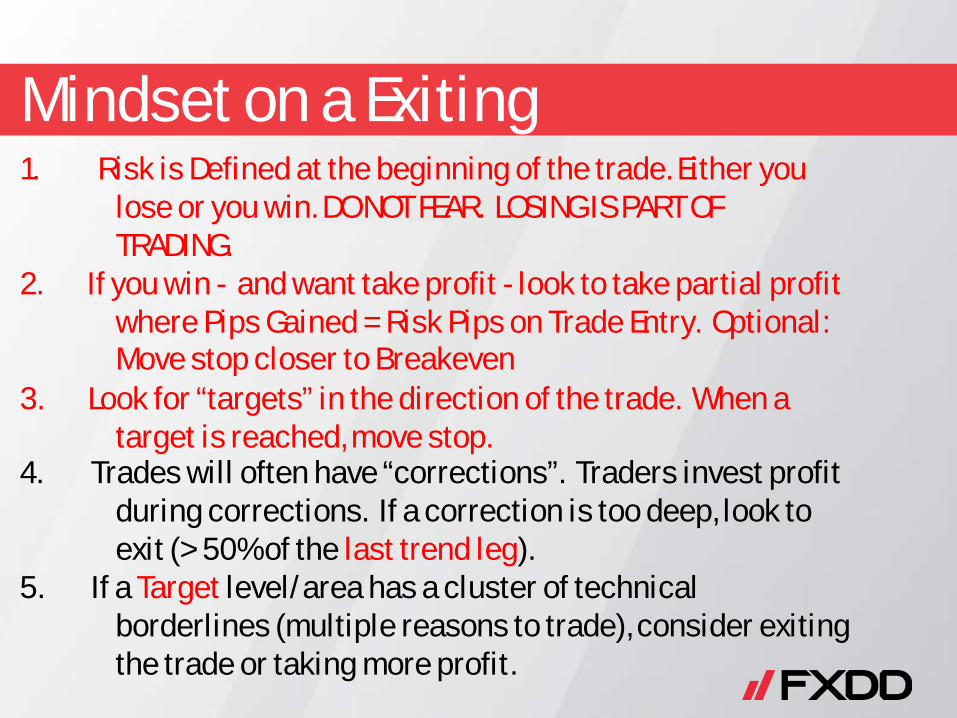
Mindset on a Exiting 1. Risk is Defined at the beginning of the trade. Either you
lose or you win. DO NOT FEAR. LOSING IS PART OF TRADING.
2. If you win - and want take profit - look to take partial profit where Pips Gained = Risk Pips on Trade Entry. Optional: Move stop closer to Breakeven 3. Look for “targets” in the direction of the trade. When a target is reached, move stop. 4. Trades will often have “corrections”. Traders invest profit
during corrections. If a correction is too deep, look to exit (> 50% of the last trend leg).
5. If a Target level/area has a cluster of technical borderlines (multiple reasons to trade), consider exiting the trade or taking more profit.

EURUSD

More Important? Entry or Exit

TRADE FACTS .

ANOTHER EXAMPLE

ANOTHER EXAMPLE

All information on this site is provided for informational and educational purposes only, not
intended for trading purposes or advice. As with all such advisory services, past results are not indicative
of future results. In addition trading in foreign exchange markets on margin carries a high level of
risk, and may not be suitable for all individuals.


 the forex traders guide to price action](https://img.pdfslide.us/doc/110x75/547346f6b4af9fb40a8b5358/fx365groupinfotrading-the-forex-traders-guide-to-price-action.jpg)