Embed Size (px)
Citation preview
Building the
BCBSM Physician Group Incentive
Program
and Patient-Centered Medical Home
June 2011
Margaret H. Mason, MHSA
Blue Cross Blue Shield of Michigan

PGIP: Catalyzing Health System Transformation in Partnership with Providers
2004 2005 2006 2007 2008 2009 2010 2011 2012
PGIP
Chronic
Care Model
Continue to
add new
specialties to
PGIP
• Transform care processes to effectively
manage chronic conditions
• Build registry and reporting capabilities to
manage populations of patients
• Achieve savings in specified areas
• Reward physicians for improved performance
and efficiency
• Share savings
•Build PCMH infrastructure
•Strengthen doctor-patient
relationship
• Support PCPs and their
team’s ability to effectively
manage care
•Coordinate care across the
continuum for a defined patient
population
•Establish linkages with
community services
Extend provider-
delivered care
management with
links to BCBSM for
customer reporting
statewide
• Support establishment of
systems of care that assume
responsibility and
accountability for managing a
defined population of patients
across all locations of care
PCMH
Primary care
transformation
OSCs
Organized
Systems of Care
Continue to
increase
number of
initiatives
Expand
PGIP to
include
specialists
involved in
chronic care
Implement
PCMH and
quality/use
initiatives
2

3
What Can We Do Together?
• 2004 meetings with Michigan State Medical Society, Michigan Osteopathic Association, & Council of Physician Organizations (POs)
Suggested that BCBSM establish partnership with POs
Harness the full measure of physicians’ creative efforts


5
PGIP Development and Growth
2005 2006 2007 2008 2009 2010
Launch
PGIP
Add
POGS
Combine &
Restructure
PGIP and POGS
Add Medical
Oncology
Add payment for
pt-self mgmt
education/
training
Add PCMH
initiatives
Continue
adding PCP-
based
initiatives
Transparency
Add PCMH
designation
Addition of
more
specialists
25 initiatives
by end of
2009
Develop
initiatives
specifically
for specialists
Implement
pilots related
to Provider-
Based Care
Mgmt
Physician
Orgs
12 31 33 35 36 38
(100 physician
groups)
Physicians 2,653 4,617 5,414 6,471 6,657
(January 2009)
8,654
(July 2010)
Incentive
Pool
$8.9
million
$19.9
million
$38 million $47 million Approx $64M Over $83
million
Members 609,700 1.2M 1.5M 1.6M 1.7M 1.7M

Marquette County: Upper Peninsula Health Plan (338)
Genesee County: Genesys Integrated Group Physicians (94),
PMC ( 200), McLaren PHO (369)
Saginaw County: Primary Care
Partners (69)
Kent County: Advantage Health
Physicians (218), Lakeshore Health
Network (209), Metro Health PHO (133),
Spectrum Health (256), West Michigan
Physicians Network (344)
Ottawa County: Holland PHO (78)
Livingston County: Livingston
Physician Organization (25)
Ingham County: Consortium of
Independent Physician Associations
(1,673), MSU Health Team (117),
Sparrow Medical Group (77)
Kalamazoo County: Bronson
Medical Group (90) and
ProMed Healthcare (141)
Calhoun County: Integrated Health Partners (110)
Washtenaw County: Huron
Valley Physicians
Association (397),
Integrated Health
Associates (165), U-M
Health System (838)
Oakland County: Beaumont Physician
Organization (423),Medical Network One (573),
Oakland Physician Network Services (212),
Oakland Southfield Physicians (233), Physician
Resource Managenent (103), St. John Medical
Group (313), United Physicians (805)
Macomb County: DMC Primary
Care Physicians (109), DMC PHO
(232), Greater Macomb PHO (171),
St. John HealthPartners (567)
St. Clair County: Mercy~ Physician
Community PHO (65), Physician
Healthcare Network (46)
Jackson County: Jackson Physician
Alliance (65)
Wayne County: Henry Ford
Medical Group (652), Midwest
Medical Center (103), Olympia
Medical Services (191), UOP,
LLC (214)

Physician Group Incentive Program:
Health Plan Role
• Convene and catalyze; not engineer and control
• Provide resources to reward infrastructure
development and process transformation
• Reward quality and cost results (improvement and
optimal performance) at the population level
• Structure reimbursement to support system
transformation
• Reward performance at population level
• Share data at organization, office and physician
level
• Leave management of individual patient care to
practices and of physician practices to PO 7
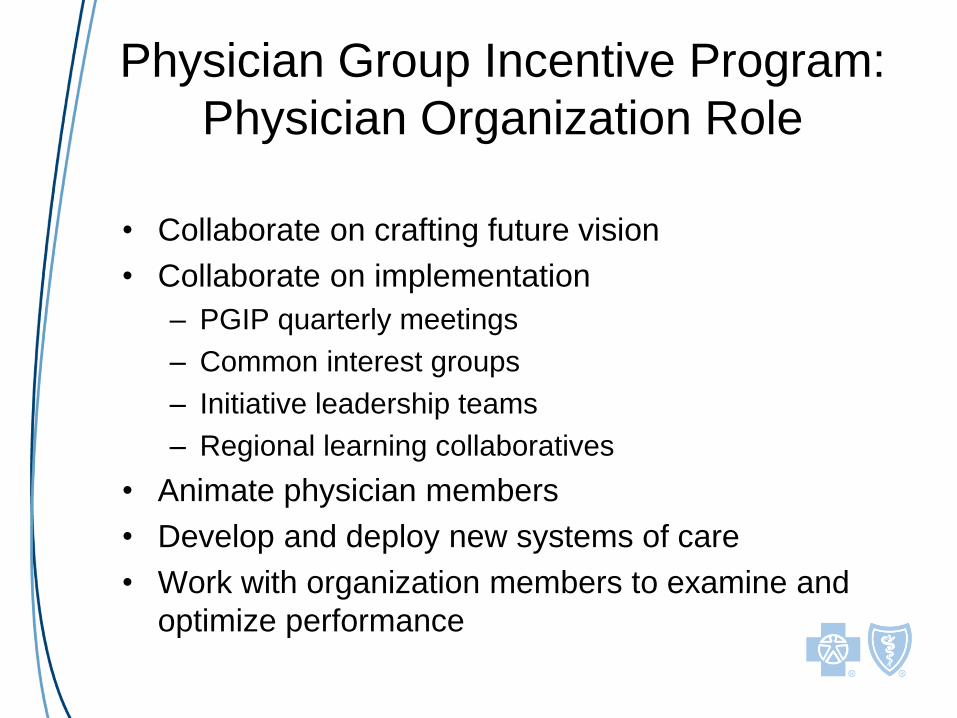
Physician Group Incentive Program:
Physician Organization Role
• Collaborate on crafting future vision
• Collaborate on implementation
– PGIP quarterly meetings
– Common interest groups
– Initiative leadership teams
– Regional learning collaboratives
• Animate physician members
• Develop and deploy new systems of care
• Work with organization members to examine and
optimize performance
8

9
Anatomy of a PGIP Initiative
• Eligibility criteria
• Description of the scope, focus and objectives
• Data, Metrics and Reports designed to:– Describe the improvement opportunity
– Assist in diagnosing the process problems
– Track progress of implementation effort
– Measure improvement success
• Resources and services (educational materials, etc.)
• Incentive design

0% 20% 40% 60% 80% 100%
Inpatient Utilization
Lean Clinical Reengineering CQI
Transitions of Care
Cardiac Care (New in 2011)
Utilization of Hysterectomy
Chronic Kidney Disease
New Group - Process improvement staff
New Group - Analytics and reporting staff
*Quality Oncology Practice Initiative
MI Oncology Clinical Treatment Pathways
Utilization of Labor Induction
Increase the use of generic drugs
Evidence based care
Electronic prescribing
Emergency Department Utilization
Radiology Management
Environmental Cancer
MI Anticoag Quality Improvement
Percent of PGIP POs Participating in Quality, Use
and Efficiency Performance-based Initiatives

Initiatives with PGIP Reporting
CORE CLINICAL
• Evidence Based Care Report
• Transitions of Care
SERVICE FOCUSED
• Pharmacy - Generic Dispense Rate
• Inpatient Utilization
• Emergency Department Utilization
• Radiology Use
CONDITION FOCUSED
• Cardiac Care
• Women’s Health (Hysterectomy & Labor
Induction)
Core
Clinical
Condition
Focused
Service
Focused
Improvement Capacity
IT Focus
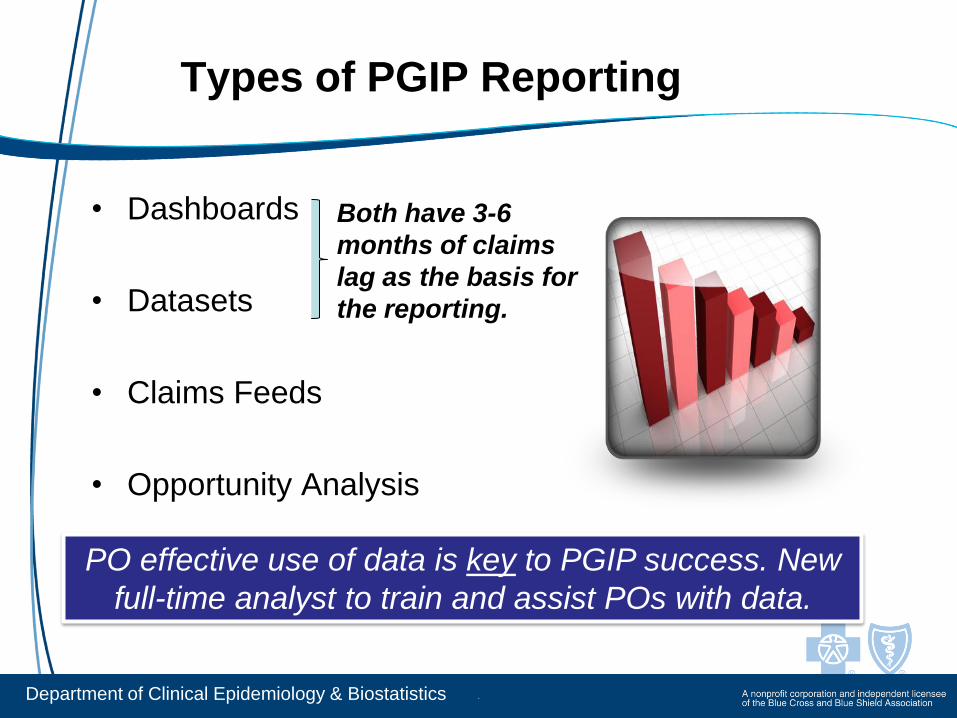
Types of PGIP Reporting
• Dashboards
• Datasets
• Claims Feeds
• Opportunity Analysis
Department of Clinical Epidemiology & Biostatistics
Both have 3-6
months of claims
lag as the basis for
the reporting.
PO effective use of data is key to PGIP success. New
full-time analyst to train and assist POs with data.

PGIP Reporting – Dashboards
• Physician Organizations receive dashboard files semi-annually
– Distributed to all POs regardless of participation
– Includes data on all POs regardless of participation
• Includes:• Physician Organization demographics and attribution volumes
• Risk adjustment comparisons (if applicable)
• Tables & Figures to show POs’ outcomes for initiative metrics
• PGIP-Overall and Benchmark comparison
• Metrics at PO level: Allows for PO – PO comparison**
**Some metric data are on a PO’s Practice Unit level (GDR, ED and Radiology), but included only in that PO’s dashboard and not shared among POs

Dashboard – Table Example
• Tables list POs
alphabetically
PGIP Physician Organization
Total
Attributed
Members
Total
Member
Months
HbA1C
denom
HbA1C
num
HbA1C
Testing
LDL-c
denomLDL-c num
LDL_C
Testing
Nephropathy
denom
Nephropathy
num
Nephropathy
Monitoringlipid denom lipid num
Lipid
Lowering
Drug Rate
PO A 31,497 301,652 649 550 84.7% 649 460 70.9% 649 547 84.3% 487 367 75.4%
PO B 33,829 330,752 1,006 764 75.9% 1,006 755 75.0% 1,006 789 78.4% 710 450 63.4%
PO C 23,276 232,419 597 459 76.9% 597 429 71.9% 597 469 78.6% 402 291 72.4%
PO D 40,673 402,382 1,404 1,103 78.6% 1,404 995 70.9% 1,404 1,089 77.6% 1,049 768 73.2%
PO E 14,311 135,899 654 473 72.3% 654 449 68.7% 654 525 80.3% 490 333 68.0%
PO F 35,875 344,419 1,452 1,148 79.1% 1,452 1,126 77.5% 1,452 1,153 79.4% 1,150 885 77.0%
PO G 15,807 153,923 563 440 78.2% 563 427 75.8% 563 441 78.3% 424 274 64.6%
PO H 35,048 339,117 1,019 773 75.9% 1,019 673 66.0% 1,019 820 80.5% 729 461 63.2%
PO I 12,404 123,648 178 125 70.2% 178 125 70.2% 178 142 79.8% 116 79 68.1%
PO J 30,172 302,541 847 656 77.4% 847 607 71.7% 847 662 78.2% 654 490 74.9%
PO K 42,246 419,645 665 543 81.7% 665 493 74.1% 665 543 81.7% 496 373 75.2%
PO L 24,591 242,173 639 537 84.0% 639 472 73.9% 639 524 82.0% 464 337 72.6%
PO M 25,656 248,855 665 549 82.6% 665 479 72.0% 665 564 84.8% 512 391 76.4%
PO N 8,902 85,993 285 234 82.1% 285 201 70.5% 285 227 79.6% 211 156 73.9%
PO O 15,965 154,178 588 489 83.2% 588 456 77.6% 588 492 83.7% 451 377 83.6%
PO P 44,486 422,360 1,654 1,218 73.6% 1,654 1,207 73.0% 1,654 1,294 78.2% 1,220 775 63.5%
PO Q 11,132 109,398 414 330 79.7% 414 307 74.2% 414 299 72.2% 306 198 64.7%
PO R 21,211 207,655 452 361 79.9% 452 365 80.8% 452 388 85.8% 336 270 80.4%
PO S 8,192 82,550 134 109 81.3% 134 106 79.1% 134 110 82.1% 108 84 77.8%
PO T 9,814 90,975 273 207 75.8% 273 193 70.7% 273 225 82.4% 180 136 75.6%
PO U 29,136 283,576 883 653 74.0% 883 629 71.2% 883 728 82.4% 690 504 73.0%
PO V 68,191 658,314 2,282 1,685 73.8% 2,282 1,668 73.1% 2,282 1,835 80.4% 1,665 1,136 68.2%
PO W 30,183 291,364 1,402 1,033 73.7% 1,402 1,074 76.6% 1,402 1,107 79.0% 997 713 71.5%
PO X 16,796 158,453 237 204 86.1% 237 189 79.7% 237 188 79.3% 164 113 68.9%
PO Y 33,069 333,809 1,037 804 77.5% 1,037 761 73.4% 1,037 845 81.5% 743 514 69.2%
PO Z 24,968 241,113 1,032 772 74.8% 1,032 799 77.4% 1,032 818 79.3% 795 574 72.2%
PO AA 25,589 250,055 733 556 75.9% 733 517 70.5% 733 585 79.8% 509 332 65.2%
PO BB 53,730 496,541 1,447 1,193 82.4% 1,447 1,075 74.3% 1,447 1,179 81.5% 1,074 826 76.9%
PO CC 12,823 131,395 391 337 86.2% 391 309 79.0% 391 354 90.5% 287 233 81.2%
PO DD 78,542 757,977 2,564 1,910 74.5% 2,564 1,947 75.9% 2,564 2,056 80.2% 1,850 1,251 67.6%
PO EE 29,208 283,620 916 705 77.0% 916 672 73.4% 916 745 81.3% 680 426 62.6%
PO FF 152,821 1,489,620 4,043 3,306 81.8% 4,043 3,256 80.5% 4,043 3,291 81.4% 3,037 2,124 69.9%
PO GG 30,556 301,924 589 499 84.7% 589 411 69.8% 589 495 84.0% 422 346 82.0%
PO HH 47,235 452,136 1,796 1,298 72.3% 1,796 1,318 73.4% 1,796 1,304 72.6% 1,254 865 69.0%
PO II 57,222 589,941 1,834 1,502 81.9% 1,834 1,196 65.2% 1,834 1,407 76.7% 1,328 977 73.6%
PO JJ 65,312 636,498 1,406 1,131 80.4% 1,406 1,032 73.4% 1,406 1,123 79.9% 1,023 774 75.7%
PGIP Total 1,240,468 12,086,869 36,730 28,656 78.0% 36,730 27,178 74.0% 36,730 29,363 79.9% 27,013 19,203 71.1%
Non-PGIP 349,504 3,380,971 9,987 7,501 75.1% 9,987 7,053 70.6% 9,987 7,397 74.1% 7,202 4,905 68.1%
ABC Benchmark 84.8% 80.6% 85.1% 80.3%
Attributed Members Diabetes
• Metrics typically
have raw
numbers along
with calculated
rates
• PGIP Totals,
Non-PGIP
controls, &
Benchmark
comparisons
included

Dashboards – POs Comparison
• Benchmark (if present)
represents top performers with
range to make up 10% total
membership (20% total membership for
Radiology)
• PGIP Total provided for
comparison of PO’s
performance to average
performance
Figure 2. Overall Diabetes by Physician Organization 07/01/2009 - 06/30/2010.
86
.2%
86
.1%
84
.7%
84
.7%
84
.0%
82
.6%
82
.4%
82
.1%
81
.9%
81
.8%
81
.7%
81
.3%
80
.4%
79
.9%
79
.7%
79
.1%
78
.6%
78
.2%
78
.2%
77
.5%
77
.4%
77
.0%
76
.9%
75
.9%
75
.9%
75
.9%
75
.8%
74
.8%
74
.5%
74
.0%
73
.8%
73
.7%
73
.6%
72
.3%
72
.3%
70
.2%
83
.2%
0%
10%
20%
30%
40%
50%
60%
70%
80%
90%
100%
PO
CC
PO
X
PO
A
PO
GG
PO
L
PO
O
PO
M
PO
BB
PO
N
PO
II
PO
FF
PO
K
PO
S
PO
JJ
PO
R
PO
Q
PO
F
PO
D
PG
IP T
ota
l
PO
G
PO
Y
PO
J
PO
EE
PO
C
PO
B
PO
H
PO
AA
PO
T
PO
Z
PO
DD
PO
U
PO
V
PO
W
PO
P
PO
E
PO
HH
PO
I
PGIP Physician Organization
Benchmark Avg. 84.8%

PGIP Reporting – Datasets
• Physician Organizations receive their own MS-
Access Datasets quarterly
– Distributed to all POs regardless of participation
• Allows Practice Unit to Practice Unit and/or
Physician to Physician comparisons within a PO
• Data tables included for member (patient) level
activity information
– Allows POs to create ad hoc queries as needed using
initiative-specific data

17
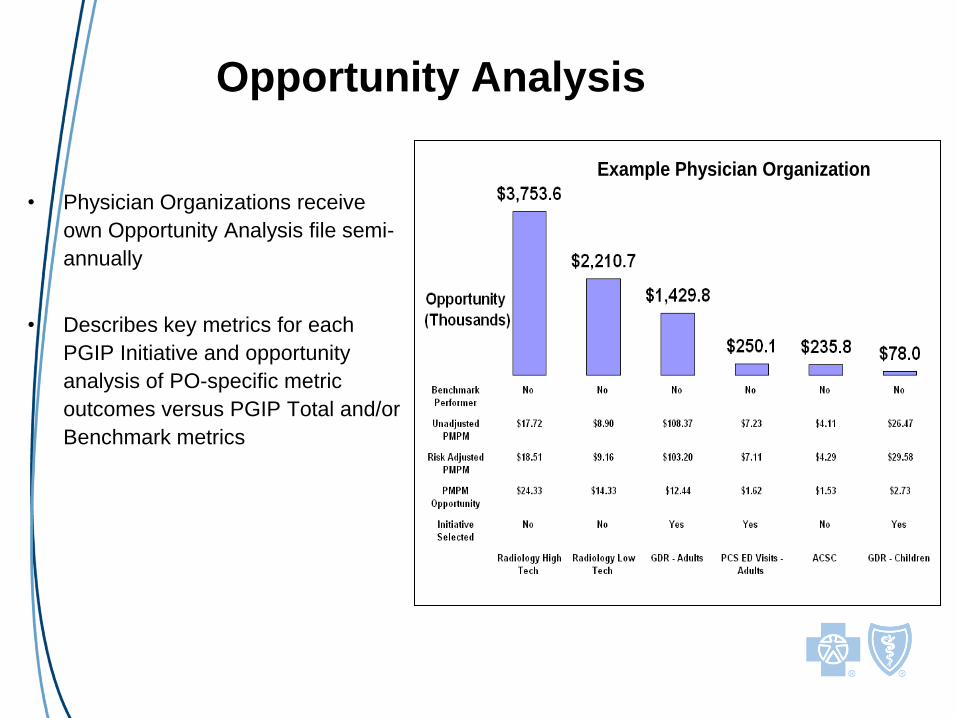
Opportunity Analysis
• Physician Organizations receive
own Opportunity Analysis file semi-
annually
• Describes key metrics for each
PGIP Initiative and opportunity
analysis of PO-specific metric
outcomes versus PGIP Total and/or
Benchmark metrics
Example Physician Organization

19
Poof! You’re a PCMH! [not]

20
BCBSM Incremental Approach to PCMH
Developed in Collaboration with PGIP Providers
PGIP PCMH Initiatives
•Opportunity for PGIP POs to
participate in 12 PCMH Initiatives
(started in 2008)
•All PCPs and Specialists in PGIP
may participate
• Over 6,000 physicians currently
working on implementing PCMH
capabilities
• $ to POs via PGIP incentives
PGIP PCMH Designation
Program
•Opportunity for PGIP Practice
Units to be PCMH Designated by
BCBSM and compensated for
additional time and resources
required (started in July 2009)
•Only PCPs are eligible
• $ to Practices via increased
E&M fees
Office visits 99201 – 99215
Preventive 99381 – 99397
POs working on initiatives
with their practices
leads to Practice designation.

0% 10% 20% 30% 40% 50% 60% 70% 80% 90% 100%
Patient-Provider Agreement
Patient Registry
Performance Reporting
Individual Care Management
Extended Access
Test Tracking
Preventive Services
Linkage to Community Services
Self-Management Support
Patient Web Portal
Coordination of Care
Specialist Referral Process
Percent of PGIP POs Participating in
“Infrastructure Building” PCMH Initiatives

Each PCMH Initiative has “Capabilities” to
be Implemented
•Over 120 capabilities in total
•POs self-report
implementation of capabilities
at practice unit level (no
required sequence)
•BCBSM uses self-reported
data to pay incentives
(validated via site visits
selected by random sampling)
•Once all a PO’s practice units
have implemented all
capabilities in an initiative, no
further incentives earned for
that initiative.

40+ Pages of PCMH Interpretive Guidelines

PCMH Designation Program
1. Physician offices nominated by their PGIP PO
2. Scores calculated based on:
– PCMH capabilities in place (50%)
• Self-reported data validated through site visits
– Performance on quality/use/efficiency measures (adult and pediatric) (50%)
• Quality: Evidence Based Care and Preventive measures
• Use: ED use for primary care treatable conditions and high-tech and low-tech radiology rates
• Efficiency: Generic Dispensing Rate and trend
• Highest ranked practices are designated
– Program expands each year
Practice Units that achieve PCMH Designation continue to participate in PCMH Initiatives and are expected to demonstrate ongoing progress towards fully implementing PCMH domains
of function

329 Validation Site Visits For 2011
PCMH Designation
POs are
accountable
for accurate
reporting of
practice unit
progress

Why Don’t We Just Use the NCQA
Program?
• PGIP PCMH developed at the same time as NCQA, in collaboration with
our PGIP partners
• Latest validation results demonstrate greater than 90 percent adherence
to our interpretive guidelines
• We are able to assess and validate the association between the
presence of specific practice capabilities and related performance
measures, such as between after-hours access and ER visits
• High degree of satisfaction with site visits and support materials provided
by the health plan and POs

Indicate your level of agreement with the
following statements.

answered question 132
How many times during the year has your physician organization
met with your practice to work on the PCMH program?
• Survey results show practices receive significant support from
both the health plan and the physician organizations. Other
processes, such as NCQA, lack programmatic support.
• Over 30 percent of practices were visited “10 or more times” by
the physician organization to promote the transformation
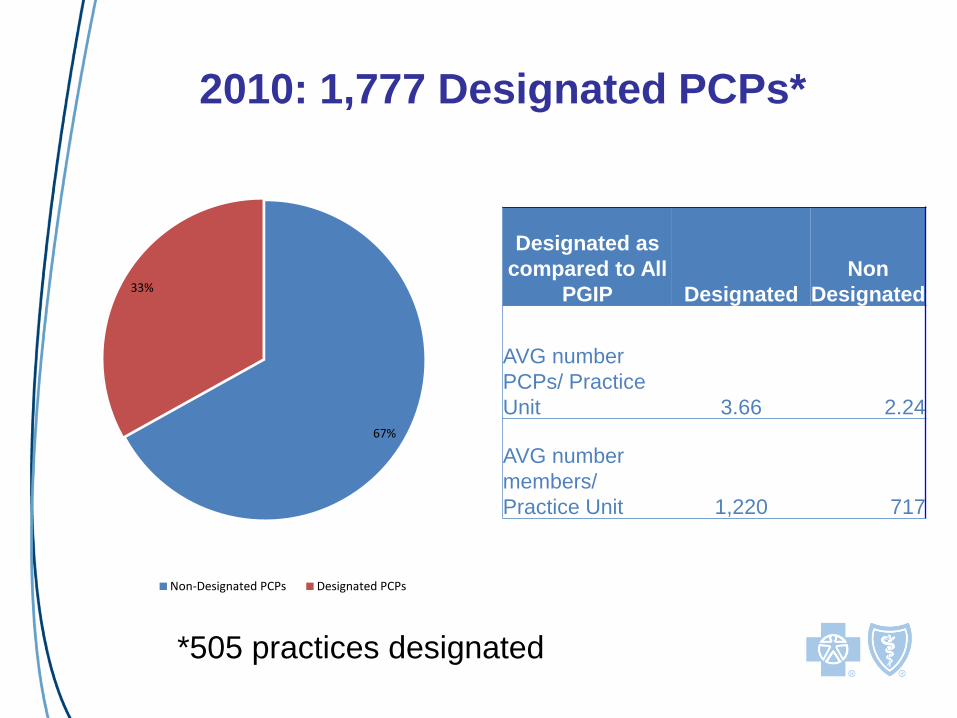
67%
33%
Non-Designated PCPs Designated PCPs
Designated as
compared to All
PGIP Designated
Non
Designated
AVG number
PCPs/ Practice
Unit 3.66 2.24
AVG number
members/
Practice Unit 1,220 717
2010: 1,777 Designated PCPs*
*505 practices designated

1%
17%
1%
6%
6%
69%
Peds Solo
Peds Multi-Physician
Adult Solo
Adult Multi-Physician
Family Solo
Family Multi-Physician
Column1 Within PGIP
Peds Solo 3%
Peds Multi-
Physician 12%
Adult Solo 4%
Adult Multi-
Physician 5%
Family Solo 18%
Family Multi-
Physician 57%
Majority of Designated PCPs are in
Family Multi-Physician Practices

Goal: Strong PCMH Functionality and Quality/Use
Performance in Designated Population
0%
10%
20%
30%
40%
50%
60%
70%
80%
90%
100%
Avg % PCMH
Capabilities
Implemented
Avg Quality/Use
% Ranking
Standard
Deviation
Quality/Use
Metrics
Designated
Not Designated

2009 PCMH DesignatedPGIP Practice Units (n=302)
* Sites with identical zip codes appear as one star
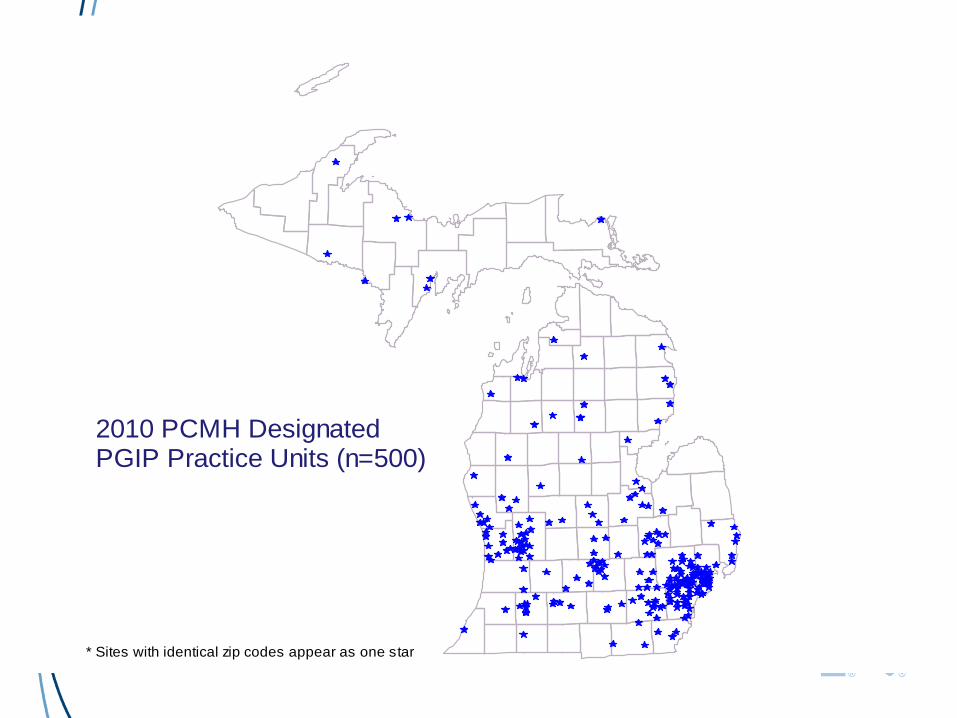
2010 PCMH DesignatedPGIP Practice Units (n=500)
* Sites with identical zip codes appear as one star

0.0%
10.0%
20.0%
30.0%
40.0%
50.0%
60.0%
70.0%
80.0%
90.0%
Total MI Zip Codes Zip Codes with PGIP Physicians
Zip Codes with PGIP PCPs
Zip Codes with PCMH Designated PCPs
74.7%
81.0% 81.0%
87.1%
25.3%
19.0% 19.0%
12.9%
Urban (%)
Rural (%)
13% of PCMH Designated Physicians
are in Rural Areas

Metric 2010 PCMH Designees Compared to PGIP non-PCMH Practices
Jan.- Dec.
2009
Jan.-June
2010
Adults (18-64)
Emergency department visits (per 1,000) -2.3% -2.8%
Primary care sensitive emergency department visits (per 1,000) -1.2% 0.8%
Ambulatory care sensitive inpatient discharges (per 1,000) -14.6% -25.5%
High tech radiology services (per 1,000) -10.3% -7.4%
High tech radiology standard cost PMPM -6.8% -4.3%
Low tech radiology services (per 1,000) -7.4% -8.4%
Low tech radiology standard cost PMPM -7.9% -8.8%
Generic dispensing rate 4.8% 4.2%
Outpatient standard cost PMPM 0.7% -1.1%
Performance of 2010 PCMH Designated Practices
Compared to PGIP Primary Care Non-Designated
Practices - Adults

PCMH Capability
The Impact of Extended Access on Primary Care Sensitive (PCS)
Emergency Department Visits, 2009
53.8 54.0 53.7 53.8 52.4 51.2
61.457.3 57.8 57.3
59.956.4
0
10
20
30
40
50
60
70
80
90
5.1 24-hour
Telephone
Access
5.4 Patients are
fullyinformed
about after-hours
care availability
and location
5.3 Patients
have access to
non-ED provider
for >= 8 after-
hours per
weekend
5.5 Patients
have access to
non-ED provider
for >= 12 after-
hours per
weekend
5.7 Advanced
access
scheduling
(Reserving >=
30% same-day
appoinrments)
5.8 Advanced
access
scheduling
(Reserving >=
50% same-day
appoinrments)PCMH Extended Access Capabilities
PC
S E
me
rge
ncy
De
part
men
t V
isit
Ra
tes
(p
er
1,0
00
)
PCMH Capability
No PCMH Capability
Extended access was
associated with 6.1%-12.6%decrease in PCS ED visits
for 6 capabilities

The Impact of Specialist Referral Capabilities on
High Tech Imaging Utilization Rates (per 1,000), 2009
362.3 369.3 372.4
407.4 408.9 401.5
0
50
100
150
200
250
300
350
400
450
500
14.1 - Specialist Referral
Procedures
14.3 - Specialist Directory 14.5 - Specialist Appointments
PCMH Specialist Referral Capabilities
Hig
h T
ec
h U
tili
za
tio
n R
ate
s (
per
1,0
00
)
PCMH Capability
No PCMH Capability
Specialist referral was
associated with 7.2%-11.1%lower High tech imaging
Utilization for 3 capabilities

The Impact of Specialist Referral Capabilities on
Low Tech Imaging Utilization Rates (per 1,000), 2009
1,102.1 1,118.8 1,110.3
1,221.1 1,229.3 1,238.1
0
200
400
600
800
1,000
1,200
1,400
1,600
14.1 - Specialist Referral
Procedures
14.3 - Specialist Directory 14.5 - Specialist Appointments
PCMH Specialist Referral Capabilities
Lo
w T
ec
h U
tili
za
tio
n R
ate
s (
per
1,0
00
)
PCMH Capability
No PCMH Capability
Specialist referral was
associated with 9.0%-10.3%lower Low tech imaging
Utilization for 3 capabilities

Quality
Indicator
No
Registry
Registry Diff
HbA1c Test 81.9% 83.4% 1.8%
Nephropathy
Screening
81.5% 82.9% 1.7%
LDLc
Screening
79.6% 79.9% 0.4%
Effectiveness of Registry in improving
diabetes-related quality of care metricsAmong 68,250 Diabetic Members with a care relationship with a PCP participating in PGIP in
2009
81.5
%
79.6
%
83.4
%
82.9
%
79.9
%
81.9
%0%
10%
20%
30%
40%
50%
60%
70%
80%
90%
100%
HbA1c Test Nephropathy
Screening
LDLc Screening
No Diabetes Registry
Diabetes Registry
Registries were associated
with 0.4%-1-8% higher quality
of care for all 3 diabetes-related
Indicators

Percent of Members (0-64) with a Care Relationship
with a PGIP PCP and Prevalence of Diabetes by Race /
Etnicity, 2009
75.5%
5.8%2.5% 1.7%
6.1%
11.3%7.3% 5.6%
0%
10%
20%
30%
40%
50%
60%
70%
80%
90%
100%
White Black Hispanic / Latino Asian / Pacific
Total Attributed Members
Members with Diabetes
`

Effectiveness of Registries in improving
quality of care metrics, by Race/EthnicityAmong 68,250 Diabetic Members with a care relationship with a PCP
participating in PGIP in 2009
Race /
EthnicityHbA1c Testing Nephropathy Screening LDLc Testing
No
Diabetes
Registry
Diabetes
Registry Diff
No
Diabetes
Registry
Diabetes
Registry Diff
No
Diabetes
Registry
Diabetes
Registry Diff
White 81.5% 84.0% 2.5% 78.9% 78.0% 1.0% 79.5% 80.7% 1.2%
Black 75.8% 80.6% 4.8% 79.9% 83.2% 3.3% 77.9% 75.4% 2.5%
Hispanic /
Latino 76.7% 81.6% 4.9% 82.3% 83.3% 1.0% 76.9% 78.1% 1.2%
Asian / Pacific
Islander 82.9% 85.7% 2.8% 87.0% 91.4% 4.5% 85.7% 84.0% 1.7%
Unclassified 79.7% 81.8% 2.1% 81.6% 84.0% 2.4% 79.5% 79.2% 0.3%
Total Races 80.6% 83.4% 2.8% 79.4% 80.7% 1.3% 79.3% 80.0% 0.6%
Registries were associated with 0.3%-4.9%higher quality of care for all 3 diabetes-related
indicators across all
race/ethnicity categories with a greater increase
for Black and Hispanic members

42
Primary
Care
Practice
Primary
Care
Practice
Primary
Care
Practice
Primary
Care
Practice
Primary
Care
Practice
Primary
Care
Practice
Prevention & Early
Diagnosis
Reduction in Preventable
ER Visits & Admissions
Appropriate Use of
Testing and Referrals
Improved Outcomes and
Efficiency for Major
Specialties
Major Specialists
(Cardiology,
Orthopedics, etc.)
Other Specialists
Hospitals Improved
Management of
Complex Patients
Safety-Net Clinics
Public Health Coordinated Health
and Social Services
Support
Health Care
Providers
Examples of Cost
Reduction
Opportunities
OSC Model
*derived from Harold Miller’s depiction of ACO models
PCP Attributed patients
Care
Part
ners

Blue Cross Blue Shield of Michigan is a nonprofit corporation and independent licensee of the Blue Cross and Blue Shield Association.
Lessons Learned

Trust and Collaboration are Key

No ruby slippers

Random Humor Helps

Appendix
Percent of PCMH Designation-Eligible
PCPs with PCMH Capabilities in
Place, by Domain
2010 Designated vs. Non-Designated PCPs
47

PGIP PCMH Infrastructure in 2010:
Average Percent of PCMH Capabilities in Place
Designated vs. Non-Designated Practices
48

Patient-Provider Partnership
49

Patient Registry
50

Individual Care Management
51

Extended Access
52

Test Tracking & Follow-up
53

Preventive Services
54

Linkage to Community Services
55

Self-Management Support
56

Patient Web Portal
57
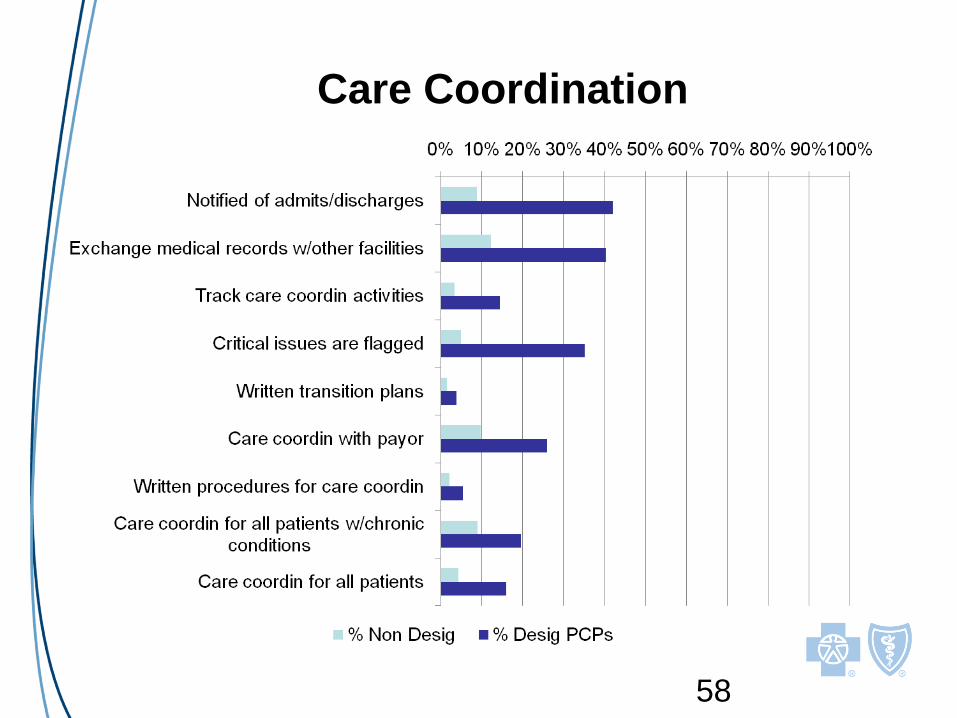
Care Coordination
58

Specialist Referral Process
59