Embed Size (px)
Citation preview

© Hitachi, Ltd. 2018. All rights reserved.
Hitachi IR Day 2018
Building Systems Business Unit
Business Strategy
Hideaki SekiSenior Vice President and Executive Officer
CEO of Building Systems Business Unit
Hitachi, Ltd.
June 8, 2018

© Hitachi, Ltd. 2018. All rights reserved.
Building Systems Business Unit
Business Strategy
Contents
2
1. Business Overview and Analysis of Current Status
2. Business Strategy
3. Conclusion

© Hitachi, Ltd. 2018. All rights reserved. 3
ElevatorsGroup control
system
Movingsidewalks
Escalators
ModernizationNew installation
Smart-building services
Building equipment fromother BUs and
other companies(HVAC, lighting, security etc.)
E&E maintenance services(Inspection, adjustment, replacing parts,
remote monitoring)
Building equipment management services
(Remote monitoring)
FY2017 revenues
603.0billion yen
BuildingServices
Sales and Manufacturing
of
E&E(Elevators
and Escalators)
31%
69%
X% : Ratio of FY2017 revenues E&E: Elevators and Escalators HVAC: Heating, Ventilation, and Air Conditioning
Providing high-value-added products and services globallyby utilizing data from E&E and other building equipment
1-1. Business Overview

© Hitachi, Ltd. 2018. All rights reserved.
1-2. Progress of the 2018 Mid-termManagement Plan (1): FY2017 Results
4
Profitability decreased in FY2017 and FY2018 forecast updateddue to competition in the Chinese E&E market pushing prices down
EBIT: Earnings Before Interest and Taxes O/R: Orders Received *1 As of 8th June, 2017 *2 As of 1st June, 2016*3 Against original targets excluding foreign exchange fluctuation and business transfer impact
FY2015(Results)
FY2016(Results)
FY2017(Results)
FY2018(Forecast)
YoYAgainst previous forecast *1
Against original target *2
Revenues(Billion yen)
650.9 585.8 603.0 580.0 (23.0)(40.0)
(70.0)[(43.0)*3]
Adjusted operating income ratio
10.3% 9.8% 8.3% 9.0% +0.7%(2.0%)
(2.0%)[(1.4%)*3]
EBIT ratio 10.8% 10.0% 8.2% 8.9% +0.7%(2.1%)
(2.1%)[(1.5%)*3]
China: Despite slowing E&E new installation demand, expanded O/R unit share;
profitability decreased by intense pricing competition, rising material costs (e.g. steel)
Japan: Revenues decreased with withdrawal from low-profit business (e.g. building
management businesses); E&E business remains steady
Asia / Middle East: Expanded sales bases, improved E&E O/R, improved profitability
FY2017 Conditions

© Hitachi, Ltd. 2018. All rights reserved. 5
Revenues Adjusted Operating Income [Ratio]
603.0
Drop in selling prices in China(30.0)
Cost reduction+8.7
Increase ofunit installation in China
+2.5
FY2017(Results)
Foreign exchange(5.0)[JPY / RMB 16.8→16.5]
580.0
52.0[9.0%]
FY2018(Forecast)
Foreign exchange(0.3)[JPY / RMB16.8→16.5]
Drop in selling prices in China(9.0)
Improve profitability year over year in FY2018promoting cost reduction in the China business
Improving profitability by promoting drastic cost reduction measures and expanding O/R for increasing NI units, in order to recover from drop in selling prices in China and foreign exchange impacts
Comparison with
FY2017 Results
50.1[8.3%]
FY2017(Results)
FY2018(Forecast)
NI: New Installation
1-3. Progress of the 2018 Mid-termManagement Plan (2): FY2018 Outlook
Billion yen Billion yen
Increase of unit installation in China+10.0
Expansion in Asia / Middle East+2.0

© Hitachi, Ltd. 2018. All rights reserved.
21 21 20 20
490 505 500 500
187 199 211 252
120 122 124 133 51 52 54 59 880
910 920 975
FY2016(Results)
FY2017(Results)
FY2018(Forecast)
FY2021(Forecast)
Americas
Japan
China
Asia /Middle East
Europe
6CAGR: Compound Annual Growth Rate *Researched by Hitachi
(Thousand units) CAGR:2.1%
■Hitachi Analysis on E&E Markets by Target Region
■E&E NI Market Trends*
China
Asia / Middle East
Japan
Still over 50% of world’s NI market, but slow down in growth Expect shifts of growth driver to maintenance
NI demand growth in multiple countries (CAGR: 6.1%)
NI demand to gradually decrease (modernization demand to increase)
1-4. Towards FY2021(1): Market Trends

© Hitachi, Ltd. 2018. All rights reserved.
-Realized strongrevenues growth with expansion of E&E NI business in China
7* Hitachi’s estimate of each company’s revenues (size of circle corresponds to revenues size);
revenues growth based on average between FY2013 and FY2017
Ra
te o
f reve
nu
es g
row
th(A
ve
rag
e o
ve
r 5 y
ea
rs) Operating income ratio (Latest)
Company B
Company C
Company E
Hitachi
Company A
10%
0%
5% 15%
5% Company D
■Our Position in the E&E Industry*
1-5. Towards FY2021(2): Competition Strategy
1. Evaluating Achievements and Direction for Future Growth
■Past Achievements
-Improve profitability mainly with building service business utilizing data
-Continue consideration of M&A to supplement growth strategy in target regions and business areas
■Direction for Future Growth
2. Key Strategies by Target Region
China
Asia / Middle East
Japan
Improve profitability by expanding building service business, mainly with E&E maintenance
Growth responding to strong E&E NI demand, improve profitability(shift in phase from investing in bases to reaping returns)
As “global mother function”, promote development of building service utilizing data

© Hitachi, Ltd. 2018. All rights reserved.
603.0 580.0640.0
8.3 9.0
-5.0
0.0
5.0
10.0
0
500
FY2017(Results)
FY2018(Forecast)
FY2021(Target)
8
Promote growth strategy, aim towards industry leader
Expand business and improve profitabilityby accelerating overseas promotion of
high-value-adding building service business utilizing data
1-6. Towards FY2021(3): Business Targets
*1 Average yearly growth prediction of E&E NI market (in units), FY2018-FY2021: +2.0% *2 Average yearly growth of revenues, FY2018-FY2021*3 Compared to FY2018 forecast
Adjusted operating income ratioRevenues(Billion yen)
Over 10%
%
Overseas revenue ratio
56% 55%over59%
%-China: Expand E&E maintenance business which has large growth potential (+30.0 billion yen)
-Asia / Middle East: Correspond to E&E NI demand growth (+30.0 billion yen)
Overseasbusiness
expansionrevenues: over
+60.0 billion yen*3
-Expand building service businesses, such as the creation of data-utilizing maintenance business overseas
-Accumulate cost reduction efforts through strict execution
Improveprofitability
Adjustedoperating
income: over+12.0 billion yen*3
Realize strong growth, including considerationof non-continuous growth by M&A etc.,in addition to organic growth
Realize growth exceeding market trends*1
at over 5% / year*2
M&Aetc.

© Hitachi, Ltd. 2018. All rights reserved.
Building Systems Business Unit
Business Strategy
Contents
1. Business Overview and Analysis of Current Status
2. Business Strategy
3. Conclusion
9
© Hitachi, Ltd. 2018. All rights reserved.
Building servicesElevators and escalators
10
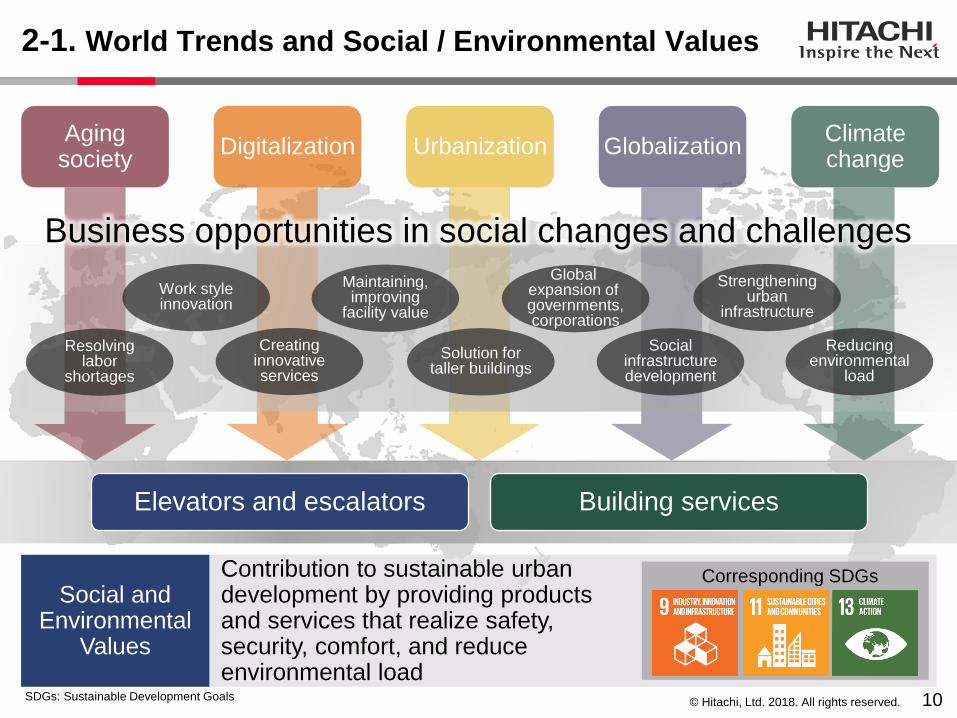
Agingsociety
Digitalization UrbanizationClimatechange
2-1. World Trends and Social / Environmental Values
Social andEnvironmental
Values
Contribution to sustainable urban development by providing products and services that realize safety, security, comfort, and reduceenvironmental load
Corresponding SDGs
SDGs: Sustainable Development Goals
Globalization
Creatinginnovativeservices
Strengtheningurban
infrastructure
Maintaining,improving
facility value
Work styleinnovation
Socialinfrastructuredevelopment
Solution fortaller buildings
Globalexpansion of governments,corporations
Resolvinglabor
shortages
Reducingenvironmental
load
Business opportunities in social changes and challenges

© Hitachi, Ltd. 2018. All rights reserved.
Expand globally, utilizing 20 years of experience in Japan with IoT services forE&E and building equipment
Provide new services combining OT × IT × Products utilizing the IoT platform Lumada
11
Provide competitive
E&E products
2-2. Basic Strategy
Utilizing data, provide fine-tuned building services globally
Product
Platform
E&E
・・・
Supplement laborshortages withservice robots
Analyze visitorinformation to increase
facility value
Realize comfortableand efficient mobile
environments
Optimizeelectricity
consumption
HVAC / lighting Security Mobility / human flow
IoT(remote monitoring)
AI / analytics Robotics
Provide solutions as services to customer
Customers
IoT platform Lumada
OT: Operational Technology AI: Artificial Intelligence

© Hitachi, Ltd. 2018. All rights reserved. 12
90%
100%
110%
2016 2017 2018 2019 2020 2021
Real GDP
E&E NI market
(Fiscal Year)
1. Market Environment
Year over
year growth
Slow down in growthand rising competition since FY2015
- New-Urbanization Plan- China Manufacturing 2025- Belt and Road Initiative
- Stable investment with urbanization- Business shifts with IoT evolution- Customers’ expansion outside China
Business opportunities etc.
Government policies
2. Hitachi’s China Business Strategy
E&Esales &
manufacturing
Buildingservices
- Over 50% of world’s NI market,
but slow down in growth
- Demand for E&E modernization
to rise in coming years
- Low E&E maintenance contract
ratio (potential for expansion
in the maintenance business)
Market condition- Improve profitability by acceleration of
cost structure reforms
- Expand exports utilizing high production capacity
- Expand E&E maintenance business, improve
profitability by data-utilizing maintenance
(remote monitoring service)
- Establish new building service business
Strategy
2-3. China: Market Environment and Strategy
ConstructionInvestments

© Hitachi, Ltd. 2018. All rights reserved. 13
2-4. China: Key Measures (1)
Visualize production procedures
for further efficiency in
production utilizing Lumada
Introduced to Chengdu factory
(China), other factories to follow
Offset impacts from price competition and increases in material costby cost structure reforms throughout the value chain
Visualize, analyze variability of working time by worker / model
Work analysis system
Video linkage systemConnect work records and video data to analyze work efficiency
Automatic video analysis system
Automatically analyze video data,
detect unnecessary procedures within
worker flow and work down time
2. Smart Production Reform
1. Reducing Material Costs
Data visualization, analysis
Working video linkage
Automatic video analysis
Globalexpansion
(FY2019~)
Collaborationamong fourfactoriesin China(FY2018)
Introducedto Chengdu
factory(FY2017)
Strengthening joint / centralizedpurchase within Hitachi group Joint / centralized purchase ratio (FY2017:55%→FY2018:69%)
Improve cost competitiveness: locate new suppliers through Hitachi group collaboration,
revise specs, standardize, multiple purchases, review internal / external production
Accelerating cost structure reformsE&E
sales & manufacturing

© Hitachi, Ltd. 2018. All rights reserved. 14
2-5. China: Key Measures (2)
Phnom Penh(Cambodia)
Johor Bahru(Malaysia)
Vientiane(Laos)
Orders received projects from strategic partners (FY2016-FY2017)
Sihanoukville(Cambodia)
Malaysia Princess Bay
Xi-hu International Hotel
The Bridge
Landmark
Expand exports aligned with strategic partners expanding overseas, such as to Asia
Improve product competitiveness by introducing global unified model,
standardized components (modular design)
Expand exports from ChinaE&E
sales & manufacturing
Improve profitability in China and grow business in Asiaby fully utilizing production capacity in China
© Hitachi, Ltd. 2018. All rights reserved. 15
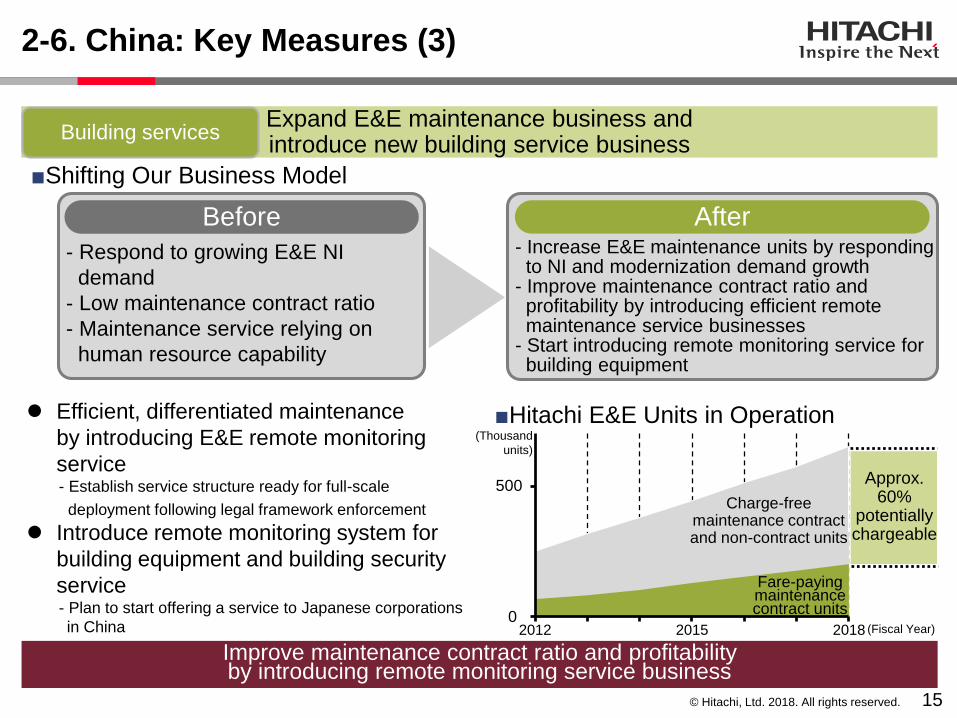
2-6. China: Key Measures (3)
Expand E&E maintenance business andintroduce new building service business
Building services
0
50
2012 2015 2018 (Fiscal Year)
(Thousand
units)
500
■Hitachi E&E Units in Operation
Approx.60%
potentiallychargeable
Fare-payingmaintenancecontract units
Charge-freemaintenance contractand non-contract units
■Shifting Our Business Model
Efficient, differentiated maintenance
by introducing E&E remote monitoring
service- Establish service structure ready for full-scale
deployment following legal framework enforcement
Introduce remote monitoring system for
building equipment and building security
service- Plan to start offering a service to Japanese corporations
in China
- Increase E&E maintenance units by respondingto NI and modernization demand growth
- Improve maintenance contract ratio andprofitability by introducing efficient remotemaintenance service businesses
- Start introducing remote monitoring service forbuilding equipment
After
- Respond to growing E&E NI
demand
- Low maintenance contract ratio
- Maintenance service relying on
human resource capability
Before
Improve maintenance contract ratio and profitabilityby introducing remote monitoring service business

© Hitachi, Ltd. 2018. All rights reserved. 16
1. Market Environment
2. Hitachi’s Asia / Middle East Business Strategy
95%
100%
105%
110%
115%
2016 2017 2018 2019 2020 2021
Year over
year growth
- Rapid urbanization- Conglomerates and state-owned
enterprises gaining presence
- Accelerating social infrastructuredevelopment
- Large urban development projectsled by conglomerates
Business opportunities etc.
Social trends
(Fiscal Year)
Expanding building-related demandsupported by economic growth
- Solid NI growth across region- Growth in India, which holds
about half of NI demand inAsia / Middle East region
- Matured NI demand and increasein modernization demand forcertain countries / regions
- Increasing labor costs leading todemand in efficient management
Market conditions- Respond to strong NI demand by enforcing
standardization strategy and full utilization of
resources in China
- Expand India business by commencing
factory establishment
- Expand E&E maintenance business by
introducing data utilizing maintenance
service (remote monitoring service) etc.
Strategy
Real GDP
E&E NI market
ConstructionInvestments
E&ESales &
manufacturing
Buildingservices
2-7. Asia / Middle East:Market Environment and Strategy

© Hitachi, Ltd. 2018. All rights reserved. 17
Philippines
Indonesia
VietnamCambodia
Laos
India
Thailand
Sales / Service
Kuwait
UAESaudi Arabia
OmanQatar
Korea
Change in number of bases in Asia / Middle East
China
(Total 4 factories)
Manufacturing
SingaporeMalaysia
Myanmar
As of 31st March2014
As of 31st March2018
57
83
Japan
Expand sales / service bases, develop product supply structure
corresponding to growth in NI demand
(Planning)
As “global motherfunction”, deploykey technology,
strengthenservice support(Planning)
Product supply flow
Component supply flow
Supply
components
Supply products
Supply products
2-8. Asia / Middle East:Strengthening Business Structure
Asia
MiddleEast

© Hitachi, Ltd. 2018. All rights reserved.
187 199 211
100
146 183
FY2016(Results)
FY2017(Results)
FY2018(Forecast)
Efficient, differentiated maintenance by introducing E&E remote monitoring service
- Trial services commenced in Singapore, Thailand and India
Enter maintenance / modernization service
businesses for other brand E&E- Horizontal expansion of Temple Lifts (U.K.) know-how
Expansion to othercountries / regions
18
2-9. Asia / Middle East: Key MeasuresO
/Ru
nits
(Ind
ex)
Dem
an
d (T
ho
usa
nd u
nits
)
O/R units
Increase competitiveness with standardized
products / components, products from China
100 135 156
FY2016(Results)
FY2017(Results)
FY2018(Forecast)
■Change in E&E NI Demand, O/R units
■Change in E&E Maintenance Sales (Index)
Deploy global-unifiedmodel (FY2020)
DeployChina-made
model (FY2018)
Deploy global-unified model(FY2017)
Promote modular designIncrease local procurement ratio
Elevators
Escalators
Components
Full-scale introduction(FY2019)
Trial servicescommenced(3 countries)
(FY2018)
Enforcing standardization strategy and utilizingresources in China to expand business
E&Esales & manufacturing
Expand E&E maintenance business byintroducing remote monitoring service etc.
Building services
© Hitachi, Ltd. 2018. All rights reserved. 19
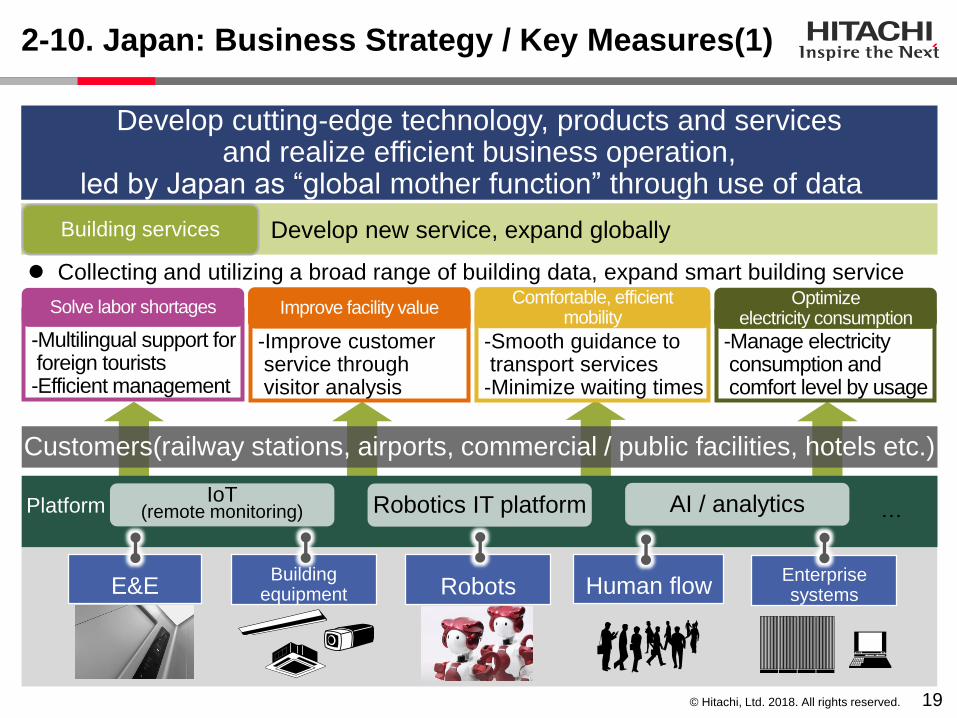
2-10. Japan: Business Strategy / Key Measures(1)
Develop cutting-edge technology, products and servicesand realize efficient business operation,
led by Japan as “global mother function” through use of data
Collecting and utilizing a broad range of building data, expand smart building service
E&E Robots Human flow
-Improve customer service through visitor analysis
Improve facility value
-Smooth guidance to transport services
-Minimize waiting times
Comfortable, efficientmobility
-Manage electricity consumption and comfort level by usage
Optimizeelectricity consumption
-Multilingual support for foreign tourists-Efficient management
Solve labor shortages
Buildingequipment
Customers(railway stations, airports, commercial / public facilities, hotels etc.)
Platform …IoT
(remote monitoring) Robotics IT platform AI / analytics
Develop new service, expand globallyBuilding services
Enterprisesystems

© Hitachi, Ltd. 2018. All rights reserved.
2-11. Japan: Business Strategy / Key Measures(2)
Development of world’s fastest*
1,260m/m elevator, global deployment
of key technology*As of June 2018, researched by Hitachi 20
Strengthen E&E modernization capabilityE&Esales & manufacturing
Promotion of key technology development and smart production reforms
E&Esales & manufacturing
Support productivity improvement efforts
in Chinese factories utilizing IoT technology
Increase remote monitoring units by
continued introduction of new products and
expanding O/R
■Change in E&E modernization target units(Hitachi E&E units installed)
Deploy Japanese technology, products and
know-how globally- Demand gradually rising in Singapore, China
100 112 115 129
FY2016(Results)
FY2017(Results)
FY2018(Forecasts)
FY2021(Target)
1980 1985 1990 1995
(Units)
Modernizationcompleted
(Fiscal Year)
Targets for modernization
(Units 25 years or older)
25 years or older:
31,500 units
- 31,500 Hitachi E&E units are 25 years or older,
a target in general for modernization
- Modernization target units will continue growing at
thousands of units / year
■Change in E&E modernization O/R units (Index)

© Hitachi, Ltd. 2018. All rights reserved.
2-12. Cost Strategy and Strengthen Cash Generation
21CCC:Cash Conversion Cycle
Furthering Hitachi Smart Transformation
(3.0)
(2.0)
(1.0)
0.0
1.0
2.0
FY2015(Results)
FY2016(Results)
FY2017(Results)
FY2018(Forecast)
Improvement point
Gross profit margin
SG&A ratio
Reduce indirect material cost
Reap operation reform effects ofinvestments in IT etc.
SG
&A
expense
Ca
sh
ge
ne
ratio
n
Promote collection of account receivable
Strengthen expense management, reduce
inventory
Select investment plan strictly and
secure investment return
Promote standardization for global
product development and manufacturing
Systematic management of production
capacity for eliminating losses
Introduce IoT remote monitoring for
improving work efficiency
Enforce strict QA to eliminate spoiled work
Gro
ss p
rofit
38.6days
FY2016(Results)
42.6days
FY2017(Results)
42.6days
FY2018(Forecast)
CCC44.2days
FY2015(Results)
© Hitachi, Ltd. 2018. All rights reserved.
Building Systems Business Unit
Business Strategy
Contents
22
1. Business Overview and Analysis of Current Status
2. Business Strategy
3. Conclusion

© Hitachi, Ltd. 2018. All rights reserved. 23
Revenues(Billion yen)
Adjusted operatingincome / EBIT(Billion yen)
Revenues Adjusted operating income [ratio] EBIT [ratio]
0
20
40
60
80
0
200
400
600
FY2015(Results)
FY2016(Results)
FY2017(Results)
FY2018(Forecast)
650.9
585.867.3[10.3%]
70.5[10.8%]
57.3[9.8%]
58.4[10.0%] 52.0
[9.0%]
580.0603.0
50.1[8.3%]
49.3[8.2%]
51.8[8.9%]
3-1. Business Performance Trends
Overseasrevenue ratio
56% 55%54%59%
Orders received(Billion yen)
583.9 600.0580.8626.2
© Hitachi, Ltd. 2018. All rights reserved.
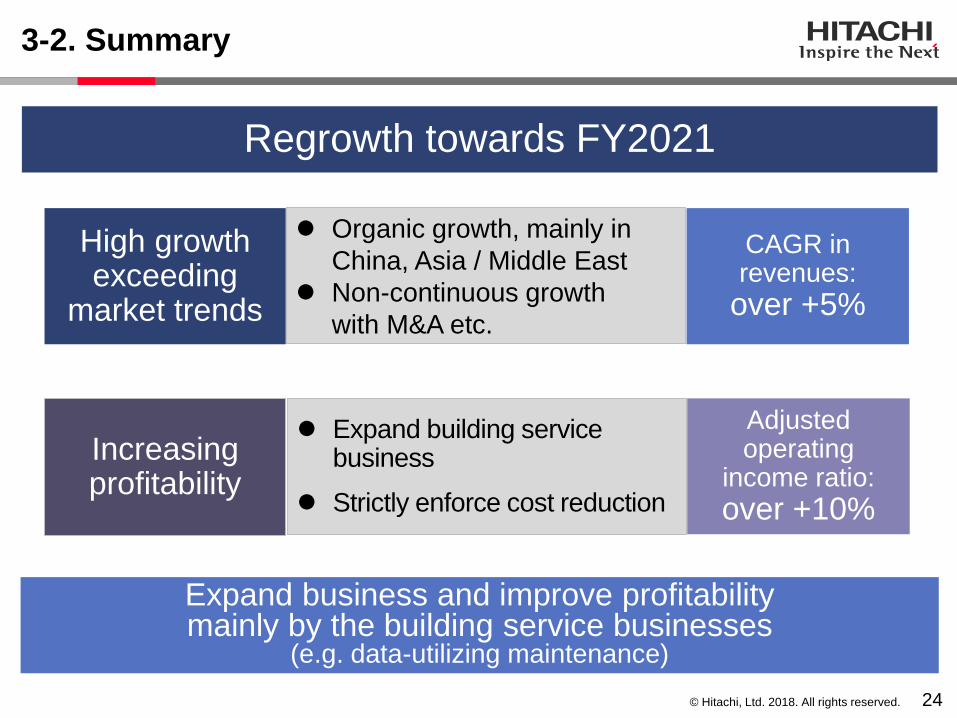
Organic growth, mainly in
China, Asia / Middle East
Non-continuous growth
with M&A etc.
24
Expand business and improve profitabilitymainly by the building service businesses
(e.g. data-utilizing maintenance)
Regrowth towards FY2021
High growthexceeding
market trends
Increasingprofitability
3-2. Summary
CAGR inrevenues:
over +5%
Expand building service business
Strictly enforce cost reduction
Adjustedoperating
income ratio:
over +10%

© Hitachi, Ltd. 2018. All rights reserved.
Cautionary Statement
25
Certain statements found in this document may constitute “forward-looking statements” as defined in the U.S. Private Securities Litigation Reform Act of 1995. Such “forward-looking
statements” reflect management’s current views with respect to certain future events and financial performance and include any statement that does not directly relate to any historical or
current fact. Words such as “anticipate,” “believe,” “expect,” “estimate,” “forecast,” “intend,” “plan,” “project” and similar expressions which indicate future events and trends may identify
“forward-looking statements.” Such statements are based on currently available information and are subject to various risks and uncertainties that could cause actual results to differ
materially from those projected or implied in the “forward-looking statements” and from historical trends. Certain “forward-looking statements” are based upon current assumptions of future
events which may not prove to be accurate. Undue reliance should not be placed on “forward-looking statements,” as such statements speak only as of the date of this document.
Factors that could cause actual results to differ materially from those projected or implied in any “forward-looking statement” and from historical trends include, but are not limited to:
economic conditions, including consumer spending and plant and equipment investment in Hitachi’s major markets, particularly Japan, Asia, the United States and Europe, as well as
levels of demand in the major industrial sectors Hitachi serves;
exchange rate fluctuations of the yen against other currencies in which Hitachi makes significant sales or in which Hitachi’s assets and liabilities are denominated;
uncertainty as to Hitachi’s ability to access, or access on favorable terms, liquidity or long-term financing;
uncertainty as to general market price levels for equity securities, declines in which may require Hitachi to write down equity securities that it holds;
fluctuations in the price of raw materials including, without limitation, petroleum and other materials, such as copper, steel, aluminum, synthetic resins, rare metals and rare-earth minerals,
or shortages of materials, parts and components;
the possibility of cost fluctuations during the lifetime of, or cancellation of, long-term contracts for which Hitachi uses the percentage-of-completion method to recognize revenue from
sales;
credit conditions of Hitachi’s customers and suppliers;
fluctuations in product demand and industry capacity;
uncertainty as to Hitachi’s ability to implement measures to reduce the potential negative impact of fluctuations in product demand, exchange rates and/or price of raw materials or
shortages of materials, parts and components;
uncertainty as to Hitachi’s ability to continue to develop and market products that incorporate new technologies on a timely and cost-effective basis and to achieve market acceptance for
such products;
increased commoditization of and intensifying price competition for products;
uncertainty as to Hitachi’s ability to attract and retain skilled personnel;
uncertainty as to Hitachi’s ability to achieve the anticipated benefits of its strategy to strengthen its Social Innovation Business;
uncertainty as to the success of acquisitions of other companies, joint ventures and strategic alliances and the possibility of incurring related expenses;
uncertainty as to the success of restructuring efforts to improve management efficiency by divesting or otherwise exiting underperforming businesses and to strengthen competitiveness;
the potential for significant losses on Hitachi’s investments in equity-method associates and joint ventures;
general socioeconomic and political conditions and the regulatory and trade environment of countries where Hitachi conducts business, particularly Japan, Asia, the United States and
Europe, including, without limitation, direct or indirect restrictions by other nations on imports and differences in commercial and business customs including, without limitation, contract
terms and conditions and labor relations;
uncertainty as to the success of cost structure overhaul;
uncertainty as to Hitachi’s access to, or ability to protect, certain intellectual property;
uncertainty as to the outcome of litigation, regulatory investigations and other legal proceedings of which the Company, its subsidiaries or its equity-method associates and joint ventures
have become or may become parties;
the possibility of incurring expenses resulting from any defects in products or services of Hitachi;
the possibility of disruption of Hitachi’s operations by natural disasters such as earthquakes and tsunamis, the spread of infectious diseases, and geopolitical and social instability such as
terrorism and conflict;
uncertainty as to Hitachi’s ability to maintain the integrity of its information systems, as well as Hitachi’s ability to protect its confidential information or that of its customers; and
uncertainty as to the accuracy of key assumptions Hitachi uses to evaluate its employee benefit-related costs.
The factors listed above are not all-inclusive and are in addition to other factors contained in other materials published by Hitachi.