Embed Size (px)
DESCRIPTION
Thermal Comfort Analysis
Citation preview
1
SCHOOL OF ARCHITECTURE, BUILDING & DESIGN
Modern Architecture Studies in Southeast Asia (MASSA) Research
Unit
Bachelor of Science (Honours) (Architecture)
BUILDING SCIENCE 1 [ARC 2412]
August 2013
Project 1: Human Perception of Comfort Level
ANG MIN QI 0302123
CHAN CHEE KIONG 0305473
CHRISTOPHER NG MAN KING 0309552
ELEANOR NG CUI SHAN 0302936
GARY CHONG 0302527
LIM PEI XUAN 0303862
LECTURER: MS CHERYL

2
CONTENT PAGES
A. SUMMARY 3
B. INTRODUCTION
B.1 Introduction to Site
B.2 Macro-Climate
B.3 Micro-Climate
4
5-12
13-14
15
C. METHODOLOGY
C.1 Tool and Instrument: Data Logger
C.2 Human Perception on Comfort Level
C.3 Details of Materials of Construction
C.4 Relevant to MS 1525 and UBBL
16-19
20
21
22-24
D. RESULT & ANALYSIS
D.1 Analysis on Data Logger Data
D.1.1 Relationship between Temperature and Relative Humidity
D.2 Thermal Analysis
D.2.1 Bioclimatic Chart
D.2.2 Thermal Heat Transfer
D.2.3 Factors Affecting Temperature of Chosen Room
D.2.4 Factors Affecting Building’s Climatic Performance
D.3 Wind Analysis
D.3.1 Wind Circulation in Chosen Site
D.3.2 Ventilation Investigated in Chosen Room
D.4 Sun Analysis
D.4.1 Sun Path in Chosen Site
D.4.2 Sun Shadow Investigated in Chosen Room
25
26
27
27-32
33-38
39-40
41-42
43-49
E. CONCLUSION 50
F. REFERENCES 51-52
G. APPENDIX 53-60
3
A. SUMMARY
Considering Majors and Various factors according to the Science of buildings, Thermal
evolution within the spaces and the building environment is a major factor to be considered
among the diverse factors called Standards in the building industry (MS 1525 for Malaysia)
In Simple Explanations, the aim for this project is mostly to acquire an adequate
understanding of the Thermal Theories residing in the Theory of Thermal and Ventilation
Standards according to the Malaysian Building Standard MS 1525.
The task for this project consists of choosing a space in a housing unit (house), and then
analyzing the space in terms of thermal quantities such as temperature, relative humidity,
occupants activities and thermal behaviour. This Experiment was relatively established
according to the change in temperature of the Exterior Surrounding of the house to the in
interior of the house.
In order to do such analysis, a Data logger, also called the Hydrometer, was allocated to each
group and it is the instrument used to measure the temperature change and Relative Humidity
in the space.
A Wind rose diagram and a complete analysis of the thermal behaviour of the exterior,
meaning the Relative humidity and Temperature change has been executed. Macro and Micro
analysis of the thermal behaviour has also been included in this experiment which can lead to
a comparative analysis in between the overall house (including interior and exterior) and the
chosen zone in the house.
MS 1525 standards and requirements has been verified and analyzed throughout the whole
building system including superstructure and infrastructure such as openings, alternative
cooling devices and occupants’ daily circulation paths.

4
B. INTRODUCTION
This Report is a complete analytical document about the thermal behaviour of which the
impact of the weather outside is affecting the space enclosed from inside to outside. A study
about Thermal Comfort including their diverse factors and proofs obtained during the
analytical and experimental stages of this project’s journey.
Various Factors and aspects of the space chosen which is the Living room of the house
situated in Damansara at this specific address, 11A Jalan Kenyalang 11/15i , 47810 Kota
Damansara. Factors affecting the thermal comfort within the space such as, Bio-climatic
Change, Sun path during a year’s cycle, the wind rose within the surrounding region, and also
the activity roaster of the activities experienced by the occupants during these three days of
experiment.
Full explanation concerning the different stages executed during the experiment’s session has
been elaborated through a whole topic of this report also including proof of the reactions
through a set of diagrams, charts and tables explaining how Bio-climatic change can have
such a significant impact on the chosen space. Research and analysis has also been executed
on a topic which can be considered critical in the thermal comfort of a house, Human
metabolism. As humans are living bodies, they emit heat to the surrounding as they also
absorbs heat from the surrounding. So, the aim of the analysis is to find out proofs of
techniques of how architects use to make the space within stay at an average tolerable
temperature to the human metabolism which is mostly the aim and meaning of the term
Thermal Comfort.

5
B.1 INTRODUCTION TO SITE
KOTA DAMANSARA
Fig. 1: Site plan of the location of the living area concerned
The House where the analysis has been executed is located in Kota Damansara in the state of
Subang Jaya, Malaysia. The house is of type a Semi-detached House and is situated in a
private residential housing area which is one of Sunway’s properties. Once in the area, it can
actually be seen that the circulation pattern creating a grid consisting of lateral and
longitudinal paths. The house’s exact location is pointed at the Housing area’s site plan .
6
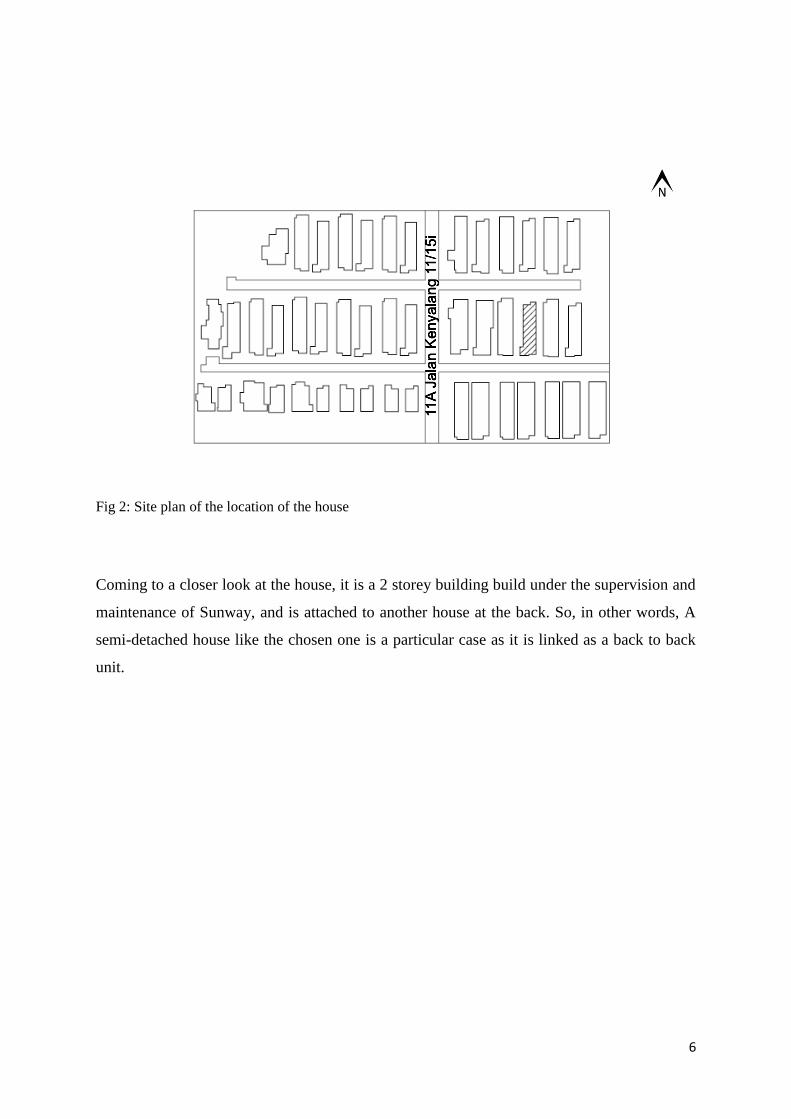
Fig 2: Site plan of the location of the house
Coming to a closer look at the house, it is a 2 storey building build under the supervision and
maintenance of Sunway, and is attached to another house at the back. So, in other words, A
semi-detached house like the chosen one is a particular case as it is linked as a back to back
unit.
7
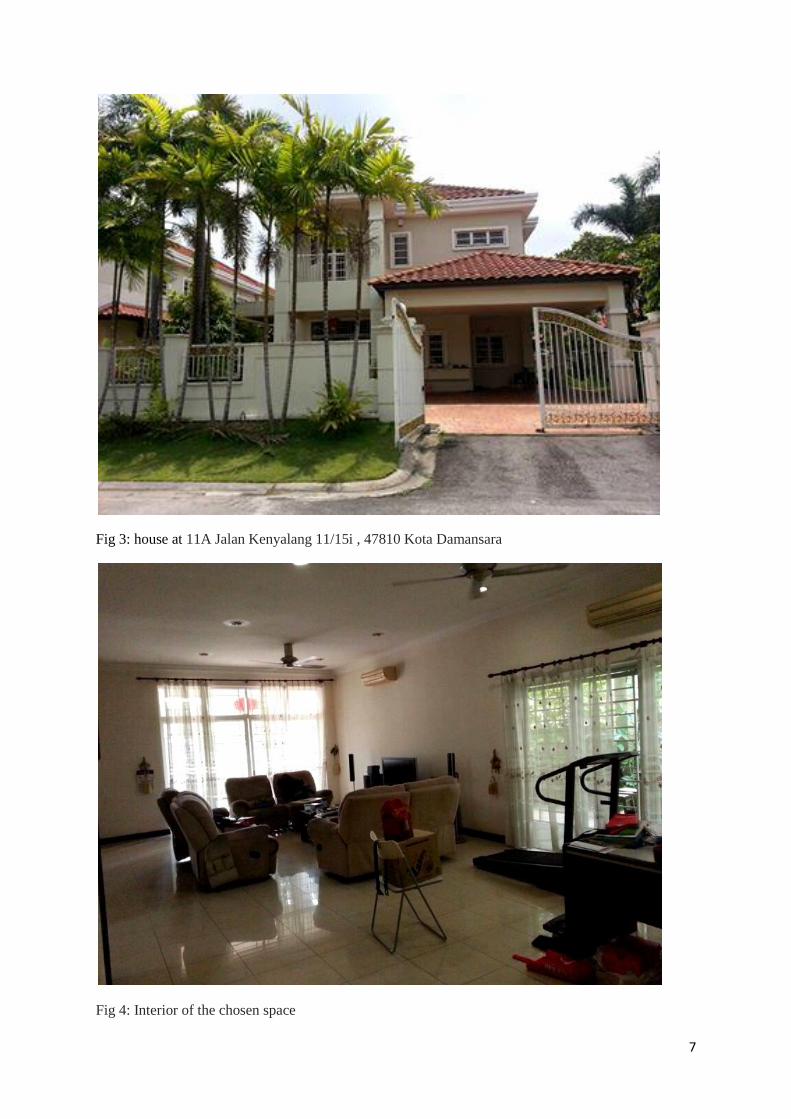
Fig 3: house at 11A Jalan Kenyalang 11/15i , 47810 Kota Damansara
Fig 4: Interior of the chosen space

8
Fig 5: Elevated view of the Living room
9
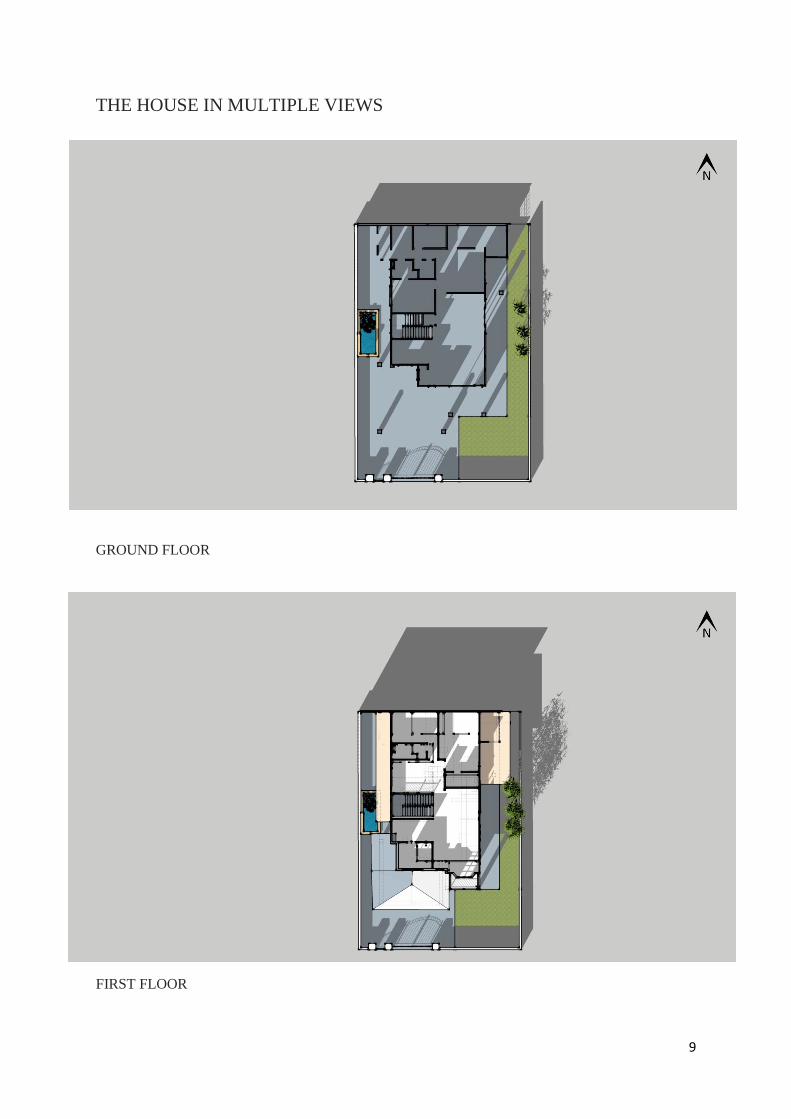
THE HOUSE IN MULTIPLE VIEWS
GROUND FLOOR
FIRST FLOOR
10
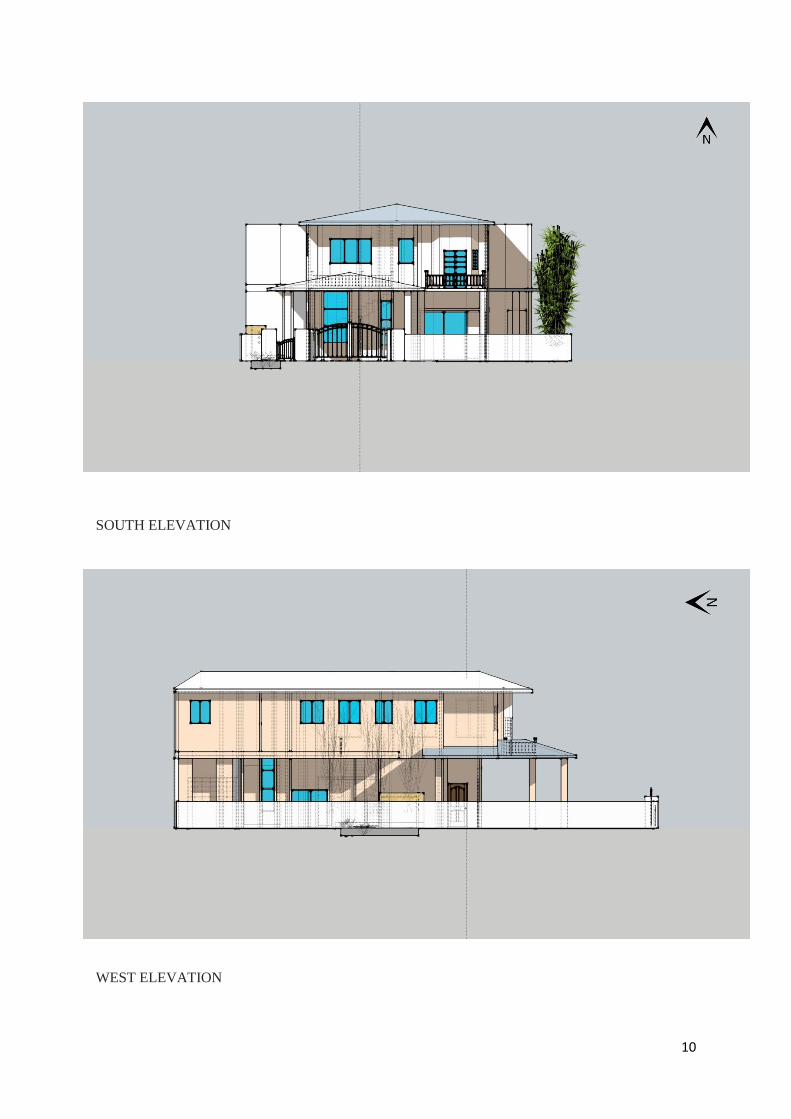
SOUTH ELEVATION
WEST ELEVATION

11
EAST ELEVATION
TOP VIEW
12
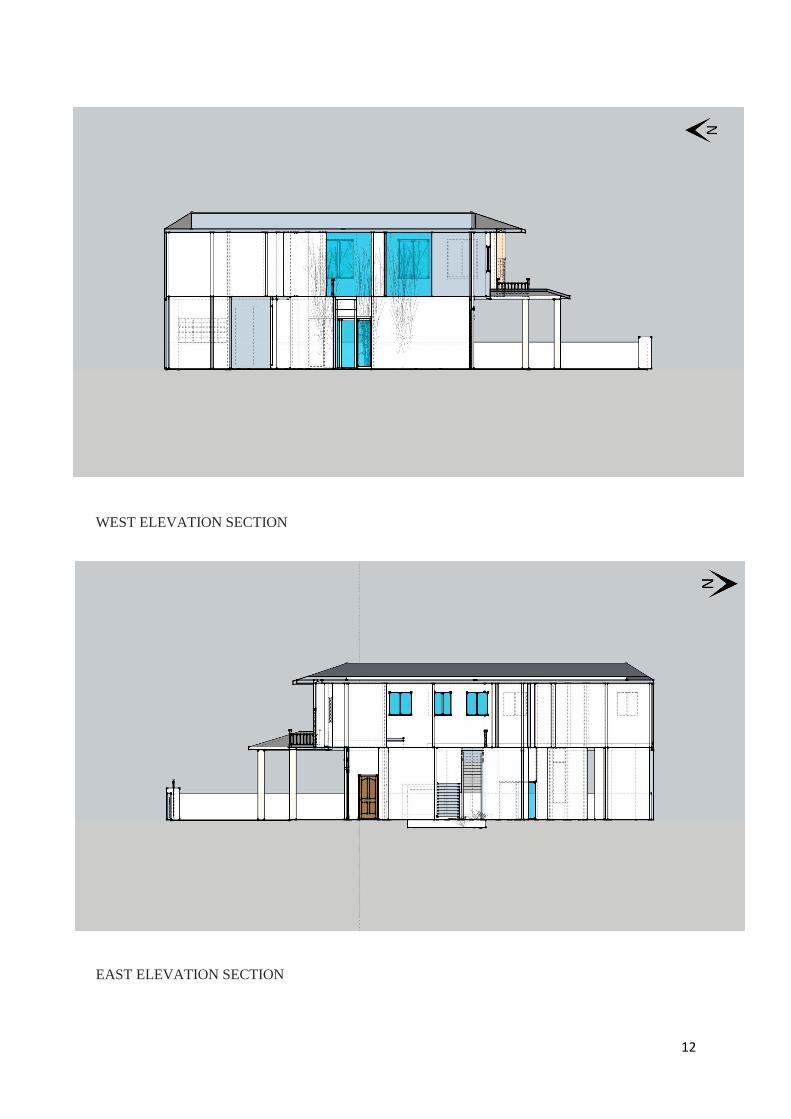
WEST ELEVATION SECTION
EAST ELEVATION SECTION
13
B.2 MACRO-CLIMATE
Malaysia’s macro climate consists of a tropical climate. Its humidity and temperatures are
constant and high. Its wind speed is low on average. The house has been designed to adapt
towards this hot and humid climate. Its orientation and shading devices have been made to
prevent heat gain and encourage air movement within the structural compound.
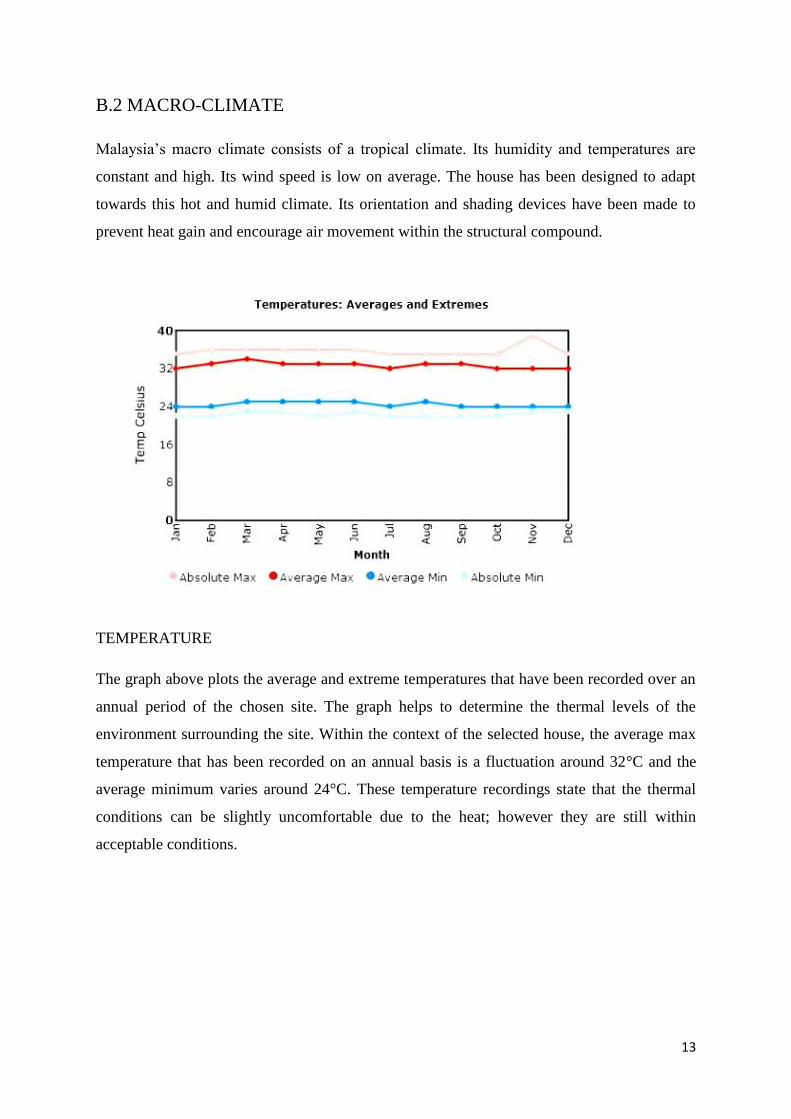
TEMPERATURE
The graph above plots the average and extreme temperatures that have been recorded over an
annual period of the chosen site. The graph helps to determine the thermal levels of the
environment surrounding the site. Within the context of the selected house, the average max
temperature that has been recorded on an annual basis is a fluctuation around 32°C and the
average minimum varies around 24°C. These temperature recordings state that the thermal
conditions can be slightly uncomfortable due to the heat; however they are still within
acceptable conditions.
14
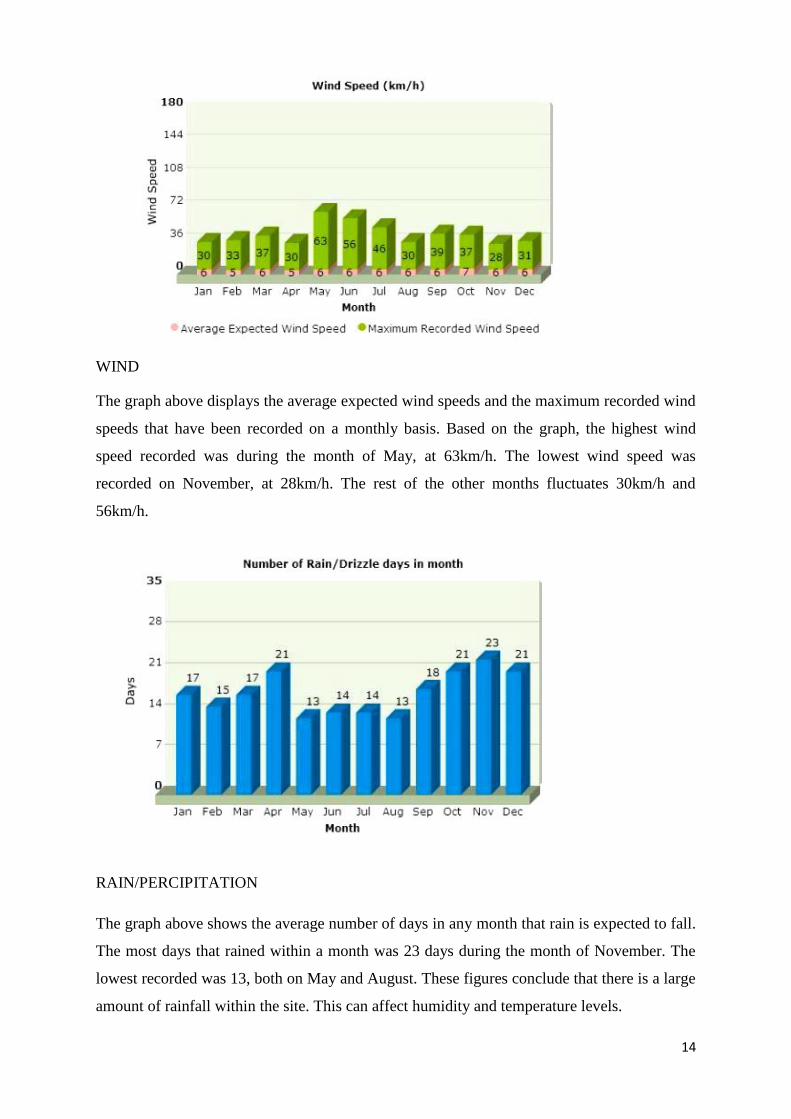
WIND
The graph above displays the average expected wind speeds and the maximum recorded wind
speeds that have been recorded on a monthly basis. Based on the graph, the highest wind
speed recorded was during the month of May, at 63km/h. The lowest wind speed was
recorded on November, at 28km/h. The rest of the other months fluctuates 30km/h and
56km/h.
RAIN/PERCIPITATION
The graph above shows the average number of days in any month that rain is expected to fall.
The most days that rained within a month was 23 days during the month of November. The
lowest recorded was 13, both on May and August. These figures conclude that there is a large
amount of rainfall within the site. This can affect humidity and temperature levels.
15
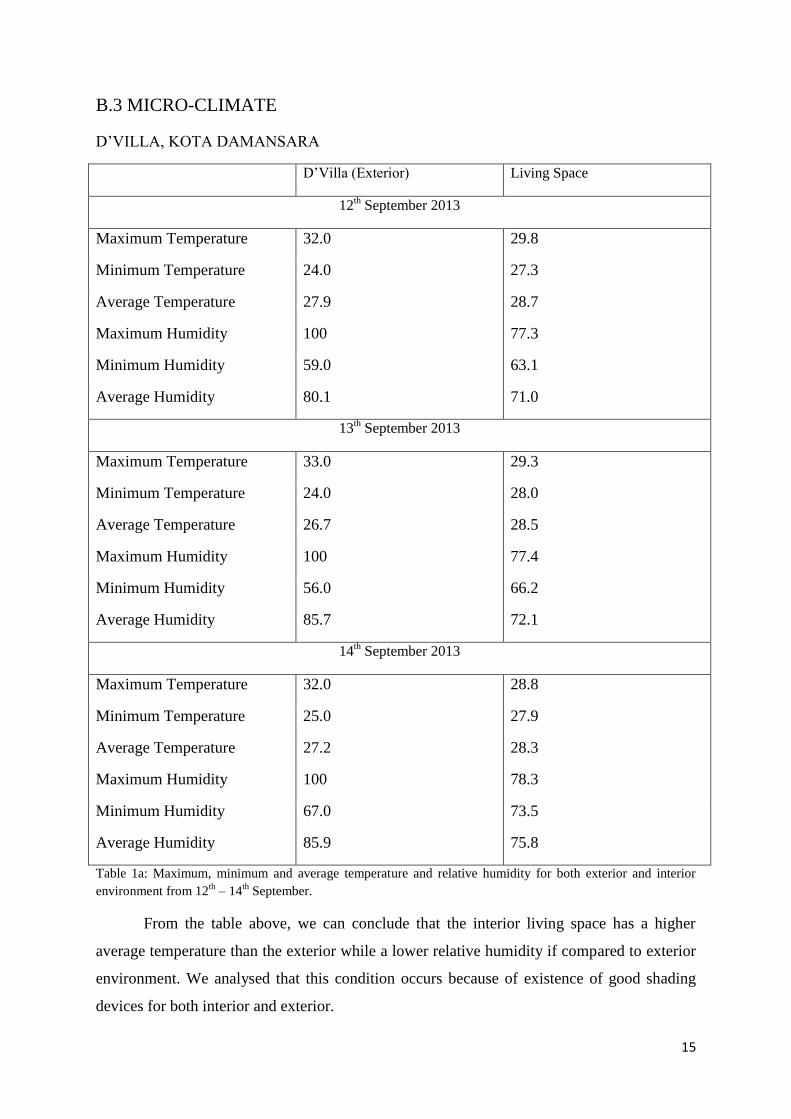
B.3 MICRO-CLIMATE
D’VILLA, KOTA DAMANSARA
D’Villa (Exterior) Living Space
12th September 2013
Maximum Temperature 32.0 29.8
Minimum Temperature 24.0 27.3
Average Temperature 27.9 28.7
Maximum Humidity 100 77.3
Minimum Humidity 59.0 63.1
Average Humidity 80.1 71.0
13th September 2013
Maximum Temperature 33.0 29.3
Minimum Temperature 24.0 28.0
Average Temperature 26.7 28.5
Maximum Humidity 100 77.4
Minimum Humidity 56.0 66.2
Average Humidity 85.7 72.1
14th September 2013
Maximum Temperature 32.0 28.8
Minimum Temperature 25.0 27.9
Average Temperature 27.2 28.3
Maximum Humidity 100 78.3
Minimum Humidity 67.0 73.5
Average Humidity 85.9 75.8
Table 1a: Maximum, minimum and average temperature and relative humidity for both exterior and interior
environment from 12th
– 14th
September.
From the table above, we can conclude that the interior living space has a higher
average temperature than the exterior while a lower relative humidity if compared to exterior
environment. We analysed that this condition occurs because of existence of good shading
devices for both interior and exterior.
16
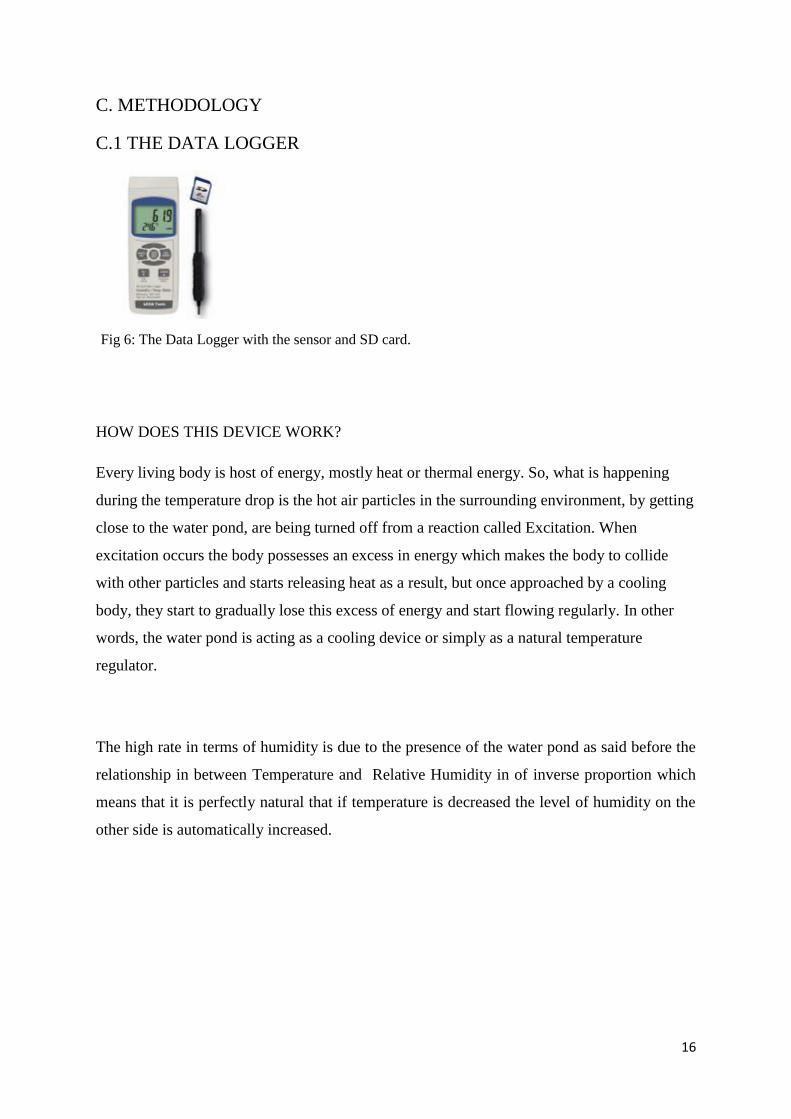
Fig 6: The Data Logger with the sensor and SD card.
C. METHODOLOGY
C.1 THE DATA LOGGER
HOW DOES THIS DEVICE WORK?
Every living body is host of energy, mostly heat or thermal energy. So, what is happening
during the temperature drop is the hot air particles in the surrounding environment, by getting
close to the water pond, are being turned off from a reaction called Excitation. When
excitation occurs the body possesses an excess in energy which makes the body to collide
with other particles and starts releasing heat as a result, but once approached by a cooling
body, they start to gradually lose this excess of energy and start flowing regularly. In other
words, the water pond is acting as a cooling device or simply as a natural temperature
regulator.
The high rate in terms of humidity is due to the presence of the water pond as said before the
relationship in between Temperature and Relative Humidity in of inverse proportion which
means that it is perfectly natural that if temperature is decreased the level of humidity on the
other side is automatically increased.

17
Fig 6: The location of Data Logger in the Living Room as Chosen Site.
Start: 10.00 pm on 11th
September 2013
End: 10.00 pm on 14th September 2013
For this experiment, a particular instrument used to measure the fluctuations in temperature
and internal relative humidity called as the Hydrometer has been used at a duration of three
days to measure the thermal behaviour within the Living Room. Formally for the proper
usage of the data logger, the apparatus is placed at a height of 1m above ground level
approximately in the centre of the space. The yellow dot indicates the location of the
Hydrometer. During the whole 3 days of the experiment the Hydrometer will be exposed to
the behaviour of the room without the usage of the Air-con in order to not disturb the trend of
the original thermal behaviour of the room.
Readings will keep on being recorded by the data logger and at the end of the experiment,
graphs are plotted in order to compare the difference between the interior temperature and
relative humidity (RH) and as well as the exterior. Relationships of inverse proportion are
also found between Temperature and relative humidity.

18
Fig 7: Micro-environment of the chosen space: The Living Room
Fig 8: Perspective View of the Living Room
19
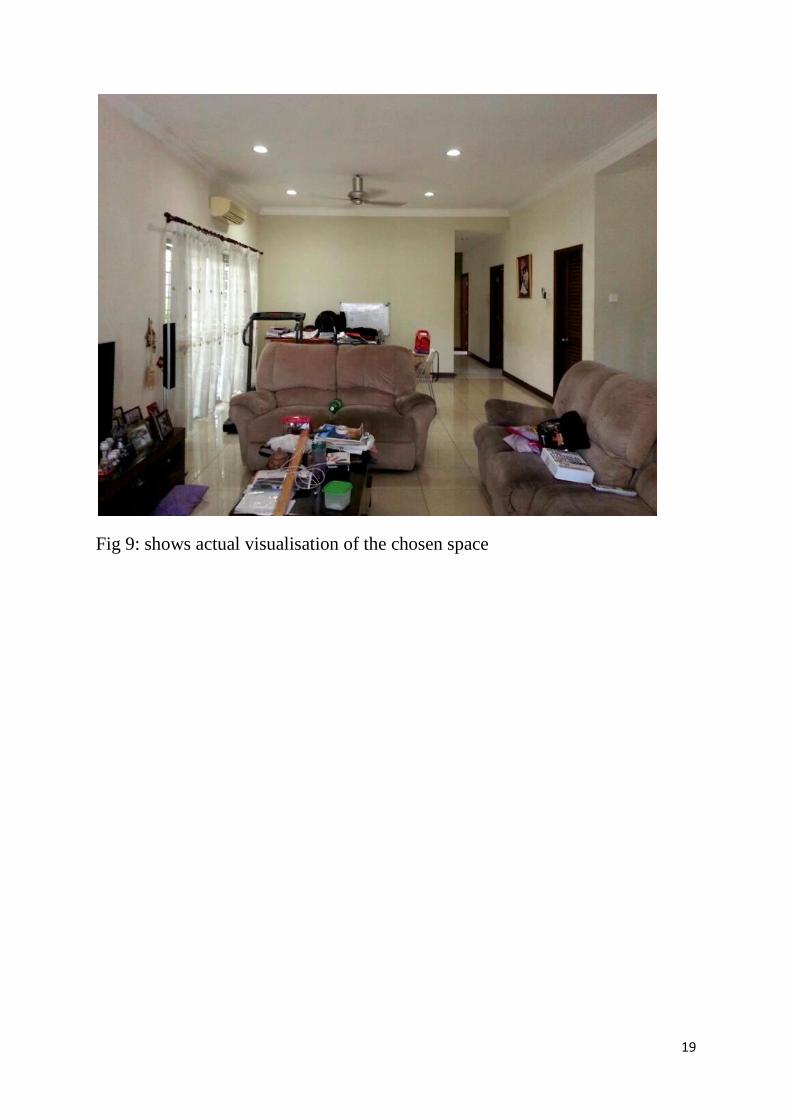
Fig 9: shows actual visualisation of the chosen space
20
C.2 HUMAN PERCEPTION ON COMFORT LEVEL
According to the universal standard ASHRAE Standard 55, which can also be considered as a
condition of the human mind and perception. According to the standard, the human instinct of
perception will express emotions and expressions of discomfort or comfort in relationship to the
surrounding thermal condition in the space.
This was divided into three categories of factors that affect the comfort level of the space
occupants such as personal and individual factors, measurable environmental factors and
psychological factors.
Thermal comfort is mostly affected by the type of clothing wore by the host, the activities
occurring in the area as well as the human metabolism and also the body mass. According to
simple logic, the higher the percentage of fat and other insulating matters in a body, the more the
heat gain and the less the fat percentage, the lower the heat gain. In other words, the body mass
factor of a person will mostly affect his own comfort towards the thermal ambiance in his/her
surrounding.
According to MS1525, the design conditions, for interior air-conditioned spaces for better
adequate comfort at a cooler environment should be considered as following. The recommended
type of dry bulb to be used should be able to emit heat at a restricted maximal range of 23 degree
Celsius to 26 degree Celsius. The minimum temperature should be of average 22 degree Celsius
so that the occupant would feel comfortable.
Besides that, recommended air movement should be in the range of 0.15 m/s to 0.50 m/s and the
maximum air movement should be around 0.7 m/s. Major flow of air particles waves would also
lead to comfortable air ventilation for individual at indoors, with respect to human comfort
tolerance. Recommended level of relative humidity should be around 55 % to 70 % in order to
keep the space occupant thermally comfortable.
The metabolic rate depends on the activity. It is normally measured in the unit “met”. A met is
defined as the metabolic rate per unit area of a sedentary person and is found to be equal to about
58.2 W/m2. This is also known as “basal metabolic rate”. Table 29.1 shows typical metabolic
rates for different activities: Studies show that the metabolic rate can be correlated to the rate
of respiratory oxygen consumption and carbon dioxide production. Based on this empirical
equations have been developed which relate metabolic rate to O2 consumption and CO2
production.
21
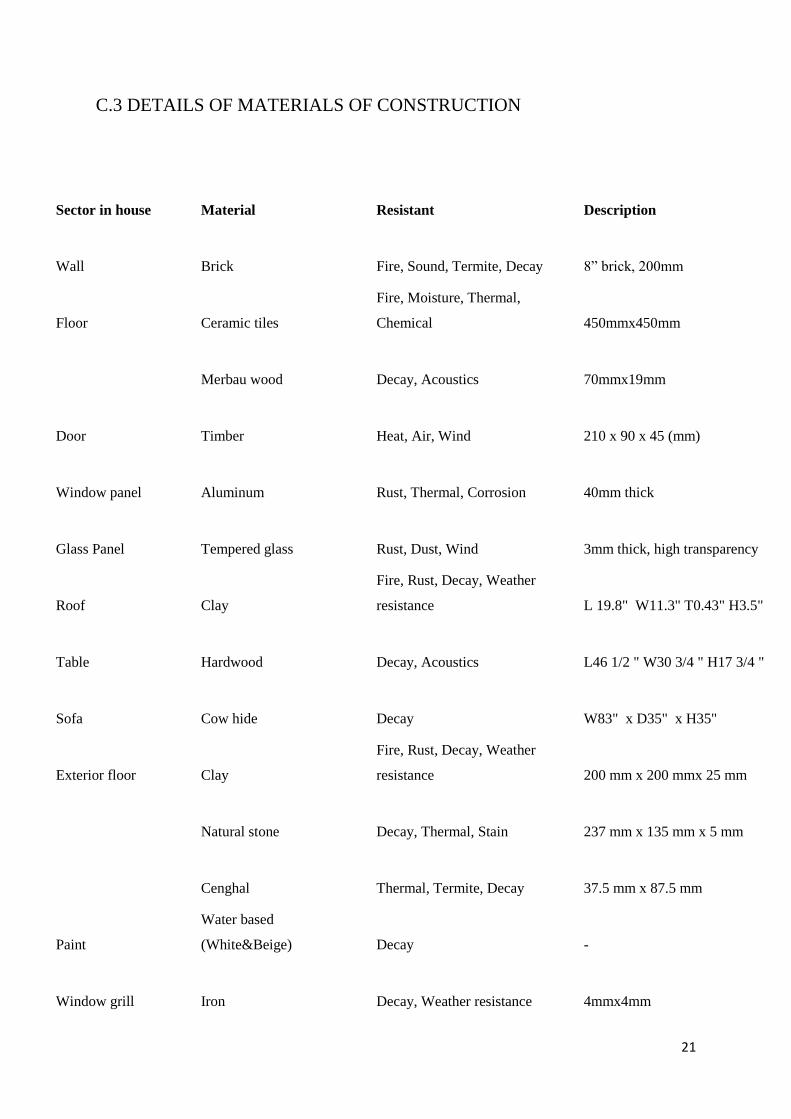
C.3 DETAILS OF MATERIALS OF CONSTRUCTION
Sector in house Material Resistant Description U-value (W/m2k)
Wall Brick Fire, Sound, Termite, Decay 8” brick, 200mm 0.41
Floor Ceramic tiles
Fire, Moisture, Thermal,
Chemical 450mmx450mm 0.8
Merbau wood Decay, Acoustics 70mmx19mm 0.18
Door Timber Heat, Air, Wind 210 x 90 x 45 (mm) 3
Window panel Aluminum Rust, Thermal, Corrosion 40mm thick 1.3
Glass Panel Tempered glass Rust, Dust, Wind 3mm thick, high transparency 3
Roof Clay
Fire, Rust, Decay, Weather
resistance L 19.8" W11.3" T0.43" H3.5" 0.2
Table Hardwood Decay, Acoustics L46 1/2 " W30 3/4 " H17 3/4 " 0.65
Sofa Cow hide Decay W83" x D35" x H35" 0.2
Exterior floor Clay
Fire, Rust, Decay, Weather
resistance 200 mm x 200 mmx 25 mm 0.13
Natural stone Decay, Thermal, Stain 237 mm x 135 mm x 5 mm 0.25
Cenghal Thermal, Termite, Decay 37.5 mm x 87.5 mm 0.18
Paint
Water based
(White&Beige) Decay - -
Window grill Iron Decay, Weather resistance 4mmx4mm 0.206
22
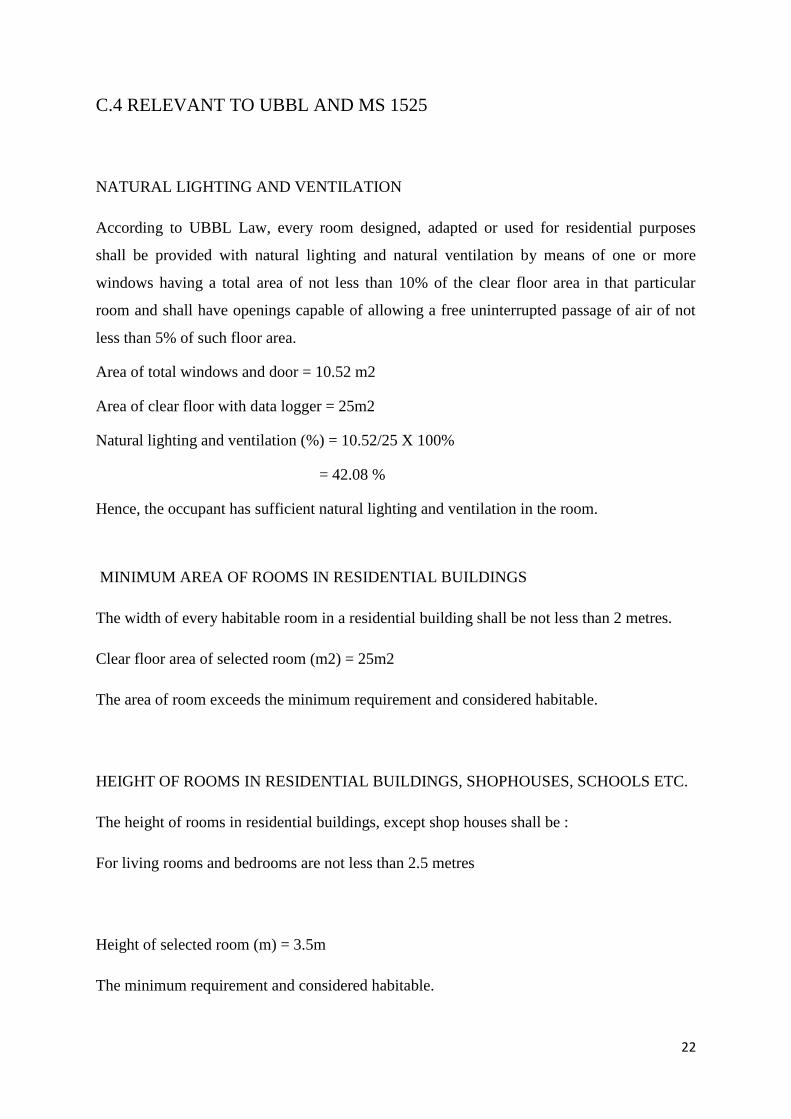
C.4 RELEVANT TO UBBL AND MS 1525
NATURAL LIGHTING AND VENTILATION
According to UBBL Law, every room designed, adapted or used for residential purposes
shall be provided with natural lighting and natural ventilation by means of one or more
windows having a total area of not less than 10% of the clear floor area in that particular
room and shall have openings capable of allowing a free uninterrupted passage of air of not
less than 5% of such floor area.
Area of total windows and door = 10.52 m2
Area of clear floor with data logger = 25m2
Natural lighting and ventilation (%) = 10.52/25 X 100%
= 42.08 %
Hence, the occupant has sufficient natural lighting and ventilation in the room.
MINIMUM AREA OF ROOMS IN RESIDENTIAL BUILDINGS
The width of every habitable room in a residential building shall be not less than 2 metres.
Clear floor area of selected room (m2) = 25m2
The area of room exceeds the minimum requirement and considered habitable.
HEIGHT OF ROOMS IN RESIDENTIAL BUILDINGS, SHOPHOUSES, SCHOOLS ETC.
The height of rooms in residential buildings, except shop houses shall be :
For living rooms and bedrooms are not less than 2.5 metres
Height of selected room (m) = 3.5m
The minimum requirement and considered habitable.

23
According to UBBL, residential buildings shall be provided with natural lighting and natural
ventilation. The openings area should not be less than 10% of floor area. The reason for this
standard is to allow sufficient natural ventilation and sunlight to penetrate through the
buildings so that each floor would have enough light and ventilation. In this house, the front
sliding door opening provides efficient sunlight but due to the wrong orientation of house,
natural ventilation is poor.
Fig 10: Wind flow and direct sunlight of building
According to UBBL, in order to achieve thermal comfort through air movement, a large
opening at the external and internal wall should be made. Therefore, 15% to 20% of external
openings are required on an external wall for achieving suitable amount of air movement
24
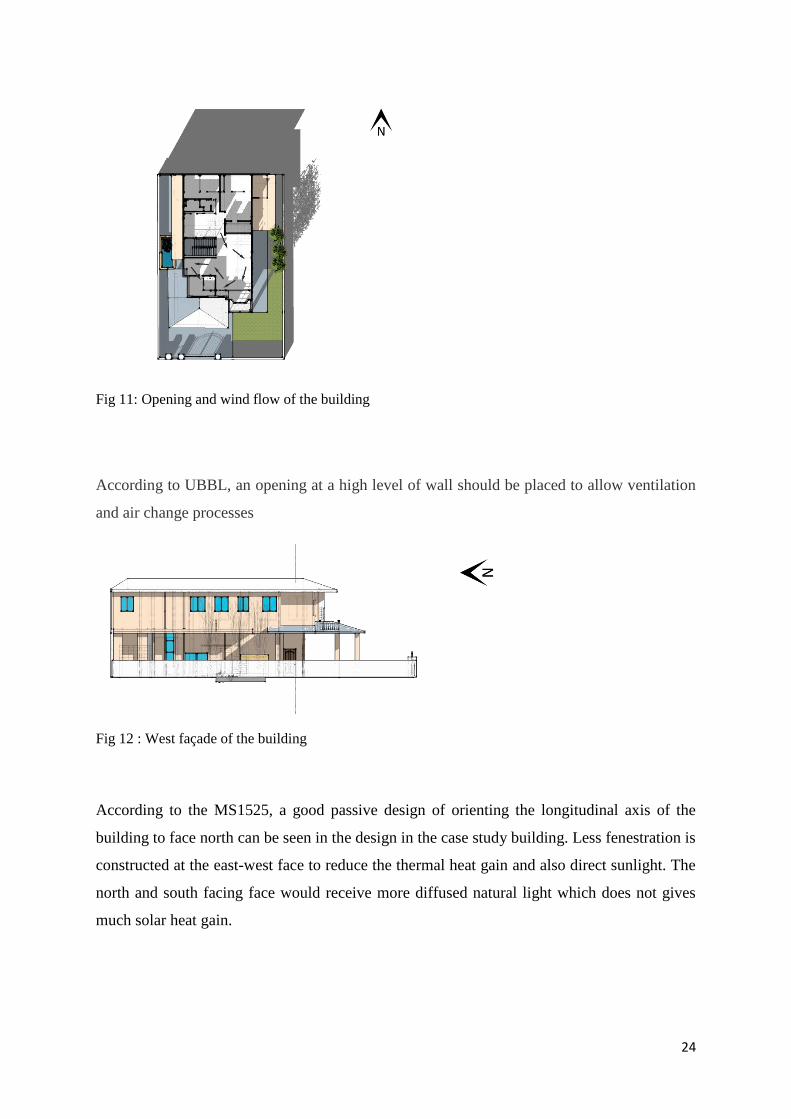
Fig 11: Opening and wind flow of the building
According to UBBL, an opening at a high level of wall should be placed to allow ventilation
and air change processes
Fig 12 : West façade of the building
According to the MS1525, a good passive design of orienting the longitudinal axis of the
building to face north can be seen in the design in the case study building. Less fenestration is
constructed at the east-west face to reduce the thermal heat gain and also direct sunlight. The
north and south facing face would receive more diffused natural light which does not gives
much solar heat gain.
25
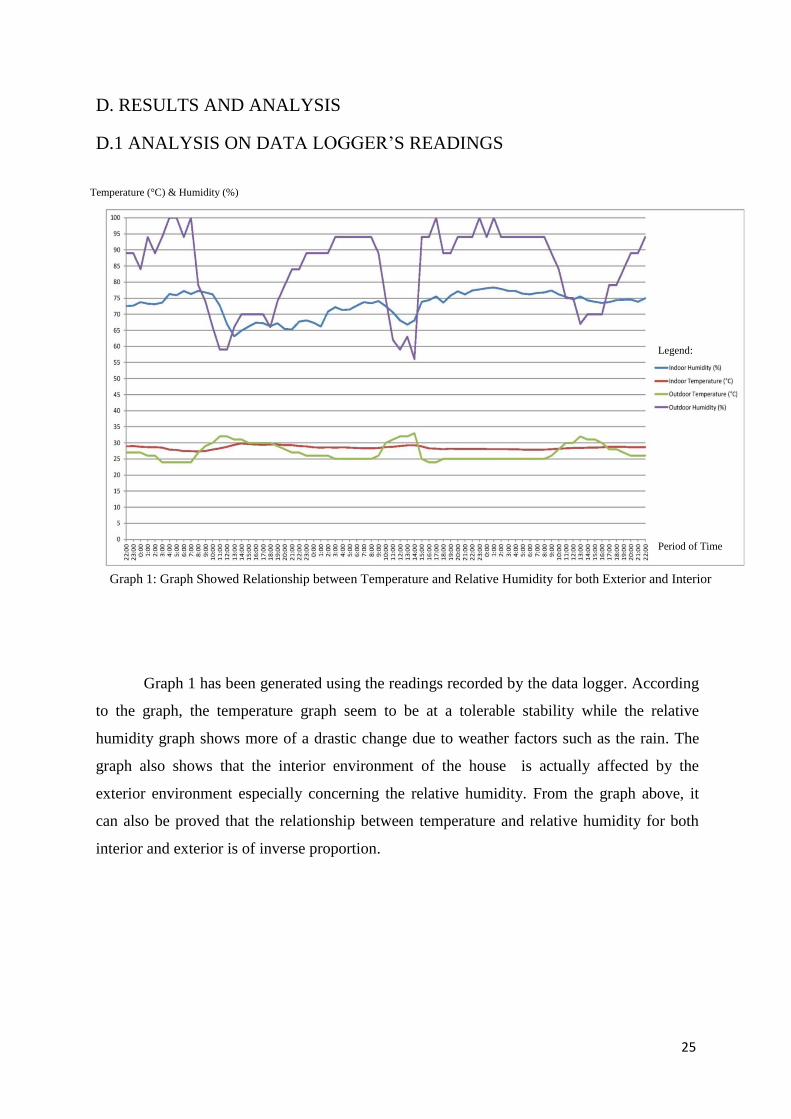
D. RESULTS AND ANALYSIS
D.1 ANALYSIS ON DATA LOGGER’S READINGS
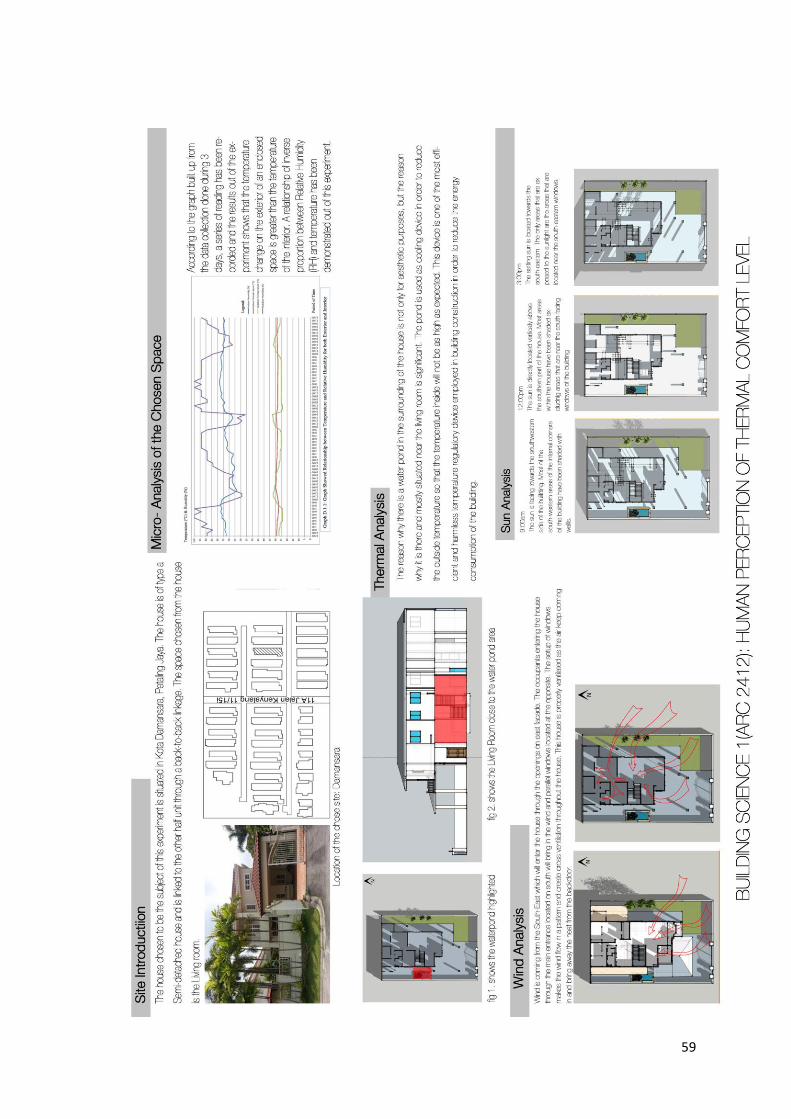
Graph 1 has been generated using the readings recorded by the data logger. According
to the graph, the temperature graph seem to be at a tolerable stability while the relative
humidity graph shows more of a drastic change due to weather factors such as the rain. The
graph also shows that the interior environment of the house is actually affected by the
exterior environment especially concerning the relative humidity. From the graph above, it
can also be proved that the relationship between temperature and relative humidity for both
interior and exterior is of inverse proportion.
Period of Time
P
Legend:
Temperature (°C) & Humidity (%)
Graph 1: Graph Showed Relationship between Temperature and Relative Humidity for both Exterior and Interior

26
D.1.1 ANALYSIS OF RELATIONSHIP BETWEEN TEMPERATURE AND
RELATIVE HUMIDITY
The graph showed the relationship between temperature and relative humidity is inversely
proportional.
On a Analytical point of view, it can be seen that the temperature and relative humidity for
Indoor Space, mostly the temperature graph is close to be a perfect constant graph except for
few fluctuation caused by drastic fluctuation from the environment outside. Logically, by
comparing the 2 graphs, people would say that the temperature inside would be supposed to
rise and drop together with the outside temperature and other conditions according to building
techniques and technologies for tropical countries.
The reason why such a phenomenon is occurring for this house is that the architect, while
designing, created a non-consumer of energy device which is very simple and humble and
which at the same time does not affect the environment in terms of pollution. This device is
actually the water pond located at the Western area of the house which is positioned just next
to the living room’s sliding door. This body actually acts as a cooling device by reducing the
temperature outside which is near to the sliding door.
27
D.2 THERMAL ANALYSIS
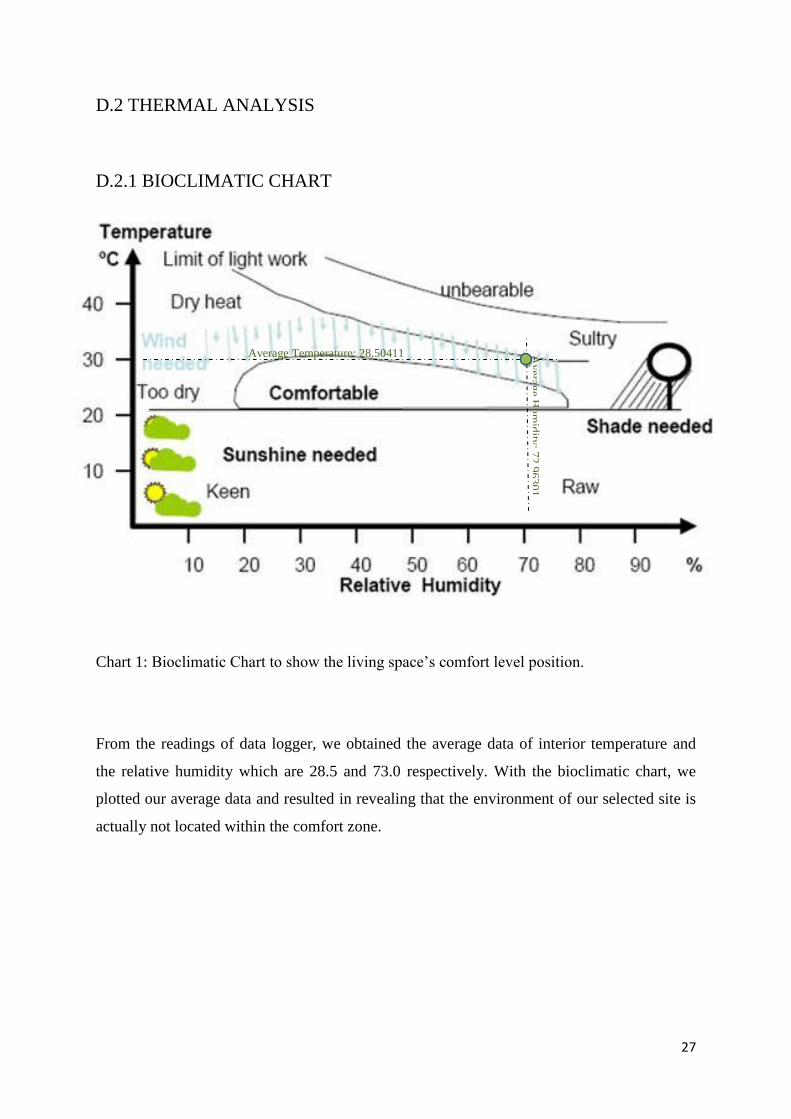
D.2.1 BIOCLIMATIC CHART
Chart 1: Bioclimatic Chart to show the living space’s comfort level position.
From the readings of data logger, we obtained the average data of interior temperature and
the relative humidity which are 28.5 and 73.0 respectively. With the bioclimatic chart, we
plotted our average data and resulted in revealing that the environment of our selected site is
actually not located within the comfort zone.
Average Temperature: 28.50411 Av
erage H
um
idity
: 72
.963
01
28
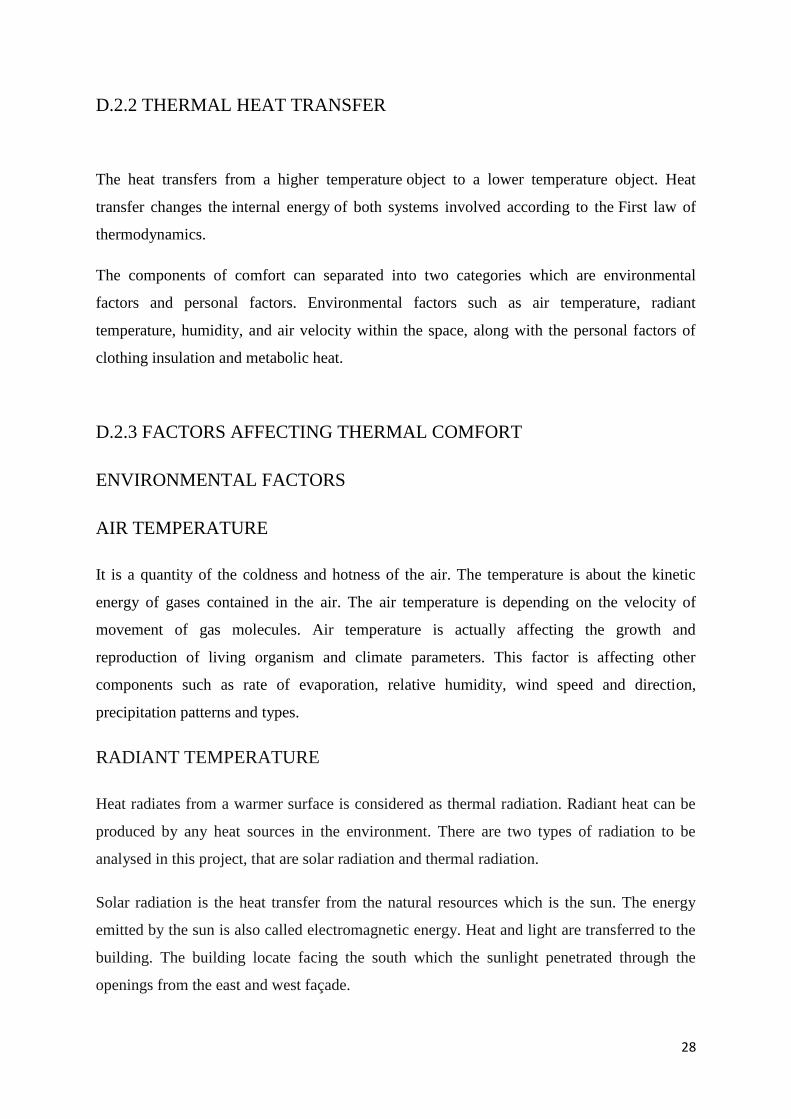
D.2.2 THERMAL HEAT TRANSFER
The heat transfers from a higher temperature object to a lower temperature object. Heat
transfer changes the internal energy of both systems involved according to the First law of
thermodynamics.
The components of comfort can separated into two categories which are environmental
factors and personal factors. Environmental factors such as air temperature, radiant
temperature, humidity, and air velocity within the space, along with the personal factors of
clothing insulation and metabolic heat.
D.2.3 FACTORS AFFECTING THERMAL COMFORT
ENVIRONMENTAL FACTORS
AIR TEMPERATURE
It is a quantity of the coldness and hotness of the air. The temperature is about the kinetic
energy of gases contained in the air. The air temperature is depending on the velocity of
movement of gas molecules. Air temperature is actually affecting the growth and
reproduction of living organism and climate parameters. This factor is affecting other
components such as rate of evaporation, relative humidity, wind speed and direction,
precipitation patterns and types.
RADIANT TEMPERATURE
Heat radiates from a warmer surface is considered as thermal radiation. Radiant heat can be
produced by any heat sources in the environment. There are two types of radiation to be
analysed in this project, that are solar radiation and thermal radiation.
Solar radiation is the heat transfer from the natural resources which is the sun. The energy
emitted by the sun is also called electromagnetic energy. Heat and light are transferred to the
building. The building locate facing the south which the sunlight penetrated through the
openings from the east and west façade.

29
Fig 14: The electric appliances installed in the living space produced thermal radiation
Balcony (1) and the Roof (2) are actually helped in preventing the direct radiate from the
sunlight above.
Sliding Glass Door (3) provided the living space good ventilation while at the same time
reducing the light penetrates directly into the house.
Tall trees (4) located at the east side of the building helped a lot in reducing the surrounding
temperature and act as a natural shading device for the openings located at the east part.
Fig 13: The south façade which is the main entrance located showed all the shading devices.
1 2
3 4
30
Radiant heat source from electric appliances is called thermal radiation. The electric
appliances installed in the living space for example the lights are actually producing heat
radiation. Other thermal radiation placed in the living room such as television, treadmill,
sound system sets, cordless phone, etc. also produced heat energy into the surrounding
environment and in order to increase the temperature.
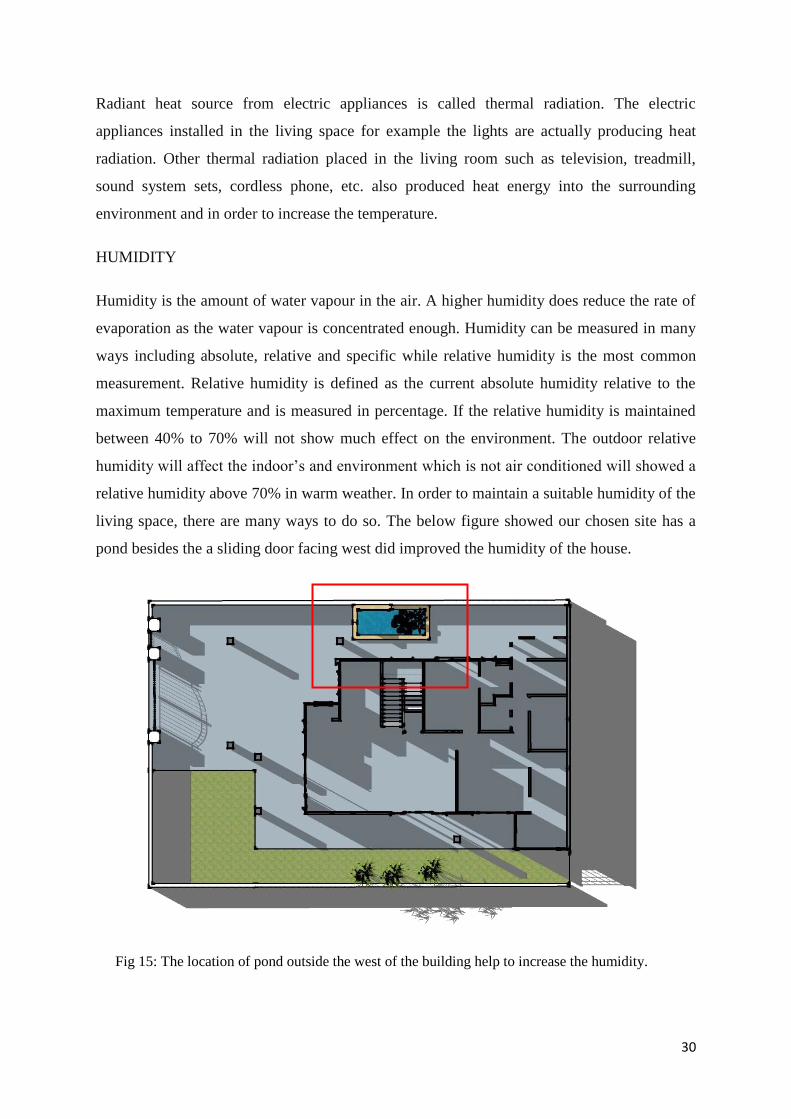
HUMIDITY
Humidity is the amount of water vapour in the air. A higher humidity does reduce the rate of
evaporation as the water vapour is concentrated enough. Humidity can be measured in many
ways including absolute, relative and specific while relative humidity is the most common
measurement. Relative humidity is defined as the current absolute humidity relative to the
maximum temperature and is measured in percentage. If the relative humidity is maintained
between 40% to 70% will not show much effect on the environment. The outdoor relative
humidity will affect the indoor’s and environment which is not air conditioned will showed a
relative humidity above 70% in warm weather. In order to maintain a suitable humidity of the
living space, there are many ways to do so. The below figure showed our chosen site has a
pond besides the a sliding door facing west did improved the humidity of the house.
Fig 15: The location of pond outside the west of the building help to increase the humidity.
31
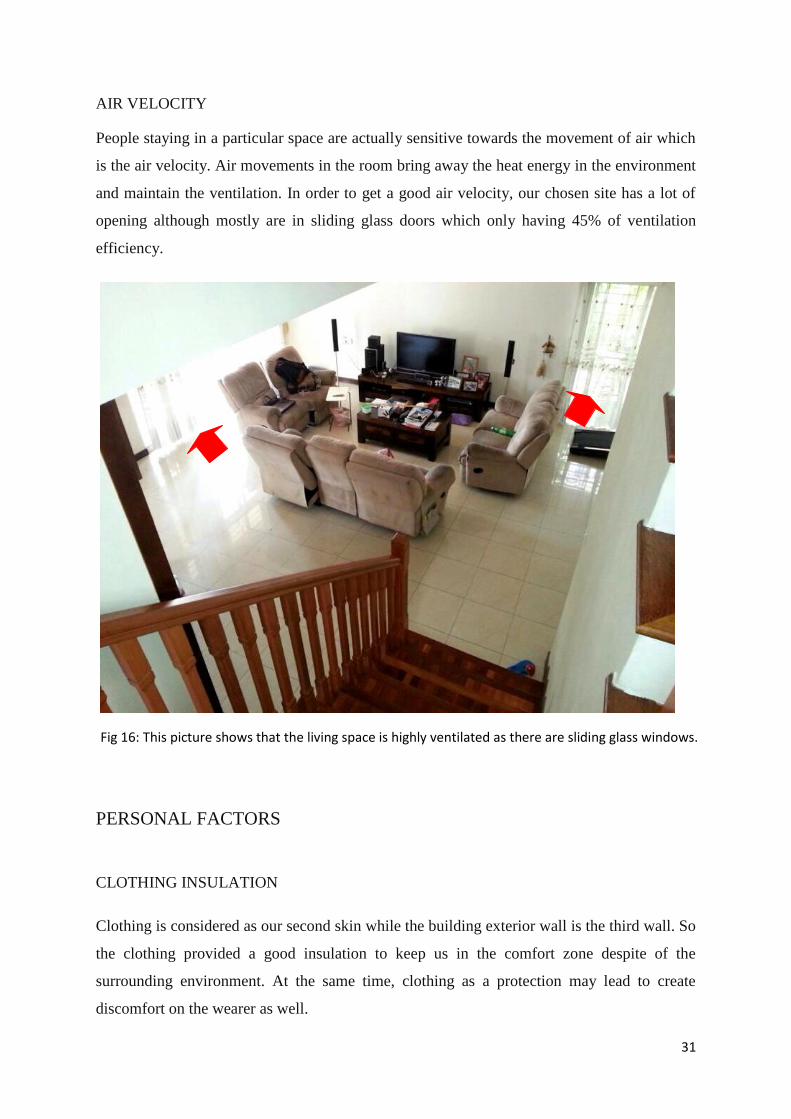
AIR VELOCITY
People staying in a particular space are actually sensitive towards the movement of air which
is the air velocity. Air movements in the room bring away the heat energy in the environment
and maintain the ventilation. In order to get a good air velocity, our chosen site has a lot of
opening although mostly are in sliding glass doors which only having 45% of ventilation
efficiency.
PERSONAL FACTORS
CLOTHING INSULATION
Clothing is considered as our second skin while the building exterior wall is the third wall. So
the clothing provided a good insulation to keep us in the comfort zone despite of the
surrounding environment. At the same time, clothing as a protection may lead to create
discomfort on the wearer as well.
Fig 16: This picture shows that the living space is highly ventilated as there are sliding glass windows.
32
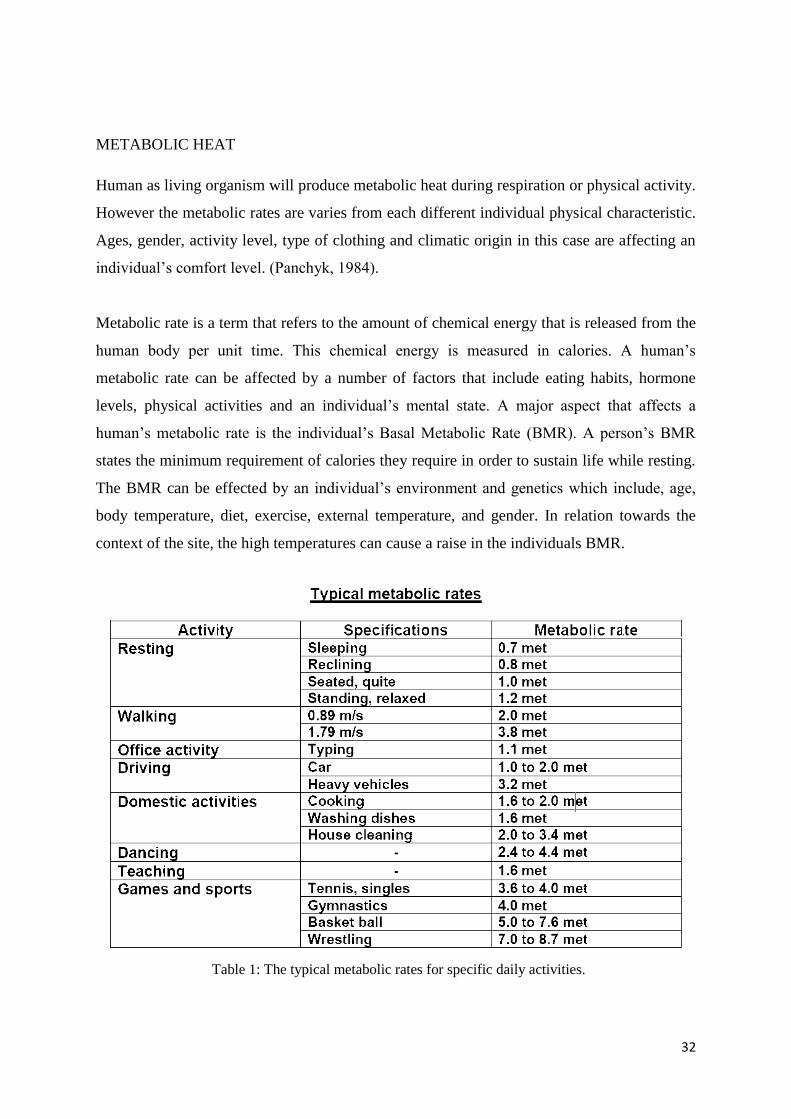
METABOLIC HEAT
Human as living organism will produce metabolic heat during respiration or physical activity.
However the metabolic rates are varies from each different individual physical characteristic.
Ages, gender, activity level, type of clothing and climatic origin in this case are affecting an
individual’s comfort level. (Panchyk, 1984).
Metabolic rate is a term that refers to the amount of chemical energy that is released from the
human body per unit time. This chemical energy is measured in calories. A human’s
metabolic rate can be affected by a number of factors that include eating habits, hormone
levels, physical activities and an individual’s mental state. A major aspect that affects a
human’s metabolic rate is the individual’s Basal Metabolic Rate (BMR). A person’s BMR
states the minimum requirement of calories they require in order to sustain life while resting.
The BMR can be effected by an individual’s environment and genetics which include, age,
body temperature, diet, exercise, external temperature, and gender. In relation towards the
context of the site, the high temperatures can cause a raise in the individuals BMR.
Table 1: The typical metabolic rates for specific daily activities.

33
D.2.4 FACTORS AFFECTING BUILDING’S CLIMATIC PERFORMANCE
Climate is the variable that we cannot control and in order to make our building habitable, we
as the architect need to consider some elements. For instance, the site context, the orientation
of the building, the openings location and size, fully utilize and arrangement of the spaces,
design of shading devices for both exterior and interior, materials choices, greenery and
plants types, and etc.
DESIGN STRATEGICS
Changing a small variable in the building structures actually did help in increase the
efficiency of the building’s performance. For example, vary the openings’ area, the wall
thickness, and layout of plans.
Building form is one of the important variables as the form affected the ventilation and sun
penetration. The form is decided by the shape of the building outlook which is the ratio of
building length to building depth. The form is also affecting the height of ceiling and façade
area at the same time.
Next, the orientation of the building is also one of the factors. The orientation of the building
should be taking into deep consideration after analysis from the sun-path and wind rose
diagrams in order to increase the efficiency for cooling devices. The placement of the façade
did affect the types of shading devices to use to get the highest efficiency.
Installation of the openings is another factor to affect the building’s climatic performance.
The arrangement of openings in the house will change the wind direction and speed once the
air entered the main entrance.

34
PASSIVE COOLING STRATEGICS
G.Z. Brown identifies four passive cooling strategies in his book, Sun, Wind and Light and
concluded those strategies as natural ventilation, evaporative cooling, high thermal mass and
high thermal mass with night ventilation.
In order to achieve natural ventilation (1), locate the Window openings on opposite sides of
the building or in parallel is improving the cross ventilation. The stack ventilation can even
improved the air quality and it can be produce by placing openings near the top of the stack.
A good ventilated building showed air flow every time someone opened the building.
The ability of the building materials in heat absorption causes the High thermal mass is
depends on the ability of materials in the building to absorb heat during the day. Conclusion,
the materials choices should consider the thermal mass to obtain the cooling effects.
Night ventilation suggested the residents to increase the air flow during the night compared to
the day. This is because at night the outdoor air helps in flushing away the heat accumulated
inside the building.
For evaporative cooling (2), evaporating water is used to decrease the indoor air temperature.
For our chosen site, this strategic is applied by placing a pond besides one of the openings.
Evaporation of the water surface helps in cooling down the surrounding environment and at
the same time, the ventilation will help to cool down the indoor environment.
2
1

35
BUILDING MATERIALS
Wall
1 BrickWall
Composed of sand brick and mortar
Strength and durability
Resistant to erosion, decay, rot and age
Fire and termite resistance
Low embodied energy
Weather resistance- UV, blistering heat, degradation
Noise isolation
Maintaining and stabilizing indoor temperature
Thermal and acoustic insulation
Flexible in application, high compressive strength
Floor
1 Ceramic tile
Long-lasting compared to other materials
Fire and moisture resistance
Resistance to abrasion and tread wear
Slip resistance and frost resistance
Thermal shock and stain resistance
Chemical and bacteria
resistance
Available in variety colors and patterns
Cost efficient
2 Merbau wood
Strength and durability
Good acoustics which prevents hollow sounds or vibrations
Low maintenance and healthier indoor air quality
Age and slip resistance

36
Door
1 Timber
Thermal insulation
Resistant to rust, air and wind
Bad conductor of heat and electricity
Low maintenance
Window panel
1 Aluminum
Resistance to rust and chemical erosion
Electrical and thermal
insulation
Strength and durability
High tensile strength
Lightweight, reflectivity and ductility
Low maintenance and recyclability
Glass panel
1 Tempered glass
High tensile strength
Strength and durability
Better security feature compared to regular lime glass
Resistance to high heat
Energy efficiency, dust and termite proof
Roof
1 Clay
Thermal insulation and long lasting
Strength and superior durability
Rot, mold and water damage resistance
Weather and freezing resistance
Moisture resistance and fire-proof
Recyclability and light weight
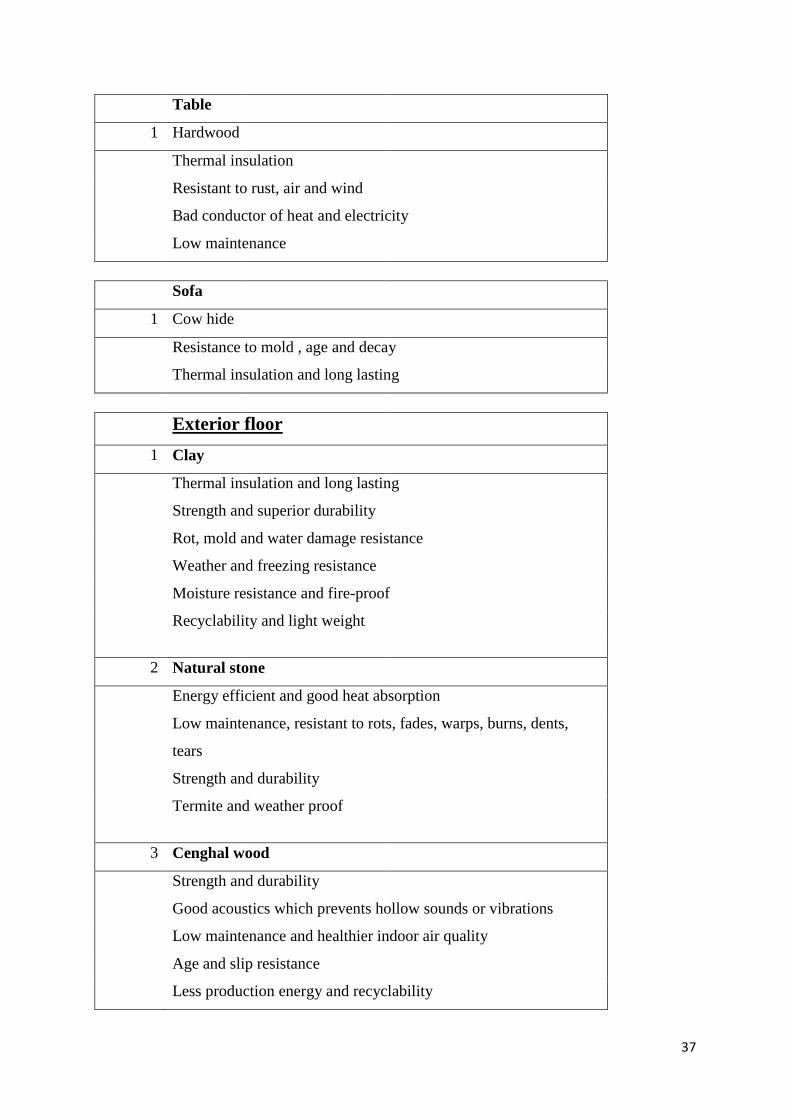
37
Table
1 Hardwood
Thermal insulation
Resistant to rust, air and wind
Bad conductor of heat and electricity
Low maintenance
Sofa
1 Cow hide
Resistance to mold , age and decay
Thermal insulation and long lasting
Exterior floor
1 Clay
Thermal insulation and long lasting
Strength and superior durability
Rot, mold and water damage resistance
Weather and freezing resistance
Moisture resistance and fire-proof
Recyclability and light weight
2 Natural stone
Energy efficient and good heat absorption
Low maintenance, resistant to rots, fades, warps, burns, dents,
tears
Strength and durability
Termite and weather proof
3 Cenghal wood
Strength and durability
Good acoustics which prevents hollow sounds or vibrations
Low maintenance and healthier indoor air quality
Age and slip resistance
Less production energy and recyclability
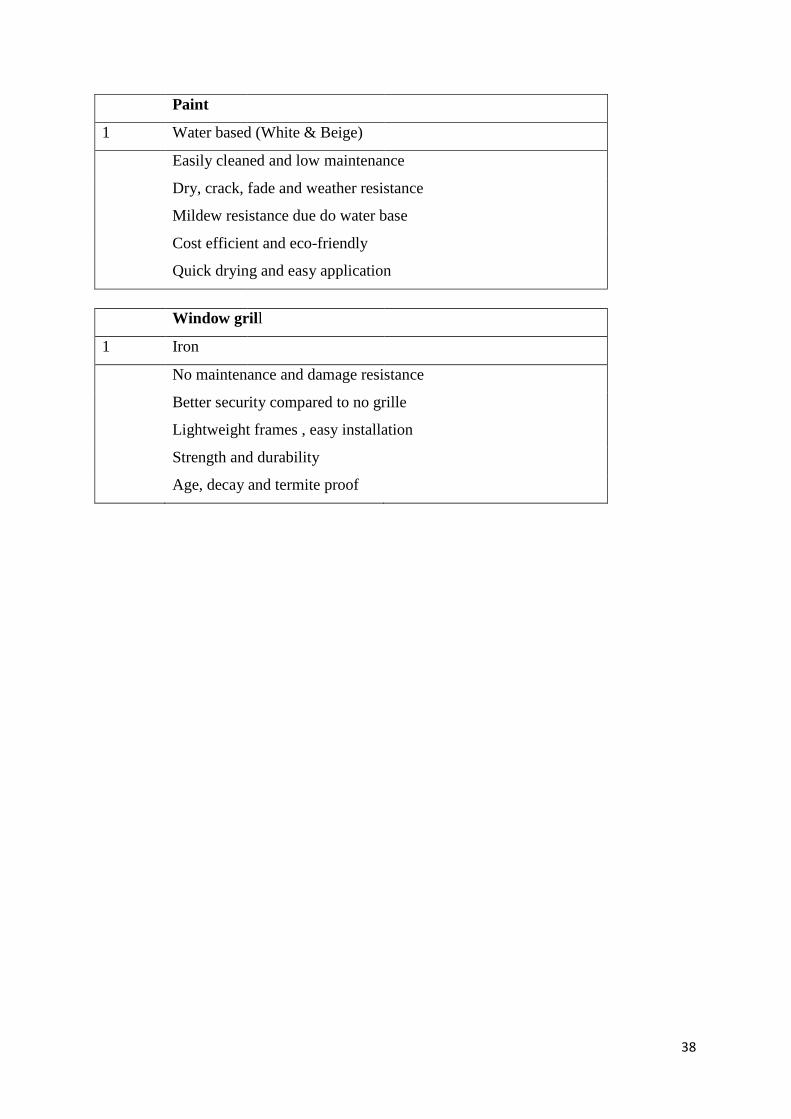
38
Paint
1 Water based (White & Beige)
Easily cleaned and low maintenance
Dry, crack, fade and weather resistance
Mildew resistance due do water base
Cost efficient and eco-friendly
Quick drying and easy application
Window grill
1 Iron
No maintenance and damage resistance
Better security compared to no grille
Lightweight frames , easy installation
Strength and durability
Age, decay and termite proof

39
D.3 WIND ANALYSIS
D.3.1 WIND CIRCULATION IN CHOSEN SITE
During the month of September, the average daily wind speed has been around 6km/h, in
which would be equivalent to about 4 mph, or 3 knots. The wind speed from our site is
altered from 0 km/h to 20 km/h. The highest wind speed occurs on the 12th
and 14th
of
September in which wind blew towards the north-west with the speed of 19 km/h at 3 p.m.
under the condition of a broken cloud. Sturdy winds usually occurs during the time vary from
10 a.m. to 7 p.m. with warmer temperature within the range from 29˚C to 33˚C. In contrast,
calmer wind will occurs during cooler temperature within the range from 24˚C to 27˚C
during early in the morning and night time.
Chart 2: The wind blows towards various directions throughout the day but it blows
more in certain directions.
The most frequent direction of the wind:
The directions which has the most wind is the North-West with the highest frequency of 19
follow on by the direction due South-East with the frequency of 11 and direction due North
and South-West with the frequency of 9. Thus, this shows that the wind blows towards the
direction due North-West. Houses which are facing South-East have more air ventilation in
which gets the most wind breeze into the interior of the house.
0
2
4
6
8
10
12
14
16
18
20
N NE E SE S SW W NW CALM
Frequency
Frequency
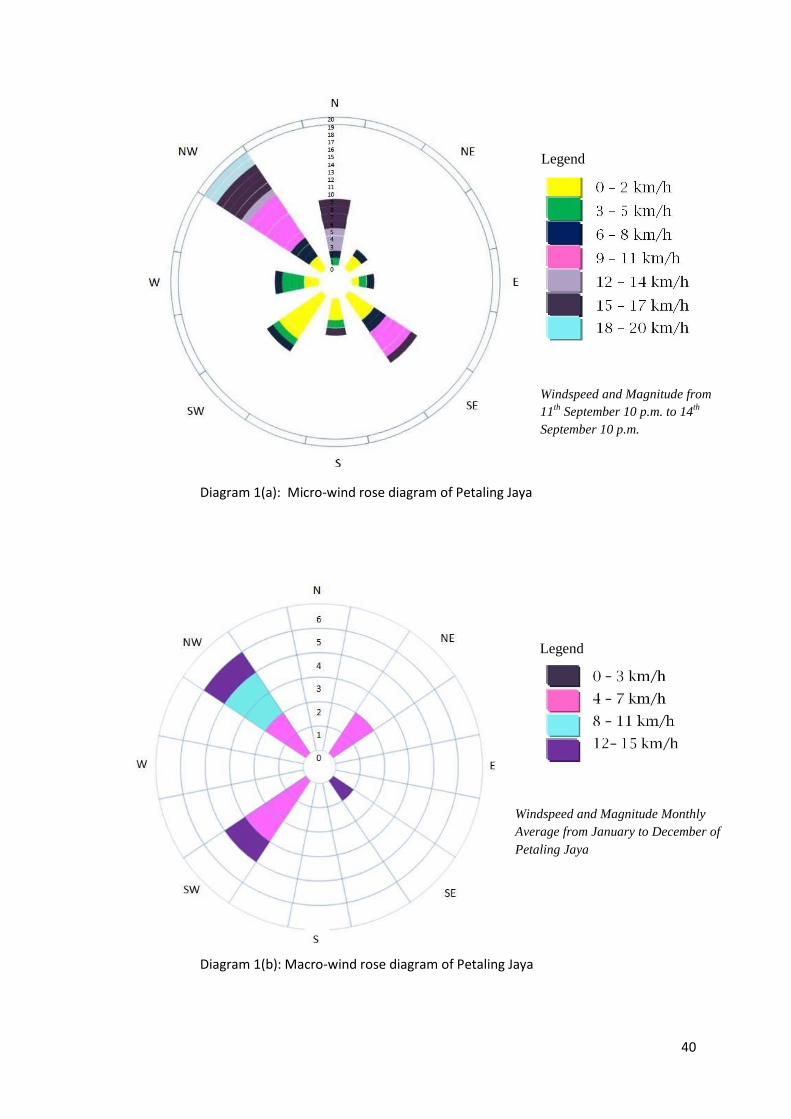
40
Diagram 1(a): Micro-wind rose diagram of Petaling Jaya
Diagram 1(b): Macro-wind rose diagram of Petaling Jaya
Legend
Windspeed and Magnitude Monthly
Average from January to December of
Petaling Jaya
Legend
Windspeed and Magnitude from
11th
September 10 p.m. to 14th
September 10 p.m.

41
D.3.2 VENTILATION INVESTIGATED IN CHOSEN ROOM
Figure 17: shows the wind movement through the doors, sliding doors and windows in the
house. The air movements are more likely affected by the daily basis of human activities
within the house. The ventilation starts when the occupants reach home and access through
the main door, wind began to enter the house and circulate as shown in Figure 3 The sliding
door will be constantly opened. When the occupants dwell in the living room for some
activities, the window will be opened and more air breeze into the living room. Due to the
most of door within the house is usually left-open, the air will then flow directly into the
kitchen and the laundry room through the door. The guest's room will rarely any circulation
of wind within the room itself because the door is closed at most of the time.

42
Figure 18: the air could flow into the upper part of the house through the staircase. The air could enter
and leaves the building through the opening of the balcony, casement window on the first floor of the
house. The air can circulate around of house. Outdoor air enters and leaves a house by: infiltration,
natural ventilation, and mechanical ventilation. As infiltration occurs, outdoor air flows into the house
through openings, floors, and ceilings, and around windows and doors. In natural ventilation, air moves
through opened windows and doors into the house. Air movement allied with infiltration and natural
ventilation in which caused by difference in air temperature between indoors and outdoors and by wind.

43

44

45

46

47

48

49

50
E. CONCLUSION
From this project, we concluded that it is not an easy way to maintain the
temperature and relative humidity at the comfort zone as we are staying in the
tropical climate country. So we have to know the factors affecting the thermal
comfort in order to obtain a better lifestyle in the interior living spaces. Our case
study which located at Kota Damansara had undergo three days of data logging
and came to a conclusion that it actually felt out from the comfort zone.
However, the residents thought of many solutions to reduce the discomfort. In
my case study, the arrangement of windows openings in the house and the
plantation of greeneries and small water pond did actually helped in increasing
the relative humidity and air velocity to decrease the temperature of surrounding
air.
Arrangement of windows opening parallel to the wall did assist in
creating cross ventilation in the room and maintain a highly ventilated
environment for them. Good ventilation is an important issue for the person to
stay inside a living space for a long period of time and being healthy. Another
solution that can be carried out by the resident is create a stack ventilation
which is even more efficient than the cross ventilation.
Existence of the balcony at the front façade and having tall trees at the
side façade are all the shading devices used in our case study. They smartly
used the building structural form and also natural plantation to prevent direct
sunlight penetrating and at the same time increased the aesthetic value.
There are still many solutions to use to solve the current environment
issue to maintain a comfortable and habitat able living space to enjoy the great
feel of being home.
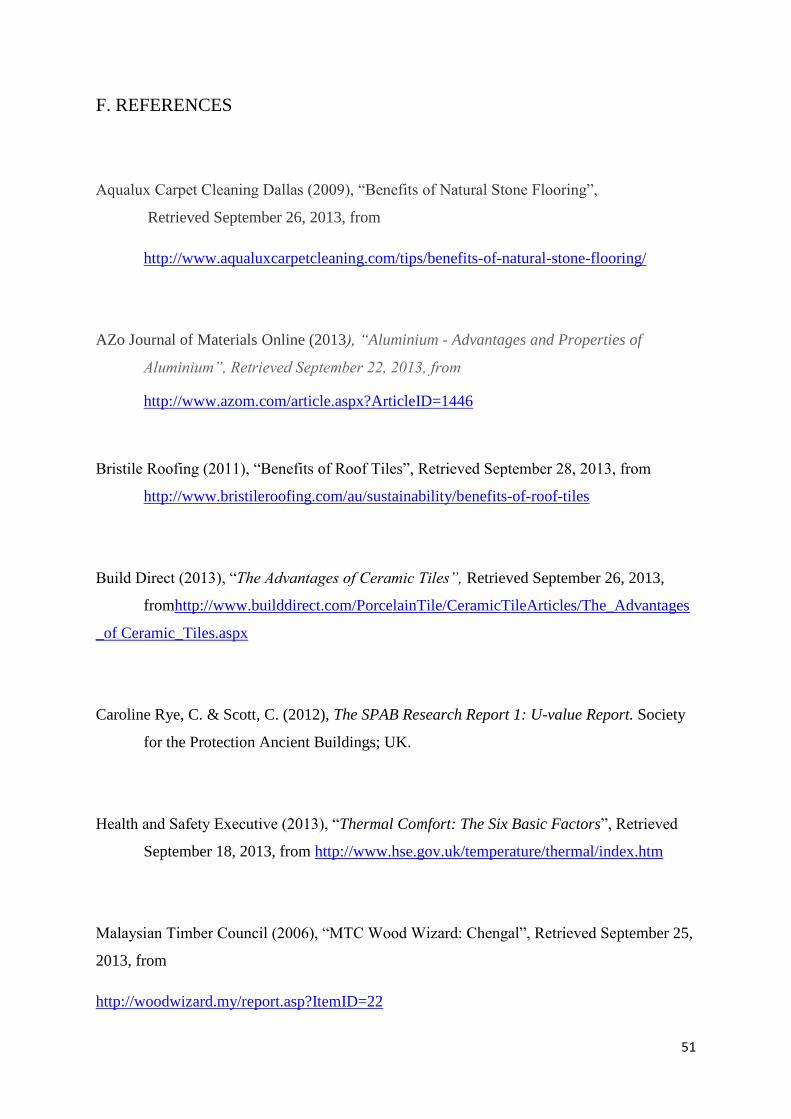
51
F. REFERENCES
Aqualux Carpet Cleaning Dallas (2009), “Benefits of Natural Stone Flooring”,
Retrieved September 26, 2013, from
http://www.aqualuxcarpetcleaning.com/tips/benefits-of-natural-stone-flooring/
AZo Journal of Materials Online (2013), “Aluminium - Advantages and Properties of
Aluminium”, Retrieved September 22, 2013, from
http://www.azom.com/article.aspx?ArticleID=1446
Bristile Roofing (2011), “Benefits of Roof Tiles”, Retrieved September 28, 2013, from
http://www.bristileroofing.com/au/sustainability/benefits-of-roof-tiles
Build Direct (2013), “The Advantages of Ceramic Tiles”, Retrieved September 26, 2013,
fromhttp://www.builddirect.com/PorcelainTile/CeramicTileArticles/The_Advantages
_of Ceramic_Tiles.aspx
Caroline Rye, C. & Scott, C. (2012), The SPAB Research Report 1: U-value Report. Society
for the Protection Ancient Buildings; UK.
Health and Safety Executive (2013), “Thermal Comfort: The Six Basic Factors”, Retrieved
September 18, 2013, from http://www.hse.gov.uk/temperature/thermal/index.htm
Malaysian Timber Council (2006), “MTC Wood Wizard: Chengal”, Retrieved September 25,
2013, from
http://woodwizard.my/report.asp?ItemID=22

52
Mid-Atlantic Masonry Heat Inc, (2011), “Understanding Thermal Comfort”,
Retrieved September 22, 2013, from
http://www.radianthomeheating.org/understandingthermalcomfort.html
The Physics Classroom (2013), “Heat and Temperature: Methods of Heat Transfer”,
Retrieved September 21, 2013, from
http://www.physicsclassroom.com/class/thermalP/u18l1e.cfm
TimeandDate (2013), “Hour-by-hour forecast for Malaysia – Kuala Lumpur”,
Retrieved September 11 – September 14, 2013, from
http://www.timeanddate.com/weather/malaysia/kuala-lumpur/hourly
Tukiainen, M (2013), GAISMA: Kuala Lumpur, Malaysia – Sunrise, Sunset, Dawn and Dusk
Times, Table, Retrieved September 20, 2013, from
http://www.gaisma.com/en/location/kuala-lumpur.html
University of the West of England (2006), “Faculty of the Built Environment: Insulation
Contents”, Retrieved September 23, 2013, from
https://environment7.uwe.ac.uk/resources/constructionsample/Conweb/walls/insulatio
n/print.htm
Panchyk, K. (1984), Solar Interiors: Energy-Efficient Spaces Designed for Comfort,
Van Nostrand Reinhold Company Inc.; USA
Wiley, J. & Son (1985), Sun, Wind, and Light,: Which Passive Cooling Strategy is Right for
You, V. Cartwright:; USA.
53
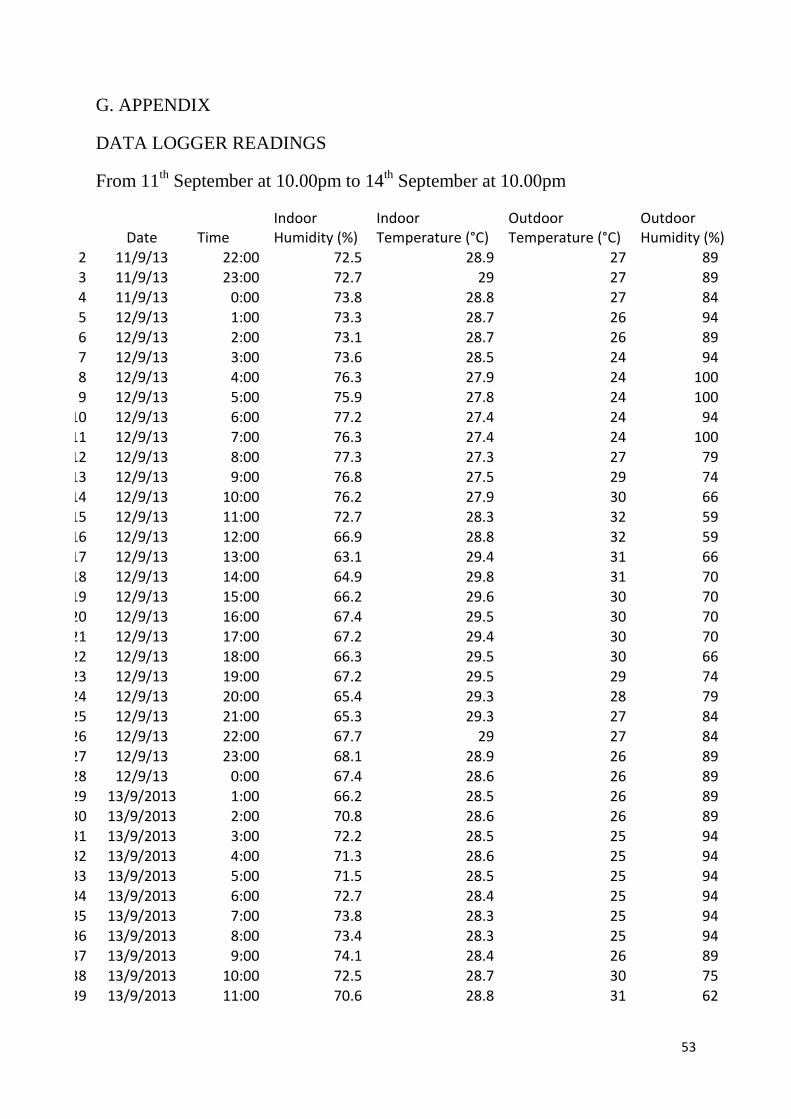
G. APPENDIX
DATA LOGGER READINGS
From 11th
September at 10.00pm to 14th September at 10.00pm
Place Date Time Indoor Humidity (%)
Indoor Temperature (°C)
Outdoor Temperature (°C)
Outdoor Humidity (%)
2 11/9/13 22:00 72.5 28.9 27 89 3 11/9/13 23:00 72.7 29 27 89 4 11/9/13 0:00 73.8 28.8 27 84 5 12/9/13 1:00 73.3 28.7 26 94 6 12/9/13 2:00 73.1 28.7 26 89 7 12/9/13 3:00 73.6 28.5 24 94 8 12/9/13 4:00 76.3 27.9 24 100 9 12/9/13 5:00 75.9 27.8 24 100 10 12/9/13 6:00 77.2 27.4 24 94 11 12/9/13 7:00 76.3 27.4 24 100 12 12/9/13 8:00 77.3 27.3 27 79 13 12/9/13 9:00 76.8 27.5 29 74 14 12/9/13 10:00 76.2 27.9 30 66 15 12/9/13 11:00 72.7 28.3 32 59 16 12/9/13 12:00 66.9 28.8 32 59 17 12/9/13 13:00 63.1 29.4 31 66 18 12/9/13 14:00 64.9 29.8 31 70 19 12/9/13 15:00 66.2 29.6 30 70 20 12/9/13 16:00 67.4 29.5 30 70 21 12/9/13 17:00 67.2 29.4 30 70 22 12/9/13 18:00 66.3 29.5 30 66 23 12/9/13 19:00 67.2 29.5 29 74 24 12/9/13 20:00 65.4 29.3 28 79 25 12/9/13 21:00 65.3 29.3 27 84 26 12/9/13 22:00 67.7 29 27 84 27 12/9/13 23:00 68.1 28.9 26 89 28 12/9/13 0:00 67.4 28.6 26 89 29 13/9/2013 1:00 66.2 28.5 26 89 30 13/9/2013 2:00 70.8 28.6 26 89 31 13/9/2013 3:00 72.2 28.5 25 94 32 13/9/2013 4:00 71.3 28.6 25 94 33 13/9/2013 5:00 71.5 28.5 25 94 34 13/9/2013 6:00 72.7 28.4 25 94 35 13/9/2013 7:00 73.8 28.3 25 94 36 13/9/2013 8:00 73.4 28.3 25 94 37 13/9/2013 9:00 74.1 28.4 26 89 38 13/9/2013 10:00 72.5 28.7 30 75 39 13/9/2013 11:00 70.6 28.8 31 62

54
average 72.9630137 28.50410959 27.1369863 84.12328767
Indoor design conditions
max. 78.3 29.8 33 100
dry bulb temperature 23-26°C min. 63.1 27.3 24 56
minimum dry bulb temperature 22°C
design relative humidity 55%-70%
Air movement m/s 0.15 - 0.50
Maximum air movement 0.7 m/s
40 13/9/2013 12:00 68.1 29 32 59 41 13/9/2013 13:00 66.8 29.2 32 63 42 13/9/2013 14:00 68.1 29.3 33 56 43 13/9/2013 15:00 73.9 28.9 25 94 44 13/9/2013 16:00 74.4 28.3 24 94 45 13/9/2013 17:00 75.5 28.2 24 100 46 13/9/2013 18:00 73.6 28 25 89 47 13/9/2013 19:00 75.8 28.2 25 89 48 13/9/2013 20:00 77.1 28.1 25 94 49 13/9/2013 21:00 76.2 28.1 25 94 50 13/9/2013 22:00 77.4 28.1 25 94 51 13/9/2013 23:00 77.7 28.1 25 100 52 13/9/2013 0:00 78.1 28.1 25 94 53 14/9/2013 1:00 78.3 28 25 100 54 14/9/2013 2:00 77.9 28.1 25 94 55 14/9/2013 3:00 77.3 28 25 94 56 14/9/2013 4:00 77.2 28 25 94 57 14/9/2013 5:00 76.4 27.9 25 94 58 14/9/2013 6:00 76.2 27.9 25 94 59 14/9/2013 7:00 76.6 27.9 25 94 60 14/9/2013 8:00 76.8 27.9 25 94 61 14/9/2013 9:00 77.4 28 26 89 62 14/9/2013 10:00 76.2 28.2 28 84 63 14/9/2013 11:00 75.4 28.3 30 75 64 14/9/2013 12:00 74.6 28.4 30 75 65 14/9/2013 13:00 75.5 28.4 32 67 66 14/9/2013 14:00 74.3 28.5 31 70 67 14/9/2013 15:00 73.9 28.5 31 70 68 14/9/2013 16:00 73.5 28.6 30 70 69 14/9/2013 17:00 73.8 28.8 28 79 70 14/9/2013 18:00 74.4 28.8 28 79 71 14/9/2013 19:00 74.5 28.8 27 84 72 14/9/2013 20:00 74.6 28.6 26 89 73 14/9/2013 21:00 73.9 28.6 26 89 74 14/9/2013 22:00 75 28.7 26 94

55
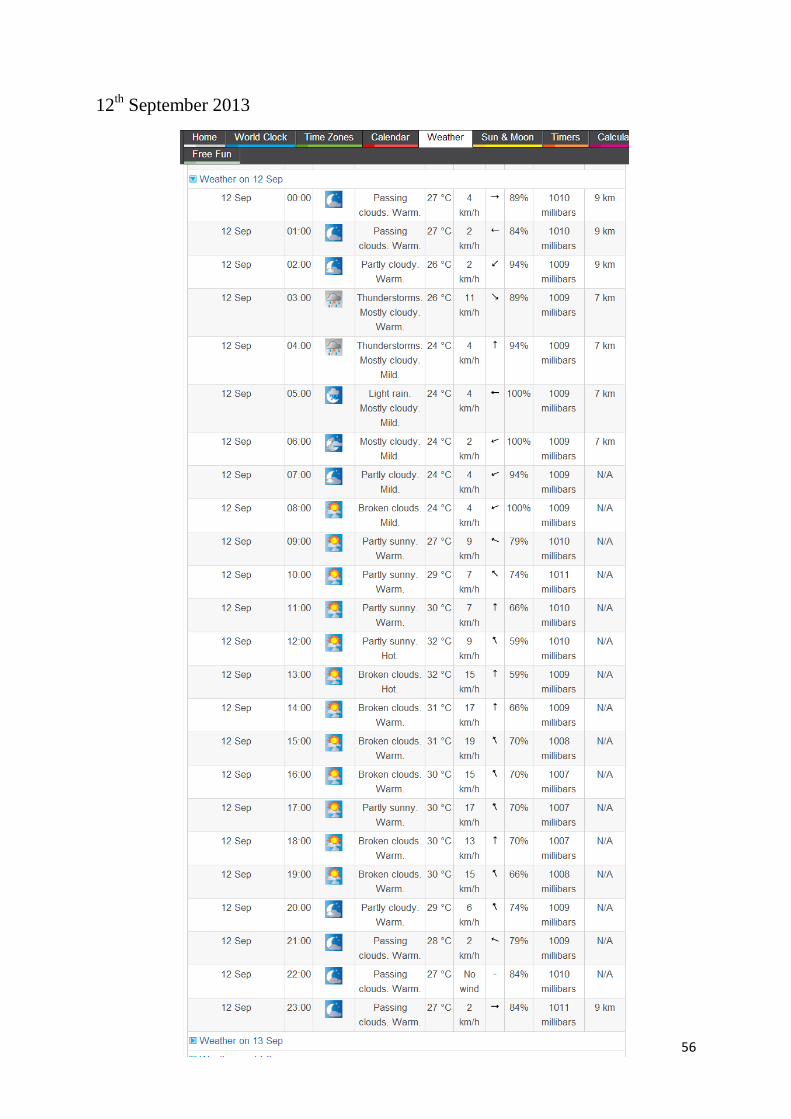
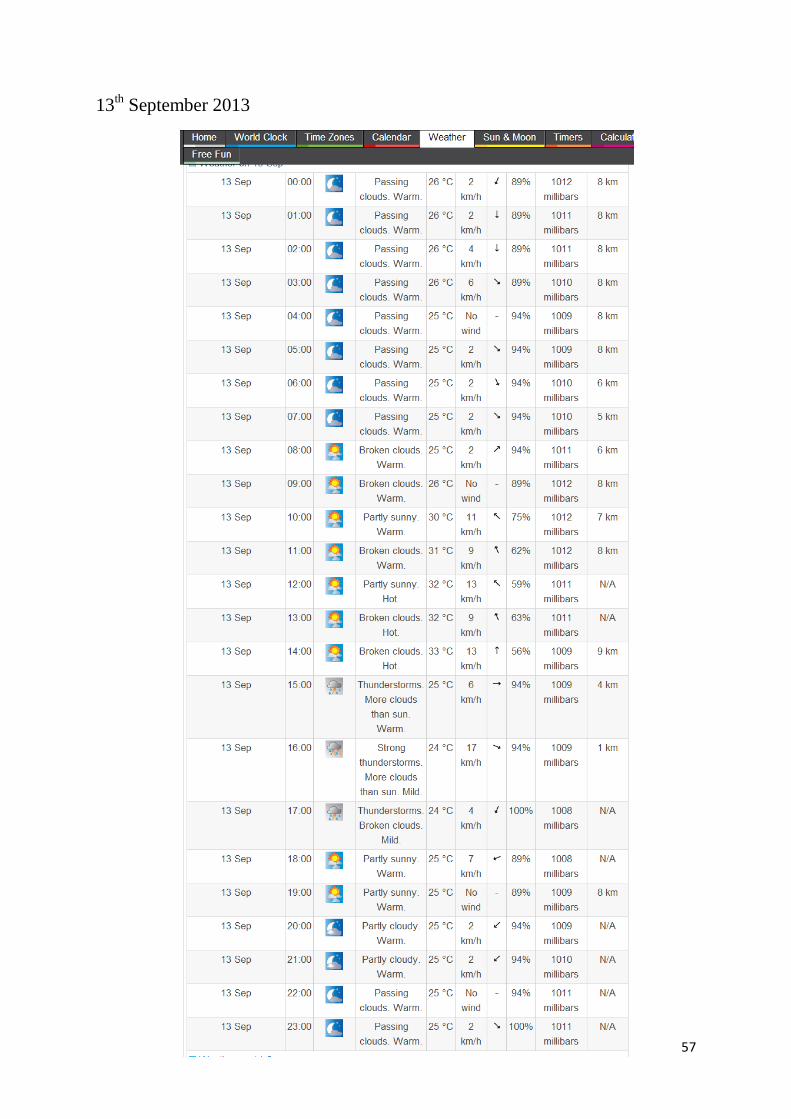
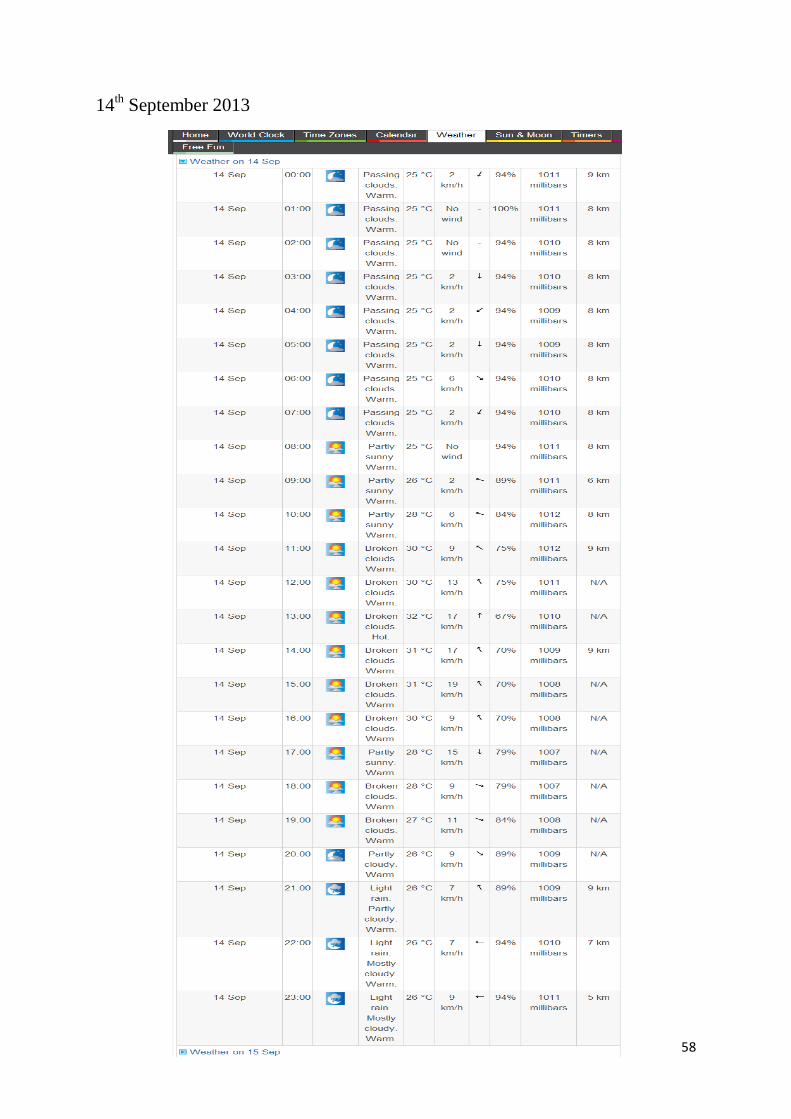
DATA OF EXTERIOR CLIMATE
11th September 2013
56
12th September 2013
57
13th September 2013
58
14th September 2013
59
60