Embed Size (px)
Citation preview

Berkeley annual report 2005
Building onexperience

OurbusinessOurpassıon
Berkeley is no longer a traditional housebuilder. It is an urbanregenerator committed to maximising returns to shareholders.
The creation of attractive and sustainable communities is at theheart of Britain’s vision for the renaissance of its urban areas.Berkeley’s experienced management team has demonstrated timeand time again that it has the flair and talent to undertake suchcomplex regeneration projects.
Berkeley continues to push the boundaries of innovation andsustainability, setting precedents and offering customers highlydesirable places in which they really do want to live, work and play.
Contents
2 Chairman’s statement
3 Who we are
6 Managing Director’s review
12 Process
16 Our people
18 Sustainability
20 Board of directors and advisers
22 Directors’ report
25 Remuneration Committee report
40 Corporate governance
45 Auditors’ report on the financial
statements
46 Consolidated profit and loss account
47 Consolidated balance sheets
48 Consolidated cash flow statement
49 Statement of Group total recognised
gains and losses
49 Movements in shareholders’ funds
50 Notes to the accounts
72 Five year summary
Inside Financial diaryback
cover
2005Financialhighlights
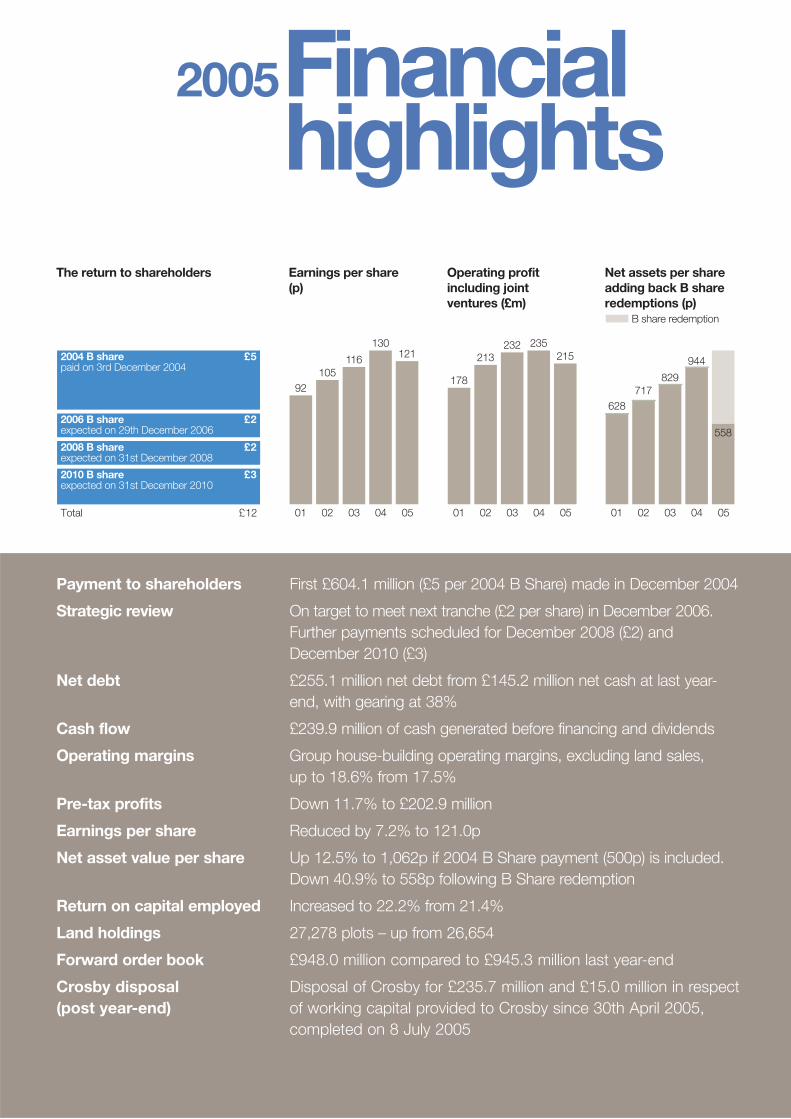
The return to shareholders
2004 B share £5 paid on 3rd December 2004
2006 B share £2 expected on 29th December 2006
2008 B share £2 expected on 31st December 2008
2010 B share £3 expected on 31st December 2010
Total £12
Earnings per share(p)
92105
116
130121
01 02 03 04 05
Operating profit including joint ventures (£m)
178
213232 235
215
01 02 03 04 05
Net assets per share adding back B share redemptions (p)
01 02 03 04 05
628717
829
944
558
B share redemption
Payment to shareholders First £604.1 million (£5 per 2004 B Share) made in December 2004
Strategic review On target to meet next tranche (£2 per share) in December 2006.Further payments scheduled for December 2008 (£2) andDecember 2010 (£3)
Net debt £255.1 million net debt from £145.2 million net cash at last year-end, with gearing at 38%
Cash flow £239.9 million of cash generated before financing and dividends
Operating margins Group house-building operating margins, excluding land sales,up to 18.6% from 17.5%
Pre-tax profits Down 11.7% to £202.9 million
Earnings per share Reduced by 7.2% to 121.0p
Net asset value per share Up 12.5% to 1,062p if 2004 B Share payment (500p) is included. Down 40.9% to 558p following B Share redemption
Return on capital employed Increased to 22.2% from 21.4%
Land holdings 27,278 plots – up from 26,654
Forward order book £948.0 million compared to £945.3 million last year-end
Crosby disposal Disposal of Crosby for £235.7 million and £15.0 million in respect(post year-end) of working capital provided to Crosby since 30th April 2005,
completed on 8 July 2005

Chairman’s statement
2 www.berkeleygroup.co.uk
Roger LewisChairman
The £1.4bn
shareholderprogramme
is on track
Berkeley has adopted a totally differentstrategy to the majority of other house-builders, choosing to concentrateon mixed-use, large-scale urbanregeneration schemes on brownfieldland. The complex nature of suchschemes is in tune with our strengthof management and scope of vision.It also defines a business model thatis more efficient at a smaller scale,so allowing Berkeley to return surpluscashflow to shareholders.
This path for the Company was agreedby shareholders following a strategicreview conducted by the Boardof Berkeley in early 2004 in conjunctionwith the Company’s advisers. Thisassessed the best route for deliveringshareholder value in the context of theBoard’s views about the outlookfor achieving sustainable growthin its markets.
Scheme of ArrangementThe Scheme of Arrangement and TheBerkeley Group Holdings plc reductionof capital were approved by shareholders

www.berkeleygroup.co.uk 3
on 17th September 2004 and by theCourt at the end of October 2004.The Scheme of Arrangement createda Berkeley Unit comprising one ordinaryshare and four redeemable B shares.The 2004 B shares were redeemedon 3rd December 2004 for £5 a shareat a cost to Berkeley of £604.1 million.The redemption of the three remainingB shares is expected in December2006, December 2008 and December2010 for amounts of £2, £2 and£3 per share respectively.
As part of the Scheme of Arrangement,the Group agreed new banking facilitiesfor £825 million. These comprise a £500million term loan for seven years,a £175 million revolving facility for threeyears and a £150 million 364 dayrevolving facility with a 2 year term-outoption. At the time of the Decemberpayment, the Group drew £600 millionof its new facilities to make the 2004B share redemption and at 30th April2005 held £344.9 million of cashbalances. This can be used for workingcapital, new land acquisitions or the
2006 B share payment and supportsthe confidence the Group has indelivering its strategy. The amountof the drawn facility will be reducedfollowing the disposal of Crosby.
Crosby GroupOn the 28th August 2003, the Boardannounced that the managementteam of its Crosby division, ledby its Chairman, Geoff Hutchinson,had subscribed for new sharesin Crosby which, after the generationof £450 million of operating cashflow,entitled them to 50.01% of the economicvoting rights of Crosby. Of this, Berkeleyhas received approximately £157.1million of operating cashflow and thiswas in line with its business plan.
On 23rd June 2005 Berkeley wasdelighted to announce the disposalof Crosby to Lend Lease for £235.7million. In addition, Berkeley will berepaid £15 million in respect of workingcapital provided to Crosby since30th April 2005.
The disposal accelerates the returnfrom Crosby and leaves Berkeley witha more focused development portfoliobased around its core markets inLondon and the South-East of England.It also gives us increased financialflexibility to take advantage of landopportunities in our core marketsas they arise.
Berkeley proposes to repay the£100 million currently drawn underits existing revolving facility and theremaining proceeds will be investedin Berkeley’s principal markets.
Financial ResultsOn 24th June 2005 Berkeley wasdelighted to announce a pre-tax profitof £202.9 million for the 12 monthsended 30th April 2005. This isa reduction of 11.7% on the restatedfigure of £229.8 million for the sameperiod last year. This result is in linewith our expectations. Earnings pershare were 121.0 pence, a reductionof 7.2%. Five factors have contributedto this earnings per share result: > > >
Who we are
Our building blocksBerkeley hasan autonomousoperating structurewith few layersof management andvery short decisionmaking processes.This gives greaterresponsibility andmotivation at all levelsof the company.
Berkeley HomesBerkeley Homes’ urban regenerationschemes reflect the company’s focuson bringing dynamic mixed-usedevelopments to brownfield land acrossLondon and the South-East.www.berkeleyhomes.co.uk
St George Operating solely in London, St Georgeis creating some of the capital’s leadingand most pioneering, large-scaleregeneration schemes.www.stgeorgeplc.co.uk
St JamesEstablished as a joint venture companybetween Berkeley and Thames Water,St James Homes has quickly forged animpressive reputation for the innovationand quality brought to bear on itsdevelopments in the South-East.www.stjameshomes.co.uk
Crosby HomesCrosby specialises in the urbanrenaissance of towns and cities acrossthe Midlands and the North of England,where its major developments haveestablished the company as amarket leader. www.crosbyhomes.co.uk
Berkeley FirstBerkeley First is believed to be oneof the first private sector developersfocused solely on affordable-ledaccommodation, delivering well-designed and attractive homes to keyworkers and students.www.berkeleyfirst.co.uk
Left: Chelsea Bridge Wharf
4 www.berkeleygroup.co.uk
reduced operating profit (-9.0%),merger expenses (-0.7%), increasedinterest charge (-2.3%), reduced taxcharge (+1.2%) and share buy-backsand other movements (+3.6%).
Shareholders’ funds have reducedby £473.1 million to £669.5 million(2004: £1,142.6 million). Net assetsper share stand at 558 pence. Thedecrease in shareholders’ funds takesinto account share buy-backsof £20.7 million and the capitalrepayment of £604.1 million. Returnon Capital Employed was 22.2%compared to 21.4% last time.
At 30th April 2005 Berkeley had netdebt of £255.1 million which representsa gearing level of 38% (2004: net cashof £145.2 million) and an outflowof £400.3 million in the period. Thishas resulted from operating cashflowof £205.0 million, a reduction in workingcapital of £84.2 million and other cashinflows of £13.1 million, off-set by£20.7 million used to buy back shares,redemption of B Shares of £604.1 millionand tax and dividends of £77.8 million.
Corporate GovernanceThe Board has remained unchangedduring the year and comprisesa Chairman, four Executive Directorsand three Non-executive Directors.The stability of the Board has beenthe key to our success in deliveringthe substantial strategic changes in theyear, including primarily the Schemeof Arrangement and, after the year-end,the disposal of the Crosby Group.
The Board has continued to considerfurther Non-executive Directorsto achieve the Board balance set outin the Combined Code and has identifieda suitable candidate. It is the currentintention therefore to appoint a furtherNon-executive Director by the AGMon 1st September 2005.
International Financial ReportingStandardsCommencing with the interim resultsfor the year ended 30th April 2006,Berkeley will report its resultsin accordance with InternationalFinancial Reporting Standards (IFRS).
Berkeley is well prepared for the adoptionof IFRS and will present to the marketits opening IFRS balance sheet(as at 1 May 2004) and restated profitand loss account and balance sheetfor the year ended 30th April 2005in September or October 2005.
The one significant area of changefor Berkeley will be with regard to therecognition of revenue and profit (IAS 18).Berkeley’s current policy reflects the twodifferent types of scheme the Groupdevelops. For traditional house building,revenue and profit on exchanged salescontracts is recognised on physicalcompletion. This will not change andwill be the policy adopted for oururban regeneration business whererevenue and profit are currentlyrecognised on a phased basis, reflectingthe stage of completion of the relevantexchanged unit.
The impact of the change at 30th April2005 will be to reduce shareholdersfunds by approximately 5%.
> > > Chairman’s statement

www.berkeleygroup.co.uk 5
Other areas that will affect shareholdersfunds at 30th April 2005 on the adoptionof IFRS are pensions and land creditors.
IAS 19 (Employee Benefits) will requirethe inclusion of any pension schemesurplus or deficit to be recorded in thebalance sheet. At 30th April 2005,Berkeley’s pension scheme deficit hasbeen calculated at £8.4 million. Theimpact on shareholders’ funds at 30thApril 2005 will be a reduction of 1.3%.
IAS 2 (Inventories) requires landpurchased on deferred payment termsto be held at discounted present value.The liability is then increased over theperiod to settlement, with this increasebeing recorded as interest. This willreduce shareholders’ funds at 30th April2005 by approximately 1%.
Our PeopleSince its inception, a vital componentof Berkeley’s strength has been thecommitted, hardworking and imaginativepeople who work for the Group,in teams created to generate results
far in excess of the simple sum ofindividuals. At its heart is a uniquelytalented and experienced managementteam, driven by entrepreneurial flair andan unrivalled practical understandingof the land and property market. Thisgives Berkeley the aptitude and foresightto identify and take advantage ofnew opportunities.
On behalf of the Board and shareholders,I would like to take this opportunityto acknowledge the huge and continuingcontribution everyone who works forBerkeley makes to our business.
OutlookBerkeley has developed a strategy thatgives it maximum flexibility, which webelieve to be best suited to the particularchallenges of a cyclical business.
Our primary goal is to maximise ourreturns to shareholders as opposedto mainly concentrating on the profitand loss account and this alignmentallows the business to continuemaximising short-term opportunities
within an unambiguous long-termoperating model. Our business iscurrently cash generative, efficientin terms of scale and allows the skillsof our people to converge on addingvalue throughout the developmentprocess. We remain on target toachieve the 2006 B share paymentand the £12 return by January 2011,and to create a sustainable andmeaningful ongoing business.
We have planned our business for thelong-term, for which the fundamentalslook very encouraging. We look forwardto the future with enthusiasm andconfidence.
Roger LewisChairman
Wycombe Square, a St Jamesdevelopment in Kensington, London.

6 www.berkeleygroup.co.uk
Managing Director’s review
Identifyingopportunities
Realising them
Trading AnalysisI am delighted to announce resultswhich accord with our expectations,having also completed on time andas promised the first stage of the cashreturn to shareholders (£5 per 2004 Bshare) on 3 December 2004.
Group turnover was £1,070.3 million(2004: £1,272.4 million). This comprises£1,002.8 million (2004: £1,130.1 million)of residential turnover and £67.5 million(2004: £142.3 million) of commercialturnover.
During the year Berkeley sold 3,570units at an average selling priceof £282,000. This compares with3,805 units at an average sellingprice of £283,000 last time.
In the financial year, turnover fromland sales was £16.1 million (2004:£11.4 million). Berkeley’s policy hasalways been to take suitable landsale opportunities. That said,its performance does not dependon it realising such opportunities. > > >
Tony PidgleyManaging Director
Boosting economıcgrowthGunwharf Quays (right) is partof Berkeley’s flagship regenerationof Portsmouth Harbour. The pioneering,mixed-use development is a primeexample of Berkeley’s skill as an urbanregenerator. The scheme alsoemphatically demonstrates how majorprojects of this nature can revitalisean area as a whole.
Gunwharf’s 72 retail outlets,20 waterfront bars and restaurants,25,000 square feet of office space,its cinema and numerous other leisurefacilities attracted over 11 millionvisitors to the area in its first two years, contributing some £2.7 millionin business rates.
When the entire developmentis complete it is estimated that it willhave generated over 3,500 jobs andincreased the number of visitorsto Portsmouth by 1.6 million a year,potentially attracting an additional£50 million of investment into the localeconomy on an annual basis.
The waterfront at Gunwharf Quays.

www.berkeleygroup.co.uk 7

8 www.berkeleygroup.co.uk

At £67.5 million (2004: £142.3 million)commercial turnover reflected thedisposal of commercial units on15 mixed-use sites. This included thesale of 62,900 square feet of officespace at St George Wharf and 17,300square feet of retail space at GunwharfQuays. Berkeley has now received 98%of the forecast commercial receiptsfrom Gunwharf Quays.
Berkeley’s share of joint ventures’turnover totalled £145.9 million (2004:£123.7 million). This comprised£144.7 million (2004: £121.0 million)of residential sales and £1.2 million(2004: £2.7 million) from commercialschemes. The number of units soldwas 809 with an average selling priceof £378,000 compared to 1,034 unitsat an average price of £225,000 forthe previous year.
The house-building operating margin,excluding joint ventures and land saleshas increased to 18.6% from 17.5% lasttime. Over recent reporting periods theGroup has achieved operating marginsin the range of 17.5% to 19.5% > > >
Managing Director’s review>>>
The Royal Arsenal Woolwich.
Developing throughpartnershipThe Royal Arsenal (left) is one ofBerkeley Homes’ most impressive and famous developments. Situated in Woolwich, the site dates back to the 17th century and was a centre forthe manufacture of ordnance for overthree centuries.
The transformation of the site into amajor, mixed-use development is well underway. The success of the schemeowes much to the close partnerships established between Berkeley and all
of its stakeholders, from the local Council to the London DevelopmentAgency and, most importantly, thelocal community.
Ultimately, the 76 acre site will form a whole new neighbourhood in London,comprising a vibrant, thriving andsustainable community in a historic riverside setting. A mix of commercial,residential and leisure facilities will fusethe old with the new.
www.berkeleygroup.co.uk 9

10 www.berkeleygroup.co.uk
(depending on mix). As reported at thehalf year we expected to be broadlyin this range for the full year if currentmarket conditions prevailed and this hasbeen achieved. On the basis that currentmarket conditions continue we forecastto remain broadly in this range. Jointventure operating margins are 10.4%compared to 17.7% last year. This isin part due to the St James profit sharearrangements with Thames Water andis forecast to reverse next year.
Housing MarketThere has been much commentary onthe housing market since the beginningof the year. From Berkeley’s perspective,the market has been very acceptableand at the level for which we plannedwhen we embarked on our Scheme ofArrangement. In summary, the housingmarket has continued to respond inaccordance with expectations and in linewith macro-economic conditions.Demand for homes has reducedfollowing the five sequential rises ininterest rates and the resultant reducedaffordability that restricts new entrantsinto the market.
> > > Managing Director’s review
Putney Wharf (right) is an imaginativelyconceived mixed-use development,occupying a key position on the southbank of the River Thames and providinga powerful link between the cosmopolitanvitality of Putney High Street and oneof Europe’s most vivid waterfronts.
The scheme has created a flourishingcommunity of bars and restaurants,21st century townhouses, stylishapartments and a majestically designed17-storey glass-fronted tower, providingan emphatic demonstration of thepower and scope of mixed-useregeneration.
Restaurant at Putney Wharf.
Our sales performance in 2005 hasbeen very solid. Berkeley has securedsales with a value 6.6% lower thanin 2004, a level which is in line withthe business plan set following theScheme of Arrangement. This enabledus to maintain our strong forward salesposition. This is 14.8% ahead of 2003,a year which was affected by worldevents. Sales prices have been aboveour forecast by 3% to 5% and arecovering the build cost increases whichwe continue to experience.
Operating margins are under pressuredue to affordable housing requirementsand Section 106 planning gainobligations. As we predicted, this hasreduced forward operating marginsby 0.4% in the year and we forecastthat this will be repeated going forward.
There is continued debate about theplanning system. While in many respectsit is much slower than we would prefer,we have found over the last yearan increased readiness on the part ofpublic agencies to work enthusiasticallywith the private sector. This is a > > >
Riverside regeneration

www.berkeleygroup.co.uk 11

12 www.berkeleygroup.co.uk
welcome development, which hasmitigated our frustrations over the lengthof time it sometimes takes to reacha decision on planning.
During the year, Berkeley has secureda number of important consentsincluding approximately 2,800 unitsat Beaufort Park, Hendon; 800 unitsat Gillingham Waterside; and furtherconsents at Chelsea Bridge Wharf;Imperial Wharf; and Bromyard Avenue,Acton. It was also good to receiveplanning consent for the residentialtower at St George Wharf in July 2005.
The investment market continuedto be very active and accounts for over50% of our reservations. Under theGroup’s definition an investor can rangefrom a large institution to a customerpurchasing a second home.
Berkeley has continued to find landprices extremely competitive andin accordance with its strategy hasbought only very selectively. During theyear terms were agreed on only 19 sites,of which 6 were in St James with
3 of those 6 from Thames Water. Thisequates to 2,110 plots.
For the Group to achieve its full yeartargets for 2005/06, 62% of theremaining sales required are on unitswith a selling price under £300,000and 88% under £500,000. This putsBerkeley in a strong position to achieveour full year forecast in the currentmarket conditions.
Forward SalesBerkeley’s strategy continues to beto sell homes at an early stage in thedevelopment cycle, often at the off-planstage, as this secures customers’commitment and consequently thequality of future revenue.
It is a good indicator of the underlyingstate of the market that Berkeley hasmanaged to maintain and marginallyincrease its forward sales position from£945.3 million at the same time last yearto £948.0 million at 30th April 2005.Of this, £139.8 million (2004: £156.4million) is included in debtors in thebalance sheet, with the remaining
£808.2 million (2004: £788.9 million)benefiting both the current year andfuture years profit and loss accountand cashflow. If Crosby is excluded,the forward sales position at 30th April2005 is £687.0 million (2004:£629.6 million).
Land HoldingsDuring the year the Group (includingits joint ventures) has again more thanreplaced the number of plots usedin construction. Berkeley now controls27,278 plots with an estimated grossmargin of £1,855 million. This compareswith 26,654 plots and an estimatedgross margin of £1,926 million at30th April 2004.
With the disposal of Crosby the restatedposition at 30th April 2005 wouldbe 22,799 plots with an estimatedgross margin of £1,638 million.
This maintained land position has beenachieved in conjunction with generating£239.9 million from cashflow beforefinancing and dividends. > > >
> > > Managing Director’s review
Process
The vision to seeopportunitiesBritain’s towns and cities are rich in derelictsites. Each is similarly rich in potential.The focus of Berkeley’s business is toprovide the means by which these brownfieldareas realise this potential. The processof regenerating brownfield land intoburgeoning communities presents bothunique challenges and opportunities.It is a complex and inspiring process.And, above all, it is a process that bringsabout the most enduring, wide-rangingand ground-breaking of results, dramaticallybreathing life into previously dormant places.
The brownfield site at Tempus Wharfprior to development.

Right: Floorplan for the tower atSt George Wharf.
Tempus Wharf followingits regeneration byBerkeley Homes.
www.berkeleygroup.co.uk 13
Balancing the view fromall angles
Right: Community Consultationin action at Hungate, York.

14 www.berkeleygroup.co.uk
Berkeley’s focus in 2004/05 has beento concentrate on maximising the returnsfrom our land holdings and we continueto submit further planning applicationson the majority of our regeneration sites.This is compatible with local/regionalplanning objectives and national policy.
At 30th April 2005, of the plots controlledby the Group, 23,288 (2004: 21,449)are owned on the balance sheet, while3,407 (2004: 4,315) are contractedfor and a further 583 plots (2004: 890)have terms agreed and solicitorsinstructed. Over 95% of our holdingsare on brownfield or recycled land.
Excluding Crosby, the Group has22,799 plots in its control at 30th April2005. Of these, 19,767 are ownedon the balance sheet, with 2,680contracted and 352 with terms agreedand solicitors instructed.
Joint VenturesBerkeley currently has £70.4 millionof capital employed in joint ventures,an increase of £2.5 million from lastyear’s figure of £67.9 million. Our share
>>> Process
Putting it all togetherConstruction and ProjectManagementAs the most visible aspect of the‘brownfield-to-lifestyle’ process,construction sees the vision of theplanning and design phase becomereality. It is also Berkeley’s most public interface. As such, Berkeley works hard to ensure that it is bothmanaged and implemented safely,effectively and responsibly.
The construction process at Tabard Square.
> > > Managing Director’s review

www.berkeleygroup.co.uk 15
of joint venture bank borrowingshas decreased by £21.1 million to£57.6 million.
Berkeley is committed to developingour partners land holdings through jointventures if there is a mutual benefit indoing so. No new joint ventures havebeen set up in the year. Berkeley’slargest joint venture is St James, whichis jointly owned with Thames Water.St James is currently developing 2,694homes within the business witha similar number being worked up withThames Water on potential future sites.
Group StructureOne of the key elements of Berkeley’sstrategy is to continue to simplify thestructure of the Group. The objectiveis to create an autonomous operatingstructure with few layers of managementand consequently very short decisionmaking processes. This createsan environment of greater responsibilityat all levels, creating greater jobsatisfaction and incentive to perform.We believe we have made great progressin delivering this strategy in the year.
Show timeSales and MarketingBerkeley’s developments speak forthemselves and much effort is madeto bring them to as wide an audienceas possible, thereby driving forwardsales and allowing Berkeley to receivevital feedback as it strives to constantlymatch the aspirations and demandsof its customers.
The marketing suite at BromyardAvenue, Acton.

16 www.berkeleygroup.co.uk
At the year-end Berkeley had6 divisions and 21 operatingcompanies, of which 1 division and8 operating companies are site based.In the year ended 30th April 2005 theGroup recorded sales from 101 sites,down from 130 in 2004. This againis in line with our strategy to developa smaller number of sites, thoughthe sites themselves are of larger-scaleand warrant dedicated managementattention.
In the current year excluding Crosby,Berkeley is forecast to achieve salesfrom approximately 50 sites.
The benefits of this model are apparentin a fall of overhead costs from £94.4million to £89.3 million.
Looking ForwardWhen I founded Berkeley almost30 years ago, it was because I hada passion for building and a desireto create good homes for people.
> > > Managing Director’s review
I knew that a home was one of the coreessentials of life. Over time I grewto appreciate that a thriving marketfor housing provides not only theeconomic means by which we createnew communities but it can also givenew life to old ones. From that flowedour early and pioneering ventures intourban regeneration, which are now thevery essence of the modern Berkeley.
Because we take housing and theeffects of it so seriously, we also takeour responsibilities seriously, in howwe find land to build on, how we plan,how we build and how we make surethe communities we create thrive. Andhow we help the communities that arealready there. A deep understandingof these responsibilities, and the valuesfrom which they derive, have createda new passion at Berkeley – one whichhas made the company Britain’s premierurban regenerator. It’s a huge challenge,which is only met though a strategy ofgenuine partnership. Our shareholders
have always looked for value creationover the long-term and the securityof knowing that safe hands aremanaging their business. The Schemeof Arrangement aligns these needsdirectly and in a way which enablesus to continue producing an enhancedperformance whilst minimising risk.In parallel, the country demands moreand more housing but also wantsa legacy for the built environmentof which this generation can be proud.I am delighted our business is now ableto concentrate, in partnership withall our stakeholders, on unlocking thisremarkable potential for the future.
Tony PidgleyManaging Director
Our people
The skills and experienceto make it happenBerkeley’s employeesare its most valuedasset and theircommitment tocontinuousimprovement drivesthe company.
Berkeley works hard to ensure thatclose consultation occurs withemployees on matters likely to affecttheir interests. Numerous policies arein place to ensure that all employeesreceive the same access to employmentand training, encouraging the sortof development that provides Berkeleywith people whose skills match thecompany’s aspirations.
Training and development areprized highly at Berkeley.

www.berkeleygroup.co.uk 17

18 www.berkeleygroup.co.uk
SustainabilityFull details of Berkeley’s sustainability
strategy are contained within the separate
2005 sustainability report or online at
www.berkeleygroup.co.uk.
Berkeley has, for some years now,been committed to a continually evolvingsustainability strategy. Its broad aimis to make significant, long-termcontributions to the environmental, socialand economic fabric of the communitiesin which Berkeley works, as well asto fulfil the ultimate responsibility ofmaximising shareholder value. Progresshas been good and, among severalaccolades, the company continues tobe listed in the FTSE4Good Index. 2005sees the publication of Berkeley’s fourthannual free-standing sustainability report.
This year, Berkeley’s strategic decisionto focus its activities in the field of urbanregeneration provided an emphaticdemonstration of its commitmentto sustainable communities. Berkeley’sunrivalled expertise in this area hasenabled it to augment its strong skillsbase to create new possibilities andto maximise opportunities for vitalregeneration in Britain’s towns andcities. Such an approach embracesthe current and prevailing publicpolicy agenda.
Though the focus of Berkeley’s businesshas recently changed, its commitmentto engage with its stakeholders, whetherat a local, regional or national level, hascontinued. Berkeley firmly believes thatpartnership in its schemes can ensurethat not only are good quality homescreated, but also communities that willtruly stand the test of time.
The sustainability strategy itself issubject to review each year. Togetherwith a number of subsidiary policiescovering specific issues, such asenvironment, health and safety andequal opportunities, it sets out thecompany’s key sustainability objectives.From time to time Berkeley developsGroup-wide policies concerning specificimpact areas where a consistentapproach can be taken across allof the divisions.
As part of a concerted effort to assessthe strategy, since 2002, Berkeley hasbeen measuring its sustainabilityperformance against a number of KeyPerformance Indicators.
The significance of sustainabilityKey sustainability impacts
nitiesu
mmo
C
Mak
ing a
long-
term
ment
cont
ribut
ionn
roivn Prote
ctin
g and
E enhan
cing
olderhekat Dev
elopin
g s
S partn
ersh
ips force
kroW
Safe,
hea
lthy
and fu
lfille
d

This year it has carried out an extensivereview of these ‘KPIs’ and will beintroducing a number of new indicators,as well as amending, or droppingsome, of those currently in use. All ofthe Group’s divisions are required toreport on their progress in relation toBerkeley’s targets and KPIs, on aquarterly basis.
The company continues to discloseinformation in relation to sustainabilityon its website, in a free-standing reportand in this annual report and accounts.With an increasing number of projectsimplementing sustainability initiatives,Berkeley is eager to ensure that it learnsas much as possible about the manychallenges and opportunities that arise.As such, the company has a numberof formal and informal mechanismsfor sharing good practice, such as thecompany Intranet and good practiceguidance notes and briefings.
To ensure that sustainability continuesto be prioritised and to develop,numerous important governanceprocedures are in place. Berkeley’squarterly Board reports include asummary of performance in relationto its sustainability KPIs and additionalqualitative information concerning theimplementation of the company’ssustainability strategy. Heads of Divisionmeetings have also placed significantemphasis on sustainability issues thisyear, particularly in light of Berkeley’slong-term business strategy to focuson urban regeneration projects.
Sustainability Working Group (SWG)meetings are held once a quarter andare made up of Board and seniormanagers from across the main divisionsof the Group. The SWG reviews progresstowards targets, performance in relationto the sustainability KPIs and sharesgood practice in relation to sustainabilityissues. External strategic sustainabilityadvisors attend the meetings to provideindependent counsel on Berkeley’s
strategy and the SWG also occasionallyinvites outside speakers to makepresentations to the Group.
These measures are in place to ensurethat Berkeley’s commitment tosustainability is matched by the skillswith which to implement it.
Below: Leybourne Lakes, Kent.
www.berkeleygroup.co.uk 19

Board of directors and advisers
topExperatt tıhsee
20 www.berkeleygroup.co.uk
Tony Pidgley, 57
Group Managing Director and Chairman
of the Executive Committee, he co-founded
the company in 1976 with Jim Farrer.
Roger Lewis FCA, 58
Group Chairman since February 1999 having
been appointed a Group Main Board Director
in 1992, a year after he joined the company.
He is a member of the Executive Committee
and Chairman of the Nomination Committee.
Honorary Life President
Jim Farrer MRICS, 74
Along with Tony Pidgley a co-founder of the
company, he was Group Chairman until his
retirement in 1992. At that time he was
appointed Honorary Life President.
Rob Perrins BSc(Hons) ACA, 40
Having qualified as a chartered accountant in
1991 he joined the company three years later.
Appointed to the Group Main Board on 1 May
2001, having become Managing Director
of Berkeley Homes plc, he became Group
Finance Director on 2 November 2001. He is
also a member of the Executive Committee.
Victoria Mitchell, 54
Appointed a Non-executive Director on
1 May 2002, she is Chairman of the
Remuneration Committee and a member
of the Audit and Nomination Committees.
Currently a Consultant Director of Savills
Limited, she was previously an Executive
Director of Savills plc. She is also a
Member of ING REIM Residential Property
Fund Advisory Board, a Non-executive
Director of The Golding Group (South
Africa), and Development Securities plc.

www.berkeleygroup.co.uk 21www.berkeleygroup.co.uk 21
Company SecretaryElizabeth Taylor FCIS
Executive CommitteeA W Pidgley (Chairman)R St J H LewisA CareyG J FryR C Perrins
Remuneration CommitteeV M Mitchell (Chairman)H A PalmerD Howell
Audit CommitteeD Howell (Chairman)V M MitchellH A Palmer
Nomination CommitteeR St J H Lewis (Chairman)V M MitchellH A Palmer
Registered office and principal place of businessBerkeley House19 Portsmouth RoadCobham, Surrey KT11 1JG
Registered number 5172586
Registrars Capita RegistrarsThe Registrary34 Beckenham RoadBechenham, Kent BR3 4TUTel: 0870 162 3100
Stockbrokers UBS
Share price information The Company’s share capital is listed on theLondon Stock Exchange. The latest shareprice is available via the company’s websiteat www.berkeleygroup.co.uk
Solicitors AshurstSacker & PartnersShearman & Sterling
Auditors PricewaterhouseCoopers LLP
Bankers Barclays BankLloyds TSB BankThe Royal Bank of Scotland
Greg Fry ACA, 48
Having joined the company in 1982 he became a
director of St George PLC from the division’s
inception in 1996 and is currently the chairman
of its three main operating companies. On 1 May
1996 he was appointed to the Group Main Board
and he is a member of the Executive Committee.
Tony Carey BSc FRICS, 57
Managing Director of St George PLC since
1990, having joined the division in 1987.
He was invited to join the Group Main Board
on 28 June 1993 and is a member of the
Executive Committee.
Tony Palmer FRICS FCIOB, 68
Appointed a Non-executive Director on
1 January 1998, he is a member of the Audit,
Remuneration and Nomination Committees
and is the Senior Independent Director.
He is currently the Chairman of Galliford Try
and Poole Investments plc having been the
Chief Executive of Taylor Woodrow Plc.
David Howell FCA, 56
A Non-executive Director since 24 February
2004, at which point he was also appointed
Chairman of the Audit Committee. Also
a member of the Group’s Remuneration
Committee, he was the Chief Financial Officer
and a Main Board Director of lastminute.com plc
until March 2005. From 1998 to 2001 he was
the Group Finance Director of First Choice
Holidays plc, and served as a Non-executive
Director of Nestor Healthcare Group plc from
2000 to 2003.
22 www.berkeleygroup.co.uk
Directors’ reportThe Directors submit their report together with the financial statements for the year ended 30 April 2005.
Capital reorganisation and scheme of arrangementEffective 26 October 2004 the Company acquired 100% of the issued share capital of The Berkeley Group plc followingimplementation of a Scheme of Arrangement under Section 425 of the Companies Act 1985.
References throughout the Annual Report and Financial Statements to the “Company” refer to The Berkeley Group Holdingsplc from 26 October 2004 onwards and prior to that to The Berkeley Group plc.
Principal activities and review of the businessThe Company is a UK listed holding company of a wider group engaged in residential and commercial propertydevelopment focusing on urban regeneration and mixed-use developments.
The Chairman’s Statement on pages 2 to 5 and the Group Managing Director’s Operational Review on pages 6 to 16provide more detailed commentaries on the business during the year, together with the outlook for the future.
Trading results and dividendsThe Group’s consolidated net profit after taxation for the financial year was £144,643,000 (2004 restated: £162,020,000).Following the payment of the final ordinary dividend in respect of the financial year ended 30 April 2004 of 16.5p perOrdinary Share in The Berkeley Group plc, amounting to £19,676,000 paid on 9 September 2004 to shareholders on theRegister on 13 August 2004, the Company intends that, prior to 31 January 2011, substantially all returns to Shareholderswill be by way of payments made on the B Shares. However, subject to the Companies Act, dividends may be declared onthe Ordinary Shares of 5p at any time.
The Group’s joint ventures contributed profits before taxation of £11,918,000 (2004: £18,403,000).
Share capitalAt the Extraordinary General Meeting of The Berkeley Group plc on 17 September 2004 shareholders approved the CourtApproved Scheme of Arrangement which resulted in a new listed holding company being created, The Berkeley GroupHoldings plc. The Scheme became effective on 26 October 2004 and the Company became the holding company ofThe Berkeley Group plc.
In order to improve the efficiency of the Company’s share capital, on 4 May 2004, within the 10% limit authorised byshareholders at the 2003 Annual General Meeting, the Company completed the purchase of 2,094,261 (2004: 6,993,318)of its shares, with a nominal value of £523,565 (2004: £1,748,330), for cancellation at a cost of £9.80 (2004: £7.44)per share, for a total cost, net of expenses, of £20,523,758 (2004: £51,998,948). This represented 2% (2004: 6%) of thecalled-up share capital of the Company at the start of the year.
Of the 10% authority given at the 2004 Annual General Meeting, no share purchases have been made. Authority will besought from shareholders at the forthcoming Annual General Meeting to renew the 10% authority for a further year.
Under the Scheme of Arrangement all shareholders of The Berkeley Group plc, at the effective date, received Units inThe Berkeley Group Holdings plc (each comprising one ordinary share, one 2004 B share, one 2006 B share, one 2008B share and one 2010 B share), hereafter referred to as “Units”.
During the year the Company redeemed 120,820,642 2004 B shares at £5 per share. The Company had 120,820,642 Unitsin issue at 30 April 2005.
Movements in the Company’s share capital are shown in Note 18 to the accounts.
Information on the Group’s share option schemes is set out in Note 18 to the accounts. Details of the Long Term IncentiveSchemes and Long Term Incentive Plans for key executives are set out in the Remuneration Committee Report on pages25 to 39.
DirectorsThe Directors of the Company and their profiles are detailed on pages 20 and 21. All of the Directors served throughout theyear under review.
Since this is the first Annual General Meeting of The Berkeley Group Holdings plc, all Directors are seeking re-electionthis year.
www.berkeleygroup.co.uk 23
The Directors’ interests in the share capital of the Company and its subsidiaries are shown in the Remuneration CommitteeReport on page 38. At 30 April 2005 each of the Executive Directors was deemed to have a non-beneficial interest in915,607 (2004: 1,077,317) Units held by the Trustees of The Berkeley Group Employee Benefit Trust.
There were no contracts of significance during, or at the end of, the financial year in which a Director of the Company is,or was, materially interested, other than those set out in Note 25, the contracts of employment of the Executive Directors,which are terminable within one year, and the appointment terms of the Non-executive Directors, which are renewableannually and terminable on one month’s notice.
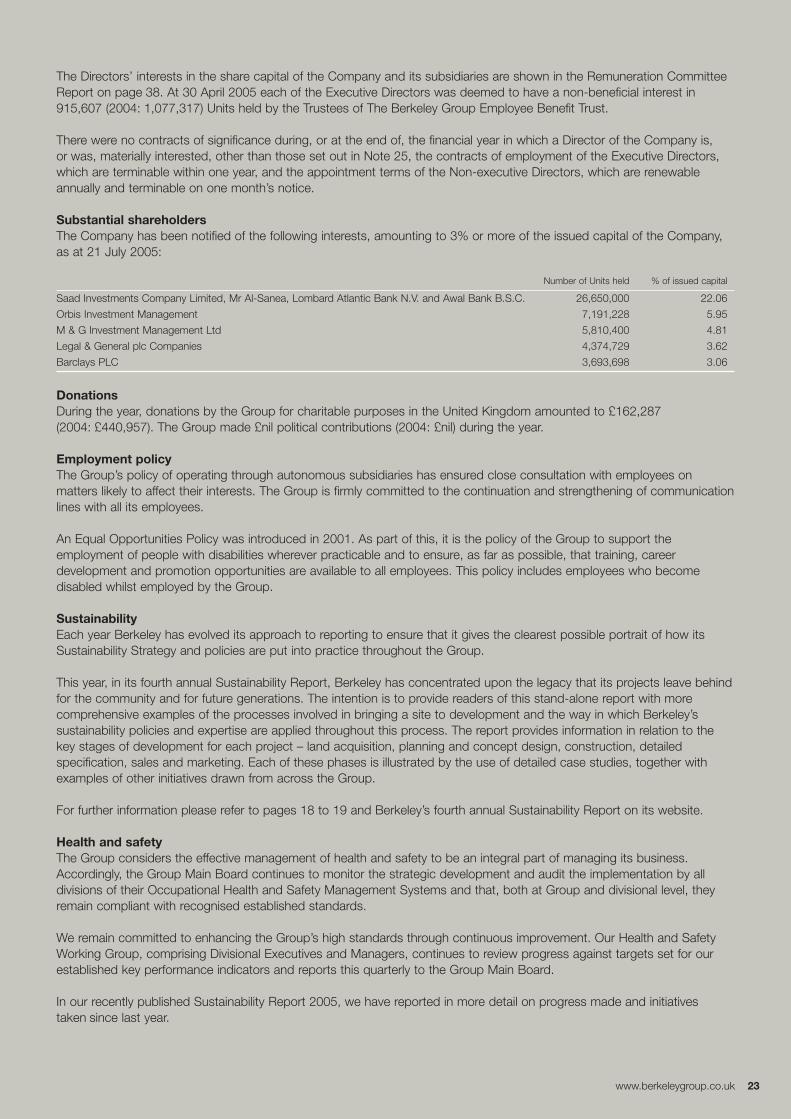
Substantial shareholdersThe Company has been notified of the following interests, amounting to 3% or more of the issued capital of the Company,as at 21 July 2005:
Number of Units held % of issued capital
Saad Investments Company Limited, Mr Al-Sanea, Lombard Atlantic Bank N.V. and Awal Bank B.S.C. 26,650,000 22.06
Orbis Investment Management 7,191,228 5.95
M & G Investment Management Ltd 5,810,400 4.81
Legal & General plc Companies 4,374,729 3.62
Barclays PLC 3,693,698 3.06
DonationsDuring the year, donations by the Group for charitable purposes in the United Kingdom amounted to £162,287(2004: £440,957). The Group made £nil political contributions (2004: £nil) during the year.
Employment policyThe Group’s policy of operating through autonomous subsidiaries has ensured close consultation with employees onmatters likely to affect their interests. The Group is firmly committed to the continuation and strengthening of communicationlines with all its employees.
An Equal Opportunities Policy was introduced in 2001. As part of this, it is the policy of the Group to support theemployment of people with disabilities wherever practicable and to ensure, as far as possible, that training, careerdevelopment and promotion opportunities are available to all employees. This policy includes employees who becomedisabled whilst employed by the Group.
SustainabilityEach year Berkeley has evolved its approach to reporting to ensure that it gives the clearest possible portrait of how itsSustainability Strategy and policies are put into practice throughout the Group.
This year, in its fourth annual Sustainability Report, Berkeley has concentrated upon the legacy that its projects leave behindfor the community and for future generations. The intention is to provide readers of this stand-alone report with morecomprehensive examples of the processes involved in bringing a site to development and the way in which Berkeley’ssustainability policies and expertise are applied throughout this process. The report provides information in relation to thekey stages of development for each project – land acquisition, planning and concept design, construction, detailedspecification, sales and marketing. Each of these phases is illustrated by the use of detailed case studies, together withexamples of other initiatives drawn from across the Group.
For further information please refer to pages 18 to 19 and Berkeley’s fourth annual Sustainability Report on its website.
Health and safety The Group considers the effective management of health and safety to be an integral part of managing its business.Accordingly, the Group Main Board continues to monitor the strategic development and audit the implementation by alldivisions of their Occupational Health and Safety Management Systems and that, both at Group and divisional level, theyremain compliant with recognised established standards.
We remain committed to enhancing the Group’s high standards through continuous improvement. Our Health and SafetyWorking Group, comprising Divisional Executives and Managers, continues to review progress against targets set for ourestablished key performance indicators and reports this quarterly to the Group Main Board.
In our recently published Sustainability Report 2005, we have reported in more detail on progress made and initiativestaken since last year.
24 www.berkeleygroup.co.uk
Directors’ report continuedPayment of creditors Each of the Group’s operating companies is responsible for agreeing the terms and conditions, including terms of payment,relating to transactions with its suppliers. It is Group policy to abide by the agreed terms of payment where the supplier hasprovided the goods and services in accordance with the relevant terms and conditions of contract. At 30 April 2005, theCompany does not have any trade creditors (2004 supplier payment period: 10 days).
Post balance sheet event – disposalsOn 23 June 2005, the Group announced that it had entered into an agreement with Lend Lease Corporation Limited for thesale of The Crosby Group plc for £235.7 million. In addition Berkeley will be repaid £15 million, in respect of working capitalprovided to Crosby since 30 April 2005.
Annual General MeetingThe Annual General Meeting of the Company is to be held at the Woodlands Park Hotel, Woodlands Lane, Stoke D’Abernon,Cobham, Surrey KT11 3QB at 11.00am on Thursday 1 September 2005. The Notice of Meeting, which is contained in aseparate letter from the Group Chairman accompanying this report, includes a commentary on the business to betransacted at the Annual General Meeting.
AuditorsA resolution to reappoint PricewaterhouseCoopers LLP as auditors to the Company will be proposed at theAnnual General Meeting.
By order of the Board
E Taylor FCISCompany Secretary21 July 2005
Remuneration Committee reportIntroductionOn 25 June 2004 the Company announced that it had concluded a strategic review which led to the restructuring of theCompany that was approved by shareholders at the EGM on 17 September 2004. It was recognised at the time of thestrategic review that if the restructuring went ahead it would have a significant impact on the Company’s existingperformance based compensation; in particular:
• the subsisting share awards and options under the Company’s various share schemes;• the annual bonus performance conditions for FY2005 and subsequent financial years; and• the structure of the 2004 Long-Term Incentive Plan and the proposed performance conditions for the first grant of awards
under the Plan.
In light of the impact on a crucial part of the total remuneration package received by Executive Directors, the RemunerationCommittee felt that it was appropriate to revisit the remuneration policy approved by shareholders at the EGM on24 February 2004. Therefore, as part of the process leading up to the EGM on 17 September 2004, the RemunerationCommittee Chairman and the Committee’s retained consultants, Halliwell Consulting, consulted with the Company’sprincipal shareholders on a revised remuneration policy.
Following the extensive consultation, 77% of shareholders voting approved a new remuneration policy for the Company’sExecutive Directors at the EGM held on 17 September 2004. The key features of the new remuneration policy are:
• the retention of the current salary freeze for the Executive Directors to 30 April 2006;• a change to the performance conditions for the annual bonus plan; and• the introduction of a new Long-Term Incentive Plan, The Berkeley Group Holdings plc 2004(b) Long-Term Incentive Plan
(the “2004(b) LTIP”).
The Remuneration Committee believes that its revised policy and the new structure with an even stronger emphasis onperformance based short and long-term compensation should encourage Executives to focus on delivering the businessstrategy thereby enhancing shareholder value as well as providing meaningful incentives to Executives. This Report will beput to an advisory vote of the Company’s shareholders at the 2005 AGM on 1 September 2005.
BackgroundThis report has been prepared in accordance with The Directors’ Remuneration Report Regulations 2002, (“theregulations”). The auditors are required to report on the ‘auditable’ part of this report and to state whether, in their opinion,that part of the report has been properly prepared in accordance with the Companies Act 1985 (as amended by theregulations). The report is therefore divided into separate sections for audited and unaudited information.
The Board has reviewed the Group’s compliance with the Combined Code (the “Code”) on remuneration related matters.It is the opinion of the Board that the Group complied with all remuneration related aspects of the Code throughout the year.
Part 2 of the regulations – unaudited information
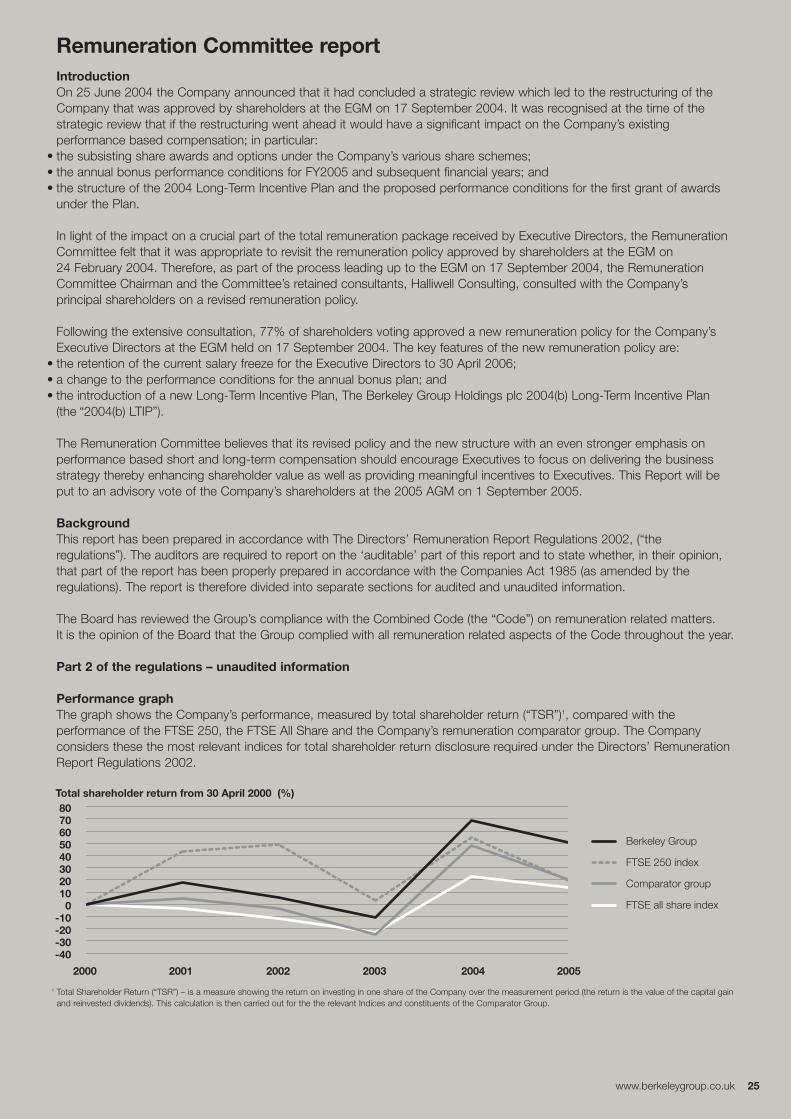
Performance graphThe graph shows the Company’s performance, measured by total shareholder return (“TSR”)1, compared with theperformance of the FTSE 250, the FTSE All Share and the Company’s remuneration comparator group. The Companyconsiders these the most relevant indices for total shareholder return disclosure required under the Directors’ RemunerationReport Regulations 2002.
www.berkeleygroup.co.uk 25
2000 2001 2002 2003 2004 2005
Total shareholder return from 30 April 2000 (%)
-40-30-20-10
01020304050607080
Berkeley Group
FTSE 250 index
Comparator group
FTSE all share index
1 Total Shareholder Return (“TSR”) – is a measure showing the return on investing in one share of the Company over the measurement period (the return is the value of the capital gainand reinvested dividends). This calculation is then carried out for the the relevant Indices and constituents of the Comparator Group.
26 www.berkeleygroup.co.uk
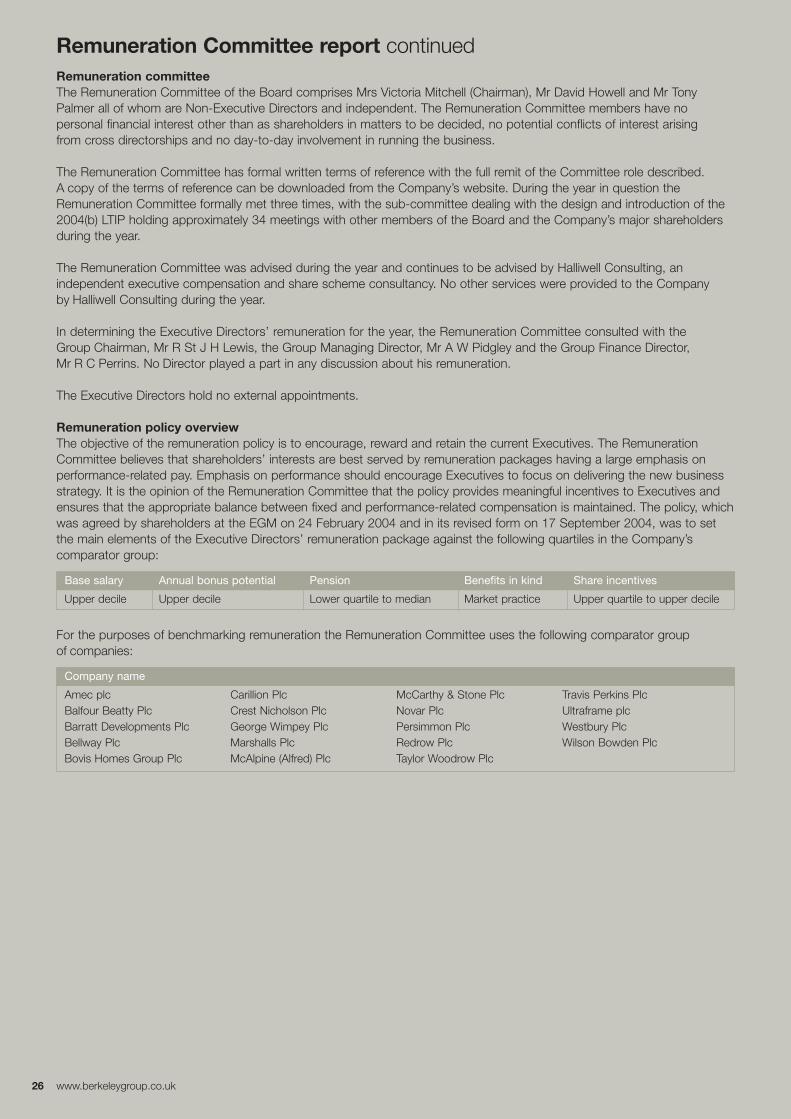
Remuneration Committee report continuedRemuneration committeeThe Remuneration Committee of the Board comprises Mrs Victoria Mitchell (Chairman), Mr David Howell and Mr TonyPalmer all of whom are Non-Executive Directors and independent. The Remuneration Committee members have nopersonal financial interest other than as shareholders in matters to be decided, no potential conflicts of interest arisingfrom cross directorships and no day-to-day involvement in running the business.
The Remuneration Committee has formal written terms of reference with the full remit of the Committee role described.A copy of the terms of reference can be downloaded from the Company’s website. During the year in question theRemuneration Committee formally met three times, with the sub-committee dealing with the design and introduction of the2004(b) LTIP holding approximately 34 meetings with other members of the Board and the Company’s major shareholdersduring the year.
The Remuneration Committee was advised during the year and continues to be advised by Halliwell Consulting, anindependent executive compensation and share scheme consultancy. No other services were provided to the Companyby Halliwell Consulting during the year.
In determining the Executive Directors’ remuneration for the year, the Remuneration Committee consulted with theGroup Chairman, Mr R St J H Lewis, the Group Managing Director, Mr A W Pidgley and the Group Finance Director,Mr R C Perrins. No Director played a part in any discussion about his remuneration.
The Executive Directors hold no external appointments.
Remuneration policy overviewThe objective of the remuneration policy is to encourage, reward and retain the current Executives. The RemunerationCommittee believes that shareholders’ interests are best served by remuneration packages having a large emphasis onperformance-related pay. Emphasis on performance should encourage Executives to focus on delivering the new businessstrategy. It is the opinion of the Remuneration Committee that the policy provides meaningful incentives to Executives andensures that the appropriate balance between fixed and performance-related compensation is maintained. The policy, whichwas agreed by shareholders at the EGM on 24 February 2004 and in its revised form on 17 September 2004, was to setthe main elements of the Executive Directors’ remuneration package against the following quartiles in the Company’scomparator group:
Base salary Annual bonus potential Pension Benefits in kind Share incentives
Upper decile Upper decile Lower quartile to median Market practice Upper quartile to upper decile
For the purposes of benchmarking remuneration the Remuneration Committee uses the following comparator groupof companies:
Company name
Amec plc Carillion Plc McCarthy & Stone Plc Travis Perkins PlcBalfour Beatty Plc Crest Nicholson Plc Novar Plc Ultraframe plcBarratt Developments Plc George Wimpey Plc Persimmon Plc Westbury PlcBellway Plc Marshalls Plc Redrow Plc Wilson Bowden PlcBovis Homes Group Plc McAlpine (Alfred) Plc Taylor Woodrow Plc
www.berkeleygroup.co.uk 27
The Remuneration Committee reviews the policy on an annual basis to ensure that it is in line with the Company’s objectives and shareholders’ interests.
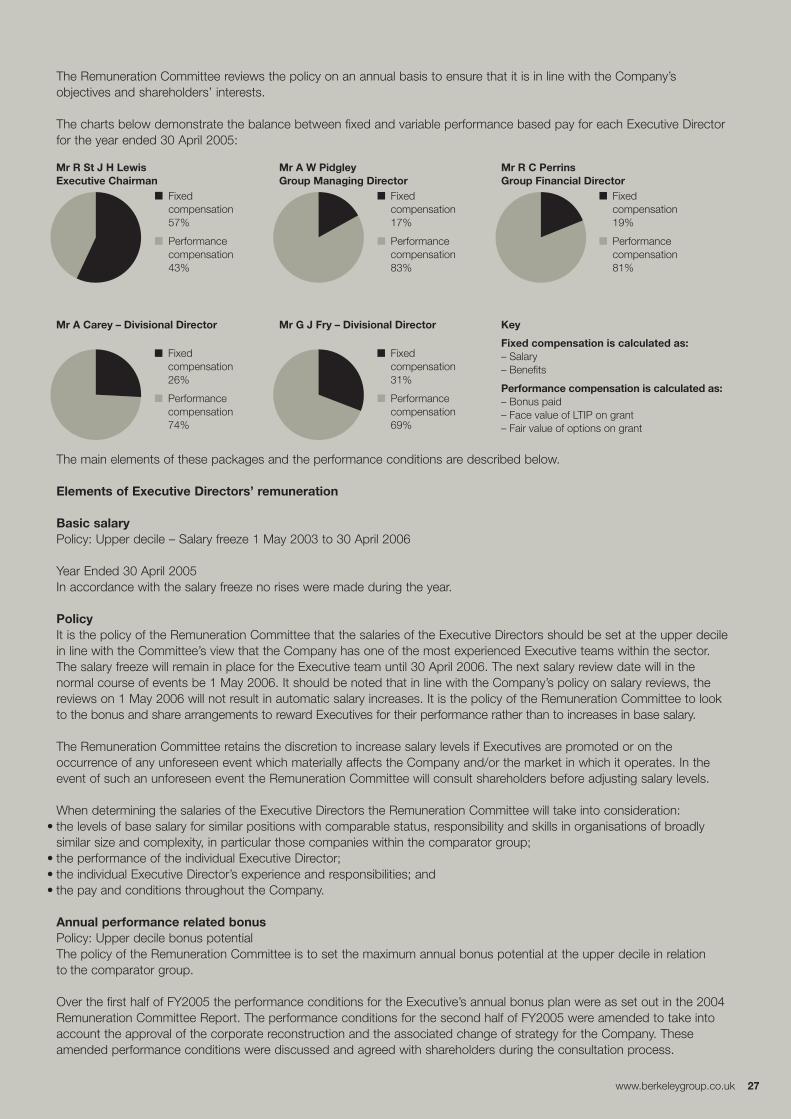
The charts below demonstrate the balance between fixed and variable performance based pay for each Executive Directorfor the year ended 30 April 2005:
Mr R St J H LewisExecutive Chairman
Fixedcompensation57%
Performancecompensation43%
Mr A W PidgleyGroup Managing Director
Fixedcompensation17%
Performancecompensation83%
Mr R C PerrinsGroup Financial Director
Fixedcompensation19%
Performancecompensation81%
Mr A Carey – Divisional Director
Fixedcompensation26%
Performancecompensation74%
Mr G J Fry – Divisional Director
Fixedcompensation31%
Performancecompensation69%
Key
Fixed compensation is calculated as:– Salary– Benefits
Performance compensation is calculated as:– Bonus paid– Face value of LTIP on grant– Fair value of options on grant
The main elements of these packages and the performance conditions are described below.
Elements of Executive Directors’ remuneration
Basic salaryPolicy: Upper decile – Salary freeze 1 May 2003 to 30 April 2006
Year Ended 30 April 2005In accordance with the salary freeze no rises were made during the year.
PolicyIt is the policy of the Remuneration Committee that the salaries of the Executive Directors should be set at the upper decilein line with the Committee’s view that the Company has one of the most experienced Executive teams within the sector.The salary freeze will remain in place for the Executive team until 30 April 2006. The next salary review date will in thenormal course of events be 1 May 2006. It should be noted that in line with the Company’s policy on salary reviews, thereviews on 1 May 2006 will not result in automatic salary increases. It is the policy of the Remuneration Committee to lookto the bonus and share arrangements to reward Executives for their performance rather than to increases in base salary.
The Remuneration Committee retains the discretion to increase salary levels if Executives are promoted or on theoccurrence of any unforeseen event which materially affects the Company and/or the market in which it operates. In theevent of such an unforeseen event the Remuneration Committee will consult shareholders before adjusting salary levels.
When determining the salaries of the Executive Directors the Remuneration Committee will take into consideration:• the levels of base salary for similar positions with comparable status, responsibility and skills in organisations of broadly
similar size and complexity, in particular those companies within the comparator group;• the performance of the individual Executive Director; • the individual Executive Director’s experience and responsibilities; and• the pay and conditions throughout the Company.
Annual performance related bonusPolicy: Upper decile bonus potentialThe policy of the Remuneration Committee is to set the maximum annual bonus potential at the upper decile in relationto the comparator group.
Over the first half of FY2005 the performance conditions for the Executive’s annual bonus plan were as set out in the 2004Remuneration Committee Report. The performance conditions for the second half of FY2005 were amended to take intoaccount the approval of the corporate reconstruction and the associated change of strategy for the Company. Theseamended performance conditions were discussed and agreed with shareholders during the consultation process.
28 www.berkeleygroup.co.uk
Remuneration Committee report continuedGeneralThe theoretical maximum bonus available is 300% of salary. However, the Remuneration Committee will only in veryexceptional circumstances, outside the normal operation of the bonus plan for the year in question consider a bonuspayment greater than 200% of salary. On the occurrence of very exceptional circumstances and prior to any commitmentto make a bonus payment, the Remuneration Committee would consult shareholders to obtain their agreement that thecircumstances gave rise to the level of bonus payment proposed. Therefore, the effective maximum annual bonus potentialis 200% of salary.
Bonus targets are reviewed each year and agreed by the Remuneration Committee. The performance measures for theExecutive Directors’ bonus plan are reviewed by the Remuneration Committee to ensure that they are appropriate to thecurrent market conditions and position of the Company, so that they continue to remain challenging.
The structure of bonus payments is as follows:
Position Percentage cash Percentage Units
Executive Bonus will be paid in cash up to a Any bonus payment above 100% of salarymaximum of 100% of salary. will be invested, net of tax, in Units2. These
Units will be retained by the Executives for 18 months.
2 Following the restructuring of the Company in October 2004, the Company’s share capital can only be held and transferred in the form of Units (each Unit comprising one ordinaryshare of 5p, one 2004 B share of 5p, one 2006 B share of 5p, one 2008 B share of 5p and one 2010 share of 5p), hereafter referred to as “Units”.
Participants in the annual bonus plan will only be eligible to receive a bonus if they meet the performance targets. However,the Remuneration Committee will retain the discretion to adjust bonus payments (either up or down) if in their opinion theresults would otherwise be inappropriate. It should be noted that this discretion will be exercised sparingly to ensurecertainty for participants and transparency for shareholders. If the Remuneration Committee does exercise its discretion toadjust bonus payments it will only do so where there is an objective justification which can be explained to shareholders. In addition, the Remuneration Committee will ensure that any changes to the basis of payment or financial performancetargets are independently verified. On an ongoing basis, the Remuneration Committee will continue to set robust andchallenging performance targets at the beginning of each financial year taking into account the business plan for that yearand general market conditions.
Bonus payments are not pensionable.
FY2005The targets for the year ended 30 April 2005, their level of achievement and the corresponding bonus earned for theExecutive Directors are set out in the following tables:
Bonus targets for year ended 30 April 2005The following table shows the element of the maximum bonus potential for each of the Executive Directors subject to eachperformance target:
Executive
R St J H Lewis
1 May 2004 – 31 October 2004Group ROCE Divisional PBT targets
50% –
1 November 2004 – 30 April 20052004 cash redemption Divisional PBT targetspayment made
50% –
A W Pidgley 50% – 50% –
R C Perrins 50% – 50% –
A Carey 12.5% 37.5% 12.5% 37.5%
G J Fry 12.5% 37.5% 12.5% 37.5%
www.berkeleygroup.co.uk 29
The following table shows the actual level of performance for FY2005 against targeted performance:
1 May 2004 – 31 October 2004 1 November 2004 – 30 April 2005Element Group ROCE Divisional PBT targets 2004 cash redemption Divisional PBT targets
payment made
Target (for 20% Payment mademaximum bonus)
Applied for year andPerformance 22.5% Applied for year and Payment madeachieved based on sliding PBT based on sliding PBT
Percentage of this element ofbonus earned
100% scale 100% scale
The following table shows the maximum potential bonus for each Executive, the bonus earned and the upper decilepayments in the comparator group for the year ended 30 April 2005:
Name R St J H Lewis A W Pidgley R C Perrins A Carey G J Fry
Effective maximum bonus potential (% of salary) 200% 200% 200% 200% 200%
2005 bonus paid £165,000 £1,500,000 £650,000 £550,000 £275,000
2005 bonus paid (% of salary) 75% 200% 200% 136% 95%
Upper decile bonus payments in the comparator group as % of salary 200% 200% 200% 175% 175%
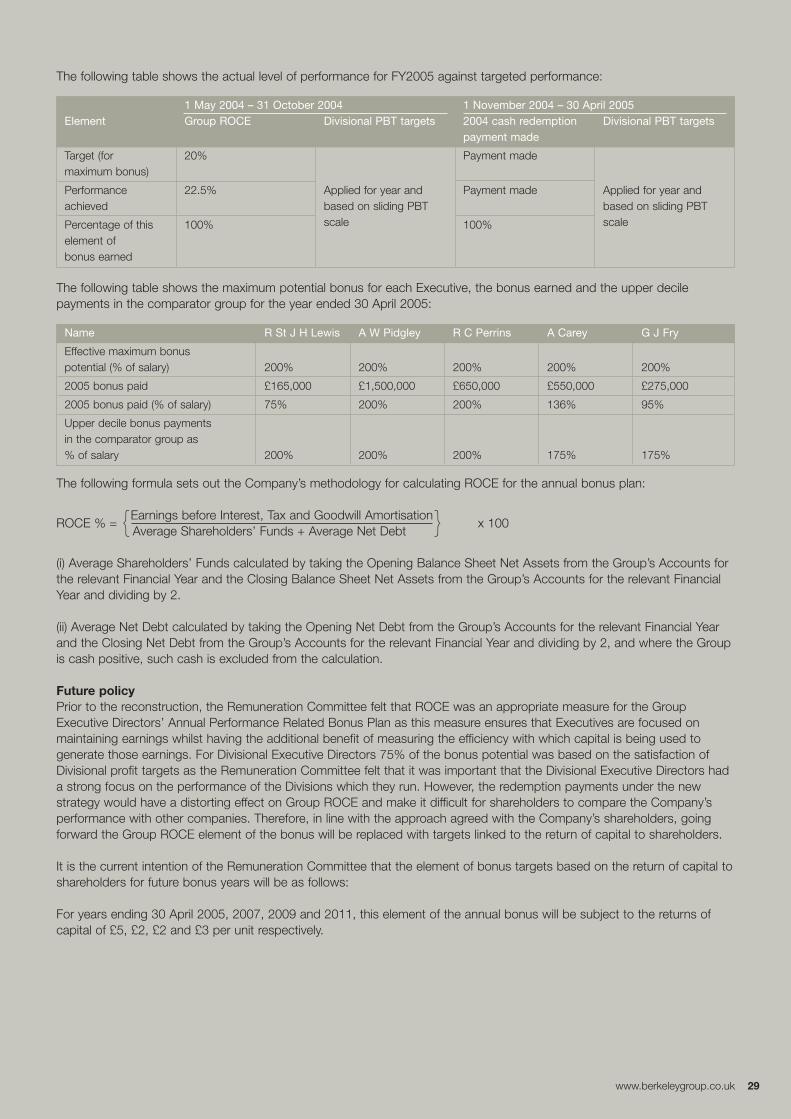
The following formula sets out the Company’s methodology for calculating ROCE for the annual bonus plan:
ROCE % = {Earnings before Interest, Tax and Goodwill Amortisationx 100
Average Shareholders’ Funds + Average Net Debt }(i) Average Shareholders’ Funds calculated by taking the Opening Balance Sheet Net Assets from the Group’s Accounts forthe relevant Financial Year and the Closing Balance Sheet Net Assets from the Group’s Accounts for the relevant FinancialYear and dividing by 2.
(ii) Average Net Debt calculated by taking the Opening Net Debt from the Group’s Accounts for the relevant Financial Yearand the Closing Net Debt from the Group’s Accounts for the relevant Financial Year and dividing by 2, and where the Groupis cash positive, such cash is excluded from the calculation.
Future policyPrior to the reconstruction, the Remuneration Committee felt that ROCE was an appropriate measure for the GroupExecutive Directors’ Annual Performance Related Bonus Plan as this measure ensures that Executives are focused onmaintaining earnings whilst having the additional benefit of measuring the efficiency with which capital is being used togenerate those earnings. For Divisional Executive Directors 75% of the bonus potential was based on the satisfaction ofDivisional profit targets as the Remuneration Committee felt that it was important that the Divisional Executive Directors hada strong focus on the performance of the Divisions which they run. However, the redemption payments under the newstrategy would have a distorting effect on Group ROCE and make it difficult for shareholders to compare the Company’sperformance with other companies. Therefore, in line with the approach agreed with the Company’s shareholders, goingforward the Group ROCE element of the bonus will be replaced with targets linked to the return of capital to shareholders.
It is the current intention of the Remuneration Committee that the element of bonus targets based on the return of capital toshareholders for future bonus years will be as follows:
For years ending 30 April 2005, 2007, 2009 and 2011, this element of the annual bonus will be subject to the returns ofcapital of £5, £2, £2 and £3 per unit respectively.
30 www.berkeleygroup.co.uk
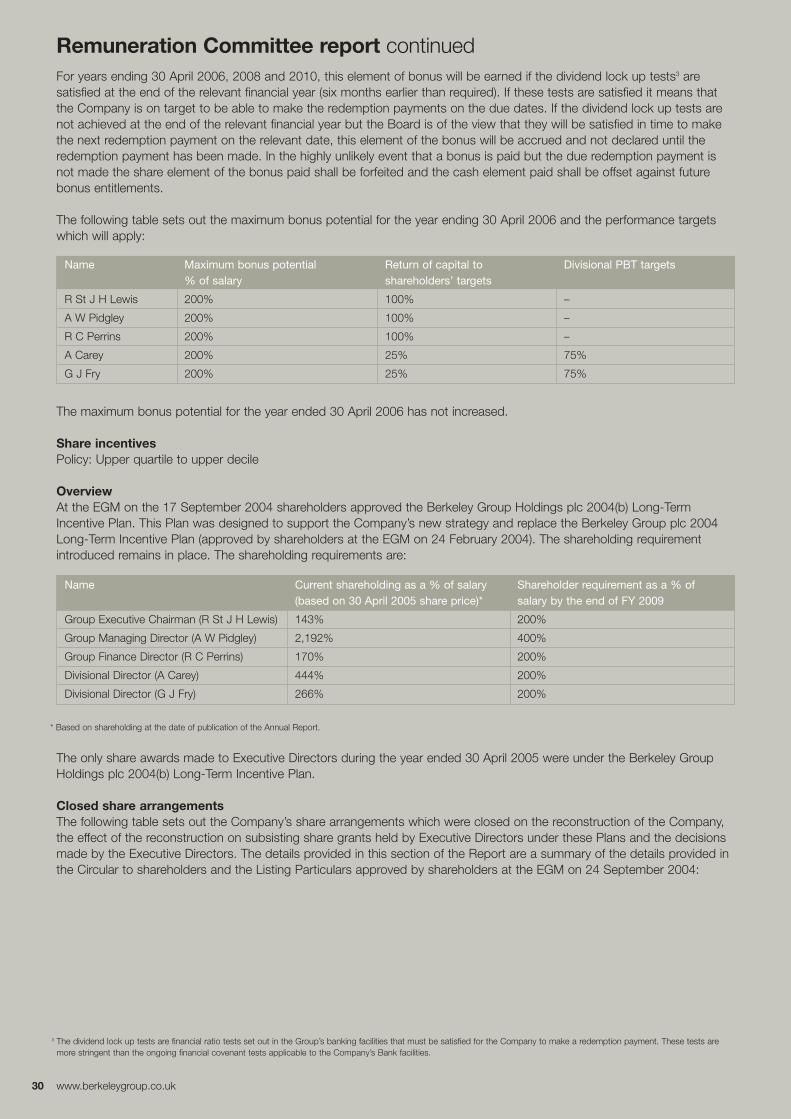
Remuneration Committee report continuedFor years ending 30 April 2006, 2008 and 2010, this element of bonus will be earned if the dividend lock up tests3 aresatisfied at the end of the relevant financial year (six months earlier than required). If these tests are satisfied it means thatthe Company is on target to be able to make the redemption payments on the due dates. If the dividend lock up tests arenot achieved at the end of the relevant financial year but the Board is of the view that they will be satisfied in time to makethe next redemption payment on the relevant date, this element of the bonus will be accrued and not declared until theredemption payment has been made. In the highly unlikely event that a bonus is paid but the due redemption payment isnot made the share element of the bonus paid shall be forfeited and the cash element paid shall be offset against futurebonus entitlements.
The following table sets out the maximum bonus potential for the year ending 30 April 2006 and the performance targetswhich will apply:
Name
R St J H Lewis
Maximum bonus potential % of salary
200%
Return of capital to shareholders’ targets
100%
Divisional PBT targets
–
A W Pidgley 200% 100% –
R C Perrins 200% 100% –
A Carey 200% 25% 75%
G J Fry 200% 25% 75%
The maximum bonus potential for the year ended 30 April 2006 has not increased.
Share incentivesPolicy: Upper quartile to upper decile
OverviewAt the EGM on the 17 September 2004 shareholders approved the Berkeley Group Holdings plc 2004(b) Long-TermIncentive Plan. This Plan was designed to support the Company’s new strategy and replace the Berkeley Group plc 2004Long-Term Incentive Plan (approved by shareholders at the EGM on 24 February 2004). The shareholding requirementintroduced remains in place. The shareholding requirements are:
Name Current shareholding as a % of salary (based on 30 April 2005 share price)*
Shareholder requirement as a % of salary by the end of FY 2009
Group Executive Chairman (R St J H Lewis) 143% 200%
Group Managing Director (A W Pidgley) 2,192% 400%
Group Finance Director (R C Perrins) 170% 200%
Divisional Director (A Carey) 444% 200%
Divisional Director (G J Fry) 266% 200%
* Based on shareholding at the date of publication of the Annual Report.
The only share awards made to Executive Directors during the year ended 30 April 2005 were under the Berkeley GroupHoldings plc 2004(b) Long-Term Incentive Plan.
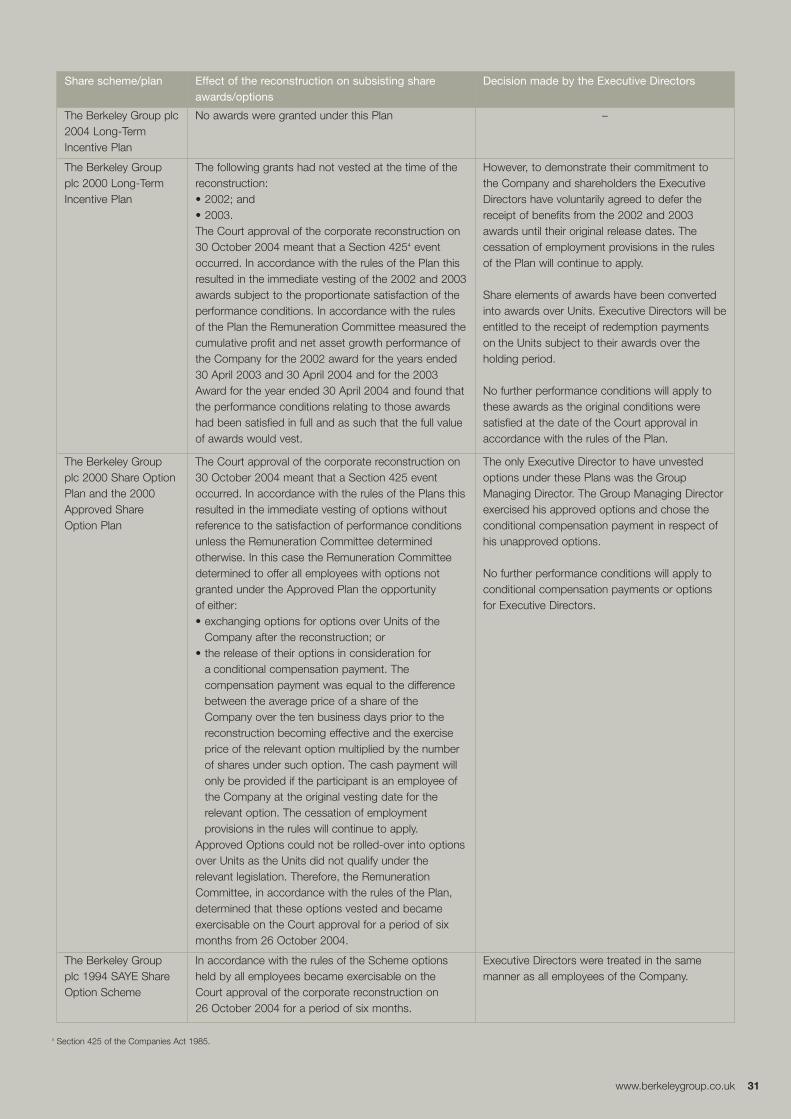
Closed share arrangementsThe following table sets out the Company’s share arrangements which were closed on the reconstruction of the Company,the effect of the reconstruction on subsisting share grants held by Executive Directors under these Plans and the decisionsmade by the Executive Directors. The details provided in this section of the Report are a summary of the details provided inthe Circular to shareholders and the Listing Particulars approved by shareholders at the EGM on 24 September 2004:
3 The dividend lock up tests are financial ratio tests set out in the Group’s banking facilities that must be satisfied for the Company to make a redemption payment. These tests aremore stringent than the ongoing financial covenant tests applicable to the Company’s Bank facilities.
www.berkeleygroup.co.uk 31
Share scheme/plan Effect of the reconstruction on subsisting shareawards/options
Decision made by the Executive Directors
The Berkeley Group plc2004 Long-TermIncentive Plan
No awards were granted under this Plan –
The Berkeley Group The following grants had not vested at the time of the However, to demonstrate their commitment toplc 2000 Long-Term reconstruction: the Company and shareholders the ExecutiveIncentive Plan • 2002; and
• 2003.The Court approval of the corporate reconstruction on30 October 2004 meant that a Section 4254 eventoccurred. In accordance with the rules of the Plan thisresulted in the immediate vesting of the 2002 and 2003awards subject to the proportionate satisfaction of theperformance conditions. In accordance with the rulesof the Plan the Remuneration Committee measured thecumulative profit and net asset growth performance ofthe Company for the 2002 award for the years ended30 April 2003 and 30 April 2004 and for the 2003Award for the year ended 30 April 2004 and found thatthe performance conditions relating to those awardshad been satisfied in full and as such that the full valueof awards would vest.
Directors have voluntarily agreed to defer thereceipt of benefits from the 2002 and 2003awards until their original release dates. Thecessation of employment provisions in the rulesof the Plan will continue to apply.
Share elements of awards have been convertedinto awards over Units. Executive Directors will beentitled to the receipt of redemption paymentson the Units subject to their awards over theholding period.
No further performance conditions will apply tothese awards as the original conditions weresatisfied at the date of the Court approval inaccordance with the rules of the Plan.
The Berkeley Groupplc 2000 Share OptionPlan and the 2000Approved ShareOption Plan
The Court approval of the corporate reconstruction on30 October 2004 meant that a Section 425 eventoccurred. In accordance with the rules of the Plans thisresulted in the immediate vesting of options withoutreference to the satisfaction of performance conditionsunless the Remuneration Committee determinedotherwise. In this case the Remuneration Committeedetermined to offer all employees with options notgranted under the Approved Plan the opportunityof either:• exchanging options for options over Units of the
Company after the reconstruction; or• the release of their options in consideration for
a conditional compensation payment. Thecompensation payment was equal to the differencebetween the average price of a share of theCompany over the ten business days prior to thereconstruction becoming effective and the exerciseprice of the relevant option multiplied by the numberof shares under such option. The cash payment willonly be provided if the participant is an employee ofthe Company at the original vesting date for therelevant option. The cessation of employmentprovisions in the rules will continue to apply.
Approved Options could not be rolled-over into optionsover Units as the Units did not qualify under therelevant legislation. Therefore, the RemunerationCommittee, in accordance with the rules of the Plan,determined that these options vested and becameexercisable on the Court approval for a period of sixmonths from 26 October 2004.
The only Executive Director to have unvestedoptions under these Plans was the GroupManaging Director. The Group Managing Directorexercised his approved options and chose theconditional compensation payment in respect ofhis unapproved options.
No further performance conditions will apply toconditional compensation payments or optionsfor Executive Directors.
The Berkeley Group In accordance with the rules of the Scheme options Executive Directors were treated in the sameplc 1994 SAYE Share held by all employees became exercisable on the manner as all employees of the Company.Option Scheme Court approval of the corporate reconstruction on
26 October 2004 for a period of six months.
4 Section 425 of the Companies Act 1985.
32 www.berkeleygroup.co.uk
Remuneration Committee report continuedThe tables in the audited section of this Report provide full details of the actual awards released, options vested and theconditional compensation payments and the terms applying to them.
The Berkeley Group plc 2000 Long-Term Incentive Plan No awards were granted under this Plan during the year.
Individuals were granted awards annually, the vesting of which were subject to the attainment of pre-determinedperformance targets measured over a three year period. Awards were structured to deliver a pre-determined cash value anda number of shares, each worth at the outset 50% of the value of the total annual award. The shares element was fixed byreference to the market value of the Company’s shares at the date of grant. The maximum value that could be deliveredunder an award (based on the share price at the date of grant) was 200% of an individual’s annual salary (excludingbonuses and all other benefits) as at the date of grant.
The cash element was payable following the third anniversary of the date of grant of the award provided the performancetargets had been met. The participant was only entitled to the share element following the fourth anniversary from the dateof grant of the award, by which time the outstanding value of the underlying shares had increased or decreased in line withthe Company’s share price performance over the period since the date of grant. Performance under the LTIP was measuredaccording to the level of audited cumulative pre-tax profits of the division or Group company in which the participant wasemployed over the relevant period. Achievement was determined on an “all or nothing” basis over a period of three yearswith no opportunity for re-testing. For awards under the LTIP to vest, the audited net assets of each division or GroupCompany, after taking account of changes in share capital and dividend distributions, must also have increased by at leasta cumulative rate of 10% per annum since the base year.
These performance conditions were selected because it was the Board’s view that profit and asset growth would ensure thedelivery of enhanced value to the Company’s shareholders.
The Berkeley Group plc 2000 Approved & Unapproved Executive Share Option Plans (“the Option Plans”)No grants of options have been made to Executive Directors under the Option Plans during the year.
Two executive option plans were introduced in 2000. Under the option plans individuals were eligible to be granted optionsannually over shares worth up to 100% of annual salary (excluding bonuses and all other benefits). The RemunerationCommittee had the discretion to vary this amount in exceptional circumstances, in which case the limit was 200% ofannual salary (excluding bonuses and all other benefits). Exercise of options granted was conditional upon meetingdefined performance targets based on the increase in earnings per ordinary share over a three year period.
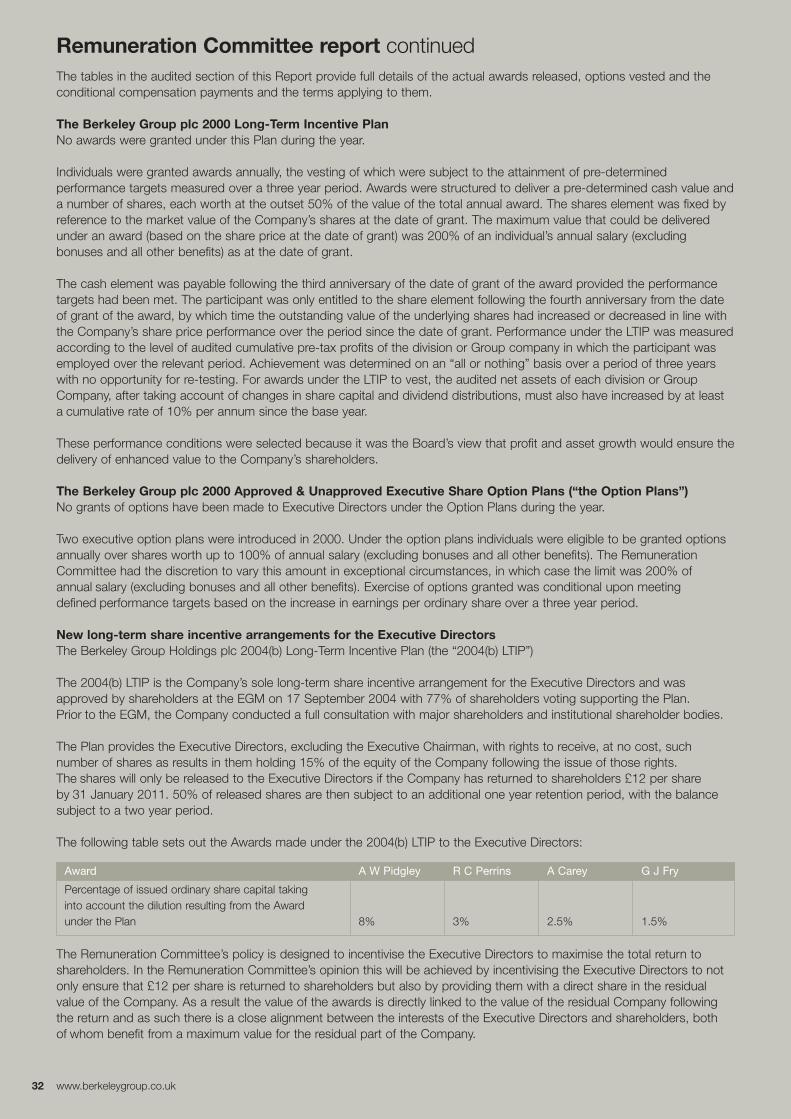
New long-term share incentive arrangements for the Executive DirectorsThe Berkeley Group Holdings plc 2004(b) Long-Term Incentive Plan (the “2004(b) LTIP”)
The 2004(b) LTIP is the Company’s sole long-term share incentive arrangement for the Executive Directors and wasapproved by shareholders at the EGM on 17 September 2004 with 77% of shareholders voting supporting the Plan.Prior to the EGM, the Company conducted a full consultation with major shareholders and institutional shareholder bodies.
The Plan provides the Executive Directors, excluding the Executive Chairman, with rights to receive, at no cost, suchnumber of shares as results in them holding 15% of the equity of the Company following the issue of those rights.The shares will only be released to the Executive Directors if the Company has returned to shareholders £12 per shareby 31 January 2011. 50% of released shares are then subject to an additional one year retention period, with the balancesubject to a two year period.
The following table sets out the Awards made under the 2004(b) LTIP to the Executive Directors:
Award A W Pidgley R C Perrins A Carey G J Fry
Percentage of issued ordinary share capital taking into account the dilution resulting from the Award under the Plan 8% 3% 2.5% 1.5%
The Remuneration Committee’s policy is designed to incentivise the Executive Directors to maximise the total return toshareholders. In the Remuneration Committee’s opinion this will be achieved by incentivising the Executive Directors to notonly ensure that £12 per share is returned to shareholders but also by providing them with a direct share in the residualvalue of the Company. As a result the value of the awards is directly linked to the value of the residual Company followingthe return and as such there is a close alignment between the interests of the Executive Directors and shareholders, bothof whom benefit from a maximum value for the residual part of the Company.
www.berkeleygroup.co.uk 33
The Remuneration Committee will determine whether the performance condition has been satisfied by ensuring theredemption payments have been made in the allotted time frame.
DilutionExcluding The Berkeley Group Holdings plc 2004(b) LTIP the Company has operated its executive and all employeearrangements within the ABI dilution limits. The 2004(b) LTIP will provide the long-term share incentive for ExecutiveDirectors during its life. The Board has currently determined that no new equity based arrangements which will be satisfiedby the issue of shares or the transfer of treasury shares will be introduced to replace the closed share arrangements setout above.
Pension Policy: Lower quartile to medianThe Executive Directors are all members of one or more of the following pensions schemes in operation within the Group,namely The Berkeley Group Staff Benefits Plan, The Berkeley Homes Executive Pension Plan and The St George PLCRetirement and Death Benefits Scheme. No element of remuneration other than basic salary is pensionable.
Three Directors have benefits accruing to them under a defined contribution scheme and three have benefits accruingto them under a defined benefits scheme. Non-Executive Directors are not eligible to participate in these schemes.
Details of pension costs for Executive Directors are set out, in the audited section of the report on page 36.
Benefits in kindPolicy: Market practiceIn line with market practice, the Company’s policy is to provide Executive Directors with the following additional benefits:
• a fully expensed company car; and• medical insurance.
Other remuneration matters
All employee share schemesThe Company’s current all employee share schemes were closed to new awards on the Court approval of the reconstructionof the Company on 30 October 2004. Traditional all employee plans such as Share Incentive Plans and SAYE Schemescannot be operated by the Company after the reconstruction as its Units do not qualify under the relevant legislation.
Therefore, the Company is intending to operate an all employee long-term cash based bonus plan called The BerkeleyGroup Holdings plc 2005 Share Appreciation Rights Plan. This Plan provides all employees of the Company (excludingExecutive Directors) with the opportunity of being granted rights on an annual basis to receive Share Appreciation Rightswhich will normally vest three years after the date of grant and subject to continued employment. Share Appreciation Rightswill consist of a number of ‘phantom Units’ with an exercise price set at the market price of a unit on the date of grant.On the exercise of Share Appreciation Rights an employee will be entitled to receive a cash payment equivalent to thedifference between the adjusted market price of a Unit (adding back redemption payments made since the date of grant)less the exercise price multiplied by the number of phantom Units being exercised.
Non-Executive Directors’ feesPolicy: Upper decile feesAll Non-Executive Directors have specific terms of engagement and their remuneration is determined by the Board withinthe limits set by the articles of association. The 2005 fee levels are based on a specific survey of the fees paid to Non-Executive Directors in the comparator group by Halliwell Consulting. The basic fee paid to each Non-Executive Director inthe year was £36,400 per annum and £45,500 for the Senior Independent Director. Further fees are payable for additionalwork performed in respect of the Chairmanship of the Remuneration and Audit Remuneration Committees (£5,000 p.a.).Non-Executive Directors cannot participate in any of the Company’s share incentive schemes or performance based plansand are not eligible to join the Company’s pension scheme.
An additional £60,000 of fees was paid to Mrs Mitchell in shares during the year ending 30 April 2005. This payment wasmade because the Board of Berkeley believed that it was appropriate to pay Mrs Mitchell this additional remuneration torecognise the very significant time she spent during 2004 discharging her duties as Chairman of the RemunerationCommittee. This was far in excess of that normally associated with the position and required Mrs Mitchell to forego otherworks and consulting opportunities during this period. The Board of Berkeley consulted with major shareholders about thispayment and thought it appropriate to make the payment in shares.
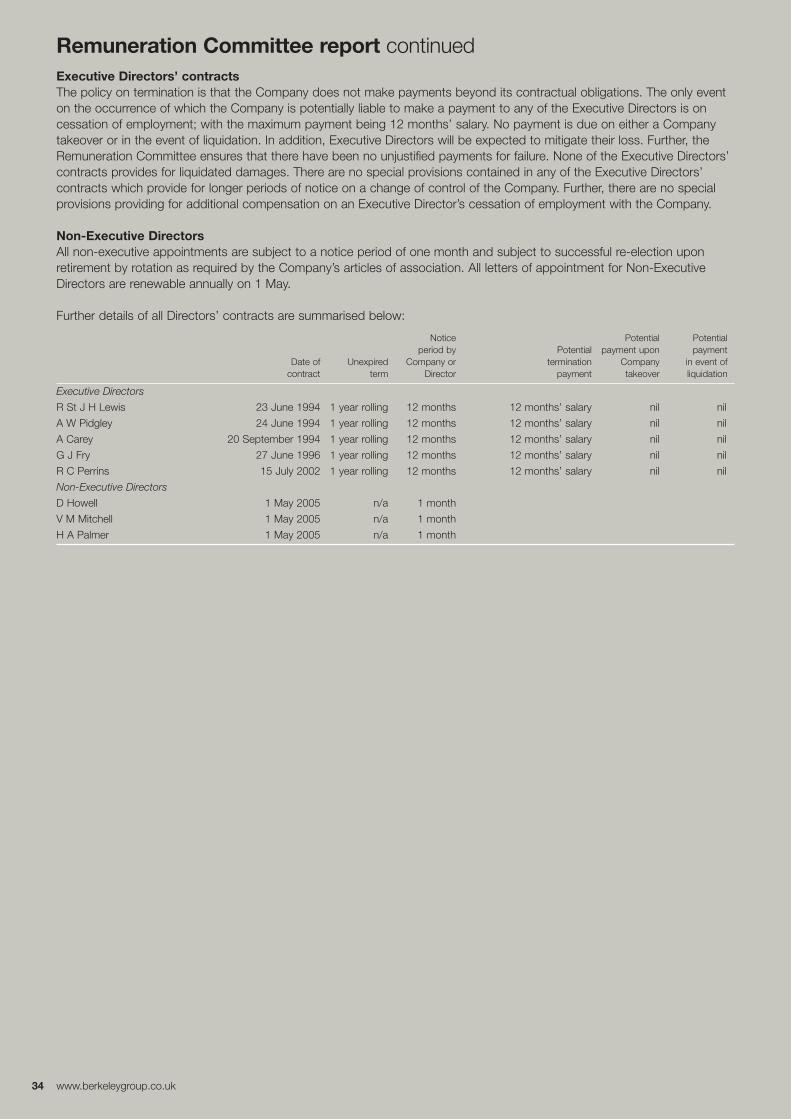
34 www.berkeleygroup.co.uk
Remuneration Committee report continuedExecutive Directors’ contractsThe policy on termination is that the Company does not make payments beyond its contractual obligations. The only eventon the occurrence of which the Company is potentially liable to make a payment to any of the Executive Directors is oncessation of employment; with the maximum payment being 12 months’ salary. No payment is due on either a Companytakeover or in the event of liquidation. In addition, Executive Directors will be expected to mitigate their loss. Further, theRemuneration Committee ensures that there have been no unjustified payments for failure. None of the Executive Directors’contracts provides for liquidated damages. There are no special provisions contained in any of the Executive Directors’contracts which provide for longer periods of notice on a change of control of the Company. Further, there are no specialprovisions providing for additional compensation on an Executive Director’s cessation of employment with the Company.
Non-Executive DirectorsAll non-executive appointments are subject to a notice period of one month and subject to successful re-election uponretirement by rotation as required by the Company’s articles of association. All letters of appointment for Non-ExecutiveDirectors are renewable annually on 1 May.
Further details of all Directors’ contracts are summarised below:
Notice Potential Potentialperiod by Potential payment upon payment
Date of Unexpired Company or termination Company in event ofcontract term Director payment takeover liquidation
Executive Directors
R St J H Lewis 23 June 1994 1 year rolling 12 months 12 months’ salary nil nil
A W Pidgley 24 June 1994 1 year rolling 12 months 12 months’ salary nil nil
A Carey 20 September 1994 1 year rolling 12 months 12 months’ salary nil nil
G J Fry 27 June 1996 1 year rolling 12 months 12 months’ salary nil nil
R C Perrins 15 July 2002 1 year rolling 12 months 12 months’ salary nil nil
Non-Executive Directors
D Howell 1 May 2005 n/a 1 month
V M Mitchell 1 May 2005 n/a 1 month
H A Palmer 1 May 2005 n/a 1 month
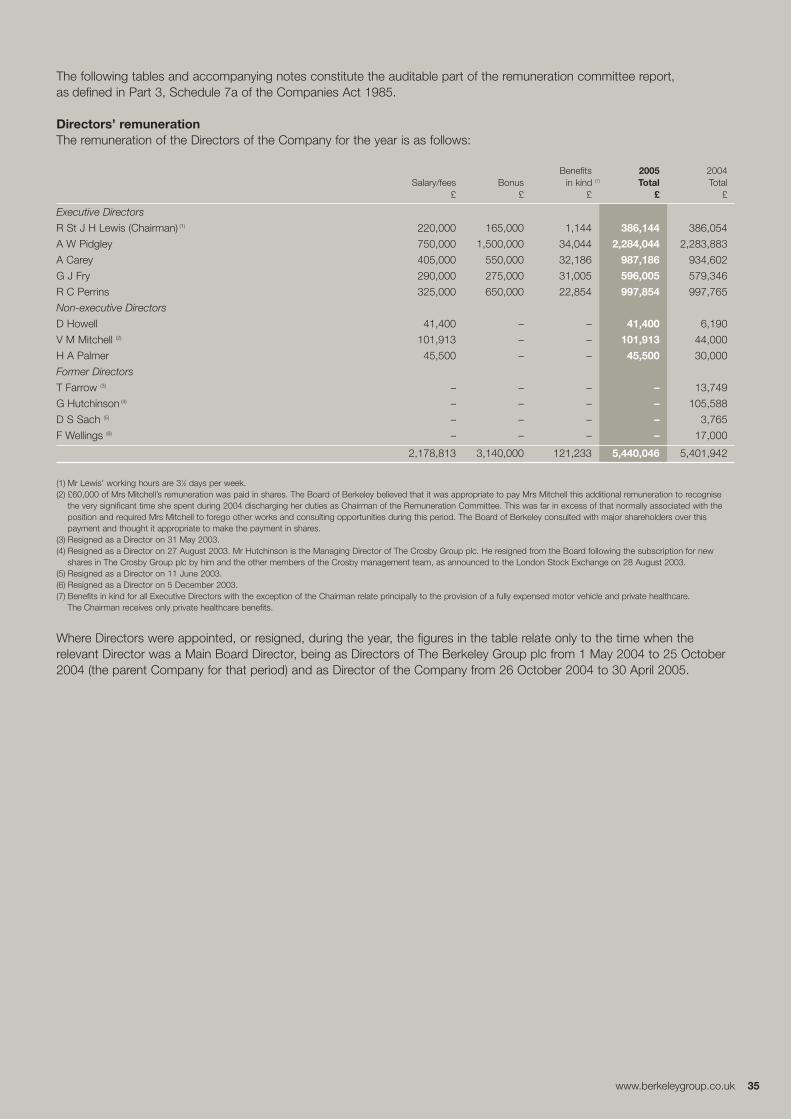
www.berkeleygroup.co.uk 35
The following tables and accompanying notes constitute the auditable part of the remuneration committee report, as defined in Part 3, Schedule 7a of the Companies Act 1985.
Directors’ remunerationThe remuneration of the Directors of the Company for the year is as follows:
Benefits 2005 2004Salary/fees Bonus in kind (7) Total Total
£ £ £ £ £
Executive Directors
R St J H Lewis (Chairman) (1) 220,000 165,000 1,144 386,144 386,054
A W Pidgley 750,000 1,500,000 34,044 2,284,044 2,283,883
A Carey 405,000 550,000 32,186 987,186 934,602
G J Fry 290,000 275,000 31,005 596,005 579,346
R C Perrins 325,000 650,000 22,854 997,854 997,765
Non-executive Directors
D Howell 41,400 – – 41,400 6,190
V M Mitchell (2) 101,913 – – 101,913 44,000
H A Palmer 45,500 – – 45,500 30,000
Former Directors
T Farrow (3) – – – – 13,749
G Hutchinson (4) – – – – 105,588
D S Sach (5) – – – – 3,765
F Wellings (6) – – – – 17,000
2,178,813 3,140,000 121,233 5,440,046 5,401,942
(1) Mr Lewis’ working hours are 31⁄2 days per week.(2) £60,000 of Mrs Mitchell’s remuneration was paid in shares. The Board of Berkeley believed that it was appropriate to pay Mrs Mitchell this additional remuneration to recognise
the very significant time she spent during 2004 discharging her duties as Chairman of the Remuneration Committee. This was far in excess of that normally associated with theposition and required Mrs Mitchell to forego other works and consulting opportunities during this period. The Board of Berkeley consulted with major shareholders over thispayment and thought it appropriate to make the payment in shares.
(3) Resigned as a Director on 31 May 2003.(4) Resigned as a Director on 27 August 2003. Mr Hutchinson is the Managing Director of The Crosby Group plc. He resigned from the Board following the subscription for new
shares in The Crosby Group plc by him and the other members of the Crosby management team, as announced to the London Stock Exchange on 28 August 2003. (5) Resigned as a Director on 11 June 2003. (6) Resigned as a Director on 5 December 2003. (7) Benefits in kind for all Executive Directors with the exception of the Chairman relate principally to the provision of a fully expensed motor vehicle and private healthcare.
The Chairman receives only private healthcare benefits.
Where Directors were appointed, or resigned, during the year, the figures in the table relate only to the time when therelevant Director was a Main Board Director, being as Directors of The Berkeley Group plc from 1 May 2004 to 25 October2004 (the parent Company for that period) and as Director of the Company from 26 October 2004 to 30 April 2005.
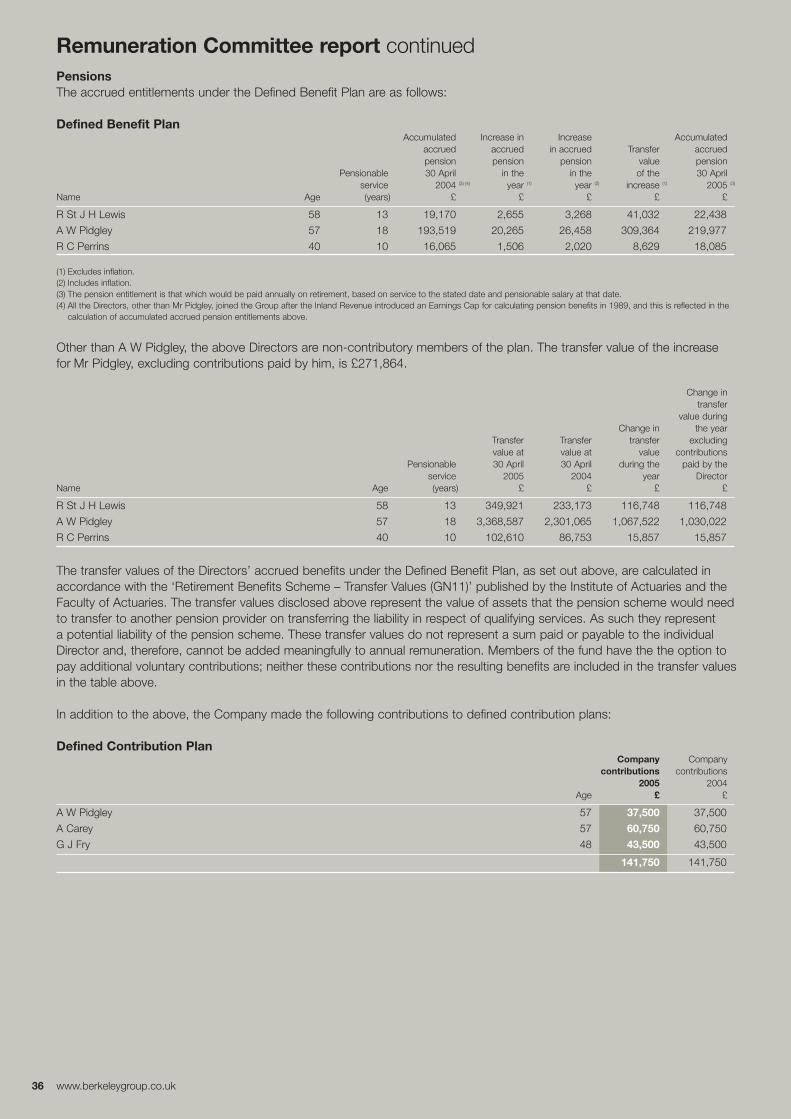
36 www.berkeleygroup.co.uk
Remuneration Committee report continuedPensionsThe accrued entitlements under the Defined Benefit Plan are as follows:
Defined Benefit PlanAccumulated Increase in Increase Accumulated
accrued accrued in accrued Transfer accruedpension pension pension value pension
Pensionable 30 April in the in the of the 30 April service 2004 (3) (4) year (1) year (2) increase (1) 2005 (3)
Name Age (years) £ £ £ £ £
R St J H Lewis 58 13 19,170 2,655 3,268 41,032 22,438
A W Pidgley 57 18 193,519 20,265 26,458 309,364 219,977
R C Perrins 40 10 16,065 1,506 2,020 8,629 18,085
(1) Excludes inflation.(2) Includes inflation.(3) The pension entitlement is that which would be paid annually on retirement, based on service to the stated date and pensionable salary at that date.(4) All the Directors, other than Mr Pidgley, joined the Group after the Inland Revenue introduced an Earnings Cap for calculating pension benefits in 1989, and this is reflected in the
calculation of accumulated accrued pension entitlements above.
Other than A W Pidgley, the above Directors are non-contributory members of the plan. The transfer value of the increasefor Mr Pidgley, excluding contributions paid by him, is £271,864.
Change in transfer
Transfervalue at
Transfer value at
Change in transfer
value
value during the year
excludingcontributions
Name Age
Pensionable service (years)
30 April 2005
£
30 April 2004
£
during the year
£
paid by theDirector
£
R St J H Lewis 58 13 349,921 233,173 116,748 116,748
A W Pidgley 57 18 3,368,587 2,301,065 1,067,522 1,030,022
R C Perrins 40 10 102,610 86,753 15,857 15,857
The transfer values of the Directors’ accrued benefits under the Defined Benefit Plan, as set out above, are calculated inaccordance with the ‘Retirement Benefits Scheme – Transfer Values (GN11)’ published by the Institute of Actuaries and theFaculty of Actuaries. The transfer values disclosed above represent the value of assets that the pension scheme would needto transfer to another pension provider on transferring the liability in respect of qualifying services. As such they representa potential liability of the pension scheme. These transfer values do not represent a sum paid or payable to the individualDirector and, therefore, cannot be added meaningfully to annual remuneration. Members of the fund have the the option topay additional voluntary contributions; neither these contributions nor the resulting benefits are included in the transfer valuesin the table above.
In addition to the above, the Company made the following contributions to defined contribution plans:
Defined Contribution PlanCompany Company
contributions contributions 2005 2004
Age £ £
A W Pidgley 57 37,500 37,500
A Carey 57 60,750 60,750
G J Fry 48 43,500 43,500
141,750 141,750
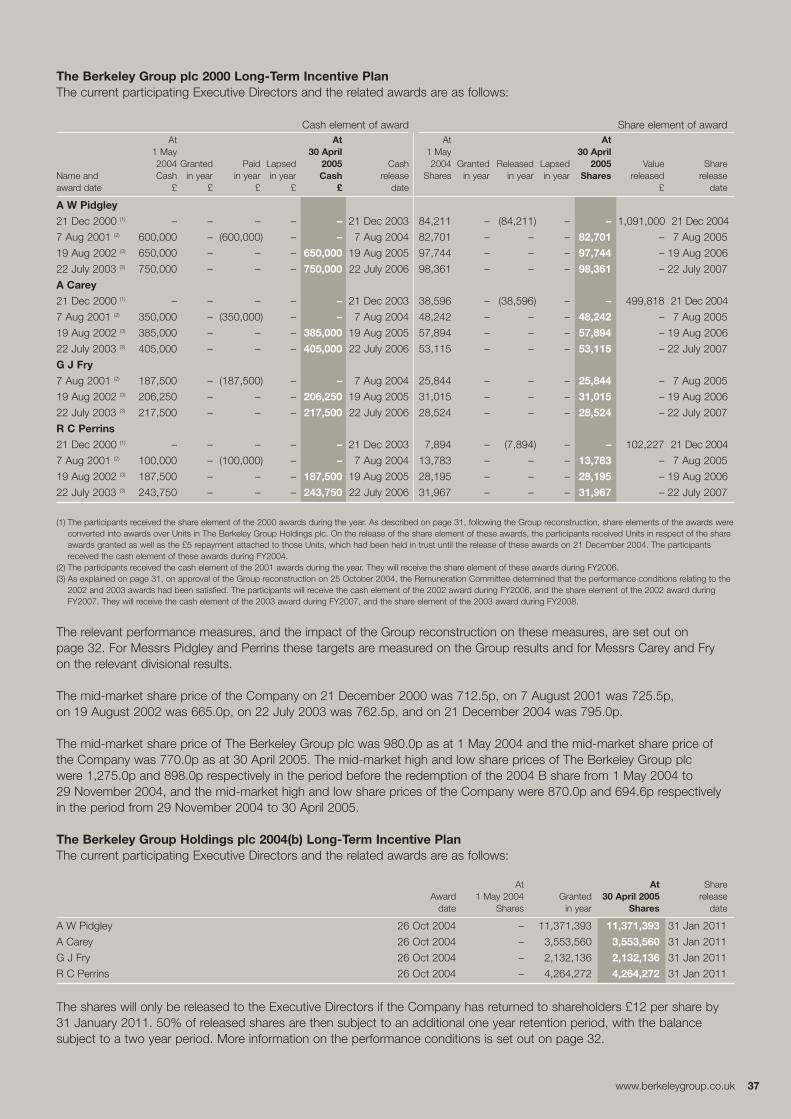
www.berkeleygroup.co.uk 37
The Berkeley Group plc 2000 Long-Term Incentive PlanThe current participating Executive Directors and the related awards are as follows:
Cash element of award Share element of awardAt At At At
1 May 30 April 1 May 30 April2004 Granted Paid Lapsed 2005 Cash 2004 Granted Released Lapsed 2005 Value Share
Name and Cash in year in year in year Cash release Shares in year in year in year Shares released release award date £ £ £ £ £ date £ date
A W Pidgley
21 Dec 2000 (1) – – – – – 21 Dec 2003 84,211 – (84,211) – – 1,091,000 21 Dec 2004
7 Aug 2001 (2) 600,000 – (600,000) – – 7 Aug 2004 82,701 – – – 82,701 – 7 Aug 2005
19 Aug 2002 (3) 650,000 – – – 650,000 19 Aug 2005 97,744 – – – 97,744 – 19 Aug 2006
22 July 2003 (3) 750,000 – – – 750,000 22 July 2006 98,361 – – – 98,361 – 22 July 2007
A Carey
21 Dec 2000 (1) – – – – – 21 Dec 2003 38,596 – (38,596) – – 499,818 21 Dec 2004
7 Aug 2001 (2) 350,000 – (350,000) – – 7 Aug 2004 48,242 – – – 48,242 – 7 Aug 2005
19 Aug 2002 (3) 385,000 – – – 385,000 19 Aug 2005 57,894 – – – 57,894 – 19 Aug 2006
22 July 2003 (3) 405,000 – – – 405,000 22 July 2006 53,115 – – – 53,115 – 22 July 2007
G J Fry
7 Aug 2001 (2) 187,500 – (187,500) – – 7 Aug 2004 25,844 – – – 25,844 – 7 Aug 2005
19 Aug 2002 (3) 206,250 – – – 206,250 19 Aug 2005 31,015 – – – 31,015 – 19 Aug 2006
22 July 2003 (3) 217,500 – – – 217,500 22 July 2006 28,524 – – – 28,524 – 22 July 2007
R C Perrins
21 Dec 2000 (1) – – – – – 21 Dec 2003 7,894 – (7,894) – – 102,227 21 Dec 2004
7 Aug 2001 (2) 100,000 – (100,000) – – 7 Aug 2004 13,783 – – – 13,783 – 7 Aug 2005
19 Aug 2002 (3) 187,500 – – – 187,500 19 Aug 2005 28,195 – – – 28,195 – 19 Aug 2006
22 July 2003 (3) 243,750 – – – 243,750 22 July 2006 31,967 – – – 31,967 – 22 July 2007
(1) The participants received the share element of the 2000 awards during the year. As described on page 31, following the Group reconstruction, share elements of the awards wereconverted into awards over Units in The Berkeley Group Holdings plc. On the release of the share element of these awards, the participants received Units in respect of the shareawards granted as well as the £5 repayment attached to those Units, which had been held in trust until the release of these awards on 21 December 2004. The participantsreceived the cash element of these awards during FY2004.
(2) The participants received the cash element of the 2001 awards during the year. They will receive the share element of these awards during FY2006.(3) As explained on page 31, on approval of the Group reconstruction on 25 October 2004, the Remuneration Committee determined that the performance conditions relating to the
2002 and 2003 awards had been satisfied. The participants will receive the cash element of the 2002 award during FY2006, and the share element of the 2002 award duringFY2007. They will receive the cash element of the 2003 award during FY2007, and the share element of the 2003 award during FY2008.
The relevant performance measures, and the impact of the Group reconstruction on these measures, are set out onpage 32. For Messrs Pidgley and Perrins these targets are measured on the Group results and for Messrs Carey and Fryon the relevant divisional results.
The mid-market share price of the Company on 21 December 2000 was 712.5p, on 7 August 2001 was 725.5p,on 19 August 2002 was 665.0p, on 22 July 2003 was 762.5p, and on 21 December 2004 was 795.0p.
The mid-market share price of The Berkeley Group plc was 980.0p as at 1 May 2004 and the mid-market share price ofthe Company was 770.0p as at 30 April 2005. The mid-market high and low share prices of The Berkeley Group plcwere 1,275.0p and 898.0p respectively in the period before the redemption of the 2004 B share from 1 May 2004 to29 November 2004, and the mid-market high and low share prices of the Company were 870.0p and 694.6p respectivelyin the period from 29 November 2004 to 30 April 2005.
The Berkeley Group Holdings plc 2004(b) Long-Term Incentive PlanThe current participating Executive Directors and the related awards are as follows:
At At Share Award 1 May 2004 Granted 30 April 2005 release
date Shares in year Shares date
A W Pidgley 26 Oct 2004 – 11,371,393 11,371,393 31 Jan 2011
A Carey 26 Oct 2004 – 3,553,560 3,553,560 31 Jan 2011
G J Fry 26 Oct 2004 – 2,132,136 2,132,136 31 Jan 2011
R C Perrins 26 Oct 2004 – 4,264,272 4,264,272 31 Jan 2011
The shares will only be released to the Executive Directors if the Company has returned to shareholders £12 per share by31 January 2011. 50% of released shares are then subject to an additional one year retention period, with the balancesubject to a two year period. More information on the performance conditions is set out on page 32.
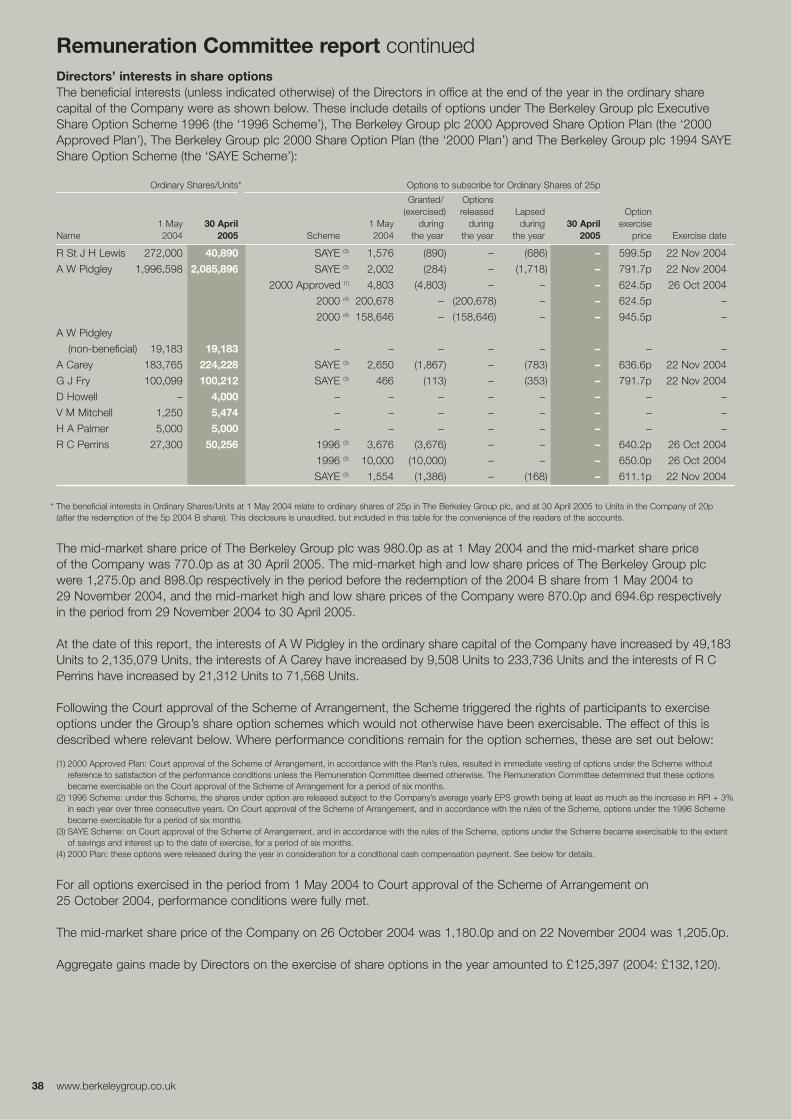
Remuneration Committee report continuedDirectors’ interests in share optionsThe beneficial interests (unless indicated otherwise) of the Directors in office at the end of the year in the ordinary sharecapital of the Company were as shown below. These include details of options under The Berkeley Group plc ExecutiveShare Option Scheme 1996 (the ‘1996 Scheme’), The Berkeley Group plc 2000 Approved Share Option Plan (the ‘2000Approved Plan’), The Berkeley Group plc 2000 Share Option Plan (the ‘2000 Plan’) and The Berkeley Group plc 1994 SAYEShare Option Scheme (the ‘SAYE Scheme’):
Ordinary Shares/Units* Options to subscribe for Ordinary Shares of 25p
Granted/ Options (exercised) released Lapsed Option
1 May 30 April 1 May during during during 30 April exerciseName 2004 2005 Scheme 2004 the year the year the year 2005 price Exercise date
R St J H Lewis 272,000 40,890 SAYE (3) 1,576 (890) – (686) – 599.5p 22 Nov 2004
A W Pidgley 1,996,598 2,085,896 SAYE (3) 2,002 (284) – (1,718) – 791.7p 22 Nov 2004
2000 Approved (1) 4,803 (4,803) – – – 624.5p 26 Oct 2004
2000 (4) 200,678 – (200,678) – – 624.5p –
2000 (4) 158,646 – (158,646) – – 945.5p –
A W Pidgley
(non-beneficial) 19,183 19,183 – – – – – – – –
A Carey 183,765 224,228 SAYE (3) 2,650 (1,867) – (783) – 636.6p 22 Nov 2004
G J Fry 100,099 100,212 SAYE (3) 466 (113) – (353) – 791.7p 22 Nov 2004
D Howell – 4,000 – – – – – – – –
V M Mitchell 1,250 5,474 – – – – – – – –
H A Palmer 5,000 5,000 – – – – – – – –
R C Perrins 27,300 50,256 1996 (2) 3,676 (3,676) – – – 640.2p 26 Oct 2004
1996 (2) 10,000 (10,000) – – – 650.0p 26 Oct 2004
SAYE (3) 1,554 (1,386) – (168) – 611.1p 22 Nov 2004
* The beneficial interests in Ordinary Shares/Units at 1 May 2004 relate to ordinary shares of 25p in The Berkeley Group plc, and at 30 April 2005 to Units in the Company of 20p(after the redemption of the 5p 2004 B share). This disclosure is unaudited, but included in this table for the convenience of the readers of the accounts.
The mid-market share price of The Berkeley Group plc was 980.0p as at 1 May 2004 and the mid-market share priceof the Company was 770.0p as at 30 April 2005. The mid-market high and low share prices of The Berkeley Group plcwere 1,275.0p and 898.0p respectively in the period before the redemption of the 2004 B share from 1 May 2004 to29 November 2004, and the mid-market high and low share prices of the Company were 870.0p and 694.6p respectivelyin the period from 29 November 2004 to 30 April 2005.
At the date of this report, the interests of A W Pidgley in the ordinary share capital of the Company have increased by 49,183Units to 2,135,079 Units, the interests of A Carey have increased by 9,508 Units to 233,736 Units and the interests of R CPerrins have increased by 21,312 Units to 71,568 Units.
Following the Court approval of the Scheme of Arrangement, the Scheme triggered the rights of participants to exerciseoptions under the Group’s share option schemes which would not otherwise have been exercisable. The effect of this isdescribed where relevant below. Where performance conditions remain for the option schemes, these are set out below:
(1) 2000 Approved Plan: Court approval of the Scheme of Arrangement, in accordance with the Plan’s rules, resulted in immediate vesting of options under the Scheme withoutreference to satisfaction of the performance conditions unless the Remuneration Committee deemed otherwise. The Remuneration Committee determined that these optionsbecame exercisable on the Court approval of the Scheme of Arrangement for a period of six months.
(2) 1996 Scheme: under this Scheme, the shares under option are released subject to the Company’s average yearly EPS growth being at least as much as the increase in RPI + 3%in each year over three consecutive years. On Court approval of the Scheme of Arrangement, and in accordance with the rules of the Scheme, options under the 1996 Schemebecame exercisable for a period of six months.
(3) SAYE Scheme: on Court approval of the Scheme of Arrangement, and in accordance with the rules of the Scheme, options under the Scheme became exercisable to the extentof savings and interest up to the date of exercise, for a period of six months.
(4) 2000 Plan: these options were released during the year in consideration for a conditional cash compensation payment. See below for details.
For all options exercised in the period from 1 May 2004 to Court approval of the Scheme of Arrangement on 25 October 2004, performance conditions were fully met.
The mid-market share price of the Company on 26 October 2004 was 1,180.0p and on 22 November 2004 was 1,205.0p.
Aggregate gains made by Directors on the exercise of share options in the year amounted to £125,397 (2004: £132,120).
38 www.berkeleygroup.co.uk
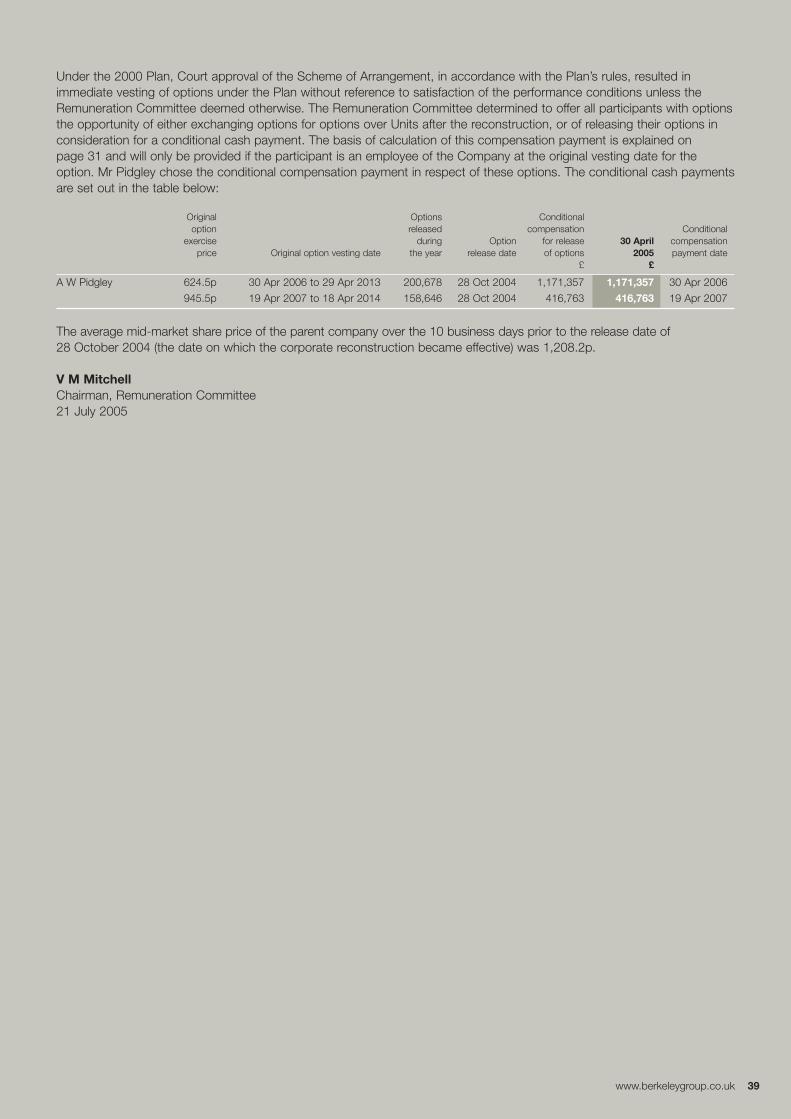
Under the 2000 Plan, Court approval of the Scheme of Arrangement, in accordance with the Plan’s rules, resulted inimmediate vesting of options under the Plan without reference to satisfaction of the performance conditions unless theRemuneration Committee deemed otherwise. The Remuneration Committee determined to offer all participants with optionsthe opportunity of either exchanging options for options over Units after the reconstruction, or of releasing their options inconsideration for a conditional cash payment. The basis of calculation of this compensation payment is explained onpage 31 and will only be provided if the participant is an employee of the Company at the original vesting date for theoption. Mr Pidgley chose the conditional compensation payment in respect of these options. The conditional cash paymentsare set out in the table below:
Original Options Conditional option released compensation Conditional
exercise during Option for release 30 April compensation price Original option vesting date the year release date of options 2005 payment date
£ £
A W Pidgley 624.5p 30 Apr 2006 to 29 Apr 2013 200,678 28 Oct 2004 1,171,357 1,171,357 30 Apr 2006
945.5p 19 Apr 2007 to 18 Apr 2014 158,646 28 Oct 2004 416,763 416,763 19 Apr 2007
The average mid-market share price of the parent company over the 10 business days prior to the release date of28 October 2004 (the date on which the corporate reconstruction became effective) was 1,208.2p.
V M MitchellChairman, Remuneration Committee21 July 2005
www.berkeleygroup.co.uk 39
40 www.berkeleygroup.co.uk
Corporate GovernanceThe Company is committed to attaining high standards of Corporate Governance in accordance with the principles of theCombined Code on Corporate Governance (“the Combined Code”), published in July 2003, and for which the Board isaccountable to shareholders. This report, together with the Directors’ Remuneration Report, where applicable, describeshow the Board has applied the main and supporting principles of the Combined Code.
As set out in the Directors’ Report, effective 26 October 2004 the Company acquired 100% of the issued share capital ofThe Berkeley Group plc following implementation of a Scheme of Arrangement under Section 425 of the Companies Act1985. In this Corporate Governance Report, references to the “Company” refer to The Berkeley Group Holdings plc from26 October 2004 onwards and prior to that to The Berkeley Group plc, and references to the “Board” refer to the Directors,being directors of those companies respectively.
Statement of ComplianceThe Board considers that it complied throughout the year with the provisions of Section 1 of the Combined Code exceptthat at least half the Board, excluding the Chairman, does not comprise independent non-executive Directors (Provision A3.2).
The Role of the BoardThe Board has adopted a formal schedule of matters reserved for the Board as a whole. The key task of the Board is toformulate strategy and to monitor the operating and financial performance of the Group in pursuit of the Group’s strategiclong-term objectives. In particular these include the annual budget, share capital changes, approval of interim and annualresults, treasury policy, dividend policy, shareholder distributions, Corporate Governance matters and the maintenance andreview of the Group’s system of internal control.
Formal Board meetings were held five times during the year under review. There were no absences from any Boardmeetings by any Director except that Messrs Greg Fry and David Howell were unable to attend the June 2004 Boardmeeting and Mrs Victoria Mitchell was unable to attend the April 2005 Board meeting. In addition the Board scheduledadditional meetings in relation to certain corporate projects including the strategic review of the business and the CourtApproved Scheme of Arrangement.
In addition to the formal meetings of the whole Board, the Non-executive directors meet with the Group Chairman in themonths not covered by a Board meeting. The Group Managing Director and Group Finance Director are invited to attendthese meetings in part, to provide an update on the business activities of the Group. The Non-executive Directors meet atleast annually without the Group Chairman present, chaired by the Senior Independent Director, Mr Tony Palmer.
From January 2005, formal meetings of the whole Board have been increased to six per annum scheduled on a bi-monthlybasis with bi-monthly meetings of the Non-Executive Directors in the months that the Board does not meet.
Board papers and agendas are sent out a week prior to each meeting, thus allowing sufficient time for detailed review andconsideration of the documents beforehand. In addition, the Board is supplied with comprehensive management informationon a regular basis, including on a monthly basis, a detailed Group management accounts pack that reports the actual andforecast financial performance in addition to other key performance indicators across the Group.
The Company has in place an appropriate policy which insures Directors against certain liabilities, including legal costs,which they may incur in carrying out their duties.
The Board and DirectorsThe Board has remained unchanged during the year and comprises eight directors including the Group Chairman, fourfurther Executive Directors and three Non-executive Directors. The Board considers that all the Non-executive Directors(Messrs. Tony Palmer and David Howell and Mrs Victoria Mitchell) have skills and experience complementary to theExecutive Directors and offer independent judgement when required and remain independent. Brief biographies appear onpages 20 to 21. The Group Chairman and the Executive Directors do not hold any Non-executive Director appointments orcommitments required to be disclosed under the Combined Code.
The roles of Group Chairman and Group Managing Director are separately held and there are clear written guidelines tosupport the division of responsibility between them. The Group Chairman is responsible for the effective conduct of Boardand shareholder meetings and for ensuring that each Director contributes to effective decision-making. The GroupManaging Director has day-to-day executive responsibility for the running of the Group’s businesses. His role is to developand deliver the strategy to enable the Group to meet it objectives.
www.berkeleygroup.co.uk 41
Mr Tony Palmer was appointed to the Board on 1 January 1998, on his retirement as Chief Executive of Taylor Woodrowplc, and was appointed Senior Independent Director on 5 December 2003. Mr Tony Palmer has a wealth of experience andan in depth understanding of the housebuilding and construction sectors. The unanimous view of the Board is that heremains independent. Mrs Victoria Mitchell and Mr David Howell were appointed to the Board as Non-executive Directorson 1 May 2002 and 24 February 2004 respectively and it is the unanimous view of the Board that they also areindependent.
An induction programme is provided for new Directors, which includes the provision of a comprehensive set of backgroundinformation on the Group, one to one meetings with all Directors and key staff as well as visits to major sites. In addition tothe induction programme for new Directors, additional ongoing training has been identified as part of the Board Evaluationprocess, which is tailored to each Director. All Directors have access to advice from the Company Secretary and independentprofessional advisers, at the Company’s expense, where specific expertise is required in the course of their duties. Arrangementsare also made for the Non-executive Directors to attend site visits and to meet with the Managing Directors of the operatingcompanies independent of the Executive Directors.
No Executive Director has a service contract with a notice period in excess of one year or with provisions for pre-determined compensation on termination. New terms of appointment for the Non-executive Directors in line with the Higgsrecommended practice were introduced in 2004, renewable annually with one month’s written notice and are subject to there-election provisions of the Articles of Association. The Non-executive Directors do not participate in any of the Company’sshare incentive or bonus plans. A minimum shareholding requirement is set for all Directors.
New Articles of Association of the Company were adopted at the 2004 AGM to take account of recent regulatory and otherchanges, including the requirement for Directors to submit themselves to shareholders for re-election every three years, inaccordance with the Combined Code. All Directors are subject to re-election by shareholders at the first opportunity of theirappointment and thereafter at intervals of no more than three years.
Since this is the first Annual General Meeting of The Berkeley Group Holdings plc, all Directors are seeking re-election atthe 2005 Annual General Meeting. Each Executive Directors has a notice period not exceeding 12 months, and each Non-executive Director has a letter of appointment renewable on 1 May each year, subject to one month’s notice.
At the date of this report, less than half of the Board comprised independent Non-executive Directors. The Board considersthat the skill base, experience and judgement of its Non-executive Directors are more important than the actual numbers onthe Board and that the stability of the Board during the year was vital to the success of the strategic review of the businessthat culminated in the Scheme of Arrangement. Since the approval of the Scheme of Arrangement the Board has identifieda suitable candidate and intends to appoint a further Non-executive Director by the 2005 Annual General Meeting.
Directors’ remunerationThe principles and details of Directors’ remuneration are contained in the Remuneration Committee Report on pages 25 to 39.
Board evaluationA review of the operation of the Board, its Committees and the skills of the Directors was undertaken during the year. Theprocess was led by the Group Chairman and Senior Independent Director with the assistance of the Company Secretaryand an external consultant. All Directors completed the wide-ranging appraisal questionnaire and the results were reviewedby the Board in April 2005. The Non-Executive Directors led by the Senior Independent Director conducted an evaluation ofthe Chairman. The process concluded that the stability of the Board has been the key to the Board’s unified success indeveloping the substantial strategic changes in the year. The Board Evaluation process has also led the Directors to identifythe skill base required by the appointment of an additional Non-Executive Director. Led by the Chairman, attention will begiven to any further matters arising from the evaluation process during the forthcoming year.
Board CommitteesThe Board has delegated certain matters to individual executives and to specific Committees of the Board. The responsibilitiesof the key Board Committees are described below.
Executive CommitteeThe Executive Committee meets monthly and reviews the financial and operating performance of all Group divisionsand companies. The Group Managing Director chairs this Committee and other members comprise the Group Chairman,Mr Roger Lewis and Messrs. Tony Carey, Greg Fry and Rob Perrins.
The following three Board Committees operate within clearly defined terms of reference that were refreshed in 2004pursuant to the provisions of the Combined Code. The Terms of Reference were added to the pages of the Company’swebsite www.berkeleygroup.co.uk in February 2005 and can be downloaded from the section dealing with InvestorRelations. Copies are also available to shareholders on application to the Company Secretary.
42 www.berkeleygroup.co.uk
Corporate Governance continuedAudit CommitteeThe Audit Committee is chaired by Mr David Howell, FCA, and comprises the three independent Non-executive Directors.The Committee met on three occasions during the year with no absences except that Mr Tony Palmer was unable to attendthe June 2004 and March 2005 meetings.
The Chairman, Group Finance Director and representatives of the external and internal auditors attend the Committee’smeetings by invitation.
Mr David Howell, who qualified as a chartered accountant in 1971 and was the Chief Financial Officer and a Main BoardDirector of lastminute.com plc until March 2005 is considered by the Board to have recent and relevant financial experience.Mr David Howell was also Chairman of the Audit Committee of Nestor Healthcare Group plc from 2000 to 2003.
The Committee has formal Terms of Reference which set out its role and the authority delegated to it by the Board.
The Audit Committee plays an important role in Corporate Governance by undertaking the following key responsibilities:• Monitoring the integrity of the financial reporting of the Company, including its annual and interim reports and other formal
announcements relating to financial performance;• Reviewing the adequacy and effectiveness of the Group’s internal control and risk management systems and disclosure of
statements concerning these in the Annual Report;• Monitoring the effectiveness of the Group’s internal audit function, reviewing the scope of the Group’s internal audit
programme and considering the findings and recommendations of the reports produced from this programme;• Overseeing the relationship with the external auditor, including appointment, removal and fees, and ensuring the auditor’s
independence and the effectiveness of the audit process.
In addition, the Committee reviewed and approved the Group’s approach to implementing International FinancialReporting Standards.
The Committee has a policy on the use of the auditors for non-audit services in order to safeguard auditor independence,with a pre-determined limit above which approval of the Audit Committee is required and identifies certain areas of workfrom which the auditors are precluded. Tax and due diligence services are provided by a small number of different firms,including the Group’s auditors. The auditors may be used for such services where their knowledge of the business is suchthat they are deemed the most appropriate supplier. Notwithstanding these safeguards, all non-audit work carried out bythe auditors is notified to the Audit Committee Chairman on an ongoing basis and formally reported to the Audit Committeeat each meeting.
The auditors have open recourse to the Non-executive Directors, should they consider it necessary and there is opendialogue between the auditors and the Chairman of the Audit Committee before each Audit Committee meeting.
Remuneration Committee The Remuneration Committee is responsible for determining the Company’s policy for executive remuneration and the preciseterms of employment and remuneration of the Executive Directors. The Remuneration Report is set out on pages 25 to 39.
The Committee is chaired by Mrs Victoria Mitchell and comprises the Non-executive Directors, these being Messrs TonyPalmer and David Howell. The Committee meets at least twice a year. The Committee takes into consideration therecommendations of the Group Chairman, Group Managing Director and Group Finance Director regarding theremuneration of their executive colleagues. During the year, the Committee met formally on three occasions and therewere no absences except that Mr Tony Palmer was unable to attend the March 2005 meeting due to a family bereavement.In addition approximately 34 meetings were held by the Chairman of the Remuneration Committee and the Committee’sadvisers with the other members of the Board and the Company’s shareholders and stakeholders, regarding the newScheme of Arrangement and the introduction of the new 2004(b) Long-Term Incentive Plan.
No Director is involved in deciding his or her remuneration. The Executive Directors decide the remuneration of the Non-executive Directors.
Nomination CommitteeThe Nomination Committee was primarily established to propose new appointments to the Board. It is also responsible forsuccession planning. The Committee is chaired by the Group Chairman, Mr Roger Lewis (save in the event of discussionsrelating to his own succession) with Mr Tony Palmer and Mrs Victoria Mitchell as Independent Non-executive members.The Committee meets at least two times per annum and at such times as required to carry our the duties of the Committee.During the year, the Committee met formally on two occasions and there were no absences. The Board Evaluation processprovided a platform for identifying the experience requirements for a new Non-executive Director. Independent recruitmentspecialists were also appointed to assist the Committee in the search criteria and the selection process.
www.berkeleygroup.co.uk 43
Key risks and internal controlThe Board has overall responsibility for the Company’s system of internal control, which is designed to provide reasonablebut not absolute assurance against misstatement or loss. The Directors have reviewed the operation and effectiveness ofthis system of internal control during the year as part of its year end procedures.
The Group has the following established framework of internal controls:
Clear organisational structure The Group operates through autonomous divisions and operating companies, eachwith its own board. Operating company boards meet on a weekly basis and divisional boards on a monthly basis, andcomprehensive information is prepared for such meetings on a standardised basis to cover all aspects of the business.Formal reporting lines and delegated levels of authority exist within this structure and review of risk and performanceoccurs at multiple levels throughout both the operating companies and divisions, and the Group.
Risk assessment Risk reporting is embedded within the ongoing management reporting throughout the Group. At operatingcompany and divisional level, board meeting agendas and packs are structured around the key risks facing the Group.These include sales/demand risk, production risk (build cost and programme), land and planning risk as well as a reviewof specific site risks. In addition, there is a formalised process whereby each division produces quarterly risk and controlreports that identify significant risks, the potential impact and the actions being taken to mitigate the risks. These riskreports are reviewed and updated regularly and reviewed quarterly by the Board.
Financial reporting A comprehensive budgeting and real-time forecasting system, covering both profit and cash,operates within the Group. This enables executive management to view key financial and operating data on a daily basis.On a weekly and monthly basis more formal reporting up to the Group executive and Board is prepared. The results of alloperating units are reported monthly and compared to budget and forecast.
Policies and procedures Policies and procedures, including operating and financial controls, are detailed in policies andprocedures manuals that are refreshed and improved as appropriate. Training to staff is given where necessary.
Central functions Where appropriate strong central functions, such as Group Legal, Group Health & Safety andCompany Secretarial, provide support and consistency to the rest of the group. In addition, the principal treasury-relatedrisks, decisions and control processes are managed by the Group Finance function, under the direction of the GroupFinance Director.
Investment and contracting controls The Group has clearly defined guidelines for the purchase and sale of land withinthe Group, which include detailed environmental, planning and financial appraisal and are subject to executive authorisation.Rigorous procedures are also followed for the selection of consultants and contractors. The review and monitoring of allbuild programmes and budgets are a fundamental element of the Company’s financial reporting cycle.
Internal audit Internal auditors are in place in each division and at group to provide assurance on the operation of theGroup’s control framework.
WhistleblowingWhistleblowing procedures are not formalised and follow the Group’s formal grievance procedures. These initially arethrough line management and up to managing director. Staff also have direct access to the Group Legal Department.
Formalising the procedure has been debated by the Board, which concluded that the current arrangements are appropriatein the context of the structure and culture of the Group.
Relations with shareholdersThe Company encourages active dialogue with its current and prospective shareholders through ongoing meetings betweeninstitutional investors. Major shareholders have the opportunity to meet all Directors after the Annual General Meeting inaddition to individual meetings with shareholders. Also, in the year under review, the Company engaged in detailedconsultation with the Company’s shareholders and stakeholders over its proposed Scheme of Arrangement andRemuneration Policy, including approximately 34 meetings held by the Chairman of the Remuneration Committee and theCommittee’s advisers. The Scheme of Arrangement was approved by shareholders at an Extraordinary General Meeting ofthe Company in September 2004 by 93.4% of the votes cast.
Shareholders are also kept up to date with the Company’s activities through the Annual and Interim Reports. In addition,the corporate website gives information on the Group and latest news, including regulatory announcements. Thepresentations made after the announcement of the preliminary and interim results are also available on the website.
44 www.berkeleygroup.co.uk
Corporate Governance continuedThe Board is kept informed of the view of the shareholders through periodic reports from the Company’s broker UBS.Additionally, the Non-executive Directors have the opportunity to attend the bi-annual analyst presentations.
The Senior Independent Director is available to shareholders if they have concerns where contact through the normalchannels has failed or when such contact is inappropriate.
Annual General MeetingAll shareholders are invited to participate in the Annual General meeting where the Group Chairman, the Group ManagingDirector and the chairmen of the Audit, Remuneration and Nomination Committees will be available to answer questionsand also available for discussions with shareholders both prior to and after the meeting.
The Company arranges for the Annual Report and Accounts and related papers to be posted to shareholders so as to allowat least 20 working days for consideration prior to the Annual General Meeting.
The Company complies with the provisions of the Combined Code relating to the disclosure of proxy votes, which, includingabstentions, are declared at the Annual General Meeting after each resolution has been dealt with on a show of hands and areannounced to the Stock Exchange shortly after the close of the meeting. The Company also complies with the requirements ofthe Combined Code with the separation of resolutions and the attendance of the Chairmen of the Board Committees.
The terms and conditions of appointment for the Non-executive Directors, which set out their expected time commitment,in addition to the service contracts for the Executive Directors, are available for inspection at the Annual General Meetingand during normal business hours.
Following publication of Paul Myner’s report on the findings and recommendations of the Shareholder Voting Working Groupin February 2004, the Company proposed amendments to its Articles to provide the Company with the power to provideelectronic voting facilities for shareholders who hold their shares through Crest, which having been approved at the 2004Annual General Meeting, will enable the Company to provide Crest voting facilities for the 2005 Annual General Meeting.
Going concernAfter making proper enquiries, the Directors have a reasonable expectation that the Company and the Group haveadequate resources to continue in operational existence for the foreseeable future. For this reason, they continue to adoptthe going concern basis in preparing the financial statements.
Statements of Directors’ responsibilitiesCompany law requires the Directors to prepare financial statements for each financial year, which give a true and fair view ofthe state of affairs of the Company and of the Group at the end of the financial year and of the profit or loss of the Group forthat period.
In preparing those financial statements, the Directors are required to:• Select suitable accounting policies and then apply them consistently;• Make judgements and estimates that are reasonable and prudent;• State whether applicable accounting standards have been followed, subject to any material departures disclosed and
explained in the financial statements;• Prepare the financial statements on a going concern basis unless it is inappropriate to presume that the Company and its
subsidiary undertakings will continue in business.
The Directors are responsible for ensuring the Company keeps proper accounting records which disclose, with reasonableaccuracy at any time, the financial position of the Company and Group and which enable them to ensure that the financialstatements comply with the Companies Act 1985. They are also responsible for safeguarding the assets of the Group andhence for taking reasonable steps for the prevention and detection of fraud and other irregularities.
The maintenance and integrity of The Berkeley Group Holdings plc website is the responsibility of the Company; the workcarried out by the auditors does not involve consideration of these matters and, accordingly, the auditors accept noresponsibility for any changes that may have occurred to the financial statements since they were initially presented on thewebsite. Legislations in the UK governing the preparation and dissemination of financial statements may differ fromlegislation in other jurisdictions.
www.berkeleygroup.co.uk 45
Auditors’ report on the financial statementsIndependent auditors’ report to the members of The Berkeley Group Holdings plcWe have audited the financial statements which comprise the consolidated profit and loss account, the consolidated andparent company balance sheets, the consolidated cash flow statement, the statement of group total recognised gains andlosses and the related notes. We have also audited the disclosures required by Part 3 of Schedule 7A to the Companies Act1985 contained in the Remuneration Committee Report (“the auditable part”).
Respective responsibilities of Directors and auditorsThe Directors’ responsibilities for preparing the Annual Report and the financial statements in accordance with applicableUnited Kingdom law and accounting standards are set out in the statement of Directors’ responsibilities. The Directors arealso responsible for preparing the Remuneration Committee Report.
Our responsibility is to audit the financial statements and the auditable part of the Remuneration Committee Report inaccordance with relevant legal and regulatory requirements and United Kingdom Auditing Standards issued by the AuditingPractices Board. This report, including the opinion, has been prepared for and only for the Company’s members as a bodyin accordance with Section 235 of the Companies Act 1985 and for no other purpose. We do not, in giving this opinion,accept or assume responsibility for any other purpose or to any other person to whom this report is shown or into whosehands it may come save where expressly agreed by our prior consent in writing.
We report to you our opinion as to whether the financial statements give a true and fair view and whether the financialstatements and the auditable part of the Remuneration Committee Report have been properly prepared in accordance withthe Companies Act 1985. We also report to you if, in our opinion, the Directors’ Report is not consistent with the financialstatements, if the Company has not kept proper accounting records, if we have not received all the information andexplanations we require for our audit, or if information specified by law regarding Directors’ remuneration and transactionsis not disclosed.
We read the other information contained in the Annual Report and consider the implications for our report if we becomeaware of any apparent misstatements or material inconsistencies with the financial statements. The other informationcomprises only the Directors’ Report, the unaudited part of the Remuneration Committee Report, the Chairman’sStatement, the Managing Director’s Review and the Corporate Governance Statement.
We review whether the Corporate Governance statement reflects the Company’s compliance with the nine provisions of the2003 FRC Combined Code specified for our review by the Listing Rules of the Financial Services Authority, and we report ifit does not. We are not required to consider whether the Board’s statements on internal control cover all risks and controls,or to form an opinion on the effectiveness of the Group’s corporate governance procedures or its risk and control procedures.
Basis of audit opinionWe conducted our audit in accordance with auditing standards issued by the Auditing Practices Board. An audit includesexamination, on a test basis, of evidence relevant to the amounts and disclosures in the financial statements and theauditable part of the Remuneration Committee Report. It also includes an assessment of the significant estimates andjudgements made by the Directors in the preparation of the financial statements, and of whether the accounting policiesare appropriate to the Company’s circumstances, consistently applied and adequately disclosed.
We planned and performed our audit so as to obtain all the information and explanations which we considered necessaryin order to provide us with sufficient evidence to give reasonable assurance that the financial statements and the auditablepart of the Remuneration Committee Report are free from material misstatement, whether caused by fraud or otherirregularity or error. In forming our opinion we also evaluated the overall adequacy of the presentation of information in thefinancial statements.
OpinionIn our opinion:
• the financial statements give a true and fair view of the state of affairs of the Company and the Group at 30 April 2005 andthe profit and cash flows of the Group for the year then ended;
• the financial statements have been properly prepared in accordance with the Companies Act 1985; and• those parts of the Remuneration Committee Report required by Part 3 of Schedule 7A to the Companies Act 1985 have
been properly prepared in accordance with the Companies Act 1985.
PricewaterhouseCoopers LLPChartered Accountants and Registered AuditorsLondon21 July 2005
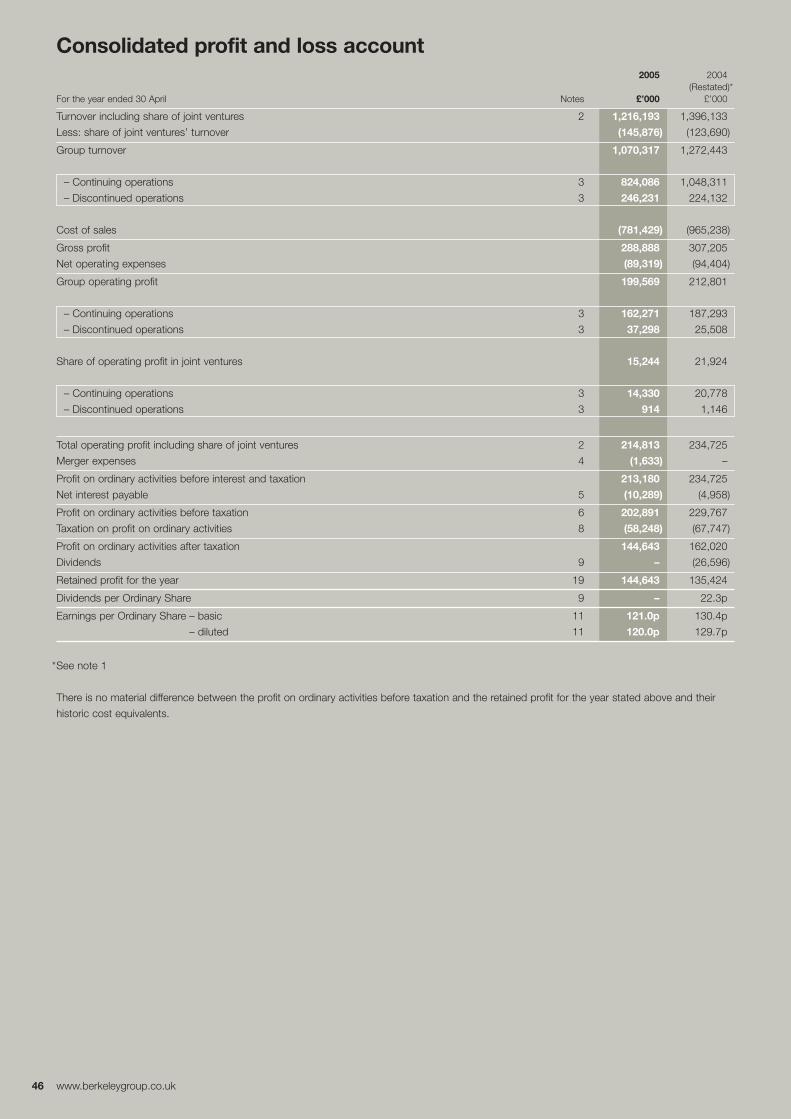
46 www.berkeleygroup.co.uk
Consolidated profit and loss account 2005 2004
(Restated)*For the year ended 30 April Notes £’000 £’000
Turnover including share of joint ventures 2 1,216,193 1,396,133
Less: share of joint ventures’ turnover (145,876) (123,690)
Group turnover 1,070,317 1,272,443
– Continuing operations 3 824,086 1,048,311
– Discontinued operations 3 246,231 224,132
Cost of sales (781,429) (965,238)
Gross profit 288,888 307,205
Net operating expenses (89,319) (94,404)
Group operating profit 199,569 212,801
– Continuing operations 3 162,271 187,293
– Discontinued operations 3 37,298 25,508
Share of operating profit in joint ventures 15,244 21,924
– Continuing operations 3 14,330 20,778
– Discontinued operations 3 914 1,146
Total operating profit including share of joint ventures 2 214,813 234,725
Merger expenses 4 (1,633) –
Profit on ordinary activities before interest and taxation 213,180 234,725
Net interest payable 5 (10,289) (4,958)
Profit on ordinary activities before taxation 6 202,891 229,767
Taxation on profit on ordinary activities 8 (58,248) (67,747)
Profit on ordinary activities after taxation 144,643 162,020
Dividends 9 – (26,596)
Retained profit for the year 19 144,643 135,424
Dividends per Ordinary Share 9 – 22.3p
Earnings per Ordinary Share – basic 11 121.0p 130.4p
– diluted 11 120.0p 129.7p
*See note 1
There is no material difference between the profit on ordinary activities before taxation and the retained profit for the year stated above and their
historic cost equivalents.
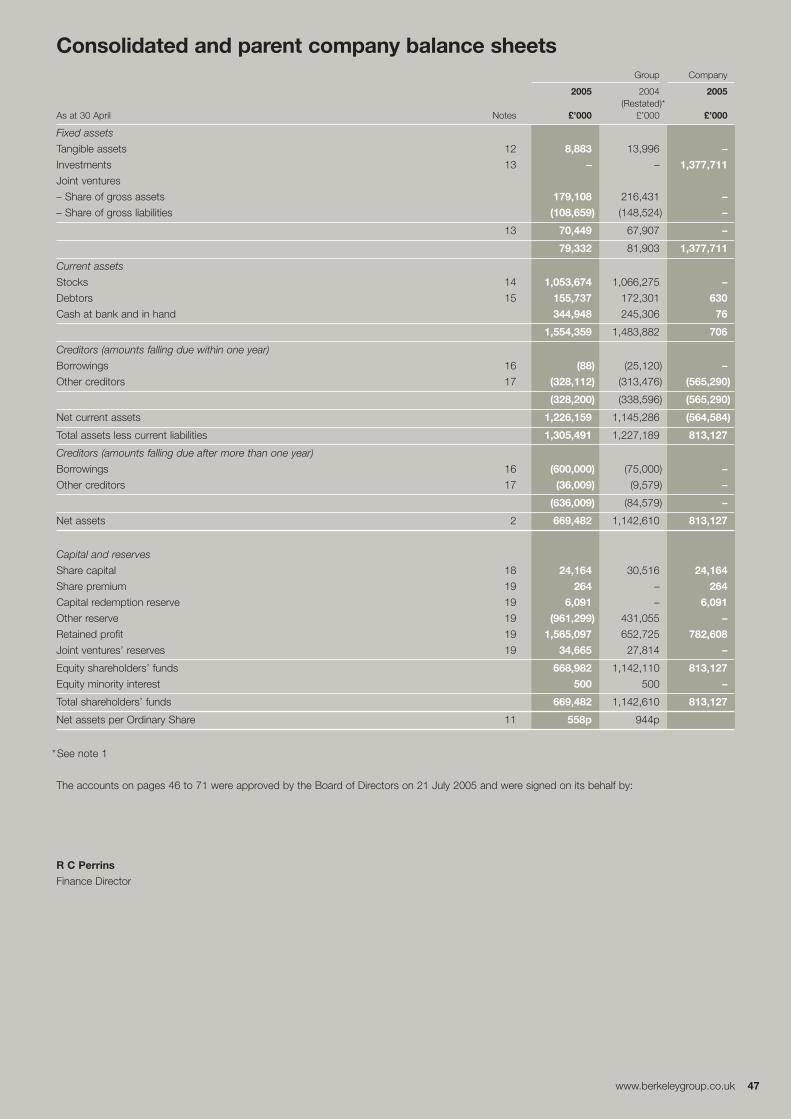
Consolidated and parent company balance sheetsGroup Company
2005 2004 2005(Restated)*
As at 30 April Notes £’000 £’000 £’000
Fixed assets
Tangible assets 12 8,883 13,996 –
Investments 13 – – 1,377,711
Joint ventures
– Share of gross assets 179,108 216,431 –
– Share of gross liabilities (108,659) (148,524) –
13 70,449 67,907 –
79,332 81,903 1,377,711
Current assets
Stocks 14 1,053,674 1,066,275 –
Debtors 15 155,737 172,301 630
Cash at bank and in hand 344,948 245,306 76
1,554,359 1,483,882 706
Creditors (amounts falling due within one year)
Borrowings 16 (88) (25,120) –
Other creditors 17 (328,112) (313,476) (565,290)
(328,200) (338,596) (565,290)
Net current assets 1,226,159 1,145,286 (564,584)
Total assets less current liabilities 1,305,491 1,227,189 813,127
Creditors (amounts falling due after more than one year)
Borrowings 16 (600,000) (75,000) –
Other creditors 17 (36,009) (9,579) –
(636,009) (84,579) –
Net assets 2 669,482 1,142,610 813,127
Capital and reserves
Share capital 18 24,164 30,516 24,164
Share premium 19 264 – 264
Capital redemption reserve 19 6,091 – 6,091
Other reserve 19 (961,299) 431,055 –
Retained profit 19 1,565,097 652,725 782,608
Joint ventures’ reserves 19 34,665 27,814 –
Equity shareholders’ funds 668,982 1,142,110 813,127
Equity minority interest 500 500 –
Total shareholders’ funds 669,482 1,142,610 813,127
Net assets per Ordinary Share 11 558p 944p
*See note 1
The accounts on pages 46 to 71 were approved by the Board of Directors on 21 July 2005 and were signed on its behalf by:
R C Perrins
Finance Director
www.berkeleygroup.co.uk 47
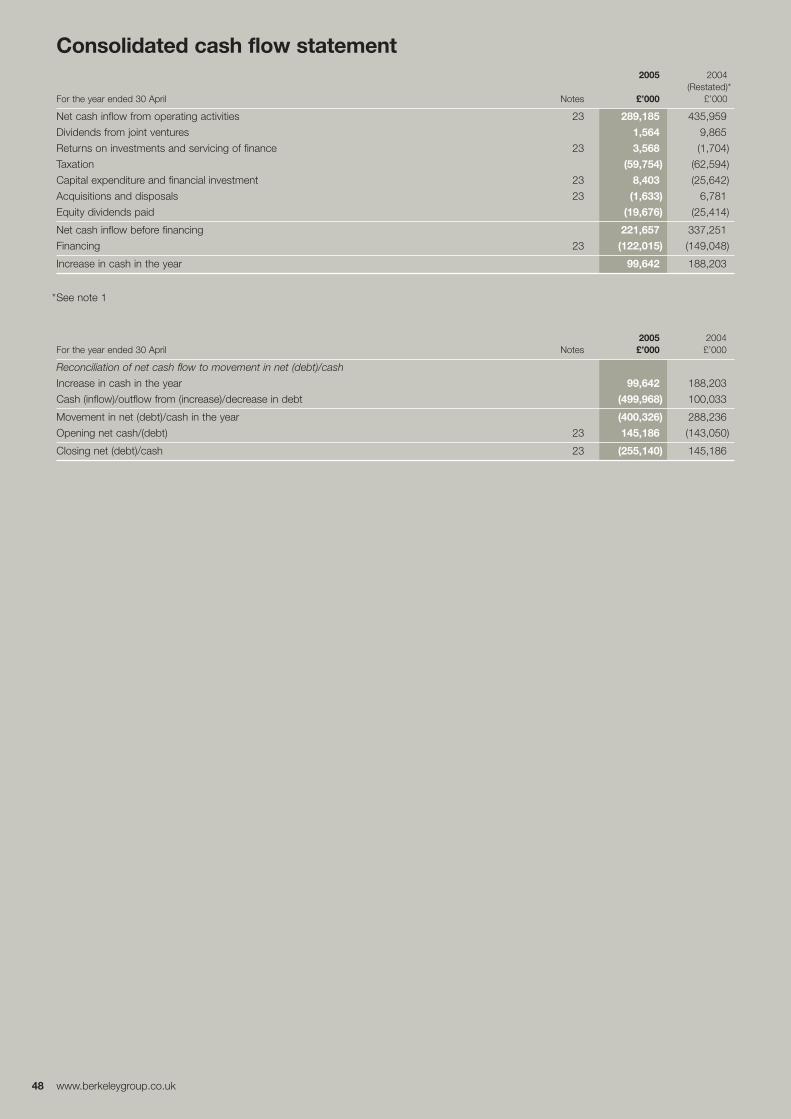
48 www.berkeleygroup.co.uk
Consolidated cash flow statement2005 2004
(Restated)*For the year ended 30 April Notes £’000 £’000
Net cash inflow from operating activities 23 289,185 435,959
Dividends from joint ventures 1,564 9,865
Returns on investments and servicing of finance 23 3,568 (1,704)
Taxation (59,754) (62,594)
Capital expenditure and financial investment 23 8,403 (25,642)
Acquisitions and disposals 23 (1,633) 6,781
Equity dividends paid (19,676) (25,414)
Net cash inflow before financing 221,657 337,251
Financing 23 (122,015) (149,048)
Increase in cash in the year 99,642 188,203
*See note 1
2005 2004For the year ended 30 April Notes £’000 £’000
Reconciliation of net cash flow to movement in net (debt)/cash
Increase in cash in the year 99,642 188,203
Cash (inflow)/outflow from (increase)/decrease in debt (499,968) 100,033
Movement in net (debt)/cash in the year (400,326) 288,236
Opening net cash/(debt) 23 145,186 (143,050)
Closing net (debt)/cash 23 (255,140) 145,186
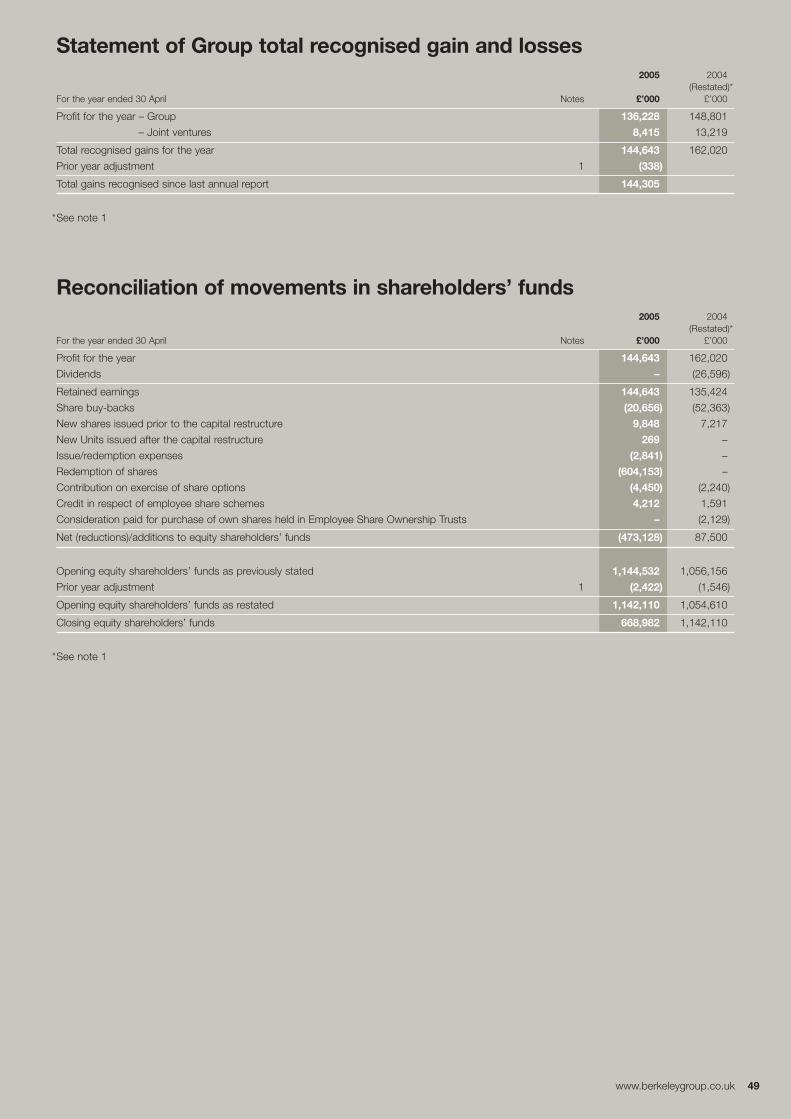
Statement of Group total recognised gain and losses2005 2004
(Restated)*For the year ended 30 April Notes £’000 £’000
Profit for the year – Group 136,228 148,801
– Joint ventures 8,415 13,219
Total recognised gains for the year 144,643 162,020
Prior year adjustment 1 (338)
Total gains recognised since last annual report 144,305
*See note 1
Reconciliation of movements in shareholders’ funds2005 2004
(Restated)*For the year ended 30 April Notes £’000 £’000
Profit for the year 144,643 162,020
Dividends – (26,596)
Retained earnings 144,643 135,424
Share buy-backs (20,656) (52,363)
New shares issued prior to the capital restructure 9,848 7,217
New Units issued after the capital restructure 269 –
Issue/redemption expenses (2,841) –
Redemption of shares (604,153) –
Contribution on exercise of share options (4,450) (2,240)
Credit in respect of employee share schemes 4,212 1,591
Consideration paid for purchase of own shares held in Employee Share Ownership Trusts – (2,129)
Net (reductions)/additions to equity shareholders’ funds (473,128) 87,500
Opening equity shareholders’ funds as previously stated 1,144,532 1,056,156
Prior year adjustment 1 (2,422) (1,546)
Opening equity shareholders’ funds as restated 1,142,110 1,054,610
Closing equity shareholders’ funds 668,982 1,142,110
*See note 1
www.berkeleygroup.co.uk 49
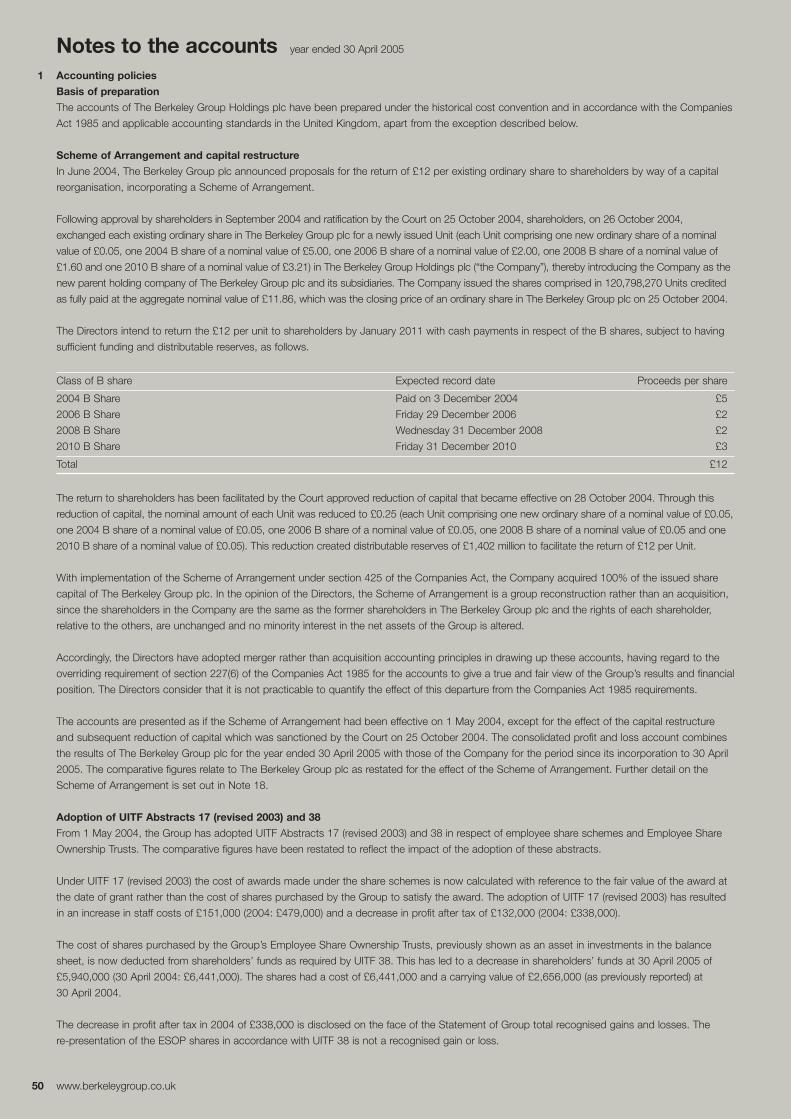
50 www.berkeleygroup.co.uk
Notes to the accounts year ended 30 April 2005
1 Accounting policies
Basis of preparation
The accounts of The Berkeley Group Holdings plc have been prepared under the historical cost convention and in accordance with the Companies
Act 1985 and applicable accounting standards in the United Kingdom, apart from the exception described below.
Scheme of Arrangement and capital restructure
In June 2004, The Berkeley Group plc announced proposals for the return of £12 per existing ordinary share to shareholders by way of a capital
reorganisation, incorporating a Scheme of Arrangement.
Following approval by shareholders in September 2004 and ratification by the Court on 25 October 2004, shareholders, on 26 October 2004,
exchanged each existing ordinary share in The Berkeley Group plc for a newly issued Unit (each Unit comprising one new ordinary share of a nominal
value of £0.05, one 2004 B share of a nominal value of £5.00, one 2006 B share of a nominal value of £2.00, one 2008 B share of a nominal value of
£1.60 and one 2010 B share of a nominal value of £3.21) in The Berkeley Group Holdings plc (“the Company”), thereby introducing the Company as the
new parent holding company of The Berkeley Group plc and its subsidiaries. The Company issued the shares comprised in 120,798,270 Units credited
as fully paid at the aggregate nominal value of £11.86, which was the closing price of an ordinary share in The Berkeley Group plc on 25 October 2004.
The Directors intend to return the £12 per unit to shareholders by January 2011 with cash payments in respect of the B shares, subject to having
sufficient funding and distributable reserves, as follows.
Class of B share Expected record date Proceeds per share
2004 B Share Paid on 3 December 2004 £5
2006 B Share Friday 29 December 2006 £2
2008 B Share Wednesday 31 December 2008 £2
2010 B Share Friday 31 December 2010 £3
Total £12
The return to shareholders has been facilitated by the Court approved reduction of capital that became effective on 28 October 2004. Through this
reduction of capital, the nominal amount of each Unit was reduced to £0.25 (each Unit comprising one new ordinary share of a nominal value of £0.05,
one 2004 B share of a nominal value of £0.05, one 2006 B share of a nominal value of £0.05, one 2008 B share of a nominal value of £0.05 and one
2010 B share of a nominal value of £0.05). This reduction created distributable reserves of £1,402 million to facilitate the return of £12 per Unit.
With implementation of the Scheme of Arrangement under section 425 of the Companies Act, the Company acquired 100% of the issued share
capital of The Berkeley Group plc. In the opinion of the Directors, the Scheme of Arrangement is a group reconstruction rather than an acquisition,
since the shareholders in the Company are the same as the former shareholders in The Berkeley Group plc and the rights of each shareholder,
relative to the others, are unchanged and no minority interest in the net assets of the Group is altered.
Accordingly, the Directors have adopted merger rather than acquisition accounting principles in drawing up these accounts, having regard to the
overriding requirement of section 227(6) of the Companies Act 1985 for the accounts to give a true and fair view of the Group’s results and financial
position. The Directors consider that it is not practicable to quantify the effect of this departure from the Companies Act 1985 requirements.
The accounts are presented as if the Scheme of Arrangement had been effective on 1 May 2004, except for the effect of the capital restructure
and subsequent reduction of capital which was sanctioned by the Court on 25 October 2004. The consolidated profit and loss account combines
the results of The Berkeley Group plc for the year ended 30 April 2005 with those of the Company for the period since its incorporation to 30 April
2005. The comparative figures relate to The Berkeley Group plc as restated for the effect of the Scheme of Arrangement. Further detail on the
Scheme of Arrangement is set out in Note 18.
Adoption of UITF Abstracts 17 (revised 2003) and 38
From 1 May 2004, the Group has adopted UITF Abstracts 17 (revised 2003) and 38 in respect of employee share schemes and Employee Share
Ownership Trusts. The comparative figures have been restated to reflect the impact of the adoption of these abstracts.
Under UITF 17 (revised 2003) the cost of awards made under the share schemes is now calculated with reference to the fair value of the award at
the date of grant rather than the cost of shares purchased by the Group to satisfy the award. The adoption of UITF 17 (revised 2003) has resulted
in an increase in staff costs of £151,000 (2004: £479,000) and a decrease in profit after tax of £132,000 (2004: £338,000).
The cost of shares purchased by the Group’s Employee Share Ownership Trusts, previously shown as an asset in investments in the balance
sheet, is now deducted from shareholders’ funds as required by UITF 38. This has led to a decrease in shareholders’ funds at 30 April 2005 of
£5,940,000 (30 April 2004: £6,441,000). The shares had a cost of £6,441,000 and a carrying value of £2,656,000 (as previously reported) at
30 April 2004.
The decrease in profit after tax in 2004 of £338,000 is disclosed on the face of the Statement of Group total recognised gains and losses. The
re-presentation of the ESOP shares in accordance with UITF 38 is not a recognised gain or loss.
www.berkeleygroup.co.uk 51
1 Accounting policies continued
The Consolidated cash flow statement has also been restated to show the relevant cash flows in financing activities rather than capital expenditure
and financial investment.
Basis of consolidation The consolidated accounts comprise the accounts of the parent Company and all its subsidiary undertakings.
The accounting date for subsidiary undertakings is 30 April. In the case of acquisitions or disposals, the Group’s result includes that proportion from
or to the effective date of acquisition or disposal as appropriate.
Goodwill With effect from 1 April 1998, where the cost of acquiring new and additional interests in subsidiaries, joint ventures and businesses
exceeds the fair value of the net assets acquired, the resulting premium on acquisition (goodwill) is capitalised and its subsequent measurement
(via annual impairment reviews or an annual amortisation charge) will be determined based on the individual circumstances of each business
acquired. Goodwill written off to reserves prior to 1998 is not recorded in the consolidated balance sheet. When a business is disposed of,
goodwill, where applicable, is charged to the consolidated profit and loss account.
Investments The parent company’s investments in subsidiary undertakings are included in the balance sheet at cost less provision for any
permanent diminution in value.
Joint ventures The results attributable to the Company’s holding in joint ventures are shown separately in the consolidated profit and loss
account. The amount included in the consolidated balance sheet is the Group’s share of the net assets of the joint ventures plus net loans
receivable. Goodwill arising on the acquisition of joint ventures is accounted for in accordance with the policy set out above. Any unamortised
balance of goodwill is included in the carrying value of the investment in joint ventures.
Turnover Turnover represents the amounts receivable from the sale of properties during the year. On traditional developments, properties
are treated as sold and profits are taken when contracts are exchanged and the building work is physically complete. On complex multi-unit
developments, revenue and profit are recognised on a staged basis, commencing when the building work is substantially complete, which
is defined as being plastered and when contracts are exchanged. This policy applies to both residential housebuilding and commercial
property activities.
Tangible fixed assets Tangible fixed assets are carried at cost. Depreciation is provided to write-off the cost of the assets on a straight line basis
over their estimated useful lives at the following annual rates:
Freehold property 2% Fixtures and fittings 15%/20%
Motor vehicles 25% Computer equipment 331⁄3%
Leasehold property is amortised over the period of the lease. Computer equipment is included within fixtures and fittings.
Stocks Property in the course of development is valued at the lower of direct cost and net realisable value. Direct cost comprises the cost of land,
raw materials and development costs but excludes indirect overheads and interest. Progress payments are deducted from work in progress.
Provision is made, where appropriate, to reduce the value of stocks and work in progress to their net realisable value.
Deferred taxation Deferred taxation is recognised in respect of all timing differences that have originated but not been reversed by the balance
sheet date, where transactions or events that result in an obligation to pay more tax in the future or a right to pay less tax in the future have
occurred at the balance sheet date. Deferred taxation assets are recognised to the extent that they are regarded as recoverable and have not been
discounted. Deferred tax assets and liabilities are calculated using the tax rates that have been enacted or substantively enacted by the balance
sheet dates.
Financial instruments From time to time the Group makes use of interest rate swaps and caps to manage its exposure to fluctuations in interest
rates. Interest rate instruments are treated as hedges and the net interest payable or receivable is reflected in the profit and loss account.
Pension costs The expected cost of providing pensions on defined benefit schemes is recognised on a systematic basis over the period during
which benefit is derived from the employees’ services. Pension contributions under defined contribution schemes are charged to the profit and loss
account as incurred for defined benefits pension schemes. A valuation is performed every three years.
Leasing and rental agreements Payments under rental and operating lease agreements are charged against profit on a straight line basis over
the life of the lease.
Share incentive schemes The intrinsic value of awards under the Group’s Long-Term Incentive Plans are charged against profit on a straight line
basis over the vesting period of the awards, based on the Group’s estimate of awards that will eventually vest. Shares held in trust to satisfy these
awards are treated as a deduction from shareholders’ funds.
52 www.berkeleygroup.co.uk
Notes to the accounts continued year ended 30 April 2005
2 Segmental information
Turnover, operating profit and net assets by class of business are analysed below:
Turnover Operating profit Net assets
2005 2004 2005 2004 2005 2004(Restated)* (Restated)*
£’000 £’000 £’000 £’000 £’000 £’000
Residential housebuilding
Group 1,002,769 1,130,162 190,487 198,586 581,892 1,065,617
Joint ventures 144,669 120,977 14,877 19,836 70,128 66,483
1,147,438 1,251,139 205,364 218,422 652,020 1,132,100
Commercial property and other activities
Group 67,548 142,281 9,082 14,215 17,141 9,085
Joint ventures 1,207 2,713 367 2,088 321 1,425
68,755 144,994 9,449 16,303 17,462 10,510
1,216,193 1,396,133 214,813 234,725 669,482 1,142,610
*See note 1
All turnover and profit are derived from activities performed in the United Kingdom. Included in Group residential housebuilding turnover and operating
margin are £16,139,000 and £6,600,000 in respect of land sales (2004: £11,426,000 and £2,382,000).
3 Discontinued operations
Since the year end, the Group has announced the sale of The Crosby Group plc and its Subsidiaries (“Crosby”) to Lend Lease Corporation Limited
for consideration of £235,700,000 and the repayment of working capital provided to Crosby since 30 April 2005 of £15,000,000. Financial Reporting
Standard No. 3 (FRS 3) requires that the Crosby Division be treated as discontinued operations for the year ended 30 April 2005, since the sale
completed before the earlier of three months after the year end and the date of approval of the financial statements. See Note 26 for further information.
The additional information required in respect of discontinued operations in the financial statements for the year ended 30 April 2005 is as follows:
Continuing Discontinued Continuing Discontinued operations operations Total operations operations Total
2005 2005 2005 2004 2004 2004 £’000 £’000 £’000 £’000 £’000 £’000
Turnover including share of joint ventures 964,464 251,729 1,216,193 1,166,383 229,750 1,396,133
Less: share of joint ventures’ turnover (140,378) (5,498) (145,876) (118,072) (5,618) (123,690)
Group turnover 824,086 246,231 1,070,317 1,048,311 224,132 1,272,443
Cost of sales (586,254) (195,175) (781,429) (785,254) (179,984) (965,238)
Gross margin 237,832 51,056 288,888 263,057 44,148 307,205
Net operating expenses (75,561) (13,758) (89,319) (75,764) (18,640) (94,404)
Operating profit 162,271 37,298 199,569 187,293 25,508 212,801
Share of operating profit of joint ventures 14,330 914 15,244 20,778 1,146 21,924
Total operating profit including share of joint ventures 176,601 38,212 214,813 208,071 26,654 234,725
Group turnover and operating profit for discontinued operations includes £11,434,000 and £629,000 respectively (2004: £11,847,000 and
£282,000) in respect of commercial property and other activities. Joint venture turnover and operating profit for discontinued operations includes
£582,000 and £52,000 respectively (2004: £2,526,000 and £563,000) in respect of commercial property and other activities.
4 Merger expenses
Merger expenses of £1,633,000 (before tax of £114,000) comprise adviser costs incurred as part of the Scheme of Arrangement and capital
restructure. See note 1.
5 Net interest payable2005 2004 £’000 £’000
Interest receivable 11,413 4,770
Interest payable on bank loans and overdrafts (18,376) (6,207)
Interest payable – share of joint ventures (3,326) (3,521)
(10,289) (4,958)
www.berkeleygroup.co.uk 53
6 Profit on ordinary activities before taxation
Profit on ordinary activities before taxation is stated after charging/(crediting) the following amounts:2005 2004 £’000 £’000
Depreciation 2,581 3,085
Hire of plant and machinery 3,828 3,122
Profit on sale of tangible fixed assets (1,379) (618)
Profit on sale of fixed asset investments – (144)
Operating lease costs – motor vehicles 941 1,436
Operating lease costs – land and buildings 2,587 1,989
Auditors’ remuneration:
– statutory audit 205 205
– further assurance services 55 45
– taxation services 781 430
– other services 158 77
Auditors’ remuneration for further assurance services comprises £25,000 in respect of the interim review (2004: £25,000) and £30,000
(2004: £20,000) in respect of advice relating to International Financial Reporting Standards.
Included in the remuneration for taxation services above is an amount of £511,000 and for other services an amount of £158,000 which relate to
taxation advice and reporting accountant work respectively for the corporate restructure and Scheme of Arrangement during the year. Of this total
of £669,000, an amount of £637,000 is included within merger costs in the profit and loss account, and £32,000, in respect of taxation advice
relating to the raising of finance, is included in interest payable in accordance with FRS 4 ‘Capital Instruments’. In addition to the above, a further
£143,000 of remuneration in respect of taxation advice relating to the raising of finance is included as a prepayment at 30 April 2005,
and £139,000 is included within share issue/redemption costs in reserves.
The remaining £270,000 of remuneration for taxation services was incurred primarily in connection with other corporate activity in the year.
Audit fees for the Company in the year were £10,000 (2004: £nil).
In addition to the above services, the Group’s auditor acted as auditor to The Berkeley Group plc Staff Benefit Plan and The Berkeley Group Money
Purchase Pension Plan. The appointment of auditors to the Group’s pension schemes and the fees paid in respect of those audits are agreed by
the trustees of each scheme, who act independently of the management of the Group. The aggregate fees paid to the Group’s auditor for audit
services to the pension schemes during the year were £11,000 (2004: £11,000).
Operating expenses represent administration expenses.
7 Directors and employees2005 2004 £’000 £’000
Staff costs
Wages and salaries 68,893 66,748
Social security costs 8,120 7,536
Other pension costs 3,784 3,467
80,797 77,751
The average number of persons employed by the Group during the year was 1,055 (2004: 1,261), of which 1,046 (2004: 1,250) were employed
in residential housebuilding activities and the balance in commercial development activities.
Directors
Details of Directors’ emoluments are set out in the Remuneration Committee Report on pages 35 to 39.
Pensions
There are currently four principal pension schemes in operation within the Group, the assets of which are held in separate trustee administered funds.
The Berkeley Group plc Staff Benefits Plan (the ‘Berkeley Final Salary Plan’) is a defined benefit scheme and was closed to new entrants from 1 May 2002.
The Berkeley Group plc Money Purchase Scheme (the ‘Berkeley Money Purchase Plan’), the St George PLC Retirement and Death Benefits Scheme (the
‘St George Scheme’) and the Thirlstone Homes Limited Retirement Benefits Scheme (the ‘Thirlstone Scheme’) are defined contribution schemes.
The Berkeley Final Salary Plan is subject to an independent actuarial valuation at least every three years. The most recent valuation was carried out
as at 1 May 2004. The method adopted in the 2004 valuation was the projected unit method, which assumed a return on investment prior to and after
retirement of 6.5% and 5.5% per annum respectively, pension increases for service before and after April 1997 of 3.0% and 3.7% per annum respectively
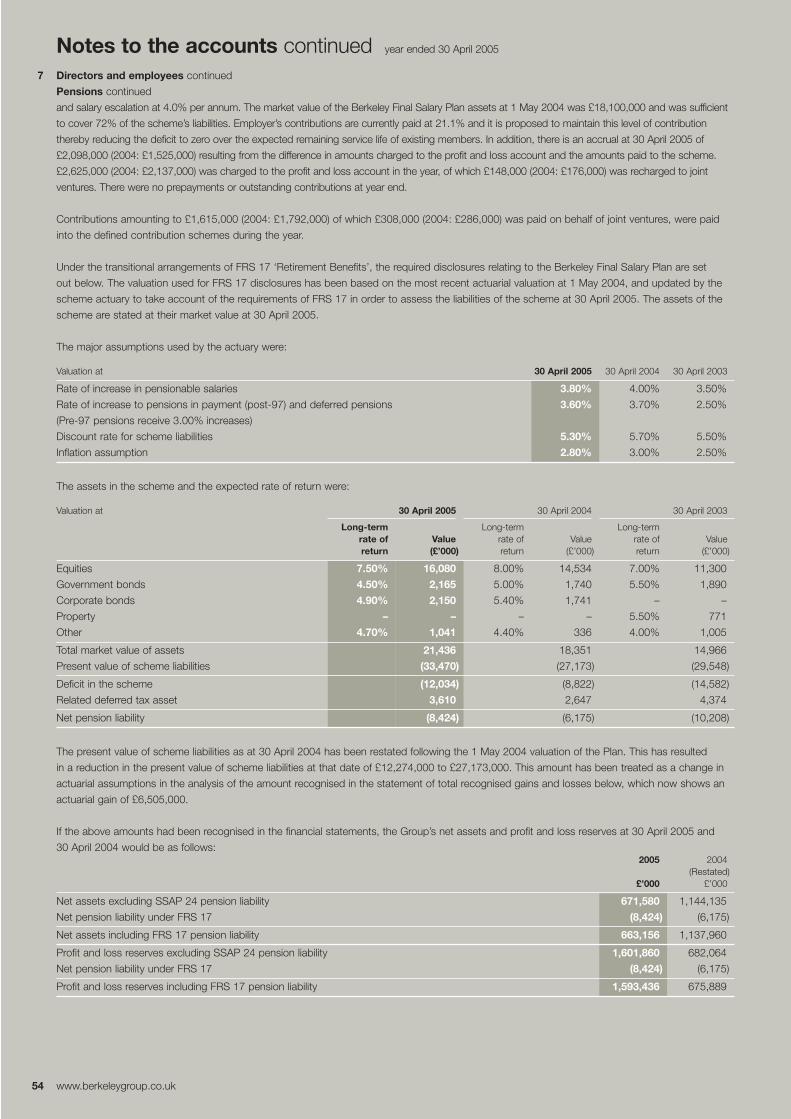
54 www.berkeleygroup.co.uk
Notes to the accounts continued year ended 30 April 2005
7 Directors and employees continued
Pensions continued
and salary escalation at 4.0% per annum. The market value of the Berkeley Final Salary Plan assets at 1 May 2004 was £18,100,000 and was sufficient
to cover 72% of the scheme’s liabilities. Employer’s contributions are currently paid at 21.1% and it is proposed to maintain this level of contribution
thereby reducing the deficit to zero over the expected remaining service life of existing members. In addition, there is an accrual at 30 April 2005 of
£2,098,000 (2004: £1,525,000) resulting from the difference in amounts charged to the profit and loss account and the amounts paid to the scheme.
£2,625,000 (2004: £2,137,000) was charged to the profit and loss account in the year, of which £148,000 (2004: £176,000) was recharged to joint
ventures. There were no prepayments or outstanding contributions at year end.
Contributions amounting to £1,615,000 (2004: £1,792,000) of which £308,000 (2004: £286,000) was paid on behalf of joint ventures, were paid
into the defined contribution schemes during the year.
Under the transitional arrangements of FRS 17 ‘Retirement Benefits’, the required disclosures relating to the Berkeley Final Salary Plan are set
out below. The valuation used for FRS 17 disclosures has been based on the most recent actuarial valuation at 1 May 2004, and updated by the
scheme actuary to take account of the requirements of FRS 17 in order to assess the liabilities of the scheme at 30 April 2005. The assets of the
scheme are stated at their market value at 30 April 2005.
The major assumptions used by the actuary were:
Valuation at 30 April 2005 30 April 2004 30 April 2003
Rate of increase in pensionable salaries
Rate of increase to pensions in payment (post-97) and deferred pensions
(Pre-97 pensions receive 3.00% increases)
Discount rate for scheme liabilities
3.80%
3.60%
5.30%
4.00%
3.70%
5.70%
3.50%
2.50%
5.50%
Inflation assumption 2.80% 3.00% 2.50%
The assets in the scheme and the expected rate of return were:
Valuation at 30 April 2005 30 April 2004 30 April 2003
Long-termrate of Value
Long-term rate of Value
Long-term rate of Value
return (£’000) return (£’000) return (£’000)
Equities 7.50% 16,080 8.00% 14,534 7.00% 11,300
Government bonds 4.50% 2,165 5.00% 1,740 5.50% 1,890
Corporate bonds 4.90% 2,150 5.40% 1,741 – –
Property – – – – 5.50% 771
Other 4.70% 1,041 4.40% 336 4.00% 1,005
Total market value of assets 21,436 18,351 14,966
Present value of scheme liabilities (33,470) (27,173) (29,548)
Deficit in the scheme (12,034) (8,822) (14,582)
Related deferred tax asset 3,610 2,647 4,374
Net pension liability (8,424) (6,175) (10,208)
The present value of scheme liabilities as at 30 April 2004 has been restated following the 1 May 2004 valuation of the Plan. This has resulted
in a reduction in the present value of scheme liabilities at that date of £12,274,000 to £27,173,000. This amount has been treated as a change in
actuarial assumptions in the analysis of the amount recognised in the statement of total recognised gains and losses below, which now shows an
actuarial gain of £6,505,000.
If the above amounts had been recognised in the financial statements, the Group’s net assets and profit and loss reserves at 30 April 2005 and
30 April 2004 would be as follows:2005 2004
£’000(Restated)
£’000
Net assets excluding SSAP 24 pension liability 671,580 1,144,135
Net pension liability under FRS 17 (8,424) (6,175)
Net assets including FRS 17 pension liability 663,156 1,137,960
Profit and loss reserves excluding SSAP 24 pension liability 1,601,860 682,064
Net pension liability under FRS 17 (8,424) (6,175)
Profit and loss reserves including FRS 17 pension liability 1,593,436 675,889
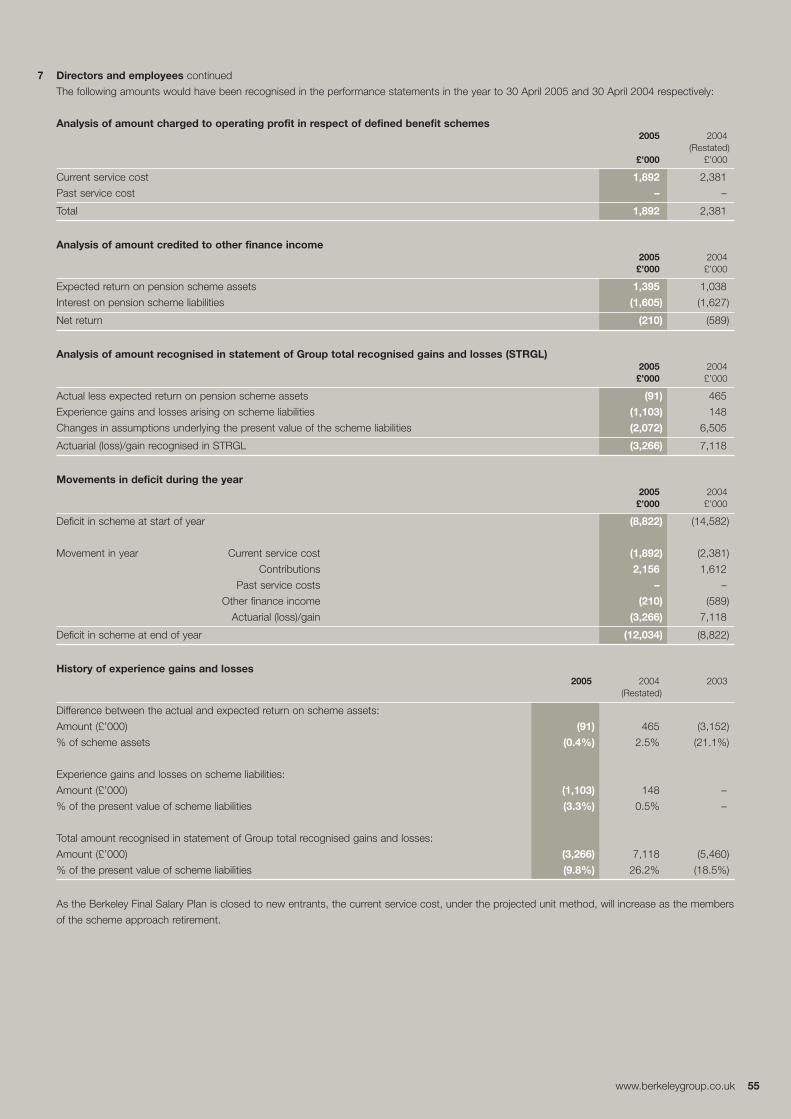
www.berkeleygroup.co.uk 55
7 Directors and employees continued
The following amounts would have been recognised in the performance statements in the year to 30 April 2005 and 30 April 2004 respectively:
Analysis of amount charged to operating profit in respect of defined benefit schemes2005 2004
(Restated)£’000 £’000
Current service cost 1,892 2,381
Past service cost – –
Total 1,892 2,381
Analysis of amount credited to other finance income2005 2004 £’000 £’000
Expected return on pension scheme assets 1,395 1,038
Interest on pension scheme liabilities (1,605) (1,627)
Net return (210) (589)
Analysis of amount recognised in statement of Group total recognised gains and losses (STRGL)2005 2004 £’000 £’000
Actual less expected return on pension scheme assets (91) 465
Experience gains and losses arising on scheme liabilities (1,103) 148
Changes in assumptions underlying the present value of the scheme liabilities (2,072) 6,505
Actuarial (loss)/gain recognised in STRGL (3,266) 7,118
Movements in deficit during the year2005 2004 £’000 £’000
Deficit in scheme at start of year (8,822) (14,582)
Movement in year Current service cost (1,892) (2,381)
Contributions 2,156 1,612
Past service costs – –
Other finance income (210) (589)
Actuarial (loss)/gain (3,266) 7,118
Deficit in scheme at end of year (12,034) (8,822)
History of experience gains and losses2005 2004 2003
(Restated)
Difference between the actual and expected return on scheme assets:
Amount (£’000) (91) 465 (3,152)
% of scheme assets (0.4%) 2.5% (21.1%)
Experience gains and losses on scheme liabilities:
Amount (£’000) (1,103) 148 –
% of the present value of scheme liabilities (3.3%) 0.5% –
Total amount recognised in statement of Group total recognised gains and losses:
Amount (£’000) (3,266) 7,118 (5,460)
% of the present value of scheme liabilities (9.8%) 26.2% (18.5%)
As the Berkeley Final Salary Plan is closed to new entrants, the current service cost, under the projected unit method, will increase as the members
of the scheme approach retirement.
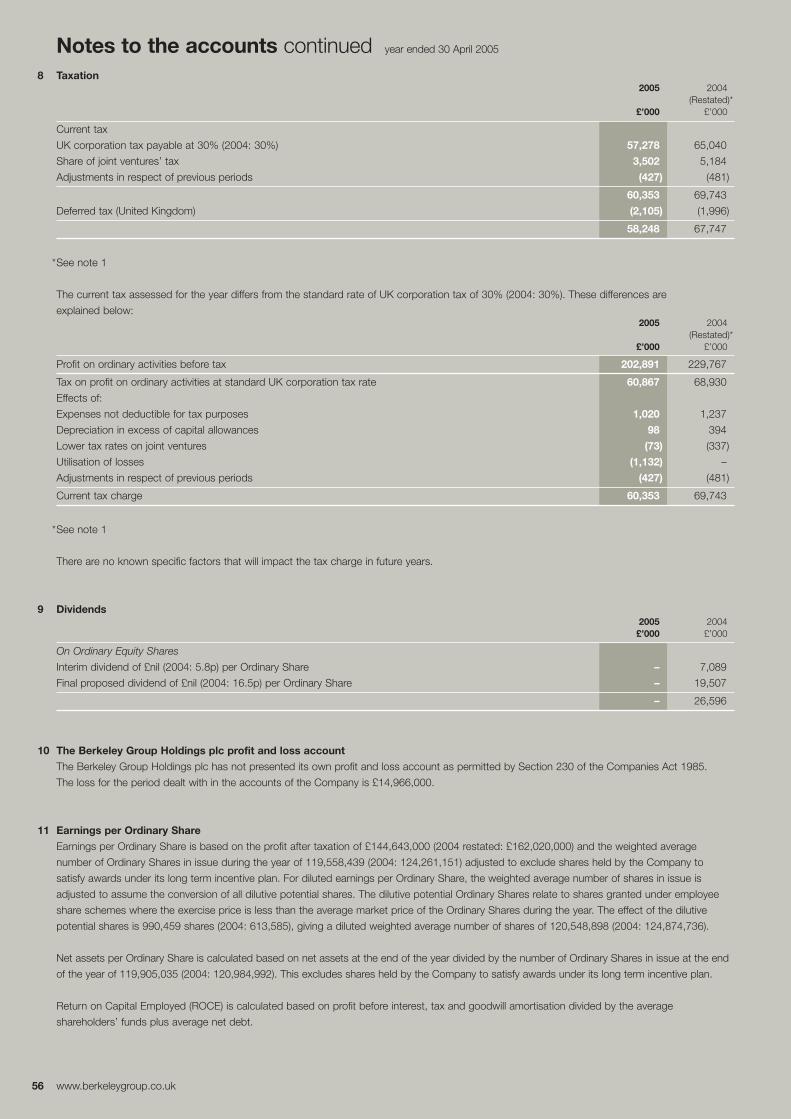
56 www.berkeleygroup.co.uk
Notes to the accounts continued year ended 30 April 2005
8 Taxation2005 2004
(Restated)* £’000 £’000
Current tax
UK corporation tax payable at 30% (2004: 30%) 57,278 65,040
Share of joint ventures’ tax 3,502 5,184
Adjustments in respect of previous periods (427) (481)
60,353 69,743
Deferred tax (United Kingdom) (2,105) (1,996)
58,248 67,747
*See note 1
The current tax assessed for the year differs from the standard rate of UK corporation tax of 30% (2004: 30%). These differences are
explained below:2005 2004
(Restated)*£’000 £’000
Profit on ordinary activities before tax 202,891 229,767
Tax on profit on ordinary activities at standard UK corporation tax rate 60,867 68,930
Effects of:
Expenses not deductible for tax purposes 1,020 1,237
Depreciation in excess of capital allowances 98 394
Lower tax rates on joint ventures (73) (337)
Utilisation of losses (1,132) –
Adjustments in respect of previous periods (427) (481)
Current tax charge 60,353 69,743
*See note 1
There are no known specific factors that will impact the tax charge in future years.
9 Dividends2005 2004 £’000 £’000
On Ordinary Equity Shares
Interim dividend of £nil (2004: 5.8p) per Ordinary Share – 7,089
Final proposed dividend of £nil (2004: 16.5p) per Ordinary Share – 19,507
– 26,596
10 The Berkeley Group Holdings plc profit and loss account
The Berkeley Group Holdings plc has not presented its own profit and loss account as permitted by Section 230 of the Companies Act 1985.
The loss for the period dealt with in the accounts of the Company is £14,966,000.
11 Earnings per Ordinary Share
Earnings per Ordinary Share is based on the profit after taxation of £144,643,000 (2004 restated: £162,020,000) and the weighted average
number of Ordinary Shares in issue during the year of 119,558,439 (2004: 124,261,151) adjusted to exclude shares held by the Company to
satisfy awards under its long term incentive plan. For diluted earnings per Ordinary Share, the weighted average number of shares in issue is
adjusted to assume the conversion of all dilutive potential shares. The dilutive potential Ordinary Shares relate to shares granted under employee
share schemes where the exercise price is less than the average market price of the Ordinary Shares during the year. The effect of the dilutive
potential shares is 990,459 shares (2004: 613,585), giving a diluted weighted average number of shares of 120,548,898 (2004: 124,874,736).
Net assets per Ordinary Share is calculated based on net assets at the end of the year divided by the number of Ordinary Shares in issue at the end
of the year of 119,905,035 (2004: 120,984,992). This excludes shares held by the Company to satisfy awards under its long term incentive plan.
Return on Capital Employed (ROCE) is calculated based on profit before interest, tax and goodwill amortisation divided by the average
shareholders’ funds plus average net debt.
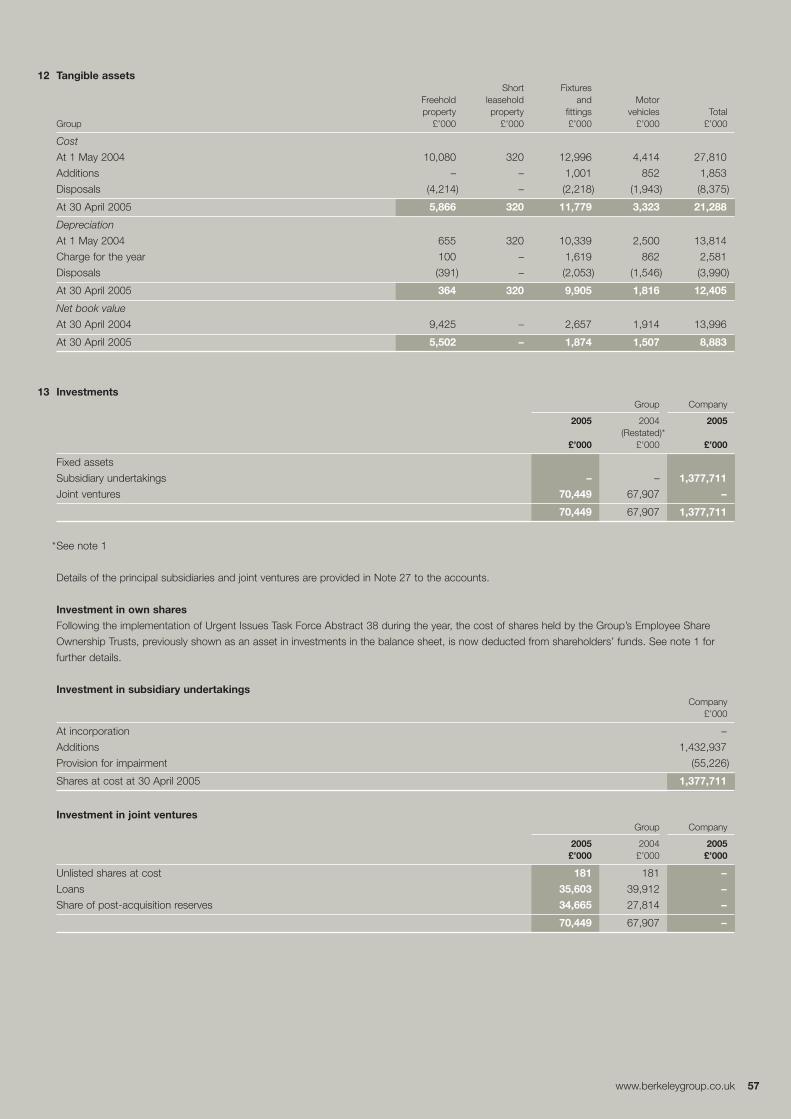
www.berkeleygroup.co.uk 57
12 Tangible assetsShort Fixtures
Freehold leasehold and Motorproperty property fittings vehicles Total
Group £’000 £’000 £’000 £’000 £’000
Cost
At 1 May 2004 10,080 320 12,996 4,414 27,810
Additions – – 1,001 852 1,853
Disposals (4,214) – (2,218) (1,943) (8,375)
At 30 April 2005 5,866 320 11,779 3,323 21,288
Depreciation
At 1 May 2004 655 320 10,339 2,500 13,814
Charge for the year 100 – 1,619 862 2,581
Disposals (391) – (2,053) (1,546) (3,990)
At 30 April 2005 364 320 9,905 1,816 12,405
Net book value
At 30 April 2004 9,425 – 2,657 1,914 13,996
At 30 April 2005 5,502 – 1,874 1,507 8,883
13 InvestmentsGroup Company
2005 2004 2005(Restated)*
£’000 £’000 £’000
Fixed assets
Subsidiary undertakings – – 1,377,711
Joint ventures 70,449 67,907 –
70,449 67,907 1,377,711
*See note 1
Details of the principal subsidiaries and joint ventures are provided in Note 27 to the accounts.
Investment in own shares
Following the implementation of Urgent Issues Task Force Abstract 38 during the year, the cost of shares held by the Group’s Employee Share
Ownership Trusts, previously shown as an asset in investments in the balance sheet, is now deducted from shareholders’ funds. See note 1 for
further details.
Investment in subsidiary undertakingsCompany
£’000
At incorporation –
Additions 1,432,937
Provision for impairment (55,226)
Shares at cost at 30 April 2005 1,377,711
Investment in joint venturesGroup Company
2005 2004 2005£’000 £’000 £’000
Unlisted shares at cost 181 181 –
Loans 35,603 39,912 –
Share of post-acquisition reserves 34,665 27,814 –
70,449 67,907 –
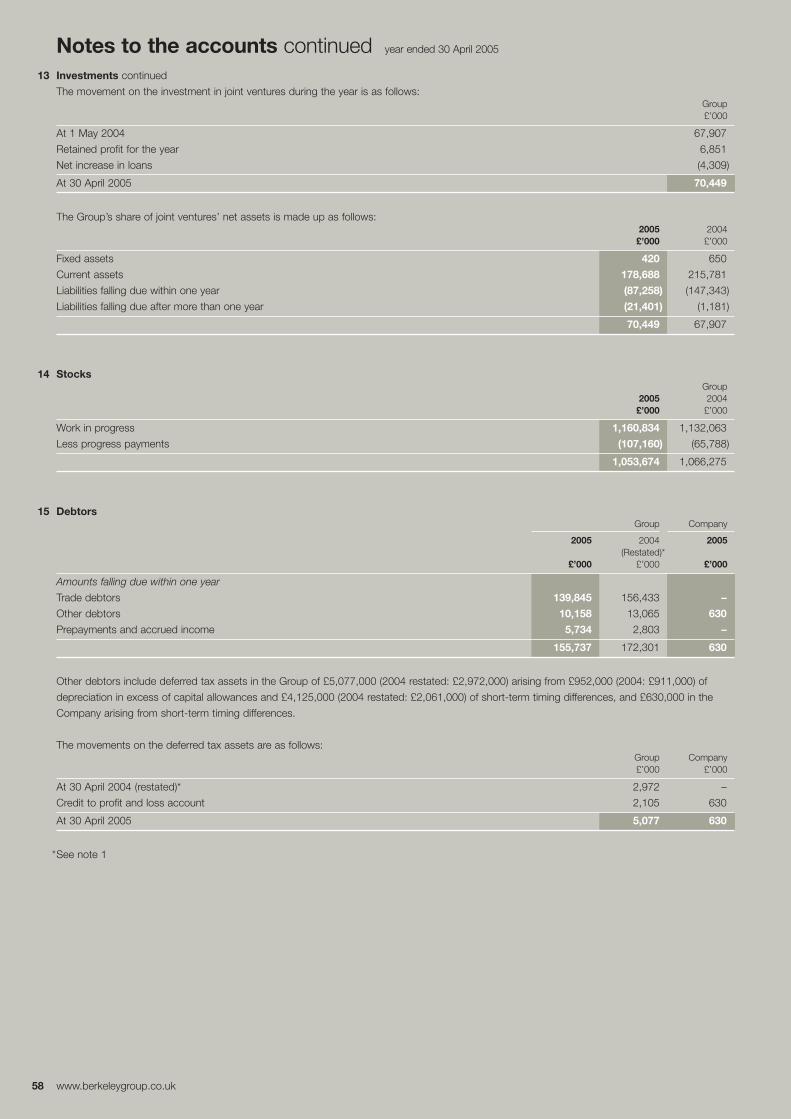
58 www.berkeleygroup.co.uk
Notes to the accounts continued year ended 30 April 2005
13 Investments continued
The movement on the investment in joint ventures during the year is as follows:Group£’000
At 1 May 2004 67,907
Retained profit for the year 6,851
Net increase in loans (4,309)
At 30 April 2005 70,449
The Group’s share of joint ventures’ net assets is made up as follows:2005 2004£’000 £’000
Fixed assets 420 650
Current assets 178,688 215,781
Liabilities falling due within one year (87,258) (147,343)
Liabilities falling due after more than one year (21,401) (1,181)
70,449 67,907
14 StocksGroup
2005 2004£’000 £’000
Work in progress 1,160,834 1,132,063
Less progress payments (107,160) (65,788)
1,053,674 1,066,275
15 DebtorsGroup Company
2005 2004 2005(Restated)*
£’000 £’000 £’000
Amounts falling due within one year
Trade debtors 139,845 156,433 –
Other debtors 10,158 13,065 630
Prepayments and accrued income 5,734 2,803 –
155,737 172,301 630
Other debtors include deferred tax assets in the Group of £5,077,000 (2004 restated: £2,972,000) arising from £952,000 (2004: £911,000) of
depreciation in excess of capital allowances and £4,125,000 (2004 restated: £2,061,000) of short-term timing differences, and £630,000 in the
Company arising from short-term timing differences.
The movements on the deferred tax assets are as follows:Group Company£’000 £’000
At 30 April 2004 (restated)* 2,972 –
Credit to profit and loss account 2,105 630
At 30 April 2005 5,077 630
*See note 1
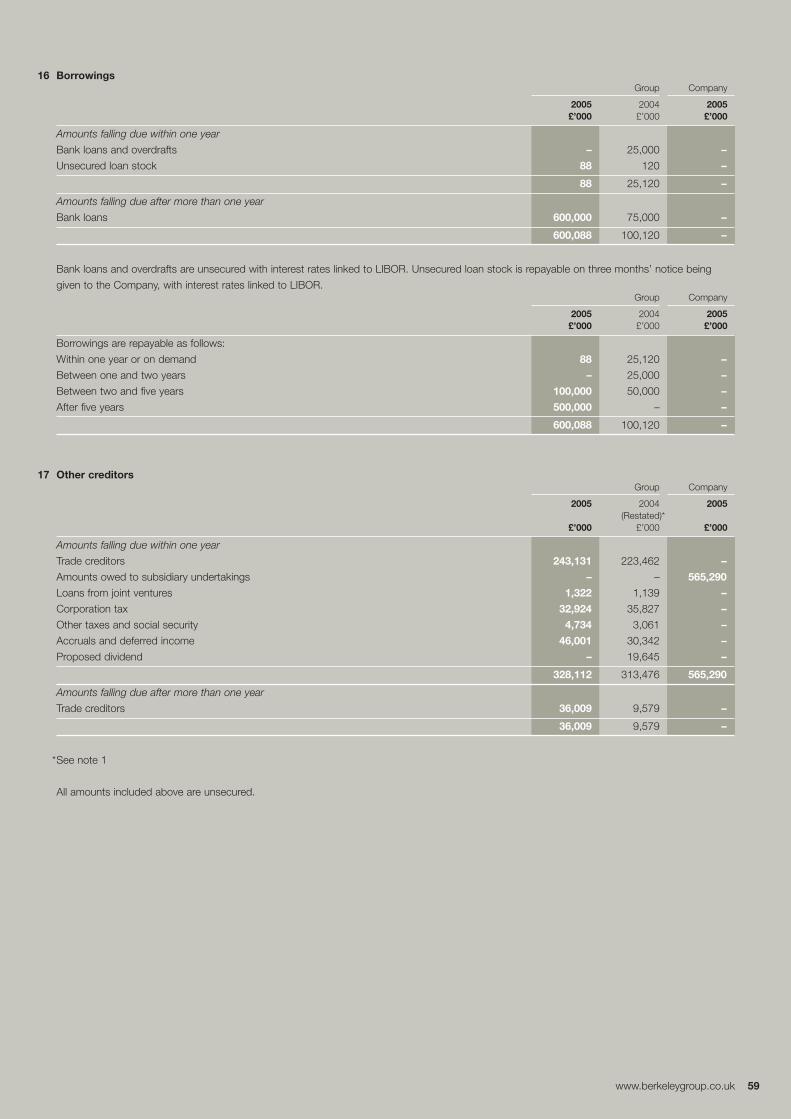
www.berkeleygroup.co.uk 59
16 BorrowingsGroup Company
2005 2004 2005£’000 £’000 £’000
Amounts falling due within one year
Bank loans and overdrafts – 25,000 –
Unsecured loan stock 88 120 –
88 25,120 –
Amounts falling due after more than one year
Bank loans 600,000 75,000 –
600,088 100,120 –
Bank loans and overdrafts are unsecured with interest rates linked to LIBOR. Unsecured loan stock is repayable on three months’ notice being
given to the Company, with interest rates linked to LIBOR.Group Company
2005 2004 2005£’000 £’000 £’000
Borrowings are repayable as follows:
Within one year or on demand 88 25,120 –
Between one and two years – 25,000 –
Between two and five years 100,000 50,000 –
After five years 500,000 – –
600,088 100,120 –
17 Other creditorsGroup Company
2005 2004 2005(Restated)*
£’000 £’000 £’000
Amounts falling due within one year
Trade creditors 243,131 223,462 –
Amounts owed to subsidiary undertakings – – 565,290
Loans from joint ventures 1,322 1,139 –
Corporation tax 32,924 35,827 –
Other taxes and social security 4,734 3,061 –
Accruals and deferred income 46,001 30,342 –
Proposed dividend – 19,645 –
328,112 313,476 565,290
Amounts falling due after more than one year
Trade creditors 36,009 9,579 –
36,009 9,579 –
*See note 1
All amounts included above are unsecured.
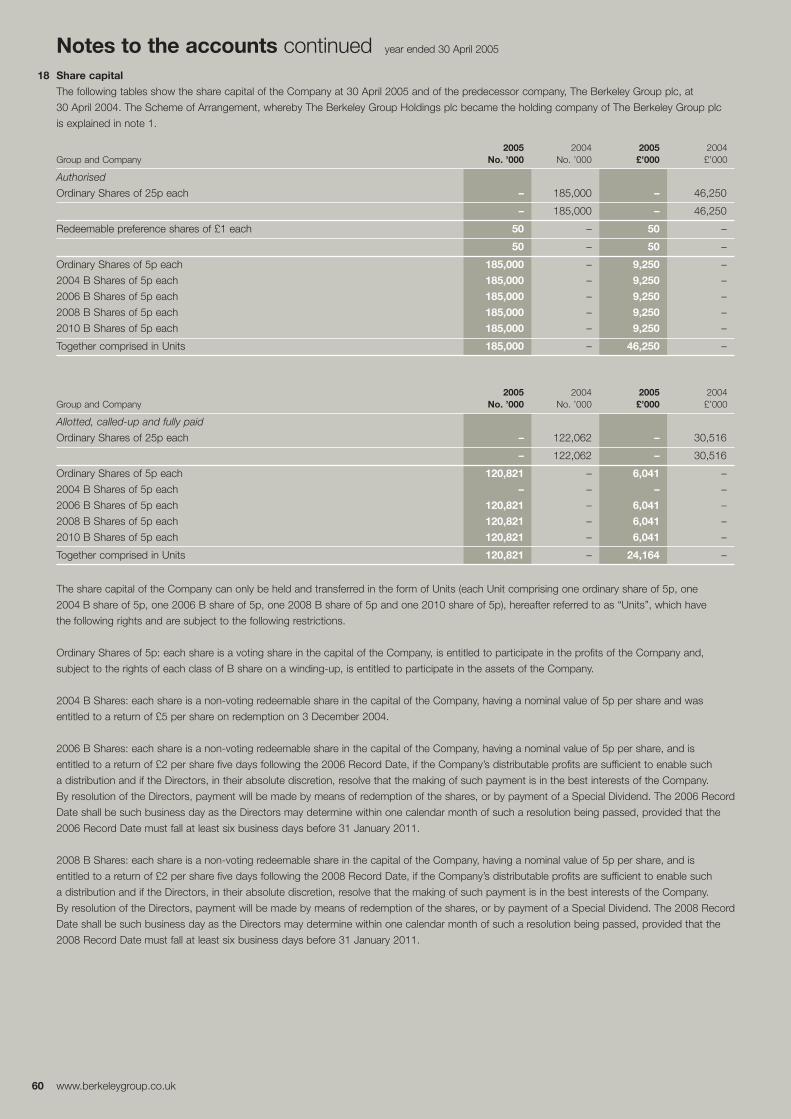
60 www.berkeleygroup.co.uk
Notes to the accounts continued year ended 30 April 2005
18 Share capital
The following tables show the share capital of the Company at 30 April 2005 and of the predecessor company, The Berkeley Group plc, at
30 April 2004. The Scheme of Arrangement, whereby The Berkeley Group Holdings plc became the holding company of The Berkeley Group plc
is explained in note 1.
2005 2004 2005 2004Group and Company No. ’000 No. ’000 £’000 £’000
Authorised
Ordinary Shares of 25p each – 185,000 – 46,250
– 185,000 – 46,250
Redeemable preference shares of £1 each 50 – 50 –
50 – 50 –
Ordinary Shares of 5p each 185,000 – 9,250 –
2004 B Shares of 5p each 185,000 – 9,250 –
2006 B Shares of 5p each 185,000 – 9,250 –
2008 B Shares of 5p each 185,000 – 9,250 –
2010 B Shares of 5p each 185,000 – 9,250 –
Together comprised in Units 185,000 – 46,250 –
2005 2004 2005 2004Group and Company No. ’000 No. ’000 £’000 £’000
Allotted, called-up and fully paid
Ordinary Shares of 25p each – 122,062 – 30,516
– 122,062 – 30,516
Ordinary Shares of 5p each 120,821 – 6,041 –
2004 B Shares of 5p each – – – –
2006 B Shares of 5p each 120,821 – 6,041 –
2008 B Shares of 5p each 120,821 – 6,041 –
2010 B Shares of 5p each 120,821 – 6,041 –
Together comprised in Units 120,821 – 24,164 –
The share capital of the Company can only be held and transferred in the form of Units (each Unit comprising one ordinary share of 5p, one
2004 B share of 5p, one 2006 B share of 5p, one 2008 B share of 5p and one 2010 share of 5p), hereafter referred to as “Units”, which have
the following rights and are subject to the following restrictions.
Ordinary Shares of 5p: each share is a voting share in the capital of the Company, is entitled to participate in the profits of the Company and,
subject to the rights of each class of B share on a winding-up, is entitled to participate in the assets of the Company.
2004 B Shares: each share is a non-voting redeemable share in the capital of the Company, having a nominal value of 5p per share and was
entitled to a return of £5 per share on redemption on 3 December 2004.
2006 B Shares: each share is a non-voting redeemable share in the capital of the Company, having a nominal value of 5p per share, and is
entitled to a return of £2 per share five days following the 2006 Record Date, if the Company’s distributable profits are sufficient to enable such
a distribution and if the Directors, in their absolute discretion, resolve that the making of such payment is in the best interests of the Company.
By resolution of the Directors, payment will be made by means of redemption of the shares, or by payment of a Special Dividend. The 2006 Record
Date shall be such business day as the Directors may determine within one calendar month of such a resolution being passed, provided that the
2006 Record Date must fall at least six business days before 31 January 2011.
2008 B Shares: each share is a non-voting redeemable share in the capital of the Company, having a nominal value of 5p per share, and is
entitled to a return of £2 per share five days following the 2008 Record Date, if the Company’s distributable profits are sufficient to enable such
a distribution and if the Directors, in their absolute discretion, resolve that the making of such payment is in the best interests of the Company.
By resolution of the Directors, payment will be made by means of redemption of the shares, or by payment of a Special Dividend. The 2008 Record
Date shall be such business day as the Directors may determine within one calendar month of such a resolution being passed, provided that the
2008 Record Date must fall at least six business days before 31 January 2011.
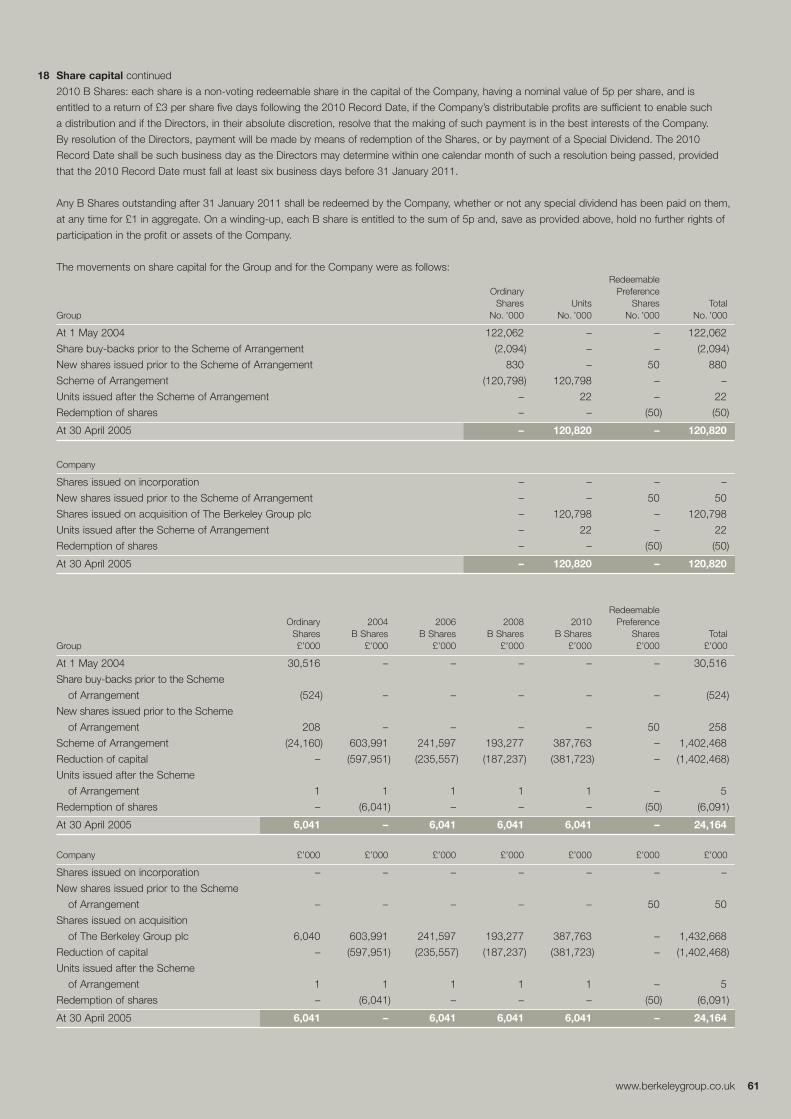
www.berkeleygroup.co.uk 61
18 Share capital continued
2010 B Shares: each share is a non-voting redeemable share in the capital of the Company, having a nominal value of 5p per share, and is
entitled to a return of £3 per share five days following the 2010 Record Date, if the Company’s distributable profits are sufficient to enable such
a distribution and if the Directors, in their absolute discretion, resolve that the making of such payment is in the best interests of the Company.
By resolution of the Directors, payment will be made by means of redemption of the Shares, or by payment of a Special Dividend. The 2010
Record Date shall be such business day as the Directors may determine within one calendar month of such a resolution being passed, provided
that the 2010 Record Date must fall at least six business days before 31 January 2011.
Any B Shares outstanding after 31 January 2011 shall be redeemed by the Company, whether or not any special dividend has been paid on them,
at any time for £1 in aggregate. On a winding-up, each B share is entitled to the sum of 5p and, save as provided above, hold no further rights of
participation in the profit or assets of the Company.
The movements on share capital for the Group and for the Company were as follows:Redeemable
Ordinary PreferenceShares Units Shares Total
Group No. ’000 No. ’000 No. ’000 No. ’000
At 1 May 2004 122,062 – – 122,062
Share buy-backs prior to the Scheme of Arrangement (2,094) – – (2,094)
New shares issued prior to the Scheme of Arrangement 830 – 50 880
Scheme of Arrangement (120,798) 120,798 – –
Units issued after the Scheme of Arrangement – 22 – 22
Redemption of shares – – (50) (50)
At 30 April 2005 – 120,820 – 120,820
Company
Shares issued on incorporation – – – –
New shares issued prior to the Scheme of Arrangement – – 50 50
Shares issued on acquisition of The Berkeley Group plc – 120,798 – 120,798
Units issued after the Scheme of Arrangement – 22 – 22
Redemption of shares – – (50) (50)
At 30 April 2005 – 120,820 – 120,820
RedeemableOrdinary 2004 2006 2008 2010 Preference
Shares B Shares B Shares B Shares B Shares Shares TotalGroup £’000 £’000 £’000 £’000 £’000 £’000 £’000
At 1 May 2004 30,516 – – – – – 30,516
Share buy-backs prior to the Scheme
of Arrangement (524) – – – – – (524)
New shares issued prior to the Scheme
of Arrangement 208 – – – – 50 258
Scheme of Arrangement (24,160) 603,991 241,597 193,277 387,763 – 1,402,468
Reduction of capital – (597,951) (235,557) (187,237) (381,723) – (1,402,468)
Units issued after the Scheme
of Arrangement 1 1 1 1 1 – 5
Redemption of shares – (6,041) – – – (50) (6,091)
At 30 April 2005 6,041 – 6,041 6,041 6,041 – 24,164
Company £’000 £’000 £’000 £’000 £’000 £’000 £’000
Shares issued on incorporation – – – – – – –
New shares issued prior to the Scheme
of Arrangement – – – – – 50 50
Shares issued on acquisition
of The Berkeley Group plc 6,040 603,991 241,597 193,277 387,763 – 1,432,668
Reduction of capital – (597,951) (235,557) (187,237) (381,723) – (1,402,468)
Units issued after the Scheme
of Arrangement 1 1 1 1 1 – 5
Redemption of shares – (6,041) – – – (50) (6,091)
At 30 April 2005 6,041 – 6,041 6,041 6,041 – 24,164
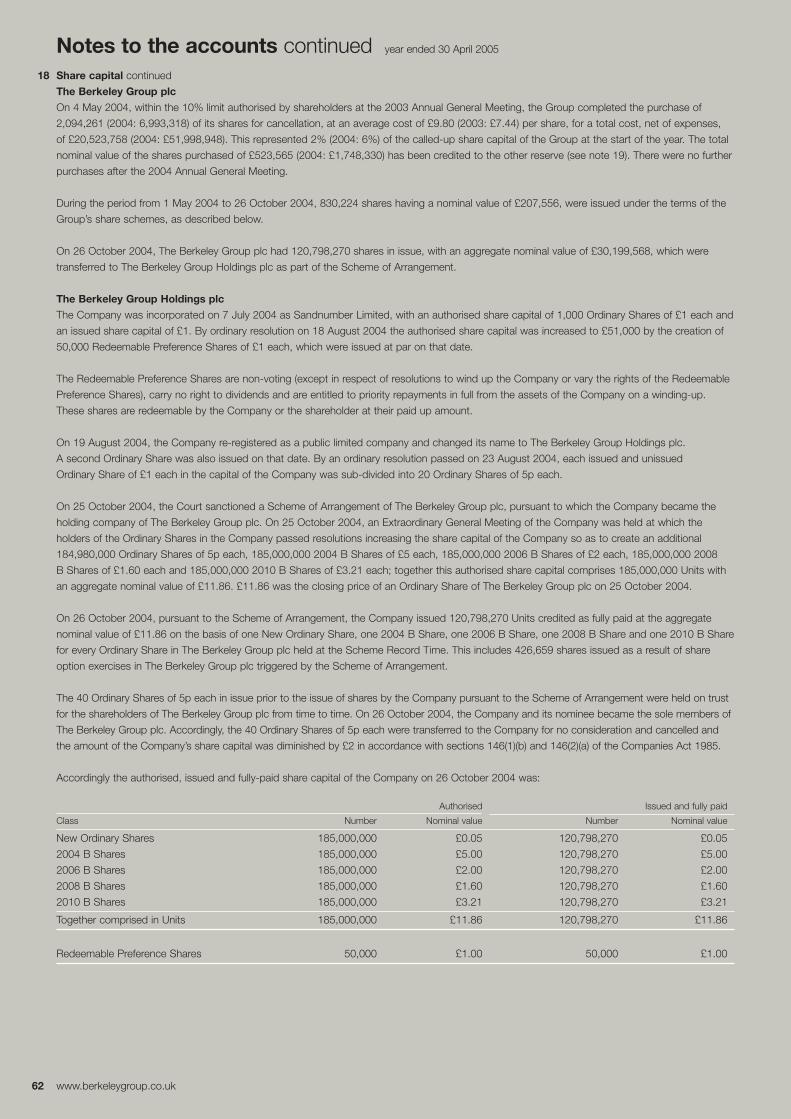
62 www.berkeleygroup.co.uk
Notes to the accounts continued year ended 30 April 2005
18 Share capital continued
The Berkeley Group plc
On 4 May 2004, within the 10% limit authorised by shareholders at the 2003 Annual General Meeting, the Group completed the purchase of
2,094,261 (2004: 6,993,318) of its shares for cancellation, at an average cost of £9.80 (2003: £7.44) per share, for a total cost, net of expenses,
of £20,523,758 (2004: £51,998,948). This represented 2% (2004: 6%) of the called-up share capital of the Group at the start of the year. The total
nominal value of the shares purchased of £523,565 (2004: £1,748,330) has been credited to the other reserve (see note 19). There were no further
purchases after the 2004 Annual General Meeting.
During the period from 1 May 2004 to 26 October 2004, 830,224 shares having a nominal value of £207,556, were issued under the terms of the
Group’s share schemes, as described below.
On 26 October 2004, The Berkeley Group plc had 120,798,270 shares in issue, with an aggregate nominal value of £30,199,568, which were
transferred to The Berkeley Group Holdings plc as part of the Scheme of Arrangement.
The Berkeley Group Holdings plc
The Company was incorporated on 7 July 2004 as Sandnumber Limited, with an authorised share capital of 1,000 Ordinary Shares of £1 each and
an issued share capital of £1. By ordinary resolution on 18 August 2004 the authorised share capital was increased to £51,000 by the creation of
50,000 Redeemable Preference Shares of £1 each, which were issued at par on that date.
The Redeemable Preference Shares are non-voting (except in respect of resolutions to wind up the Company or vary the rights of the Redeemable
Preference Shares), carry no right to dividends and are entitled to priority repayments in full from the assets of the Company on a winding-up.
These shares are redeemable by the Company or the shareholder at their paid up amount.
On 19 August 2004, the Company re-registered as a public limited company and changed its name to The Berkeley Group Holdings plc.
A second Ordinary Share was also issued on that date. By an ordinary resolution passed on 23 August 2004, each issued and unissued
Ordinary Share of £1 each in the capital of the Company was sub-divided into 20 Ordinary Shares of 5p each.
On 25 October 2004, the Court sanctioned a Scheme of Arrangement of The Berkeley Group plc, pursuant to which the Company became the
holding company of The Berkeley Group plc. On 25 October 2004, an Extraordinary General Meeting of the Company was held at which the
holders of the Ordinary Shares in the Company passed resolutions increasing the share capital of the Company so as to create an additional
184,980,000 Ordinary Shares of 5p each, 185,000,000 2004 B Shares of £5 each, 185,000,000 2006 B Shares of £2 each, 185,000,000 2008
B Shares of £1.60 each and 185,000,000 2010 B Shares of £3.21 each; together this authorised share capital comprises 185,000,000 Units with
an aggregate nominal value of £11.86. £11.86 was the closing price of an Ordinary Share of The Berkeley Group plc on 25 October 2004.
On 26 October 2004, pursuant to the Scheme of Arrangement, the Company issued 120,798,270 Units credited as fully paid at the aggregate
nominal value of £11.86 on the basis of one New Ordinary Share, one 2004 B Share, one 2006 B Share, one 2008 B Share and one 2010 B Share
for every Ordinary Share in The Berkeley Group plc held at the Scheme Record Time. This includes 426,659 shares issued as a result of share
option exercises in The Berkeley Group plc triggered by the Scheme of Arrangement.
The 40 Ordinary Shares of 5p each in issue prior to the issue of shares by the Company pursuant to the Scheme of Arrangement were held on trust
for the shareholders of The Berkeley Group plc from time to time. On 26 October 2004, the Company and its nominee became the sole members of
The Berkeley Group plc. Accordingly, the 40 Ordinary Shares of 5p each were transferred to the Company for no consideration and cancelled and
the amount of the Company’s share capital was diminished by £2 in accordance with sections 146(1)(b) and 146(2)(a) of the Companies Act 1985.
Accordingly the authorised, issued and fully-paid share capital of the Company on 26 October 2004 was:
Authorised Issued and fully paid
Class Number Nominal value Number Nominal value
New Ordinary Shares 185,000,000 £0.05 120,798,270 £0.05
2004 B Shares 185,000,000 £5.00 120,798,270 £5.00
2006 B Shares 185,000,000 £2.00 120,798,270 £2.00
2008 B Shares 185,000,000 £1.60 120,798,270 £1.60
2010 B Shares 185,000,000 £3.21 120,798,270 £3.21
Together comprised in Units 185,000,000 £11.86 120,798,270 £11.86
Redeemable Preference Shares 50,000 £1.00 50,000 £1.00
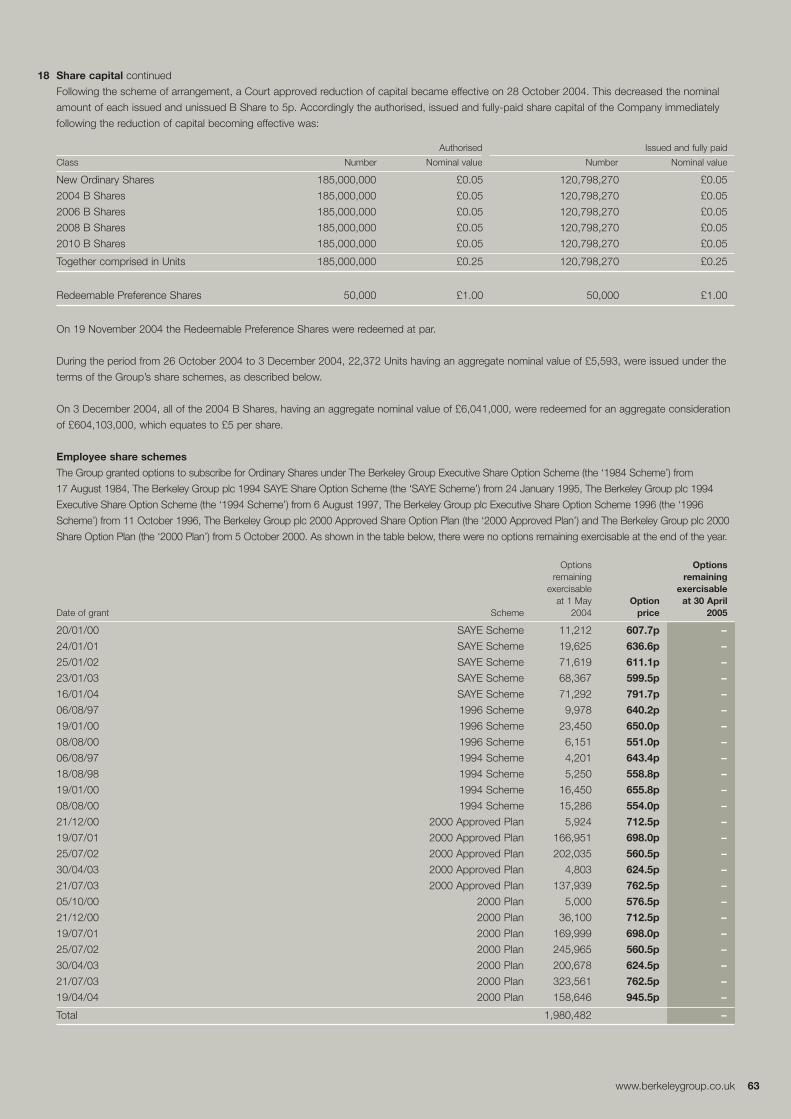
www.berkeleygroup.co.uk 63
18 Share capital continued
Following the scheme of arrangement, a Court approved reduction of capital became effective on 28 October 2004. This decreased the nominal
amount of each issued and unissued B Share to 5p. Accordingly the authorised, issued and fully-paid share capital of the Company immediately
following the reduction of capital becoming effective was:
Authorised Issued and fully paid
Class Number Nominal value Number Nominal value
New Ordinary Shares 185,000,000 £0.05 120,798,270 £0.05
2004 B Shares 185,000,000 £0.05 120,798,270 £0.05
2006 B Shares 185,000,000 £0.05 120,798,270 £0.05
2008 B Shares 185,000,000 £0.05 120,798,270 £0.05
2010 B Shares 185,000,000 £0.05 120,798,270 £0.05
Together comprised in Units 185,000,000 £0.25 120,798,270 £0.25
Redeemable Preference Shares 50,000 £1.00 50,000 £1.00
On 19 November 2004 the Redeemable Preference Shares were redeemed at par.
During the period from 26 October 2004 to 3 December 2004, 22,372 Units having an aggregate nominal value of £5,593, were issued under the
terms of the Group’s share schemes, as described below.
On 3 December 2004, all of the 2004 B Shares, having an aggregate nominal value of £6,041,000, were redeemed for an aggregate consideration
of £604,103,000, which equates to £5 per share.
Employee share schemes
The Group granted options to subscribe for Ordinary Shares under The Berkeley Group Executive Share Option Scheme (the ‘1984 Scheme’) from
17 August 1984, The Berkeley Group plc 1994 SAYE Share Option Scheme (the ‘SAYE Scheme’) from 24 January 1995, The Berkeley Group plc 1994
Executive Share Option Scheme (the ‘1994 Scheme’) from 6 August 1997, The Berkeley Group plc Executive Share Option Scheme 1996 (the ‘1996
Scheme’) from 11 October 1996, The Berkeley Group plc 2000 Approved Share Option Plan (the ‘2000 Approved Plan’) and The Berkeley Group plc 2000
Share Option Plan (the ‘2000 Plan’) from 5 October 2000. As shown in the table below, there were no options remaining exercisable at the end of the year.
Options Optionsremaining remaining
exercisable exercisableat 1 May Option at 30 April
Date of grant Scheme 2004 price 2005
20/01/00 SAYE Scheme 11,212 607.7p –
24/01/01 SAYE Scheme 19,625 636.6p –
25/01/02 SAYE Scheme 71,619 611.1p –
23/01/03 SAYE Scheme 68,367 599.5p –
16/01/04 SAYE Scheme 71,292 791.7p –
06/08/97 1996 Scheme 9,978 640.2p –
19/01/00 1996 Scheme 23,450 650.0p –
08/08/00 1996 Scheme 6,151 551.0p –
06/08/97 1994 Scheme 4,201 643.4p –
18/08/98 1994 Scheme 5,250 558.8p –
19/01/00 1994 Scheme 16,450 655.8p –
08/08/00 1994 Scheme 15,286 554.0p –
21/12/00 2000 Approved Plan 5,924 712.5p –
19/07/01 2000 Approved Plan 166,951 698.0p –
25/07/02 2000 Approved Plan 202,035 560.5p –
30/04/03 2000 Approved Plan 4,803 624.5p –
21/07/03 2000 Approved Plan 137,939 762.5p –
05/10/00 2000 Plan 5,000 576.5p –
21/12/00 2000 Plan 36,100 712.5p –
19/07/01 2000 Plan 169,999 698.0p –
25/07/02 2000 Plan 245,965 560.5p –
30/04/03 2000 Plan 200,678 624.5p –
21/07/03 2000 Plan 323,561 762.5p –
19/04/04 2000 Plan 158,646 945.5p –
Total 1,980,482 –
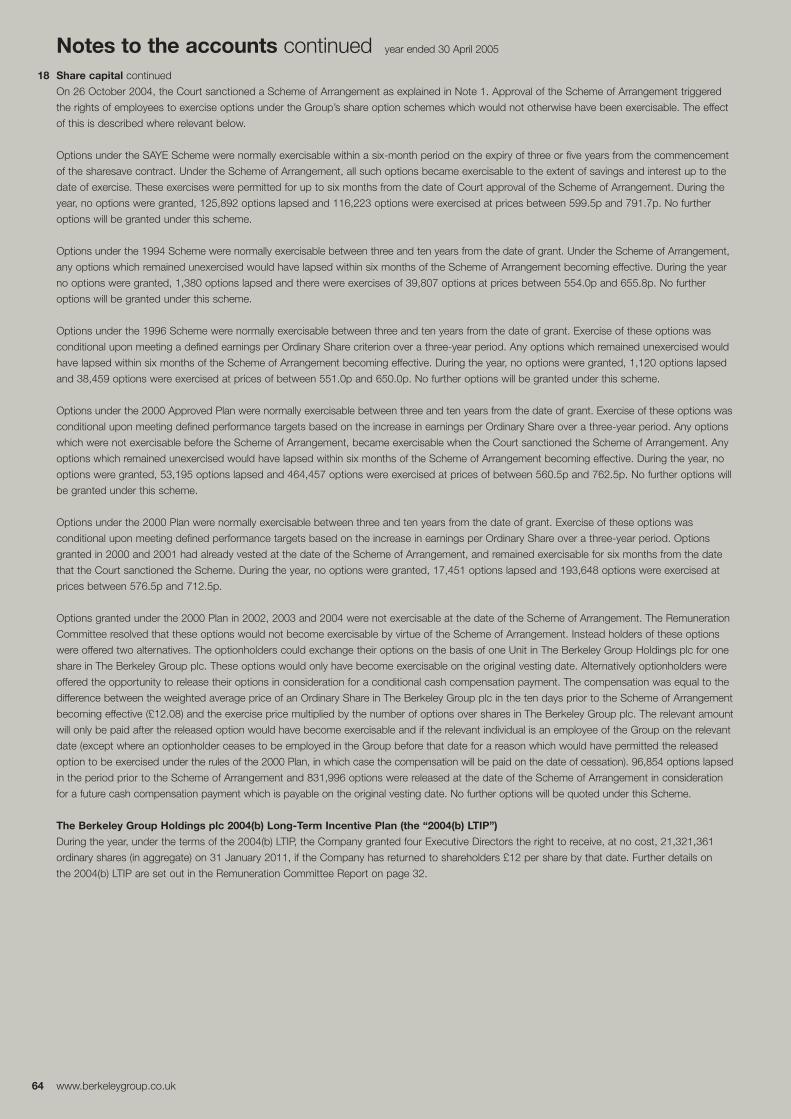
64 www.berkeleygroup.co.uk
Notes to the accounts continued year ended 30 April 2005
18 Share capital continued
On 26 October 2004, the Court sanctioned a Scheme of Arrangement as explained in Note 1. Approval of the Scheme of Arrangement triggered
the rights of employees to exercise options under the Group’s share option schemes which would not otherwise have been exercisable. The effect
of this is described where relevant below.
Options under the SAYE Scheme were normally exercisable within a six-month period on the expiry of three or five years from the commencement
of the sharesave contract. Under the Scheme of Arrangement, all such options became exercisable to the extent of savings and interest up to the
date of exercise. These exercises were permitted for up to six months from the date of Court approval of the Scheme of Arrangement. During the
year, no options were granted, 125,892 options lapsed and 116,223 options were exercised at prices between 599.5p and 791.7p. No further
options will be granted under this scheme.
Options under the 1994 Scheme were normally exercisable between three and ten years from the date of grant. Under the Scheme of Arrangement,
any options which remained unexercised would have lapsed within six months of the Scheme of Arrangement becoming effective. During the year
no options were granted, 1,380 options lapsed and there were exercises of 39,807 options at prices between 554.0p and 655.8p. No further
options will be granted under this scheme.
Options under the 1996 Scheme were normally exercisable between three and ten years from the date of grant. Exercise of these options was
conditional upon meeting a defined earnings per Ordinary Share criterion over a three-year period. Any options which remained unexercised would
have lapsed within six months of the Scheme of Arrangement becoming effective. During the year, no options were granted, 1,120 options lapsed
and 38,459 options were exercised at prices of between 551.0p and 650.0p. No further options will be granted under this scheme.
Options under the 2000 Approved Plan were normally exercisable between three and ten years from the date of grant. Exercise of these options was
conditional upon meeting defined performance targets based on the increase in earnings per Ordinary Share over a three-year period. Any options
which were not exercisable before the Scheme of Arrangement, became exercisable when the Court sanctioned the Scheme of Arrangement. Any
options which remained unexercised would have lapsed within six months of the Scheme of Arrangement becoming effective. During the year, no
options were granted, 53,195 options lapsed and 464,457 options were exercised at prices of between 560.5p and 762.5p. No further options will
be granted under this scheme.
Options under the 2000 Plan were normally exercisable between three and ten years from the date of grant. Exercise of these options was
conditional upon meeting defined performance targets based on the increase in earnings per Ordinary Share over a three-year period. Options
granted in 2000 and 2001 had already vested at the date of the Scheme of Arrangement, and remained exercisable for six months from the date
that the Court sanctioned the Scheme. During the year, no options were granted, 17,451 options lapsed and 193,648 options were exercised at
prices between 576.5p and 712.5p.
Options granted under the 2000 Plan in 2002, 2003 and 2004 were not exercisable at the date of the Scheme of Arrangement. The Remuneration
Committee resolved that these options would not become exercisable by virtue of the Scheme of Arrangement. Instead holders of these options
were offered two alternatives. The optionholders could exchange their options on the basis of one Unit in The Berkeley Group Holdings plc for one
share in The Berkeley Group plc. These options would only have become exercisable on the original vesting date. Alternatively optionholders were
offered the opportunity to release their options in consideration for a conditional cash compensation payment. The compensation was equal to the
difference between the weighted average price of an Ordinary Share in The Berkeley Group plc in the ten days prior to the Scheme of Arrangement
becoming effective (£12.08) and the exercise price multiplied by the number of options over shares in The Berkeley Group plc. The relevant amount
will only be paid after the released option would have become exercisable and if the relevant individual is an employee of the Group on the relevant
date (except where an optionholder ceases to be employed in the Group before that date for a reason which would have permitted the released
option to be exercised under the rules of the 2000 Plan, in which case the compensation will be paid on the date of cessation). 96,854 options lapsed
in the period prior to the Scheme of Arrangement and 831,996 options were released at the date of the Scheme of Arrangement in consideration
for a future cash compensation payment which is payable on the original vesting date. No further options will be quoted under this Scheme.
The Berkeley Group Holdings plc 2004(b) Long-Term Incentive Plan (the “2004(b) LTIP”)
During the year, under the terms of the 2004(b) LTIP, the Company granted four Executive Directors the right to receive, at no cost, 21,321,361
ordinary shares (in aggregate) on 31 January 2011, if the Company has returned to shareholders £12 per share by that date. Further details on
the 2004(b) LTIP are set out in the Remuneration Committee Report on page 32.
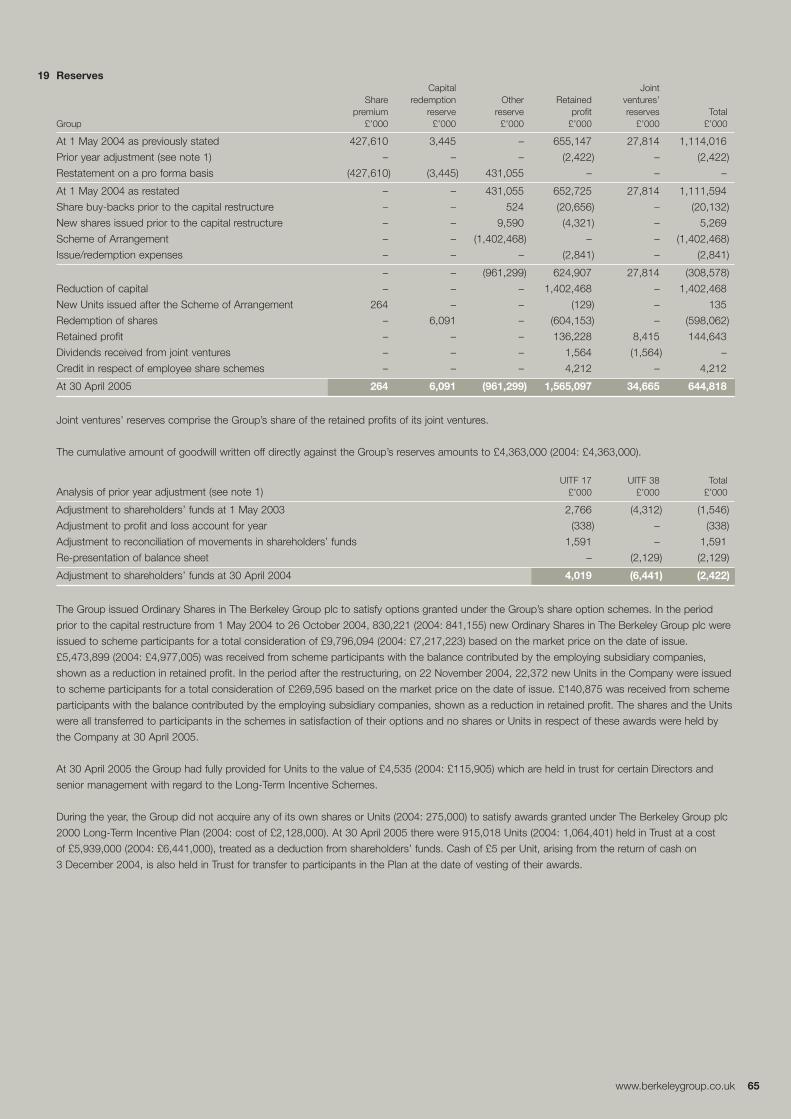
www.berkeleygroup.co.uk 65
19 ReservesCapital Joint
Share redemption Other Retained ventures’premium reserve reserve profit reserves Total
Group £’000 £’000 £’000 £’000 £’000 £’000
At 1 May 2004 as previously stated 427,610 3,445 – 655,147 27,814 1,114,016
Prior year adjustment (see note 1) – – – (2,422) – (2,422)
Restatement on a pro forma basis (427,610) (3,445) 431,055 – – –
At 1 May 2004 as restated – – 431,055 652,725 27,814 1,111,594
Share buy-backs prior to the capital restructure – – 524 (20,656) – (20,132)
New shares issued prior to the capital restructure – – 9,590 (4,321) – 5,269
Scheme of Arrangement – – (1,402,468) – – (1,402,468)
Issue/redemption expenses – – – (2,841) – (2,841)
– – (961,299) 624,907 27,814 (308,578)
Reduction of capital – – – 1,402,468 – 1,402,468
New Units issued after the Scheme of Arrangement 264 – – (129) – 135
Redemption of shares – 6,091 – (604,153) – (598,062)
Retained profit – – – 136,228 8,415 144,643
Dividends received from joint ventures – – – 1,564 (1,564) –
Credit in respect of employee share schemes – – – 4,212 – 4,212
At 30 April 2005 264 6,091 (961,299) 1,565,097 34,665 644,818
Joint ventures’ reserves comprise the Group’s share of the retained profits of its joint ventures.
The cumulative amount of goodwill written off directly against the Group’s reserves amounts to £4,363,000 (2004: £4,363,000).
UITF 17 UITF 38 TotalAnalysis of prior year adjustment (see note 1) £’000 £’000 £’000
Adjustment to shareholders’ funds at 1 May 2003 2,766 (4,312) (1,546)
Adjustment to profit and loss account for year (338) – (338)
Adjustment to reconciliation of movements in shareholders’ funds 1,591 – 1,591
Re-presentation of balance sheet – (2,129) (2,129)
Adjustment to shareholders’ funds at 30 April 2004 4,019 (6,441) (2,422)
The Group issued Ordinary Shares in The Berkeley Group plc to satisfy options granted under the Group’s share option schemes. In the period
prior to the capital restructure from 1 May 2004 to 26 October 2004, 830,221 (2004: 841,155) new Ordinary Shares in The Berkeley Group plc were
issued to scheme participants for a total consideration of £9,796,094 (2004: £7,217,223) based on the market price on the date of issue.
£5,473,899 (2004: £4,977,005) was received from scheme participants with the balance contributed by the employing subsidiary companies,
shown as a reduction in retained profit. In the period after the restructuring, on 22 November 2004, 22,372 new Units in the Company were issued
to scheme participants for a total consideration of £269,595 based on the market price on the date of issue. £140,875 was received from scheme
participants with the balance contributed by the employing subsidiary companies, shown as a reduction in retained profit. The shares and the Units
were all transferred to participants in the schemes in satisfaction of their options and no shares or Units in respect of these awards were held by
the Company at 30 April 2005.
At 30 April 2005 the Group had fully provided for Units to the value of £4,535 (2004: £115,905) which are held in trust for certain Directors and
senior management with regard to the Long-Term Incentive Schemes.
During the year, the Group did not acquire any of its own shares or Units (2004: 275,000) to satisfy awards granted under The Berkeley Group plc
2000 Long-Term Incentive Plan (2004: cost of £2,128,000). At 30 April 2005 there were 915,018 Units (2004: 1,064,401) held in Trust at a cost
of £5,939,000 (2004: £6,441,000), treated as a deduction from shareholders’ funds. Cash of £5 per Unit, arising from the return of cash on
3 December 2004, is also held in Trust for transfer to participants in the Plan at the date of vesting of their awards.
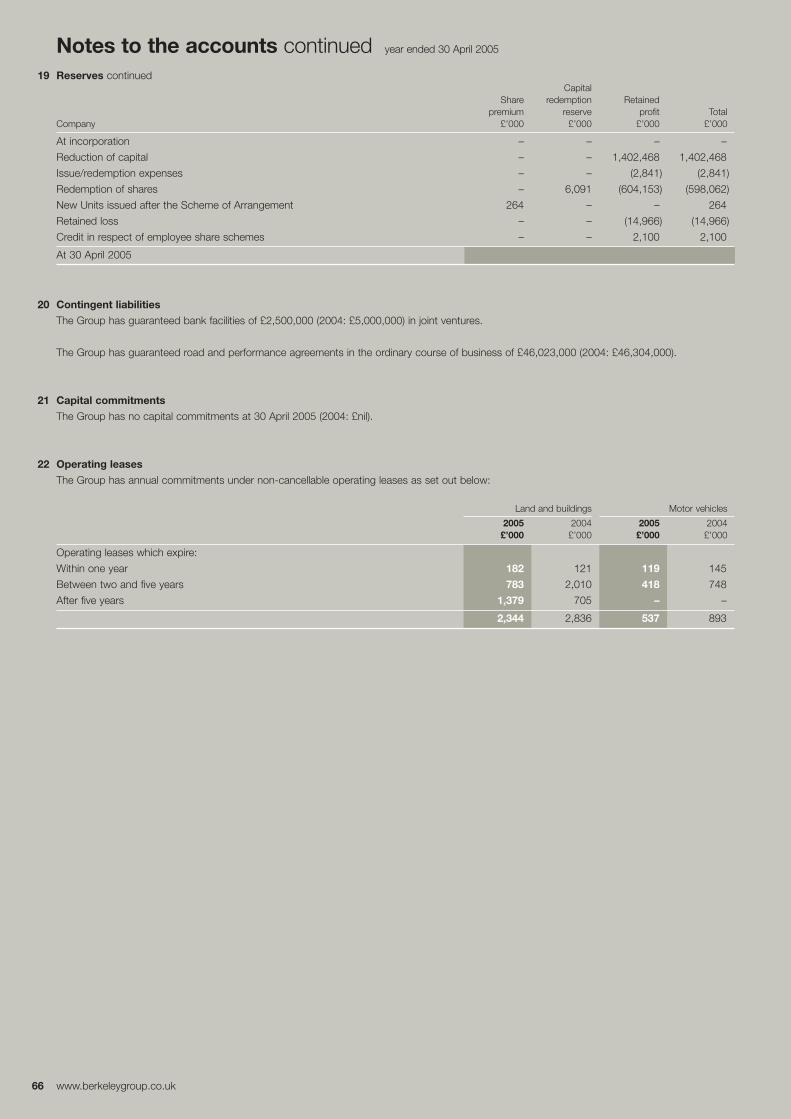
66 www.berkeleygroup.co.uk
Notes to the accounts continued year ended 30 April 2005
19 Reserves continuedCapital
Share redemption Retainedpremium reserve profit Total
Company £’000 £’000 £’000 £’000
At incorporation – – – –
Reduction of capital – – 1,402,468 1,402,468
Issue/redemption expenses – – (2,841) (2,841)
Redemption of shares – 6,091 (604,153) (598,062)
New Units issued after the Scheme of Arrangement 264 – – 264
Retained loss – – (14,966) (14,966)
Credit in respect of employee share schemes – – 2,100 2,100
At 30 April 2005 264 6,091 782,608 788,963
20 Contingent liabilities
The Group has guaranteed bank facilities of £2,500,000 (2004: £5,000,000) in joint ventures.
The Group has guaranteed road and performance agreements in the ordinary course of business of £46,023,000 (2004: £46,304,000).
21 Capital commitments
The Group has no capital commitments at 30 April 2005 (2004: £nil).
22 Operating leases
The Group has annual commitments under non-cancellable operating leases as set out below:
Land and buildings Motor vehicles
2005 2004 2005 2004£’000 £’000 £’000 £’000
Operating leases which expire:
Within one year 182 121 119 145
Between two and five years 783 2,010 418 748
After five years 1,379 705 – –
2,344 2,836 537 893
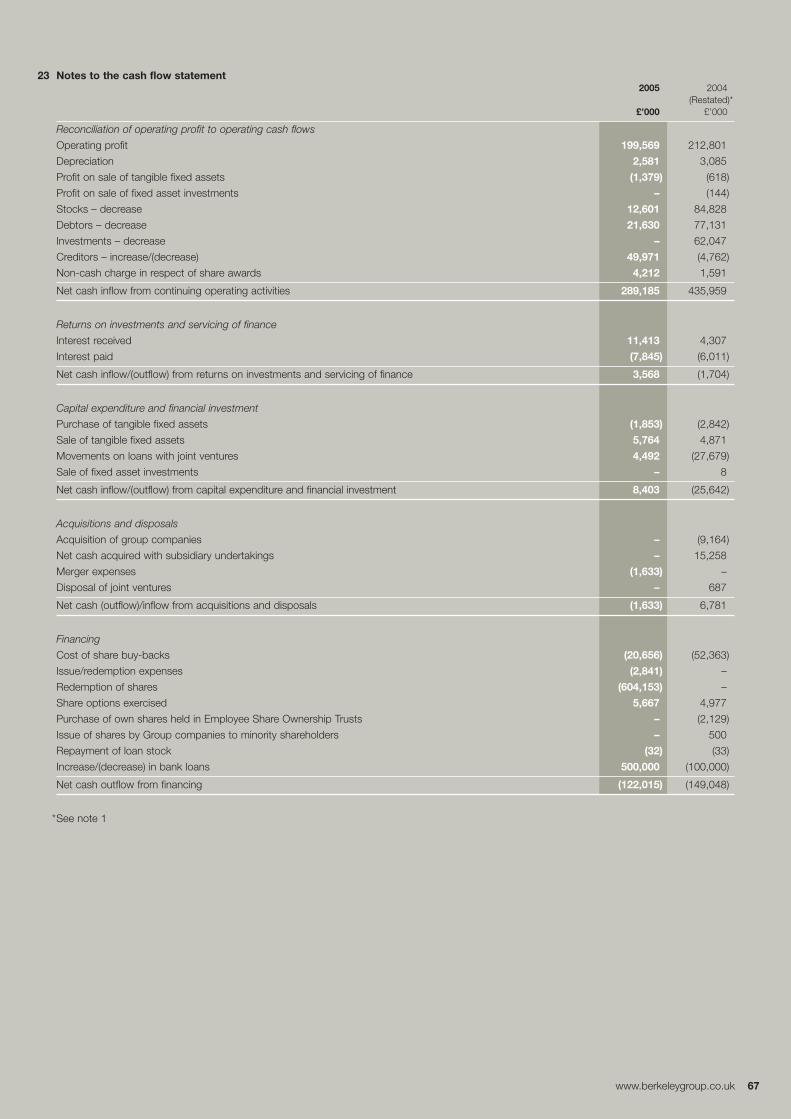
www.berkeleygroup.co.uk 67
23 Notes to the cash flow statement2005 2004
(Restated)*£’000 £’000
Reconciliation of operating profit to operating cash flows
Operating profit 199,569 212,801
Depreciation 2,581 3,085
Profit on sale of tangible fixed assets (1,379) (618)
Profit on sale of fixed asset investments – (144)
Stocks – decrease 12,601 84,828
Debtors – decrease 21,630 77,131
Investments – decrease – 62,047
Creditors – increase/(decrease) 49,971 (4,762)
Non-cash charge in respect of share awards 4,212 1,591
Net cash inflow from continuing operating activities 289,185 435,959
Returns on investments and servicing of finance
Interest received 11,413 4,307
Interest paid (7,845) (6,011)
Net cash inflow/(outflow) from returns on investments and servicing of finance 3,568 (1,704)
Capital expenditure and financial investment
Purchase of tangible fixed assets (1,853) (2,842)
Sale of tangible fixed assets 5,764 4,871
Movements on loans with joint ventures 4,492 (27,679)
Sale of fixed asset investments – 8
Net cash inflow/(outflow) from capital expenditure and financial investment 8,403 (25,642)
Acquisitions and disposals
Acquisition of group companies – (9,164)
Net cash acquired with subsidiary undertakings – 15,258
Merger expenses (1,633) –
Disposal of joint ventures – 687
Net cash (outflow)/inflow from acquisitions and disposals (1,633) 6,781
Financing
Cost of share buy-backs (20,656) (52,363)
Issue/redemption expenses (2,841) –
Redemption of shares (604,153) –
Share options exercised 5,667 4,977
Purchase of own shares held in Employee Share Ownership Trusts – (2,129)
Issue of shares by Group companies to minority shareholders – 500
Repayment of loan stock (32) (33)
Increase/(decrease) in bank loans 500,000 (100,000)
Net cash outflow from financing (122,015) (149,048)
*See note 1
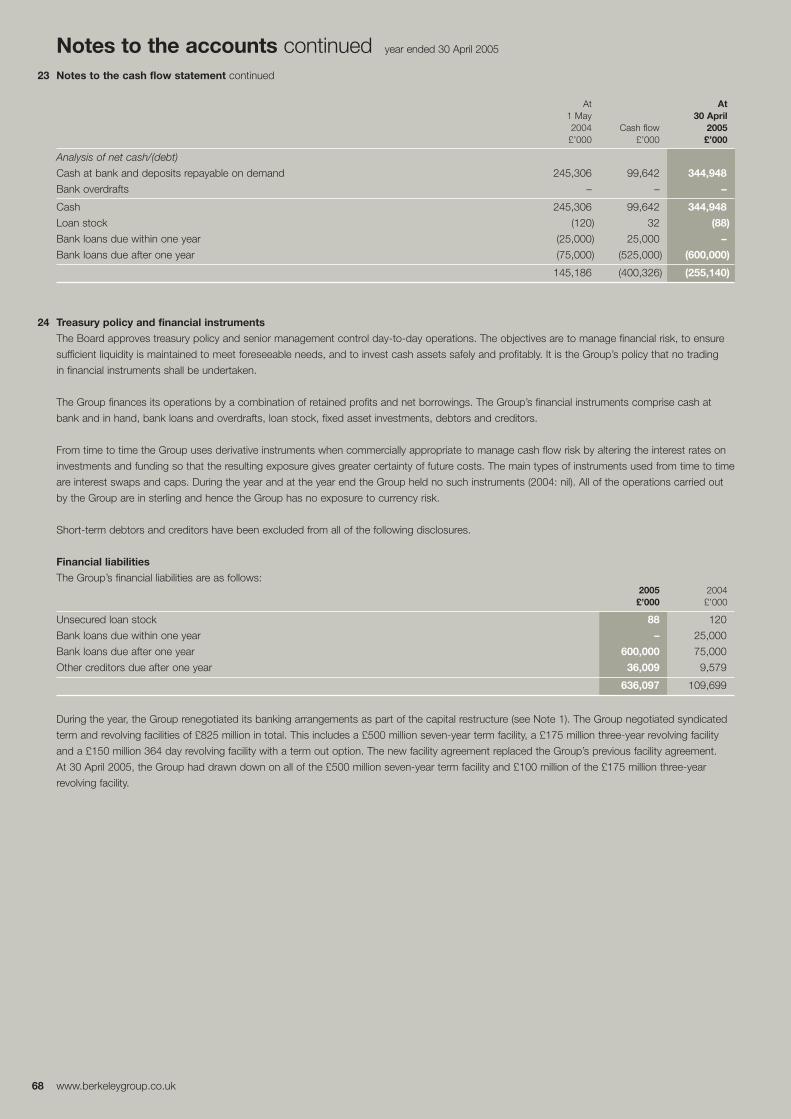
68 www.berkeleygroup.co.uk
Notes to the accounts continued year ended 30 April 2005
23 Notes to the cash flow statement continued
At At1 May 30 April2004 Cash flow 2005
£’000 £’000 £’000
Analysis of net cash/(debt)
Cash at bank and deposits repayable on demand 245,306 99,642 344,948
Bank overdrafts – – –
Cash 245,306 99,642 344,948
Loan stock (120) 32 (88)
Bank loans due within one year (25,000) 25,000 –
Bank loans due after one year (75,000) (525,000) (600,000)
145,186 (400,326) (255,140)
24 Treasury policy and financial instruments
The Board approves treasury policy and senior management control day-to-day operations. The objectives are to manage financial risk, to ensure
sufficient liquidity is maintained to meet foreseeable needs, and to invest cash assets safely and profitably. It is the Group’s policy that no trading
in financial instruments shall be undertaken.
The Group finances its operations by a combination of retained profits and net borrowings. The Group’s financial instruments comprise cash at
bank and in hand, bank loans and overdrafts, loan stock, fixed asset investments, debtors and creditors.
From time to time the Group uses derivative instruments when commercially appropriate to manage cash flow risk by altering the interest rates on
investments and funding so that the resulting exposure gives greater certainty of future costs. The main types of instruments used from time to time
are interest swaps and caps. During the year and at the year end the Group held no such instruments (2004: nil). All of the operations carried out
by the Group are in sterling and hence the Group has no exposure to currency risk.
Short-term debtors and creditors have been excluded from all of the following disclosures.
Financial liabilities
The Group’s financial liabilities are as follows:2005 2004 £’000 £’000
Unsecured loan stock 88 120
Bank loans due within one year – 25,000
Bank loans due after one year 600,000 75,000
Other creditors due after one year 36,009 9,579
636,097 109,699
During the year, the Group renegotiated its banking arrangements as part of the capital restructure (see Note 1). The Group negotiated syndicated
term and revolving facilities of £825 million in total. This includes a £500 million seven-year term facility, a £175 million three-year revolving facility
and a £150 million 364 day revolving facility with a term out option. The new facility agreement replaced the Group’s previous facility agreement.
At 30 April 2005, the Group had drawn down on all of the £500 million seven-year term facility and £100 million of the £175 million three-year
revolving facility.
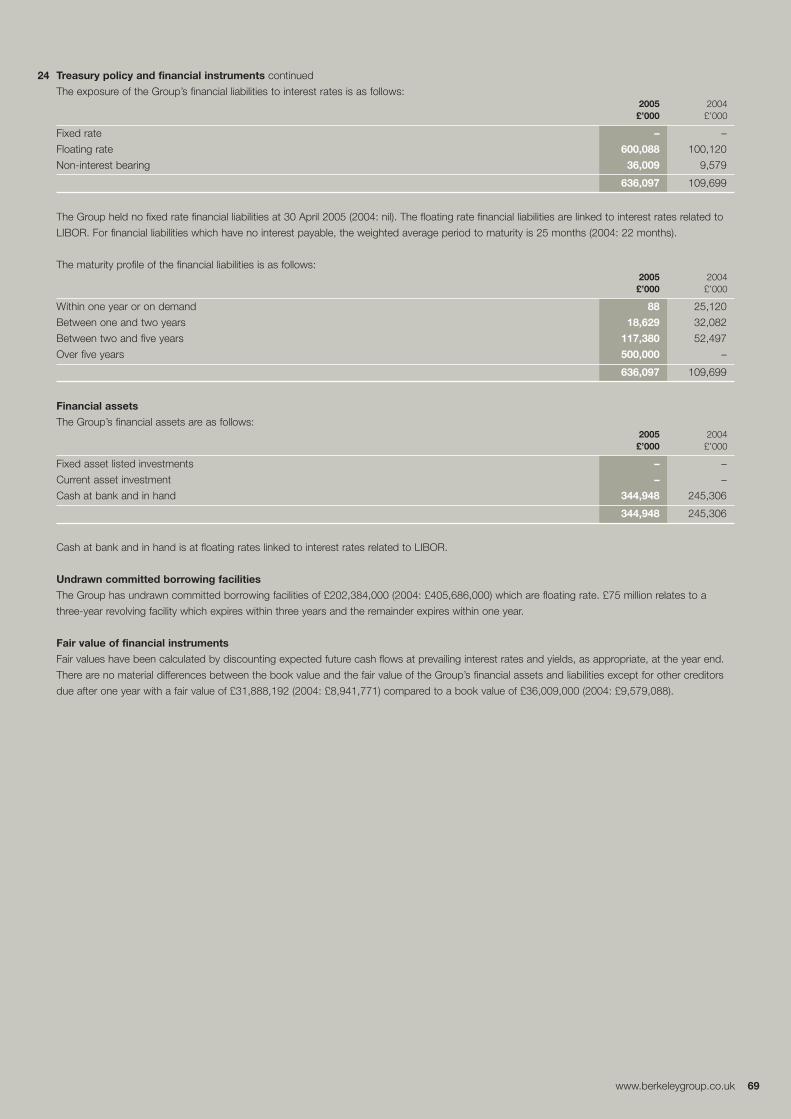
www.berkeleygroup.co.uk 69
24 Treasury policy and financial instruments continued
The exposure of the Group’s financial liabilities to interest rates is as follows:2005 2004£’000 £’000
Fixed rate – –
Floating rate 600,088 100,120
Non-interest bearing 36,009 9,579
636,097 109,699
The Group held no fixed rate financial liabilities at 30 April 2005 (2004: nil). The floating rate financial liabilities are linked to interest rates related to
LIBOR. For financial liabilities which have no interest payable, the weighted average period to maturity is 25 months (2004: 22 months).
The maturity profile of the financial liabilities is as follows:2005 2004£’000 £’000
Within one year or on demand 88 25,120
Between one and two years 18,629 32,082
Between two and five years 117,380 52,497
Over five years 500,000 –
636,097 109,699
Financial assets
The Group’s financial assets are as follows:2005 2004£’000 £’000
Fixed asset listed investments – –
Current asset investment – –
Cash at bank and in hand 344,948 245,306
344,948 245,306
Cash at bank and in hand is at floating rates linked to interest rates related to LIBOR.
Undrawn committed borrowing facilities
The Group has undrawn committed borrowing facilities of £202,384,000 (2004: £405,686,000) which are floating rate. £75 million relates to a
three-year revolving facility which expires within three years and the remainder expires within one year.
Fair value of financial instruments
Fair values have been calculated by discounting expected future cash flows at prevailing interest rates and yields, as appropriate, at the year end.
There are no material differences between the book value and the fair value of the Group’s financial assets and liabilities except for other creditors
due after one year with a fair value of £31,888,192 (2004: £8,941,771) compared to a book value of £36,009,000 (2004: £9,579,088).

70 www.berkeleygroup.co.uk
Notes to the accounts continued year ended 30 April 2005
25 Related party transactions
The Group has entered into the following related party transactions:
a) Charges made for goods and services supplied to joint ventures
During the year £2,189,000 (2004: £2,737,000) was paid to joint ventures for goods and services supplied.
b) Transactions with Directors
During the financial year, Mr A W Pidgley paid £644,000 to Berkeley Homes plc for works carried out at his home, and Mr R C Perrins paid
£35,000 to Berkeley Homes plc for works carried out at his home, under the Group’s own build scheme. This is a scheme whereby eligible
employees may enter into an arrangement with the Group for the construction or renovation of their own home. There were no balances
outstanding at the year end.
26 Post balance sheet events
Disposal of The Crosby Group plc and its subsidiaries (“Crosby”)
On 23 June 2005, the Company announced that it had entered into an unconditional agreement with Lend Lease Corporation Limited
(“Lend Lease”) for the sale of Crosby. The sale completed on 8 July 2005.
Terms of the disposal
The consideration comprises in aggregate £235.7 million in respect of the Crosby A Shares held by the Group including the repayment of the
inter-company indebtedness owned to Berkeley by Crosby at 30 April 2005. In addition, the Group will be repaid £15 million in respect of working
capital provided to Crosby since 30 April 2005.
Under the agreement the Group has entered into normal warranties and indemnities. In addition, it has entered into various covenants including an
undertaking restricting the number of developments it can undertake in Birmingham, Leeds and Manchester.
Background to the transaction
Following the strategic review reported on 26 June 2003 the board of Berkeley decided to concentrate on increasingly complex mixed-use urban
regeneration projects in London and Southern England. The management of Crosby proposed maximising the value of the assets within Crosby
and incentivising them by acquiring a shareholding in Crosby. At this time Crosby was a wholly owned subsidiary of Berkeley.
On 27 August 2003, Berkeley entered into an agreement whereby the Crosby Managers, led by Geoff Hutchinson, subscribed for newly issued
shares in Crosby (“Crosby B Shares”) for a consideration of £500,000, funded by a loan from Berkeley (together “the Crosby transaction”).
Following this subscription the share capital of Crosby comprised Crosby A Shares, held by Berkeley, and Crosby B Shares, held by the Crosby
Managers. Berkeley retained control of Crosby through its holding of Crosby A Shares and continued to consolidate Crosby as a subsidiary. Under
the terms of the Crosby Transaction, Crosby had to make agreed milestone payments to Berkeley every six months and generate in aggregate
£450 million of operating cashflow within seven years of the date of the subscription.
It was agreed that if these two criteria were met, the Crosby B Shares are broadly entitled to 50.01% of the economic and voting rights of Crosby.
In addition, Berkeley would retain voting control of Crosby until the gross assets and net assets of Crosby fall below £75 million and £50 million,
respectively, at which point voting control of Crosby passes to the Crosby Managers and Crosby ceases to be consolidated by the Group.
The sale of Crosby B Shares to Lend Lease is outside the control of the Group and has been the subject of separate negotiation between the
Crosby Managers and Lend Lease. Upon receipt of the consideration of the sale of their Crosby B Shares to Lend Lease for £10 million, the Crosby
Managers will repay to the Group the £500,000 loan mentioned above. As part of the Disposal, Berkeley and the Crosby Managers will enter into
a Termination Deed, pursuant to which the arrangements put in place at the time of the Crosby Transaction will be terminated.
The operating results of Crosby for the years ended 30 April 2004 and 2005 are set out in note 3 of these financial statements.
www.berkeleygroup.co.uk 71
27 Subsidiaries, joint ventures and limited partnership
At 30 April 2005 the Group had the following principal subsidiary undertakings which have all been consolidated, are registered and operate in
England and Wales, and all 100% owned and for which 100% of voting rights are held:
Residential housebuilding
Berkeley Community Villages Limited Crosby Homes (Special Projects) Limited (3) (7)
Berkeley First Limited (1) Crosby Homes (North West) Limited (2) (7)
Berkeley Homes plc Crosby Homes Special Projects (NW) Limited (2) (7)
Berkeley Homes (Capital) plc (1) Crosby Homes (Yorkshire) Limited (2) (7)
Berkeley Homes (Central and West London) plc (1) Exchange Place No. 2 Limited (5)
Berkeley Homes (Central London) Limited (1) St David Limited (3)
Berkeley Homes (East Thames) Limited (1) St George PLC
Berkeley Homes (Eastern) Limited (1) St George Central London Limited (4)
Berkeley Homes (Festival Development) Limited (1) St George North London Limited (4)
Berkeley Homes (Festival Waterfront Company) Limited (1) St George South London Limited (4)
Berkeley Homes (Hampshire) Limited (1) St George West London Limited (4)
Berkeley Homes (Home Counties) plc (1) St George Battersea Reach Limited (5)
Berkeley Homes (North East London) Limited (1) St John Homes Limited
Berkeley Homes (Oxford & Chiltern) Limited (1) The Berkeley Clarence Dock Company Limited (2)
Berkeley Homes (South East London) Limited (1) The Berkeley Group plc (6)
Berkeley Homes (Southern) Limited (1) The Beaufort Homes Development Group Limited (7)
Berkeley Homes (West London) Limited (1) The Crosby Group plc (7)
Berkeley Partnership Homes Limited (1) Thirlstone Homes Limited (1)
Berkeley Strategic Land Limited Thirlstone Homes (Western) Limited (1)
Crosby Homes Limited (2) (7) West Kent Cold Storage Company Limited
(1) Agency companies of Berkeley Homes plc (2) Agency companies of The Crosby Group plc (3) Agency companies of The Beaufort Homes Development Group Limited(4) Agency companies of St George PLC (5) The substance of the acquisition of these companies was the purchase of land for development and not of a business, and as such, fairvalue accounting and the calculation of goodwill is not required (6) The Berkeley Group plc is the only subsidiary of the parent company. (7) Companies sold on 8 July 2005 as partof the disposal of The Crosby Group plc.
Commercial property and other activities
Berkeley Commercial Developments Limited (†) Berkeley Portsmouth Harbour Limited (†)
(†) Direct subsidiaries of The Berkeley Group plc
At 30 April 2005 the Group had interests in the following joint ventures which have been equity accounted to 30 April and are registered and
operate in England and Wales (except where stated in italics) and which are all 50% owned, except where stated:
Accounting date Principal activity
Joint ventures
Berkeley Breamore (Oceana) Limited 30 April Commercial property
Berkeley Gemini Limited 30 April Mixed-use
Berkeley Mansford Limited 31 March Commercial property
Berkeley Sutton Limited 30 April Residential housebuilding
Crosby: ASK Limited (1) 31 March Commercial property
Crosby Peel Limited (1) 31 March Residential housebuilding
Crosby Seddon Developments Limited (1) 30 April Residential housebuilding
Hungate (York) Regeneration Limited (33.3%) (1) 30 April Mixed-use
Ician Developments Limited (1) 30 April Residential housebuilding
Saad Berkeley Investment Properties Limited (Jersey) 30 April Commercial property
Saad Berkeley Limited 30 April Residential housebuilding
St James Group Limited 31 December Residential housebuilding
Thirlstone Centros Miller Limited 31 December Residential housebuilding
UB Developments Limited 30 April Residential housebuilding
The interests in the joint ventures are in equity share capital.
(1) Joint ventures sold on 8 July 2005 as part of the disposal of The Crosby Group plc.
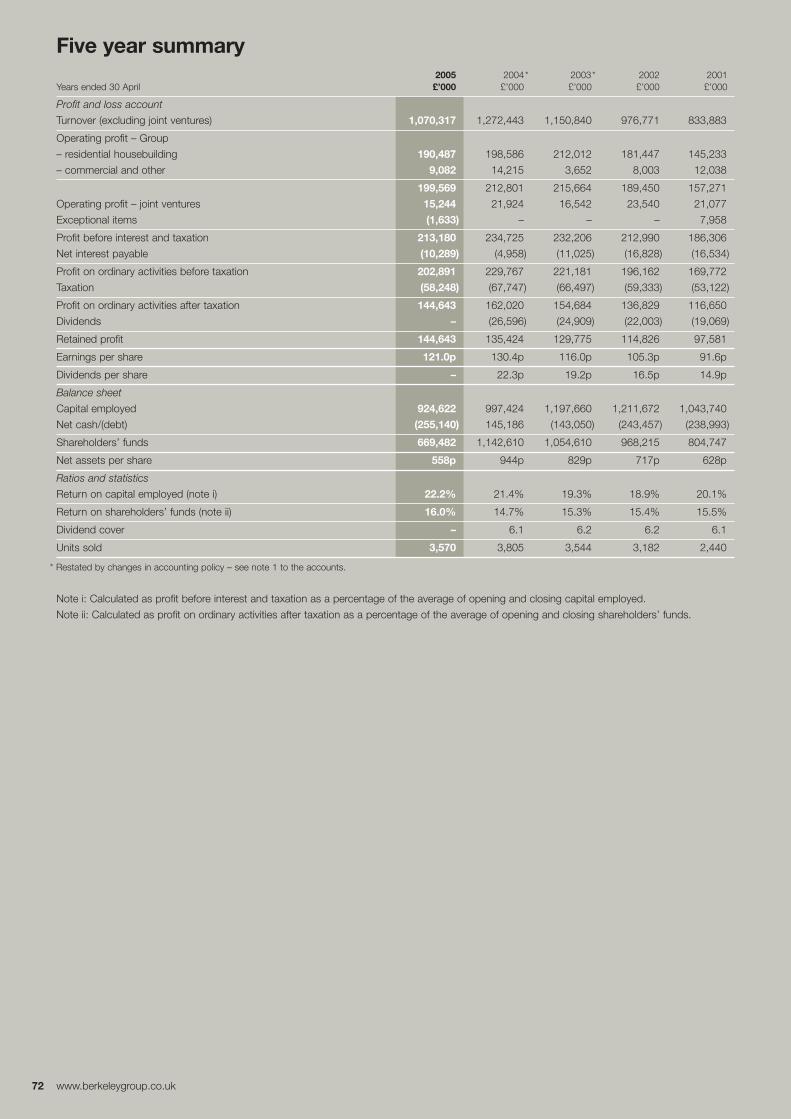
72 www.berkeleygroup.co.uk
Five year summary2005 2004* 2003* 2002 2001
Years ended 30 April £’000 £’000 £’000 £’000 £’000
Profit and loss account
Turnover (excluding joint ventures) 1,070,317 1,272,443 1,150,840 976,771 833,883
Operating profit – Group
– residential housebuilding 190,487 198,586 212,012 181,447 145,233
– commercial and other 9,082 14,215 3,652 8,003 12,038
199,569 212,801 215,664 189,450 157,271
Operating profit – joint ventures 15,244 21,924 16,542 23,540 21,077
Exceptional items (1,633) – – – 7,958
Profit before interest and taxation 213,180 234,725 232,206 212,990 186,306
Net interest payable (10,289) (4,958) (11,025) (16,828) (16,534)
Profit on ordinary activities before taxation 202,891 229,767 221,181 196,162 169,772
Taxation (58,248) (67,747) (66,497) (59,333) (53,122)
Profit on ordinary activities after taxation 144,643 162,020 154,684 136,829 116,650
Dividends – (26,596) (24,909) (22,003) (19,069)
Retained profit 144,643 135,424 129,775 114,826 97,581
Earnings per share 121.0p 130.4p 116.0p 105.3p 91.6p
Dividends per share – 22.3p 19.2p 16.5p 14.9p
Balance sheet
Capital employed 924,622 997,424 1,197,660 1,211,672 1,043,740
Net cash/(debt) (255,140) 145,186 (143,050) (243,457) (238,993)
Shareholders’ funds 669,482 1,142,610 1,054,610 968,215 804,747
Net assets per share 558p 944p 829p 717p 628p
Ratios and statistics
Return on capital employed (note i) 22.2% 21.4% 19.3% 18.9% 20.1%
Return on shareholders’ funds (note ii) 16.0% 14.7% 15.3% 15.4% 15.5%
Dividend cover – 6.1 6.2 6.2 6.1
Units sold 3,570 3,805 3,544 3,182 2,440
* Restated by changes in accounting policy – see note 1 to the accounts.
Note i: Calculated as profit before interest and taxation as a percentage of the average of opening and closing capital employed.
Note ii: Calculated as profit on ordinary activities after taxation as a percentage of the average of opening and closing shareholders’ funds.

Financial diaryAnnual General Meeting 1 September 2005
Half year end 31 October 2005
Interim Report for the six months to 31 October 2005 9 December 2005
Preliminary announcement of results for year to 30 April 2006 June 2006
Publication of 2005/06 Annual Report July 2006
Return of capital
Class of B share Payment/Expected record date Proceeds per share
2004 B share Paid on 3 December 2004 £5
2006 B share 29 December 2006 £2
2008 B share 31 December 2008 £2
2010 B share 31 December 2010 £3
Total £12

The Berkeley Group Holdings plcBerkeley House19 Portsmouth Road, CobhamSurrey KT11 1JGUK
Telephone +44 (0)1932 868555Facsimile +44 (0)1932 868667Website www.berkeleygroup.co.uk
Designed by Tor Pettersen & Partners
Printed in England by Ingersoll Printers
This report is printed on Revive Special Silk.
At least 30% of the total fibre content comes from
well-managed forests independently certified according
to the rules of the Forest Stewardship Council, and
30% is from post-consumer recycled waste paper.