Embed Size (px)
Citation preview
19/04/12 Building OLAP 11g Cubes
1/38www.oracle.com/webfolder/technetwork/tutorials/obe/db/11g/r1/olap/cube/buildicubes.htm
Building OLAP 11g Cubes
Purpose
In this tutorial, you use the Analytic Workspace Manager 11g (AWM 11g) tool to build an OLAP cube. You:
Create a cube and its dependent components, including:
DimensionsMeasures (stored and calculated)
Map the OLAP model to source data
Enable MV rewrite to the cube
Load data into the dimensions and measures
View the OLAP data
Time to Complete:
Approximately 60 minutes
Topics
This tutorial covers the following topics:
Overview
Scenario
Prerequisites
Creating an Analytic Workspace
Defining Dimensions and Levels
Defining Hierarchies
Defining and Reviewing Attributes
Mapping Dimensions to Relational Sources
Using Templates to Define Data Objects
Defining Cubes
Creating Measures
Mapping Cubes to Relational Sources
Enabling Query Rewrite to Cube MVs (optional)
Loading and Viewing Cube Data
More Information
Viewing Screenshots
Place the cursor over this icon to load and view all the screenshots for this tutorial. (Caution: Because this action loads all screenshots simultaneously,
response time may be slow depending on your Internet connection.)
Note: Alternatively, you can place the cursor over each individual icon in the following steps to load and view only the screenshot associated with that step.
Overview
AWM 11g is a tool for creating, developing, and managing multidimensional data in an Oracle 11g data warehouse. With this easy-to-use GUI tool, you create thecontainer for OLAP data, an analytic workspace (AW), and then add OLAP dimensions and cubes.
In Oracle OLAP, a Cube provides a convenient way of collecting stored and calculated measures with similar characteristics, including dimensionality, aggregationrules, and so on. A particular AW may contain more than one cube, and each cube may describe a different dimensional shape. Multiple cubes in the same AW mayshare one or more dimensions. Therefore, a cube is simply a logical object that helps an administrator to build and maintain data in an AW.
After creating cubes, measures, and dimensions, you map the dimensions and stored measures to existing star, snowflake, and normalized relational sources andthen load the data. OLAP data can then be queried with simple SQL.
Back to Topic List
Scenario
The source data for this tutorial the OLAPTRAIN schema. OLAPTRAIN is a star schema that was sourced from a base transactional system which contains data fora fictional electronics store. The star schema contains “dimension” tables, which describe the relationships in the data, and “fact” tables, which contain the metricsused to measure performance.
The following are the tables, intended for analysis, that previously have gone through the ETL (Extraction, Transformation, and Loading of heterogeneous data)process:
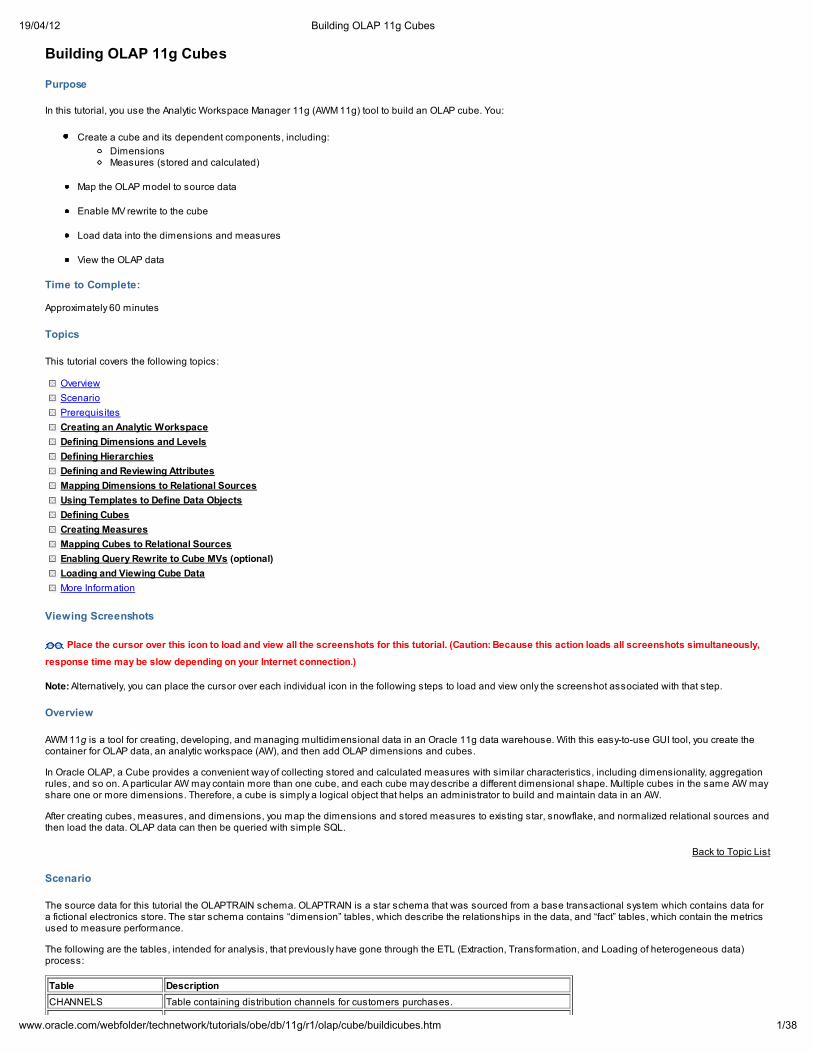
Table Description
CHANNELS Table containing distribution channels for customers purchases.
19/04/12 Building OLAP 11g Cubes
2/38www.oracle.com/webfolder/technetwork/tutorials/obe/db/11g/r1/olap/cube/buildicubes.htm
CUSTOMERS Table that show who purchased products, and where products are sold for the Geographydimension.
PRODUCTS Table containing products that are sold by the company.
TIMES Table containing time periods when products were sold.
SALES_FACTStores purchases in dollars, quantity, and price, by channel of distribution, product item,day, and customer.
Designing a Logical Data Model
After examining the relational tables, the available levels, hierarchies, and attributes for each dimension are identified. In addition, the required stored and calculatedmeasures are identified as part of the business requirements definition process. The resulting logical model becomes the design for the OLAP data model.
Identifying Dimensions
Using the source data tables as the primary input, the following dimensions have been identified as requirements for the OLAP data model:
ChannelGeographyProductTime
Identifying Levels
When designing your OLAP model, you also determine the level of summarization that you want to load into your cube. You may not necessarily want to replicate thedata in your source as a cube. You can always query the detail data (since all of the data is in the Oracle database), by joining the cube to the fact table.
Your business requirements for summary management and analysis purposes should define the lowest level of detail for each dimension in the OLAP cube. Youcan load data into the cube at any level. After performing a business requirements analysis, the following the levels of summarization within each dimension havebeen identified as part of the OLAP data model:
Channel dimension has two classes of distribution channels: Direct and Indirect. The children of these two values are the lowest level of detail and will begrouped in the Channel level. From the order of highest level of summarization to the lowest level of detail, levels will be: All Channels, Class, and Channel.
Geography dimension reflects how company performs customer and geographic analysis along regions. Although the CUSTOMERS dimension table containsthe following levels of detail: Region > Country > State-Province > City > Customer, the levels of summarization required for geographic analysis in the OLAPsystem will be (highest to lowest): All Regions, Region, Country, and State-Province.
Product dimension will have six levels. These levels reflect the same levels of detail in the source data. From highest to lowest, the OLAP levels are: AllProducts, Department, Category, Type, Subtype, and Item.
Time dimension will have four levels (highest to lowest): All Years, Calendar Year, Calendar Quarter, and Month. Data is available for the years 2005–2007.
Within each dimension, notice that an "All" (Total) level is added as the highest level of summarization. Adding this highest level provides additional flexibility asapplication users analyze OLAP data.
Identifying Hierarchies
Hierarchies organize the levels within each dimension. To identify hierarchies, you group the levels in the correct order of summarization and in a way that supportsthe identified types of analysis. You can orgainize levels into any number of hierarchies for each dimension.
In this OLAP data model, only one hierarchy is required for each dimension. The hierachy levels are designed as shown in the table above.
Identifying Measures
Analysis requirements include both stored and calculated measures. Two of the measures are acquired from the fact table, and the remaining measures arecreated and managed as OLAP calculations:
Stored Measures Sales
Quantity
Calculated Measures Sales Year-to-Date
Sales Year-to-Date Prior Year
Sales Year-to-Date Prior Year % Change
Sales Prior Year % Change
Sales Prior Period
Sales Prior Period % Change
Sales Rank in Product Level
Sales Rank in Product Parent
Share of Product Sales within Parent
Share of Product Sales within Total
Back to Topic List
Prerequisites
Before you perform this tutorial, you should:
1. Install Oracle Database 11g with the OLAP Option (Patch level 11.1.0.7 or higher).
2. Download Analytic Workspace Manager 11g (version 11.1.0.7A or higher) from OTN and unzip it into any directoryon your Windows machine.
19/04/12 Building OLAP 11g Cubes
3/38www.oracle.com/webfolder/technetwork/tutorials/obe/db/11g/r1/olap/cube/buildicubes.htm
3. Download and install the OLAPTRAIN schema following the instructions in Installing the Oracle OLAP 11g Sample
Schema.
Notes: The Sample Schema installation package includes two parts:
1. Installing the base OLAPTRAIN schema
2. Installing the SALESTRACK analytic workspace in the OLAPTRAIN schema
Only complete the first part -- installing the base OLAPTRAIN schema.
4. a. Download olaptrain_templates.zip to a location on the machine where AWM is installed.
b. Unzip the files.
The resulting directory structure is: <your_path>\templates\calcs
The files in the ...\templates directory, and the ...\templates\calcs directory are used later in this tutorial.
Back to Topic List
Creating an Analytic Workspace
An analytic workspace is a container for multidimensional data objects and procedures written in OLAP DML. It is created using the AWM tool. Perform the followingsteps:
1.Launch AWM 11g either by double-clicking <your_path>\awm\bin\awm11.1.0.7.0A.jar, or from your desktop shortcut.
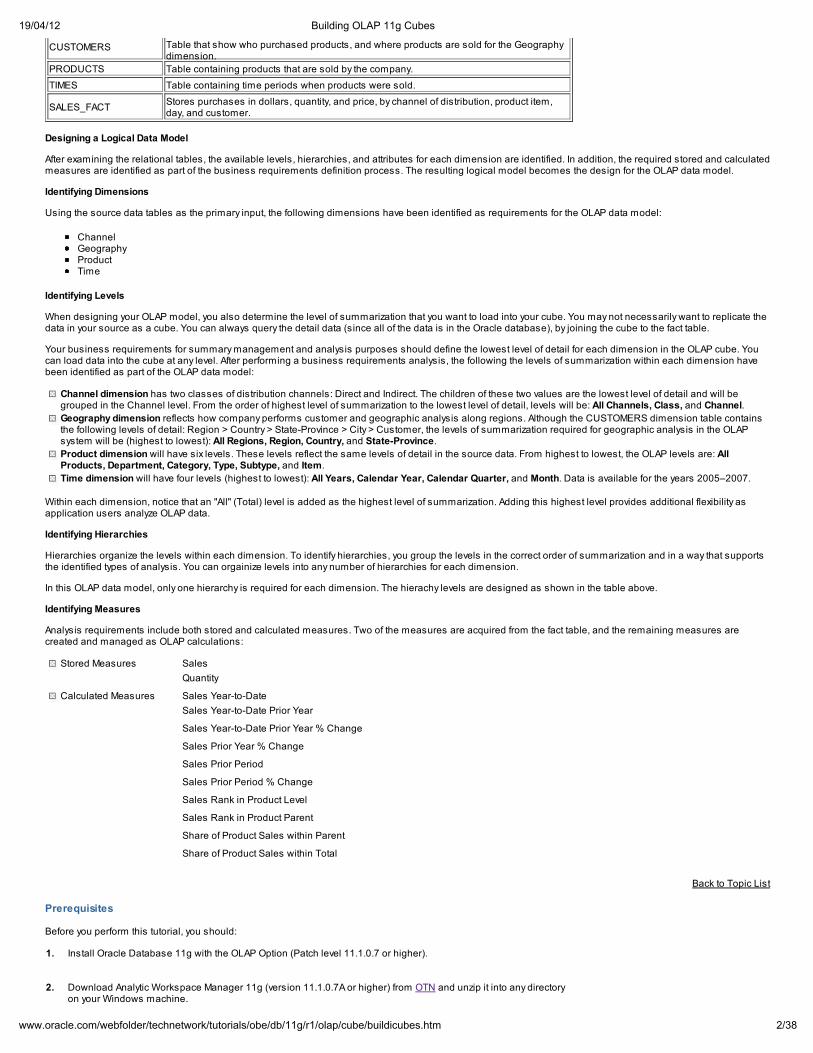
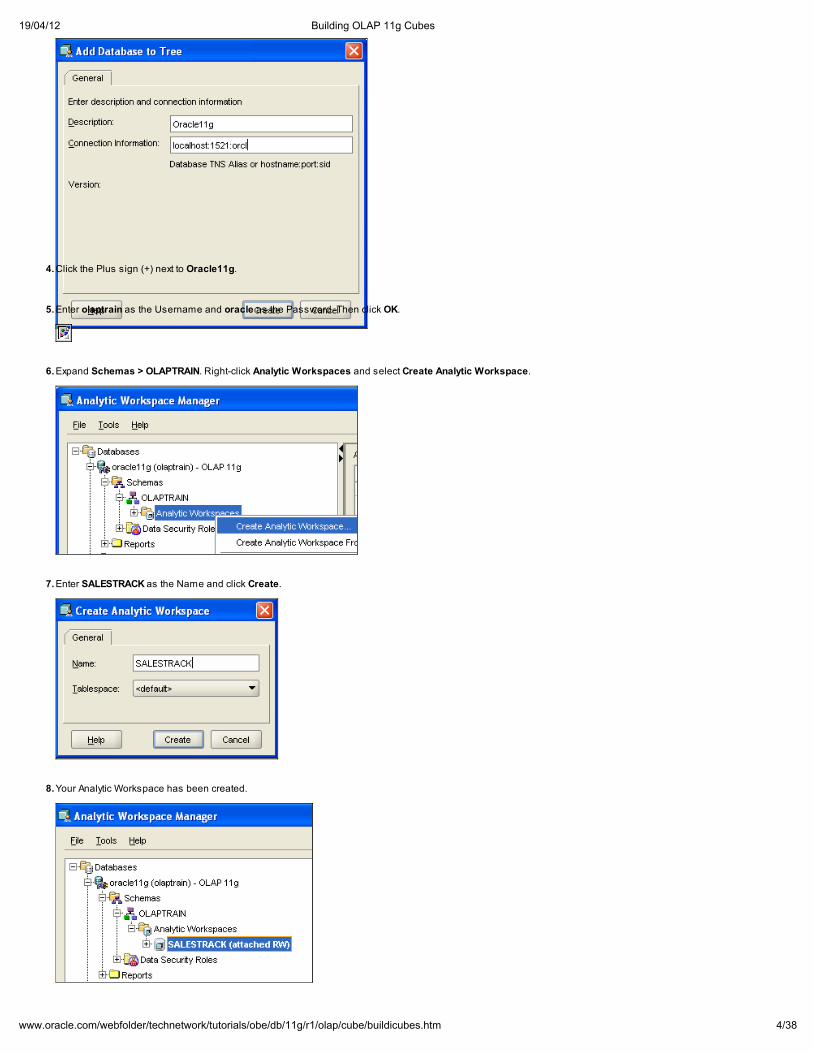
2.Right-click Databases and select Add Database to tree.
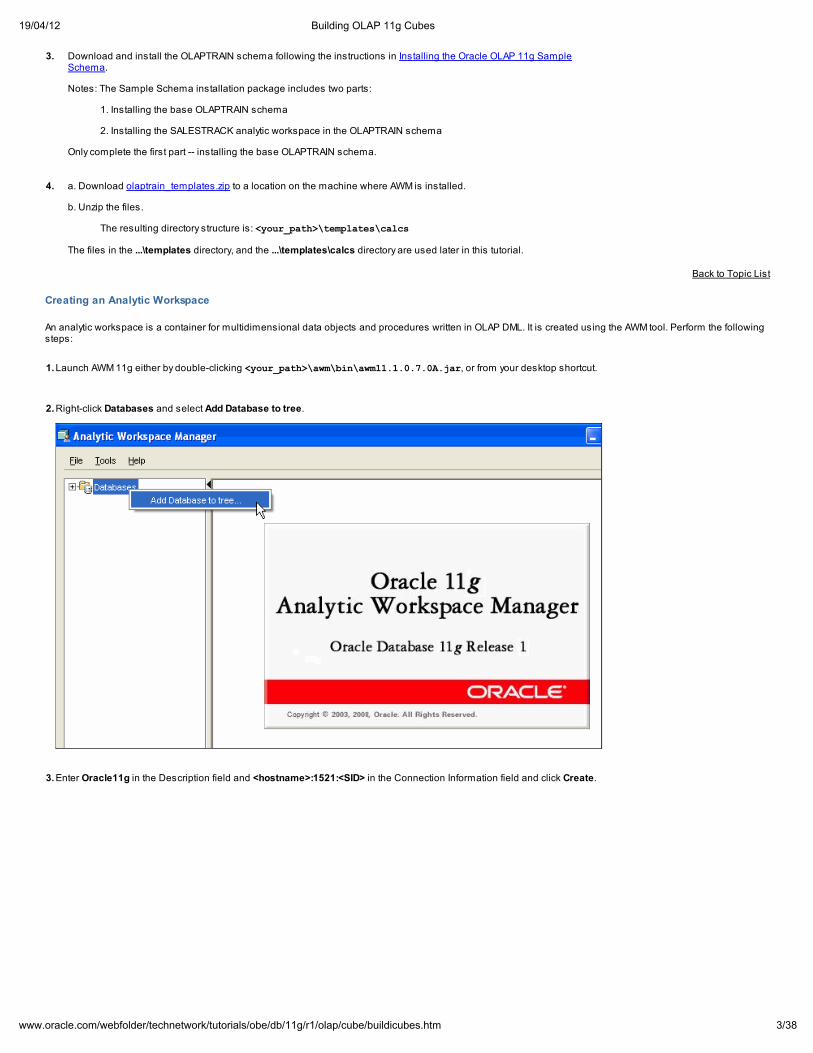
3.Enter Oracle11g in the Description field and <hostname>:1521:<SID> in the Connection Information field and click Create.
19/04/12 Building OLAP 11g Cubes
4/38www.oracle.com/webfolder/technetwork/tutorials/obe/db/11g/r1/olap/cube/buildicubes.htm
4.Click the Plus sign (+) next to Oracle11g.
5.Enter olaptrain as the Username and oracle as the Password. Then click OK.
6.Expand Schemas > OLAPTRAIN. Right-click Analytic Workspaces and select Create Analytic Workspace.
7.Enter SALESTRACK as the Name and click Create.
8.Your Analytic Workspace has been created.

19/04/12 Building OLAP 11g Cubes
5/38www.oracle.com/webfolder/technetwork/tutorials/obe/db/11g/r1/olap/cube/buildicubes.htm
Back to Topic List
Defining Dimensions and Levels
Dimensions are lists of unique members that identify and categorize data. They form the edges of a cube, and thus the measures within the cube. Dimensions maycontain levels, hierarchies, and attributes. You may define levels at the same time that create a dimension, or you may define the levels later.
You can define dimensions either as 'User' or as 'Time' dimension type. Business analysis is performed on historical data, so fully defined time periods are vital.For a Time type dimension, your source data must have columns for period end dates and time span. These required attributes support OLAP time-series analysis,such as comparisons with earlier time periods. If this information is not available, then you can define Time as a normal dimension, but it does not support time-based analysis.
1. Right-click the Dimensions folder and select Create Dimension.
2. At the default General tab in the Create Dimension dialog box, enter CHANNEL as the name and select UserDimension as dimension type.
3. In the Levels tab, enter the following three levels:
ALL_CHANNELSCLASSCHANNEL
Note: the Label and Description fields are auto-filled
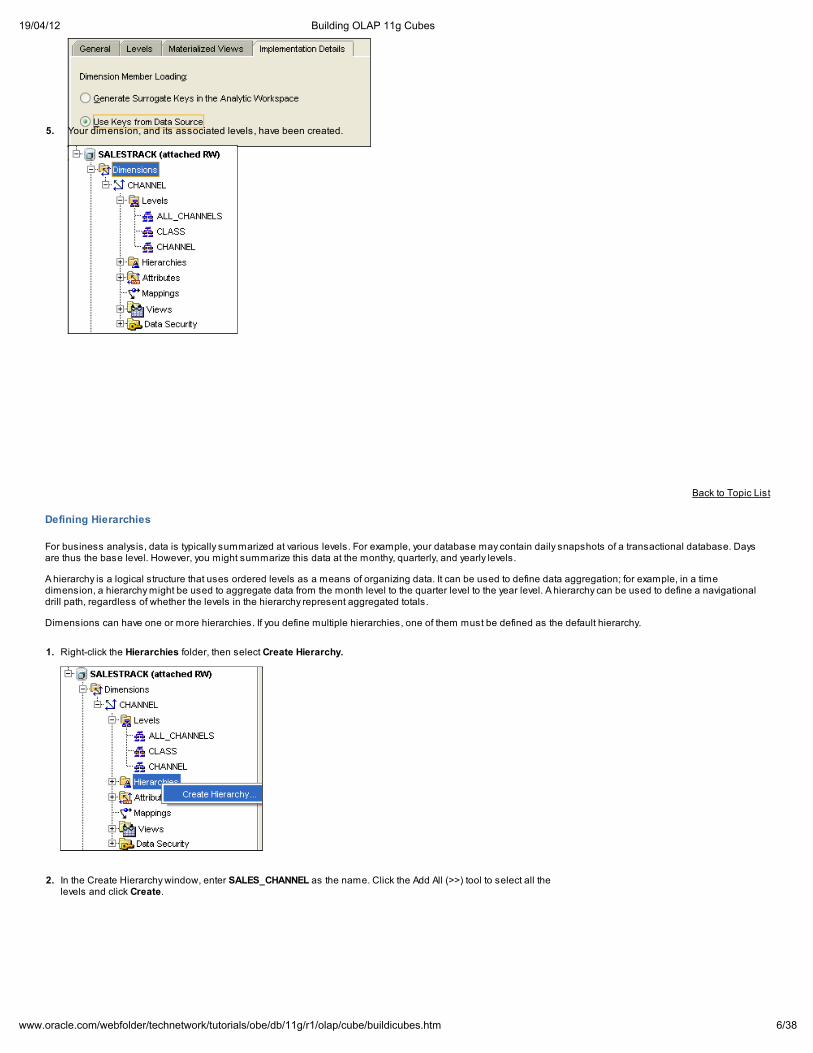
4. In the Implementation Details tab, select Use Keys from Data Source.
19/04/12 Building OLAP 11g Cubes
6/38www.oracle.com/webfolder/technetwork/tutorials/obe/db/11g/r1/olap/cube/buildicubes.htm
Then, click Create.
5. Your dimension, and its associated levels, have been created.
Back to Topic List
Defining Hierarchies
For business analysis, data is typically summarized at various levels. For example, your database may contain daily snapshots of a transactional database. Daysare thus the base level. However, you might summarize this data at the monthy, quarterly, and yearly levels.
A hierarchy is a logical structure that uses ordered levels as a means of organizing data. It can be used to define data aggregation; for example, in a timedimension, a hierarchy might be used to aggregate data from the month level to the quarter level to the year level. A hierarchy can be used to define a navigationaldrill path, regardless of whether the levels in the hierarchy represent aggregated totals.
Dimensions can have one or more hierarchies. If you define multiple hierarchies, one of them must be defined as the default hierarchy.
1. Right-click the Hierarchies folder, then select Create Hierarchy.
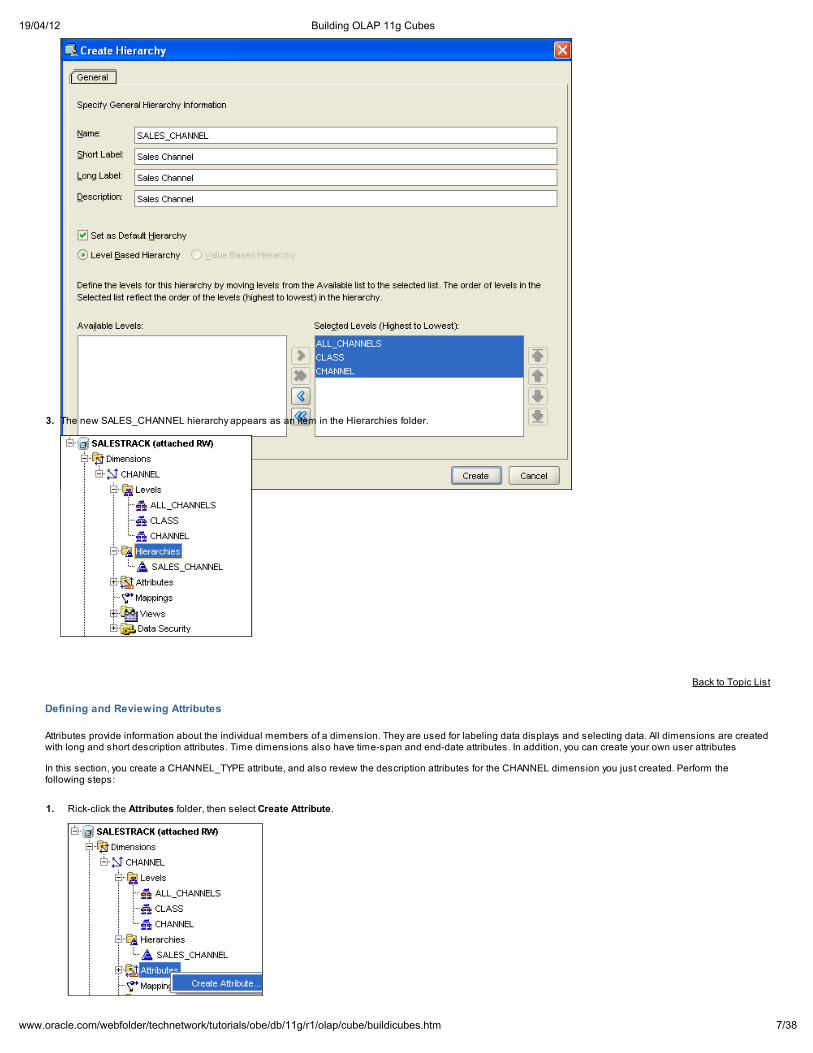
2. In the Create Hierarchy window, enter SALES_CHANNEL as the name. Click the Add All (>>) tool to select all thelevels and click Create.
19/04/12 Building OLAP 11g Cubes
7/38www.oracle.com/webfolder/technetwork/tutorials/obe/db/11g/r1/olap/cube/buildicubes.htm
3. The new SALES_CHANNEL hierarchy appears as an item in the Hierarchies folder.
Back to Topic List
Defining and Reviewing Attributes
Attributes provide information about the individual members of a dimension. They are used for labeling data displays and selecting data. All dimensions are createdwith long and short description attributes. Time dimensions also have time-span and end-date attributes. In addition, you can create your own user attributes
In this section, you create a CHANNEL_TYPE attribute, and also review the description attributes for the CHANNEL dimension you just created. Perform thefollowing steps:
1. Rick-click the Attributes folder, then select Create Attribute.
19/04/12 Building OLAP 11g Cubes
8/38www.oracle.com/webfolder/technetwork/tutorials/obe/db/11g/r1/olap/cube/buildicubes.htm
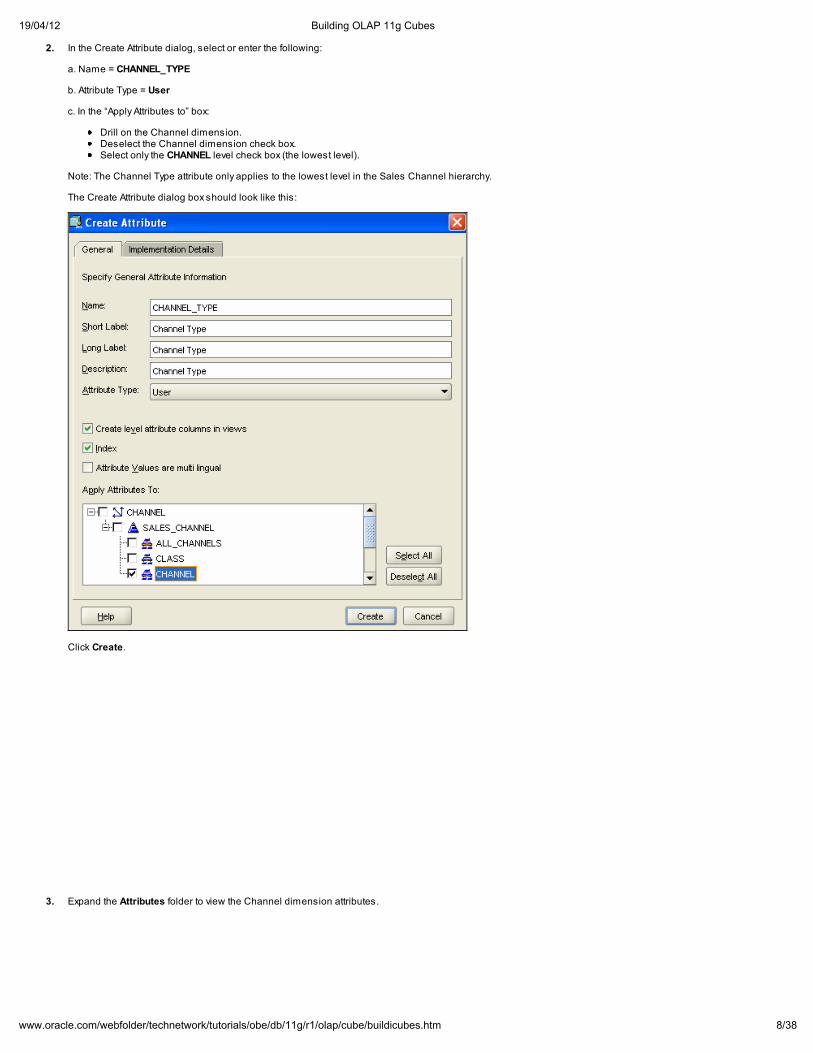
2. In the Create Attribute dialog, select or enter the following:
a. Name = CHANNEL_TYPE
b. Attribute Type = User
c. In the “Apply Attributes to” box:
Drill on the Channel dimension.Deselect the Channel dimension check box.Select only the CHANNEL level check box (the lowest level).
Note: The Channel Type attribute only applies to the lowest level in the Sales Channel hierarchy.
The Create Attribute dialog box should look like this:
Click Create.
3. Expand the Attributes folder to view the Channel dimension attributes.
19/04/12 Building OLAP 11g Cubes
9/38www.oracle.com/webfolder/technetwork/tutorials/obe/db/11g/r1/olap/cube/buildicubes.htm
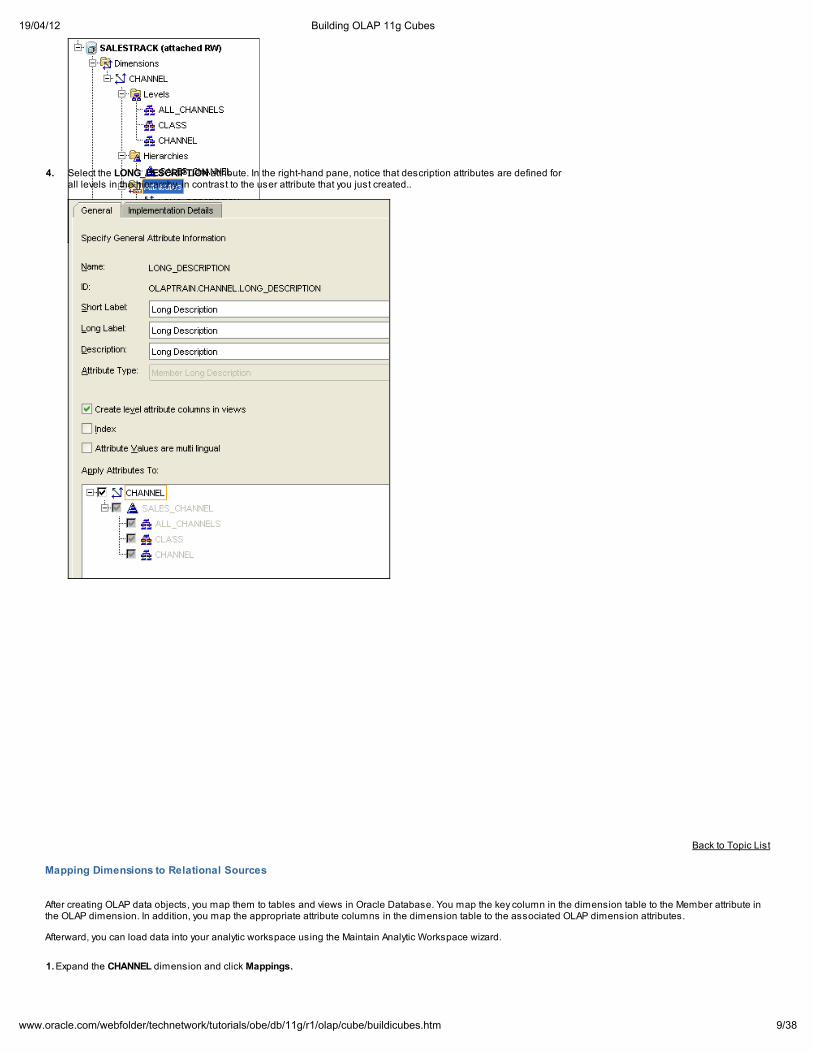
4. Select the LONG_DESCRIPTION attribute. In the right-hand pane, notice that description attributes are defined forall levels in the hierarchy, in contrast to the user attribute that you just created..
Back to Topic List
Mapping Dimensions to Relational Sources
After creating OLAP data objects, you map them to tables and views in Oracle Database. You map the key column in the dimension table to the Member attribute inthe OLAP dimension. In addition, you map the appropriate attribute columns in the dimension table to the associated OLAP dimension attributes.
Afterward, you can load data into your analytic workspace using the Maintain Analytic Workspace wizard.
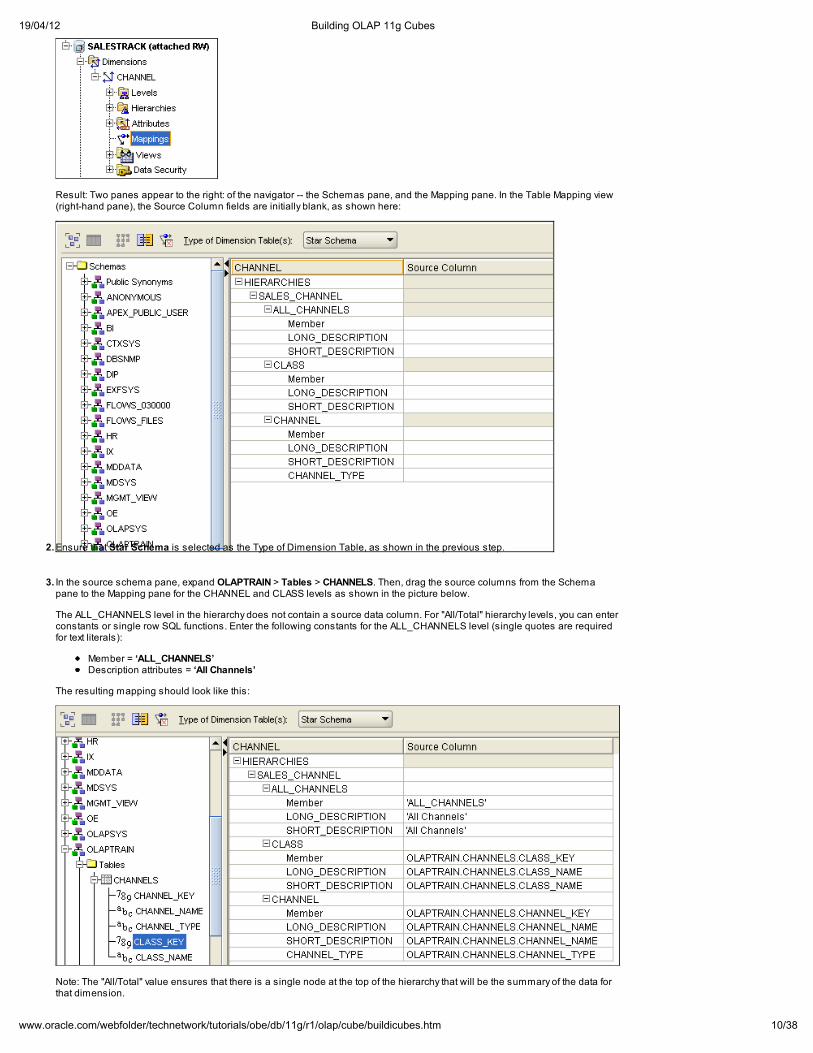
1.Expand the CHANNEL dimension and click Mappings.
19/04/12 Building OLAP 11g Cubes
10/38www.oracle.com/webfolder/technetwork/tutorials/obe/db/11g/r1/olap/cube/buildicubes.htm
Result: Two panes appear to the right: of the navigator -- the Schemas pane, and the Mapping pane. In the Table Mapping view(right-hand pane), the Source Column fields are initially blank, as shown here:
2.Ensure that Star Schema is selected as the Type of Dimension Table, as shown in the previous step.
3. In the source schema pane, expand OLAPTRAIN > Tables > CHANNELS. Then, drag the source columns from the Schemapane to the Mapping pane for the CHANNEL and CLASS levels as shown in the picture below.
The ALL_CHANNELS level in the hierarchy does not contain a source data column. For "All/Total" hierarchy levels, you can enterconstants or single row SQL functions. Enter the following constants for the ALL_CHANNELS level (single quotes are requiredfor text literals):
Member = ‘ALL_CHANNELS’Description attributes = ‘All Channels’
The resulting mapping should look like this:
Note: The "All/Total" value ensures that there is a single node at the top of the hierarchy that will be the summary of the data forthat dimension.

19/04/12 Building OLAP 11g Cubes
11/38www.oracle.com/webfolder/technetwork/tutorials/obe/db/11g/r1/olap/cube/buildicubes.htm
4. In the lower right corner of the mapping pane, click Apply.
Result: The Channel dimension is ready to have data loaded. Although you could load the dimension data now, you will performthis step later in the tutorial.
Back to Topic List
Using Templates to Define Data Objects
The template feature in Analytic Workspace Manager saves the definition of the OLAP data objects as an XML file. Using a saved template, you can create a newanalytic workspace, dimension, cube, and measure exactly like an existing object, with or without mappings. Templates do not include the data, only the definition ofthe object.
Templates allow you to:
Share analytic workspace designs with other users.
Transfer object definitions to other schema or instances.
Persist object definitions outside database.
Place object definitions in source control.
In this section, you create three dimensions, GEOGRAPHY, PRODUCT and TIME from previously saved templates. Perform the following steps:
1. Right-click the Dimensions folder, then select Create Dimension From Template.
2. At the Create Dimensions From Template dialog box, locate the ...\templates directory, where you installed theolaptrain template files.
For example: c:<your_path>\templates
Then, select GEOGRAPHY.XML in the templates directory and click Create.
3. The new GEOGRAPHY dimension appears under the Dimensions folder. Drill on Levels, Hierarchies, andAttributes to view its elements.
19/04/12 Building OLAP 11g Cubes
12/38www.oracle.com/webfolder/technetwork/tutorials/obe/db/11g/r1/olap/cube/buildicubes.htm
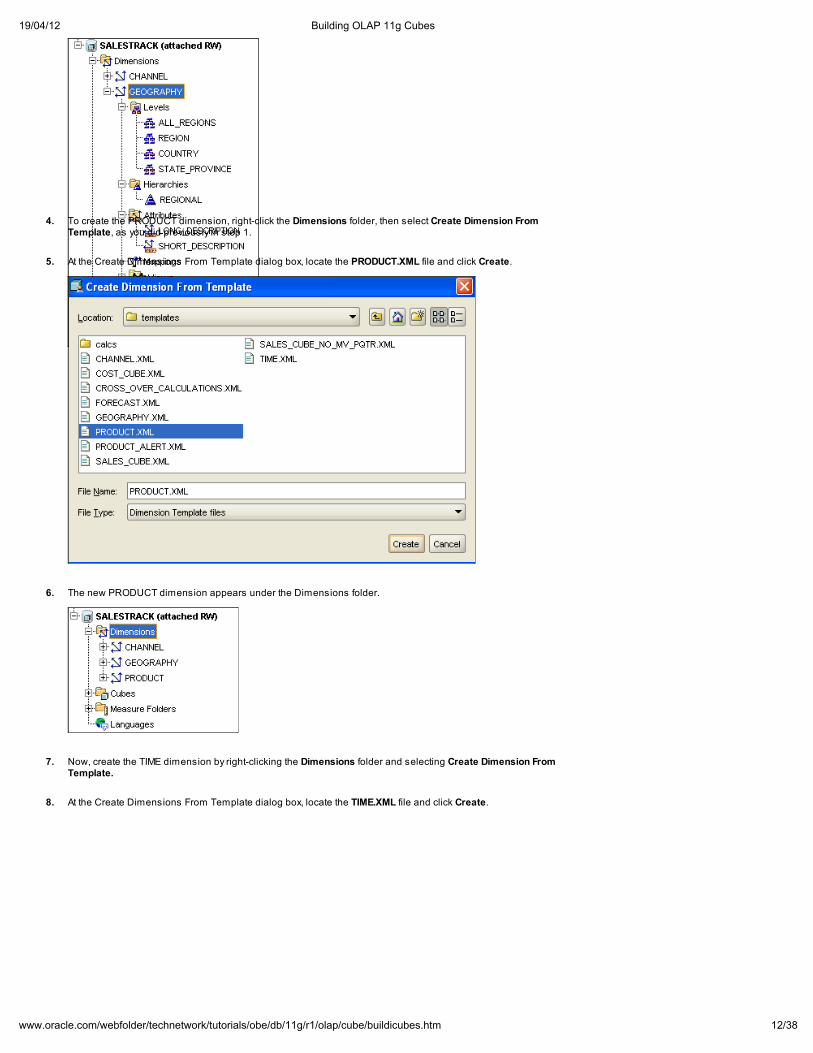
4. To create the PRODUCT dimension, right-click the Dimensions folder, then select Create Dimension FromTemplate, as you did previously in step 1.
5. At the Create Dimensions From Template dialog box, locate the PRODUCT.XML file and click Create.
6. The new PRODUCT dimension appears under the Dimensions folder.
7. Now, create the TIME dimension by right-clicking the Dimensions folder and selecting Create Dimension FromTemplate.
8. At the Create Dimensions From Template dialog box, locate the TIME.XML file and click Create.

19/04/12 Building OLAP 11g Cubes
13/38www.oracle.com/webfolder/technetwork/tutorials/obe/db/11g/r1/olap/cube/buildicubes.htm
Result: The new TIME dimension appears under the Dimensions folder.
9. In the navigator, drill on TIME > Attributes.
Notice that there are two special attributes -- END_DATE and TIME_SPAN -- have been created for the TIMEdimension. Since this dimension was defined as a "Time" type, these attributes are automatically created. Theymust be mapped to apppropriate source data columns for certain OLAP time series analysis features to beenabled. You will leverage these attributes when you create time series calculations later in this tutorial.
10. The Geography, Product and Time templates all included mappings. To view the mappings for the Timedimension, click Mappings under TIME in the navigator.

19/04/12 Building OLAP 11g Cubes
14/38www.oracle.com/webfolder/technetwork/tutorials/obe/db/11g/r1/olap/cube/buildicubes.htm
As with the other the "All/Total" level in the hierarchy is mapped to either constants or single-row SQL functions.
You can examine the mappings for any of these dimensions by clicking on the Mappings tab under the dimensionnode in the navigator.
Back to Topic List
Defining Cubes
In Oracle OLAP, a Cube provides a convenient way of collecting measures of the same dimensionality. Therefore, a cube is simply an object that helps anadministrator to build and maintain an AW.
Cubes aid in the definition of measures with common characteristics, including the following:
The edges of a Cube are defined by its dimensions. If multiple measures have the same dimensionality, it is likely that they will be defined in the same cube..
Measures that share sparsity patterns and aggregation rules are commonly defined in the same Cube.
Measures in the same Cube have the same relationships to other logical objects and can easily be analyzed and displayed together.
A particular AW may contain more than one Cube, and each cube may describe a different dimensional shape.
Multiple Cubes in the same AW may share one or more dimensions.
For example, sales data can be organized into a cube, whose edges contain values from the channel, geography, product, and time dimensions and whose bodycontains measures that might include dollar sales, unit sales, and a range calculated measures based on sales and quantity sold.
Perform the following steps to create a cube that will be used to organize a variety of sales measures:
1. Right click the Cubes folder, then click Create Cube.
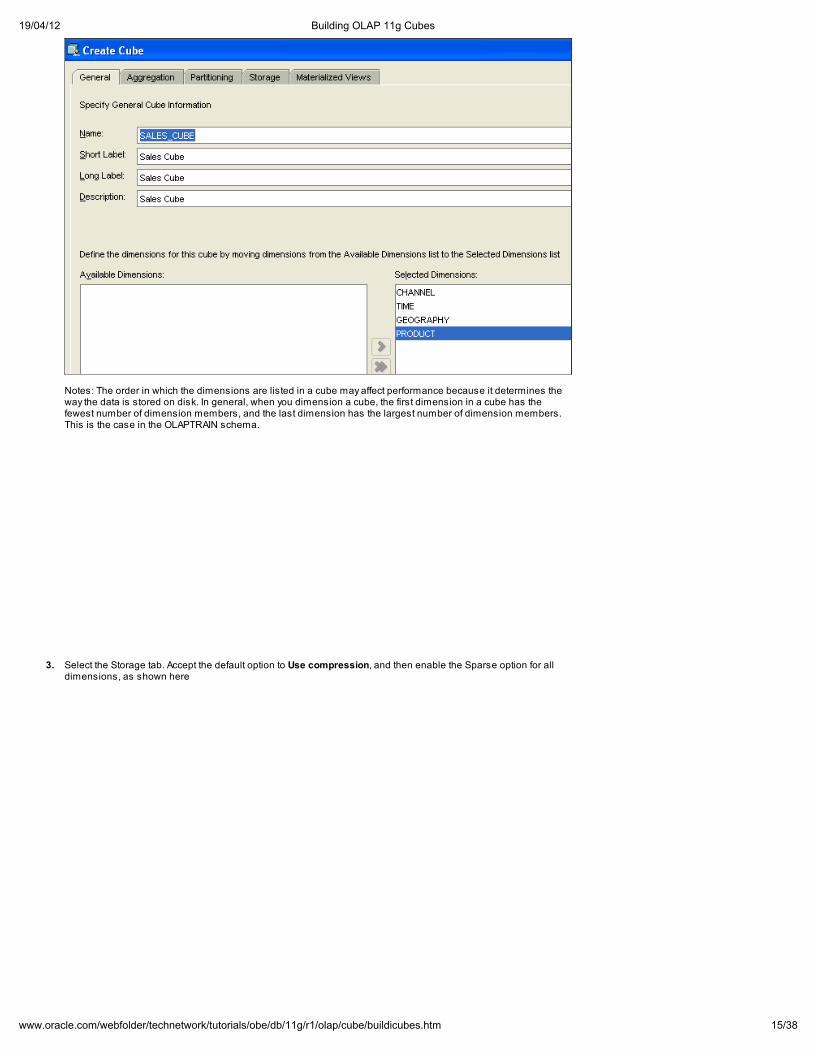
2. In the General tab of the Create Cube window, specify the following:
a. Name: SALES_CUBE
b. Use the Add tool (>) to selected dimensions in the following order:
CHANNELTIMEGEOGRAPHYPRODUCT
Result: the Create Cube window should look like this:
19/04/12 Building OLAP 11g Cubes
15/38www.oracle.com/webfolder/technetwork/tutorials/obe/db/11g/r1/olap/cube/buildicubes.htm
Notes: The order in which the dimensions are listed in a cube may affect performance because it determines theway the data is stored on disk. In general, when you dimension a cube, the first dimension in a cube has thefewest number of dimension members, and the last dimension has the largest number of dimension members.This is the case in the OLAPTRAIN schema.
3. Select the Storage tab. Accept the default option to Use compression, and then enable the Sparse option for alldimensions, as shown here

19/04/12 Building OLAP 11g Cubes
16/38www.oracle.com/webfolder/technetwork/tutorials/obe/db/11g/r1/olap/cube/buildicubes.htm
Notes:
What is Sparsity? When there are a large number of empty cells in a cube, the cube is said to be “sparse.”This is very common in dimensional data models. Most commonly, all dimensions are marked as sparse.When one or more dimensions as marked as sparse, OLAP creates a special index for the cube thatautomatically manages sparsity.The Compression feature can be used to significantly reduce the size of cubes and improve performance ofboth data loads and queries. Since most dimensional data is sparse, the Compression option is selectedas a default.
4. Select the Aggregation tab. Then, in the Precompute sub-tab, specify a value of 30 for Cost-based aggregation, asshown here:
Notes:
Cost-based aggregation is new feature for Oracle 11g OLAP. You can use this feature if you selectcompression for your cube. Specify a percentage value and the database will precompute and store themost costly aggregate values based on your input.Using a setting of 30 causes a larger percentage of cube data to be aggregated and stored than the defaultsetting of 20.
5. In the Partitioning tab, select the Partition cube option. (The Dimension, Hierarchy, and Level options are enabled.)
Then, select the following settings to specify partitioning on the Time dimension at the Year level:
a) Dimension = TIME
b) Hierarchy = CALENDAR
c) Level = CALENDAR_YEAR
6. At the bottom of the Create Cube dialog box, click Create.
19/04/12 Building OLAP 11g Cubes
17/38www.oracle.com/webfolder/technetwork/tutorials/obe/db/11g/r1/olap/cube/buildicubes.htm
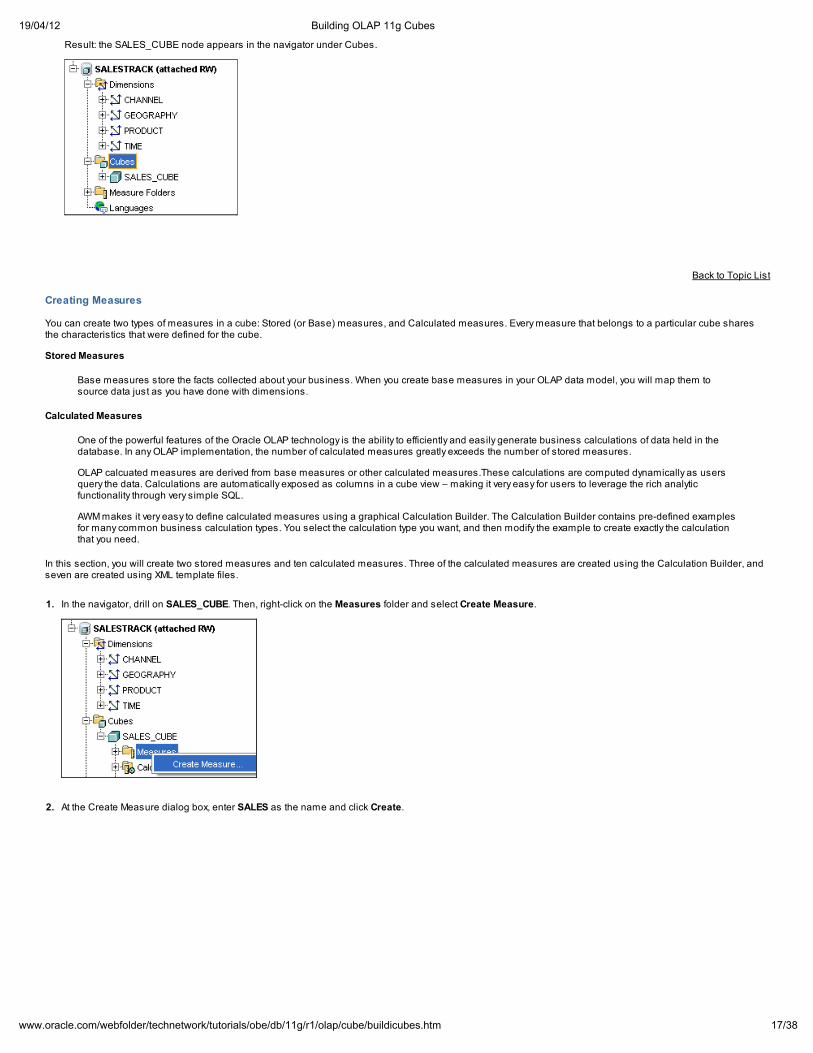
Result: the SALES_CUBE node appears in the navigator under Cubes.
Back to Topic List
Creating Measures
You can create two types of measures in a cube: Stored (or Base) measures, and Calculated measures. Every measure that belongs to a particular cube sharesthe characteristics that were defined for the cube.
Stored Measures
Base measures store the facts collected about your business. When you create base measures in your OLAP data model, you will map them tosource data just as you have done with dimensions.
Calculated Measures
One of the powerful features of the Oracle OLAP technology is the ability to efficiently and easily generate business calculations of data held in thedatabase. In any OLAP implementation, the number of calculated measures greatly exceeds the number of stored measures.
OLAP calcuated measures are derived from base measures or other calculated measures.These calculations are computed dynamically as usersquery the data. Calculations are automatically exposed as columns in a cube view – making it very easy for users to leverage the rich analyticfunctionality through very simple SQL.
AWM makes it very easy to define calculated measures using a graphical Calculation Builder. The Calculation Builder contains pre-defined examplesfor many common business calculation types. You select the calculation type you want, and then modify the example to create exactly the calculationthat you need.
In this section, you will create two stored measures and ten calculated measures. Three of the calculated measures are created using the Calculation Builder, andseven are created using XML template files.
1. In the navigator, drill on SALES_CUBE. Then, right-click on the Measures folder and select Create Measure.
2. At the Create Measure dialog box, enter SALES as the name and click Create.

19/04/12 Building OLAP 11g Cubes
18/38www.oracle.com/webfolder/technetwork/tutorials/obe/db/11g/r1/olap/cube/buildicubes.htm
3. Using the same techniques described in steps 1 and 2, create a second measure named QUANTITY.
In the navigator, drill on Measures. You should see the following:
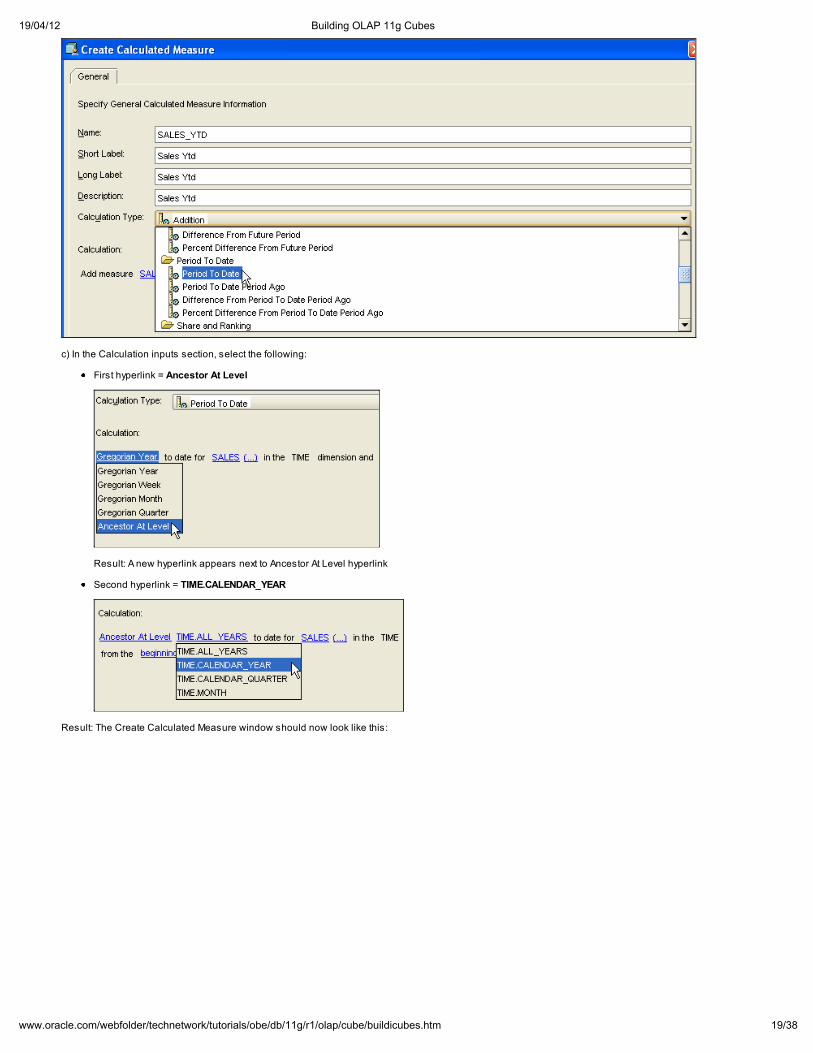
4. In the navigator, right-click on the Calculated Measures folder and select Create Calculated Measure.
5. In the Create Calculated Measure window, enter or select the following:
a) Name = SALES_YTD (the Name field is automatically all caps, and the Label and Description fields are auto-filled)
b) Calculation Type = Period to Date
19/04/12 Building OLAP 11g Cubes
19/38www.oracle.com/webfolder/technetwork/tutorials/obe/db/11g/r1/olap/cube/buildicubes.htm
c) In the Calculation inputs section, select the following:
First hyperlink = Ancestor At Level
Result: A new hyperlink appears next to Ancestor At Level hyperlink
Second hyperlink = TIME.CALENDAR_YEAR
Result: The Create Calculated Measure window should now look like this:
19/04/12 Building OLAP 11g Cubes
20/38www.oracle.com/webfolder/technetwork/tutorials/obe/db/11g/r1/olap/cube/buildicubes.htm
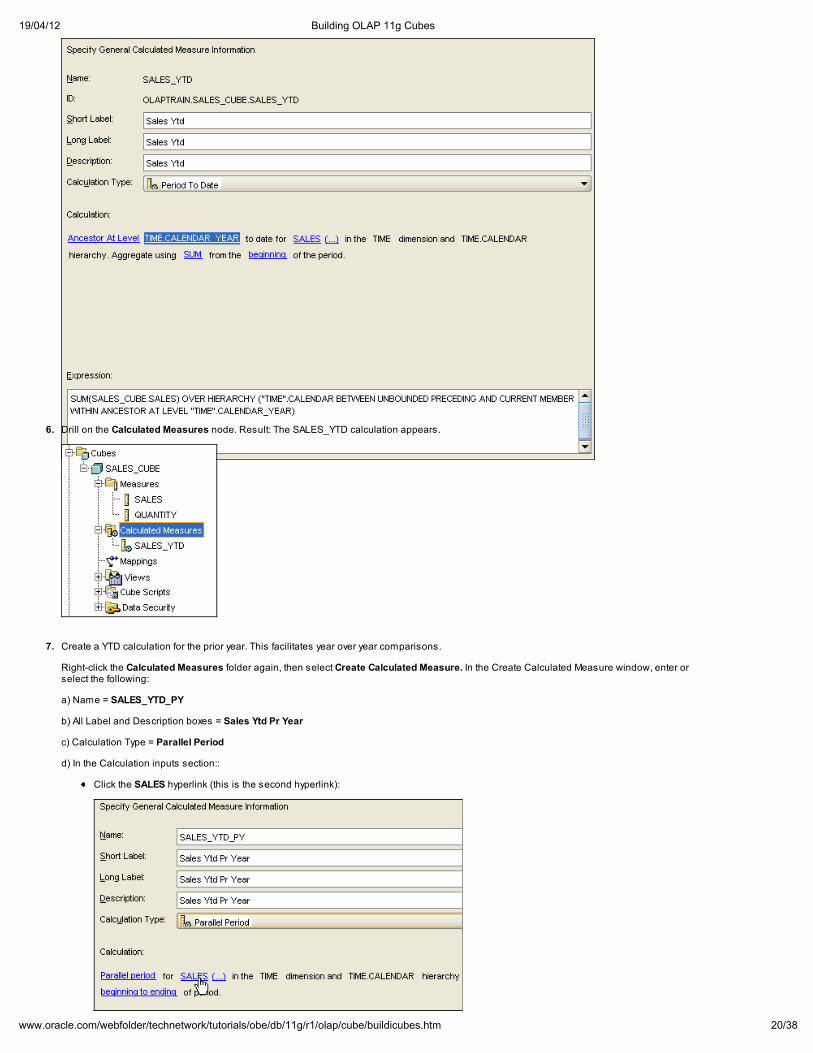
d) Click Create.
6. Drill on the Calculated Measures node. Result: The SALES_YTD calculation appears.
7. Create a YTD calculation for the prior year. This facilitates year over year comparisons.
Right-click the Calculated Measures folder again, then select Create Calculated Measure. In the Create Calculated Measure window, enter orselect the following:
a) Name = SALES_YTD_PY
b) All Label and Description boxes = Sales Ytd Pr Year
c) Calculation Type = Parallel Period
d) In the Calculation inputs section::
Click the SALES hyperlink (this is the second hyperlink):

19/04/12 Building OLAP 11g Cubes
21/38www.oracle.com/webfolder/technetwork/tutorials/obe/db/11g/r1/olap/cube/buildicubes.htm
Result: The Select Measure window appears.
Select SALES_YTD (as shown below) and then click OK.
Result: The Calculation updates with the selected measure.
Click the TIME.CALENDAR.ALL_YEARS hyperlink and select TIME.CALENDAR. CALENDAR_YEAR from the list, as shown here:
e) Click Create.
Result: The SALES_YTD_PY calculation appears below the Calculated Measures node in the Navigator.
8. Create a third calculation that measures the percent change in Year-To-Date sales when compared to the previous year. Right-click on theCalculated Measures folder and select Create Calculated Measure.
9. In the Create Calculated Measure window, enter or select the following:
a) Name = SALES_YTD_PY_PCT_CHG
b) All Label and Description boxes = Sales Ytd Pr Yr Pct Chg
c) Calculation Type = Percent Difference From Parallel Period
d) In the Calculation inputs section, click the SALES hyperlink.
e) In the Select Measure window, select SALES_YTD and click OK.
f) Click the TIME.CALENDAR.ALL_YEARS hyperlink and select TIME.CALENDAR. CALENDAR_YEAR from the list.
The calculation should now look like this:
19/04/12 Building OLAP 11g Cubes
22/38www.oracle.com/webfolder/technetwork/tutorials/obe/db/11g/r1/olap/cube/buildicubes.htm
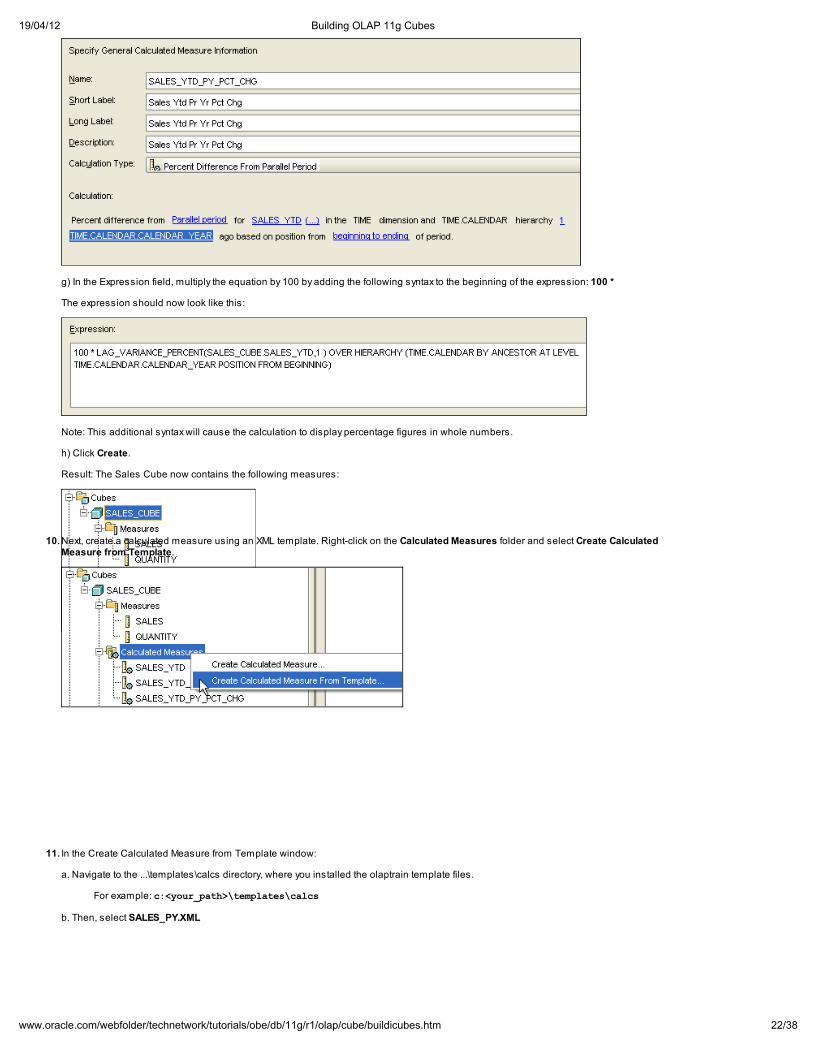
g) In the Expression field, multiply the equation by 100 by adding the following syntax to the beginning of the expression: 100 *
The expression should now look like this:
Note: This additional syntax will cause the calculation to display percentage figures in whole numbers.
h) Click Create.
Result: The Sales Cube now contains the following measures:
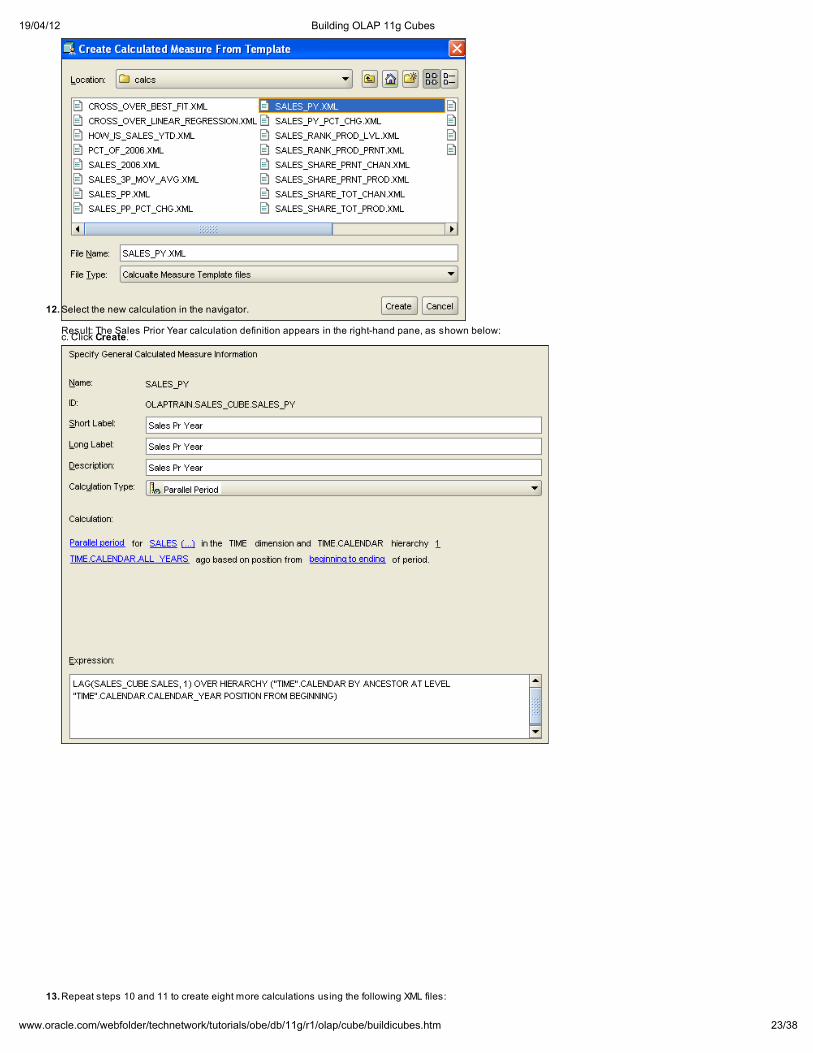
10.Next, create a calculated measure using an XML template. Right-click on the Calculated Measures folder and select Create CalculatedMeasure from Template.
11. In the Create Calculated Measure from Template window:
a. Navigate to the ...\templates\calcs directory, where you installed the olaptrain template files.
For example: c:<your_path>\templates\calcs
b. Then, select SALES_PY.XML
19/04/12 Building OLAP 11g Cubes
23/38www.oracle.com/webfolder/technetwork/tutorials/obe/db/11g/r1/olap/cube/buildicubes.htm
c. Click Create.
Result: The calculation appears in the navigator.
12.Select the new calculation in the navigator.
Result: The Sales Prior Year calculation definition appears in the right-hand pane, as shown below:
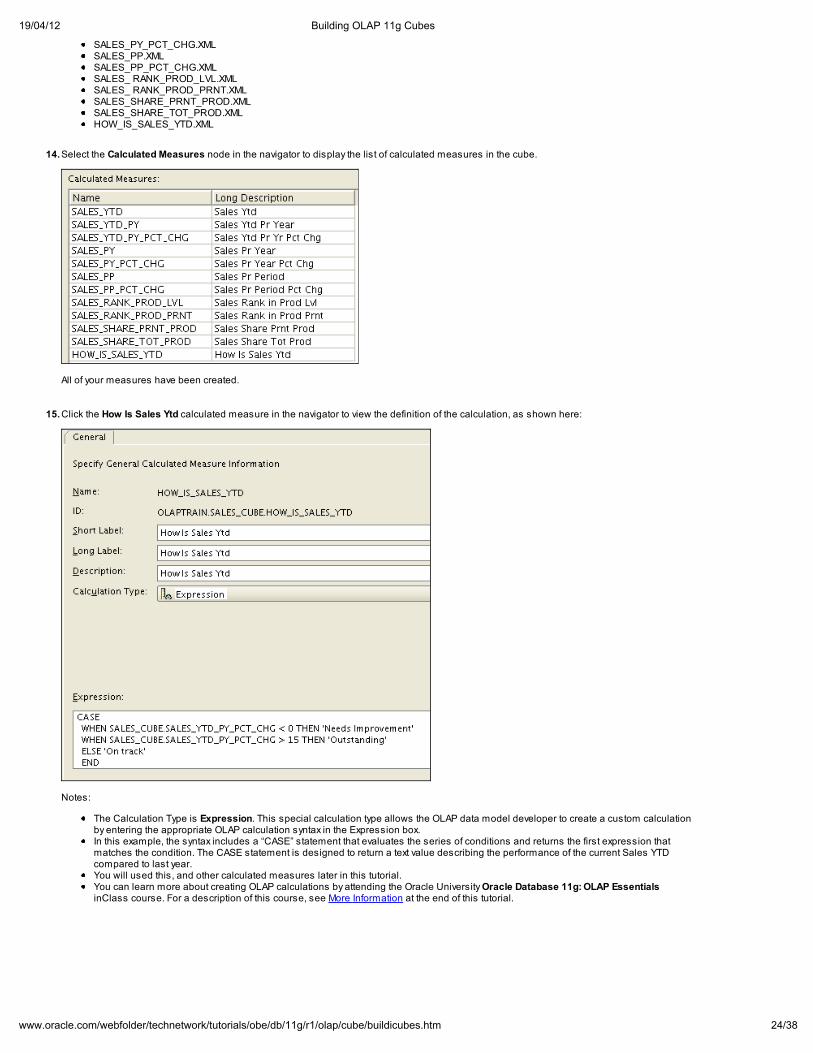
13.Repeat steps 10 and 11 to create eight more calculations using the following XML files:
19/04/12 Building OLAP 11g Cubes
24/38www.oracle.com/webfolder/technetwork/tutorials/obe/db/11g/r1/olap/cube/buildicubes.htm
SALES_PY_PCT_CHG.XMLSALES_PP.XMLSALES_PP_PCT_CHG.XMLSALES_ RANK_PROD_LVL.XMLSALES_ RANK_PROD_PRNT.XMLSALES_SHARE_PRNT_PROD.XMLSALES_SHARE_TOT_PROD.XMLHOW_IS_SALES_YTD.XML
14.Select the Calculated Measures node in the navigator to display the list of calculated measures in the cube.
All of your measures have been created.
15.Click the How Is Sales Ytd calculated measure in the navigator to view the definition of the calculation, as shown here:
Notes:
The Calculation Type is Expression. This special calculation type allows the OLAP data model developer to create a custom calculationby entering the appropriate OLAP calculation syntax in the Expression box.In this example, the syntax includes a “CASE” statement that evaluates the series of conditions and returns the first expression thatmatches the condition. The CASE statement is designed to return a text value describing the performance of the current Sales YTDcompared to last year.You will used this, and other calculated measures later in this tutorial.You can learn more about creating OLAP calculations by attending the Oracle University Oracle Database 11g: OLAP EssentialsinClass course. For a description of this course, see More Information at the end of this tutorial.
19/04/12 Building OLAP 11g Cubes
25/38www.oracle.com/webfolder/technetwork/tutorials/obe/db/11g/r1/olap/cube/buildicubes.htm
Back to Topic List
Mapping Cubes to Relational Sources
After creating an OLAP cube, you map it to relational data sources in Oracle Database. When mapping the cube, drag the appropriate source data column to theassociated field for the OLAP cube element.
You map the following fields:
The stored measures that are defined within the cube.
The lowest level of detail for each dimension hierarchy.
The Join Condition field. This field associates the foreign key (fk) column from the fact table to the primary key (pk) column from the dimension table.
Afterward, you can load data into your analytic workspace using the Maintain Analytic Workspace wizard.
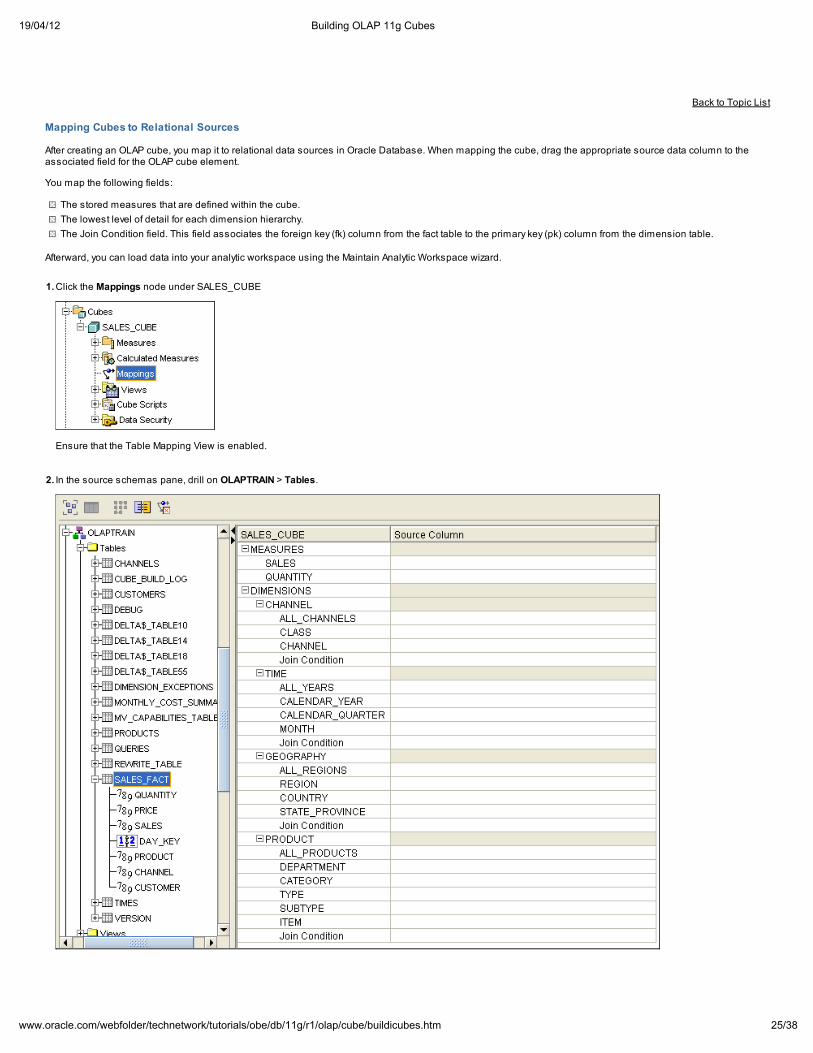
1.Click the Mappings node under SALES_CUBE
Ensure that the Table Mapping View is enabled.
2. In the source schemas pane, drill on OLAPTRAIN > Tables.
19/04/12 Building OLAP 11g Cubes
26/38www.oracle.com/webfolder/technetwork/tutorials/obe/db/11g/r1/olap/cube/buildicubes.htm
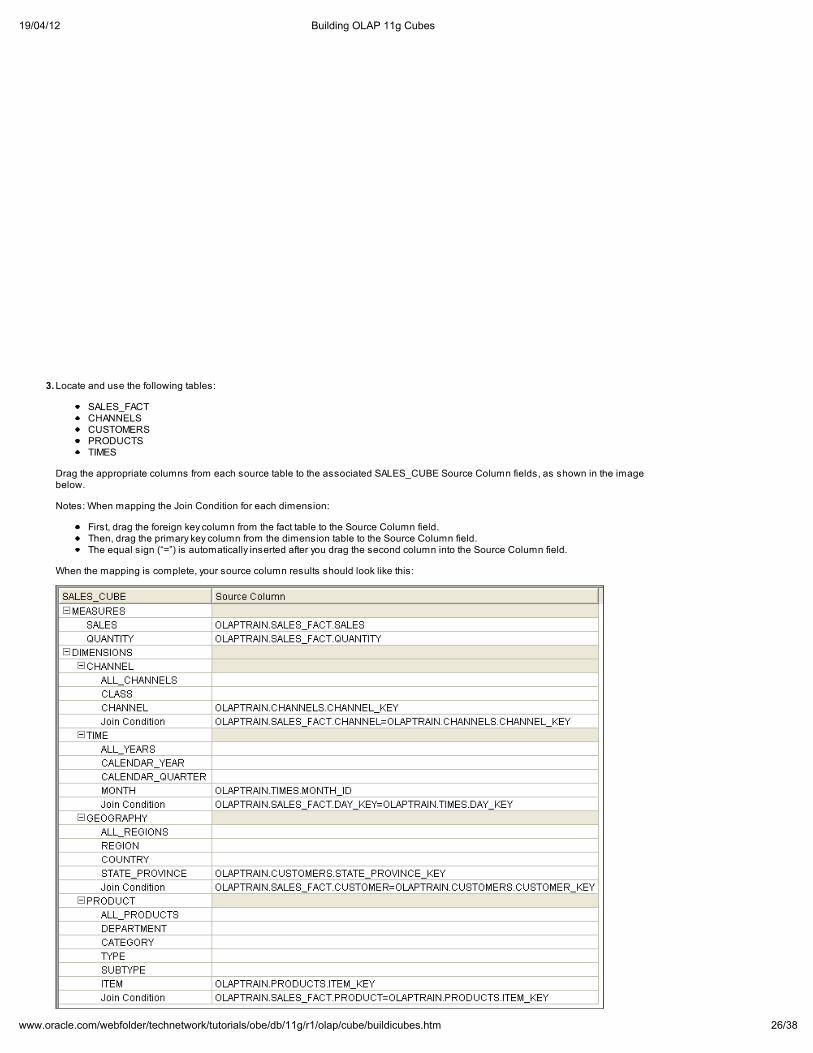
3.Locate and use the following tables:
SALES_FACTCHANNELSCUSTOMERSPRODUCTSTIMES
Drag the appropriate columns from each source table to the associated SALES_CUBE Source Column fields, as shown in the imagebelow.
Notes: When mapping the Join Condition for each dimension:
First, drag the foreign key column from the fact table to the Source Column field.Then, drag the primary key column from the dimension table to the Source Column field.The equal sign (“=”) is automatically inserted after you drag the second column into the Source Column field.
When the mapping is complete, your source column results should look like this:
19/04/12 Building OLAP 11g Cubes
27/38www.oracle.com/webfolder/technetwork/tutorials/obe/db/11g/r1/olap/cube/buildicubes.htm
4.Click Apply.
Back to Topic List
Enabling Query Rewrite to Cube MVs (optional)
In an extension of the Materialized View capabilities for Oracle Database 11g, OLAP cubes can be represented as a cube-organized materialized views (Cube MVs).The query optimizer automatically recognizes when an existing Cube MV can and should be used to satisfy a SQL summary request. A Cube MV represents asignificant summary space, and benefits include both ease of manageability and improved query performance.
If your OLAP system requirements do not include a need for summary management of exiting SQL-based BI applications, then you can skip this optional task.
Notes:
If you chose to enable query rewrite, supporting cube MV objects are automatically created and managed by the Oracle Database.
Before you can enable materialized views for the cube, you must first map the cube.
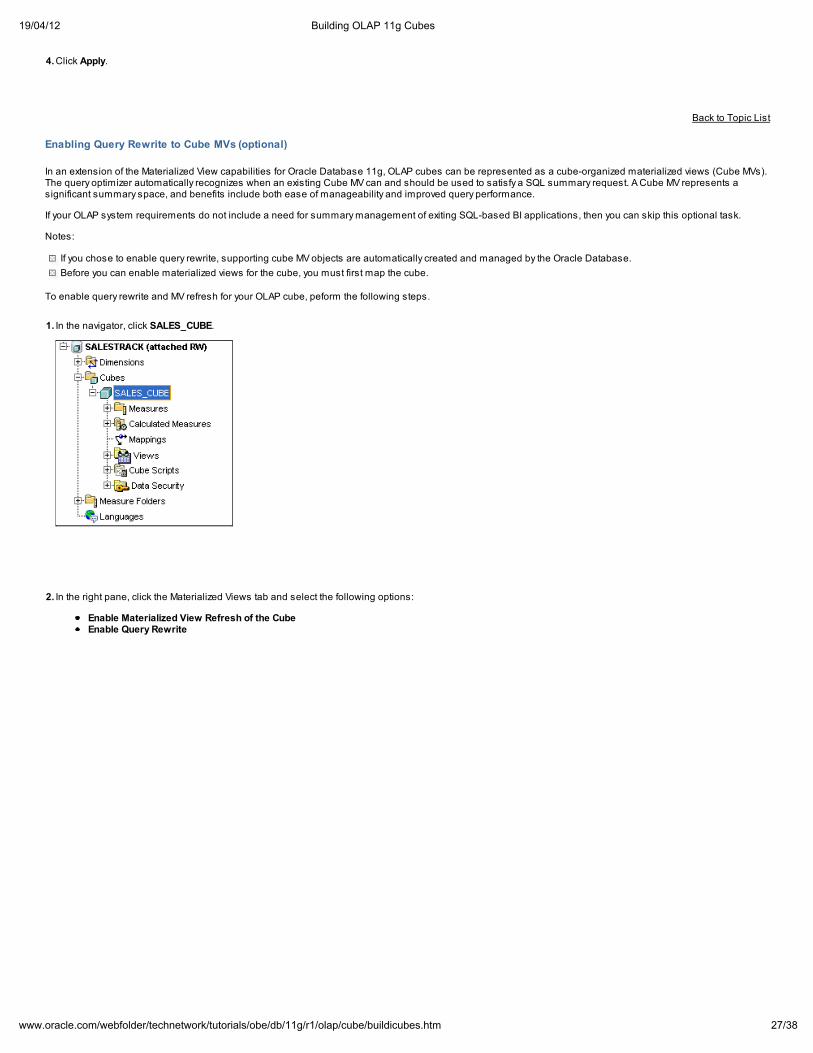
To enable query rewrite and MV refresh for your OLAP cube, peform the following steps.
1. In the navigator, click SALES_CUBE.
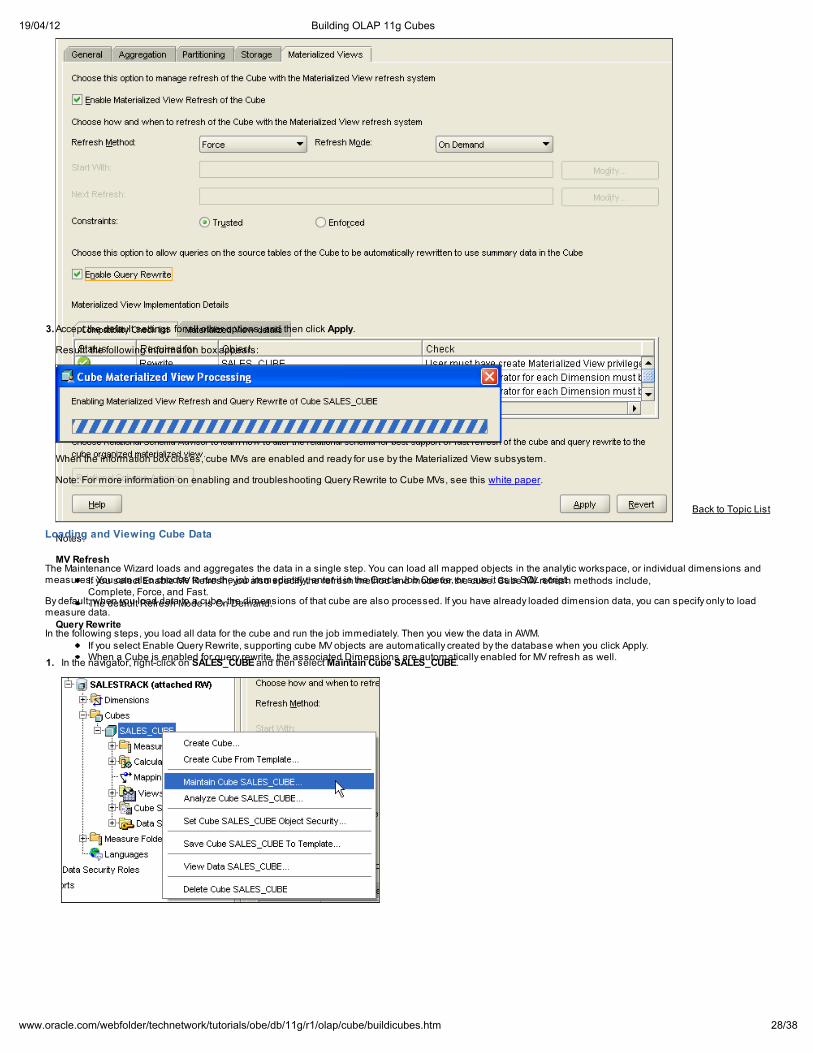
2. In the right pane, click the Materialized Views tab and select the following options:
Enable Materialized View Refresh of the CubeEnable Query Rewrite
19/04/12 Building OLAP 11g Cubes
28/38www.oracle.com/webfolder/technetwork/tutorials/obe/db/11g/r1/olap/cube/buildicubes.htm
Notes:
MV Refresh
If you select Enable MV Refresh, you also specify the refresh method and mode for the cube. Cube MV refresh methods include,Complete, Force, and Fast.The default Refresh Mode is On Demand.
Query Rewrite
If you select Enable Query Rewrite, supporting cube MV objects are automatically created by the database when you click Apply.When a Cube is enabled for query rewrite, the associated Dimensions are automatically enabled for MV refresh as well.
3.Accept the default settings for all other options, and then click Apply.
Result: the following information box appears:
When the information box closes, cube MVs are enabled and ready for use by the Materialized View subsystem.
Note: For more information on enabling and troubleshooting Query Rewrite to Cube MVs, see this white paper.
Back to Topic List
Loading and Viewing Cube Data
The Maintenance Wizard loads and aggregates the data in a single step. You can load all mapped objects in the analytic workspace, or individual dimensions andmeasures. You can also choose to run the job immediately, enter it in the Oracle Job Queue, or save it as a SQL script.
By default, when you load data to a cube, the dimensions of that cube are also processed. If you have already loaded dimension data, you can specify only to loadmeasure data.
In the following steps, you load all data for the cube and run the job immediately. Then you view the data in AWM.
1. In the navigator, right-click on SALES_CUBE and then select Maintain Cube SALES_CUBE.

19/04/12 Building OLAP 11g Cubes
29/38www.oracle.com/webfolder/technetwork/tutorials/obe/db/11g/r1/olap/cube/buildicubes.htm
2. In the Maintenance Wizard, click Finish to begin the load process.
Note: The default settings for an immediate build of all cube objects is applied.
Result: The following information box appears:
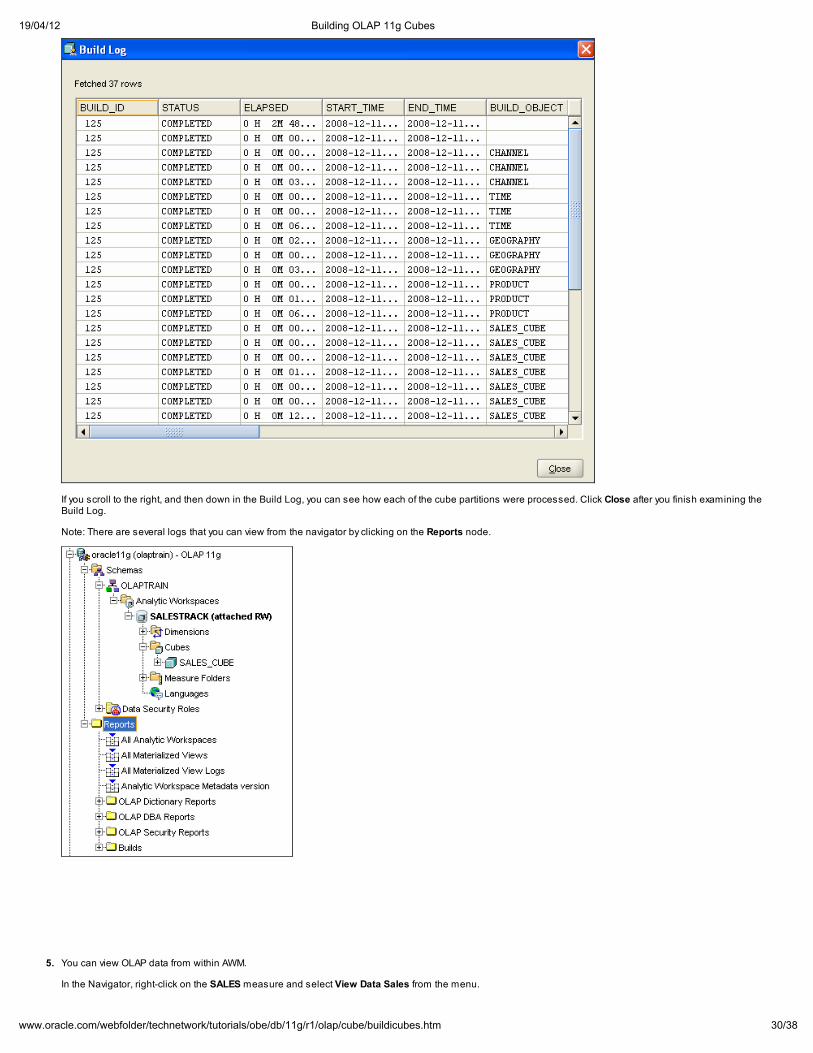
3. When the build completes, the Build Log window appears.
19/04/12 Building OLAP 11g Cubes
30/38www.oracle.com/webfolder/technetwork/tutorials/obe/db/11g/r1/olap/cube/buildicubes.htm
If you scroll to the right, and then down in the Build Log, you can see how each of the cube partitions were processed. Click Close after you finish examining theBuild Log.
Note: There are several logs that you can view from the navigator by clicking on the Reports node.
5. You can view OLAP data from within AWM.
In the Navigator, right-click on the SALES measure and select View Data Sales from the menu.
19/04/12 Building OLAP 11g Cubes
31/38www.oracle.com/webfolder/technetwork/tutorials/obe/db/11g/r1/olap/cube/buildicubes.htm
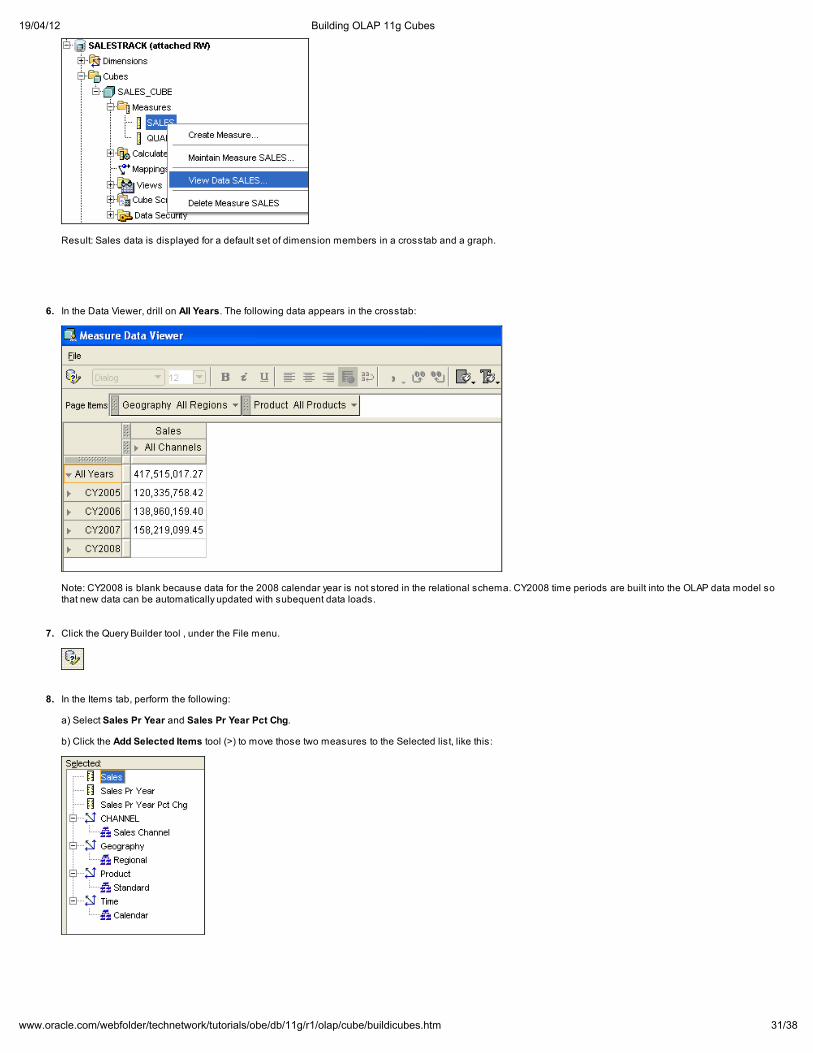
Result: Sales data is displayed for a default set of dimension members in a crosstab and a graph.
6. In the Data Viewer, drill on All Years. The following data appears in the crosstab:
Note: CY2008 is blank because data for the 2008 calendar year is not stored in the relational schema. CY2008 time periods are built into the OLAP data model sothat new data can be automatically updated with subequent data loads.
7. Click the Query Builder tool , under the File menu.
8. In the Items tab, perform the following:
a) Select Sales Pr Year and Sales Pr Year Pct Chg.
b) Click the Add Selected Items tool (>) to move those two measures to the Selected list, like this:
19/04/12 Building OLAP 11g Cubes
32/38www.oracle.com/webfolder/technetwork/tutorials/obe/db/11g/r1/olap/cube/buildicubes.htm
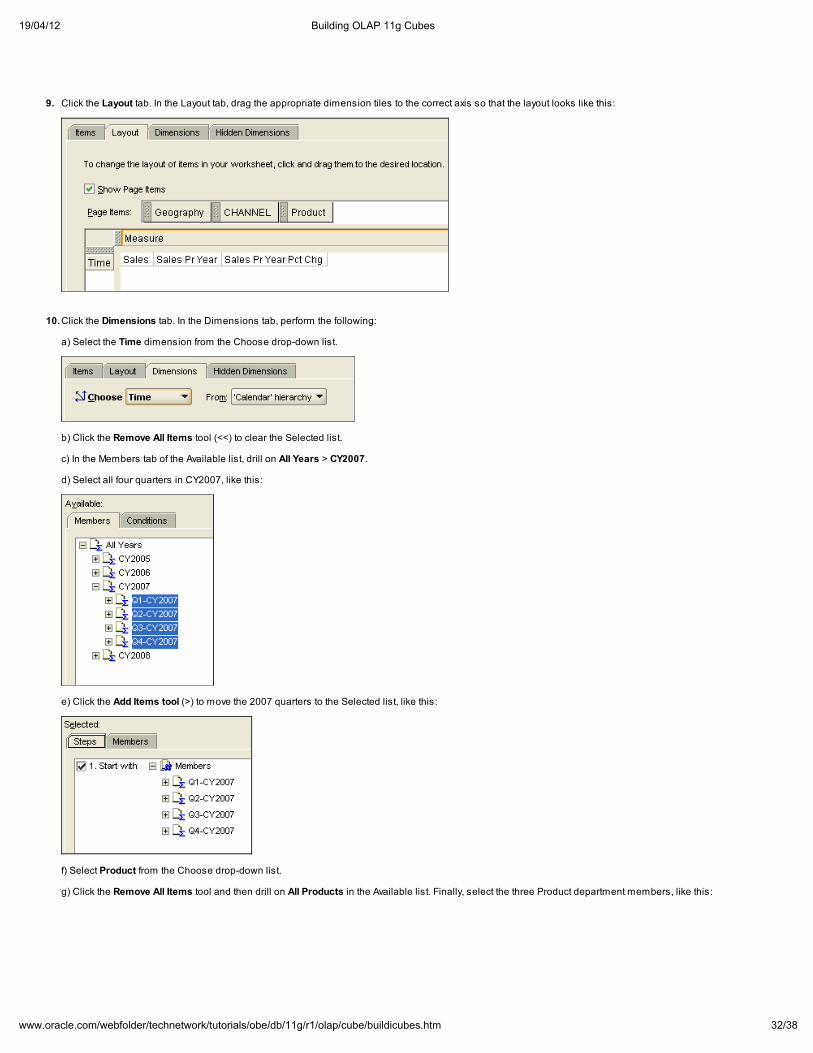
9. Click the Layout tab. In the Layout tab, drag the appropriate dimension tiles to the correct axis so that the layout looks like this:
10.Click the Dimensions tab. In the Dimensions tab, perform the following:
a) Select the Time dimension from the Choose drop-down list.
b) Click the Remove All Items tool (<<) to clear the Selected list.
c) In the Members tab of the Available list, drill on All Years > CY2007.
d) Select all four quarters in CY2007, like this:
e) Click the Add Items tool (>) to move the 2007 quarters to the Selected list, like this:
f) Select Product from the Choose drop-down list.
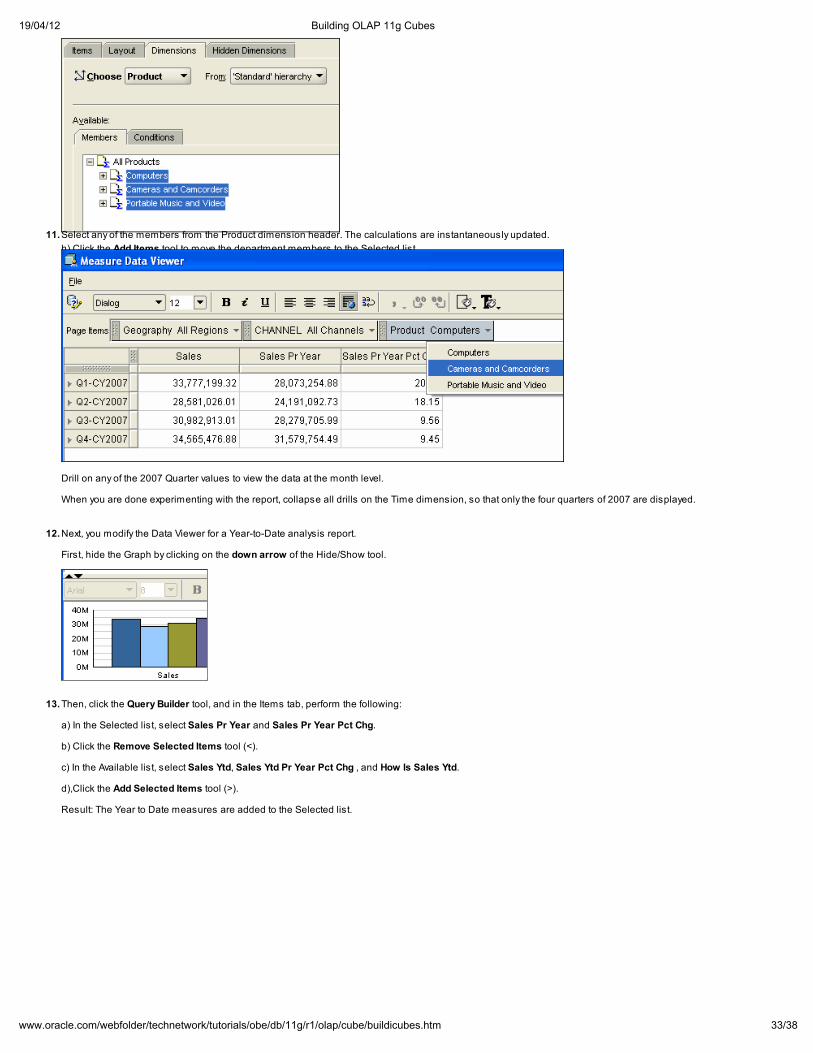
g) Click the Remove All Items tool and then drill on All Products in the Available list. Finally, select the three Product department members, like this:
19/04/12 Building OLAP 11g Cubes
33/38www.oracle.com/webfolder/technetwork/tutorials/obe/db/11g/r1/olap/cube/buildicubes.htm
h) Click the Add Items tool to move the department members to the Selected list.
i) Click OK to view the data.
11.Select any of the members from the Product dimension header. The calculations are instantaneously updated.
Drill on any of the 2007 Quarter values to view the data at the month level.
When you are done experimenting with the report, collapse all drills on the Time dimension, so that only the four quarters of 2007 are displayed.
12.Next, you modify the Data Viewer for a Year-to-Date analysis report.
First, hide the Graph by clicking on the down arrow of the Hide/Show tool.
13.Then, click the Query Builder tool, and in the Items tab, perform the following:
a) In the Selected list, select Sales Pr Year and Sales Pr Year Pct Chg.
b) Click the Remove Selected Items tool (<).
c) In the Available list, select Sales Ytd, Sales Ytd Pr Year Pct Chg , and How Is Sales Ytd.
d),Click the Add Selected Items tool (>).
Result: The Year to Date measures are added to the Selected list.
19/04/12 Building OLAP 11g Cubes
34/38www.oracle.com/webfolder/technetwork/tutorials/obe/db/11g/r1/olap/cube/buildicubes.htm
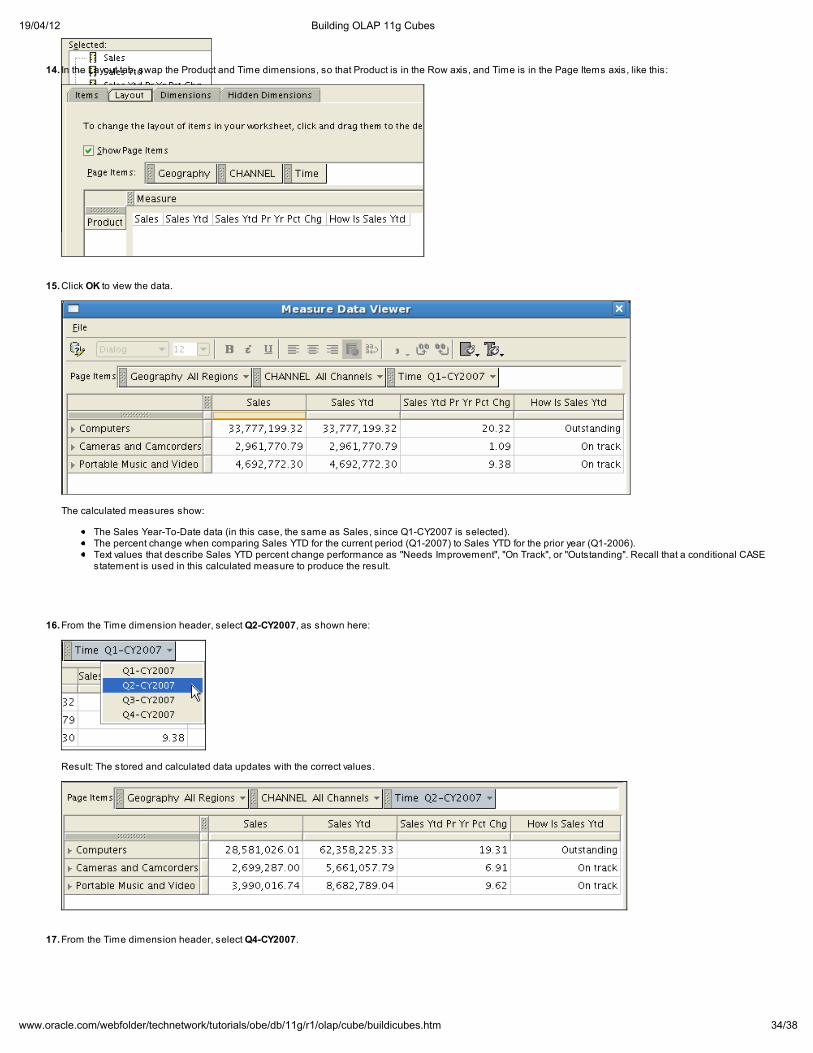
14. In the Layout tab, swap the Product and Time dimensions, so that Product is in the Row axis, and Time is in the Page Items axis, like this:
15.Click OK to view the data.
The calculated measures show:
The Sales Year-To-Date data (in this case, the same as Sales, since Q1-CY2007 is selected).The percent change when comparing Sales YTD for the current period (Q1-2007) to Sales YTD for the prior year (Q1-2006).Text values that describe Sales YTD percent change performance as "Needs Improvement", "On Track", or "Outstanding". Recall that a conditional CASEstatement is used in this calculated measure to produce the result.
16.From the Time dimension header, select Q2-CY2007, as shown here:
Result: The stored and calculated data updates with the correct values.
17.From the Time dimension header, select Q4-CY2007.
19/04/12 Building OLAP 11g Cubes
35/38www.oracle.com/webfolder/technetwork/tutorials/obe/db/11g/r1/olap/cube/buildicubes.htm
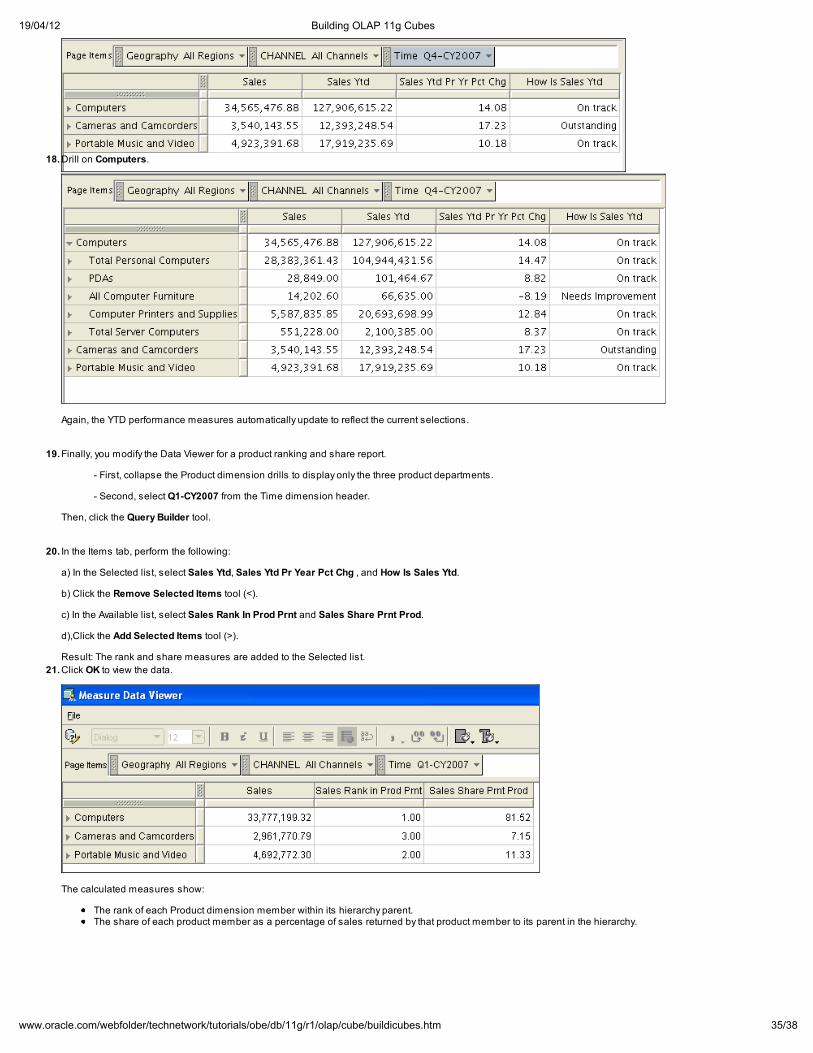
The How Is Sales Ytd measure correctly reflects the newly queried data.
18.Drill on Computers.
Again, the YTD performance measures automatically update to reflect the current selections.
19.Finally, you modify the Data Viewer for a product ranking and share report.
- First, collapse the Product dimension drills to display only the three product departments.
- Second, select Q1-CY2007 from the Time dimension header.
Then, click the Query Builder tool.
20. In the Items tab, perform the following:
a) In the Selected list, select Sales Ytd, Sales Ytd Pr Year Pct Chg , and How Is Sales Ytd.
b) Click the Remove Selected Items tool (<).
c) In the Available list, select Sales Rank In Prod Prnt and Sales Share Prnt Prod.
d),Click the Add Selected Items tool (>).
Result: The rank and share measures are added to the Selected list.
21.Click OK to view the data.
The calculated measures show:
The rank of each Product dimension member within its hierarchy parent.The share of each product member as a percentage of sales returned by that product member to its parent in the hierarchy.

19/04/12 Building OLAP 11g Cubes
36/38www.oracle.com/webfolder/technetwork/tutorials/obe/db/11g/r1/olap/cube/buildicubes.htm
22.Drill on Computers.
The rank and share measures show the relative ranking and share contribution for each of the Product division members in the Computer department.
23.Select any Time member from the Page Items axis, and the calculations update instantaneously.
Feel free to modify the report by drilling or selected other dimension members.
When you are done, close the Measure Data Viewer.
24.You can also perform ad-hoc, multidimensional analysis against OLAP data with any SQL-based tool. Oracle OLAP data is made directly accessible to SQL by aset of relational views that are automatically created and maintained by Oracle OLAP. You query OLAP data by executing simple SQL statements against theseassociated Cube Views.
Click SALES_CUBE_VIEW -- the view created for SALES_CUBE -- to display information and data for the view.
Oracle OLAP creates and maintains views for each cube and dimension. These views represent an OLAP Cube as a star schema with the followingcharacteristics:
A cube view plays the role of a fact table.Dimension views and hierarchy views play the role of dimension tables (a dimension and a hierarchy view are created and maintained for each dimension

19/04/12 Building OLAP 11g Cubes
37/38www.oracle.com/webfolder/technetwork/tutorials/obe/db/11g/r1/olap/cube/buildicubes.htm
in the OLAP data model).
Although SQL access to OLAP cubes is covered in another tutorial, an example of a SQL query against the cube that you just created is provided next.
25. In the example shown here, SQL Developer is used to write a SQL query.
The SQL statement, explained by in-line notes, queries the same data that is selected by AWM in step 21.
Note: SQL Developer is shipped free with Oracle Database.
26.The query above is executed, and the resulting output shows the same data that was returned in step 21.

19/04/12 Building OLAP 11g Cubes
38/38www.oracle.com/webfolder/technetwork/tutorials/obe/db/11g/r1/olap/cube/buildicubes.htm
For information how to query OLAP data using SQL, see the Querying OLAP 11g Cubes OBE lesson.
Back to Topic List
More Information
For more information on OLAP-related education, use the following links:
Oracle Database 11g: OLAP Essentials (Oracle University inClass)
Querying OLAP 11g Cubes (OBE)
Using Oracle OLAP 11g With Oracle BI Enterprise Edition (OBE)
Creating Interactive APEX Reports Over OLAP 11g Cubes (OBE)
Back to Topic List
Place the cursor over this icon to hide all screenshots.