Embed Size (px)
Citation preview
1150 Roberts Blvd Kennesaw, Georgia 30144
770/429-3000 Fax 770/429-3001
www.automatedlogic.com
Building intrinsic analytics into Automated Logic’s WebCTRL®
Admiral Ernest J. King
Admiral Ernest J. King was the U.S. Chief of Naval Operations during World War II. He was a key player in the success of the war effort; however, his greatest contribution may have been in the field of logistics. U.S. forces were engaged in combat around the world, and to a large extent it was the U.S. Navy that kept them supplied with food, fuel, vehicles, ammunition, tents, construction materials, and thousands of other items that were needed throughout the Pacific, Atlantic, Mediterranean, and African camps. It’s not surprising that Admiral King’s name is legend within military logistics channels, but what is surprising is the quote for which he is most remembered. While leaving a meeting with his Army counterpart, U.S. Army Chief of Staff General George C. Marshall, Admiral King turned to an aide and said "I don't know what the hell this ‘logistics’ is that Marshall is always talking about, but I want some of it."
Obviously Admiral King knew a great deal about logistics. He couldn’t have succeeded in his position without understanding the importance of materials and transportation. However, he wasn’t very familiar with the term “logistics.” Many people have a similar reaction to the word “analytics.” They read magazine articles about how analytics is revolutionizing building management, receive multiple e-mails every day advertising new analytics packages, and attend seminars where consultants talk about how they saved thousands of dollars by using analytics. They may not understand “analytics,” but they know they want some of it. This paper will provide a brief explanation of what analytics is and will show how Automated Logic (ALC) is building analytic tools into current and planned future releases of WebCTRL®. The WebCTRL Building Automation System provides the ability to understand a building’s
Automated Logic / Analytics Page | 1 May, 2015
operation and analyze the results. WebCTRL integrates environmental, energy, security and safety systems into one powerful management tool minimizing energy consumption, maximizing occupant comfort, and achieving sustainable building operations.
What is analytics?
Since about 1590 AD when the word “analytics” came into existence, there have been many different definitions. However, it is consistently defined as a “science,” a “method,” or a “system. While the various definitions of analytics are generally consistent, some are so broad that they could apply to almost anything. Wikipedia proposes a definition that is relevant to building automation. The full definition is lengthy, but the three key points are:
• Analytics is the discovery and communication of meaningful patterns in data • Analytics often favors data visualization to communicate insight • The insights from data are used to recommend action or to guide decision making
The first bullet essentially defines the term “analytics.” Sometimes advanced statistical tools are used to discover patterns, but it’s important to understand that these are simply tools used to support analytics. Analytics is not a statistical process; it is the discovery and communication of patterns in data. The second bullet describes a favored technique because it emphasizes the fact that analytics are used to provide data visualization and insight – two factors that are unique to humans. Analytics is not an automated process that occurs in the background; however, it is a technique used to help humans make sense of data. This is driven home in the third point, which provides the purpose of analytics – to recommend action or to guide decision making. Analytics can help a building manager improve the operation of a facility, save energy, improve comfort, reduce maintenance, and make equipment last longer.
The buzzword “analytics” is often applied to stand-alone computer programs that extract data from a building automation system (BAS), analyze it, and provide suggestions on how to make the system run more efficiently. Often these systems run in “the cloud,” adding an element of technical black magic to their appeal. Properly applied, analytics can do amazing things. If applied improperly, they provide yet another example of the old computer adage “garbage in = garbage out.” The key is to pick the right analytics package and apply it properly. Automated Logic is experimenting with analytics packages and working with the United Technologies Research Center (UTRC) as well as with other UTC sister companies to see which packages work well and how they can be applied to WebCTRL. The company is also investigating emerging technologies such as semantic tagging which is intended to make it easier for separate analytic programs to make sense out of the data they extract from a BAS, since mapping this data into current analytic packages can be an expensive proposition.
Analytics doesn’t need to involve a third-party computer program. The Wikipedia definition does not state that analytics is performed by a stand-alone computer program, nor does it mention anything about data mapping, cloud services, or any other tool that is needed by an external program. There are many ways in which analytics is performed by the building automation system itself. These intrinsic
Automated Logic / Analytics Page | 2 May, 2015
analytics are built into the user interface, displaying meaningful patterns that communicate insight and guide decision making. Since these features are built into the core product, they don’t require external programs or expensive data mapping. This makes them useful to customers who can’t afford expensive add-on services, or whose security requirements don’t permit them to export data to the cloud. More importantly, intrinsic analytics are consistent with a key element of distributed control and implement algorithms at the level at which data is available. Some sophisticated analytic functions require data from the entire system. It makes sense to implement those functions in a central computer. Searching for new patterns, for example, may require data from multiple parts of the system. Looking for correlations between random streams of data is not an automatic search performed by the computer. These are guided searches, using rules developed by an operator who understands how the system should operate, looking for anomalies that might indicate a problem. The rules might, for example, compare the performances of identical chillers when operating with similar loads. If one chiller consistently outperformed its supposedly twin sibling, that might indicate a problem. It would take additional searches with additional rules to determine the exact nature of the problem, but a central analytics system makes it easy to conduct these additional searches.
Thermographic Floor Plans:
Sometimes, the rules are well known and are easily performed at a local level. For more than 20 years, ALC systems have compared the actual temperature of a room to the desired temperature (setpoint) and presented the difference as a thermographic color. Traditionally we described this as an example of how our system was “providing the user with information, not just data.” Today we would describe this as “favoring data visualization to communicate insight.” In other words, we’re implementing analytics.
Automated Logic / Analytics Page | 3 May, 2015
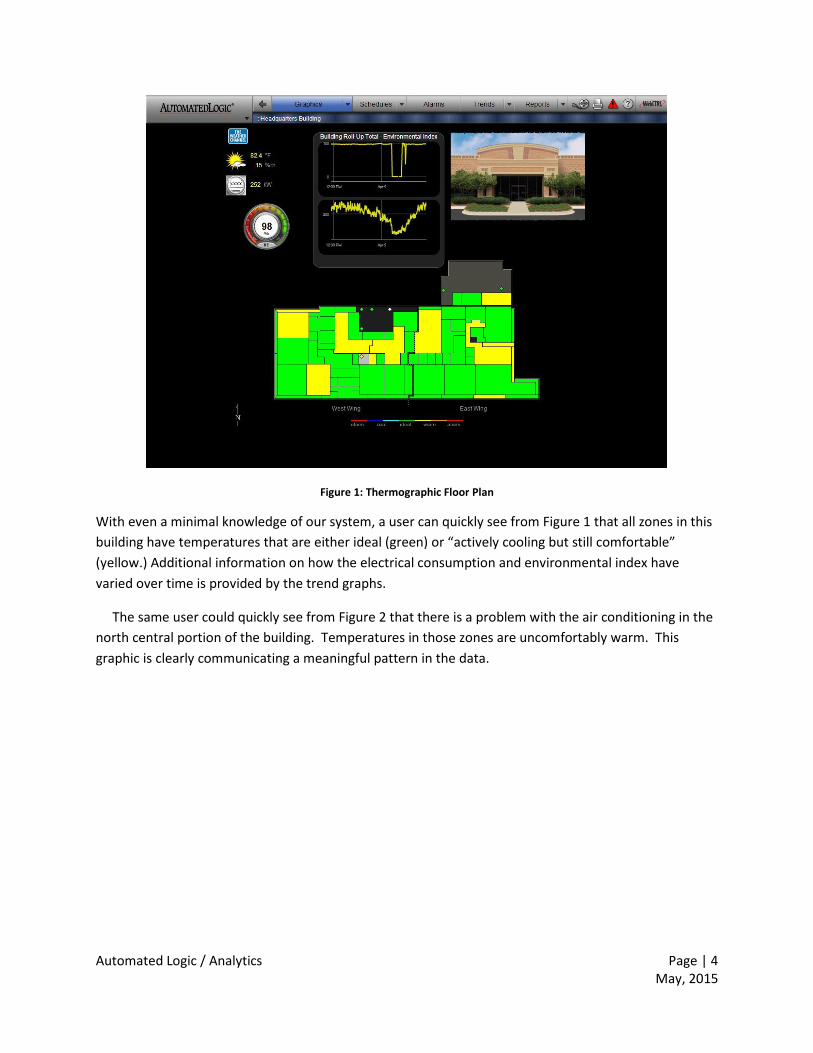
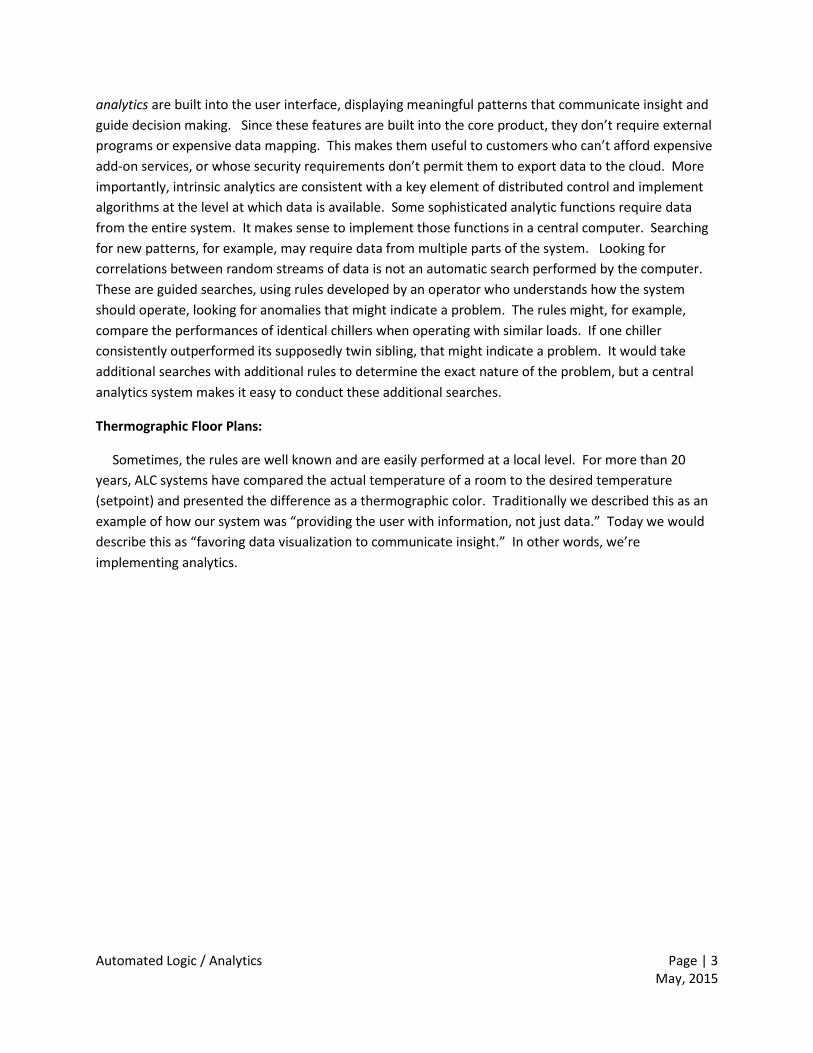
Figure 1: Thermographic Floor Plan
With even a minimal knowledge of our system, a user can quickly see from Figure 1 that all zones in this building have temperatures that are either ideal (green) or “actively cooling but still comfortable” (yellow.) Additional information on how the electrical consumption and environmental index have varied over time is provided by the trend graphs.
The same user could quickly see from Figure 2 that there is a problem with the air conditioning in the north central portion of the building. Temperatures in those zones are uncomfortably warm. This graphic is clearly communicating a meaningful pattern in the data.
Automated Logic / Analytics Page | 4 May, 2015
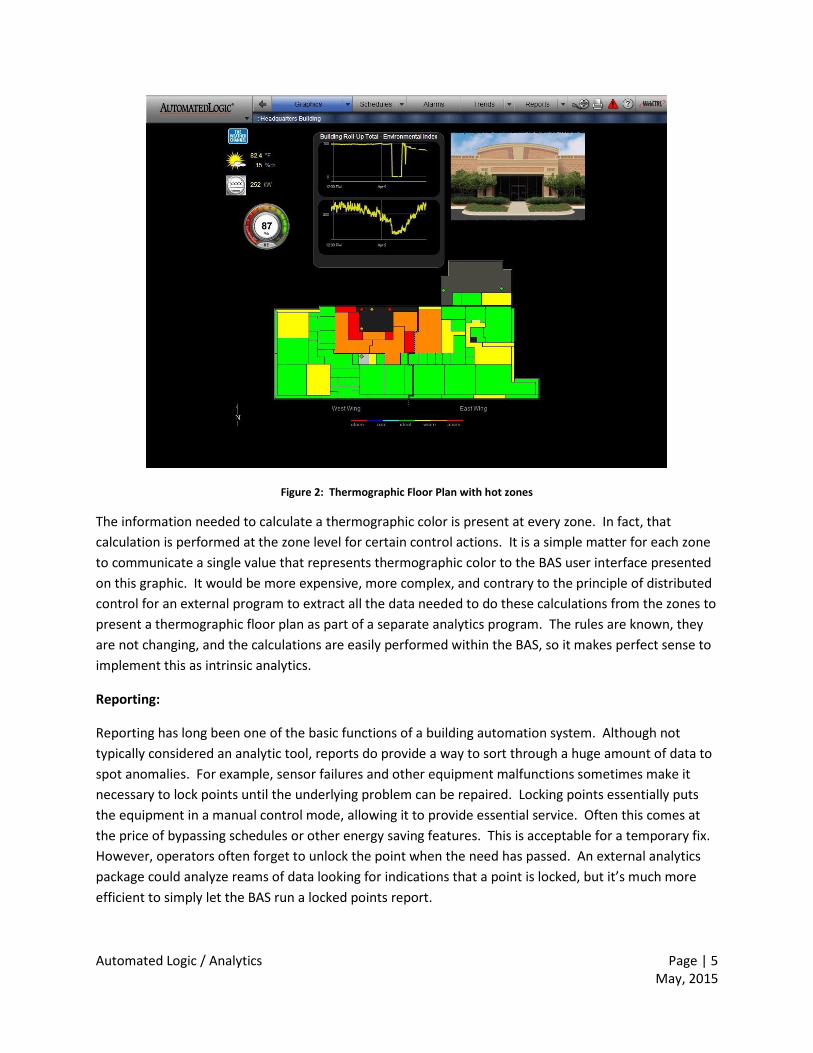
Figure 2: Thermographic Floor Plan with hot zones
The information needed to calculate a thermographic color is present at every zone. In fact, that calculation is performed at the zone level for certain control actions. It is a simple matter for each zone to communicate a single value that represents thermographic color to the BAS user interface presented on this graphic. It would be more expensive, more complex, and contrary to the principle of distributed control for an external program to extract all the data needed to do these calculations from the zones to present a thermographic floor plan as part of a separate analytics program. The rules are known, they are not changing, and the calculations are easily performed within the BAS, so it makes perfect sense to implement this as intrinsic analytics.
Reporting:
Reporting has long been one of the basic functions of a building automation system. Although not typically considered an analytic tool, reports do provide a way to sort through a huge amount of data to spot anomalies. For example, sensor failures and other equipment malfunctions sometimes make it necessary to lock points until the underlying problem can be repaired. Locking points essentially puts the equipment in a manual control mode, allowing it to provide essential service. Often this comes at the price of bypassing schedules or other energy saving features. This is acceptable for a temporary fix. However, operators often forget to unlock the point when the need has passed. An external analytics package could analyze reams of data looking for indications that a point is locked, but it’s much more efficient to simply let the BAS run a locked points report.
Automated Logic / Analytics Page | 5 May, 2015
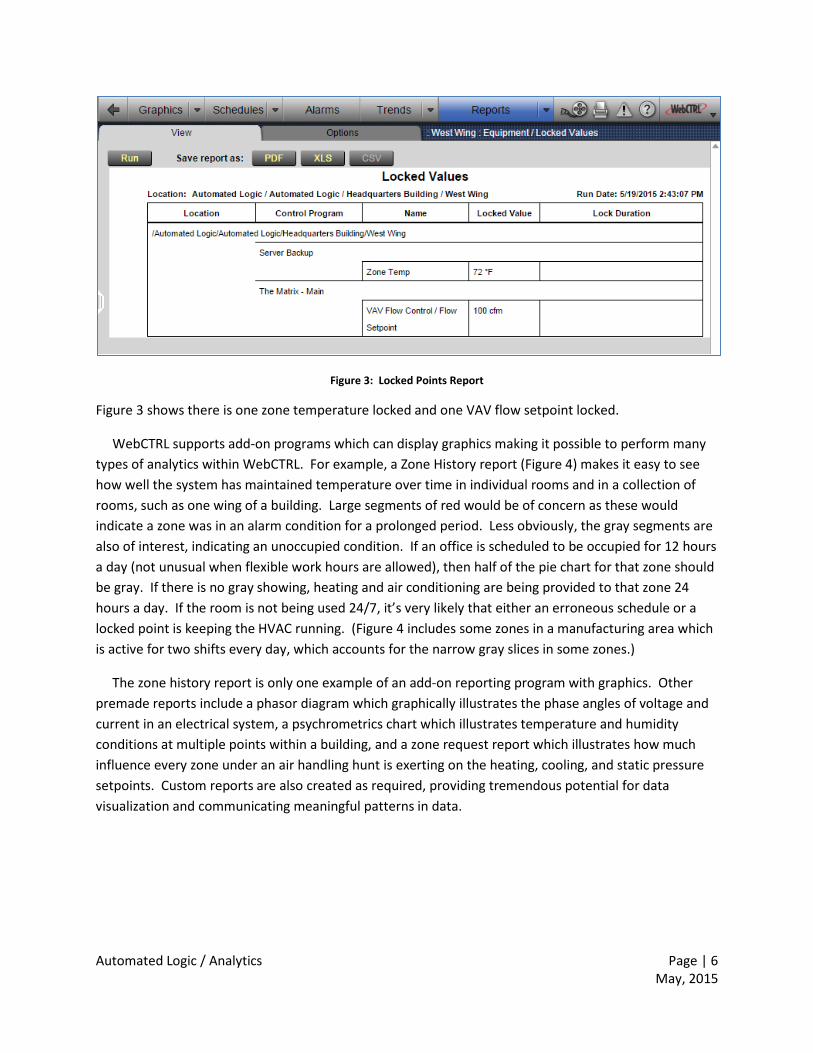
Figure 3: Locked Points Report
Figure 3 shows there is one zone temperature locked and one VAV flow setpoint locked.
WebCTRL supports add-on programs which can display graphics making it possible to perform many types of analytics within WebCTRL. For example, a Zone History report (Figure 4) makes it easy to see how well the system has maintained temperature over time in individual rooms and in a collection of rooms, such as one wing of a building. Large segments of red would be of concern as these would indicate a zone was in an alarm condition for a prolonged period. Less obviously, the gray segments are also of interest, indicating an unoccupied condition. If an office is scheduled to be occupied for 12 hours a day (not unusual when flexible work hours are allowed), then half of the pie chart for that zone should be gray. If there is no gray showing, heating and air conditioning are being provided to that zone 24 hours a day. If the room is not being used 24/7, it’s very likely that either an erroneous schedule or a locked point is keeping the HVAC running. (Figure 4 includes some zones in a manufacturing area which is active for two shifts every day, which accounts for the narrow gray slices in some zones.)
The zone history report is only one example of an add-on reporting program with graphics. Other premade reports include a phasor diagram which graphically illustrates the phase angles of voltage and current in an electrical system, a psychrometrics chart which illustrates temperature and humidity conditions at multiple points within a building, and a zone request report which illustrates how much influence every zone under an air handling hunt is exerting on the heating, cooling, and static pressure setpoints. Custom reports are also created as required, providing tremendous potential for data visualization and communicating meaningful patterns in data.
Automated Logic / Analytics Page | 6 May, 2015
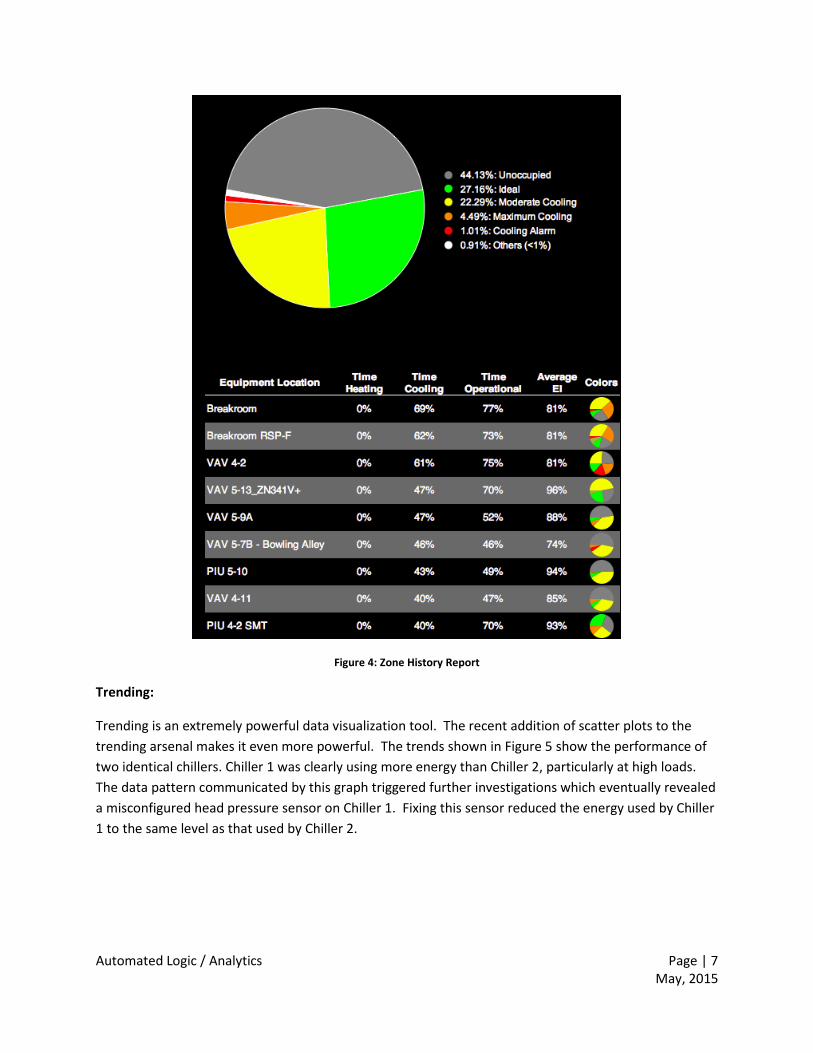
Figure 4: Zone History Report
Trending:
Trending is an extremely powerful data visualization tool. The recent addition of scatter plots to the trending arsenal makes it even more powerful. The trends shown in Figure 5 show the performance of two identical chillers. Chiller 1 was clearly using more energy than Chiller 2, particularly at high loads. The data pattern communicated by this graph triggered further investigations which eventually revealed a misconfigured head pressure sensor on Chiller 1. Fixing this sensor reduced the energy used by Chiller 1 to the same level as that used by Chiller 2.
Automated Logic / Analytics Page | 7 May, 2015
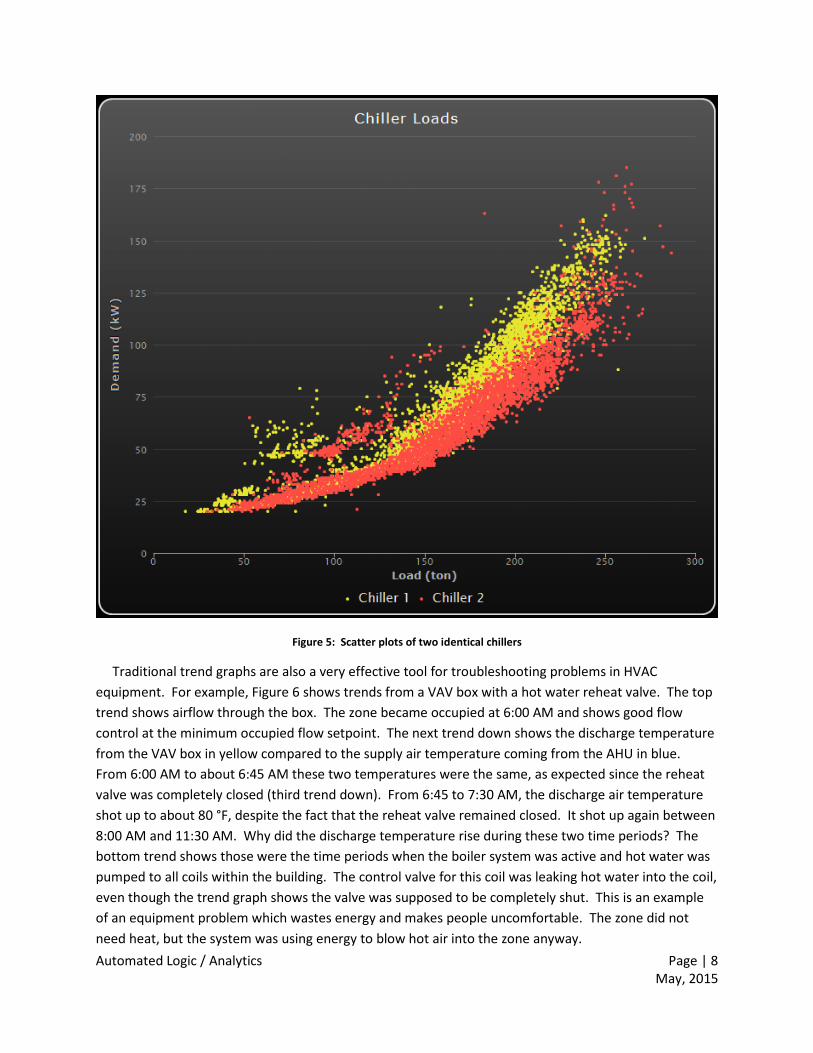
Figure 5: Scatter plots of two identical chillers
Traditional trend graphs are also a very effective tool for troubleshooting problems in HVAC equipment. For example, Figure 6 shows trends from a VAV box with a hot water reheat valve. The top trend shows airflow through the box. The zone became occupied at 6:00 AM and shows good flow control at the minimum occupied flow setpoint. The next trend down shows the discharge temperature from the VAV box in yellow compared to the supply air temperature coming from the AHU in blue. From 6:00 AM to about 6:45 AM these two temperatures were the same, as expected since the reheat valve was completely closed (third trend down). From 6:45 to 7:30 AM, the discharge air temperature shot up to about 80 °F, despite the fact that the reheat valve remained closed. It shot up again between 8:00 AM and 11:30 AM. Why did the discharge temperature rise during these two time periods? The bottom trend shows those were the time periods when the boiler system was active and hot water was pumped to all coils within the building. The control valve for this coil was leaking hot water into the coil, even though the trend graph shows the valve was supposed to be completely shut. This is an example of an equipment problem which wastes energy and makes people uncomfortable. The zone did not need heat, but the system was using energy to blow hot air into the zone anyway. Automated Logic / Analytics Page | 8 May, 2015
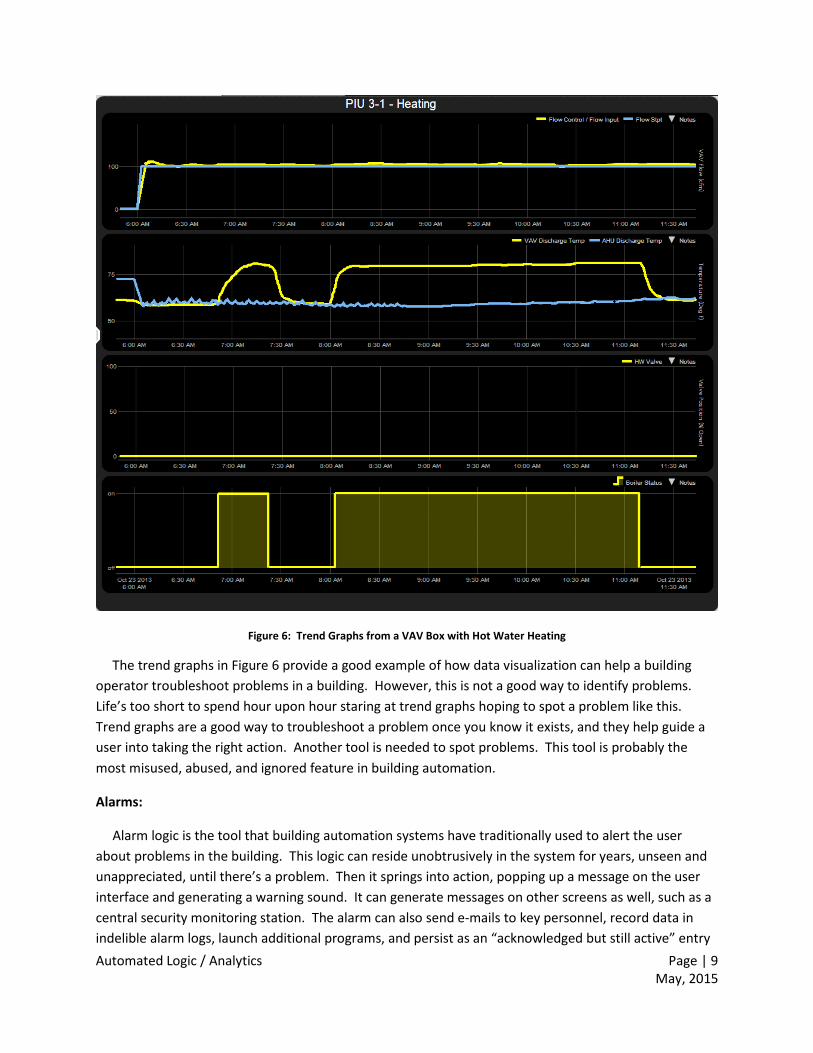
Figure 6: Trend Graphs from a VAV Box with Hot Water Heating
The trend graphs in Figure 6 provide a good example of how data visualization can help a building operator troubleshoot problems in a building. However, this is not a good way to identify problems. Life’s too short to spend hour upon hour staring at trend graphs hoping to spot a problem like this. Trend graphs are a good way to troubleshoot a problem once you know it exists, and they help guide a user into taking the right action. Another tool is needed to spot problems. This tool is probably the most misused, abused, and ignored feature in building automation.
Alarms:
Alarm logic is the tool that building automation systems have traditionally used to alert the user about problems in the building. This logic can reside unobtrusively in the system for years, unseen and unappreciated, until there’s a problem. Then it springs into action, popping up a message on the user interface and generating a warning sound. It can generate messages on other screens as well, such as a central security monitoring station. The alarm can also send e-mails to key personnel, record data in indelible alarm logs, launch additional programs, and persist as an “acknowledged but still active” entry Automated Logic / Analytics Page | 9 May, 2015
in the user interface. These actions are very useful for major problems, such as a fire in the building or the death of the data center air conditioning system. The same actions become annoying if they are applied to less significant problems, such as a broom closet that’s slightly too warm. Alarms may become infuriating if they’re triggered by something that really isn’t a problem, such as a gust of wind hitting a sensor when a door is opened. Unfortunately, our industry has a history of overwhelming the user with so many unimportant alarms that the user ignores all of them. When you hear a car alarm go off in a parking lot, do you immediately call 9-1-1 to report a vehicle theft in progress? Or do you assume it’s a false alarm and ignore it? Many building operators ignore BAS alarms for the same reason.
Life Safety and emergency equipment alarms, such as those triggered by a smoke detector of a freezestat, usually do not cause problems. Problems most often occur with alarm logic that is intended to detect maintenance issues or equipment items that are not working as well as they should. These are often referred to as Fault Detection and Diagnostic alarms (FDD). Detecting and fixing equipment problems can lead to significant savings in energy and operational costs as well as improvements in occupant comfort. A 2013 Australian Summer Study on Energy Efficiency and Decentralized Energy estimated that FDD and ongoing commissioning could reduce building energy use by 17%1. The New Buildings Institute studied 181 buildings in five states and found significant problems in over half the equipment they investigated2. Several of the standalone analytics packages being marketed today focus on FDD. Using a standalone analytics package to perform FDD is effective, but many of the problems detected by these packages are also detected by “intrinsic analytics,” i.e. existing BAS alarms, at a far lower cost. The key is to implement the alarms properly. The following “rules” provide guidance for creating FDD alarms:
Only alarm conditions the customer cares about. While this may seem obvious, it’s very easy to create alarm logic in “standard” control programs which is not a concern for all customers. Some customers appreciate differential pressure alarms on air filters, informed maintenance crews know when a filter is getting clogged and needs to be changed. Alternatively, large campus maintenance crews may automatically change filters while performing regularly scheduled equipment maintenance. A filter alarm is considered a nuisance for this customer, as they’re not about to send someone across campus just to change a filter. Some customers only care about zone level alarms if they come from critical zones, such as a laboratory, a large meeting room, or a key executive office. It doesn’t matter whether or not you agree with what the customer thinks is important, but it’s crucial that you know what the customer’s priorities are so you can alarm the things that concern them. Don’t be afraid to disable alarms that do no interest the customer. Otherwise, the customer will quickly learn to disregard all alarms.
Minimize single condition alarms. Critical alarms like those triggered by smoke detectors and freezestats are usually based upon a single condition. FDD alarms are not. Even a seemingly simple alarm like “this room’s too hot” should be based upon multiple conditions. To begin with, what temperature should the room be? Unless you’re worried about the room freezing (32°) or catching fire (451°F), it’s best to compare the room temperature to the desired temperature, i.e. the setpoint. Is the room occupied? The customer may not want notification
Automated Logic / Analytics Page | 10 May, 2015
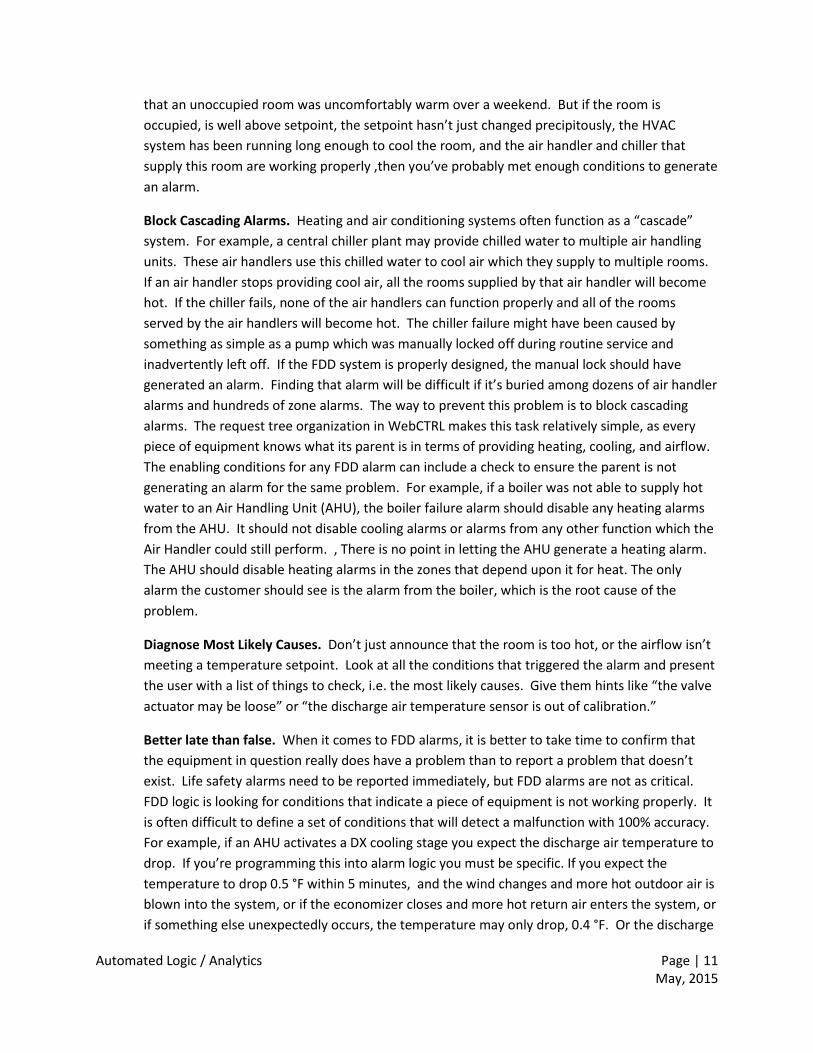
that an unoccupied room was uncomfortably warm over a weekend. But if the room is occupied, is well above setpoint, the setpoint hasn’t just changed precipitously, the HVAC system has been running long enough to cool the room, and the air handler and chiller that supply this room are working properly ,then you’ve probably met enough conditions to generate an alarm.
Block Cascading Alarms. Heating and air conditioning systems often function as a “cascade” system. For example, a central chiller plant may provide chilled water to multiple air handling units. These air handlers use this chilled water to cool air which they supply to multiple rooms. If an air handler stops providing cool air, all the rooms supplied by that air handler will become hot. If the chiller fails, none of the air handlers can function properly and all of the rooms served by the air handlers will become hot. The chiller failure might have been caused by something as simple as a pump which was manually locked off during routine service and inadvertently left off. If the FDD system is properly designed, the manual lock should have generated an alarm. Finding that alarm will be difficult if it’s buried among dozens of air handler alarms and hundreds of zone alarms. The way to prevent this problem is to block cascading alarms. The request tree organization in WebCTRL makes this task relatively simple, as every piece of equipment knows what its parent is in terms of providing heating, cooling, and airflow. The enabling conditions for any FDD alarm can include a check to ensure the parent is not generating an alarm for the same problem. For example, if a boiler was not able to supply hot water to an Air Handling Unit (AHU), the boiler failure alarm should disable any heating alarms from the AHU. It should not disable cooling alarms or alarms from any other function which the Air Handler could still perform. , There is no point in letting the AHU generate a heating alarm. The AHU should disable heating alarms in the zones that depend upon it for heat. The only alarm the customer should see is the alarm from the boiler, which is the root cause of the problem.
Diagnose Most Likely Causes. Don’t just announce that the room is too hot, or the airflow isn’t meeting a temperature setpoint. Look at all the conditions that triggered the alarm and present the user with a list of things to check, i.e. the most likely causes. Give them hints like “the valve actuator may be loose” or “the discharge air temperature sensor is out of calibration.”
Better late than false. When it comes to FDD alarms, it is better to take time to confirm that the equipment in question really does have a problem than to report a problem that doesn’t exist. Life safety alarms need to be reported immediately, but FDD alarms are not as critical. FDD logic is looking for conditions that indicate a piece of equipment is not working properly. It is often difficult to define a set of conditions that will detect a malfunction with 100% accuracy. For example, if an AHU activates a DX cooling stage you expect the discharge air temperature to drop. If you’re programming this into alarm logic you must be specific. If you expect the temperature to drop 0.5 °F within 5 minutes, and the wind changes and more hot outdoor air is blown into the system, or if the economizer closes and more hot return air enters the system, or if something else unexpectedly occurs, the temperature may only drop, 0.4 °F. Or the discharge
Automated Logic / Analytics Page | 11 May, 2015
air temperature may even go up. If the FDD logic generated an alarm immediately, it is considered a false alarm, which would undermine the user’s confidence in the alarms. However, if the DX cooling stage actually is broken, it will fail every time the controller tries to turn it on. To avoid false alarms, the FDD logic can keep track of the failures. If it fails to start 7 out of 10 times, it’s time to generate an alarm. This strategy means it takes longer to generate an alarm, but it decreases the chances of generating a false alarm.
ALC Initiatives:
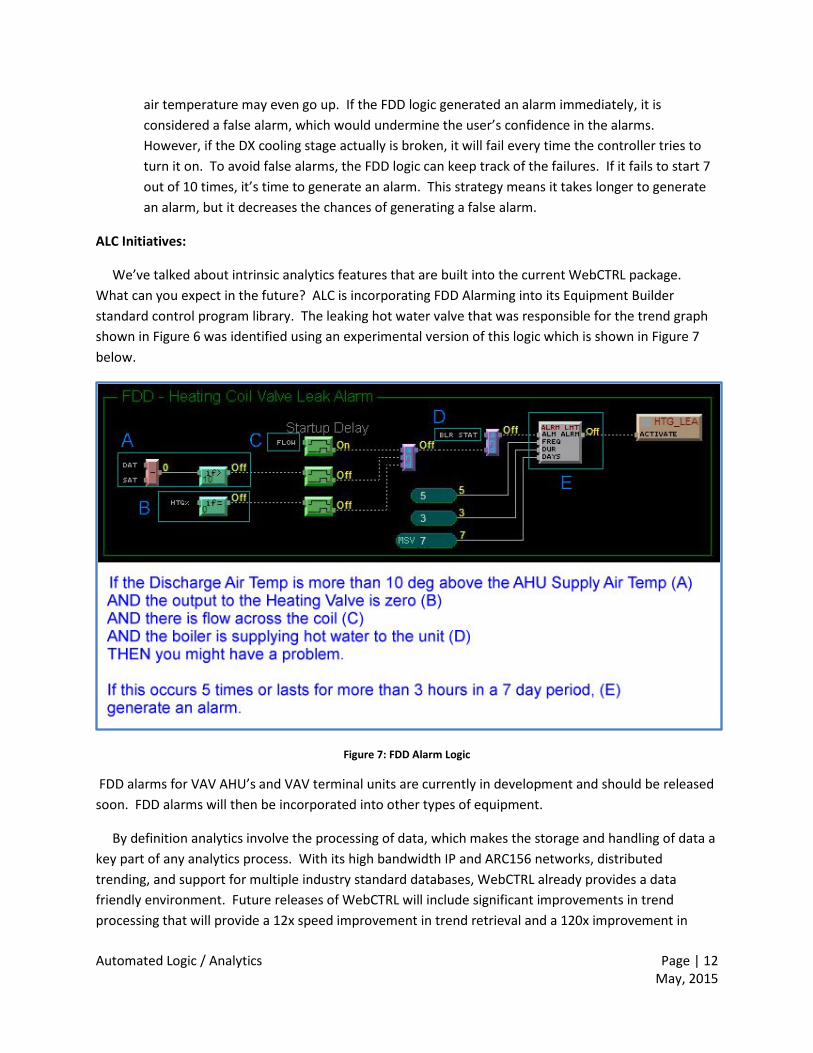
We’ve talked about intrinsic analytics features that are built into the current WebCTRL package. What can you expect in the future? ALC is incorporating FDD Alarming into its Equipment Builder standard control program library. The leaking hot water valve that was responsible for the trend graph shown in Figure 6 was identified using an experimental version of this logic which is shown in Figure 7 below.
Figure 7: FDD Alarm Logic
FDD alarms for VAV AHU’s and VAV terminal units are currently in development and should be released soon. FDD alarms will then be incorporated into other types of equipment.
By definition analytics involve the processing of data, which makes the storage and handling of data a key part of any analytics process. With its high bandwidth IP and ARC156 networks, distributed trending, and support for multiple industry standard databases, WebCTRL already provides a data friendly environment. Future releases of WebCTRL will include significant improvements in trend processing that will provide a 12x speed improvement in trend retrieval and a 120x improvement in
Automated Logic / Analytics Page | 12 May, 2015
trend storage. Whether this data is needed for a trend graph, a dashboard which summarizes data from the trend database, or an external analytics software package, the data will be there when it’s needed.
While dashboards are not often thought of as an analytics tool, they are a data visualization tool to communicate insight. ALC technicians and knowledgeable end users have created custom graphics pages to display data the customer wanted to see in a dashboard format, but the tools they used to create these pages were not designed with dashboards in mind. Future versions of WebCTRL will include an improved dashboard toolset that makes it easier to create the gauges, graphs, and other visuals needed to summarize building data in a compact dashboard. WebCTRL 6.0 already supports tablets and other mobile devices, and a goal of the dashboarding effort is to make it easy for users to view just the dashboards on their smart phones and tablets if that’s all they need to see, or to take advantage of the full WebCTRL graphical user interface (including dashboards) if they need to probe deeper.
Looking further into the future, ALC will roll out a new generation of control modules with dramatically improved memory, processing speed, and networking capabilities. This will significantly enhance support for existing analytics features, and it will provide the capability to write “companion programs” for analytics. Companion programs are designed to link to a graphic control program, read data from and write data to the control program, and perform analytical calculations without compromising the power and understandability of the underlying graphic control program. ALC will also implement Semantic Tagging in its control logic, utilizing standards being developed by the ASHRAE BACnet committee and Project Haystack to make it easier for third party analytics packages to locate and correctly interpret data in a WebCTRL system.
To summarize, WebCTRL is an analytics package. Its user friendly graphics, extensive trend support, intrinsic FDD alarm capabilities, and similar features provide the data visualization users need to guide their decision making. Existing add-on programs enhance this capability with graphic reports. ALC’s R&D team is working today to bring even better intrinsic analytics to future releases of WebCTRL and to enhance WebCTRL’s support for external analytics packages.
References
1. http://www.a2se.org.au/files/2013_Wall_A2SESummerStudy-AFDD.pdf
2. http://rtf.nwcouncil.org/NWPCC_SmallHVAC_Report(R3)Final.pdf
Automated Logic / Analytics Page | 13 May, 2015


![Get 642-770 exam questions & 642-770 practice tests [Infographic]](https://img.pdfslide.us/doc/110x75/58e7683a1a28ab147b8b46c5/get-642-770-exam-questions-642-770-practice-tests-infographic.jpg)