Embed Size (px)
Citation preview
KUBERA
CROSS-BORDER FUND LIMITED
INTERIM REPORT 2014
BUILDING GLOBAL BUSINESSES


1
CONTENTS
2 About Us
3 Chairman’s Statement
5 Investment Manager’s Report
7 Major Portfolio Holdings
9 Minor Portfolio Holdings
13 Consolidated Statement of Assets and Liabilities
14 Consolidated Schedule of Investments
16 Consolidated Statement of Operations
17 Consolidated Statement of Changes in Net Assets
18 Consolidated Statement of Cash Flows
19 Notes to the Consolidated Financial Statements
32 Corporate Information
KUBERA CROSS-BORDER FUND INTERIM REPORT 2014 1

KUBERA CROSS-BORDER FUND INTERIM REPORT 20142
About UsKubera Cross-Border Fund (the ‘Fund’) is a closed-end investment
company listed on the AIM market of the London Stock Exchange. The
Fund makes priva te equity investments in cross-border companies,
primarily in businesses that operate in the US-India corridor.
The Fund’s investment manager, Kubera Partners LLC, brings a strong track
record of investing in or managing such businesses. Several of the Fund’s
investee companies also benefit from business activities in the growing
Indian domestic market.
KUBERA CROSS-BORDER FUND INTERIM REPORT 2014 3
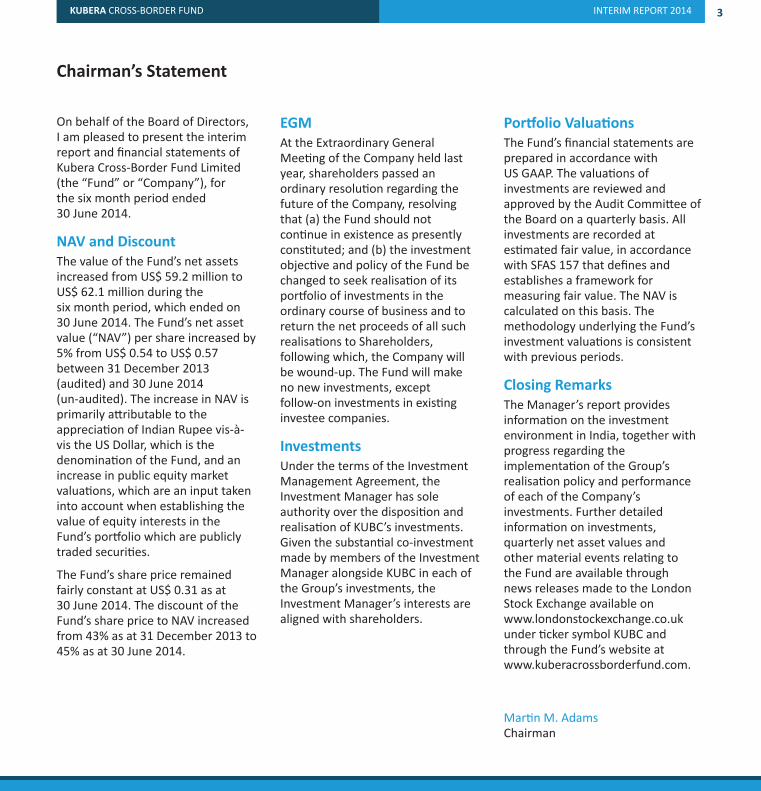
Chairman’s Statement
On behalf of the Board of Directors,I am pleased to present the interimreport and financial statements ofKubera Cross-Border Fund Limited(the “Fund” or “Company”), forthe six month period ended30 June 2014.
NAV and Discount
The value of the Fund’s net assetsincreased from US$ 59.2 million toUS$ 62.1 million during thesix month period, which ended on30 June 2014. The Fund’s net assetvalue (“NAV”) per share increased by5% from US$ 0.54 to US$ 0.57between 31 December 2013(audited) and 30 June 2014(un-audited). The increase in NAV isprimarily attributable to theappreciation of Indian Rupee vis-à-vis the US Dollar, which is thedenomination of the Fund, and anincrease in public equity marketvaluations, which are an input takeninto account when establishing thevalue of equity interests in theFund’s portfolio which are publiclytraded securities.
The Fund’s share price remainedfairly constant at US$ 0.31 as at30 June 2014. The discount of theFund’s share price to NAV increasedfrom 43% as at 31 December 2013 to45% as at 30 June 2014.
EGM
At the Extraordinary GeneralMeeting of the Company held lastyear, shareholders passed anordinary resolution regarding thefuture of the Company, resolvingthat (a) the Fund should notcontinue in existence as presentlyconstituted; and (b) the investmentobjective and policy of the Fund bechanged to seek realisation of itsportfolio of investments in theordinary course of business and toreturn the net proceeds of all suchrealisations to Shareholders,following which, the Company willbe wound-up. The Fund will makeno new investments, exceptfollow-on investments in existinginvestee companies.
Investments
Under the terms of the InvestmentManagement Agreement, theInvestment Manager has soleauthority over the disposition andrealisation of KUBC’s investments.Given the substantial co-investmentmade by members of the InvestmentManager alongside KUBC in each ofthe Group’s investments, theInvestment Manager’s interests arealigned with shareholders.
Portfolio Valuations
The Fund’s financial statements areprepared in accordance withUS GAAP. The valuations ofinvestments are reviewed andapproved by the Audit Committee ofthe Board on a quarterly basis. Allinvestments are recorded atestimated fair value, in accordancewith SFAS 157 that defines andestablishes a framework formeasuring fair value. The NAV iscalculated on this basis. Themethodology underlying the Fund’sinvestment valuations is consistentwith previous periods.
Closing Remarks
The Manager’s report providesinformation on the investmentenvironment in India, together withprogress regarding theimplementation of the Group’srealisation policy and performanceof each of the Company’sinvestments. Further detailedinformation on investments,quarterly net asset values andother material events relating tothe Fund are available throughnews releases made to the LondonStock Exchange available onwww.londonstockexchange.co.ukunder ticker symbol KUBC andthrough the Fund’s website atwww.kuberacrossborderfund.com.
Martin M. AdamsChairman
KUBERA CROSS-BORDER FUND INTERIM REPORT 20144
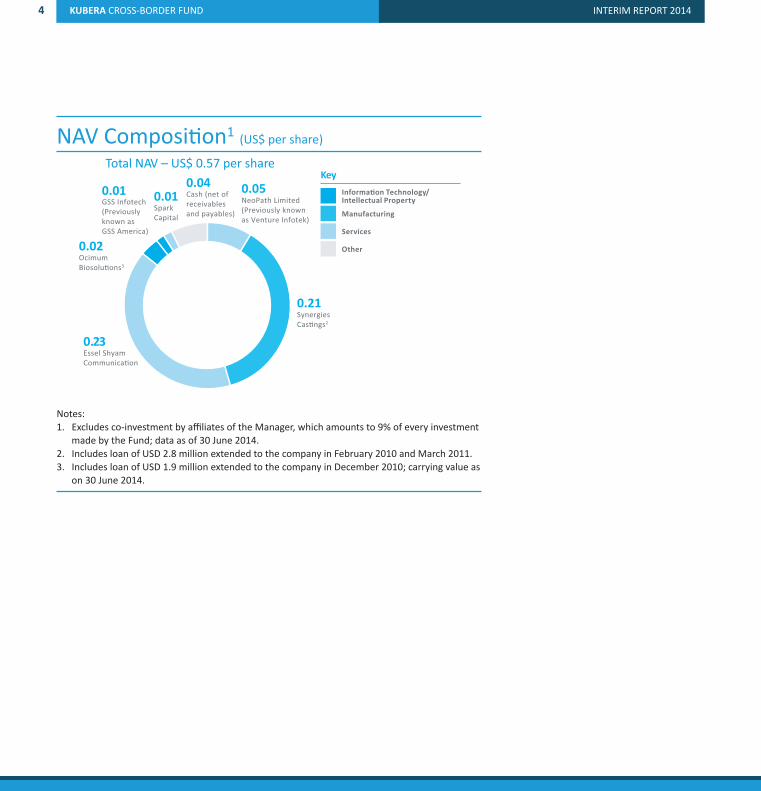
NAV Composition1(US$ per share)
Notes:
1. Excludes co-investment by affiliates of the Manager, which amounts to 9% of every investment
made by the Fund; data as of 30 June 2014.
2. Includes loan of USD 2.8 million extended to the company in February 2010 and March 2011.
3. Includes loan of USD 1.9 million extended to the company in December 2010; carrying value as
on 30 June 2014.
NeoPath Limited(Previously knownas Venture Infotek)
0.05Cash (net ofreceivablesand payables)
0.040.01
0.02
Essel ShyamCommunica on
0.23
SynergiesCas ngs2
0.21
Key
Informa on Technology/Intellectual Property
Manufacturing
Services
Other
GSS Infotech(Previouslyknown asGSS America)
OcimumBiosolu ons3
Total NAV – US$ 0.57 per share
SparkCapital
0.01
KUBERA CROSS-BORDER FUND INTERIM REPORT 2014 5
Investment Manager’s Report
Indian Economy and Market Review1
During the quarter, the Indian electorate gave a positive outcome and
for the first time in 30 years, voting a single party (BJP) to power. It is
hoped that this decisive mandate will lead to a revival in market
sentiment and a boost in overall economic growth.
Indian GDP grew by 4.6% during the quarter ending March 2014,
growing at a similar rate as compared quarter-on-quarter from the prior
financial year. Though local political uncertainty is behind us, global
macro factors, including the volatile Middle East situation, and local
factors such as a possible weak monsoon continue to influence the
Indian economy and capital flows.
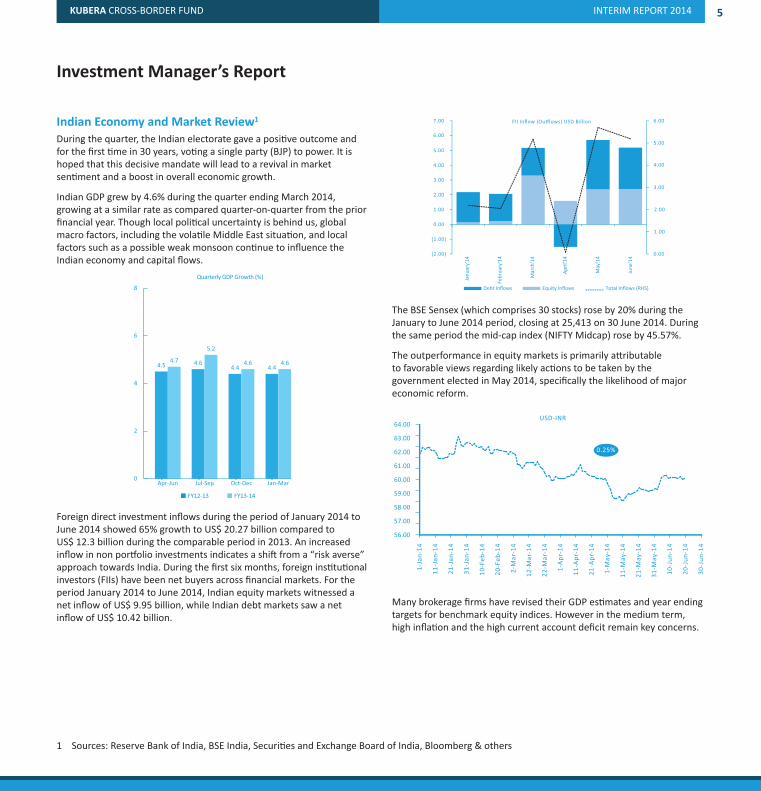
Foreign direct investment inflows during the period of January 2014 to
June 2014 showed 65% growth to US$ 20.27 billion compared to
US$ 12.3 billion during the comparable period in 2013. An increased
inflow in non portfolio investments indicates a shift from a “risk averse”
approach towards India. During the first six months, foreign institutional
investors (FIIs) have been net buyers across financial markets. For the
period January 2014 to June 2014, Indian equity markets witnessed a
net inflow of US$ 9.95 billion, while Indian debt markets saw a net
inflow of US$ 10.42 billion.
The BSE Sensex (which comprises 30 stocks) rose by 20% during the
January to June 2014 period, closing at 25,413 on 30 June 2014. During
the same period the mid-cap index (NIFTY Midcap) rose by 45.57%.
The outperformance in equity markets is primarily attributable
to favorable views regarding likely actions to be taken by the
government elected in May 2014, specifically the likelihood of major
economic reform.
Many brokerage firms have revised their GDP estimates and year ending
targets for benchmark equity indices. However in the medium term,
high inflation and the high current account deficit remain key concerns.
Quarterly GDP Growth (%)
FY12-13 FY13-14
4.74.5 4.6
5.2
4.44.6
4.44.6
0
2
4
6
8
Jan-MarOct-DecJul-SepApr-Jun
(2.00)
(1.00)
0.00
1.00
2.00
3.00
4.00
5.00
6.00
7.00
0.00
1.00
2.00
3.00
4.00
5.00
6.00
Debt Inflows Equity Inflows Total Inflows (RHS)
FII Inflow (Ou lows) USD Billion
January’14
February’14
March’14
April’14
May’14
June’14
56.00
57.00
58.00
59.00
60.00
61.00
62.00
63.00
64.001-Jan-14
21-Jan
-14
10-Feb
-14
20-Feb
-14
2-Mar-14
22-M
ar-14
1-Ap
r-14
21-Apr-14
11-M
ay-14
31-M
ay-14
20-Jun
-14
30-Jun
-14
11-Jan
-14
31-Jan
-14
12-M
ar-14
11-Apr-14
1-May
-14
21-M
ay-14
10-Jun
-14
0.25%
USD-INR
1 Sources: Reserve Bank of India, BSE India, Securities and Exchange Board of India, Bloomberg & others
KUBERA CROSS-BORDER FUND INTERIM REPORT 20146
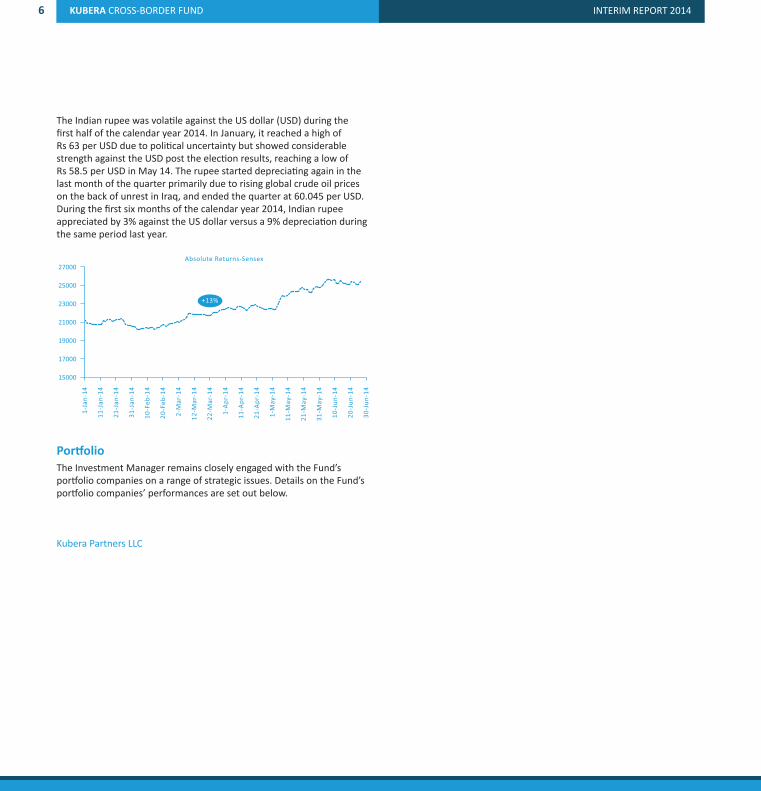
The Indian rupee was volatile against the US dollar (USD) during the
first half of the calendar year 2014. In January, it reached a high of
Rs 63 per USD due to political uncertainty but showed considerable
strength against the USD post the election results, reaching a low of
Rs 58.5 per USD in May 14. The rupee started depreciating again in the
last month of the quarter primarily due to rising global crude oil prices
on the back of unrest in Iraq, and ended the quarter at 60.045 per USD.
During the first six months of the calendar year 2014, Indian rupee
appreciated by 3% against the US dollar versus a 9% depreciation during
the same period last year.
Portfolio
The Investment Manager remains closely engaged with the Fund’s
portfolio companies on a range of strategic issues. Details on the Fund’s
portfolio companies’ performances are set out below.
Kubera Partners LLC
15000
17000
19000
21000
23000
25000
27000
1-Ja
n-14
21-J
an-1
4
10-F
eb-1
4
20-F
eb-1
4
2-M
ar-1
4
22-M
ar-1
4
1-Ap
r-14
21-A
pr-1
4
11-M
ay-1
4
31-M
ay-1
4
20-J
un-1
4
30-J
un-1
4
11-J
an-1
4
31-J
an-1
4
12-M
ar-1
4
11-A
pr-1
4
1-M
ay-1
4
21-M
ay-1
4
10-J
un-1
4
+13%
Absolute Returns-Sensex
KUBERA CROSS-BORDER FUND INTERIM REPORT 2014 7
Major Portfolio HoldingsNote: Fiscal years end in March. FY2015 is the fiscal year ending March 2015 and estimates for this year are the portfolio company’s board approved
budgets or Kubera Partners’ estimates – there is no assurance that these will be achieved results.
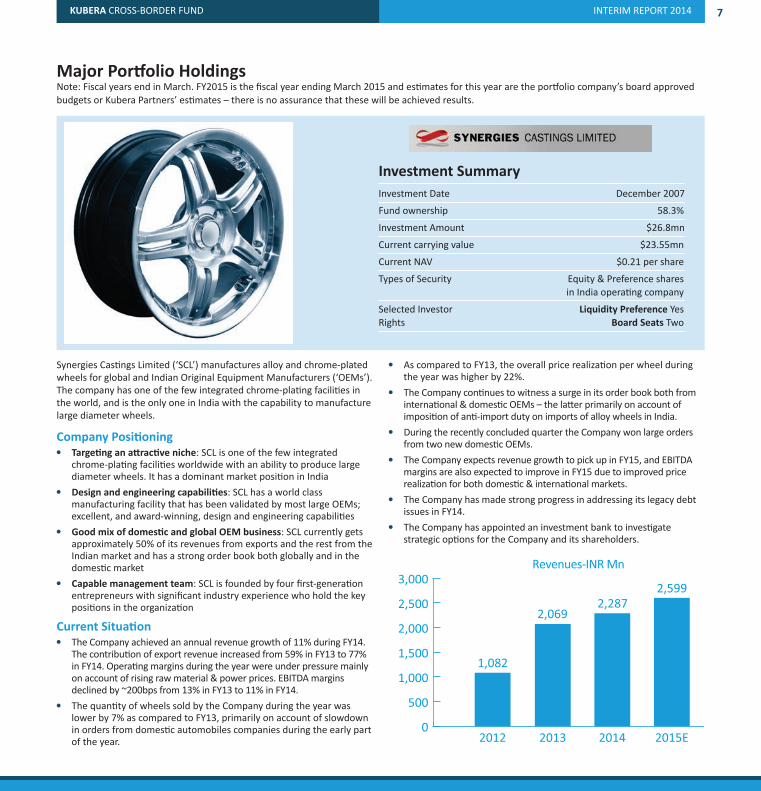
Synergies Castings Limited (‘SCL’) manufactures alloy and chrome-plated
wheels for global and Indian Original Equipment Manufacturers (‘OEMs’).
The company has one of the few integrated chrome-plating facilities in
the world, and is the only one in India with the capability to manufacture
large diameter wheels.
Company Positioningl Targeting an attractive niche: SCL is one of the few integrated
chrome-plating facilities worldwide with an ability to produce largediameter wheels. It has a dominant market position in India
l Design and engineering capabilities: SCL has a world classmanufacturing facility that has been validated by most large OEMs;excellent, and award-winning, design and engineering capabilities
l Good mix of domestic and global OEM business: SCL currently getsapproximately 50% of its revenues from exports and the rest from theIndian market and has a strong order book both globally and in thedomestic market
l Capable management team: SCL is founded by four first-generationentrepreneurs with significant industry experience who hold the keypositions in the organization
Current Situationl The Company achieved an annual revenue growth of 11% during FY14.
The contribution of export revenue increased from 59% in FY13 to 77%in FY14. Operating margins during the year were under pressure mainlyon account of rising raw material & power prices. EBITDA marginsdeclined by ~200bps from 13% in FY13 to 11% in FY14.
l The quantity of wheels sold by the Company during the year waslower by 7% as compared to FY13, primarily on account of slowdownin orders from domestic automobiles companies during the early partof the year.
l As compared to FY13, the overall price realization per wheel duringthe year was higher by 22%.
l The Company continues to witness a surge in its order book both frominternational & domestic OEMs – the latter primarily on account ofimposition of anti-import duty on imports of alloy wheels in India.
l During the recently concluded quarter the Company won large ordersfrom two new domestic OEMs.
l The Company expects revenue growth to pick up in FY15, and EBITDAmargins are also expected to improve in FY15 due to improved pricerealization for both domestic & international markets.
l The Company has made strong progress in addressing its legacy debtissues in FY14.
l The Company has appointed an investment bank to investigatestrategic options for the Company and its shareholders.
Investment Summary
Investment Date December 2007
Fund ownership 58.3%
Investment Amount $26.8mn
Current carrying value $23.55mn
Current NAV $0.21 per share
Types of Security Equity & Preference shares
in India operating company
Selected Investor Liquidity Preference Yes
Rights Board Seats Two
2012 2013 2014 2015E
Revenues-INR Mn
1,082
2,0692,287
2,599
0
500
1,000
1,500
2,000
2,500
3,000
KUBERA CROSS-BORDER FUND INTERIM REPORT 20148
Major Portfolio Holdings
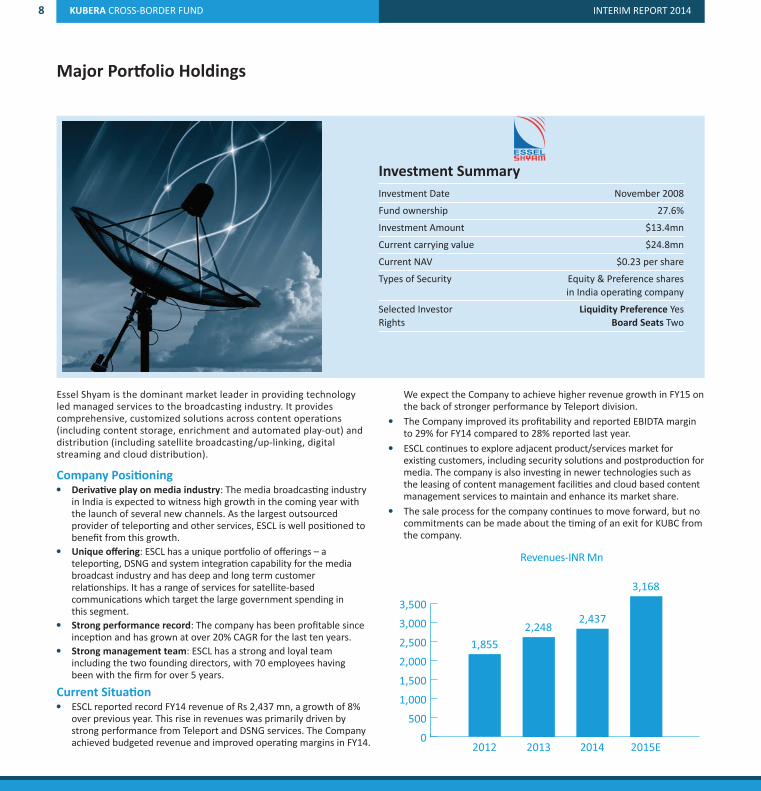
Essel Shyam is the dominant market leader in providing technologyled managed services to the broadcasting industry. It providescomprehensive, customized solutions across content operations(including content storage, enrichment and automated play-out) anddistribution (including satellite broadcasting/up-linking, digitalstreaming and cloud distribution).
Company Positioningl Derivative play on media industry: The media broadcasting industry
in India is expected to witness high growth in the coming year withthe launch of several new channels. As the largest outsourcedprovider of teleporting and other services, ESCL is well positioned tobenefit from this growth.
l Unique offering: ESCL has a unique portfolio of offerings – ateleporting, DSNG and system integration capability for the mediabroadcast industry and has deep and long term customerrelationships. It has a range of services for satellite-basedcommunications which target the large government spending inthis segment.
l Strong performance record: The company has been profitable sinceinception and has grown at over 20% CAGR for the last ten years.
l Strong management team: ESCL has a strong and loyal teamincluding the two founding directors, with 70 employees havingbeen with the firm for over 5 years.
Current Situationl ESCL reported record FY14 revenue of Rs 2,437 mn, a growth of 8%
over previous year. This rise in revenues was primarily driven bystrong performance from Teleport and DSNG services. The Companyachieved budgeted revenue and improved operating margins in FY14.
We expect the Company to achieve higher revenue growth in FY15 onthe back of stronger performance by Teleport division.
l The Company improved its profitability and reported EBIDTA marginto 29% for FY14 compared to 28% reported last year.
l ESCL continues to explore adjacent product/services market forexisting customers, including security solutions and postproduction formedia. The company is also investing in newer technologies such asthe leasing of content management facilities and cloud based contentmanagement services to maintain and enhance its market share.
l The sale process for the company continues to move forward, but nocommitments can be made about the timing of an exit for KUBC fromthe company.
2012 2013 2014 2015E
Revenues-INR Mn
1,855
2,2482,437
3,168
0
500
1,000
1,500
2,000
2,500
3,000
3,500
Investment Summary
Investment Date November 2008
Fund ownership 27.6%
Investment Amount $13.4mn
Current carrying value $24.8mn
Current NAV $0.23 per share
Types of Security Equity & Preference shares
in India operating company
Selected Investor Liquidity Preference Yes
Rights Board Seats Two

KUBERA CROSS-BORDER FUND INTERIM REPORT 2014 9
Minor Portfolio Holdings
Ocimum offers genomics outsourcing services from offices in India and
the US. The company provides information products and software
solutions for the research community; basic reagents required in a
genomics lab; and outsourced research services, including gene
expression analysis, genotyping and hybridization services. The
company’s customers include some of the world’s largest pharmaceutical
and biotech companies.
Current Situation
l The Company continues to track below expectation and reported
25% YoY decline in revenue during FY14.
l Business environment remain challenging with near term cash flow
constraints. The Company has embarked upon a restructuring
exercise to reduce operational costs and improve operating margins.
l The company has appointed banker to sell certain business segments
to raise cash and reduce overall debt.
Investment Summary
Investment Date December 2007
Fund ownership 33.4%
Investment Amount $15.0mn
Current carrying value $2.0mn
Current NAV $0.02 per share
Types of Security Equity & Preference shares
in India operating company

KUBERA CROSS-BORDER FUND INTERIM REPORT 201410
Minor Portfolio Holdings
GSS Infotech provides IT Infrastructure Management services (‘IMS’) and
Enterprise Application Integration services (‘EAI’) to Fortune 500 clients.
The company is listed on the NSE and the BSE in India.
Current Situation
l GSS trades at a deep discount to our entry price and continues to
trade at a discount to peers.
l The Company has not yet announced their FY14 results till
publication of this report.
Investment Summary
Investment Date January 2008
Fund ownership 6.4%
Investment Amount $9.3mn
Current carrying value $0.59mn
Current NAV $0.01 per share
Types of Security Equity shares

KUBERA CROSS-BORDER FUND INTERIM REPORT 2014 11
Spark Capital (‘Spark’) is a full service investment bank with a strong
presence in Southern India.
Current Situation
l The Company continues to perform well and reported FY14 revenues
of INR 349 mn, a growth of 19.2% and net profits of INR 44.12 mn
showing a marginal increase of 6% on a year-over-year basis. The
investment banking and securities businesses continue to contribute
90% of total revenue.
l During the fiscal year 2014, the company was lead advisor on
seven private equity transactions, including primary and secondary
investments in both listed and unlisted companies, with an aggregate
transaction value worth USD 379 mn.
l We expect the Company to benefit from the expected improvement
in economic environment during next two years.
Minor Portfolio Holdings
272 293349
417
2012 2013 2014 2015E
Revenues-INR Mn
050
100150200250300350400450
Investment Summary
Investment Date April 2008
Fund ownership 10.56%
Investment Amount $1.4mn
Current carrying value $1.4mn
Current NAV $0.01 per share
Types of Security Equity shares in India operating company

KUBERA CROSS-BORDER FUND INTERIM REPORT 201412
Minor Portfolio Holdings
Investment Summary
Investment Date December 2007
Fund ownership 42.8%
Investment Amount $19.7mn
Current carrying value $5.2mn
Current NAV $0.05 per share
Types of Security Equity shares
Venture Infotek (“VI”)2 is India’s leading card transaction processing
company, operating in three major business segments: Merchant
Acquisition, Credit Card Issuance and Loyalty Cards.
Current Situation
l We were valuing the company on the basis of pending future tax
receipts from government of India discounted to its present value.
l The Company now faces yet another delay in the recovery of the
pending tax withholdings, as the Authority of Advance Rulings (AAR)
declined to hear the Company’s petition.
l The company is expected to file, in July, a writ petition in the Bombay
High Court to reinstate the Company’s application to the AAR. We are
hopeful that a reinstated application, coupled with the changed
political and business environment, will lead to a successful outcome
for the company and to the Fund.
2 The name of the company has been changed from Venture Infotek to Neopath.
KUBERA CROSS-BORDER FUND INTERIM REPORT 2014 13
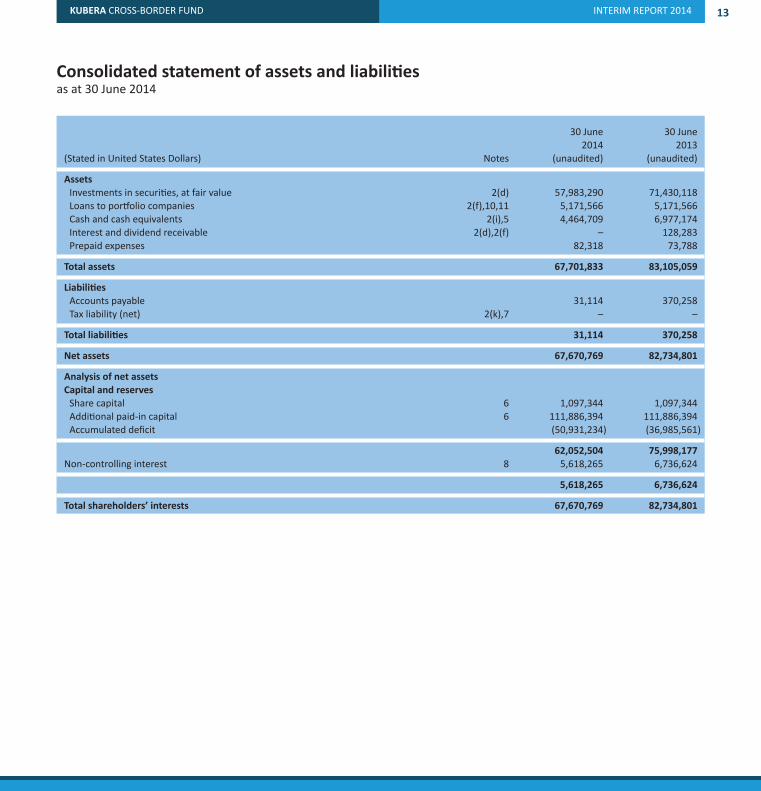
Consolidated statement of assets and liabilitiesas at 30 June 2014
30 June 30 June
2014 2013
(Stated in United States Dollars) Notes (unaudited) (unaudited)
Assets
Investments in securities, at fair value 2(d) 57,983,290 71,430,118
Loans to portfolio companies 2(f),10,11 5,171,566 5,171,566
Cash and cash equivalents 2(i),5 4,464,709 6,977,174
Interest and dividend receivable 2(d),2(f) – 128,283
Prepaid expenses 82,318 73,788
Total assets 67,701,833 83,105,059
Liabilities
Accounts payable 31,114 370,258
Tax liability (net) 2(k),7 – –
Total liabilities 31,114 370,258
Net assets 67,670,769 82,734,801
Analysis of net assets
Capital and reserves
Share capital 6 1,097,344 1,097,344
Additional paid-in capital 6 111,886,394 111,886,394
Accumulated deficit (50,931,234) (36,985,561)
62,052,504 75,998,177
Non-controlling interest 8 5,618,265 6,736,624
5,618,265 6,736,624
Total shareholders’ interests 67,670,769 82,734,801
KUBERA CROSS-BORDER FUND INTERIM REPORT 201414
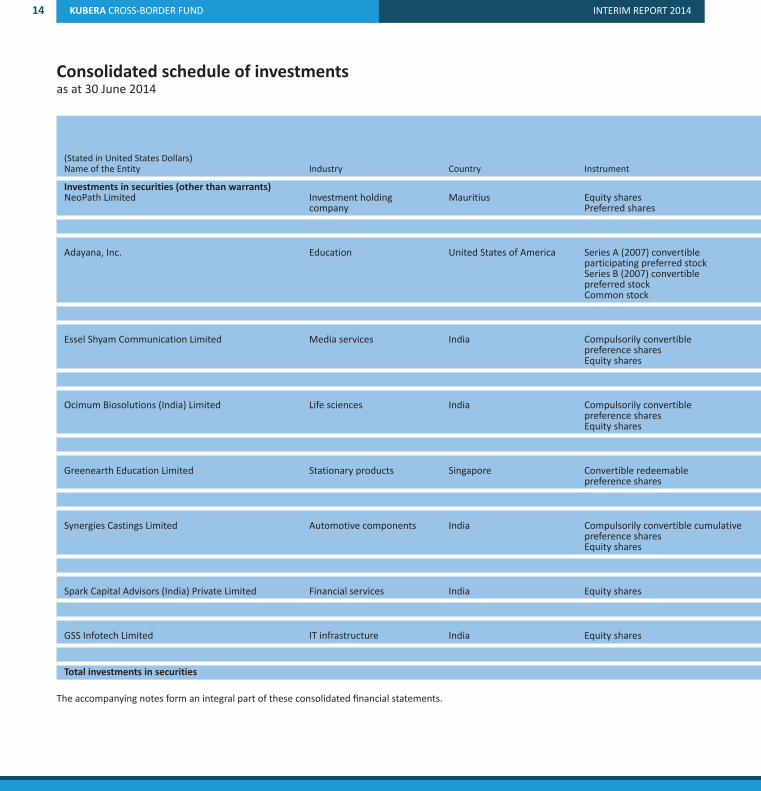
Consolidated schedule of investmentsas at 30 June 2014
3 3 ( (
(Stated in United States Dollars) N F % N F % Name of the Entity Industry Country Instrument o C v n o C v n
Investments in securities (other than warrants)NeoPath Limited Investment holding Mauritius Equity shares 1 – 1 0 1 – 1 0 company Preferred shares 9 – 5 8 9 – 5 6
– 5 8 – 5 6
Adayana, Inc. Education United States of America Series A (2007) convertible participating preferred stock 3 – – – 3 1 1 1 Series B (2007) convertible preferred stock 1 – – – 1 5 7 8 Common stock 1 – – – 1 5 – 0
– – – 2 8 1
Essel Shyam Communication Limited Media services India Compulsorily convertible preference shares 5 1 2 3 5 1 2 3 Equity shares 1 2 4 7 1 2 5 6
1 2 4 1 3 3
Ocimum Biosolutions (India) Limited Life sciences India Compulsorily convertible preference shares 3 1 9 0 3 1 9 0 Equity shares 1 3 2 0 1 3 2 0
1 1 0 1 1 0
Greenearth Education Limited Stationary products Singapore Convertible redeemable preference shares 4 – – – 4 2 1 0
– – – 2 1 0
Synergies Castings Limited Automotive components India Compulsorily convertible cumulative preference shares 5 1 7 9 5 1 8 9 Equity shares 1 1 1 2 1 1 1 1
2 2 3 2 2 2
Spark Capital Advisors (India) Private Limited Financial services India Equity shares 5 1 1 2 5 1 1 1
1 1 2 1 1 1
GSS Infotech Limited IT infrastructure India Equity shares 1 1 6 0 1 1 4 0
1 6 0 1 4 0
Total investments in securities 6 5 8 1 7 8
The accompanying notes form an integral part of these consolidated financial statements.
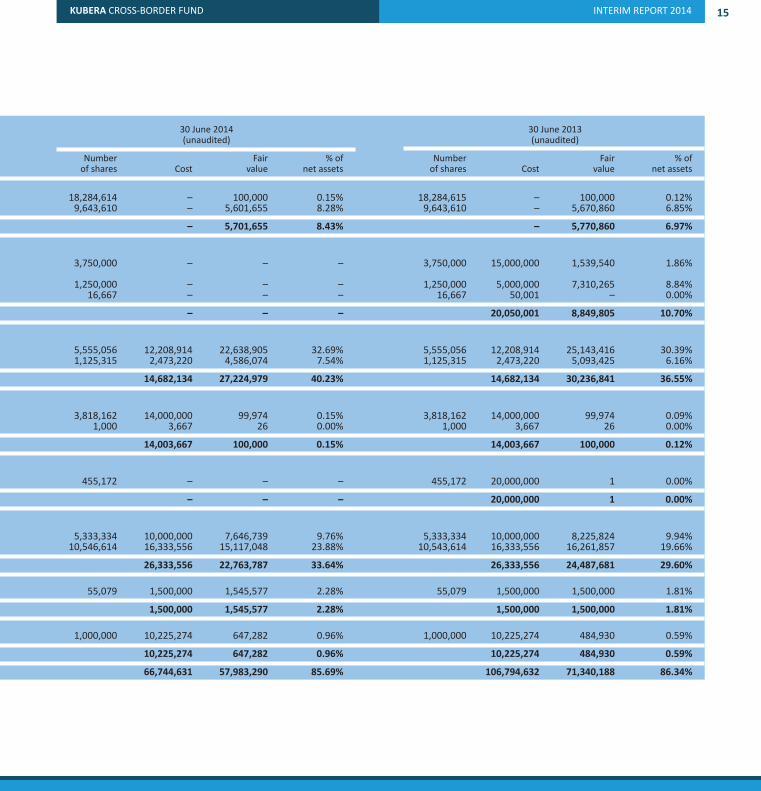
30 June 2014 30 June 2013 (unaudited) (unaudited)
Number Fair % of Number Fair % of I C I of shares Cost value net assets of shares Cost value net assets
I M E 18,284,614 – 100,000 0.15% 18,284,615 – 100,000 0.12%
c P 9,643,610 – 5,601,655 8.28% 9,643,610 – 5,670,860 6.85%
– 5,701,655 8.43% – 5,770,860 6.97%
E U S p 3,750,000 – – – 3,750,000 15,000,000 1,539,540 1.86% S p 1,250,000 – – – 1,250,000 5,000,000 7,310,265 8.84% C 16,667 – – – 16,667 50,001 – 0.00%
– – – 20,050,001 8,849,805 10.70%
M I C p 5,555,056 12,208,914 22,638,905 32.69% 5,555,056 12,208,914 25,143,416 30.39% E 1,125,315 2,473,220 4,586,074 7.54% 1,125,315 2,473,220 5,093,425 6.16%
14,682,134 27,224,979 40.23% 14,682,134 30,236,841 36.55%
L I C p 3,818,162 14,000,000 99,974 0.15% 3,818,162 14,000,000 99,974 0.09% E 1,000 3,667 26 0.00% 1,000 3,667 26 0.00%
14,003,667 100,000 0.15% 14,003,667 100,000 0.12%
S S C p 455,172 – – – 455,172 20,000,000 1 0.00%
– – – 20,000,000 1 0.00%
A I C p 5,333,334 10,000,000 7,646,739 9.76% 5,333,334 10,000,000 8,225,824 9.94% E 10,546,614 16,333,556 15,117,048 23.88% 10,543,614 16,333,556 16,261,857 19.66%
26,333,556 22,763,787 33.64% 26,333,556 24,487,681 29.60%
F I E 55,079 1,500,000 1,545,577 2.28% 55,079 1,500,000 1,500,000 1.81%
1,500,000 1,545,577 2.28% 1,500,000 1,500,000 1.81%
I I E 1,000,000 10,225,274 647,282 0.96% 1,000,000 10,225,274 484,930 0.59%
10,225,274 647,282 0.96% 10,225,274 484,930 0.59%
66,744,631 57,983,290 85.69% 106,794,632 71,340,188 86.34%
KUBERA CROSS-BORDER FUND INTERIM REPORT 2014 15
KUBERA CROSS-BORDER FUND INTERIM REPORT 201416
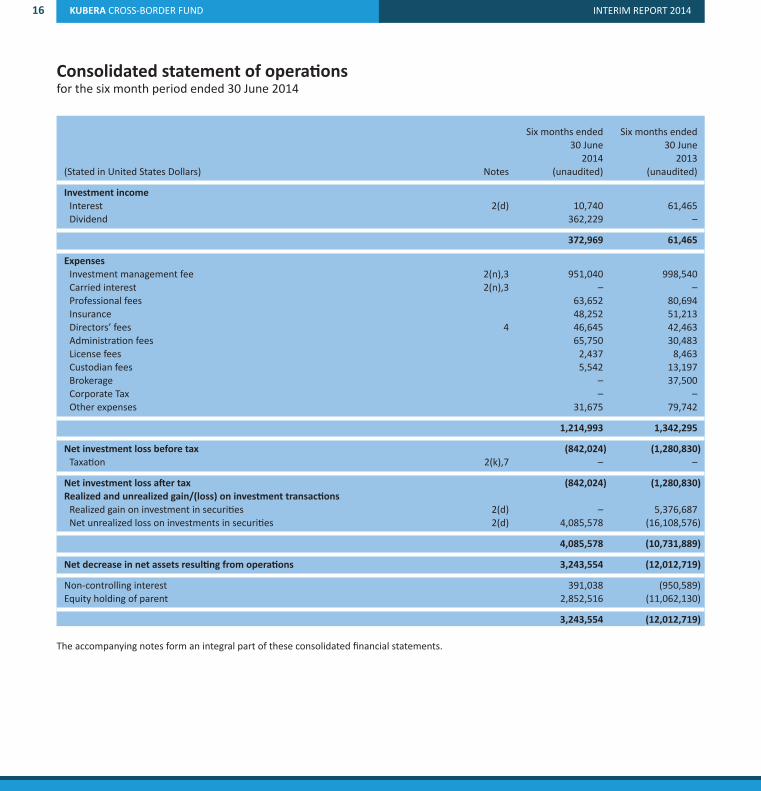
Consolidated statement of operationsfor the six month period ended 30 June 2014
Six months ended Six months ended
30 June 30 June
2014 2013
(Stated in United States Dollars) Notes (unaudited) (unaudited)
Investment income
Interest 2(d) 10,740 61,465
Dividend 362,229 –
372,969 61,465
Expenses
Investment management fee 2(n),3 951,040 998,540
Carried interest 2(n),3 – –
Professional fees 63,652 80,694
Insurance 48,252 51,213
Directors’ fees 4 46,645 42,463
Administration fees 65,750 30,483
License fees 2,437 8,463
Custodian fees 5,542 13,197
Brokerage – 37,500
Corporate Tax – –
Other expenses 31,675 79,742
1,214,993 1,342,295
Net investment loss before tax (842,024) (1,280,830)
Taxation 2(k),7 – –
Net investment loss after tax (842,024) (1,280,830)
Realized and unrealized gain/(loss) on investment transactions
Realized gain on investment in securities 2(d) – 5,376,687
Net unrealized loss on investments in securities 2(d) 4,085,578 (16,108,576)
4,085,578 (10,731,889)
Net decrease in net assets resulting from operations 3,243,554 (12,012,719)
Non-controlling interest 391,038 (950,589)
Equity holding of parent 2,852,516 (11,062,130)
3,243,554 (12,012,719)
The accompanying notes form an integral part of these consolidated financial statements.
KUBERA CROSS-BORDER FUND INTERIM REPORT 2014 17
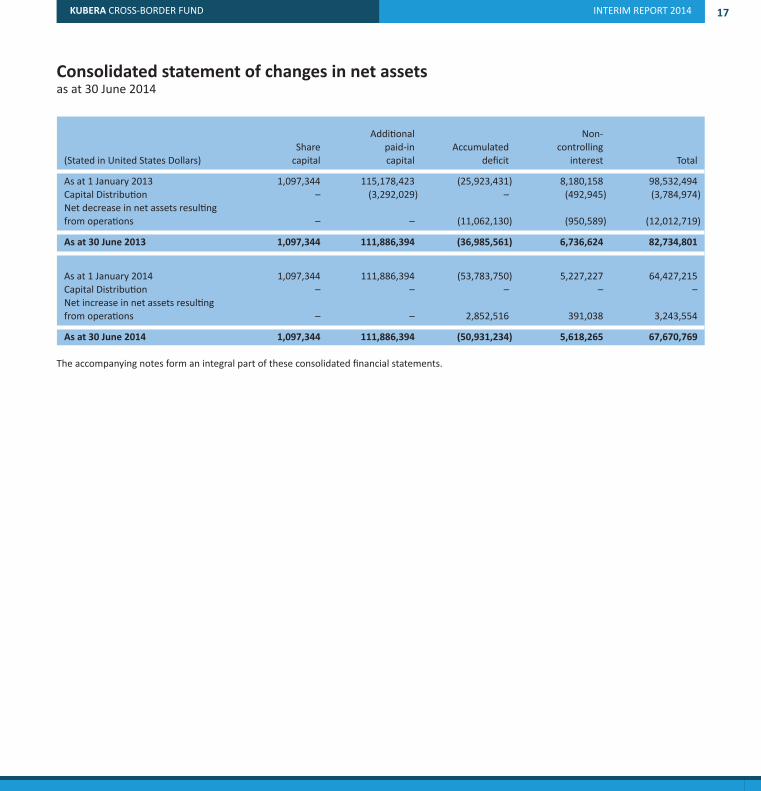
Consolidated statement of changes in net assetsas at 30 June 2014
Additional Non-
Share paid-in Accumulated controlling
(Stated in United States Dollars) capital capital deficit interest Total
As at 1 January 2013 1,097,344 115,178,423 (25,923,431) 8,180,158 98,532,494
Capital Distribution – (3,292,029) – (492,945) (3,784,974)
Net decrease in net assets resulting
from operations – – (11,062,130) (950,589) (12,012,719)
As at 30 June 2013 1,097,344 111,886,394 (36,985,561) 6,736,624 82,734,801
As at 1 January 2014 1,097,344 111,886,394 (53,783,750) 5,227,227 64,427,215
Capital Distribution – – – – –
Net increase in net assets resulting
from operations – – 2,852,516 391,038 3,243,554
As at 30 June 2014 1,097,344 111,886,394 (50,931,234) 5,618,265 67,670,769
The accompanying notes form an integral part of these consolidated financial statements.
KUBERA CROSS-BORDER FUND INTERIM REPORT 201418
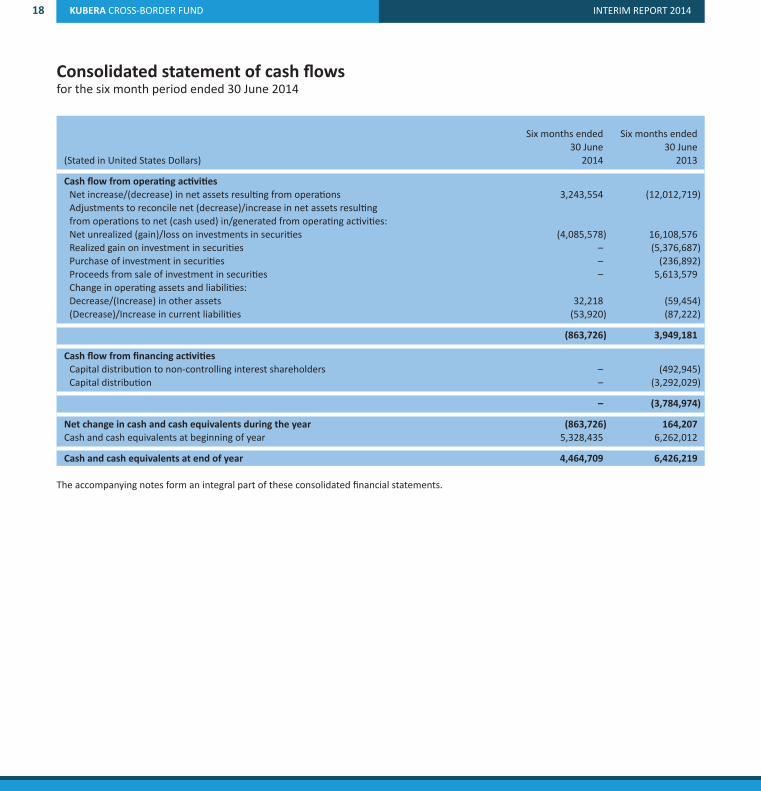
Consolidated statement of cash flowsfor the six month period ended 30 June 2014
Six months ended Six months ended
30 June 30 June
(Stated in United States Dollars) 2014 2013
Cash flow from operating activities
Net increase/(decrease) in net assets resulting from operations 3,243,554 (12,012,719)
Adjustments to reconcile net (decrease)/increase in net assets resulting
from operations to net (cash used) in/generated from operating activities:
Net unrealized (gain)/loss on investments in securities (4,085,578) 16,108,576
Realized gain on investment in securities – (5,376,687)
Purchase of investment in securities – (236,892)
Proceeds from sale of investment in securities – 5,613,579
Change in operating assets and liabilities:
Decrease/(Increase) in other assets 32,218 (59,454)
(Decrease)/Increase in current liabilities (53,920) (87,222)
(863,726) 3,949,181
Cash flow from financing activities
Capital distribution to non-controlling interest shareholders – (492,945)
Capital distribution – (3,292,029)
– (3,784,974)
Net change in cash and cash equivalents during the year (863,726) 164,207
Cash and cash equivalents at beginning of year 5,328,435 6,262,012
Cash and cash equivalents at end of year 4,464,709 6,426,219
The accompanying notes form an integral part of these consolidated financial statements.
KUBERA CROSS-BORDER FUND INTERIM REPORT 2014 19
Notes to the consolidated financial statementsfor the six month period ended 30 June 2014(Stated in United States Dollars)
1. Organization and principal activity
Kubera Cross-Border Fund Limited (the “Fund”) was incorporated in the Cayman Islands on 23 November 2006 as an exempted company with
limited liability.
The Fund is a closed-end investment company trading on the AIM market of the London Stock Exchange. The Fund makes private equity investments
in cross-border companies, primarily in businesses that operate in the US-India corridor.
The Fund is managed by Kubera Partners, LLC (the “Investment Manager”), a Delaware limited liability company. The Investment Manager is
responsible for the day-to-day management of the Fund’s investment portfolio in accordance with the Fund’s investment objective and policies and
has full discretionary investment management authority.
The Fund is a Limited Partner in Kubera Cross-Border Fund LP (the “Partnership”), an exempted limited partnership formed on 28 November 2006,
in accordance with the laws of the Cayman Islands. The primary business of the Partnership is to invest in, purchase and sell investments for the
purpose of carrying out an investment strategy that is consistent with the strategy described in the Admission Document and Offering Memorandum
of the Fund.
Kubera Cross-Border Fund (GP) Limited, a company incorporated under the laws of the Cayman Islands and a wholly owned subsidiary of the Fund,
serves as the General Partner of the Partnership.
The Partnership holds 100% ownership in Kubera Cross-Border Fund (Mauritius) Limited (“Kubera Mauritius”), a company incorporated in Mauritius.
The primary business of Kubera Mauritius is to carry on business as an investment holding company.
Kubera Mauritius holds 100% ownership in New Wave Holdings Limited, a company incorporated in Mauritius. The primary business of New Wave
Holdings Limited is to carry on business as an investment holding company.
IOMA Fund and Investment Management Limited (the “Administrator”) is the administrator of the Fund.
2. Significant accounting policies
The accompanying consolidated financial statements are prepared in conformity with U.S. generally accepted accounting principles (“US GAAP”).
The significant accounting policies adopted by the Company are as follows:
a. Use of estimates
US GAAP requires management to make estimates and assumptions that affect the reported amounts of assets and liabilities and disclosure of
contingent assets and liabilities at the date of the financial statements, the results of operations during the reporting period and the reported
amounts of increases and decreases in net assets from operations during the reporting period. Significant estimates and assumptions are used for,
but not limited to, accounting for the fair values of investments in portfolio companies. Management believes that the estimates made in the
preparation of the financial statements are prudent and reasonable. Actual results could differ from those estimates. Changes in estimates are
reflected in the financial statements in the period in which the changes are made and if material, these effects are disclosed in the notes to the
financial statements.
b. Functional currency
The measurement and presentation currency of the financial statements is the United States dollar rather than the local currency of Cayman Island
reflecting the fact that subscriptions to and redemptions from the Company are made in United States dollars and the Company’s operations are
primarily conducted in United States dollars.
KUBERA CROSS-BORDER FUND INTERIM REPORT 201420
Notes to the consolidated financial statementsfor the six month period ended 30 June 2014 (continued)(Stated in United States Dollars)
2. Significant accounting policies (continued)
c. Basis of consolidation
The consolidated financial statements include the accounts of the Fund and its wholly owned subsidiary, Kubera Cross-Border Fund (GP) Limited and
its majority owned subsidiaries, Kubera Cross-Border Fund LP, Kubera Cross-Border Fund (Mauritius) Limited and New Wave Holdings Limited
(together referred to as the ‘Group’). All material inter-company balances and transactions have been eliminated.
d. Investment transactions and related investment income and expenses
Substantially all securities are held in the custody of Kotak Mahindra Bank Limited. Investment transactions are accounted for on a trade date basis.
Realized gains and losses and movements in unrealized gains and losses are recognized in the statement of operations and determined on weighted
average cost method basis. Movements in fair value are recorded in the statement of operations at each valuation date.
Dividend income is recognized on the ex-dividend date and is presented net of withholding taxes. Interest income and expense are recognized on an
accruals basis except for securities in default for which interest is recognized on a cash basis.
e. Fair value
Definition and hierarchy
Investments are recorded at estimated fair value as at the balance sheet date. The Group follows ASC 820 “Fair Value Measurements and
Disclosures” which defines fair value, establishes a framework for measuring fair value and expands disclosures about fair value measurements.
Fair value is defined as the price that would be received to sell an asset or paid to transfer a liability (i.e., the “exit price”) in an orderly transaction
between market participants at the measurement date.
ASC 820 establishes a hierarchical disclosure framework which prioritizes and ranks the level of market price observability used in measuring
investments at fair value. Market price observability is impacted by a number of factors, including the type of investment and the characteristics
specific to the investment. Investments with readily available active quoted prices or for which fair value can be measured from actively quoted
prices generally will have a higher degree of market price observability and a lesser degree of judgment used in measuring fair value.
Investments measured and reported at fair value as determined by the Board of Directors are classified and disclosed in one of the following
categories:
Level I – Unadjusted quoted prices in active markets for identical assets or liabilities that the Fund has the ability to access.
Level II – Observable inputs other than quoted prices included in Level 1 that are not observable for the asset or liability either directly or indirectly.
These inputs may include quoted prices for the identical instrument on an inactive market, prices for similar instruments, interest rates, prepayment
speeds, credit risk, yield curves, default rates, and similar data.
Level III – Unobservable inputs for the asset or liability to the extent that relevant observable inputs are not available, representing the Group’s own
assumptions about the assumptions that a market participant would use in valuing the asset or liability, and that would be based on the best
information available.
In determining fair value, the Group uses various valuation approaches. Inputs that are used in determining fair value of an instrument may include
price information; quotations received from market makers, brokers, dealers and/or counterparties (when available and considered reliable); credit
data; volatility statistics and other factors. Inputs, including price information, may be provided by independent pricing services or derived from
market data. Inputs can be either observable or unobservable.
KUBERA CROSS-BORDER FUND INTERIM REPORT 2014 21
The availability of observable inputs can vary from security to security and is affected by a wide variety of factors, including, for example, the type of
security, whether the security is new and not yet established in the marketplace, the liquidity of markets, and other characteristics particular to the
security. To the extent that valuation is based on models or inputs that are less observable in the market, the determination of fair value requires
more judgment. Accordingly, the degree of judgment exercised in determining fair value is greatest for instruments categorized in Level III. The
inputs used to measure fair value may fall into different levels of the fair value hierarchy. In such cases, for disclosure purposes, the level in the fair
value hierarchy within which the fair value measurement falls in its entirety is determined based on the lowest level input that is significant to the
fair value measurement in its entirety.
Valuation
Listed equity securities
Investments in equity securities that are freely tradable and are listed on a national securities exchange are valued at their last sales price as of the
valuation date. These investments are classified as Level I in the fair value hierarchy and include common stocks and preferred stock.
Private company
Investment in private company consists of a direct ownership of common and/or preferred stock of a privately held company. The transaction
price, excluding transaction costs, is typically the Group’s best estimate of fair value at inception. When evidence supports a change to the
carrying value from the transaction price, adjustments are made to reflect expected exit values in the investment’s principal market under
current market conditions.
The Group performs ongoing reviews based on an assessment of trends in the performance of each underlying investment from the inception date
through the most recent valuation date. These assessments typically incorporate the original transaction price, recent transactions in the same or
similar instruments, completed or pending third-party transactions in the underlying investment or comparable issuers, subsequent rounds of
financing, recapitalizations and other transactions across the capital structure, offerings in the equity or debt capital markets and changes in
financial ratios or cash flows.
Valuation process
The Group establishes valuation processes and procedures to ensure that the valuation techniques for investments that are categorized within Level
III of the fair value hierarchy are fair, consistent, and verifiable. The Group designates the Investment Manager to oversee the entire valuation
process of the Group’s investments.
The Investment Manager is responsible for reviewing the Group’s written valuation processes and procedures, conducting periodic reviews of the
valuation policies, and evaluating the overall fairness and consistent application of the valuation policies.
Valuations determined by the Investment Manager are required to be supported by market data, third-party pricing sources; industry accepted
pricing models, or other methods the Investment Manager deems to be appropriate, including the use of internal proprietary pricing models.
KUBERA CROSS-BORDER FUND INTERIM REPORT 201422
2. Significant accounting policies (continued)
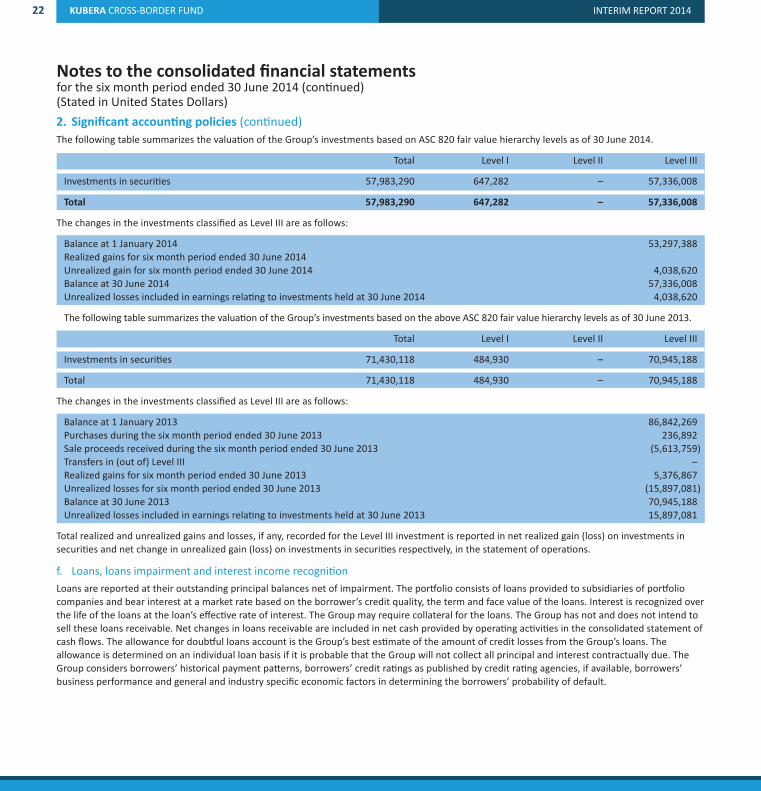
The following table summarizes the valuation of the Group’s investments based on ASC 820 fair value hierarchy levels as of 30 June 2014.
Total Level I Level II Level III
Investments in securities 57,983,290 647,282 – 57,336,008
Total 57,983,290 647,282 – 57,336,008
The changes in the investments classified as Level III are as follows:
Balance at 1 January 2014 53,297,388
Realized gains for six month period ended 30 June 2014
Unrealized gain for six month period ended 30 June 2014 4,038,620
Balance at 30 June 2014 57,336,008
Unrealized losses included in earnings relating to investments held at 30 June 2014 4,038,620
The following table summarizes the valuation of the Group’s investments based on the above ASC 820 fair value hierarchy levels as of 30 June 2013.
Total Level I Level II Level III
Investments in securities 71,430,118 484,930 – 70,945,188
Total 71,430,118 484,930 – 70,945,188
The changes in the investments classified as Level III are as follows:
Balance at 1 January 2013 86,842,269
Purchases during the six month period ended 30 June 2013 236,892
Sale proceeds received during the six month period ended 30 June 2013 (5,613,759)
Transfers in (out of) Level III –
Realized gains for six month period ended 30 June 2013 5,376,867
Unrealized losses for six month period ended 30 June 2013 (15,897,081)
Balance at 30 June 2013 70,945,188
Unrealized losses included in earnings relating to investments held at 30 June 2013 15,897,081
Total realized and unrealized gains and losses, if any, recorded for the Level III investment is reported in net realized gain (loss) on investments in
securities and net change in unrealized gain (loss) on investments in securities respectively, in the statement of operations.
f. Loans, loans impairment and interest income recognition
Loans are reported at their outstanding principal balances net of impairment. The portfolio consists of loans provided to subsidiaries of portfolio
companies and bear interest at a market rate based on the borrower’s credit quality, the term and face value of the loans. Interest is recognized over
the life of the loans at the loan’s effective rate of interest. The Group may require collateral for the loans. The Group has not and does not intend to
sell these loans receivable. Net changes in loans receivable are included in net cash provided by operating activities in the consolidated statement of
cash flows. The allowance for doubtful loans account is the Group’s best estimate of the amount of credit losses from the Group’s loans. The
allowance is determined on an individual loan basis if it is probable that the Group will not collect all principal and interest contractually due. The
Group considers borrowers’ historical payment patterns, borrowers’ credit ratings as published by credit rating agencies, if available, borrowers’
business performance and general and industry specific economic factors in determining the borrowers’ probability of default.
Notes to the consolidated financial statementsfor the six month period ended 30 June 2014 (continued)(Stated in United States Dollars)
KUBERA CROSS-BORDER FUND INTERIM REPORT 2014 23
As per Para 310-10-35-22 of ASC 310 on “Receivables”, the impairment is measured based on the present value of expected future cash flows
discounted at the loan’s effective interest rate or the fair value of the collateral if the loan is collateral-dependent. The Group does not accrue
interest when a loan is considered impaired. When ultimate collectability of the principal balance of the impaired loan is in doubt, all cash receipts
on impaired loans are applied to reduce the principal amount of such loans until the principal has been recovered and are recognized as interest
income thereafter. Impairment losses are charged against the allowance and increases in the allowance are charged to impairment loss in statement
of operations. Loans are written off against the impairment allowance when all possible means of collection have been exhausted and the potential
for recovery is considered remote. The Group resumes accrual of interest when it is probable that the Group will collect the remaining principal and
interest of an impaired loan. Loans become past due based on how recently payments have been received.
g. Foreign currency translation
Assets and liabilities denominated in a currency other than the U.S. dollar are translated into U.S. dollars at the exchange rate as at the reporting
date. Purchases and sales of investments and income and expenses denominated in currencies other than U.S. dollars are translated at the exchange
rate on the respective dates of such transactions.
The Group does not generally isolate that portion of the results of operations arising as a result of changes in the foreign currency exchange rates
from the fluctuations arising from changes in the market prices of securities. Accordingly, such foreign currency gain (loss) is included in net realized
and unrealized gain (loss) on investments.
h. Buy back
The Fund repurchases its shares by allocating the excess of repurchase price over par value against additional paid-in capital.
i. Cash and cash equivalents
Cash and cash equivalents includes highly liquid investments, such as money market funds, that are readily convertible to known amounts of cash
within 90 days from the date of purchase. All cash balances are held at major banking institutions.
j. Related parties
Parties are considered to be related if one party has the ability, directly or indirectly, to control the other party or exercise significant influence over
the other party in making financial and operating decisions.
k. Income taxes
The current charge for income taxes is calculated in accordance with the relevant tax regulations applicable to the Group. Deferred tax assets and
liabilities are recognized for future tax consequences attributable to temporary differences between the consolidated financial statements carrying
amount of existing assets and liabilities and their respective tax bases and operating loss carry forwards. Deferred tax assets and liabilities are
measured using prevailing tax rates expected to apply to taxable income in the years in which those temporary differences are expected to be
recovered or settled. The effect on deferred tax assets and liabilities of a change in tax rates is recognized in the consolidated statement of
operations in the period that includes the enactment date. The measurement of deferred tax assets is reduced, if necessary, by a valuation
allowance for any tax benefits of which future realization is not more likely than not.
l. Fair value of financial instruments other than investment in securities
The Group’s investments are accounted as described in Note 2(e). The Group’s financial instruments include other current assets, accounts payable
and accrued expenses, which are realizable or to be settled within a short period of time. The carrying amounts of these financial instruments
approximate their fair values.
m. Comprehensive income
The Group has no comprehensive income other than the net income disclosed in the statement of operations. Therefore, a statement of
comprehensive income has not been prepared.
KUBERA CROSS-BORDER FUND INTERIM REPORT 201424
2. Significant accounting policies (continued)
n. Investment management fees
On 17 January 2013 and subsequently on 7 June 2013, the Board of Directors of the Company fixed the management fees for the years 2013 to
2015. Provided that if at any time prior to 31 December 2015, the Net Asset Value does not drop below 15 per cent of the Net Asset Value as at
1 January 2013, the Company shall pay a management fee to the Manager which shall be:
l US$1,997,079 per annum for the period from 1 January 2013 to 31 December 2014 less the administration fee payable to IOMA Fund and
Investment Management Limited (“IOMA”) for such period;
l US$1,697,515 for the period from 1 January 2015 to 31 December 2015 less the administration fee payable to IOMA.
For periods subsequent to 31 December 2015 the management fee will be negotiated by both parties at that time.
Carried interest
Under the terms of the Partnership Agreement, Kubera Cross-Border Incentives SPC – Carried Interest SP, the Special Limited Partner of the
Partnership and an affiliate of the Investment Manager, is entitled to receive a carried interest from the Partnership equivalent to 20 per cent, of the
aggregate return over investment received by the Partnership following the full or partial cash realization of an investment.
Aggregate return, for the purposes of calculating the carried interest, is defined as the net realized gains reduced by the net unrealized losses of the
Partnership to the date of such distribution. Realized and unrealized gains or losses on each investment are determined on the most recent
announced NAV immediately prior to the date of such distribution.
The payment of carried interest is conditional upon the fact that the last announced adjusted NAV of the Fund prior to the date of distribution
should be equal to or greater than the Par Value. The adjusted NAV is arrived at by adding back the value of any income or capital distributions
made by the Fund to its shareholders.
In addition, the carried interest payment is adjusted such that, the aggregate cumulative amount of carried interest paid at the date of such
distribution will equal 20 per cent, of the eligible carried interest proceeds.
Eligible carried interest proceeds may not be less than zero.
3. Investment management fees and carried interest
Investment management fees
During the six month period ended 30 June 2014, the Fund paid US$951,040 (30 June 2013: US$ 998,540) as investment management fee.
Carried interest
During the six month period ended 30 June 2014, no carried interest is paid/payable (30 June 2013: Nil).
4. Directors’ fees and expenses
The Fund pays each of its directors an annual fee of £20,000 and the Chairman is paid an annual fee of £25,000, plus reimbursement for out-of-
pocket expenses incurred in the performance of their duties. The members of the Audit Committee are paid an annual fee of £2,000 and the
Chairman of the Audit Committee is paid an annual fee of £5,000. Mr. Raghavendran has waived his director’s fees as long as he is interested in the
Investment Manager.
The Fund does not remunerate its directors by way of share options and other long term incentives or by way of contribution to a pension scheme.
Notes to the consolidated financial statementsfor the six month period ended 30 June 2014 (continued)(Stated in United States Dollars)
KUBERA CROSS-BORDER FUND INTERIM REPORT 2014 25
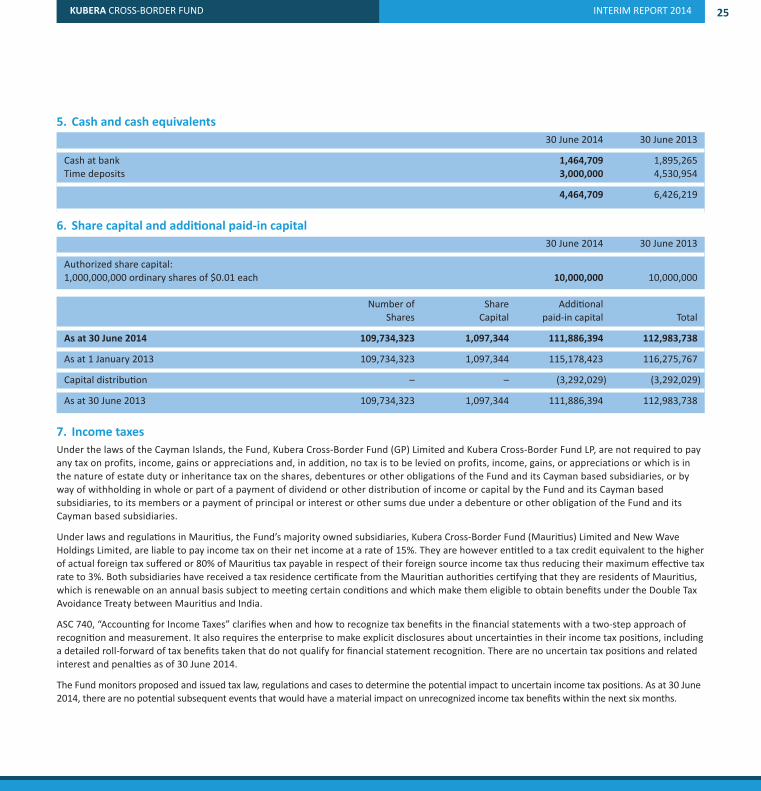
5. Cash and cash equivalents
30 June 2014 30 June 2013
Cash at bank 1,464,709 1,895,265
Time deposits 3,000,000 4,530,954
4,464,709 6,426,219
6. Share capital and additional paid-in capital
30 June 2014 30 June 2013
Authorized share capital:
1,000,000,000 ordinary shares of $0.01 each 10,000,000 10,000,000
Number of Share Additional
Shares Capital paid-in capital Total
As at 30 June 2014 109,734,323 1,097,344 111,886,394 112,983,738
As at 1 January 2013 109,734,323 1,097,344 115,178,423 116,275,767
Capital distribution – – (3,292,029) (3,292,029)
As at 30 June 2013 109,734,323 1,097,344 111,886,394 112,983,738
7. Income taxes
Under the laws of the Cayman Islands, the Fund, Kubera Cross-Border Fund (GP) Limited and Kubera Cross-Border Fund LP, are not required to pay
any tax on profits, income, gains or appreciations and, in addition, no tax is to be levied on profits, income, gains, or appreciations or which is in
the nature of estate duty or inheritance tax on the shares, debentures or other obligations of the Fund and its Cayman based subsidiaries, or by
way of withholding in whole or part of a payment of dividend or other distribution of income or capital by the Fund and its Cayman based
subsidiaries, to its members or a payment of principal or interest or other sums due under a debenture or other obligation of the Fund and its
Cayman based subsidiaries.
Under laws and regulations in Mauritius, the Fund’s majority owned subsidiaries, Kubera Cross-Border Fund (Mauritius) Limited and New Wave
Holdings Limited, are liable to pay income tax on their net income at a rate of 15%. They are however entitled to a tax credit equivalent to the higher
of actual foreign tax suffered or 80% of Mauritius tax payable in respect of their foreign source income tax thus reducing their maximum effective tax
rate to 3%. Both subsidiaries have received a tax residence certificate from the Mauritian authorities certifying that they are residents of Mauritius,
which is renewable on an annual basis subject to meeting certain conditions and which make them eligible to obtain benefits under the Double Tax
Avoidance Treaty between Mauritius and India.
ASC 740, “Accounting for Income Taxes” clarifies when and how to recognize tax benefits in the financial statements with a two-step approach of
recognition and measurement. It also requires the enterprise to make explicit disclosures about uncertainties in their income tax positions, including
a detailed roll-forward of tax benefits taken that do not qualify for financial statement recognition. There are no uncertain tax positions and related
interest and penalties as of 30 June 2014.
The Fund monitors proposed and issued tax law, regulations and cases to determine the potential impact to uncertain income tax positions. As at 30 June
2014, there are no potential subsequent events that would have a material impact on unrecognized income tax benefits within the next six months.
KUBERA CROSS-BORDER FUND INTERIM REPORT 201426
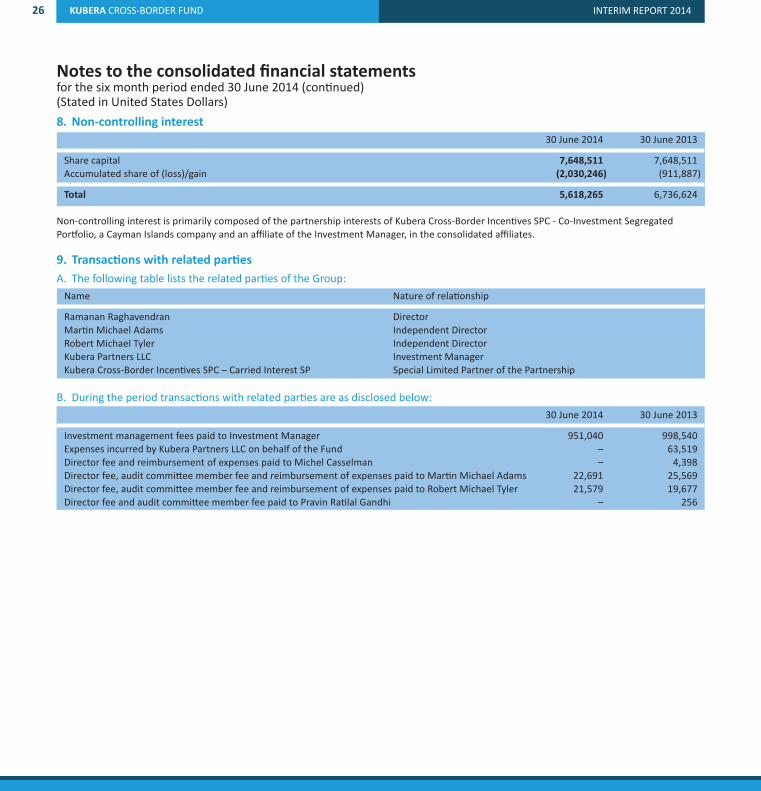
8. Non-controlling interest
30 June 2014 30 June 2013
Share capital 7,648,511 7,648,511
Accumulated share of (loss)/gain (2,030,246) (911,887)
Total 5,618,265 6,736,624
Non-controlling interest is primarily composed of the partnership interests of Kubera Cross-Border Incentives SPC - Co-Investment Segregated
Portfolio, a Cayman Islands company and an affiliate of the Investment Manager, in the consolidated affiliates.
9. Transactions with related parties
A. The following table lists the related parties of the Group:
Name Nature of relationship
Ramanan Raghavendran Director
Martin Michael Adams Independent Director
Robert Michael Tyler Independent Director
Kubera Partners LLC Investment Manager
Kubera Cross-Border Incentives SPC – Carried Interest SP Special Limited Partner of the Partnership
B. During the period transactions with related parties are as disclosed below:
30 June 2014 30 June 2013
Investment management fees paid to Investment Manager 951,040 998,540
Expenses incurred by Kubera Partners LLC on behalf of the Fund – 63,519
Director fee and reimbursement of expenses paid to Michel Casselman – 4,398
Director fee, audit committee member fee and reimbursement of expenses paid to Martin Michael Adams 22,691 25,569
Director fee, audit committee member fee and reimbursement of expenses paid to Robert Michael Tyler 21,579 19,677
Director fee and audit committee member fee paid to Pravin Ratilal Gandhi – 256
Notes to the consolidated financial statementsfor the six month period ended 30 June 2014 (continued)(Stated in United States Dollars)
KUBERA CROSS-BORDER FUND INTERIM REPORT 2014 27
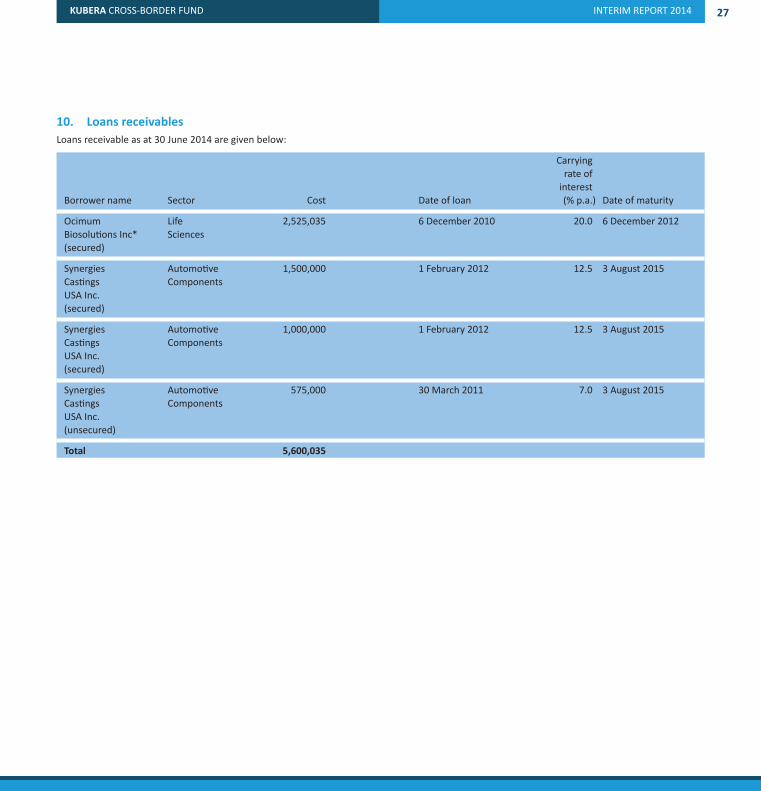
10. Loans receivables
Loans receivable as at 30 June 2014 are given below:
Carrying
rate of
interest
Borrower name Sector Cost Date of loan (% p.a.) Date of maturity
Ocimum Life 2,525,035 6 December 2010 20.0 6 December 2012
Biosolutions Inc* Sciences
(secured)
Synergies Automotive 1,500,000 1 February 2012 12.5 3 August 2015
Castings Components
USA Inc.
(secured)
Synergies Automotive 1,000,000 1 February 2012 12.5 3 August 2015
Castings Components
USA Inc.
(secured)
Synergies Automotive 575,000 30 March 2011 7.0 3 August 2015
Castings Components
USA Inc.
(unsecured)
Total 5,600,035
KUBERA CROSS-BORDER FUND INTERIM REPORT 201428
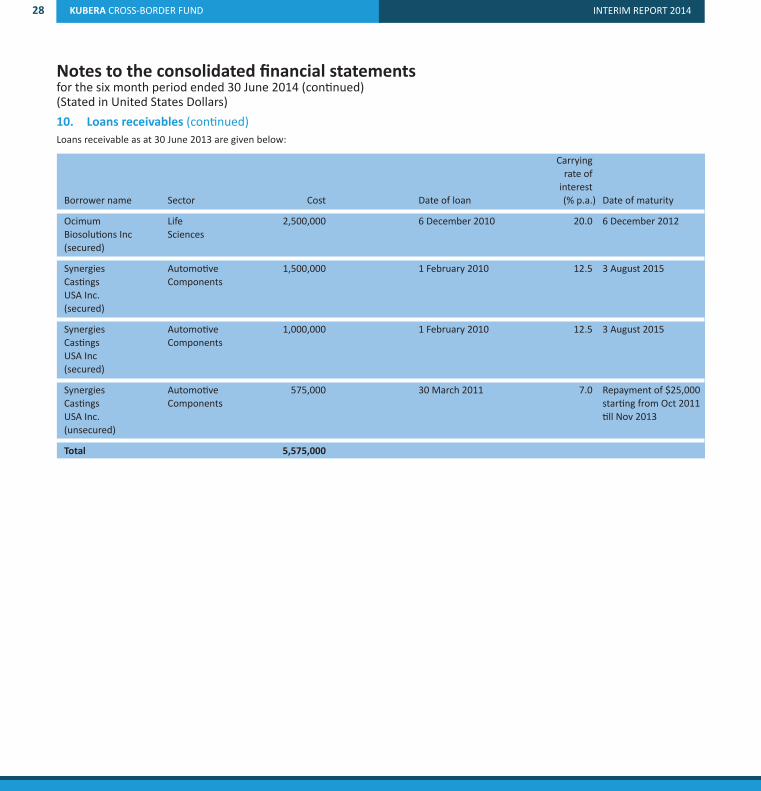
10. Loans receivables (continued)
Loans receivable as at 30 June 2013 are given below:
Carrying
rate of
interest
Borrower name Sector Cost Date of loan (% p.a.) Date of maturity
Ocimum Life 2,500,000 6 December 2010 20.0 6 December 2012
Biosolutions Inc Sciences
(secured)
Synergies Automotive 1,500,000 1 February 2010 12.5 3 August 2015
Castings Components
USA Inc.
(secured)
Synergies Automotive 1,000,000 1 February 2010 12.5 3 August 2015
Castings Components
USA Inc
(secured)
Synergies Automotive 575,000 30 March 2011 7.0 Repayment of $25,000
Castings Components starting from Oct 2011
USA Inc. till Nov 2013
(unsecured)
Total 5,575,000
Notes to the consolidated financial statementsfor the six month period ended 30 June 2014 (continued)(Stated in United States Dollars)
KUBERA CROSS-BORDER FUND INTERIM REPORT 2014 29
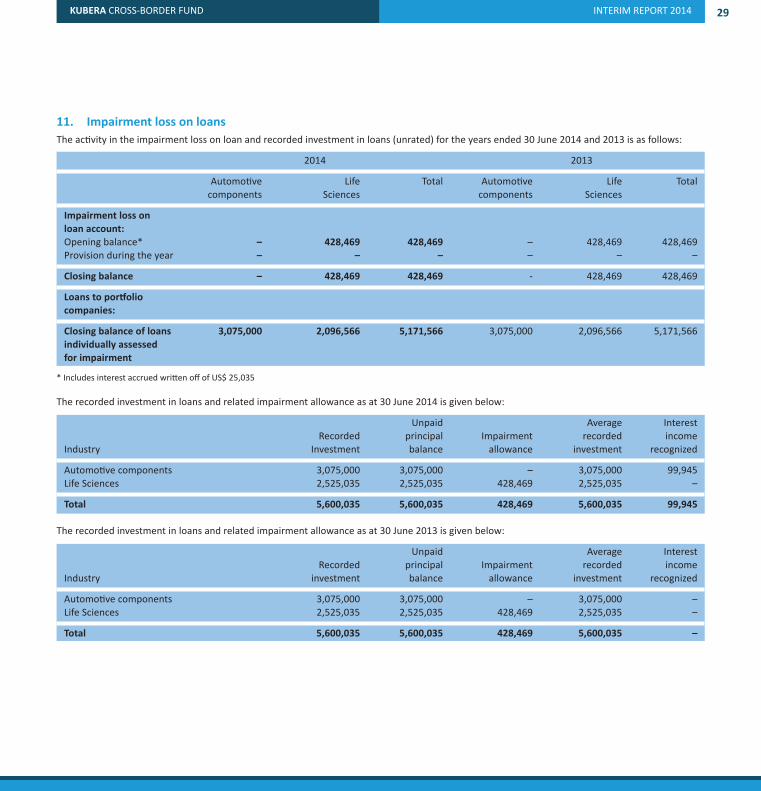
11. Impairment loss on loans
The activity in the impairment loss on loan and recorded investment in loans (unrated) for the years ended 30 June 2014 and 2013 is as follows:
2014 2013
Automotive Life Total Automotive Life Total
components Sciences components Sciences
Impairment loss on
loan account:
Opening balance* – 428,469 428,469 – 428,469 428,469
Provision during the year – – – – – –
Closing balance – 428,469 428,469 - 428,469 428,469
Loans to portfolio
companies:
Closing balance of loans 3,075,000 2,096,566 5,171,566 3,075,000 2,096,566 5,171,566
individually assessed
for impairment
* Includes interest accrued written off of US$ 25,035
The recorded investment in loans and related impairment allowance as at 30 June 2014 is given below:
Unpaid Average Interest
Recorded principal Impairment recorded income
Industry Investment balance allowance investment recognized
Automotive components 3,075,000 3,075,000 – 3,075,000 99,945
Life Sciences 2,525,035 2,525,035 428,469 2,525,035 –
Total 5,600,035 5,600,035 428,469 5,600,035 99,945
The recorded investment in loans and related impairment allowance as at 30 June 2013 is given below:
Unpaid Average Interest
Recorded principal Impairment recorded income
Industry investment balance allowance investment recognized
Automotive components 3,075,000 3,075,000 – 3,075,000 –
Life Sciences 2,525,035 2,525,035 428,469 2,525,035 –
Total 5,600,035 5,600,035 428,469 5,600,035 –
KUBERA CROSS-BORDER FUND INTERIM REPORT 201430
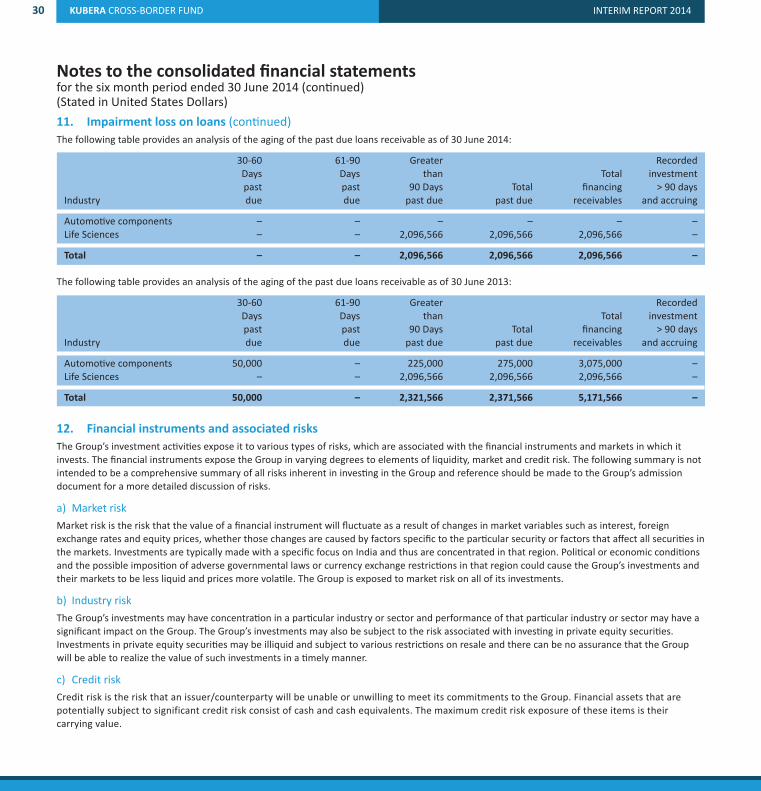
11. Impairment loss on loans (continued)
The following table provides an analysis of the aging of the past due loans receivable as of 30 June 2014:
30-60 61-90 Greater Recorded
Days Days than Total investment
past past 90 Days Total financing > 90 days
Industry due due past due past due receivables and accruing
Automotive components – – – – – –
Life Sciences – – 2,096,566 2,096,566 2,096,566 –
Total – – 2,096,566 2,096,566 2,096,566 –
The following table provides an analysis of the aging of the past due loans receivable as of 30 June 2013:
30-60 61-90 Greater Recorded
Days Days than Total investment
past past 90 Days Total financing > 90 days
Industry due due past due past due receivables and accruing
Automotive components 50,000 – 225,000 275,000 3,075,000 –
Life Sciences – – 2,096,566 2,096,566 2,096,566 –
Total 50,000 – 2,321,566 2,371,566 5,171,566 –
12. Financial instruments and associated risks
The Group’s investment activities expose it to various types of risks, which are associated with the financial instruments and markets in which it
invests. The financial instruments expose the Group in varying degrees to elements of liquidity, market and credit risk. The following summary is not
intended to be a comprehensive summary of all risks inherent in investing in the Group and reference should be made to the Group’s admission
document for a more detailed discussion of risks.
a) Market risk
Market risk is the risk that the value of a financial instrument will fluctuate as a result of changes in market variables such as interest, foreign
exchange rates and equity prices, whether those changes are caused by factors specific to the particular security or factors that affect all securities in
the markets. Investments are typically made with a specific focus on India and thus are concentrated in that region. Political or economic conditions
and the possible imposition of adverse governmental laws or currency exchange restrictions in that region could cause the Group’s investments and
their markets to be less liquid and prices more volatile. The Group is exposed to market risk on all of its investments.
b) Industry risk
The Group’s investments may have concentration in a particular industry or sector and performance of that particular industry or sector may have a
significant impact on the Group. The Group’s investments may also be subject to the risk associated with investing in private equity securities.
Investments in private equity securities may be illiquid and subject to various restrictions on resale and there can be no assurance that the Group
will be able to realize the value of such investments in a timely manner.
c) Credit risk
Credit risk is the risk that an issuer/counterparty will be unable or unwilling to meet its commitments to the Group. Financial assets that are
potentially subject to significant credit risk consist of cash and cash equivalents. The maximum credit risk exposure of these items is their
carrying value.
Notes to the consolidated financial statementsfor the six month period ended 30 June 2014 (continued)(Stated in United States Dollars)
KUBERA CROSS-BORDER FUND INTERIM REPORT 2014 31
d) Currency risk
The Group has assets denominated in currencies other than the US Dollar, the functional currency. The Group is therefore exposed to currency risk
as the value of assets denominated in other currencies will fluctuate due to changes in exchange rates. The Group’s cash and cash equivalents are
held in US Dollars.
e) Liquidity risk
The Group is exposed to liquidity risk as a majority of the Group’s investments are largely illiquid. Illiquid investments include any securities or
instruments which are not actively traded on any major securities market or for which no established secondary market exists where the
investments can be readily converted into cash. Reduced liquidity resulting from the absence of an established secondary market may have an
adverse effect on the prices of the Group’s investments and the Group’s ability to dispose of them where necessary to meet liquidity requirements.
As a result, the Group may be exposed to significant liquidity risk.
f) Political, economic and social risk
Political, economic and social factors, mainly changes in Indian laws or regulations and the status of India’s relations with other countries may
adversely affect the value of the Group’s investments.
13. Sale of investments held by NeoPath Limited
On 25 August 2010, NeoPath Limited (NeoPath), a portfolio company of New Wave Holdings Limited, sold its 100% holding in Venture Infotek Global
Private Limited, its wholly owned subsidiary, to Atos Origin (Singapore) Pte Limited (Atos), a company incorporated and resident in Singapore, for a
consideration of USD 110 million. As part of the terms of the share purchase agreement, USD 69.04 million was paid to NeoPath for its share of holding.
In April 2013, NeoPath entered into a settlement with Atos (with respect to the monies lying in escrow that were subject to an arbitration process)
and received USD 13.07 million as a settlement amount. NeoPath distributed the same by way of buyback of 5,613,579 preferred shares; pursuant
to which New Wave Holdings Limited received USD 5.61 million. New Wave Holdings Limited accounted for it as a realized gain on sale of investment
in securities.
The only asset now left in NeoPath Limited is the withholding tax refund. Atos had deducted withholding tax towards Indian income tax of USD
15.96 million (the Group’s share is USD 7.49 million) and deposited with the Government of India. NeoPath Limited is in the process of claiming a
refund of the withholding tax based on its position that the capital gains realized on the sale is exempt from tax in India under the relevant
provisions of the India-Mauritius tax treaty. Consequently, based on the tax counsel opinion, the entire amount of USD 15.96 million has been
considered as fully recoverable and the present value of the expected tax refund has been included in the fair value estimate of the investment in
NeoPath as at 30 June 2014.
14. Previous year comparatives
Prior year comparatives have been regrouped and reclas sified wherever necessary to confirm with the current year’s presentation.
KUBERA CROSS-BORDER FUND INTERIM REPORT 201432
Corporate Information
Board of DirectorsMartin Michael Adams, Chairman
Robert Michael Tyler
Ramanan Raghavendran
Audit CommitteeRobert Michael Tyler, Chairman
Martin Michael Adams
Investment ManagerKubera Partners LLC®
C/O Frankel Loughran Starr & Vallone, LLP
1475 Franklin Avenue
Garden City, NY 11530
www.kuberapartners.com
BrokerNumis Securities Ltd
The London Stock Exchange Building
10 Paternoster Square
London EC4M 7LT
Tel: +44 (0) 20 7260 1000
www.numiscorp.com
CustodianKotak Mahindra Bank Limited
Custody Services Unit
Kotak Infiniti, 6th Floor
Zone IV, Building No. 21
Infinity Park, Off Western Express Highway
General A K Vaidya Marg, Malad (E)
Mumbai-400 097
India
www.kotak.com
Administrator, Registrar & Company SecretaryIOMA Fund and Investment Management Limited
IOMA House, Hope Street, Douglas
Isle of Man, IM1 1AP
Tel +44 (0) 1624 681200
www.iomagroup.co.im
Cim Fund Services Ltd
33, Edith Cavell Street,
Port-Louis, Mauritius
Tel +230 405 2000
www.cimglobalbusiness.com
Nominated AdviserGrant Thornton Corporate Finance
30 Finsbury Square
London, EC2P 2YU
United Kingdom
Tel +44 (0) 20 7383 5100
www.grant-thornton.co.uk
AuditorKPMG India
Lodha Excelus, 5th Floor
Apollo Mills Compound
N.M. Joshi Marg, Mahalaxmi
Mumbai 400 011
India
Tel +91 22 3989 6000
www.in.kpmg.com
Legal Adviser (as to English law)Lawrence Graham LLP
4 More London Riverside
London SE1 2AU
United Kingdom
Tel +44 (0) 20 7379 0000
www.lg-legal.com
Legal Adviser (as to Cayman Islands law)Maples and Calder
Princes Court, 7 Princes Street
London EC2R 8AQ
United Kingdom
+44 (0) 20 7466 1600
www.maplesandcalder.com

Kubera Cross-Border Fund Limited
PO Box 309GT Ugland House,South Church Street, George Town,
Grand Cayman, Cayman [email protected]
www.kuberacrossborderfund.com