Embed Size (px)
Citation preview
Building for sustainaBility on a rock-solid BaseCONSOLIDATED ANNUAL REPORT 2014
Your well-being, our duty


INTEGRATED UTILITY HOLDING N.V. (AQUALECTRA)Reference number 2015-20380
28/05/2015
Board of Managing Directors
3
contents
Profile
Integrated Utility Holding (IUH) N.V. doing
business as Aqualectra (hereinafter
“Aqualectra” or “the Group”), is the utility
company of Curaçao responsible for the
production and distribution of power and
water as well as the delivery of accompanying
services. As per December 2014 the Group’s
workforce consisted of 681 (2013: 724)
dedicated employees who provide the
manpower needed for the delivery of quality
products and services to our customers.
As per December 31, 2014, the Group had
approximately 69,156 (2013: 76,075)
electricity connections and 77,804 (2013:
76,522) water connections.
This annual report of the Group is the
consolidated report of Management to the
shareholders and other relevant stakeholders
about the financial and non-financial
performance of the Group over the year
2014. The scope of this report comprises
the Integrated Utility Holding N.V. and its
subsidiaries.
4
Table of contents
1. Report of the Board of Managing Directors 7
1.1. Milestones 2014 8
1.2. Financial performance 9
1.3. Financial position 14
1.4. Regulatory environment 16
1.5. Corporate Governance 17
1.6. Compliance with the Corporate
Governance Code 21
1.7. Corporate Citizenship 22
1.8. Future prospects 23
2. Report of the Board of Supervisory Directors 27 2.1. Legal structure of the Group 28
2.2. Corporate Governance 28
2.3. Compliance with the Corporate
Governance Code 29
2.4. Composition of the Board of
Supervisory Directors 30
2.5. Annual financial report and
dividend proposal 31
2.6. Assertion of the Board of
Supervisory Directors 32
3. Highlights of the year 34
4. Consolidated Financial Statements 36 4.1. Consolidated Statement of
Financial Position 37
4.2. Consolidated Statement of
Comprehensive Income 38
4.3. Consolidated Statement of Changes
in Shareholder’s Equity 39
4.4. Consolidated Statement of Cash Flows 40
5. Notes to the Consolidated Financial Statements 42 5.1. General 43
5.2. Summary of significant accounting
policies 45
5.3. Significant accounting judgments,
estimates and assumptions 60
5.4. Financial risk management 61
5.4.1. Market risks 62
5.4.1.1. Foreign exchange risk 62
5.4.1.2. Interest rate risk 65
5.4.1.3. Tariff risk 66
5.4.2. Credit risk 69
5.4.3. Liquidity risk 71
5.4.4. Capital management 74
5.5. Explanatory notes to the Statement
of Financial Position 75
5.5.1. Intangible Assets 75
5.5.2. Property, Plant and Equipment 76
5.5.3. Other Non-current financial assets 78
5.5.4. Deferred tax assets 78
5.5.5. Inventories 79
5.5.6. Trade accounts receivable 80
5.5.7. Other receivables 81
5.5.8. Cash & cash equivalents 82
5.5.9. Share capital and share premium 83
5.5.10. Preferred shares and treasury shares 83
5.5.11. Financial liabilities 84
5.5.12. Customer deposits 85
5.5.13. Provisions 85
5.5.13.1. Provisions employee benefits 86
5.5.13.2. Other provisions 97
5.5.14. Trade accounts payable 98
5.5.15. Corporate Bonds IUH N.V. 98
5.5.16. Bank overdrafts 99
5.5.17. Other liabilities 100
5.5.18. Commitments and Contingencies 101
5.5.18.1. Operating lease commitments 101
5.5.18.2. Other commitments 103
5.5.18.3. Legal claim contingency 104
5.5.18.4. L/C guarantee 104
5.5.18.5. Contingent liabilities 104
5.5.18.6. Contingent assets 106
5.5.19. Fair Values 108
5.6. Explanatory Notes to the Consolidated
Statement of Comprehensive Income 110
5.6.1. Sales Electricity and Water 110
5.6.2. Direct costs production 110
5.6.3. Salaries, social securities and other
personnel expenses 111
5.6.4. Other (post) employment benefits (net) 111
5.6.5. Parts, repairs and maintenance 112
5.6.6. General expenses 113
5.6.7. Interest expense (net) 113
5.6.8. Income tax 114
5.7. Related Parties 115
5.8. Subsequent events 116
5

6

1. report of the Board of Managing directors
7
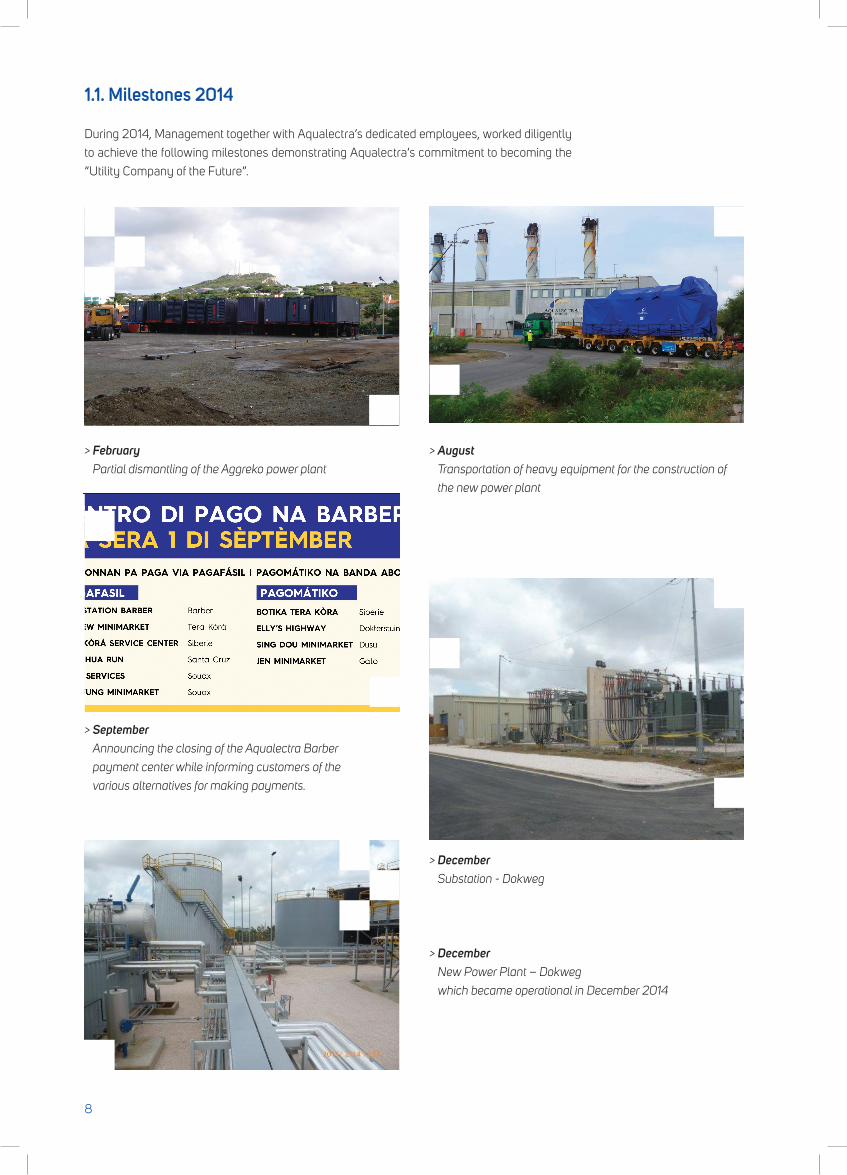
1.1. Milestones 2014
During 2014, Management together with Aqualectra’s dedicated employees, worked diligently
to achieve the following milestones demonstrating Aqualectra’s commitment to becoming the
“Utility Company of the Future”.
> February
Partial dismantling of the Aggreko power plant
> September
Announcing the closing of the Aqualectra Barber
payment center while informing customers of the
various alternatives for making payments.
> August Transportation of heavy equipment for the construction of
the new power plant
> December
Substation - Dokweg
> December
New Power Plant – Dokweg
which became operational in December 2014
8
1.2. Financial performance
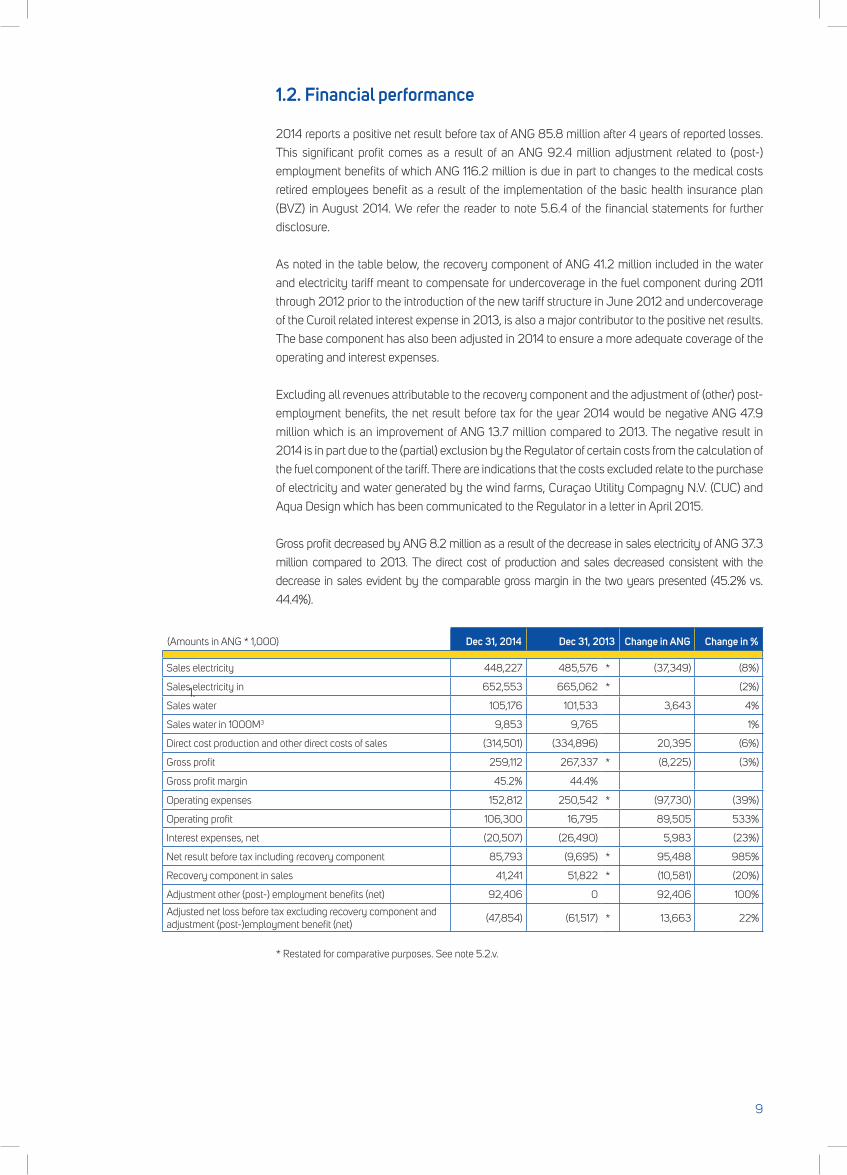
2014 reports a positive net result before tax of ANG 85.8 million after 4 years of reported losses.
This significant profit comes as a result of an ANG 92.4 million adjustment related to (post-)
employment benefits of which ANG 116.2 million is due in part to changes to the medical costs
retired employees benefit as a result of the implementation of the basic health insurance plan
(BVZ) in August 2014. We refer the reader to note 5.6.4 of the financial statements for further
disclosure.
As noted in the table below, the recovery component of ANG 41.2 million included in the water
and electricity tariff meant to compensate for undercoverage in the fuel component during 2011
through 2012 prior to the introduction of the new tariff structure in June 2012 and undercoverage
of the Curoil related interest expense in 2013, is also a major contributor to the positive net results.
The base component has also been adjusted in 2014 to ensure a more adequate coverage of the
operating and interest expenses.
Excluding all revenues attributable to the recovery component and the adjustment of (other) post-
employment benefits, the net result before tax for the year 2014 would be negative ANG 47.9
million which is an improvement of ANG 13.7 million compared to 2013. The negative result in
2014 is in part due to the (partial) exclusion by the Regulator of certain costs from the calculation of
the fuel component of the tariff. There are indications that the costs excluded relate to the purchase
of electricity and water generated by the wind farms, Curaçao Utility Compagny N.V. (CUC) and
Aqua Design which has been communicated to the Regulator in a letter in April 2015.
Gross profit decreased by ANG 8.2 million as a result of the decrease in sales electricity of ANG 37.3
million compared to 2013. The direct cost of production and sales decreased consistent with the
decrease in sales evident by the comparable gross margin in the two years presented (45.2% vs.
44.4%).
(Amounts in ANG * 1,000) Dec 31, 2014 Dec 31, 2013 Change in ANG Change in %
Sales electricity 448,227 485,576 * (37,349) (8%)
Sales electricity in 652,553 665,062 * (2%)
Sales water 105,176 101,533 3,643 4%
Sales water in 1000M3 9,853 9,765 1%
Direct cost production and other direct costs of sales (314,501) (334,896) 20,395 (6%)
Gross profit 259,112 267,337 * (8,225) (3%)
Gross profit margin 45.2% 44.4%
Operating expenses 152,812 250,542 * (97,730) (39%)
Operating profit 106,300 16,795 89,505 533%
Interest expenses, net (20,507) (26,490) 5,983 (23%)
Net result before tax including recovery component 85,793 (9,695) * 95,488 985%
Recovery component in sales 41,241 51,822 * (10,581) (20%)
Adjustment other (post-) employment benefits (net) 92,406 0 92,406 100%
Adjusted net loss before tax excluding recovery component and adjustment (post-)employment benefit (net)
(47,854) (61,517) * 13,663 22%
* Restated for comparative purposes. See note 5.2.v.
1.
9
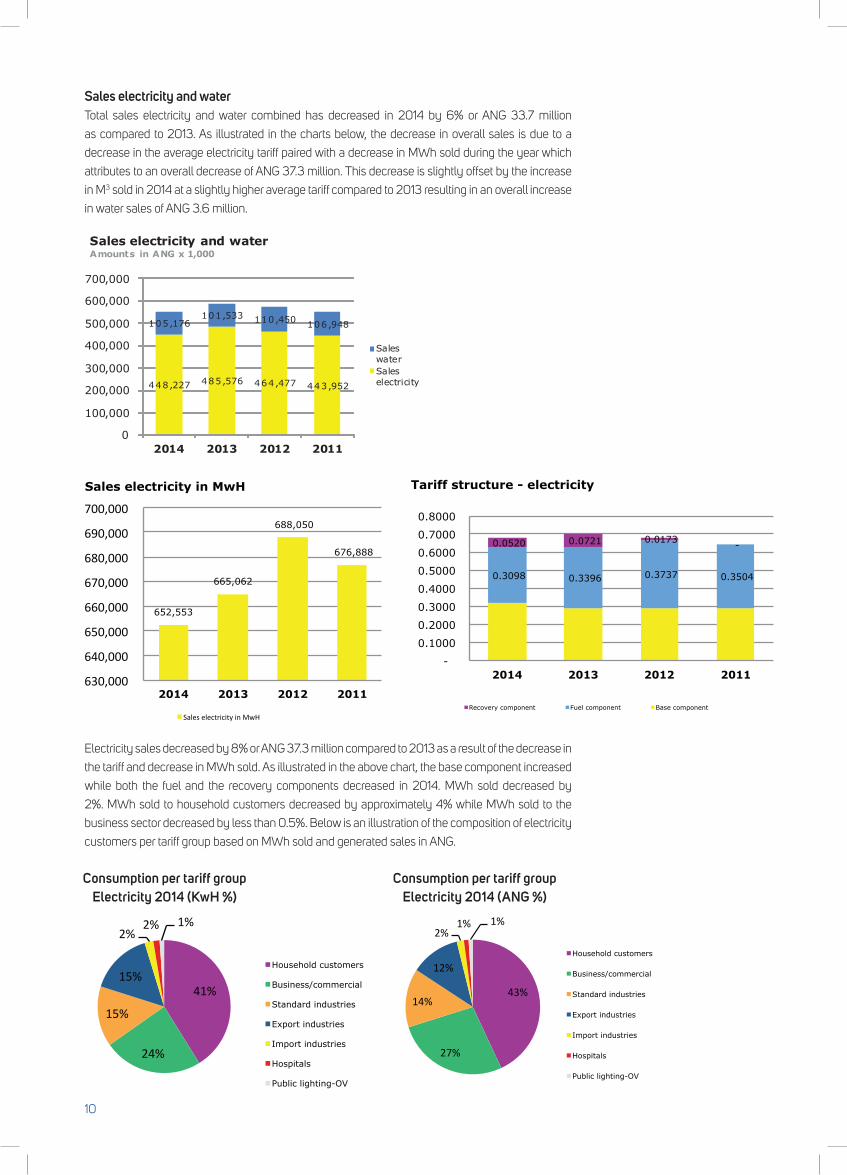
Sales electricity and water Total sales electricity and water combined has decreased in 2014 by 6% or ANG 33.7 million
as compared to 2013. As illustrated in the charts below, the decrease in overall sales is due to a
decrease in the average electricity tariff paired with a decrease in MWh sold during the year which
attributes to an overall decrease of ANG 37.3 million. This decrease is slightly offset by the increase
in M3 sold in 2014 at a slightly higher average tariff compared to 2013 resulting in an overall increase
in water sales of ANG 3.6 million.
Electricity sales decreased by 8% or ANG 37.3 million compared to 2013 as a result of the decrease in
the tariff and decrease in MWh sold. As illustrated in the above chart, the base component increased
while both the fuel and the recovery components decreased in 2014. MWh sold decreased by
2%. MWh sold to household customers decreased by approximately 4% while MWh sold to the
business sector decreased by less than 0.5%. Below is an illustration of the composition of electricity
customers per tariff group based on MWh sold and generated sales in ANG.
652,553
665,062
688,050
676,888
630,000
640,000
650,000
660,000
670,000
680,000
690,000
700,000
2014 2013 2012 2011
Sales electricity in MwH
Sales electricity in MwH
0.3098 0.3396 0.3737 0.3504
0.0520 0.0721 0.0173 -
-
0.1000
0.2000
0.3000
0.4000
0.5000
0.6000
0.7000
0.8000
2014 2013 2012 2011
Tariff structure - electricity
Recovery component Fuel component Base component
41%
24%
15%
15%
2% 2% 1%
Household customers
Business/commercial
Standard industries
Export industries
Import industries
Hospitals
Public lighting-OV
43%
27%
14%
12%
2% 1% 1%
Household customers
Business/commercial
Standard industries
Export industries
Import industries
Hospitals
Public lighting-OV
448,227 485,576 464,477 443,952
105,176 101,533 110,450 106,948
0
100,000
200,000
300,000
400,000
500,000
600,000
700,000
2014 2013 2012 2011
Sales electricity and waterAmounts in ANG x 1,000
SaleswaterSaleselectricity
10
Consumption per tariff groupElectricity 2014 (KwH %)
Consumption per tariff groupElectricity 2014 (ANG %)
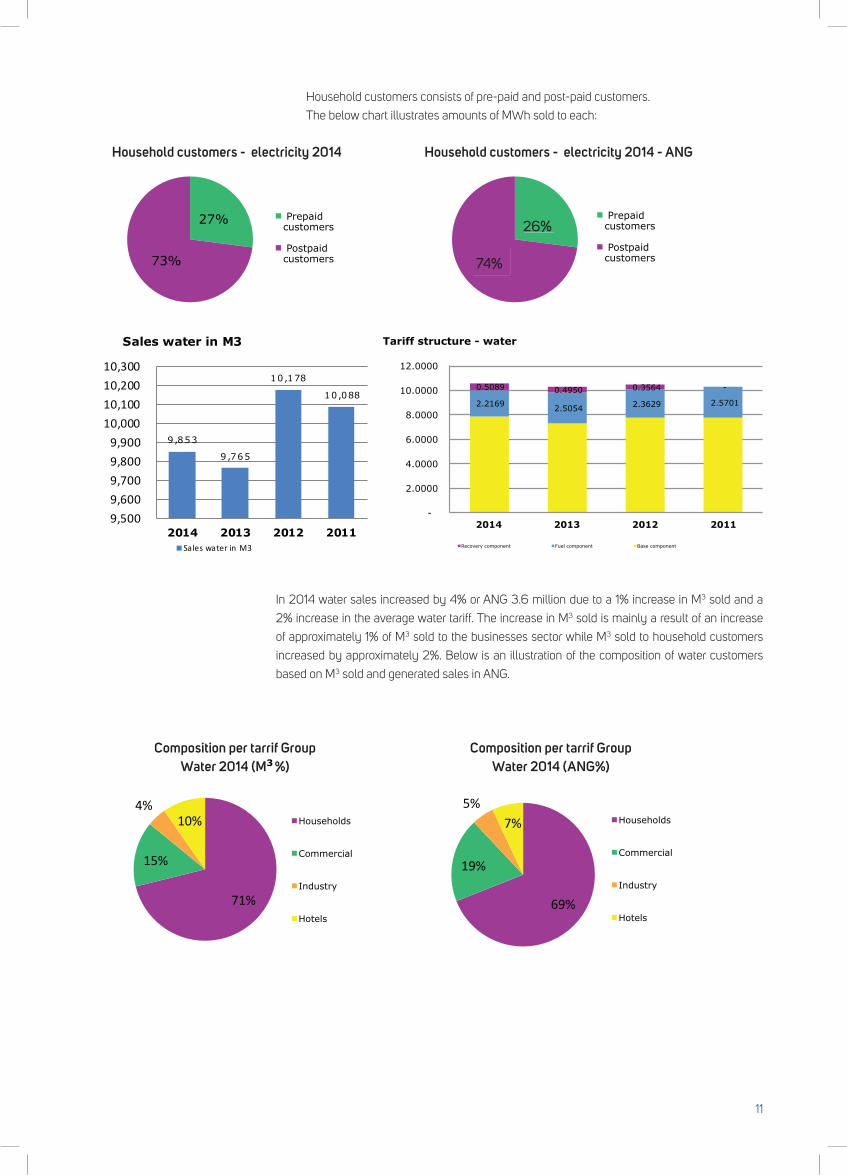
In 2014 water sales increased by 4% or ANG 3.6 million due to a 1% increase in M3 sold and a
2% increase in the average water tariff. The increase in M3 sold is mainly a result of an increase
of approximately 1% of M3 sold to the businesses sector while M3 sold to household customers
increased by approximately 2%. Below is an illustration of the composition of water customers
based on M3 sold and generated sales in ANG.
2.2169 2.5054 2.3629 2.5701
0.5089 0.4950 0.3564 -
-
2.0000
4.0000
6.0000
8.0000
10.0000
12.0000
2014 2013 2012 2011
Tariff structure - water
Recovery component Fuel component Base component
27%
73%
Prepaid customers
Postpaid customers
27%
73%
Prepaid customers
Postpaid customers
0.26175147
0.73824853
Prepaid customers
Postpaid customers
0.26175147
0.73824853
Prepaid customers
Postpaid customers
71%
15%
4% 10% Households
Commercial
Industry
Hotels
71%
15%
4% 10% Households
Commercial
Industry
Hotels
71%
15%
4% 10% Households
Commercial
Industry
Hotels
Household customers consists of pre-paid and post-paid customers.
The below chart illustrates amounts of MWh sold to each:
27%
73%
Prepaid customers
Postpaid customers 27%
73%
Prepaid customers
Postpaid customers
74%
26%
11
9,853
9 ,765
10,178
10,088
9,5009,6009,7009,8009,900
10,00010,10010,20010,300
2014 2013 2012 2011
Sales water in M3
Sales water in M3
Household customers - electricity 2014 Household customers - electricity 2014 - ANG
69%
19%
5% 7%
Households
Commercial
Industry
Hotels
Composition per tarrif GroupWater 2014 (M %)
Composition per tarrif GroupWater 2014 (ANG%)
9,765
10,178 10,088
9,978
9,400
9,600
9,800
10,000
10,200
10,400
2013 2012 2011 2010
Sales water in M3
Sales water in M3
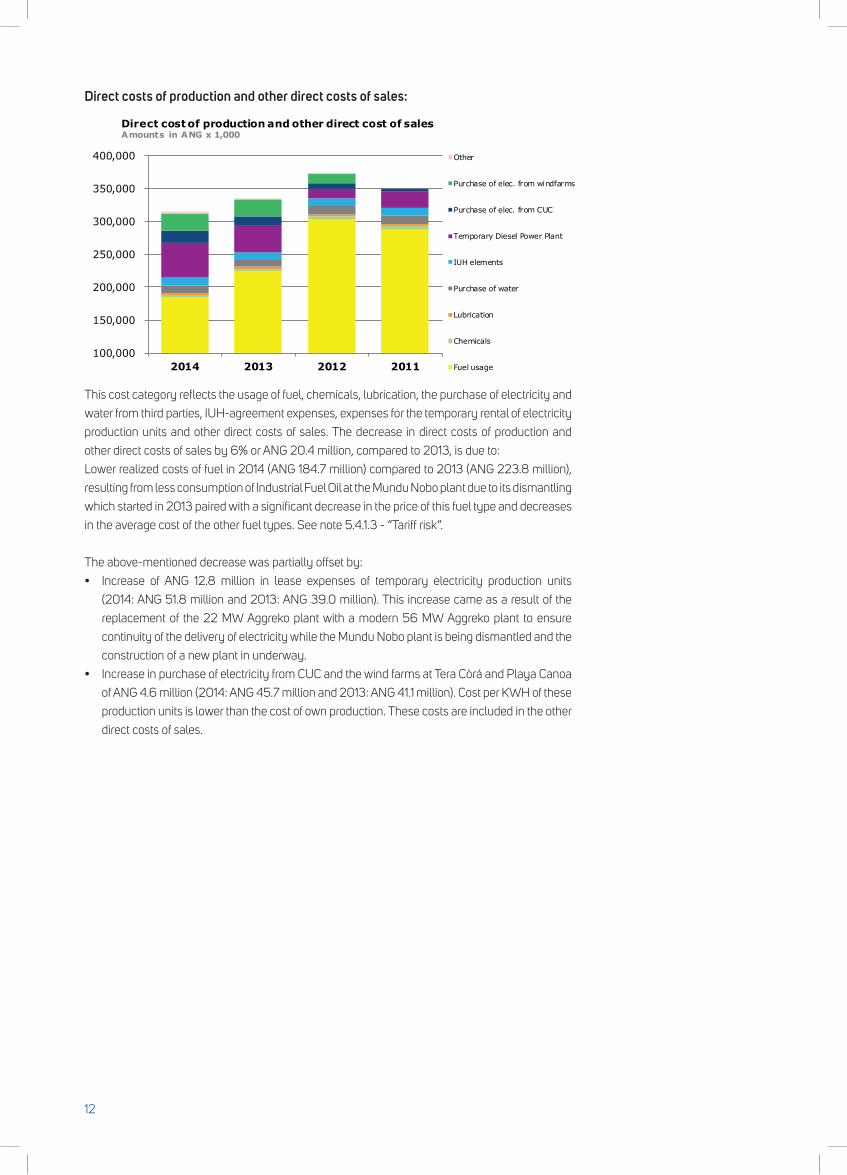
Direct costs of production and other direct costs of sales:
This cost category reflects the usage of fuel, chemicals, lubrication, the purchase of electricity and
water from third parties, IUH-agreement expenses, expenses for the temporary rental of electricity
production units and other direct costs of sales. The decrease in direct costs of production and
other direct costs of sales by 6% or ANG 20.4 million, compared to 2013, is due to:
Lower realized costs of fuel in 2014 (ANG 184.7 million) compared to 2013 (ANG 223.8 million),
resulting from less consumption of Industrial Fuel Oil at the Mundu Nobo plant due to its dismantling
which started in 2013 paired with a significant decrease in the price of this fuel type and decreases
in the average cost of the other fuel types. See note 5.4.1.3 - “Tariff risk”.
The above-mentioned decrease was partially offset by:
• Increase of ANG 12.8 million in lease expenses of temporary electricity production units
(2014: ANG 51.8 million and 2013: ANG 39.0 million). This increase came as a result of the
replacement of the 22 MW Aggreko plant with a modern 56 MW Aggreko plant to ensure
continuity of the delivery of electricity while the Mundu Nobo plant is being dismantled and the
construction of a new plant in underway.
• IncreaseinpurchaseofelectricityfromCUCandthewindfarmsatTeraCòráandPlayaCanoa
of ANG 4.6 million (2014: ANG 45.7 million and 2013: ANG 41.1 million). Cost per KWH of these
production units is lower than the cost of own production. These costs are included in the other
direct costs of sales.
12
100,000
150,000
200,000
250,000
300,000
350,000
400,000
2014 2013 2012 2011
Direct cost of production and other direct cost of salesAmounts in ANG x 1,000
Other
Purchase of elec. from windfarms
Purchase of elec. from CUC
Temporary Diesel Power Plant
IUH elements
Purchase of water
Lubrication
Chemicals
Fuel usage
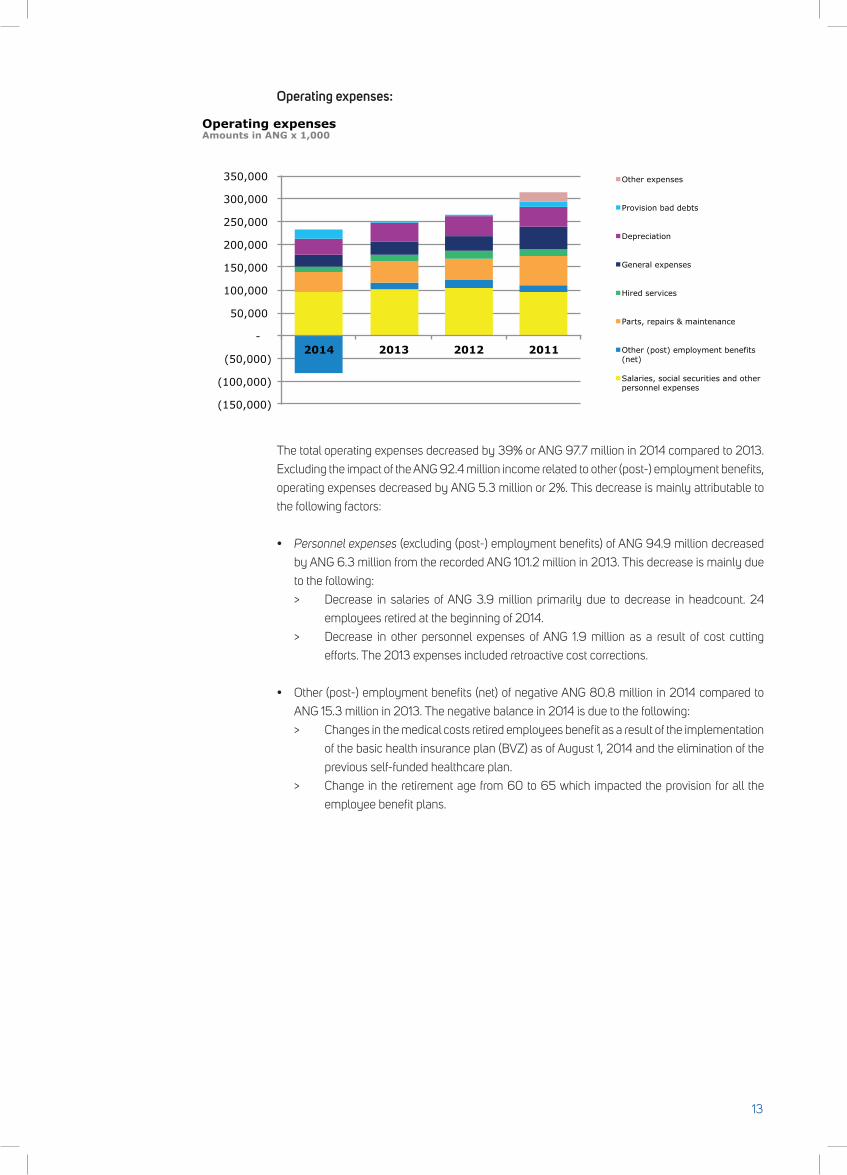
Operating expenses:
The total operating expenses decreased by 39% or ANG 97.7 million in 2014 compared to 2013.
Excluding the impact of the ANG 92.4 million income related to other (post-) employment benefits,
operating expenses decreased by ANG 5.3 million or 2%. This decrease is mainly attributable to
the following factors:
• Personnel expenses (excluding (post-) employment benefits) of ANG 94.9 million decreased
by ANG 6.3 million from the recorded ANG 101.2 million in 2013. This decrease is mainly due
to the following:
> Decrease in salaries of ANG 3.9 million primarily due to decrease in headcount. 24
employees retired at the beginning of 2014.
> Decrease in other personnel expenses of ANG 1.9 million as a result of cost cutting
efforts. The 2013 expenses included retroactive cost corrections.
• Other(post-)employmentbenefits(net)ofnegativeANG80.8millionin2014comparedto
ANG 15.3 million in 2013. The negative balance in 2014 is due to the following:
> Changes in the medical costs retired employees benefit as a result of the implementation
of the basic health insurance plan (BVZ) as of August 1, 2014 and the elimination of the
previous self-funded healthcare plan.
> Change in the retirement age from 60 to 65 which impacted the provision for all the
employee benefit plans.
13
(150,000)
(100,000)
(50,000)
-
50,000
100,000
150,000
200,000
250,000
300,000
350,000
2014 2013 2012 2011
Operating expenses Amounts in ANG x 1,000
Other expenses
Provision bad debts
Depreciation
General expenses
Hired services
Parts, repairs & maintenance
Other (post) employment benefits (net)
Salaries, social securities and other personnel expenses
• Parts, repairs & maintenance expenses and hired services amounted to ANG 56.3 million in
2014 (2013: ANG 61.9 million). The ANG 5.6 million (9%) decrease is mainly a result of less
maintenance required due to the demolition of the Mundu Nobo plant.
• General expenses regards the costs related to housing & car fleet, office expenses, Communication
& PR, insurances and security, consultancy and other miscellaneous expenses. In 2014 a total of
ANG 24.9 million was recognized as general expenses, which is a decrease of ANG 3.5 million
(12%) compared to 2013 (ANG 28.4 million). The decrease of the general expenses in 2014 is
due to cost cutting measures implemented stemming from the efficiency improvement process
initiated within the company.
• Depreciation expenses amounts to ANG 36.6 million in the year under report (2013: ANG
40.5 million). This is a decrease of ANG 3.9 million compared to 2013. Depreciation costs are
realized based on the total amount in assets on the balance sheet during the year under report.
Before mentioned decreases were partially offset by:
• Provision bad debt expenses amounting to ANG 20.9 million in 2014 (2013: ANG 3.3 million).
A prudent provision was created primarily for accounts receivable which have accumulated in
Aqualectra Holding (ANG 2.0 million), Aqualectra Production (ANG 2.0 million) and Aqualectra
Distribution (ANG 16.7 million). The approach to provide for receivables in Aqualectra
Distribution was changed significantly during 2014. Given a sharpened collection procedure, it
became evident that uncollected aged balances are to be scrutinized and monitored closely,
which resulted in this changed provisioning approach.
• Interest expense:The decrease in interest expense of 23% or ANG 6.0 million is primarily due to the conversion in
October 2013 of the payable to Curoil into a 3 year loan at a much lower interest rate (6% vs 18%).
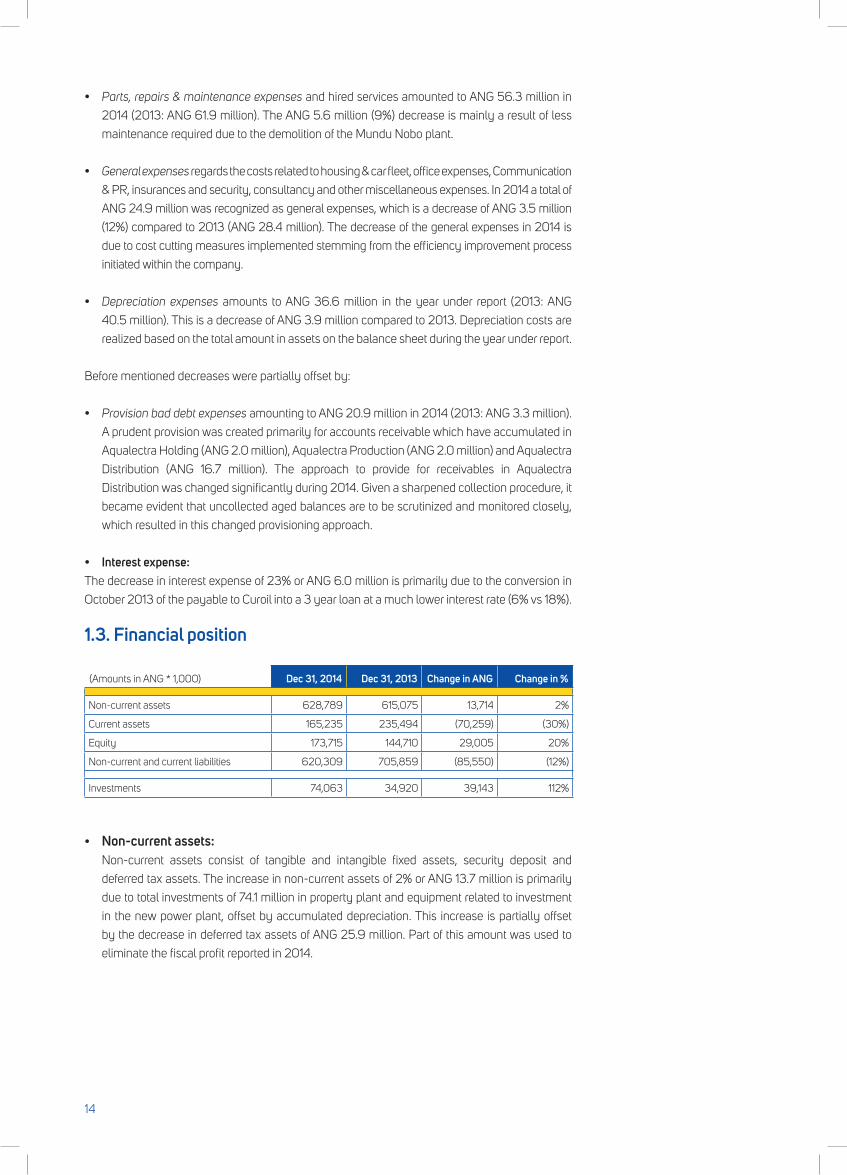
1.3. Financial position
(Amounts in ANG * 1,000) Dec 31, 2014 Dec 31, 2013 Change in ANG Change in %
Non-current assets 628,789 615,075 13,714 2%
Current assets 165,235 235,494 (70,259) (30%)
Equity 173,715 144,710 29,005 20%
Non-current and current liabilities 620,309 705,859 (85,550) (12%)
Investments 74,063 34,920 39,143 112%
• Non-current assets: Non-current assets consist of tangible and intangible fixed assets, security deposit and
deferred tax assets. The increase in non-current assets of 2% or ANG 13.7 million is primarily
due to total investments of 74.1 million in property plant and equipment related to investment
in the new power plant, offset by accumulated depreciation. This increase is partially offset
by the decrease in deferred tax assets of ANG 25.9 million. Part of this amount was used to
eliminate the fiscal profit reported in 2014.
14
• Current assets: Current assets consists of inventories, trade accounts receivables, other receivables and cash
& cash equivalents. The decrease in current assets of ANG 70.3 million or 30% is due to the
receipt of a receivable of ANG 24.0 million from the Government of Country Curaçao for shares
issued in 2013 but not paid up as of year-end, a decrease in household trade receivables of
ANG 27 million and a decrease of ANG 7.2 million in cash and cash equivalents. The decrease
in household trade receivable of ANG 25 million is due to the more stringent collection policy
applied throughout the year. The average receivable days outstanding has been decreased
considerably as a result.
• Equity: Equity increased by ANG 29.0 million as result of the reported profit for the year of ANG 51.4
million, partially offset by other comprehensive income.
• Non-current and current liabilities: The decrease in non-current and current liabilities of 12% or ANG 85.6 million is primarily due
to a decrease in the provisions for employee benefits of ANG 49.8 million. There was also an
ANG 12.2 million decrease in the payable to Curoil as a result of the payment of the past due
balances and a decrease of ANG 17.0 million in long-term loans as a result of repayments in
accordance with the loan agreements.
• Investments: A total amount of ANG 74.1 million has been invested in 2014 of which ANG 53.7 million by
Aqualectra Production and ANG 20.4 million by Aqualectra Distribution. The invested amounts
are mainly related to the following projects:
Aqualectra Production
• New power plant - 35 MW DPS Dokweg II: Construction of the new power plant began in
2013. The startup of the power plant took place in December 2014 and was commissioned in
the first quarter of 2015.
Aqualectra Distribution
• Electricity and water metering: Consists of projects related to direct client connections, all
activities related to network extensions, upgrades and new installations as well as projects
related to meter substitution due to their respective lifecycle.
• New 66 kV power substation Dokweg: This project was required in order to be able to transport
the generated power of the new Dokweg plant into the grid and the future extensions of grid on
the 66 kV level.
• Water transportation line grid Sta. Barbara: Project to handle the water production expansion
of RO Fuik to be transported to the Tra’i Seru Reservoir.
• Execution of various special projects electricity and water: Verkavelingsplan Sapat, Sambil
Shopping Mall and transformer box FEPCO De Savaan.
15
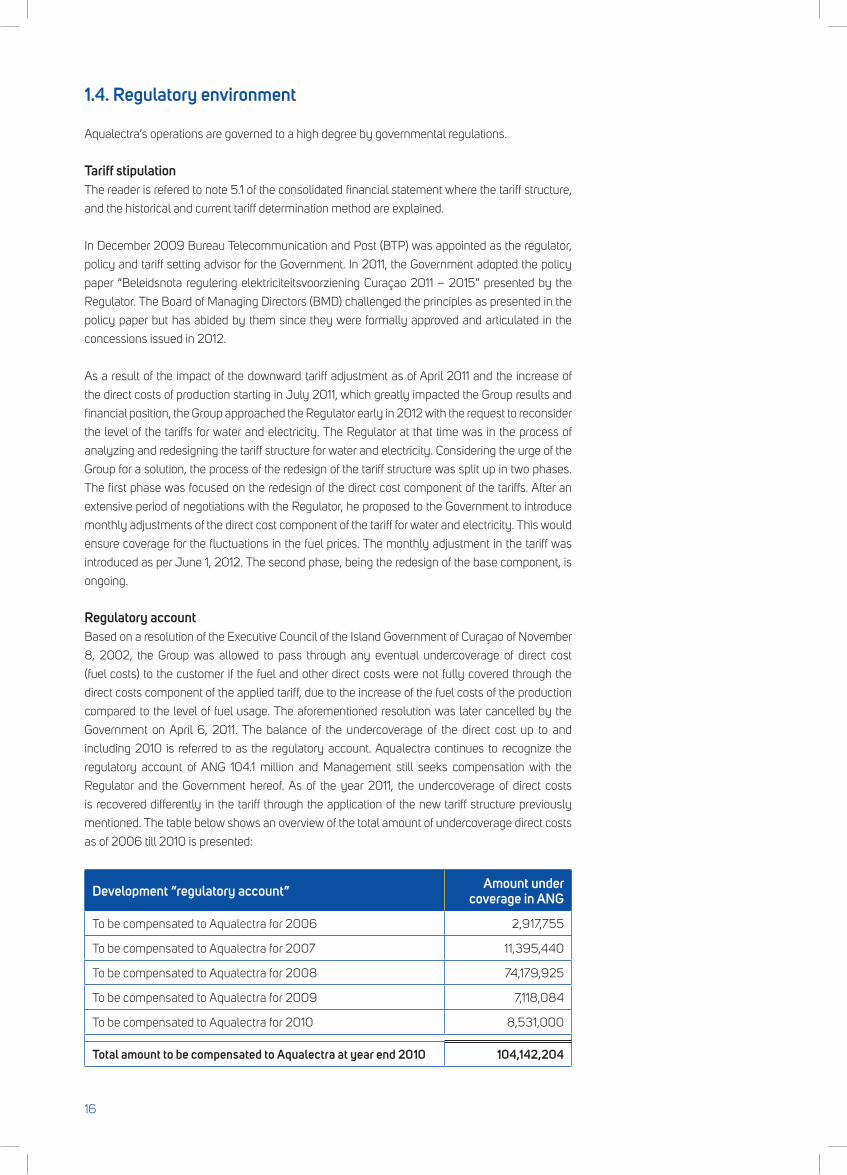
Regulatory accountBased on a resolution of the Executive Council of the Island Government of Curaçao of November
8, 2002, the Group was allowed to pass through any eventual undercoverage of direct cost
(fuel costs) to the customer if the fuel and other direct costs were not fully covered through the
direct costs component of the applied tariff, due to the increase of the fuel costs of the production
compared to the level of fuel usage. The aforementioned resolution was later cancelled by the
Government on April 6, 2011. The balance of the undercoverage of the direct cost up to and
including 2010 is referred to as the regulatory account. Aqualectra continues to recognize the
regulatory account of ANG 104.1 million and Management still seeks compensation with the
Regulator and the Government hereof. As of the year 2011, the undercoverage of direct costs
is recovered differently in the tariff through the application of the new tariff structure previously
mentioned. The table below shows an overview of the total amount of undercoverage direct costs
as of 2006 till 2010 is presented:
Development “regulatory account” Amount under coverage in ANG
To be compensated to Aqualectra for 2006 2,917,755
To be compensated to Aqualectra for 2007 11,395,440
To be compensated to Aqualectra for 2008 74,179,925
To be compensated to Aqualectra for 2009 7,118,084
To be compensated to Aqualectra for 2010 8,531,000
Total amount to be compensated to Aqualectra at year end 2010 104,142,204
1.4. Regulatory environment
Aqualectra’s operations are governed to a high degree by governmental regulations.
Tariff stipulationThe reader is refered to note 5.1 of the consolidated financial statement where the tariff structure,
and the historical and current tariff determination method are explained.
In December 2009 Bureau Telecommunication and Post (BTP) was appointed as the regulator,
policy and tariff setting advisor for the Government. In 2011, the Government adopted the policy
paper “Beleidsnota regulering elektriciteitsvoorziening Curaçao 2011 – 2015” presented by the
Regulator. The Board of Managing Directors (BMD) challenged the principles as presented in the
policy paper but has abided by them since they were formally approved and articulated in the
concessions issued in 2012.
As a result of the impact of the downward tariff adjustment as of April 2011 and the increase of
the direct costs of production starting in July 2011, which greatly impacted the Group results and
financial position, the Group approached the Regulator early in 2012 with the request to reconsider
the level of the tariffs for water and electricity. The Regulator at that time was in the process of
analyzing and redesigning the tariff structure for water and electricity. Considering the urge of the
Group for a solution, the process of the redesign of the tariff structure was split up in two phases.
The first phase was focused on the redesign of the direct cost component of the tariffs. After an
extensive period of negotiations with the Regulator, he proposed to the Government to introduce
monthly adjustments of the direct cost component of the tariff for water and electricity. This would
ensure coverage for the fluctuations in the fuel prices. The monthly adjustment in the tariff was
introduced as per June 1, 2012. The second phase, being the redesign of the base component, is
ongoing.
16
ConcessionsIn 2011 the process for preparation and adoption of new concessions for electricity production and
distribution started and were finalized in 2012 with the adoption of an electricity production and
an electricity distribution concession as per July 30, 2012. The concessions were granted for a
period of 20 years with an extension option of 5 years. Management identified various compliance
issues with the issued concessions and requested the Regulator for consultation on these matters.
An amended concession for the production of electricity was issued by the Government on
June 19, 2014 and formalized on November 6, 2014. This new concession for the production of
electricity is granted for 30 years and substitutes the electricity production concession issued in
2012.
1.5. Corporate Governance
In accordance with the “Stock Register” of IUH N.V., the following information about the ownership
of the Company can be disclosed:
Common Shareholder
• AsofJune1,1998atotalnumberof470issuedcommonshares(nr.1tonr.470)hasbeenpaid
for by the “Eilandgebied Curaçao”. The total amount paid regards ANG 525 million.
• As of September 6, 2001 the total number of 470 shares has been transferred by the
Government “Eilandgebied Curaçao” to Stichting Implementatie Privatisering (STIP). STIP
became the legal owner while the Government kept the economic ownership.
• AsofDecember14,2010thesharesweretransferredtotheGovernmentofCuraçao(“Land
Curaçao”).
• AsofJanuary31,2013,anadditional58commonshareswereissued(nr.471tonr.528)tothe
Government of Curaçao (“Land Curaçao”).
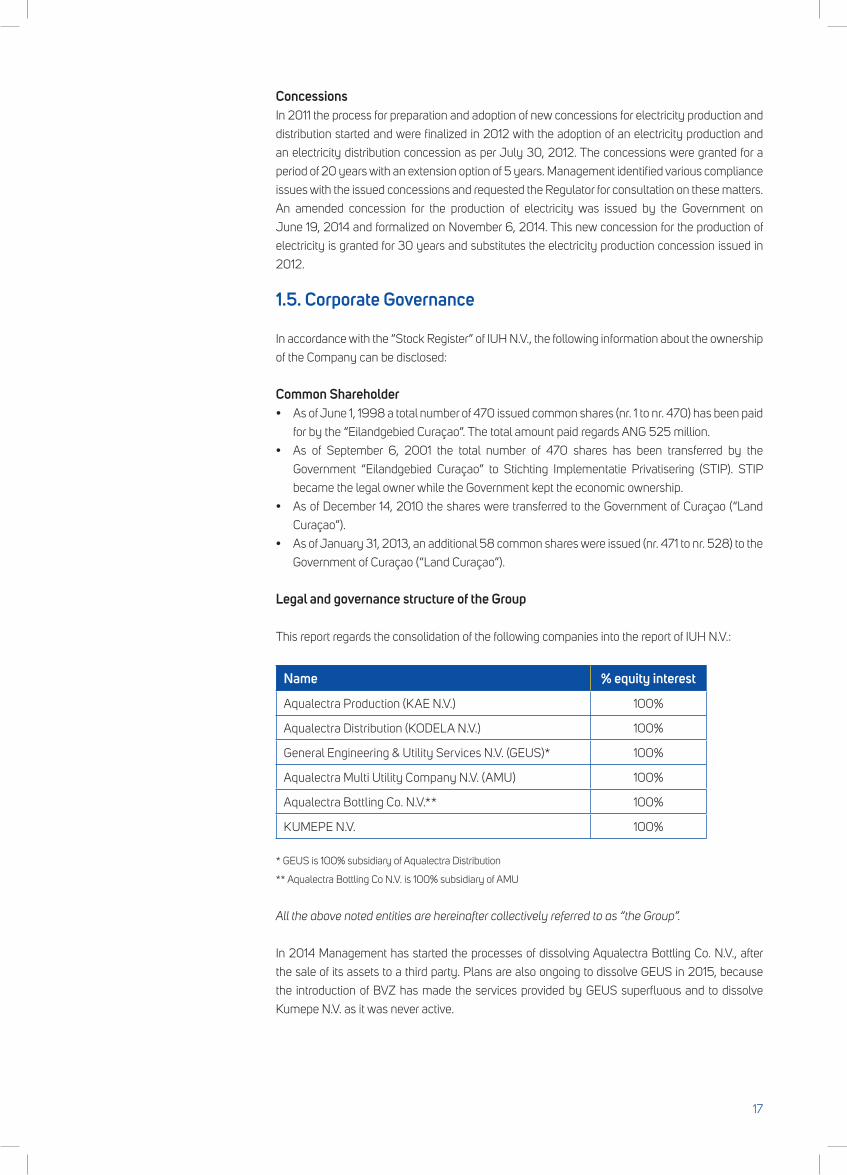
Legal and governance structure of the Group
This report regards the consolidation of the following companies into the report of IUH N.V.:
Name % equity interest
Aqualectra Production (KAE N.V.) 100%
Aqualectra Distribution (KODELA N.V.) 100%
General Engineering & Utility Services N.V. (GEUS)* 100%
Aqualectra Multi Utility Company N.V. (AMU) 100%
Aqualectra Bottling Co. N.V.** 100%
KUMEPE N.V. 100%
* GEUS is 100% subsidiary of Aqualectra Distribution
** Aqualectra Bottling Co N.V. is 100% subsidiary of AMU
All the above noted entities are hereinafter collectively referred to as “the Group”.
In 2014 Management has started the processes of dissolving Aqualectra Bottling Co. N.V., after
the sale of its assets to a third party. Plans are also ongoing to dissolve GEUS in 2015, because
the introduction of BVZ has made the services provided by GEUS superfluous and to dissolve
Kumepe N.V. as it was never active.
17
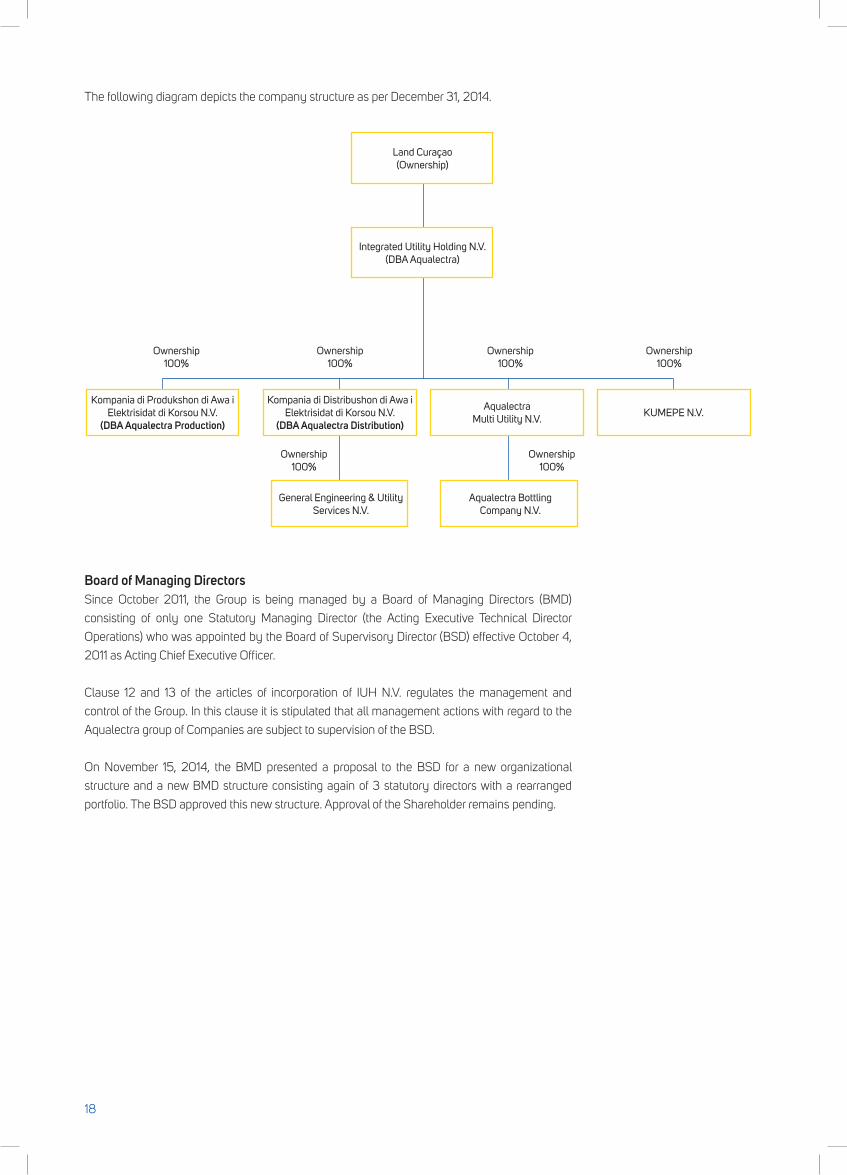
The following diagram depicts the company structure as per December 31, 2014.
Board of Managing DirectorsSince October 2011, the Group is being managed by a Board of Managing Directors (BMD)
consisting of only one Statutory Managing Director (the Acting Executive Technical Director
Operations) who was appointed by the Board of Supervisory Director (BSD) effective October 4,
2011 as Acting Chief Executive Officer.
Clause 12 and 13 of the articles of incorporation of IUH N.V. regulates the management and
control of the Group. In this clause it is stipulated that all management actions with regard to the
Aqualectra group of Companies are subject to supervision of the BSD.
On November 15, 2014, the BMD presented a proposal to the BSD for a new organizational
structure and a new BMD structure consisting again of 3 statutory directors with a rearranged
portfolio. The BSD approved this new structure. Approval of the Shareholder remains pending.
Land Curaçao (Ownership)
Integrated Utility Holding N.V. (DBA Aqualectra)
Kompania di Produkshon di Awa i Elektrisidat di Korsou N.V.
(DBA Aqualectra Production)
Kompania di Distribushon di Awa i Elektrisidat di Korsou N.V.
(DBA Aqualectra Distribution)
General Engineering & Utility Services N.V.
Aqualectra Bottling Company N.V.
Aqualectra Multi Utility N.V.
KUMEPE N.V.
Ownership 100%
Ownership 100%
Ownership 100%
Ownership 100%
Ownership 100%
Ownership 100%
18
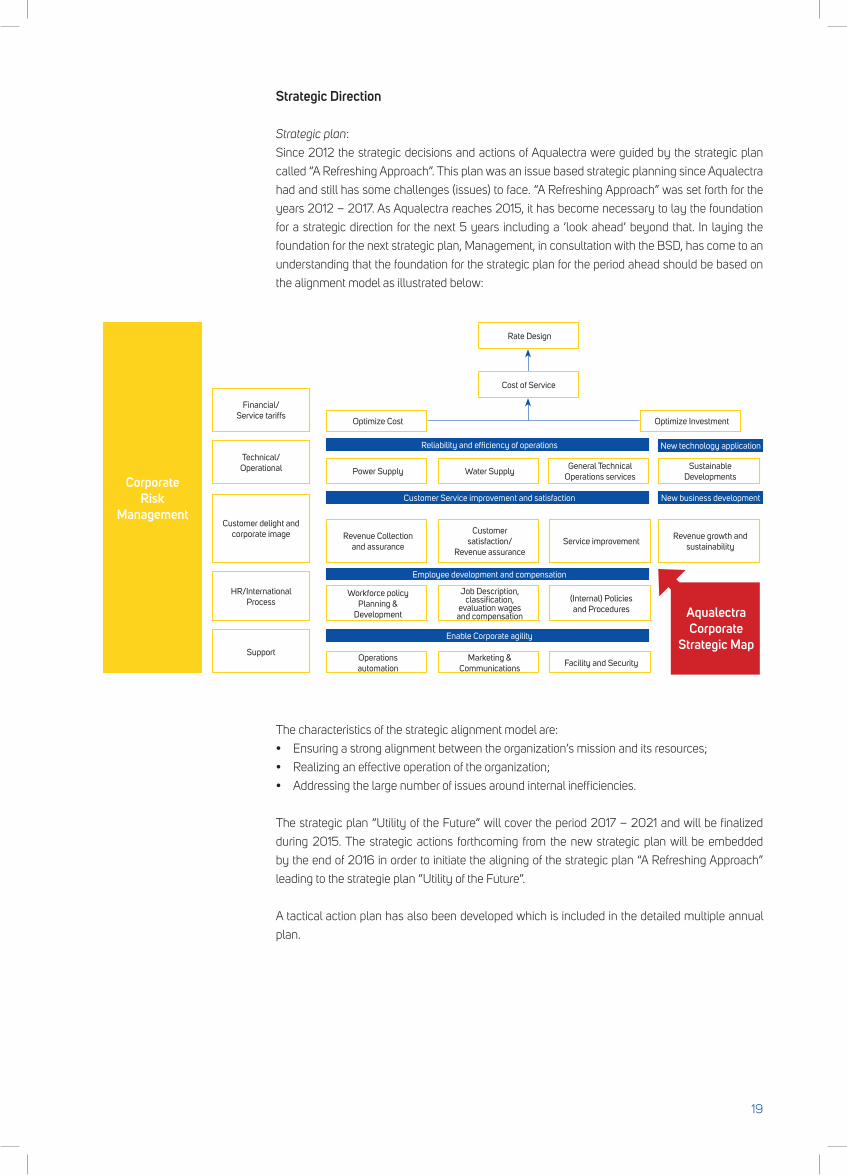
Strategic Direction
Strategic plan:
Since 2012 the strategic decisions and actions of Aqualectra were guided by the strategic plan
called “A Refreshing Approach”. This plan was an issue based strategic planning since Aqualectra
had and still has some challenges (issues) to face. “A Refreshing Approach” was set forth for the
years 2012 – 2017. As Aqualectra reaches 2015, it has become necessary to lay the foundation
for a strategic direction for the next 5 years including a ‘look ahead’ beyond that. In laying the
foundation for the next strategic plan, Management, in consultation with the BSD, has come to an
understanding that the foundation for the strategic plan for the period ahead should be based on
the alignment model as illustrated below:
The characteristics of the strategic alignment model are:
• Ensuringastrongalignmentbetweentheorganization’smissionanditsresources;
• Realizinganeffectiveoperationoftheorganization;
• Addressingthelargenumberofissuesaroundinternalinefficiencies.
The strategic plan “Utility of the Future” will cover the period 2017 – 2021 and will be finalized
during 2015. The strategic actions forthcoming from the new strategic plan will be embedded
by the end of 2016 in order to initiate the aligning of the strategic plan “A Refreshing Approach”
leading to the strategie plan “Utility of the Future”.
A tactical action plan has also been developed which is included in the detailed multiple annual
plan.
CorporateRisk
Management
Financial/ Service tariffs
Technical/ Operational
Customer delight and corporate image
HR/International Process
Support
Rate Design
Optimize Cost Optimize Investment
Reliability and efficiency of operations
Customer Service improvement and satisfaction New business development
New technology application
Employee development and compensation
Enable Corporate agility
Power Supply Water SupplyGeneral Technical
Operations servicesSustainable
Developments
Revenue Collection and assurance
Customer satisfaction/
Revenue assuranceService improvement
Revenue growth and sustainability
Workforce policy Planning &
Development
Job Description, classification,
evaluation wages and compensation
(Internal) Policies and Procedures
Operations automation
Marketing & Communications
Facility and Security
Cost of Service
AqualectraCorporate
Strategic Map
19
Business planning and consolidated budget:
Every year a business plan and a consolidated budget, including a 5 year forward looking
projection, are drafted and submitted for approval to the BSD. This business plan includes corporate
Key Performance Indicators (KPI’s) for the year ahead and information about Management’s
objectives and intentions for the year under report. These are identified as the corporate enabling
areas. These corporate enabling areas are (i) Strategy & Policy, (ii) People, (iii) Leadership, (iv)
Partnerships & Resources and (v) Processes. Furthermore 4 result areas are identified being (a)
people results, (b) customer results, (c) society results and (d) key performance (operational and
financial) results. The business plan presents the various KPI’s per result area, which results are to
be considered Management’s score card for the year under report.
This planning process is aimed at the defined corporate objectives and is being executed,
considering the various conditions as well as the substantial facts and risks involved. Corporate
Governance and Public Governance principles are also important and relevant in this regard.
Aqualectra recognizes and respects the role that Governments, its shareholder and itself as a
public entity have to play in the deployment of policy within the Group. Management considers it
as well as its duty to sustain the Government, its Shareholder and the BSD as much as possible
in this important task by complying completely and proactively through our planning & control
cycle with all regulations, laws and internal procedures. Key words for Aqualectra in this regard
are: transparency, disclosure and compliance.
Reporting:
Periodic reporting (monthly or quarterly and annually) of each policy area is applied, in which
the realization of the KPI’s are set off against the planned or projected KPI’s per policy area.
Management also reports periodically to the BSD about the realization vis á vis target KPI’s.
Through a process of monitoring, reporting and compliance, the adherence to good governance
within Aqualectra is assessed.
Throughout the year 2014 Aqualectra has gone through the following process of monitoring,
reporting and compliance:
• OneauditofthefinancialsoftheGroupconductedbytheexternalauditorEYDutchCaribbean
(EY);
• TwoauditsconductedbyLloydsRegisterQualityAssurancerelatedtotherecertificationofthe
ISO 14001: 2004 ‘environmental management standards’ and the compliance with the ISO
9001:2008‘qualitymanagementstandards’;
• AnauditconductedbyDutchAccreditationCouncilRvArelated to thecompliancewith the
NEN-EN-ISO/IEC17025:2005qualitystandardslaboratories;
• RegularinternalauditsperformedbytheBusinessRiskControl&InternalAuditdepartment;
We are pleased to inform that all of the above-mentioned reviews and audits have been undergone
with satisfactory results.
20
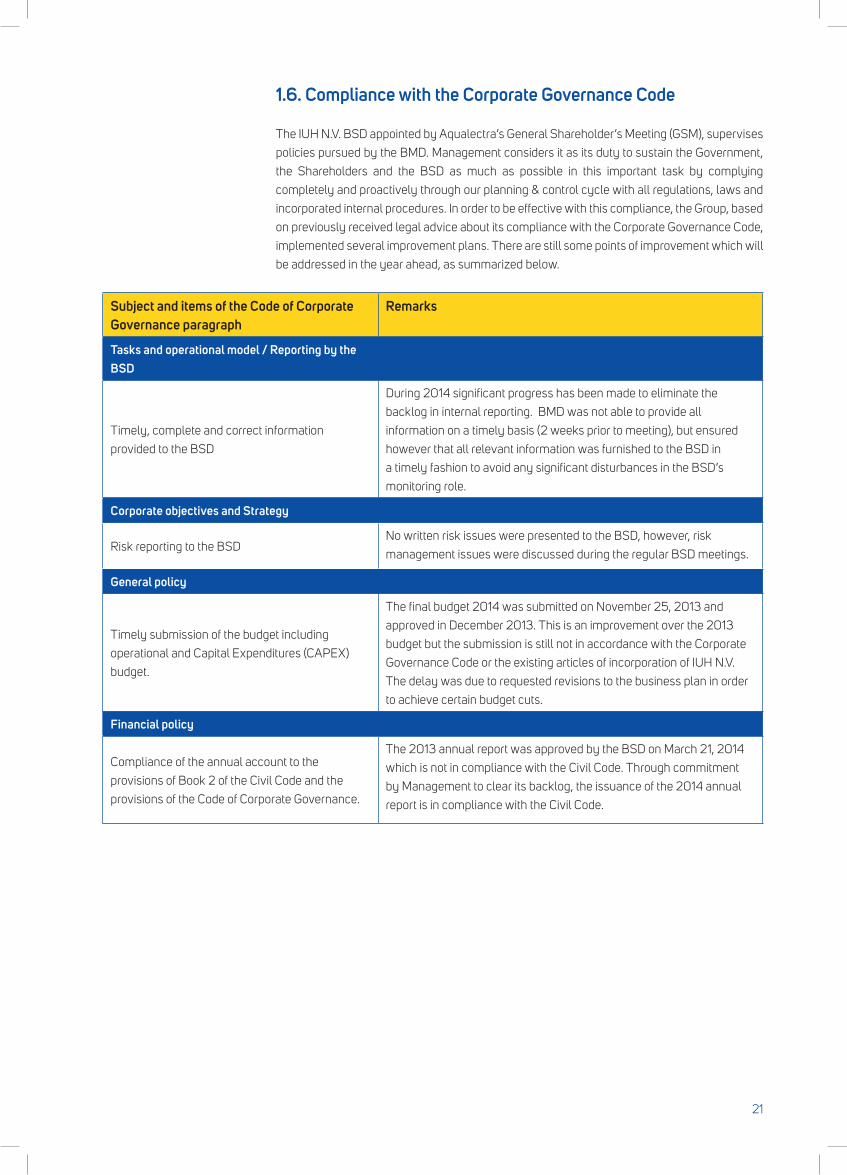
1.6. Compliance with the Corporate Governance Code
The IUH N.V. BSD appointed by Aqualectra’s General Shareholder’s Meeting (GSM), supervises
policies pursued by the BMD. Management considers it as its duty to sustain the Government,
the Shareholders and the BSD as much as possible in this important task by complying
completely and proactively through our planning & control cycle with all regulations, laws and
incorporated internal procedures. In order to be effective with this compliance, the Group, based
on previously received legal advice about its compliance with the Corporate Governance Code,
implemented several improvement plans. There are still some points of improvement which will
be addressed in the year ahead, as summarized below.
Subject and items of the Code of Corporate Governance paragraph
Remarks
Tasks and operational model / Reporting by the BSD
Timely, complete and correct information
provided to the BSD
During 2014 significant progress has been made to eliminate the
backlog in internal reporting. BMD was not able to provide all
information on a timely basis (2 weeks prior to meeting), but ensured
however that all relevant information was furnished to the BSD in
a timely fashion to avoid any significant disturbances in the BSD’s
monitoring role.
Corporate objectives and Strategy
Risk reporting to the BSD No written risk issues were presented to the BSD, however, risk
management issues were discussed during the regular BSD meetings.
General policy
Timely submission of the budget including
operational and Capital Expenditures (CAPEX)
budget.
The final budget 2014 was submitted on November 25, 2013 and
approved in December 2013. This is an improvement over the 2013
budget but the submission is still not in accordance with the Corporate
Governance Code or the existing articles of incorporation of IUH N.V.
The delay was due to requested revisions to the business plan in order
to achieve certain budget cuts.
Financial policy
Compliance of the annual account to the
provisions of Book 2 of the Civil Code and the
provisions of the Code of Corporate Governance.
The 2013 annual report was approved by the BSD on March 21, 2014
which is not in compliance with the Civil Code. Through commitment
by Management to clear its backlog, the issuance of the 2014 annual
report is in compliance with the Civil Code.
21
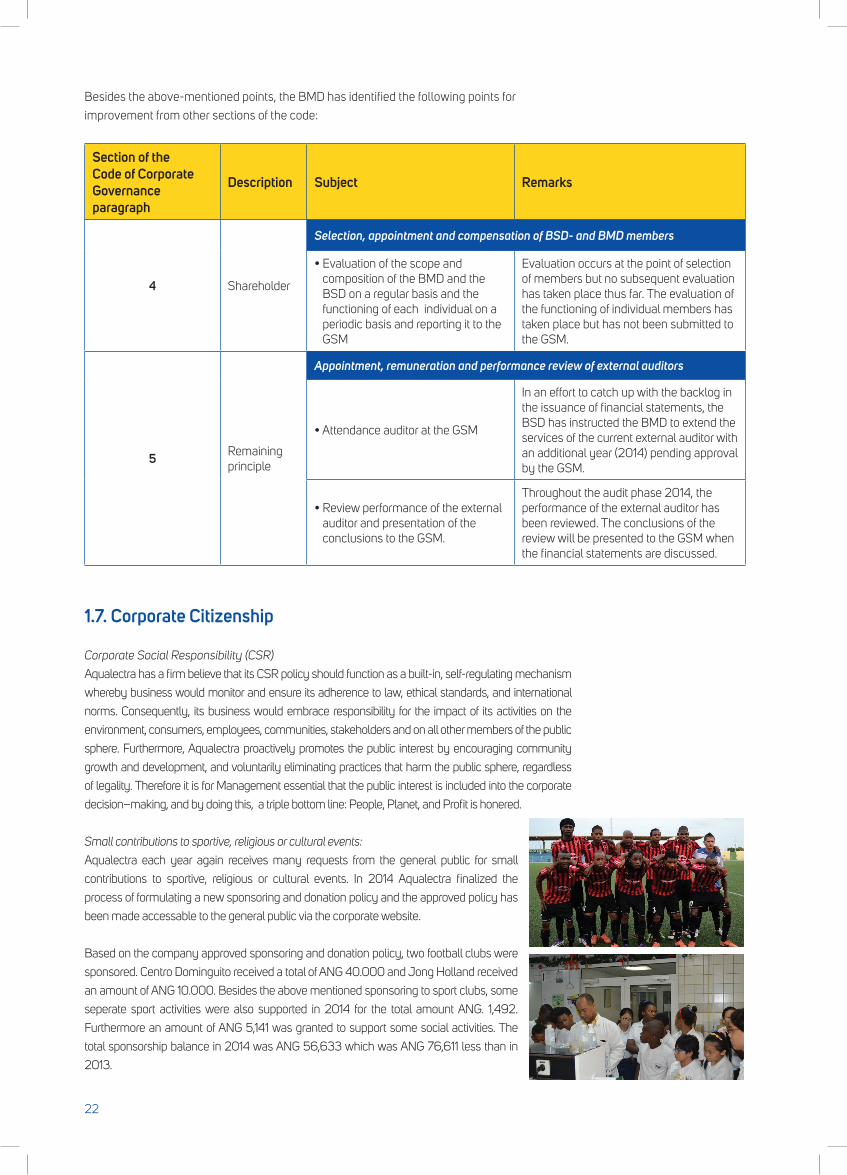
Besides the above-mentioned points, the BMD has identified the following points for
improvement from other sections of the code:
Section of the Code of Corporate Governance paragraph
Description Subject Remarks
4 Shareholder
Selection, appointment and compensation of BSD- and BMD members
•Evaluationofthescopeandcomposition of the BMD and the BSD on a regular basis and the functioning of each individual on a periodic basis and reporting it to the GSM
Evaluation occurs at the point of selection of members but no subsequent evaluation has taken place thus far. The evaluation of the functioning of individual members has taken place but has not been submitted to the GSM.
5 Remaining principle
Appointment, remuneration and performance review of external auditors
•AttendanceauditorattheGSM
In an effort to catch up with the backlog in the issuance of financial statements, the BSD has instructed the BMD to extend the services of the current external auditor with an additional year (2014) pending approval by the GSM.
•Reviewperformanceoftheexternalauditor and presentation of the conclusions to the GSM.
Throughout the audit phase 2014, the performance of the external auditor has been reviewed. The conclusions of the review will be presented to the GSM when the financial statements are discussed.
1.7. Corporate Citizenship
Corporate Social Responsibility (CSR)
Aqualectra has a firm believe that its CSR policy should function as a built-in, self-regulating mechanism
whereby business would monitor and ensure its adherence to law, ethical standards, and international
norms. Consequently, its business would embrace responsibility for the impact of its activities on the
environment, consumers, employees, communities, stakeholders and on all other members of the public
sphere. Furthermore, Aqualectra proactively promotes the public interest by encouraging community
growth and development, and voluntarily eliminating practices that harm the public sphere, regardless
of legality. Therefore it is for Management essential that the public interest is included into the corporate
decision–making, and by doing this, a triple bottom line: People, Planet, and Profit is honered.
Small contributions to sportive, religious or cultural events:
Aqualectra each year again receives many requests from the general public for small
contributions to sportive, religious or cultural events. In 2014 Aqualectra finalized the
process of formulating a new sponsoring and donation policy and the approved policy has
been made accessable to the general public via the corporate website.
Based on the company approved sponsoring and donation policy, two football clubs were
sponsored. Centro Dominguito received a total of ANG 40.000 and Jong Holland received
an amount of ANG 10.000. Besides the above mentioned sponsoring to sport clubs, some
seperate sport activities were also supported in 2014 for the total amount ANG. 1,492.
Furthermore an amount of ANG 5,141 was granted to support some social activities. The
total sponsorship balance in 2014 was ANG 56,633 which was ANG 76,611 less than in
2013.
22
Excursions to the production plants:
It is Aqualectra’s believe that every citizen of our island must be made conscious about the fact that
water and electricity are very scarce on the island and that it takes a lot of effort and energy to make this
water and electricity available for the community. The reason for promoting this consciousness is driven
by the fact that it is in the consumers’ own economic interest to be efficient with the use of these utilities
and on the other hand it is from an environmental standpoint an interest for the whole community to be
efficient with these scarce resources. During the year under report, several excursions to the Group’s
production plants and technical facilities have been organized by our Communication department for
schools and interest groups (including tourists and universities), during which excursions the production
process of water and generation processes of electricity have been explained.
ISO 14001: 2004
The Group is conscious of the impact that its operations can have on the overall environment
and the community it serves. Aqualectra continues to make every effort to minimize this possible
negative impact effectively. By obtaining the ISO 14001 in 2005, the Group explicitly specifies in
its business processes the actual requirements for an environmental management system and
adheres to those environmental aspects which the organization has control over and which it can
be expected to have an influence on.
With the continuation of the ISO 14001: 2004 standard in 2014, the Group proactively shows the
community it serves, that it wishes to:
• implement,maintainandimproveanenvironmentalmanagementsystem;
• assureitselfofitscompliancewithitsownstatedenvironmentalpolicy;
• demonstratecompliance;
• ensurecompliancewithenvironmentallawsandregulations;
• seek certification of its environmental management system by an external third party
organization;
• makeaself-determinationofcompliance.
1.8. Future prospects
Fuel price volatility:
In the past, Aqualectra identified fuel price volatility as a major risk. Aqualectra still recognizes fuel price
to be of risk even though this risk has been mitigated by the new tariff setting structure introduced per
June 2012. With the application of a fuel clause in the tariffs, a full fuel pass through is in fact applicable.
Nevertheless, monitoring the fuel price volatility will remain of high importance for Aqualectra.
Fuel diversity:
Aqualectra is a firm believer of the value of fuel diversity in order to help stabilize fuel costs as
well as to maintain and improve overall system reliability. With the renewed wind farms at Tera
CòráandPlayaCanoain2009,18%ofthetotalenergydemandofCuraçaoisprovidedthrough
alternative (wind) energy, with a total capacity of 30 MW.
Corporate objectives:
As stated before, good governance in corporate settings includes transparency, accountability,
compliance and adherence to legal principles and procedures. Ultimately the citizen will judge
the Group by its performance in terms of (i) quality, (ii) reliability, (iii) least environmental burden
and (iv) least applicable costs. In order to be transparent and effective, the Group has recognized
the value of these 4 objectives and has also drafted a roadmap based on which these corporate
objectives must be met (mission).
23
Infrastructure:
Aqualectra’s investment actions are aimed at replacing the existing production units for water and
electricity which are based on steam technology, as well as an expansion of the total capacity of
the production units and grid in order for the Group to be able to cope with future demand for water
and electricity. This investment plan is phased over the period 2010 till 2017. Within this time
frame the following needed investments have been identified:
• Expansionandrenewingofthetotalcapacityofelectricitygeneratingunitsin2015.In2015,
the total demand for electricity is expected to be between 115 MW and 140 MW. Significant
investments have been made in 2013 as discussed in note 1.3 and have continued throughout
2014.
• RenewingandexpandingthetotalcapacityofSeaWaterReverseOsmosisproductionupto
54,000 M3 per day in 2017. In 2017, the total demand for water is expected to be 45,000 M3
per day. Significant investments are required in 2015 and 2016.
• Expansionofthecapacitytogeneratedenergybythewindfarmswithanadditional15MW
through an addition of the current Power Purchase Agreement (PPA).
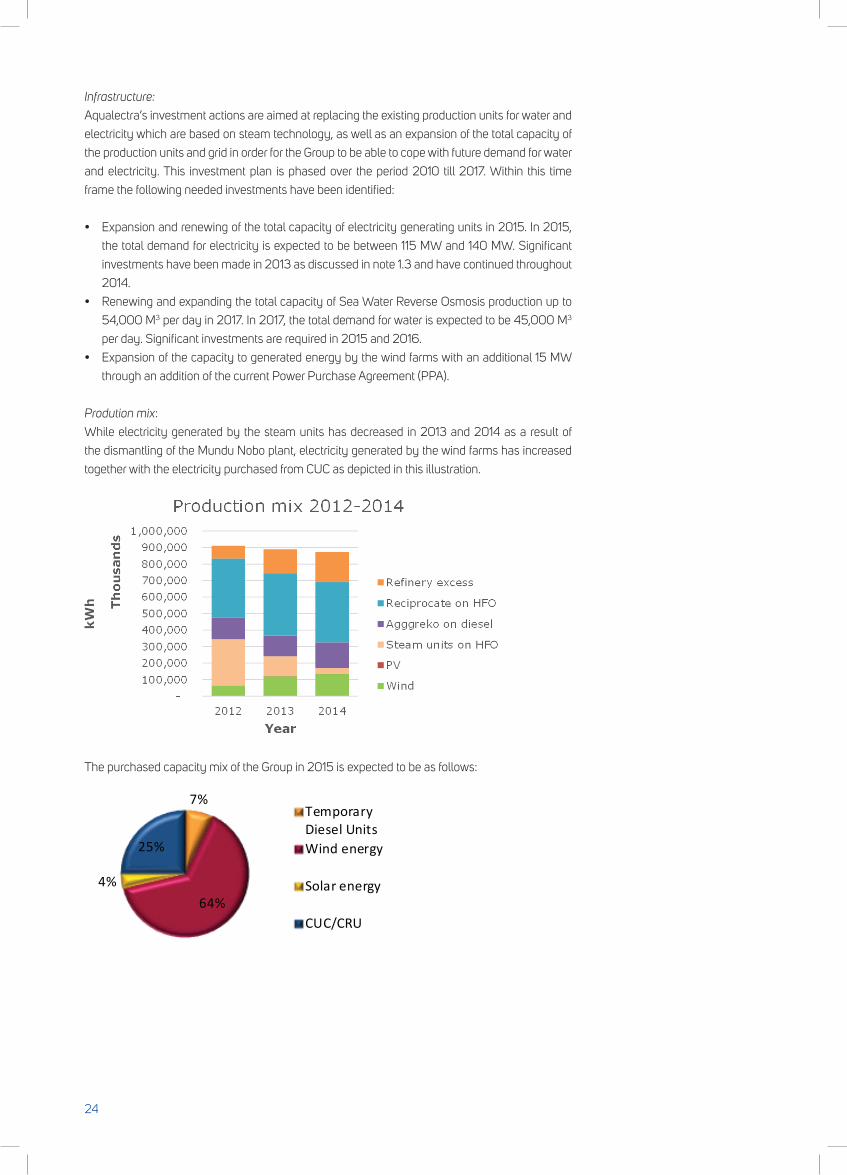
Prodution mix:
While electricity generated by the steam units has decreased in 2013 and 2014 as a result of
the dismantling of the Mundu Nobo plant, electricity generated by the wind farms has increased
together with the electricity purchased from CUC as depicted in this illustration.
w
The purchased capacity mix of the Group in 2015 is expected to be as follows:
7%
64%4%
25%
TemporaryDiesel UnitsWind energy
Solar energy
CUC/CRU
24
Systems:
It is important for the Group to realize necessary improvements and upgrading of the applied
systems. The primary systems that will be improved and upgraded in the period 2014 through
2017 are:
• Supervisory Control & Data Acquisition (SCADA system) regarding the upgrading and
improvement of the Group’s dispatch and control centre.
• Automatic Meter Reading and Advanced Metering Infrastructure (AMR/AMI systems)
regarding the improvement of the metering of the water and the electricity flows in the
applicable distribution grids as well as at the customer premises.
• GeographicalInformationSystem(GISsystems)regardingtheimprovementandalignmentof
the technical drawings database of the distribution grid of water and electricity aligned with the
Customer Relation data base.
• Enterprise Resource Planning systems (ERP system) regarding a new system that will
increase efficiency, achieve synchronization of processes, streamlining of processes among
departments and optimization of the usage of information.
Organization, Personnel, Headquarters, Processes and Procedures:
The aforementioned road map will lead the Group to a situation in which the Mundu Nobo
production facility will be phased out in 2015. It must also be noted that between 2015 and 2020
approximately 173 employees will reach their retirement age if the age of 60 years continues to be
applied as the retirement age. This creates the opportunity to reduce personnel costs.
On November 15, 2014, the BMD presented a proposal to the BSD for a new organizational
structure and a new BMD structure consisting again of 3 directors with a rearranged portfolio.
Plans for a new building facility are being discussed to centralize all corporate operations. The
Group received in April 2015 an option on a land as part of the commitment of the government to
grant IUH a leasehold land of a size comparable to the land of the Scadta Peninsula (old Amstel
land at the Rijkseenheid Boulevard) that was designated for the construction of a new Operational
Center and Technical Services Facility for the Group prior to the termination of the related
agreements in 2011. Management intends to construct a new office at the chosen location as
part of the organizational restructyring. In this matter the assets at Pater Euwensweg and Rector
Zwijsenstraat will be vacated and put up for sale.
Actions for the integration of business processes and information/operation systems within the
Group, which has been an ongoing process, will also continue.
Financing:
In order to realize the above-mentioned corporate objectives, it will also be necessary to have the
financial resources in place. The determining factor within the scope of these corporate objectives
will be the least cost option criterion. Lower cost per unit can be realized, because of (i) relatively
less cost of fuel because of more wind and heavy fuel oil generation of electricity, (ii) relatively
less personnel cost, because of less personnel due to process automation and (iii) relatively less
maintenance cost, because of adherence to an acceptable and rational overcapacity, considering
the development of the demand. The aforementioned efficiency gains can be offset against the
expected additional capital charges, which are expected to be higher than the current capital
charges, this because of the amount of capital expenditure needed for the refinancing of Aqualectra.
During 2014, various objectives were achieved despite the fact that the Group did not obtain the
financing it was seeking. Currently the Group is rethinking its financing strategy in order to ensure
that the strategic objectives and future plans are achieved while also applying the least cost option
criterion for financing charges.
25
Continuous improvement:
Furthermore, Aqualectra will continue its pursuit of operational excellence throughout its
organizational performance improvement programs within its business operations. The
optimization of the production and distribution processes will continue together with non-revenue
programs to lower the non-revenue for water and electricity as well as its policy aimed at cost
rationalization and efficiency improvement. Customer care will remain a focal point of policy and
the target is set to improve service and customer satisfaction.
Financial statements 2014:
The audit opinion of the 2014 financial statements has been qualified. The causes of the
qualification, which are consistent with the 2010 through 2013 financial statements, are as follow:
- CUC share transferManagement has been trying to solve this matter and has done its utmost to resolve this issue
with the parties involved but could not come to a satisfactory solution. Therefore, Management
has not been able to provide the external auditor with sufficient appropriate and corroborative
audit evidence regarding the valuation and recognition of this balance as per year-end 2010.
This matter still remains unresolved. All relevant information has been disclosed in note 5.5.17.6
“Contingent assets”.
- IUH Corporate Bonds
Management has been trying to solve this matter but could not come to a satisfactory solution.
Therefore this qualification remains standing in all subsequent financial statements. For further
information on this, Management refers the reader to note 5.8 “Subsequent events” of these
financial statements where further developments on the steps taken by Management are
disclosed.
Despite the qualifications noted above, which Management is still working on to resolve, the BMD
asserts to the accuracy and completeness of the figures as presented in the 2014 consolidated
financial statements of IUH N.V. and request the approval of the BSD and the Shareholder for
issuance of the financial statements.
Willemstad, May 28, 2015
On behalf of the Board of Managing Directors,
Mr. D.P. Jonis M.Sc. MBA
Acting Chief Executive Officer
26

2. report of the Board of supervisory directors
27
2.1. Legal structure of the Group
This annual report of Aqualectra, regards the
consolidated report of Management to the
Shareholder and other relevant stakeholders
about the performance of the Company over
the year 2014.
In accordance with the “Stock Register” of
IUH N.V., no changes were made to the legal
structure of the Company during 2014.
2.2. Corporate Governance
The BSD considers it as its duty to assist
the Government and the Shareholders as
much as possible with the supervision and
guidance of the Group as is prescribed for
a BSD in the several rules and regulations
regarding corporate governance.
This entails that the BSD must supervise the
execution of the general vision and mission,
adherence to all regulations, laws and the
embedding of incorporated and internal
procedures by the BMD. A tool that can help
with the monitoring of the goals and with the
important tasks of the BSD is the planning
& control cycle of the Group. Another tool
are the specific requests stipulated by the
Shareholders that have to be executed or
reported on.
Key decisions reached by the BSD with
respect to the BMD in 2014, are highlighted
below:
a) Management Directors structure
On November 15, 2014, the BMD presented a
proposal to the BSD for a new organizational
structure and a new BMD structure
consisting again of 3 Directors with a
rearranged portfolio. The BSD approved this
new structure. Approval of the Shareholder
remains pending.
b) Restructuring of the Corporate legal
structure:
In the BSD meeting of June 21, 2014,
Management presented various scenarios for
the legal integration of the entities Aqualectra
Production and Aqualectra Distribution.
This as per government resolution received
in 2003. This integration has been in
process since the government resolution
was adopted. The Group started with the
organizational integration under the project
“Next Step”. Now that this organizational
integration is completed Management has
initiated the legal integration. It is expected
that after this legal integration the final step
in the organizational restructuring will be
effectuated.
c) Corporate Governance Compliance audit:
In order to ensure the compliance with the
Corporate Governance Code, the BMD
and the BSD engaged Law office Van Eps
Kunneman & Van Doorne for a Corporate
Governance compliance audit in June 2014.
The purpose of this audit was to measure the
compliance level at the time of engagement
and prepare a roadmap for the Group to
increase the current compliance level to
the maximum compliance level possible by
2015.
d) Approval regulations BMD:
In July 2014 the BSD approved the
regulations for the BMD.
28
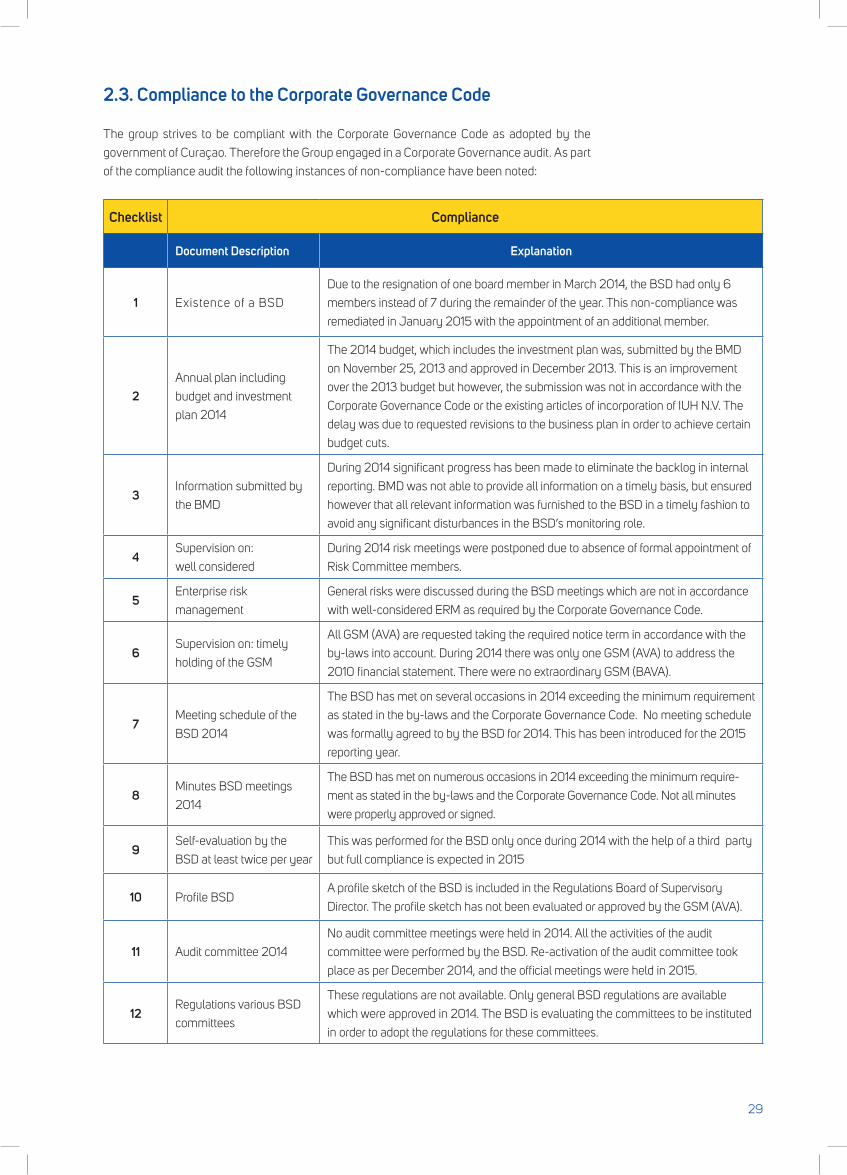
2.3. Compliance to the Corporate Governance Code
The group strives to be compliant with the Corporate Governance Code as adopted by the
government of Curaçao. Therefore the Group engaged in a Corporate Governance audit. As part
of the compliance audit the following instances of non-compliance have been noted:
Checklist Compliance
Document Description Explanation
1 Existence of a BSD
Due to the resignation of one board member in March 2014, the BSD had only 6
members instead of 7 during the remainder of the year. This non-compliance was
remediated in January 2015 with the appointment of an additional member.
2Annual plan including
budget and investment
plan 2014
The 2014 budget, which includes the investment plan was, submitted by the BMD
on November 25, 2013 and approved in December 2013. This is an improvement
over the 2013 budget but however, the submission was not in accordance with the
Corporate Governance Code or the existing articles of incorporation of IUH N.V. The
delay was due to requested revisions to the business plan in order to achieve certain
budget cuts.
3Information submitted by
the BMD
During 2014 significant progress has been made to eliminate the backlog in internal
reporting. BMD was not able to provide all information on a timely basis, but ensured
however that all relevant information was furnished to the BSD in a timely fashion to
avoid any significant disturbances in the BSD’s monitoring role.
4Supervision on:
well considered
During 2014 risk meetings were postponed due to absence of formal appointment of
Risk Committee members.
5Enterprise risk
management
General risks were discussed during the BSD meetings which are not in accordance
with well-considered ERM as required by the Corporate Governance Code.
6Supervision on: timely
holding of the GSM
All GSM (AVA) are requested taking the required notice term in accordance with the
by-laws into account. During 2014 there was only one GSM (AVA) to address the
2010 financial statement. There were no extraordinary GSM (BAVA).
7Meeting schedule of the
BSD 2014
The BSD has met on several occasions in 2014 exceeding the minimum requirement
as stated in the by-laws and the Corporate Governance Code. No meeting schedule
was formally agreed to by the BSD for 2014. This has been introduced for the 2015
reporting year.
8Minutes BSD meetings
2014
The BSD has met on numerous occasions in 2014 exceeding the minimum require-
ment as stated in the by-laws and the Corporate Governance Code. Not all minutes
were properly approved or signed.
9Self-evaluation by the
BSD at least twice per year
This was performed for the BSD only once during 2014 with the help of a third party
but full compliance is expected in 2015
10 Profile BSDA profile sketch of the BSD is included in the Regulations Board of Supervisory
Director. The profile sketch has not been evaluated or approved by the GSM (AVA).
11 Audit committee 2014
No audit committee meetings were held in 2014. All the activities of the audit
committee were performed by the BSD. Re-activation of the audit committee took
place as per December 2014, and the official meetings were held in 2015.
12Regulations various BSD
committees
These regulations are not available. Only general BSD regulations are available
which were approved in 2014. The BSD is evaluating the committees to be instituted
in order to adopt the regulations for these committees.
29
Checklist Compliance
Document Description Explanation
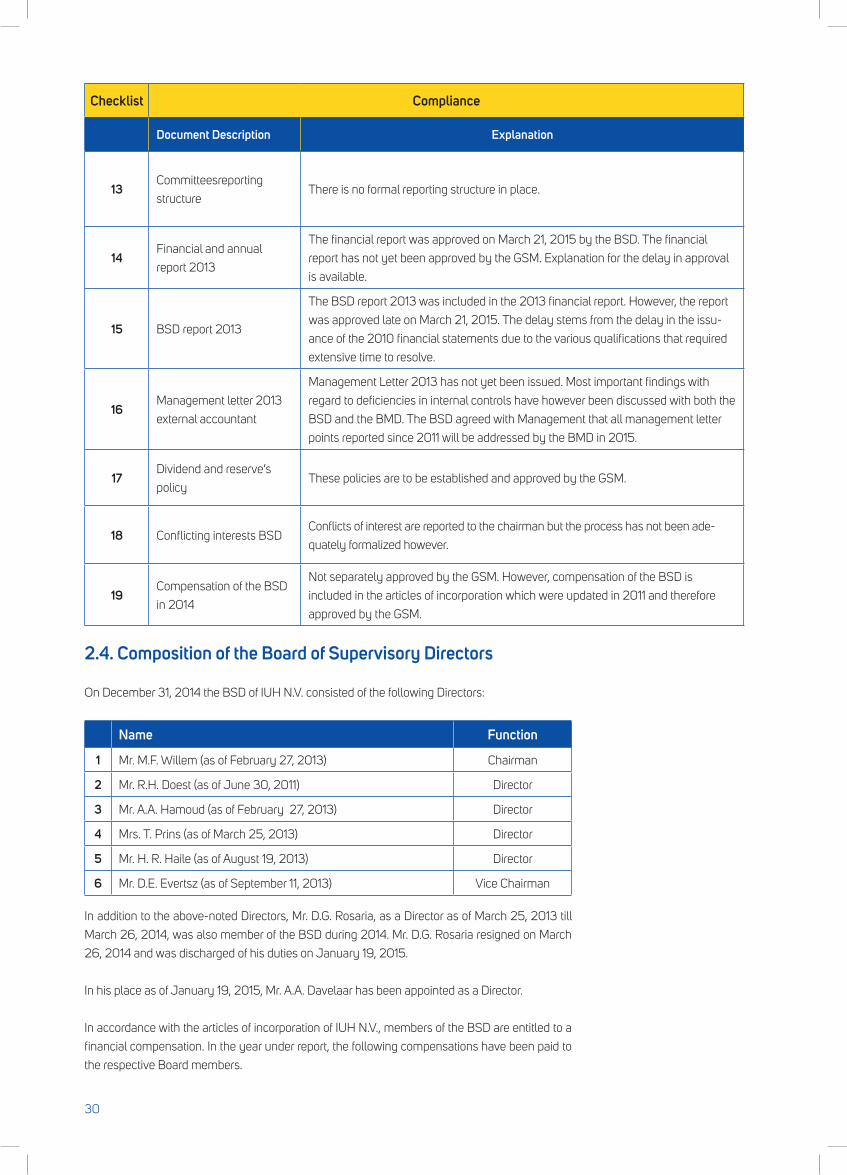
13Committeesreporting
structureThere is no formal reporting structure in place.
14Financial and annual
report 2013
The financial report was approved on March 21, 2015 by the BSD. The financial
report has not yet been approved by the GSM. Explanation for the delay in approval
is available.
15 BSD report 2013
The BSD report 2013 was included in the 2013 financial report. However, the report
was approved late on March 21, 2015. The delay stems from the delay in the issu-
ance of the 2010 financial statements due to the various qualifications that required
extensive time to resolve.
16Management letter 2013
external accountant
Management Letter 2013 has not yet been issued. Most important findings with
regard to deficiencies in internal controls have however been discussed with both the
BSD and the BMD. The BSD agreed with Management that all management letter
points reported since 2011 will be addressed by the BMD in 2015.
17Dividend and reserve’s
policyThese policies are to be established and approved by the GSM.
18 Conflicting interests BSDConflicts of interest are reported to the chairman but the process has not been ade-
quately formalized however.
19Compensation of the BSD
in 2014
Not separately approved by the GSM. However, compensation of the BSD is
included in the articles of incorporation which were updated in 2011 and therefore
approved by the GSM.
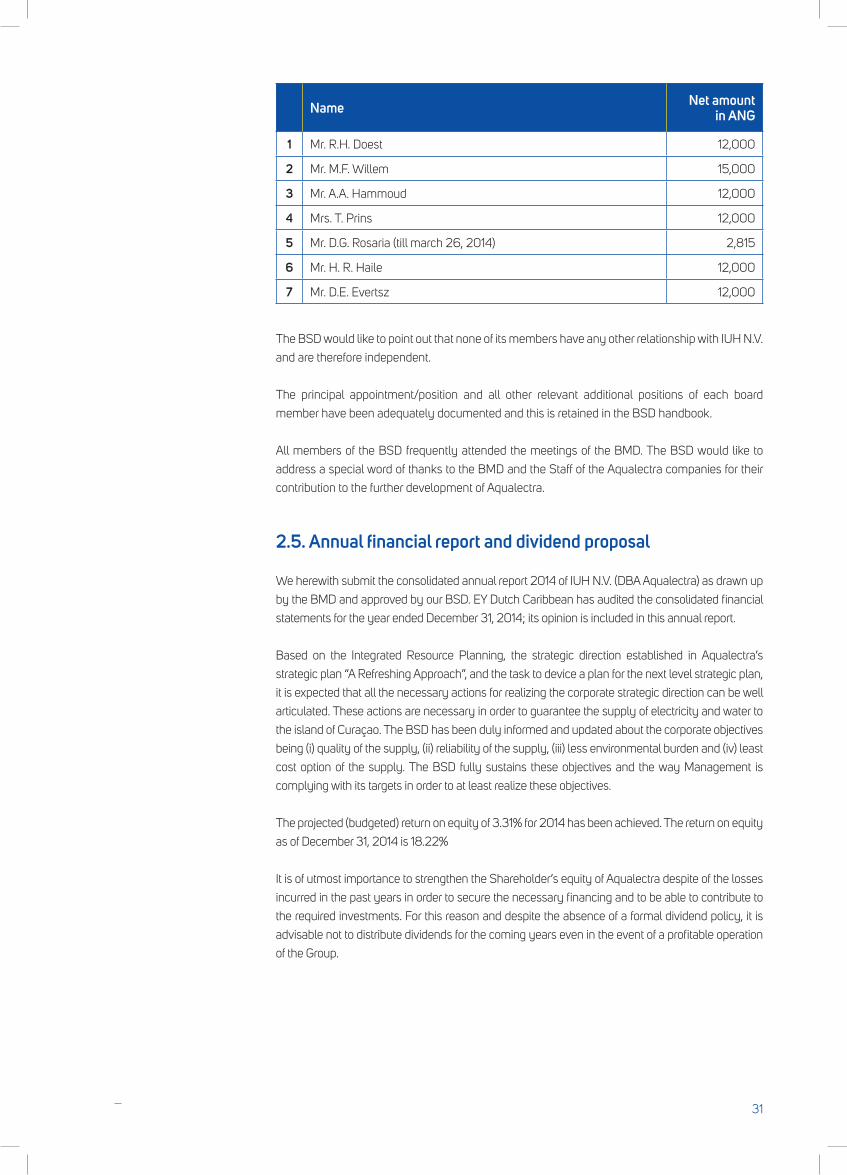
2.4. Composition of the Board of Supervisory Directors
On December 31, 2014 the BSD of IUH N.V. consisted of the following Directors:
Name Function
1 Mr. M.F. Willem (as of February 27, 2013) Chairman
2 Mr. R.H. Doest (as of June 30, 2011) Director
3 Mr. A.A. Hamoud (as of February 27, 2013) Director
4 Mrs. T. Prins (as of March 25, 2013) Director
5 Mr. H. R. Haile (as of August 19, 2013) Director
6 Mr. D.E. Evertsz (as of September 11, 2013) Vice Chairman
In addition to the above-noted Directors, Mr. D.G. Rosaria, as a Director as of March 25, 2013 till
March 26, 2014, was also member of the BSD during 2014. Mr. D.G. Rosaria resigned on March
26, 2014 and was discharged of his duties on January 19, 2015.
In his place as of January 19, 2015, Mr. A.A. Davelaar has been appointed as a Director.
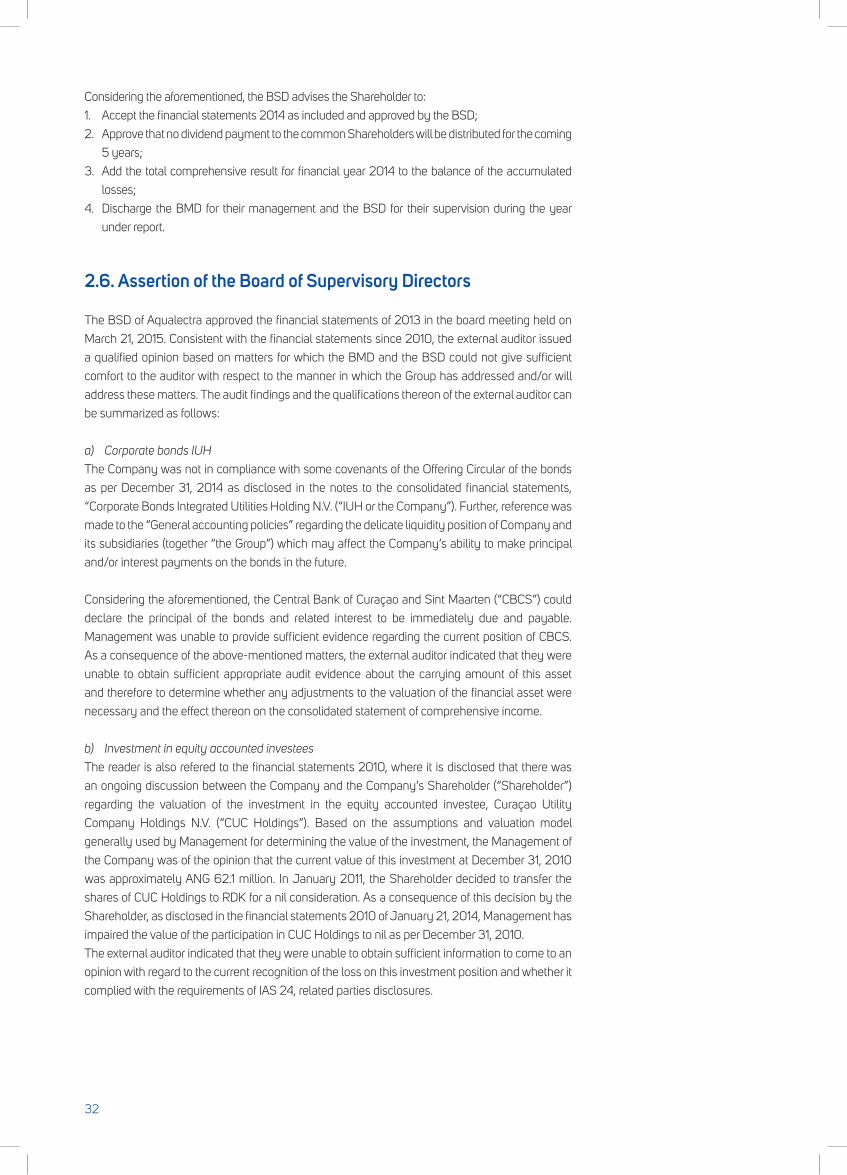
In accordance with the articles of incorporation of IUH N.V., members of the BSD are entitled to a
financial compensation. In the year under report, the following compensations have been paid to
the respective Board members.
30
Name Net amount in ANG
1 Mr. R.H. Doest 12,000
2 Mr. M.F. Willem 15,000
3 Mr. A.A. Hammoud 12,000
4 Mrs. T. Prins 12,000
5 Mr. D.G. Rosaria (till march 26, 2014) 2,815
6 Mr. H. R. Haile 12,000
7 Mr. D.E. Evertsz 12,000
The BSD would like to point out that none of its members have any other relationship with IUH N.V.
and are therefore independent.
The principal appointment/position and all other relevant additional positions of each board
member have been adequately documented and this is retained in the BSD handbook.
All members of the BSD frequently attended the meetings of the BMD. The BSD would like to
address a special word of thanks to the BMD and the Staff of the Aqualectra companies for their
contribution to the further development of Aqualectra.
2.5. Annual financial report and dividend proposal
We herewith submit the consolidated annual report 2014 of IUH N.V. (DBA Aqualectra) as drawn up
bytheBMDandapprovedbyourBSD.EYDutchCaribbeanhasauditedtheconsolidatedfinancial
statementsfortheyearendedDecember31,2014;itsopinionisincludedinthisannualreport.
Based on the Integrated Resource Planning, the strategic direction established in Aqualectra’s
strategic plan “A Refreshing Approach”, and the task to device a plan for the next level strategic plan,
it is expected that all the necessary actions for realizing the corporate strategic direction can be well
articulated. These actions are necessary in order to guarantee the supply of electricity and water to
the island of Curaçao. The BSD has been duly informed and updated about the corporate objectives
being (i) quality of the supply, (ii) reliability of the supply, (iii) less environmental burden and (iv) least
cost option of the supply. The BSD fully sustains these objectives and the way Management is
complying with its targets in order to at least realize these objectives.
The projected (budgeted) return on equity of 3.31% for 2014 has been achieved. The return on equity
as of December 31, 2014 is 18.22%
It is of utmost importance to strengthen the Shareholder’s equity of Aqualectra despite of the losses
incurred in the past years in order to secure the necessary financing and to be able to contribute to
the required investments. For this reason and despite the absence of a formal dividend policy, it is
advisable not to distribute dividends for the coming years even in the event of a profitable operation
of the Group.
31
Considering the aforementioned, the BSD advises the Shareholder to:
1. Acceptthefinancialstatements2014asincludedandapprovedbytheBSD;
2. Approve that no dividend payment to the common Shareholders will be distributed for the coming
5years;
3. Add the total comprehensive result for financial year 2014 to the balance of the accumulated
losses;
4. Discharge the BMD for their management and the BSD for their supervision during the year
under report.
2.6. Assertion of the Board of Supervisory Directors
The BSD of Aqualectra approved the financial statements of 2013 in the board meeting held on
March 21, 2015. Consistent with the financial statements since 2010, the external auditor issued
a qualified opinion based on matters for which the BMD and the BSD could not give sufficient
comfort to the auditor with respect to the manner in which the Group has addressed and/or will
address these matters. The audit findings and the qualifications thereon of the external auditor can
be summarized as follows:
a) Corporate bonds IUH
The Company was not in compliance with some covenants of the Offering Circular of the bonds
as per December 31, 2014 as disclosed in the notes to the consolidated financial statements,
“Corporate Bonds Integrated Utilities Holding N.V. (“IUH or the Company”). Further, reference was
made to the “General accounting policies” regarding the delicate liquidity position of Company and
its subsidiaries (together “the Group”) which may affect the Company’s ability to make principal
and/or interest payments on the bonds in the future.
Considering the aforementioned, the Central Bank of Curaçao and Sint Maarten (“CBCS”) could
declare the principal of the bonds and related interest to be immediately due and payable.
Management was unable to provide sufficient evidence regarding the current position of CBCS.
As a consequence of the above-mentioned matters, the external auditor indicated that they were
unable to obtain sufficient appropriate audit evidence about the carrying amount of this asset
and therefore to determine whether any adjustments to the valuation of the financial asset were
necessary and the effect thereon on the consolidated statement of comprehensive income.
b) Investment in equity accounted investees
The reader is also refered to the financial statements 2010, where it is disclosed that there was
an ongoing discussion between the Company and the Company’s Shareholder (“Shareholder”)
regarding the valuation of the investment in the equity accounted investee, Curaçao Utility
Company Holdings N.V. (“CUC Holdings”). Based on the assumptions and valuation model
generally used by Management for determining the value of the investment, the Management of
the Company was of the opinion that the current value of this investment at December 31, 2010
was approximately ANG 62.1 million. In January 2011, the Shareholder decided to transfer the
shares of CUC Holdings to RDK for a nil consideration. As a consequence of this decision by the
Shareholder, as disclosed in the financial statements 2010 of January 21, 2014, Management has
impaired the value of the participation in CUC Holdings to nil as per December 31, 2010.
The external auditor indicated that they were unable to obtain sufficient information to come to an
opinion with regard to the current recognition of the loss on this investment position and whether it
complied with the requirements of IAS 24, related parties disclosures.
32
None of the undersigned members of the BSD were appointed during the fiscal years when
the various decisions were reached affecting the financial position of the Company in particular,
the transfer of CUC to “Refineria di Korsou” (“RDK”) upon instruction of the government and the
consequences thereof on the long term bond financing of the Company.
Based on the corporate law of Curaçao, each member of the BSD could be held liable by a third
party in the case that the financial statements present a misleading position of the Company.
On the other hand each board member could be liable in case the financial statements are not
prepared, signed by the BSD presented for approval to the Shareholder and published timely by
the Company.
The BSD approved the financial statement of 2010 on January 21, 2014 and on April 9, 2014 this
financial statement was presented to the GSM. The Council of Ministers accepted the qualification
as to be issued by the external accountant and instructed the Shareholder to approve the financial
statement with the proposed qualifications as issued by the external auditors. On May 13, 2014
the Shareholder of the Group approved the 2010 financial statements.
Furthermore, as per October 21, 2014, December 13, 2014 and March 21, 2015, the BSD also
approved the financial statements 2011, 2012 and 2013, respectively with the abovementioned
qualifications and also advised the Shareholder to do the same. It is expected that the Shareholder
will shortly provide her approval to the financial statements 2011 through 2013 with the above-
mentioned qualifications.
The BSD requests the Shareholder to approve the financial statements 2014 with the same
qualifications as the previous financial statements since 2010. Work is still ongoing to resolve the
qualifications.
Willemstad, May 28, 2015
On behalf of the Board of Supervisory Directors,
Mr. M.F. Willem
Chairperson of the Board of Supervisory Directors
Mr. D.E. Evertsz
Vice Chairman
Mr. A.A. Hammoud
Director
Mrs. T. Prins
Director
Mr. H. R. Haile
Director
Mr. R.H. Doest
Director
Mr. A.A. Davelaar
Director
33

3. highlights of the year
34
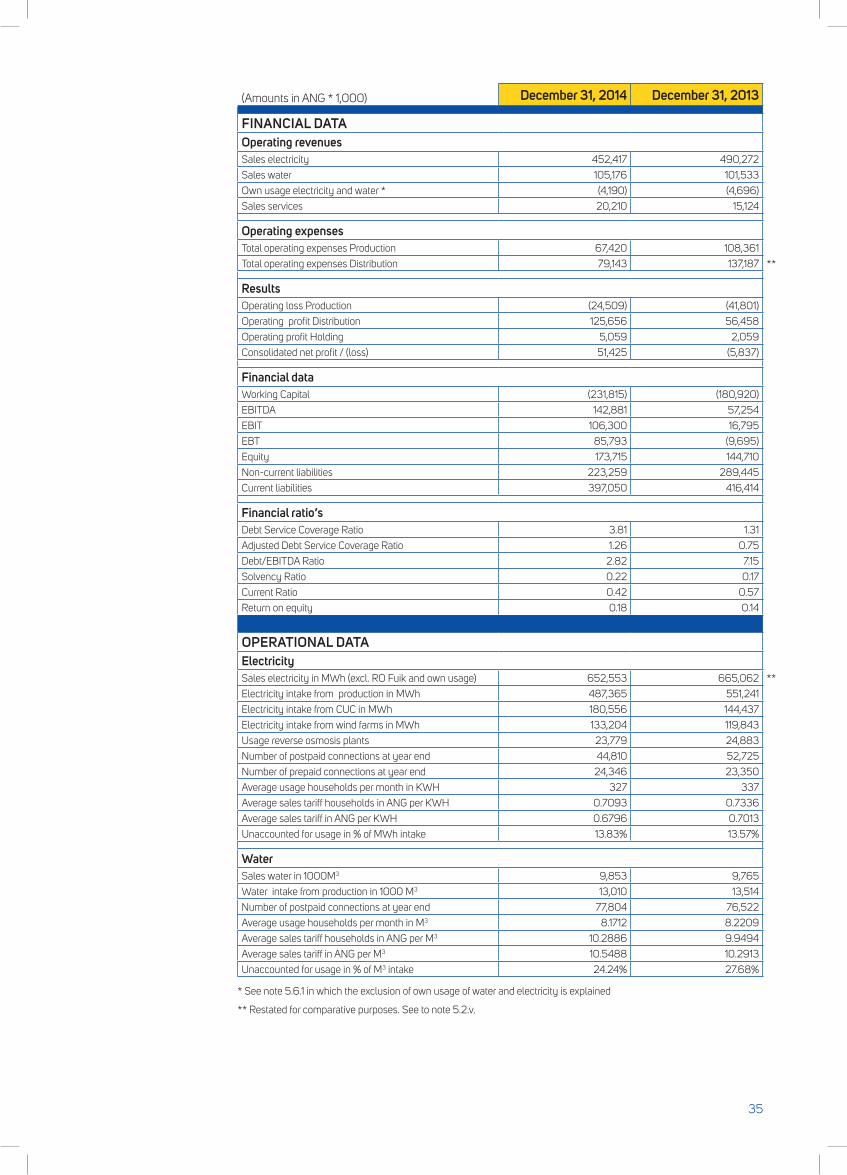
(Amounts in ANG * 1,000) December 31, 2014 December 31, 2013
FINANCIAL DATAOperating revenuesSales electricity 452,417 490,272
Sales water 105,176 101,533
Own usage electricity and water * (4,190) (4,696)
Sales services 20,210 15,124
Operating expensesTotal operating expenses Production 67,420 108,361
Total operating expenses Distribution 79,143 137,187 **
ResultsOperating loss Production (24,509) (41,801)
Operating profit Distribution 125,656 56,458
Operating profit Holding 5,059 2,059
Consolidated net profit / (loss) 51,425 (5,837)
Financial dataWorking Capital (231,815) (180,920)
EBITDA 142,881 57,254
EBIT 106,300 16,795
EBT 85,793 (9,695)
Equity 173,715 144,710
Non-current liabilities 223,259 289,445
Current liabilities 397,050 416,414
Financial ratio’sDebt Service Coverage Ratio 3.81 1.31
Adjusted Debt Service Coverage Ratio 1.26 0.75
Debt/EBITDA Ratio 2.82 7.15
Solvency Ratio 0.22 0.17
Current Ratio 0.42 0.57
Return on equity 0.18 0.14
OPERATIONAL DATA ElectricitySales electricity in MWh (excl. RO Fuik and own usage) 652,553 665,062 **
Electricity intake from production in MWh 487,365 551,241
Electricity intake from CUC in MWh 180,556 144,437
Electricity intake from wind farms in MWh 133,204 119,843
Usage reverse osmosis plants 23,779 24,883
Number of postpaid connections at year end 44,810 52,725
Number of prepaid connections at year end 24,346 23,350
Average usage households per month in KWH 327 337
Average sales tariff households in ANG per KWH 0.7093 0.7336
Average sales tariff in ANG per KWH 0.6796 0.7013
Unaccounted for usage in % of MWh intake 13.83% 13.57%
WaterSales water in 1000M3 9,853 9,765
Water intake from production in 1000 M3 13,010 13,514
Number of postpaid connections at year end 77,804 76,522
Average usage households per month in M3 8.1712 8.2209
Average sales tariff households in ANG per M3 10.2886 9.9494
Average sales tariff in ANG per M3 10.5488 10.2913
Unaccounted for usage in % of M3 intake 24.24% 27.68%
* See note 5.6.1 in which the exclusion of own usage of water and electricity is explained
** Restated for comparative purposes. See to note 5.2.v.
35

4. consolidated financial stateMents
36
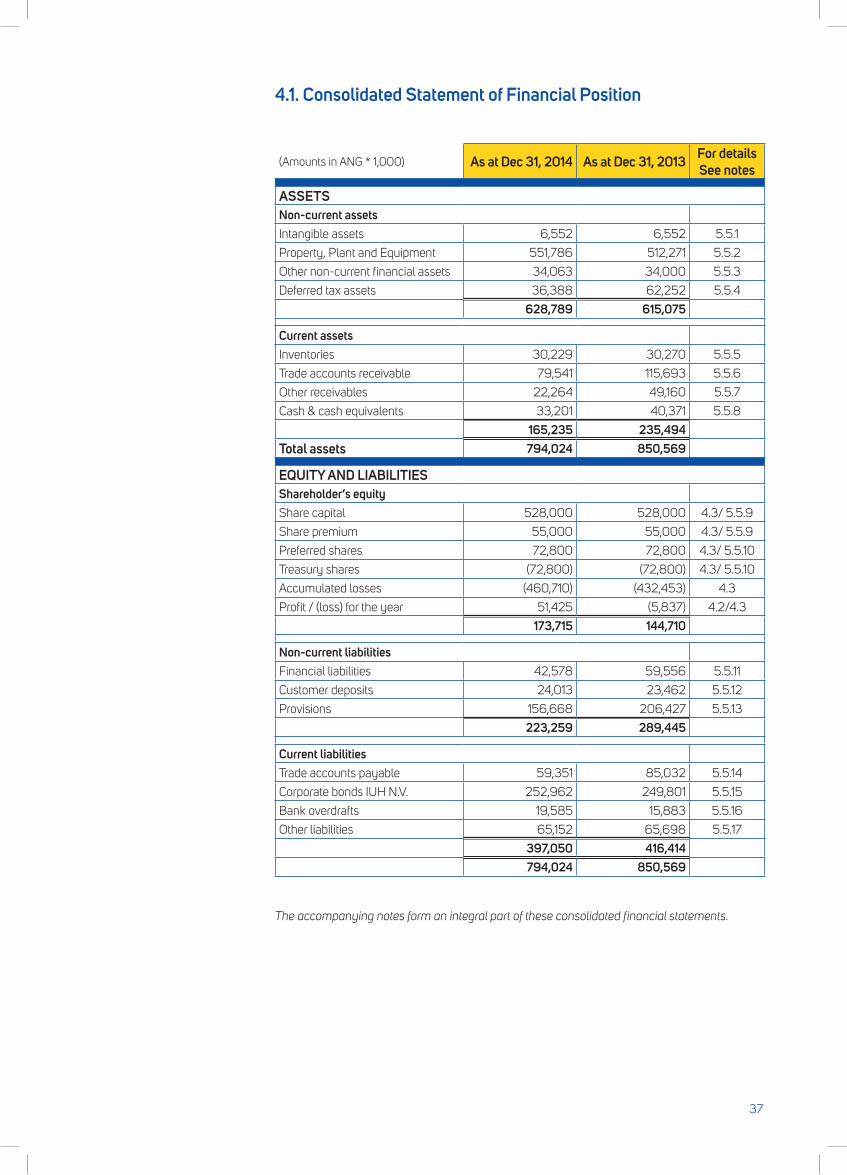
4.1. Consolidated Statement of Financial Position
(Amounts in ANG * 1,000) As at Dec 31, 2014 As at Dec 31, 2013 For details See notes
ASSETSNon-current assetsIntangible assets 6,552 6,552 5.5.1
Property, Plant and Equipment 551,786 512,271 5.5.2
Other non-current financial assets 34,063 34,000 5.5.3
Deferred tax assets 36,388 62,252 5.5.4
628,789 615,075
Current assetsInventories 30,229 30,270 5.5.5
Trade accounts receivable 79,541 115,693 5.5.6
Other receivables 22,264 49,160 5.5.7
Cash & cash equivalents 33,201 40,371 5.5.8
165,235 235,494Total assets 794,024 850,569
EQUITY AND LIABILITIESShareholder’s equityShare capital 528,000 528,000 4.3/ 5.5.9
Share premium 55,000 55,000 4.3/ 5.5.9
Preferred shares 72,800 72,800 4.3/ 5.5.10
Treasury shares (72,800) (72,800) 4.3/ 5.5.10
Accumulated losses (460,710) (432,453) 4.3
Profit / (loss) for the year 51,425 (5,837) 4.2/4.3
173,715 144,710
Non-current liabilitiesFinancial liabilities 42,578 59,556 5.5.11
Customer deposits 24,013 23,462 5.5.12
Provisions 156,668 206,427 5.5.13
223,259 289,445
Current liabilitiesTrade accounts payable 59,351 85,032 5.5.14
Corporate bonds IUH N.V. 252,962 249,801 5.5.15
Bank overdrafts 19,585 15,883 5.5.16
Other liabilities 65,152 65,698 5.5.17
397,050 416,414794,024 850,569
The accompanying notes form an integral part of these consolidated financial statements.
37
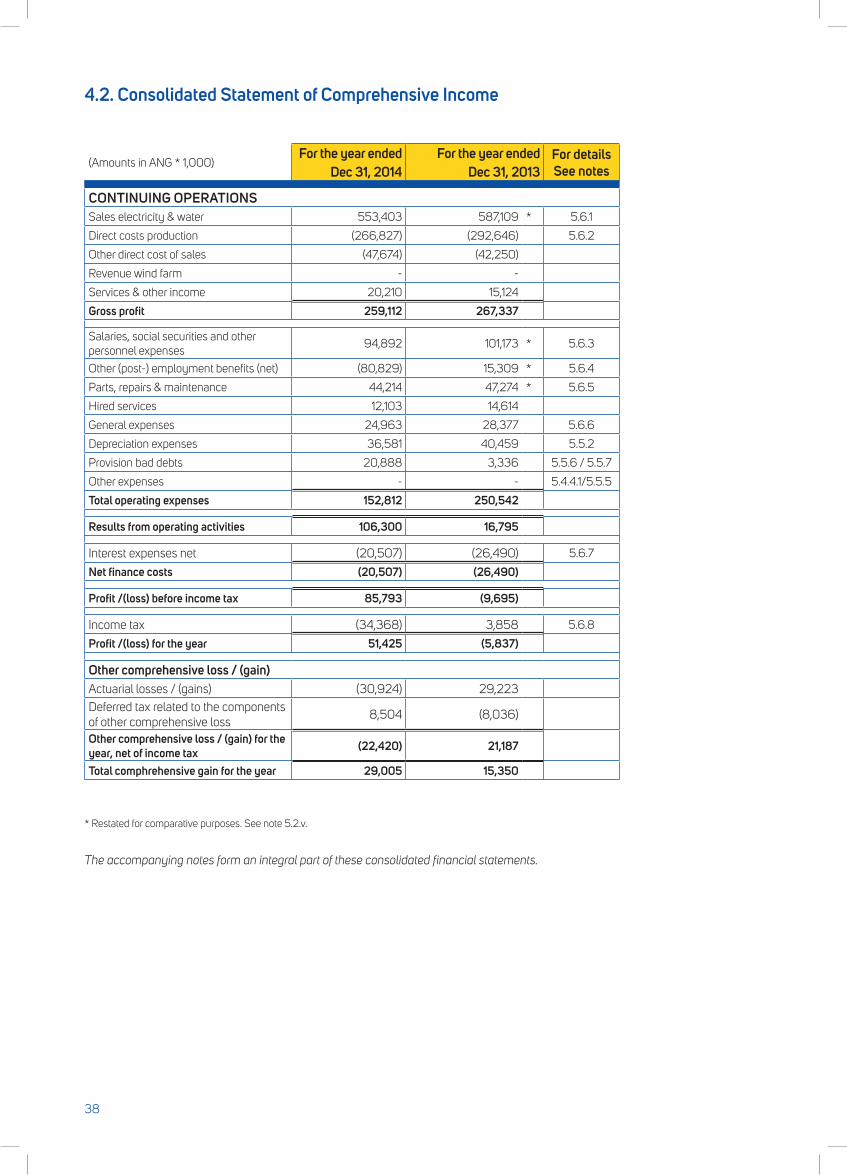
4.2. Consolidated Statement of Comprehensive Income
(Amounts in ANG * 1,000)For the year ended
Dec 31, 2014For the year ended
Dec 31, 2013For details See notes
CONTINUING OPERATIONSSales electricity & water 553,403 587,109 * 5.6.1
Direct costs production (266,827) (292,646) 5.6.2
Other direct cost of sales (47,674) (42,250)
Revenue wind farm - -
Services & other income 20,210 15,124
Gross profit 259,112 267,337
Salaries, social securities and other personnel expenses
94,892 101,173 * 5.6.3
Other (post-) employment benefits (net) (80,829) 15,309 * 5.6.4
Parts, repairs & maintenance 44,214 47,274 * 5.6.5
Hired services 12,103 14,614
General expenses 24,963 28,377 5.6.6
Depreciation expenses 36,581 40,459 5.5.2
Provision bad debts 20,888 3,336 5.5.6 / 5.5.7
Other expenses - - 5.4.4.1/5.5.5
Total operating expenses 152,812 250,542
Results from operating activities 106,300 16,795
Interest expenses net (20,507) (26,490) 5.6.7
Net finance costs (20,507) (26,490)
Profit /(loss) before income tax 85,793 (9,695)
Income tax (34,368) 3,858 5.6.8
Profit /(loss) for the year 51,425 (5,837)
Other comprehensive loss / (gain)Actuarial losses / (gains) (30,924) 29,223 Deferred tax related to the components of other comprehensive loss
8,504 (8,036)
Other comprehensive loss / (gain) for the year, net of income tax (22,420) 21,187
Total comphrehensive gain for the year 29,005 15,350
* Restated for comparative purposes. See note 5.2.v.
The accompanying notes form an integral part of these consolidated financial statements.
38
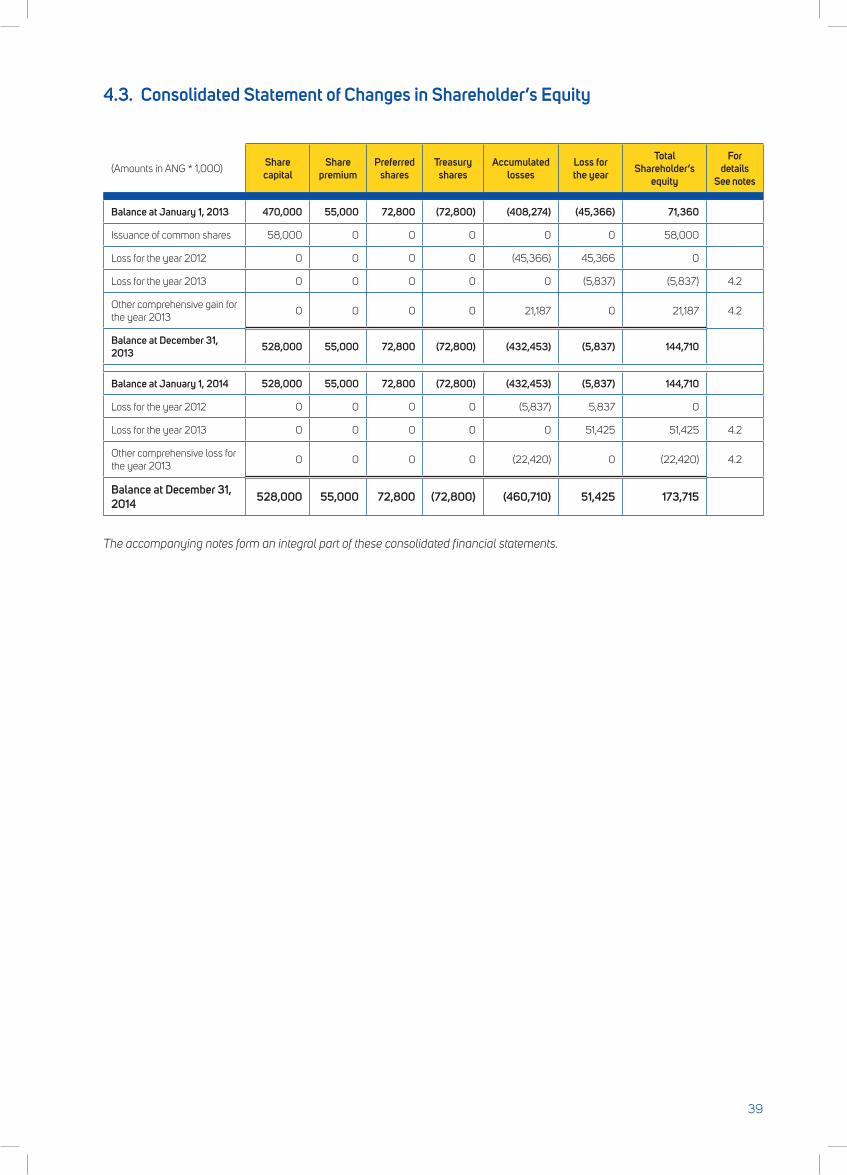
4.3. Consolidated Statement of Changes in Shareholder’s Equity
(Amounts in ANG * 1,000)Share capital
Share premium
Preferred shares
Treasury shares
Accumulated losses
Loss for the year
Total Shareholder’s
equity
For details
See notes
Balance at January 1, 2013 470,000 55,000 72,800 (72,800) (408,274) (45,366) 71,360
Issuance of common shares 58,000 0 0 0 0 0 58,000
Loss for the year 2012 0 0 0 0 (45,366) 45,366 0
Loss for the year 2013 0 0 0 0 0 (5,837) (5,837) 4.2
Other comprehensive gain for the year 2013
0 0 0 0 21,187 0 21,187 4.2
Balance at December 31, 2013 528,000 55,000 72,800 (72,800) (432,453) (5,837) 144,710
Balance at January 1, 2014 528,000 55,000 72,800 (72,800) (432,453) (5,837) 144,710
Loss for the year 2012 0 0 0 0 (5,837) 5,837 0
Loss for the year 2013 0 0 0 0 0 51,425 51,425 4.2
Other comprehensive loss for the year 2013
0 0 0 0 (22,420) 0 (22,420) 4.2
Balance at December 31, 2014 528,000 55,000 72,800 (72,800) (460,710) 51,425 173,715
The accompanying notes form an integral part of these consolidated financial statements.
39
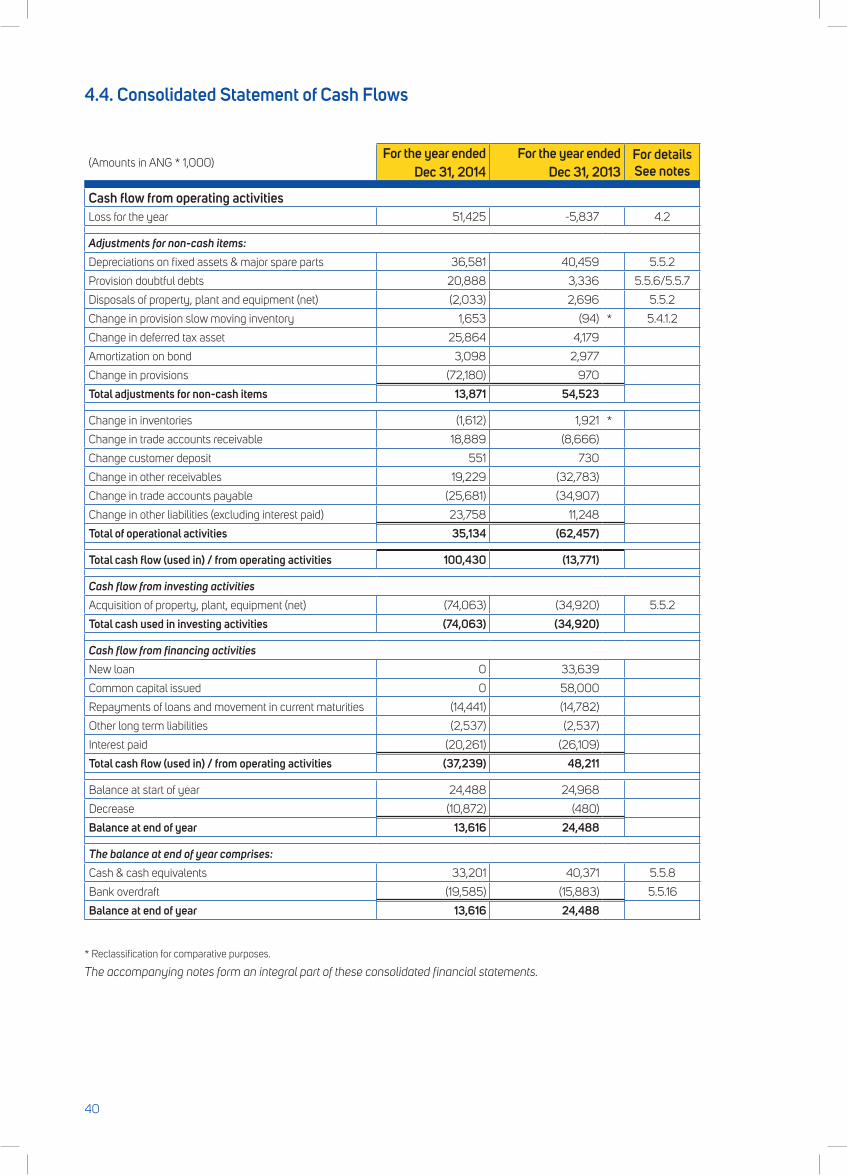
4.4. Consolidated Statement of Cash Flows
(Amounts in ANG * 1,000)For the year ended
Dec 31, 2014For the year ended
Dec 31, 2013For details See notes
Cash flow from operating activitiesLoss for the year 51,425 -5,837 4.2
Adjustments for non-cash items:
Depreciations on fixed assets & major spare parts 36,581 40,459 5.5.2
Provision doubtful debts 20,888 3,336 5.5.6/5.5.7
Disposals of property, plant and equipment (net) (2,033) 2,696 5.5.2
Change in provision slow moving inventory 1,653 (94) * 5.4.1.2
Change in deferred tax asset 25,864 4,179
Amortization on bond 3,098 2,977
Change in provisions (72,180) 970
Total adjustments for non-cash items 13,871 54,523
Change in inventories (1,612) 1,921 *
Change in trade accounts receivable 18,889 (8,666)
Change customer deposit 551 730
Change in other receivables 19,229 (32,783)
Change in trade accounts payable (25,681) (34,907)
Change in other liabilities (excluding interest paid) 23,758 11,248
Total of operational activities 35,134 (62,457)
Total cash flow (used in) / from operating activities 100,430 (13,771)
Cash flow from investing activities
Acquisition of property, plant, equipment (net) (74,063) (34,920) 5.5.2
Total cash used in investing activities (74,063) (34,920)
Cash flow from financing activities
New loan 0 33,639
Common capital issued 0 58,000
Repayments of loans and movement in current maturities (14,441) (14,782)
Other long term liabilities (2,537) (2,537)
Interest paid (20,261) (26,109)
Total cash flow (used in) / from operating activities (37,239) 48,211
Balance at start of year 24,488 24,968
Decrease (10,872) (480)
Balance at end of year 13,616 24,488
The balance at end of year comprises:
Cash & cash equivalents 33,201 40,371 5.5.8
Bank overdraft (19,585) (15,883) 5.5.16
Balance at end of year 13,616 24,488
* Reclassification for comparative purposes.
The accompanying notes form an integral part of these consolidated financial statements.
40

41

5. notes to the consolidated financial stateMents
42
5.1. General
Corporate informationIntegrated Utility Holding N.V. (IUH N.V., hereinafter “the Group”) was incorporated on September 12,
1997 in Willemstad, Curaçao. The shares of Kompania di Awa i Elektrisidat N.V. (K.A.E.), a water and
electricity production company and Kompania di Distribushon di Elektrisidat i Awa (KODELA), a water
and electricity distribution company, were transferred into IUH N.V. The principal activities of the Group
are described in the “Profile”. The headquarters of the Group is located at Rector Zwijssenstraat 1,
Curaçao.
The objectives of the Group are:
• Investing funds insharesofutilitycompanieswhichhave thegoalsofproducinganddistributing
waterandelectricity;and
• Managing, controlling and administering of other companies and representing interests of the
Shareholderandfinancersin/oftheGroup;
• Generatingelectricityandtheproductionofwater;
• Distributingelectricityandwater;
• Offeringmanagementconsultancy-andengineeringservices;and
• Bottlingofdrinkingwater.
The Group’s authorized capital amounts to ANG 600 million, consisting of 600 shares at ANG
1 million par value each. 470 shares were issued to the Island territory of Curaçao on June 1, 1998
with an additional 58 shares issued on January 31, 2013 to the Government of Country Curaçao who
became the legal successor of the Island territory of Curaçao and the Shareholder of the Group after the
restructuring of the Netherlands Antilles on October 10, 2010.
The 470 shares were paid up in full by means of the contribution of the KODELA (Aqualectra Distribution)
and KAE (Aqualectra Production) shares. This created a share premium of ANG 55 million. Of the 58
shares issued in 2013, 34 were paid up in full by means of a settlement of the concession security
deposit payable to the Country of Curaçao of ANG 34 million at December 31, 2012. The remaining 24
shares were paid up during the year 2014.
Utilities sector in Curaçao
Concessions
The National Ordinance for Electricity concession (“Landsverordening Elektriciteitsconcessies”) states
that the building, construction or usage of equipment for the generation of power and for the transmission
and/or transformation of electricity, in order to deliver this to a third party, is restricted to the company
to which permission has been granted by the Government. Furthermore, the ordinance states that the
concession will be given for a maximum period of 30 years with possibility for extension.
On July 30, 2012 concessions for the production and distribution of electricity were adopted, granting the
Group the certainty of production of power for the coming 30 years. Management initiated discussions
and negotiations with the Regulator, Bureau Telecommunicatie and Post (BTP), on various restrictions
identified in complying with these requirements. On June 9, 2014 the Minister of Finance provided
Aqualectra with a draft of a proposed amended concession for the production of electricity. On June
11, 2014 the Government adopted concession for the production of electricity. Notable change in this
concession is the simplification of various requirements compared to the previous concession. Another
major change in the new concession is the granting to Aqualectra of a minimum and a maximum
production capacity. This granted capacity can be applied in direct form (own production) and in indirect
form (contracted production). The amended concession was issued on June 19, 2014 and formalized
on November 6, 2014.
43
Tariff structure
The tariff structure for water and electricity consists of a (i) base component and (ii) a fuel component.
The base component is intended to cover all the non-direct costs for the production, distribution and
supply, while the fuel component must cover the fuel costs and other direct costs of production and
sales. This separation made the application of a rate calculation system, that could track changes in fuel
costs, possible.
Calculation of tariffs
The Ordinance for Prices (“Prijzenverordening”) states that the authority for the calculation and the
adjustment of electricity and water tariffs, lies with the Government of Country Curaçao.
The Executive Council of the Island Government of Curaçao adopted in 2002 a resolution in which is
stated that as the public entity and as the Shareholder of the Group she is in favor of tariffs that will allow
the Company to comply with all its obligations including its capital investments. The resolution also
mentions that tariffs for water and electricity may be changed as a consequence of increases in the fuel
prices. Furthermore, it is indicated that the price increases will be charged to the consumers.
The Government did not approve any change of the water and electricity tariffs in the subsequent years.
Consequently, in 2008 the Board of Managing Directors (BMD) engaged in legal proceedings in order
to achieve tariff changes. The Court ruled, on October 31, 2008, for an interlocutory judgment, giving the
parties time for a settlement out of the court. As a consequence, a resolution was adopted on November
17, 2008.
The aforementioned resolutions were retracted by the Government on April 6, 2011. In 2011 and 2012
there were several developments with regard to the tariffs. Tariff decreased starting April 2011 and direct
costs increased starting July 2011. The Group approached the Regulator in early 2012 with the request
to reconsider the level of the tariffs for water and electricity. As a result, the fuel pass through principal
on a monthly basis was granted, which has been included in the tariff policy as of June 1, 2012 by the
Regulator. Furthermore the granting and execution of the recovery of the fuel undercoverage for 2011
and 2012 was also included in the tariffs as of August 1, 2012 with a 12 month recovery period. These
actions have lowered to a certain extent the pressure on the cash flow and improved the results of the
Group. Based on the aforementioned, the BMD sees room for managing and operating the Company in
a responsible manner with the possibilities for achieving (efficiency) improvements through execution
of investment plans. The combination of these actions in conjunction with other measures should
enable Management to achieve a sound financial position. We refer the reader further to the paragraph
‘Financial Position of the group’ in note 5.2.c.
The electricity and water tariff-structure adopted on June 1, 2012 comprises three components, namely:
• the fuel component,which covers the direct costs (including fuel, chemicals, lubricants and the
purchaseofelectricityandwaterfromthirdparties);
• therecoverycomponent,whichcoversshortages in the fuelcomponent thatdevelopedbetween
January2011throughMay2012;
• thebasecostcomponent,whichcoverstheoperationalcosts.
44
Energy policy
In a resolution dated November 17, 2008 it is stated that the Government will institute a regulatory
framework as per March 1, 2010 for the review, calculation and approval of the tariffs for water and
electricity. Furthermore, it was stated that a regulatory body would be instituted, as per March
2009, for the analysis and approval of the Group’s requests for tariff changes and for the execution
of the regulation yet to be implemented.
In 2009, the Group was notified by the Government that BTP was appointed as the Regulator.
On November 15, 2010, the Regulator presented to the Group and other stakeholders a New Policy
paper (“Beleidsnota”) concerning the future regulatory structure for electricity supply in Curaçao.
The intended effect of the policy paper is to lower the tariffs, upgrade the services to the customers,
provide choices for the clients and to increase the reliability and sustainability of energy. BTP
made amendments to the policy paper in February 2011 based on comments from the BMD and
the policy paper is being implemented and will continue to be implemented in the coming years.
5.2. Summary of significant accounting policies
a) Basis of preparation The accompanying Consolidated Financial Statements are prepared in accordance with the
International Financial Reporting Standards (IFRS). The Consolidated Financial Statements are
prepared under the historical cost convention except as disclosed in the accounting policies below.
The Consolidated Financial Statements are presented in Netherlands Antilian guilders and all
values are rounded to the nearest thousand (ANG’000), exept when otherwise indicated.
Management has concluded that the Consolidated Financial Statements fairly represent the
Group’s financial position, financial performance and cash flows. The Consolidated Financial
Statements comply in all material respects with applicable IFRS.
These Consolidated Financial Statements for the year ended 2013 were approved for issue by
the Board of Supervisory Directors (BSD) on April 21, 2015. The Shareholders have the power to
amend the financial statements after the date of issuance.
45
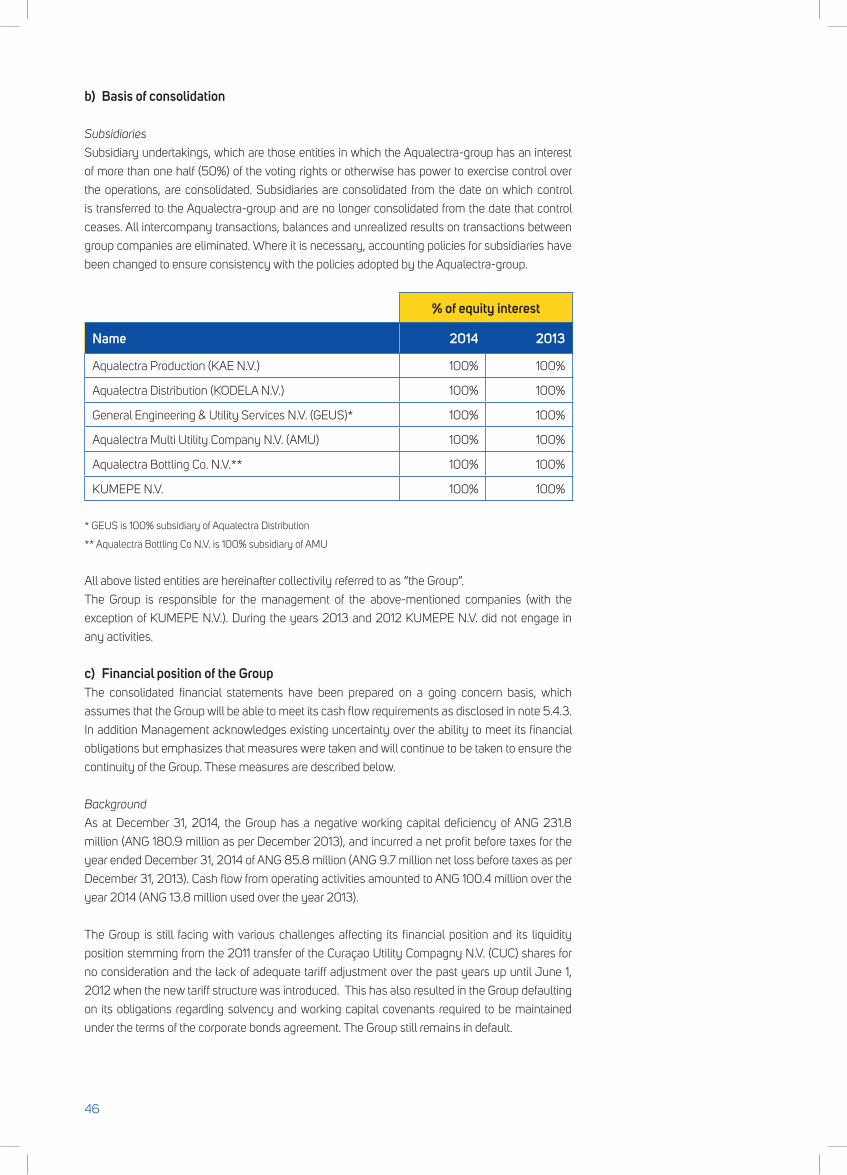
b) Basis of consolidation
Subsidiaries
Subsidiary undertakings, which are those entities in which the Aqualectra-group has an interest
of more than one half (50%) of the voting rights or otherwise has power to exercise control over
the operations, are consolidated. Subsidiaries are consolidated from the date on which control
is transferred to the Aqualectra-group and are no longer consolidated from the date that control
ceases. All intercompany transactions, balances and unrealized results on transactions between
group companies are eliminated. Where it is necessary, accounting policies for subsidiaries have
been changed to ensure consistency with the policies adopted by the Aqualectra-group.
% of equity interest
Name 2014 2013
Aqualectra Production (KAE N.V.) 100% 100%
Aqualectra Distribution (KODELA N.V.) 100% 100%
General Engineering & Utility Services N.V. (GEUS)* 100% 100%
Aqualectra Multi Utility Company N.V. (AMU) 100% 100%
Aqualectra Bottling Co. N.V.** 100% 100%
KUMEPE N.V. 100% 100%
* GEUS is 100% subsidiary of Aqualectra Distribution
** Aqualectra Bottling Co N.V. is 100% subsidiary of AMU
All above listed entities are hereinafter collectivily referred to as “the Group”.
The Group is responsible for the management of the above-mentioned companies (with the
exception of KUMEPE N.V.). During the years 2013 and 2012 KUMEPE N.V. did not engage in
any activities.
c) Financial position of the GroupThe consolidated financial statements have been prepared on a going concern basis, which
assumes that the Group will be able to meet its cash flow requirements as disclosed in note 5.4.3.
In addition Management acknowledges existing uncertainty over the ability to meet its financial
obligations but emphasizes that measures were taken and will continue to be taken to ensure the
continuity of the Group. These measures are described below.
Background
As at December 31, 2014, the Group has a negative working capital deficiency of ANG 231.8
million (ANG 180.9 million as per December 2013), and incurred a net profit before taxes for the
year ended December 31, 2014 of ANG 85.8 million (ANG 9.7 million net loss before taxes as per
December 31, 2013). Cash flow from operating activities amounted to ANG 100.4 million over the
year 2014 (ANG 13.8 million used over the year 2013).
The Group is still facing with various challenges affecting its financial position and its liquidity
position stemming from the 2011 transfer of the Curaçao Utility Compagny N.V. (CUC) shares for
no consideration and the lack of adequate tariff adjustment over the past years up until June 1,
2012 when the new tariff structure was introduced. This has also resulted in the Group defaulting
on its obligations regarding solvency and working capital covenants required to be maintained
under the terms of the corporate bonds agreement. The Group still remains in default.
46
Preliminary figures show that the Group made a profit of approximately ANG 8.9 million before
taxes in the first quarter of 2015 and is expected to make a profit of approximately ANG 33.6
million before taxes for 2015 based on the budget. The effects of the aforementioned and forecast
results are disclosed in note 5.4.3., “Liquidity risk”.
Since the transfer of the CUC shares to RdK in 2011 for no consideration, the Group has remained
in default of the solvency and working capital covenants required to be maintained under the term
of the corporate bonds agreement. See note 5.4.4., “Capital risk”.
Because of the aforementioned facts and circumstances, the financial position of the Group is
delicate and warrants close attention of Management and the BSD of the Group and may cast
doubt about the possibility of the Group to continue as a going concern. In order to safeguard the
continuity of the business, some actions have been taken in the past years and more are planned
for execution phases that are yet to come.
Plan for the improvement of the financial and liquidity position of the Group
As a consequence of the developments over the recent years, Management prepared in 2011 a
turnaround plan that was provided to, among others, the BSD, the Shareholder and the general
supervisory body “College Financieel Toezicht” (CFT). With the realization of this plan that started
in 2011, Management expects that within a period of 5 years the Group will become a sound
company again. This plan is based on some important focus areas and assumptions. In order to
realize the turnaround, the Group plans to take the following measures:
Significant investments will be made in new technologies that are more efficient, which will lead to:• Adecreaseinfueldependencybytheusageofsustainableenergysources.
• Amorebalancedproductionmix.
• Atransitionfromtheevaporationtechniquetomoreefficientwaterproductiontechnologies,
such as reverse osmosis.
• Theavailabilityofadequateresourcestoensuretimelyrealizationofrepairsandmaintenance
plans.
The Group will ensure that its future revenues (tariffs) are more in line with the developments in the cost of productions (fuel, etc.) by:• Havingcontinuousdialoguewith theRegulatorand theGovernmentofCuraçao inorder to
maintainthetimelytariffadjustmentstoabsorbfluctuationsinfuelprices;
• Performingadiligentandcontinuousevaluationofthefuelclauseanditsaccuracy.
• Continuing to inform theRegulatorand theGovernmentofCuraçaoabout theneed for the
recovery of any fuel undercoverage in electricity and water tariffs caused by the lack of the
necessary tariff adjustments and the need to recover undercovarege caused by the base
component.
• ContinuingtoinformtheRegulatorandtheGovernmentofCuraçaoabouttheneedtorecover
the balance in the regulatory account of ANG 104 million due to lack of timely adjustments
through 2010. For more details we refer the reader to note 5.5.18.6. The Group will significantly
improve its financial position if it obtains this recovery. This amount will cover the entire
payment backlog reflected in the liquidity projection (note 5.3.3).
47
Measures taken regarding cost control and the reassessment of certain planned investments are: • Maintenanceofequipmentwasperformedinordertoachieveoptimallevelfunctioning.The
cost cutting result, being lower usage of fuel and other fuel additives, was achieved mid-2012.
• Continuousrationalizationoftheproductionmix(anditsforecast)inordertoachievetheleast
cost option for production of water and power.
• Theusageofcontractingcompanieswasevaluatedandwherenotconsideredanessential
requirement, the volume of hiring was reduced.
• Reassessmentoforderlevelsforstockitemswasperformedandwhereconsideredacceptable
these were adapted.
• Rationalizationofovertimedeclarationandimprovementofworkplanning.
• Centralizationoftasksleadingtosynergy,efficiencyandlowercostlevels.
• Apetition forageneralabolishmentof importduties forequipmentandmachinery thatare
required for the production and distribution of water and power was submitted to Customs in
2011. Management will intensify the communications with Customs in order to obtain a final
decision on the aforementioned.
• PostponementofphaseIIoftheNextStepproject
• PostponementoftheERP-systemimplementationinitiallybudgetedatANG65millionovera
5 year period. See note 5.5.1. Intangible assets.
The turnaround plan as presented by Management has been approved by the BSD and the
Shareholder. The turnaround plan has been also presented to the CFT.
Management assertion
The Group’s ability to continue as a going concern is contingent upon the realization of:
1. The Management turnaround plan and financing of the necessary investments which are
imperative in realizing the above-mentioned plan. See the liquidity projection in note 5.4.3.
This is a key assumption that Management has worked out in a business plan in order to
provide sufficient comfort to the local financial institutions.
2. Arrangement with the Regulator regarding the recovery of the undercoverage related to both
the fuel and the base component.
3. Arrangement with the Central Bank of Curaçao and St. Maarten (CBCS) regarding the Corporate
Bond.
The Group’s ability to continue as a going concern is contingent upon the realization of
management’s plan, receipt of the recovery of the undercoverage on fuel and base component as
incurred during the past years and the financing of the investments and liabilities.
Management has reasonable expectation that the Group will be able to realize the aforementioned
plan as it is supported by the most important stakeholders (Government of Curaçao, BSD and
employees) of the Group.
Furthermore, it is in the best interest of the community of Curaçao that the Group overcomes this
period of difficulty. As the only supplier of water and power and as one of the major employers
on the island, every development within the Group affects the local economy. With the financial
support of the participants in this economy, the Group will realize the aforementioned goals which
will lead to an increase of the reliability and sustainability of the delivery of power and water.
The Consolidated Financial Statements have therefore been prepared on a going concern basis
by Management, which assumes that the Group will be able to meet its financial obligations in the
foreseeable future as disclosed in note 5.4.3. as far as the conditions mentioned before are met.
48
d) Current versus non-current classificationThe Group presents assets and liabilities in the Statement of Financial Position based on a current/
non-current classification. An asset is current when it is:
• Expectedtoberealizedorintendedtobesoldorconsumedinnormaloperatingcycle;
• Heldprimarilyforthepurposeoftrading;
• Expectedtoberealizedwithintwelvemonthsafterthereportingperiod,or;
• Cashorcashequivalentunlessrestrictedfrombeingexchangedorusedtosettlealiabilityfor
at least twelve months after the reporting period.
All other assets are classified as non-current. A liability is current when:
• Itisexpectedtobesettledinnormaloperatingcycle;
• Itisheldprimarilyforthepurposeoftrading;
• Itisduetobesettledwithintwelvemonthsafterthereportingperiod,or;
• Thereisnounconditionalrighttodeferthesettlementoftheliabilityforatleasttwelvemonths
after the reporting period.
The Group classifies all other liabilities as non-current.
Deferred tax assets and liabilities are classified as non-current assets and liabilities.
e) Fair value measurementThe Group holds no financial assets or liabilities that are measured at fair value at December 31,
2014 or December 31, 2013 . Fair values of financial instruments measured at amortized cost are
disclosed in Note 5.5.19. Fair values.
Fair value is the price that would be received to sell an asset or be paid to transfer a liability in
an orderly transaction between market participants at the measurement date. The fair value
measurement is based on the presumption that the transaction to sell the asset or transfer the
liability takes place either:
• Intheprincipalmarketfortheassetorliability,or
• Intheabsenceofaprincipalmarket,inthemostadvantageousmarketfortheassetorliability
The principal or the most advantageous market must be accessible for the Group.
The fair value of an asset or a liability is measured using the assumptions that market participants
would use when pricing the asset or liability, assuming that market participants act in their
economic best interest.
A fair value measurement of a non-financial asset takes into account a market participant’s ability
to generate economic benefits by using the asset in its highest and best use or by selling it to
another market participant that would use the asset in its highest and best use.
The Group uses valuation techniques that are appropriate in the circumstances and for which
sufficient data are available to measure fair value, maximising the use of relevant observable
inputs and minimizing the use of unobservable inputs.
All assets and liabilities for which fair value is measured or disclosed in the financial statements are
categorized within the fair value hierarchy, described as follows, based on the lowest level input
that is significant to the fair value measurement as a whole:
49
• Level 1 — Quoted (unadjusted) market
prices in active markets for identical assets
or liabilities.
• Level2—Valuationtechniquesforwhich
the lowest level input that is significant to
the fair value measurement is directly or
indirectly observable.
• Level 3 — Valuation techniques for
which the lowest level input that is
significant to the fair value measurement
is unobservable.
For the purpose of fair value disclosures,
the Group has determined classes of assets
and liabilities on the basis of the nature,
characteristics and risks of the asset or liability
and the level of the fair value hierarchy as
explained above.
f) Foreign currenciesFunctional and presentation currency
The Group’s consolidated financial statements
are presented in Netherlands Antillean
Guilders (ANG), which is also the parent
company’s and its subsidiaries’ functional
currency.
Transactions and balances
Transactions in foreign currencies are initially
recorded by the Group’s entities at their
respective functional currency spot rates
at the date the transaction first qualifies for
recognition.
Monetary assets and liabilities denominated
in foreign currencies are translated at the
functional currency spot rates of exchange at
the reporting date.
Differences arising on settlement or translation
of monetary items are recognized in profit or
loss with the exception of monetary items
that are designated as part of the hedge of the
Group’s net investment of a foreign operation.
These are recognized in other comprehensive
income until the net investment is disposed
of, at which time, the cumulative amount is
reclassified to profit or loss.
Tax charges and credits attributable to
exchange differences on those monetary items
are also recorded in other comprehensive
income.
Non-monetary items that are measured in
terms of historical cost in a foreign currency
are translated using the exchange rates at
the dates of the initial transactions. Non-
monetary items measured at fair value
in a foreign currency are translated using
the exchange rates at the date when the
fair value is determined. The gain or loss
arising on translation of non-monetary items
measured at fair value is treated in line with
the recognition of gain or loss on change in
fair value of the item (translation differences
on items whose fair value gain or loss is
recognized in other comprehensive income
or profit or loss are also recognized in other
comprehensive income or profit or loss,
respectively).
Any goodwill arising on the acquisition
of a foreign operation and any fair value
adjustments to the carrying amounts of
assets and liabilities arising on the acquisition
are treated as assets and liabilities of the
foreign operation and translated at the spot
rate of exchange at the reporting date.
g) Property, plant and equipmentConstruction in progress, property, plant and
equipment is stated at historical cost, net of
accumulated depreciation and accumulated
impairment. Depreciation is calculated on
the straight-line method to write off the cost
of each asset, or the recoverable amounts,
to their residual values over their estimated
useful life, taking into account the useful life of
the most important components.
Expenses for the decommissioning of the
Mundu Nobo plant are included in property,
plant and equipment. These capitalized
expenses are based upon estimations
performed by an independent expert. In
2013, the provision was adjusted internally
based on more accurate information gathered
regarding the decommission costs once the
demolition of the Mundu Nobo plant began.
Depreciation hereon is calculated by the
straight-line method to write off the cost of
each asset, or the recoverable amounts, to
their residual values over their estimated
useful life, taking into account the useful life of
the most important components.
50
Major spare parts are accounted for as property, plant and equipment when the Group expects to
use them during more than one period. Similarly, if the spare parts can be used only in connection
with an item of property, plant and equipment, they are accounted for as property, plant and
equipment.
The cost of work in progress comprises materials, direct labor (Aqualectra Distribution), service
charges and other costs.
An item of property, plant and equipment and any significant part initially recognized is
derecognized upon disposal or when no future economic benefits are expected from its use
or disposal. Any gain or loss arising on derecognition of the asset (calculated as the difference
between the net disposal proceeds and the carrying amount of the asset) is included in the income
statement when the asset is derecognized. The assets’ residual values, useful lives and methods
of depreciation are reviewed at each financial year end and adjusted prospectively, if appropriate.
h) Property, plant and equipment contributed by customersThe Group recognizes as property, plant and equipment any contribution received from its
customers to be utilized in the construction or acquisition of an item required for the connection to
its distribution network and/or asset transferred by its customers, also for the purpose of providing
the customer with ongoing access to supply of electricity and/or water. The corresponding amount
is credited to the cost of work in progress or is shown as deferred credit in case construction has
not yet started.
i) LeasesThe determination of whether an arrangement is (or contains) a lease is based on the substance
of the arrangement at the inception date. The arrangement is assessed for whether fulfilment of
the arrangement is dependent on the use of a specific asset or assets or whether the arrangement
conveys a right to use the asset or assets, even if that right is not explicitly specified in an
arrangement.
A lease is classified at the inception date as a finance lease or an operating lease. A lease that
transfers substantially all the risks and rewards incidental to ownership to the Group, is classified
as a finance lease. During 2014 and 2013, all leases were classified as operating leases. Operating
lease payments are recognized as an operating expense in the income statement on a straight-
line basis over the lease term.
j) Borrowing costsBorrowing costs directly attributable to the acquisition, construction or production of an asset,
that necessarily takes a substantial period of time to get ready for its intended use or sale, are
capitalized as part of the cost of the asset. All other borrowing costs are expensed in the period
they occur. Borrowing costs consist of interest and other costs that an entity incurs in connection
with the borrowing of funds.
k) Intangible assets
Licences
Separately acquired licences are shown at historical cost. Licences have a finite useful life and are
carried at cost less accumulated amortization and accumulated impairment losses. Amortization
is calculated using the straight-line method to allocate the cost of licences over their estimated
useful lives. The amortization period and the amortization method for an intangible asset with a
finite useful life are reviewed at least once at the end of each reporting period.
51
Changes in the expected useful life or the
expected pattern of consumption of future
economic benefits embodied in the asset are
considered to modify the amortization period
or method, as appropriate, and are treated
as changes in accounting estimates. The
amortization expense on intangible assets
with finite lives is recognized in the statement
of profit or loss in the expense category that is
consistent with the function of the intangible
assets.
Gains or losses arising from derecognition
of an intangible asset are measured as the
difference between the net disposal proceeds
and the carrying amount of the asset and are
recognized in the statement of profit or loss
when the asset is derecognized.
l) Impairment of non-financial assetsThe Group assesses at each reporting date,
whether there is an indication that the asset
may be impaired. If any indication exists, or
when annual impairment testing for an asset
is required, the Group estimates the asset’s
recoverable amount. An asset’s recoverable
amount is the higher of an asset’s or cash-
generating unit’s (CGU) fair value less costs
of disposal and its value in use. Recoverable
amount is determined for an individual asset,
unless the asset does not generate cash
inflows that are largely independent from
those from other assets or groups of assets.
When the carrying amount of an asset or CGU
exceeds its recoverable amount, the asset is
considered impaired and is written down to its
recoverable amount.
In assessing value in use, the estimated future
cash flows are discounted to their present
value using a pre-tax discount rate that
reflects current market assessments of the
time value of money and the risks specific to
the asset. In determining fair value less costs
of disposal, recent market transactions are
taken into account. If no such transactions can
be identified, an appropriate valuation model
is used. These calculations are corroborated
by valuation multiples, quoted share prices for
publicly traded companies or other available
fair value indicators.
The Group bases its impairment calculation
on detailed budgets and forecast calculations,
which are prepared separately for each of the
Group’s CGU to which the individual assets
are allocated. These budget and forecast
calculations generally cover a period of five
years. For longer periods, a long-term growth
rate is calculated and applied to project future
cash flows after the fifth year.
Impairment losses of continuing operations,
including impairment on inventories, are
recognized in the income statement in
expense categories consistent with the
function of the impaired asset.
An assessment is made at each reporting
date as to whether there is any indication
that previously recognized impairment losses
may no longer exist or may have decreased.
If such indication exists, the Group estimates
the asset’s CGUs recoverable amount. A
previously recognized impairment loss is
reversed only if there has been a change
in the assumptions used to determine the
asset’s recoverable amount since the last
impairment loss was recognized.
The reversal is limited so that the carrying
amount of the asset does not exceed its
recoverable amount, not exceed the carrying
amount that would have been determined,
net of depreciation, had no impairment loss
been recognized for the asset in prior years.
Such reversal is recognized in the income
statement unless the asset is carried at
a revaluated amount, in which case, the
reversal is treated as a revaluation increase.
m) Financial instrumentsA financial instrument is any contract that
gives rise to a financial asset of one entity
and a financial liability or equity instrument of
another entity.
Financial assets and liabilities are offset and
the net amount presented in the statement of
financial position when, and only when, the
Group has a legal right to offset the amounts
and intends either to settle on a net basis
or to realize the asset and settle the liability
simultaneously.
52
Financial assets
The group classifies its financial assets in
the following categories: at fair value through
profit or loss, loans and receivables, held-to-
maturity investments and available for sale
financial assets. The classification depends
on the purpose for which the financial assets
were acquired. Management determines the
classification of its financial assets at initial
recognition. The group only holds financial
assets categorized as loans and receivables
as at December 31, 2014 and 2013.
All financial assets are recognized initially at
fair value plus transaction cost, except in the
case of financial assets recorded at fair value
through profit or loss.
Loans and receivables
Loans and receivables are non-derivative
financial assets with fixed or determinable
payments that are not quoted in an active
market. Loans and receivable comprise trade
accounts receivable, other receivables, cash
and cash equivalents and other non-current
financial assets. After initial measurement,
such financial assets are subsequently
measured at amortized cost using the effective
interest rate (EIR) method, less impairment.
The losses arising from impairment are
recognized in the statement of profit or loss.
The Group derecognizes a financial asset
when the contractual rights to the cash
flows from the asset expire, or it transfers
the rights to receive the contractual cash
flows on the financial asset in a transaction
in which substantially all the risks and
rewards of ownership of the financial asset
are transferred. Any interest in transferred
financial assets that is created or retained by
the Group, is recognized as a separate asset
or liability.
Impairment of financial assets carried at
amortized cost
A provision for impairment of financial assets is
established when there is objective evidence
that the Group will not be able to collect all
amounts due according to the original terms
of the financial asset. Significant financial
difficulties of the debtor, probability that the
debtor will enter bankruptcy or financial
reorganization and default or delinquency in
payments are considered indicators that the
financial asset is impaired. The amount of
the provision is the difference between the
asset’s carrying amount and the estimated
future cash flows. The carrying amount
of the asset is reduced through the use of
an allowance account and the amount of
the loss is recognized in the consolidated
statement of comprehensive income. When a
financial asset is uncollectible, it is written off
against the allowance account. Subsequent
recoveries of amounts previously written off
are credited in the consolidated statement of
comprehensive income.
Financial liabilities
Financial liabilities are classified, at initial
recognition, as financial liabilities at fair value
through profit or loss, loans and borrowings,
payables, or as derivatives designated as
hedging instruments in an effective hedge,
as appropriate. All financial liabilities are
recognized initially at fair value and, in the
case of loans and borrowings and payables,
net of directly attributable transaction costs.
The Group’s financial liabilities include trade
and other payables and loans and borrowings
including bank overdrafts.
Loans and borrowings
After initial recognition, interest-bearing loans
and borrowings are subsequently measured
at amortized cost using the EIR method.
Gains and losses are recognized in profit or
loss when the liabilities are derecognized
as well as through the EIR amortization
process. Amortized cost is calculated by
taking into account any discount or premium
on acquisition and fees or costs that are an
integral part of the EIR. The EIR amortization
is included as finance costs in the statement
of profit or loss.
The Group derecognizes a financial liability
when its contractual obligations are
discharged, cancelled or expire.
53
n) InventoriesInventories are stated at the lower of cost or net realizable value (the estimated selling price in
the ordinary course of business). The cost is determined by using the weighted average cost.
The cost of finished goods and work in progress comprises cost of direct materials, direct labor,
other direct costs and related production overheads (based on normal operating capacity) and it
excludes borrowing costs. The cost of fuel inventory is determined by using the first-in, first-out
(FIFO) method.
o) Cash position (includes “Cash and cash equivalents” and “Bank overdraft”)Cash and cash equivalents comprize cash on hand, deposits held at call with banks, other short-
term highly liquid investments and bank overdrafts. In the statement of financial position, bank
overdrafts are included in borrowings under the current liabilities.
p) Share capitalCommon shares and preferred shares are classified as equity. Dividends on common shares and
preferred shares are recognized in equity in the period in which they are declared.
q) Treasury sharesOwn equity instruments that are reacquired (treasury shares) are recognized at cost and
deducted from equity. No gain or loss is recognized in profit or loss on the purchase, sale, issue or
cancellation of the Group’s own equity instruments. Any difference between the carrying amount
and the consideration, if reissued, is recognized in share premium.
r) ProvisionsProvisions are recognized when the Group has a present legal or constructive obligation as
a result of past events. Furthermore, it should be probable that an outflow of resources will be
required to settle the obligation and a reliable estimate of the amount can be made. Provisions are
determined, unless otherwise stated, by discounting the expected future cash flows at a pre-tax
rate that reflects current market assessments of the time value of money and the risks specific to
the liability. The unwinding of the discount is recognized as finance cost.
• OnerouscontractsA provision for onerous contracts is recognized when the expected benefits to be derived by
the Group from a contract are lower than the unavoidable cost of meeting its obligations under
the contract. The provision is measured at the present value of the lower of the expected cost
of terminating the contract and the expected net cost of continuing with the contract. Before a
provision is established, the Group recognizes any impairment loss on the assets associated with
that contract.
• ProvisionfordecommissioningofMunduNoboThe Group records a provision for decommissioning costs of the Mundu Nobo plant which consists
of the costs for the demolition of buildings, civil works and installations, including the costs of
removal and eventual processing of the residuals. Decommissioning costs are provided at the
expected costs to settle the obligation and are recognized as part of the cost of particular asset. The
unwinding of the discount is expensed as incurred and recognized in the consolidated statement
of comprehensive income as finance cost. The estimated future costs of decommissioning are
reviewed annually and adjusted as appropriate. In the intervening years, the value is increased
with accrued interest and any changes in the estimated future costs added to or deducted from
the cost of the asset.
54
• EmployeebenefitsCertain employee benefit provisions, except for the provision for vacation leave, are based
on actuarial calculations. For the principal actuarial assumptions please see note 5.5.13.1. The
independent and qualified actuary obtained sufficient information in order to perform the valuations.
Pension plans
All the pension plans within the Group are defined benefit plans. The pension accounting costs
are assessed using the projected unit credit method. Under this method, the cost of providing
pension is charged to the statement of comprehensive income so as to spread the regular cost
over the service lives of employees in accordance with the advice of qualified actuaries who
carried out a full valuation of the plans. The pension obligation is measured as the present value
of the estimated future cash outflows using interest rates of government securities, which have
terms of approximately the terms of the related liability. Any unrecognized past service costs and
the fair value of any plan assets are deducted.
Actuarial gains and losses are immediately recognized in the period in which they occur through
the statement of other comprehensive income.
APC Pension plan
Certain employees of the Group (ex-civil servants) participate partially in a pension plan
administered by Algemeen Pensioenfonds van Curacao (APC). The pension plan administered by
APC is a multi-employer defined benefit plan giving right to the participant to a pension calculated
as a fixed percentage of the average salaries of the last two years of service taking into account a
franchise. At reporting date there was no information available to use benefit accounting. Therefore
the plan is accounted for as if it were a defined contribution plan where the Group’s share in the
contribution amount is recognized as an expense.
APC Supplementary pension (‘Duurtetoeslag’)
In 1943 the Government guaranteed civil servants a pension that amounts to up to 70% of their
average salary received during 24 months before their retirement. The supplementary pension
(the so called ‘Duurtetoeslag’) is the difference between the guaranteed pension amount and the
pension actually built-up as per the APC pension agreement. By National Decree of July 12, 1995
it was stipulated that the legal entity that ultimately employs the person concerned is responsible
for payment of the supplementary pension. This plan is unfunded.
VIDANOVA pension plan
The employees of the Group who do not participate in the APC pension plan, participate in a
multi-employer defined benefit plan (VIDANOVA) in which it is compulsory for all employees to
participate if and when they comply with all applicable conditions. The pension plan is generally
funded by payments from employees and by the employers taking into account recommendations
of independent qualified actuaries. A level premium contribution is charged as an advance for the
defined benefit plans.
The advance contributions for this plan are based on a percentage of the pension base. The funded
status of the pension plan is actuarially calculated on a periodic basis, in accordance with IAS 19
and could result in a surplus.
Regarding the active members of the plan, sufficient information is available to account for
the Companies’ proportionate share of the defined benefit obligation, plan assets and post-
employment benefit costs. The obligations towards retired staff are fully funded by the pension
fund and no costs are charged to the Group.
55
Based on the Group’s interpretation of the
pension agreement and the related financing
agreement, there are no future economic
benefits resulting from the funded assets in
the form of a reduction in future contributions
or a cash refund. Therefore no assets have
been recognized in the statement of financial
position.
APC Early retirement benefit (‘VUT’)
In the National Ordinance of December 27,
1995 it is stipulated that civil servants have
the option of filing a request with the Governor
to retire from service at the age of 55. The
resulting liability due to early retirement of
persons for the period in which these early
retired persons are between the age of 55 and
60 years will be borne by the last legal entity
that employed the respective persons.
Aqualectra VUT
According to the collective labor agreements
of Aqualectra Distribution and Aqualectra
Production, employees have the option of
requesting early retirement to the BMD.
The BMD decides whether the employee’s
request will be honored. In such a case, the
resulting obligation will be accounted for as a
liability in the Group’s statement of financial
position.
Other long-term employee benefits
The Group’s net obligation in respect of long-
term employee benefits other than pension
plans is the amount of future benefit that
employees have earned in return for their
service in thecurrent andpriorperiods; that
benefit is discounted to determine its present
value, and the fair value of any related assets
is deducted. The calculation is performed
using the projected unit credit method. Any
actuarial gains and losses are recognized in
the consolidated statement of comprehensive
income in the period in which they arise.
Anniversary bonus
According to the collective labor agreements
of Aqualectra Distribution and Aqualectra
Production, employees are entitled to an
anniversary bonus linked to the amount of
years of service.
Medical costs retired employees
Through July 31, 2014 both the active
employees and the Group contributed 2% of
the total gross salary as compensation for the
medical costs of retired employees. Retired
personnel contribute 2% of their pension.
In accordance with the collective labor
agreements of Aqualectra Distribution and
Aqualectra Production, retired employees
are compensated to a certain extent for their
medical costs.
Effective August 1, 2014, with the
implementation of the basic health-care
insurance (BVZ), changes were made to the
health coverage plan for retired personnel.
Active employees no longer contribute
the 2% and to partially compensate the
retired employees for the additional costs
of BVZ, Aqualectra contributes 3% of the
retired employee’s pension to the “Sociale
Verzekerings Bank” (SVB).
s) Revenue recognitionRevenue represents the income from the
supply of goods and services relating to the
generation, distribution and supply of energy
and water, less discounts and transactions
within the Group. Sales are recognized
upon delivery of products and customer
acceptance, if any or on the performance
of services. The revenue from respectively
the generation and supply of energy and
the production and distribution of water is
measured on a monthly basis. The revenue is
based on the customer’s monthly usage and
applicable tariffs.
56
The usage is based on monthly meter
readings spread over the cycles. The cycles
have a 25 to 30 days consumption period
which may differ from a monthly calendar.
Due to the aforementioned, a part of the
monthly revenue is accrued and reported as
still to be invoiced.
The revenue from Pagatinu electricity is
accounted for at the sales moment.
t) Interest income and expensesInterest income is recognized as it accrues
in profit or loss, using the effective interest
method. Dividend income is recognized in
the consolidated statement of comprehensive
income on the date that the Group’s right to
receive payment is established.
Interest expenses consist of interest on
borrowings and interest on the bonds. The
expenses are recognized in the profit and loss
in the period to which they relate.
Borrowing costs that are not directly
attributable to the acquisition, construction
or production of a qualifying asset are
recognized in the consolidated statement of
comprehensive income as interest expenses
by using the effective interest method.
u) Taxes
Current income tax
Current income tax assets and liabilities for the
current period are measured at the amount
expected to be recovered from or paid to the
taxation authorities. The tax rates and tax
laws used to compute the amount are those
that are enacted or substantially enacted, at
the reporting date. Management periodically
evaluates positions taken in tax returns with
respect to situations in which applicable
tax regulation is subject to interpretation. It
establishes provisions where appropriate on
the basis of amounts expected to be paid to
the tax authorities.
Deferred tax
Deferred tax is provided in full, using the
liability method, on temporary differences
arising between the tax bases of assets and
liabilities and their carrying amounts in the
Consolidated Financial Statements. However,
deferred tax liabilities are not recognized if they
arise from the initial recognition of goodwill;
deferred income tax is not accounted for if it
arises from initial recognition of an asset or
liability in a transaction other than a business
combination that at the time of the transaction
affects neither accounting nor taxable profit or
loss.
The principal temporary differences arise
from depreciation on property, plant and
equipment and tax losses carried forward.
Deferred tax is measured at the tax rates that
are expected to apply in the year when the
asset is realized or the liability is settled, based
on tax rates (and tax laws) that have been
enacted or substantially enacted at reporting
date. The carrying amount of deferred tax
assets is reviewed at each reporting date and
is recognized to the extent that it is probable
that future taxable profit will be available
against which the unused tax losses can be
utilized.
Deferred income tax assets are recognized
only to the extent that it is probable that future
taxable profit will be available against which
the temporary differences can be utilised.
Deferred tax assets and liabilities are offset
if there is a legally enforceable right to offset
current tax liabilities and assets, and they
relate to income taxes charged by the same
tax authority on the same taxable entity, or
on different tax entities, but they intend to
settle current tax liabilities and assets on a net
basis or their tax assets and liabilities will be
realized simultaneously.
57
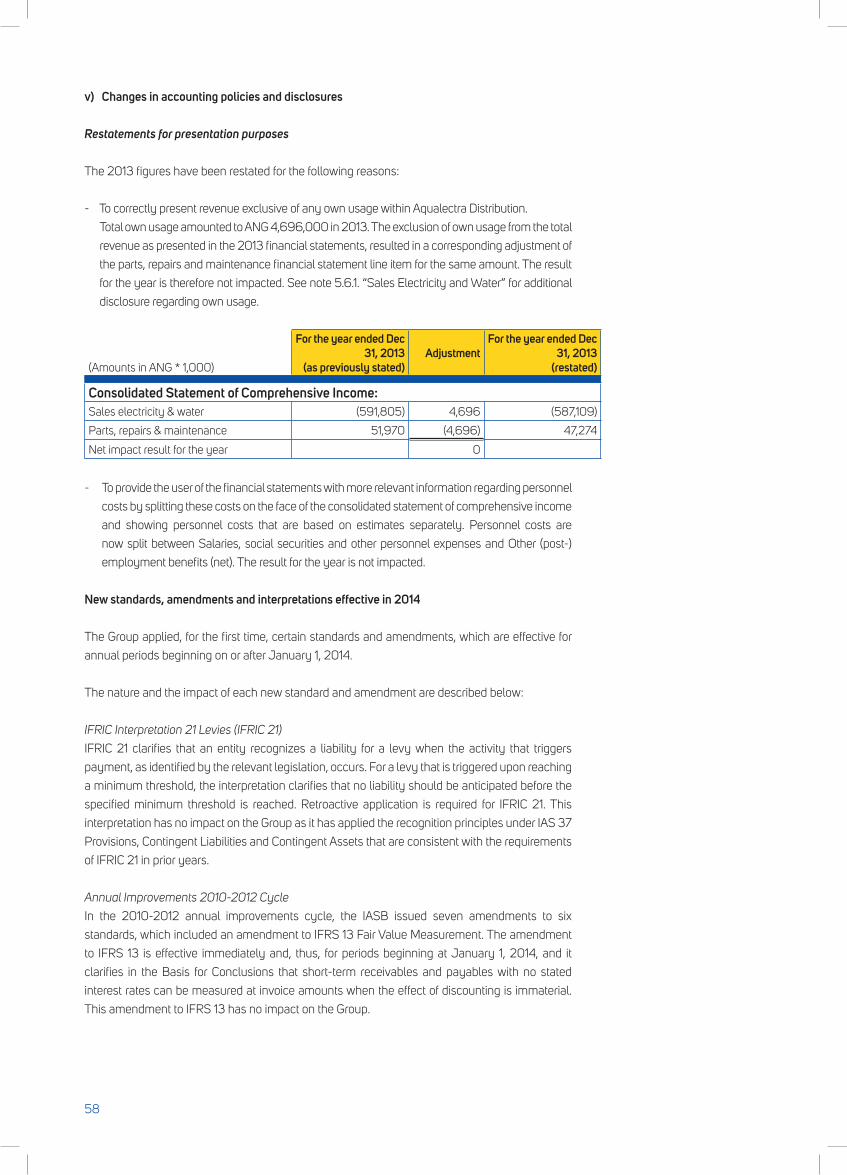
v) Changes in accounting policies and disclosures
Restatements for presentation purposes
The 2013 figures have been restated for the following reasons:
- To correctly present revenue exclusive of any own usage within Aqualectra Distribution.
Total own usage amounted to ANG 4,696,000 in 2013. The exclusion of own usage from the total
revenue as presented in the 2013 financial statements, resulted in a corresponding adjustment of
the parts, repairs and maintenance financial statement line item for the same amount. The result
for the year is therefore not impacted. See note 5.6.1. “Sales Electricity and Water” for additional
disclosure regarding own usage.
(Amounts in ANG * 1,000)
For the year ended Dec 31, 2013
(as previously stated)Adjustment
For the year ended Dec 31, 2013
(restated)
Consolidated Statement of Comprehensive Income:Sales electricity & water (591,805) 4,696 (587,109)
Parts, repairs & maintenance 51,970 (4,696) 47,274
Net impact result for the year 0
- To provide the user of the financial statements with more relevant information regarding personnel
costs by splitting these costs on the face of the consolidated statement of comprehensive income
and showing personnel costs that are based on estimates separately. Personnel costs are
now split between Salaries, social securities and other personnel expenses and Other (post-)
employment benefits (net). The result for the year is not impacted.
New standards, amendments and interpretations effective in 2014
The Group applied, for the first time, certain standards and amendments, which are effective for
annual periods beginning on or after January 1, 2014.
The nature and the impact of each new standard and amendment are described below:
IFRIC Interpretation 21 Levies (IFRIC 21)
IFRIC 21 clarifies that an entity recognizes a liability for a levy when the activity that triggers
payment, as identified by the relevant legislation, occurs. For a levy that is triggered upon reaching
a minimum threshold, the interpretation clarifies that no liability should be anticipated before the
specified minimum threshold is reached. Retroactive application is required for IFRIC 21. This
interpretation has no impact on the Group as it has applied the recognition principles under IAS 37
Provisions, Contingent Liabilities and Contingent Assets that are consistent with the requirements
of IFRIC 21 in prior years.
Annual Improvements 2010-2012 Cycle
In the 2010-2012 annual improvements cycle, the IASB issued seven amendments to six
standards, which included an amendment to IFRS 13 Fair Value Measurement. The amendment
to IFRS 13 is effective immediately and, thus, for periods beginning at January 1, 2014, and it
clarifies in the Basis for Conclusions that short-term receivables and payables with no stated
interest rates can be measured at invoice amounts when the effect of discounting is immaterial.
This amendment to IFRS 13 has no impact on the Group.
58
Standards issued but not yet effective Standards issued but not yet effective up to
the date of issuance of the Group’s financial
statements are listed below. This listing of
standards and interpretations issued, are
those that the Group reasonably expects
will have an impact on disclosures, financial
position or performance when applied at a
future date. The Group intends to adopt these
standards when they become effective.
IFRS 9 Financial InstrumentsIn July 2014, the IASB issued the final version
of IFRS 9 Financial Instruments which
reflects all phases of the financial instruments
project and replaces IAS 39 Financial
Instruments: Recognition and Measurement
and all previous versions of IFRS 9. The
standard introduces new requirements for
classification and measurement, impairment,
and hedge accounting. IFRS 9 is effective
for annual periods beginning on or after
January 1, 2018, with earlier application
permitted. Retroactive application is
required, but comparative information is not
compulsory. Early application of previous
versions of IFRS 9 (2009, 2010 and 2013)
is permitted if the date of initial application
is before February 1, 2015. The adoption
of IFRS 9 is expected to have an effect on
the classification and measurement of the
Group’s financial assets, but no impact on
the classification and measurement of the
Group’s financial liabilities.
Amendments to IAS 19 Defined Benefit Plans: Employee ContributionsIAS 19 requires an entity to consider
contributions from employees or third
parties when accounting for defined benefit
plans. Where the contributions are linked to
service, they should be attributed to periods
of service as a negative benefit. These
amendments clarify that, if the amount of the
contributions is independent from the number
of years of service, an entity is permitted to
recognize such contributions as a reduction
in the service cost in the period in which the
service is rendered, instead of allocating the
contributions to the periods of service. This
amendment is effective for annual periods
beginning on or after July 1, 2014. The Group
is currently assessing the full impact of these
amendments.
IFRS 15 Revenue from Contracts with CustomersIFRS 15 was issued in May 2014 and
establishes a new five-step model that will
apply to revenue arising from contracts
with customers. Under IFRS 15 revenue is
recognized at an amount that reflects the
consideration to which an entity expects to
be entitled in exchange for transferring goods
or services to a customer. The principles in
IFRS 15 provide a more structured approach
to measuring and recognizing revenue. The
new revenue standard is applicable to all
entities and will supersede all current revenue
recognition requirements under IFRS. Either
a full or a modified retroactive application is
required for annual periods beginning on or
after January 1, 2017 with earlier adoption
permitted. The Group is currently assessing
the impact of IFRS 15 and plans to adopt the
new standard on the required effective date.
59
5.3. Significant accounting judgments, estimates and assumptions
The preparation of financial statements in conformity with IFRS requires the use of estimates and
assumptions that affect the reported amounts of revenue, expenses, assets and liabilities and the
accompanying disclosures and the disclosure of contingent assets and liabilities. Uncertainty about
these assumptions and estimates could result in outcomes that require a material adjustment to
the carrying amount of assets or liabilities affected in future periods.
Critical accounting estimates and judgmentsThe Group applies estimates and judgments which are based on historical experience and on
other factors including expectations of future events that are considered reasonable under the
circumstances. The Group’s critical accounting estimates and assumptions and critical judgments
in applying the entity’s accounting policies are discussed in this paragraph.
a. Critical accounting estimates and assumptionsThe Group makes estimates and assumptions concerning the future. The resulting accounting
estimates will, by definition, seldom equal the related actual results. The estimates and
assumptions that have a significant risk of causing a material adjustment to the carrying amounts
of assets and liabilities within the next financial year are discussed below.
Provision for bad debts
Trade debtors are valued at the actual billing amounts for electricity and water. Other receivables
are valued at the billed amounts. A provision has been made for doubtful debts. In the calculation of
the amounts to be provided for, assumptions based on historical experience concerning amounts
that are not being received within a certain period of time are made. If the realized amounts
receivable turn out to be more impaired than expected, an additional amount for provision bad
debts will be recorded.
Provision employee benefits
The present value of the defined benefit obligations depends on a number of factors that are
determined on an actuarial basis using a number of assumptions. The assumptions used in
determining the net cost (income) include the discount rate. Any changes in these assumptions will
impact the carrying amount of defined benefit obligations. The Group determines the appropriate
discount rate at the end of each year. This is the interest rate that should be used to determine the
present value of estimated future cash outflows expected to be required to settle the obligations. In
determining the appropriate discount rate, the Group considers the interest rates of “high quality”
government bonds that are denominated in the currency in which the benefits will be paid, and
that have terms to maturity approximating the terms of the related pension liability.
Also a critical assumption used for the calculation of the provision Future Medical Expenses, is the
indexation rate. The indexation rate represents the expected inflation rate corrected for a medical
technology index. Changes in the indexation rate can have material effects on the provision as is
shown in the sensitivity analysis in note 5.5.13.1.
Other key assumptions for obligations are based in part on current market conditions. Additional
information is disclosed in note 5.5.13.1.
60
Provision decommissioning The provision for the Mundu Nobo premises consists of the costs for the demolition of buildings, civil
works and installations, including the costs of removal and eventual processing of the residuals.
The provision as of December 31, 2014 and 2013 is based on actual costs incurred during 2014
and 2013, external quotations and internal estimates.
Cumulative tax losses to be compensated with future taxable profits
The deferred tax assets of the Group are mainly attributable to cumulative tax losses for which it is
probable that future taxable profit will be available to be utilized against these.
The tax losses will expire in a period of ten years, beginning the year in which the fiscal loss
was incurred. The estimation of the future taxable profits that can be utilized against these tax
losses is based on Management’s income forecast. The income forecast of the Group is based on
assumptions with regard to market developments of electricity and water, fuel costs, demographic
movements, the level of electricity and water tariffs, etc. Significant changes in these assumptions
may have a significant impact on the extent to which the past taxable losses can be utilized.
b. Critical judgments in applying the entity’s accounting policiesImpairment test Property, Plant and Equipment
The Group performs yearly an impairment test on its property, plant and equipment. In order to
assess the fair value of the property, plant and equipment, the present value of future generated
cash flows (recoverable value of the assets) are calculated. To calculate the future generated cash
flows, assumptions and judgments are made with regard to future profits, investments, interest
rates and the capitalization rate based on the available information about the business and also
the technological and operational outlook. Significant changes in these assumptions may have
a significant impact on the present value of future generated cash flows and therefore on the fair
value of the property, plant and equipment. For more details including assumptions, see note 5.5.2.
5.4. Financial risk management
The Group’s activities expose it to a variety of financial risks: market risks (including the effects
of foreign exchange risk, interest rate risk and tariff risk), credit risk and liquidity risk. The Group’s
overall risk management is aimed at minimizing the potential adverse effects of these risks on the
financial performance of the Group.
The BSD has overall responsibility for the establishment and oversight of the Group’s risk
management framework. A Risk Management Committee has been established, which is
responsible for developing and monitoring the Group’s risk management policies. The Group’s risk
management policies were established to identify and analyze the risks faced by the Group, to set
appropriate risk limits and controls, and to monitor risks and adherence to limits. During 2014 the
Risk Management Committee did not engage in risk monitoring activities.
The Group Audit Committee oversees how Management monitors compliance with the Group’s
risk management policies and procedures, and reviews the adequacy of the risk management
framework in relation to the risks faced by the Group. The Group Audit Committee is assisted in its
oversight role by Internal Audit. Internal Audit undertakes both regular and ad hoc reviews of risk
management controls and procedures, the results of which are reported to the Audit Committee.
During 2013 the Group Audit Committee was not functional. Various tasks assigned to the Group
Audit Committee were fulfilled by the BSD.
61
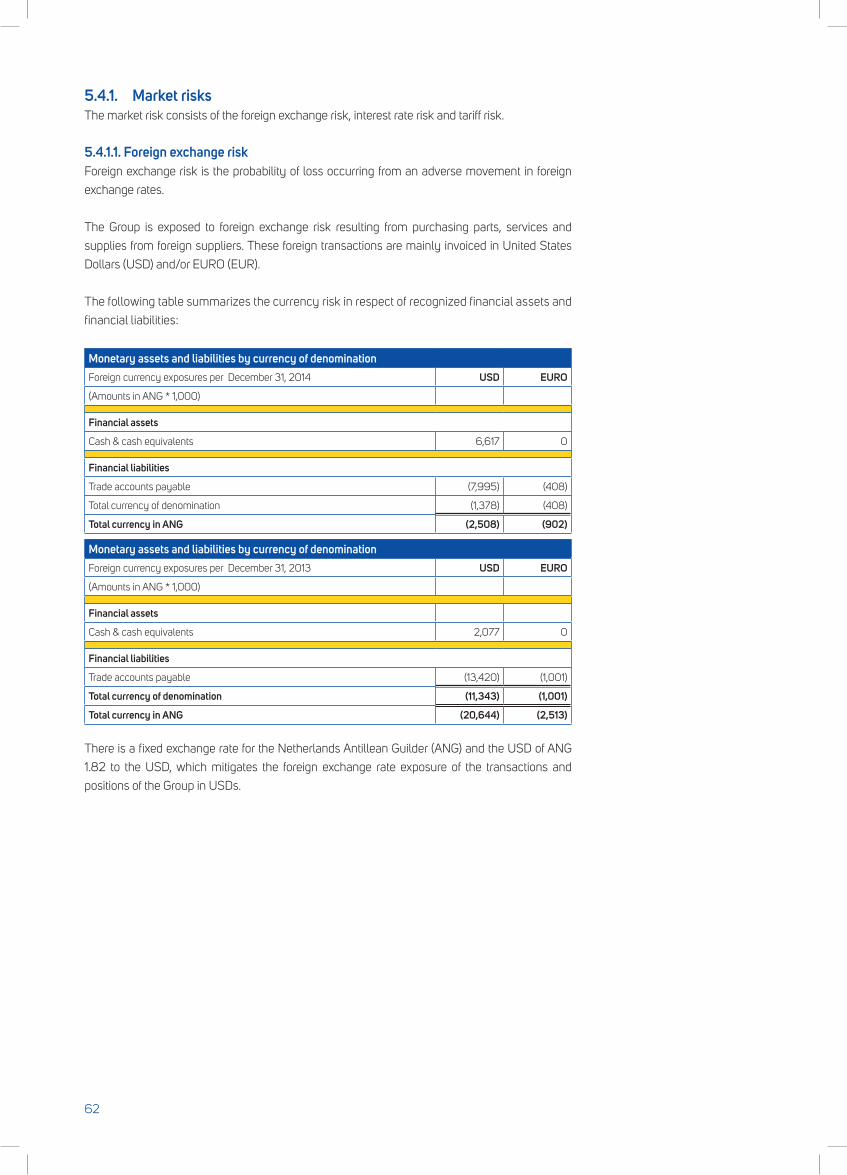
5.4.1. Market risksThe market risk consists of the foreign exchange risk, interest rate risk and tariff risk.
5.4.1.1. Foreign exchange riskForeign exchange risk is the probability of loss occurring from an adverse movement in foreign
exchange rates.
The Group is exposed to foreign exchange risk resulting from purchasing parts, services and
supplies from foreign suppliers. These foreign transactions are mainly invoiced in United States
Dollars (USD) and/or EURO (EUR).
The following table summarizes the currency risk in respect of recognized financial assets and
financial liabilities:
Monetary assets and liabilities by currency of denominationForeign currency exposures per December 31, 2014 USD EURO
(Amounts in ANG * 1,000)
Financial assets
Cash & cash equivalents 6,617 0
Financial liabilities
Trade accounts payable (7,995) (408)
Total currency of denomination (1,378) (408)
Total currency in ANG (2,508) (902)
Monetary assets and liabilities by currency of denominationForeign currency exposures per December 31, 2013 USD EURO
(Amounts in ANG * 1,000)
Financial assets
Cash & cash equivalents 2,077 0
Financial liabilities
Trade accounts payable (13,420) (1,001)
Total currency of denomination (11,343) (1,001)
Total currency in ANG (20,644) (2,513)
There is a fixed exchange rate for the Netherlands Antillean Guilder (ANG) and the USD of ANG
1.82 to the USD, which mitigates the foreign exchange rate exposure of the transactions and
positions of the Group in USDs.
62
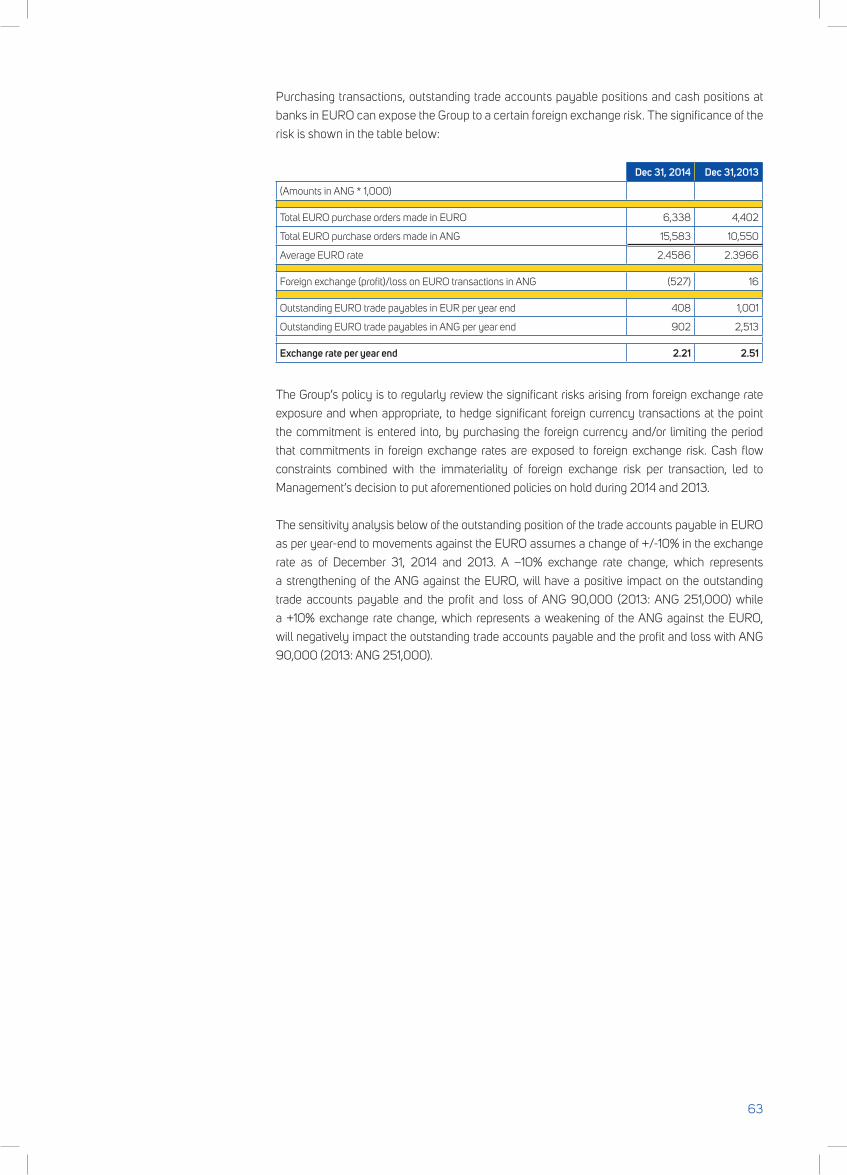
Purchasing transactions, outstanding trade accounts payable positions and cash positions at
banks in EURO can expose the Group to a certain foreign exchange risk. The significance of the
risk is shown in the table below:
Dec 31, 2014 Dec 31,2013
(Amounts in ANG * 1,000)
Total EURO purchase orders made in EURO 6,338 4,402
Total EURO purchase orders made in ANG 15,583 10,550
Average EURO rate 2.4586 2.3966
Foreign exchange (profit)/loss on EURO transactions in ANG (527) 16
Outstanding EURO trade payables in EUR per year end 408 1,001
Outstanding EURO trade payables in ANG per year end 902 2,513
Exchange rate per year end 2.21 2.51
The Group’s policy is to regularly review the significant risks arising from foreign exchange rate
exposure and when appropriate, to hedge significant foreign currency transactions at the point
the commitment is entered into, by purchasing the foreign currency and/or limiting the period
that commitments in foreign exchange rates are exposed to foreign exchange risk. Cash flow
constraints combined with the immateriality of foreign exchange risk per transaction, led to
Management’s decision to put aforementioned policies on hold during 2014 and 2013.
The sensitivity analysis below of the outstanding position of the trade accounts payable in EURO
as per year-end to movements against the EURO assumes a change of +/-10% in the exchange
rate as of December 31, 2014 and 2013. A –10% exchange rate change, which represents
a strengthening of the ANG against the EURO, will have a positive impact on the outstanding
trade accounts payable and the profit and loss of ANG 90,000 (2013: ANG 251,000) while
a +10% exchange rate change, which represents a weakening of the ANG against the EURO,
will negatively impact the outstanding trade accounts payable and the profit and loss with ANG
90,000 (2013: ANG 251,000).
63
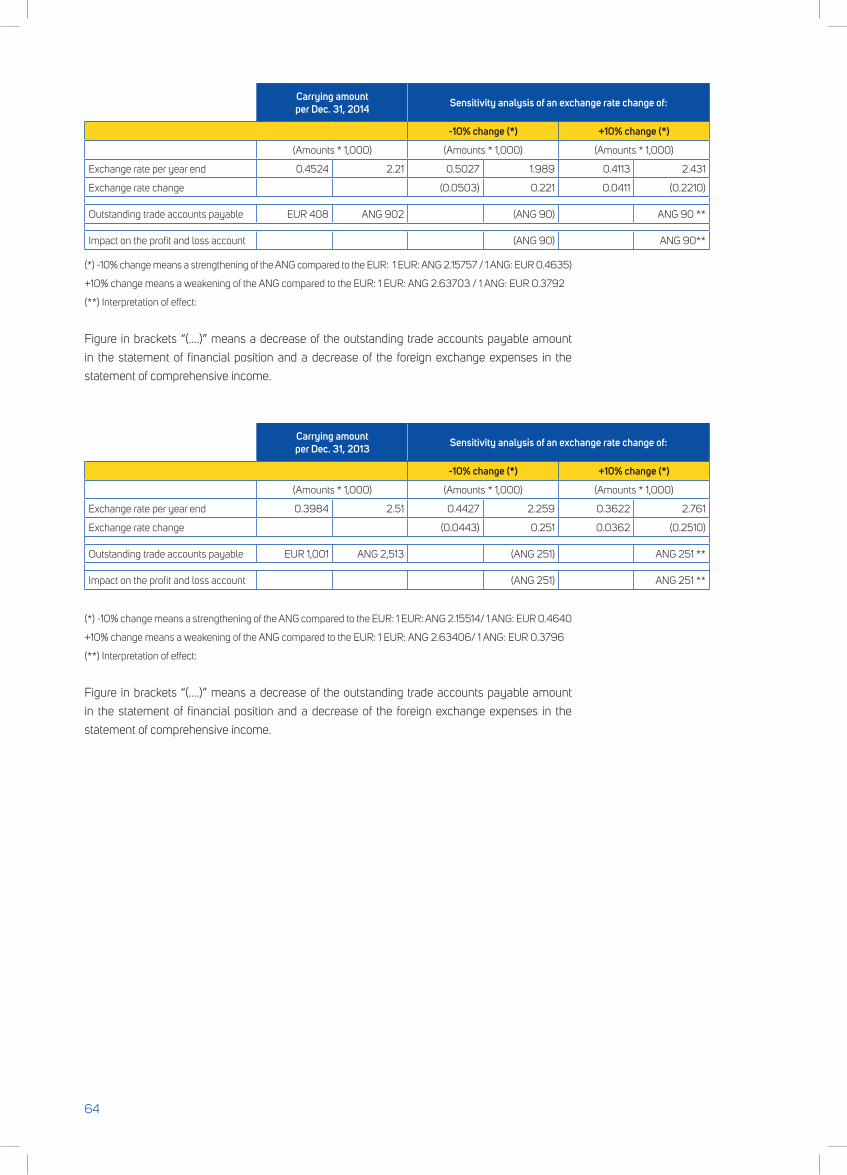
Carrying amount per Dec. 31, 2014 Sensitivity analysis of an exchange rate change of:
-10% change (*) +10% change (*)
(Amounts * 1,000) (Amounts * 1,000) (Amounts * 1,000)
Exchange rate per year end 0.4524 2.21 0.5027 1.989 0.4113 2.431
Exchange rate change (0.0503) 0.221 0.0411 (0.2210)
Outstanding trade accounts payable EUR 408 ANG 902 (ANG 90) ANG 90 **
Impact on the profit and loss account (ANG 90) ANG 90**
(*) -10% change means a strengthening of the ANG compared to the EUR: 1 EUR: ANG 2.15757 / 1 ANG: EUR 0.4635)
+10% change means a weakening of the ANG compared to the EUR: 1 EUR: ANG 2.63703 / 1 ANG: EUR 0.3792
(**) Interpretation of effect:
Figure in brackets “(….)” means a decrease of the outstanding trade accounts payable amount
in the statement of financial position and a decrease of the foreign exchange expenses in the
statement of comprehensive income.
Carrying amount per Dec. 31, 2013 Sensitivity analysis of an exchange rate change of:
-10% change (*) +10% change (*)
(Amounts * 1,000) (Amounts * 1,000) (Amounts * 1,000)
Exchange rate per year end 0.3984 2.51 0.4427 2.259 0.3622 2.761
Exchange rate change (0.0443) 0.251 0.0362 (0.2510)
Outstanding trade accounts payable EUR 1,001 ANG 2,513 (ANG 251) ANG 251 **
Impact on the profit and loss account (ANG 251) ANG 251 **
(*) -10% change means a strengthening of the ANG compared to the EUR: 1 EUR: ANG 2.15514/ 1 ANG: EUR 0.4640
+10% change means a weakening of the ANG compared to the EUR: 1 EUR: ANG 2.63406/ 1 ANG: EUR 0.3796
(**) Interpretation of effect:
Figure in brackets “(….)” means a decrease of the outstanding trade accounts payable amount
in the statement of financial position and a decrease of the foreign exchange expenses in the
statement of comprehensive income.
64
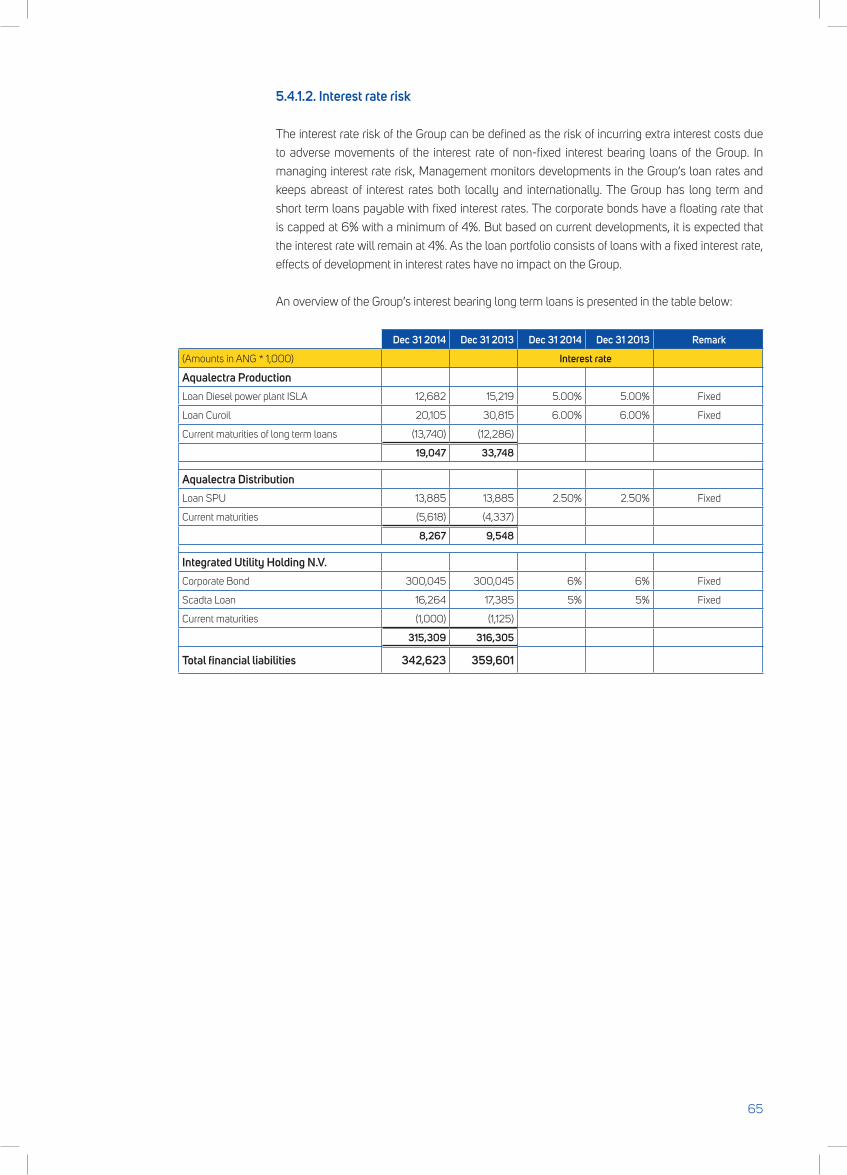
5.4.1.2. Interest rate risk
The interest rate risk of the Group can be defined as the risk of incurring extra interest costs due
to adverse movements of the interest rate of non-fixed interest bearing loans of the Group. In
managing interest rate risk, Management monitors developments in the Group’s loan rates and
keeps abreast of interest rates both locally and internationally. The Group has long term and
short term loans payable with fixed interest rates. The corporate bonds have a floating rate that
is capped at 6% with a minimum of 4%. But based on current developments, it is expected that
the interest rate will remain at 4%. As the loan portfolio consists of loans with a fixed interest rate,
effects of development in interest rates have no impact on the Group.
An overview of the Group’s interest bearing long term loans is presented in the table below:
Dec 31 2014 Dec 31 2013 Dec 31 2014 Dec 31 2013 Remark
(Amounts in ANG * 1,000) Interest rate
Aqualectra ProductionLoan Diesel power plant ISLA 12,682 15,219 5.00% 5.00% Fixed
Loan Curoil 20,105 30,815 6.00% 6.00% Fixed
Current maturities of long term loans (13,740) (12,286)
19,047 33,748
Aqualectra DistributionLoan SPU 13,885 13,885 2.50% 2.50% Fixed
Current maturities (5,618) (4,337)
8,267 9,548
Integrated Utility Holding N.V.
Corporate Bond 300,045 300,045 6% 6% Fixed
Scadta Loan 16,264 17,385 5% 5% Fixed
Current maturities (1,000) (1,125)
315,309 316,305
Total financial liabilities 342,623 359,601
65
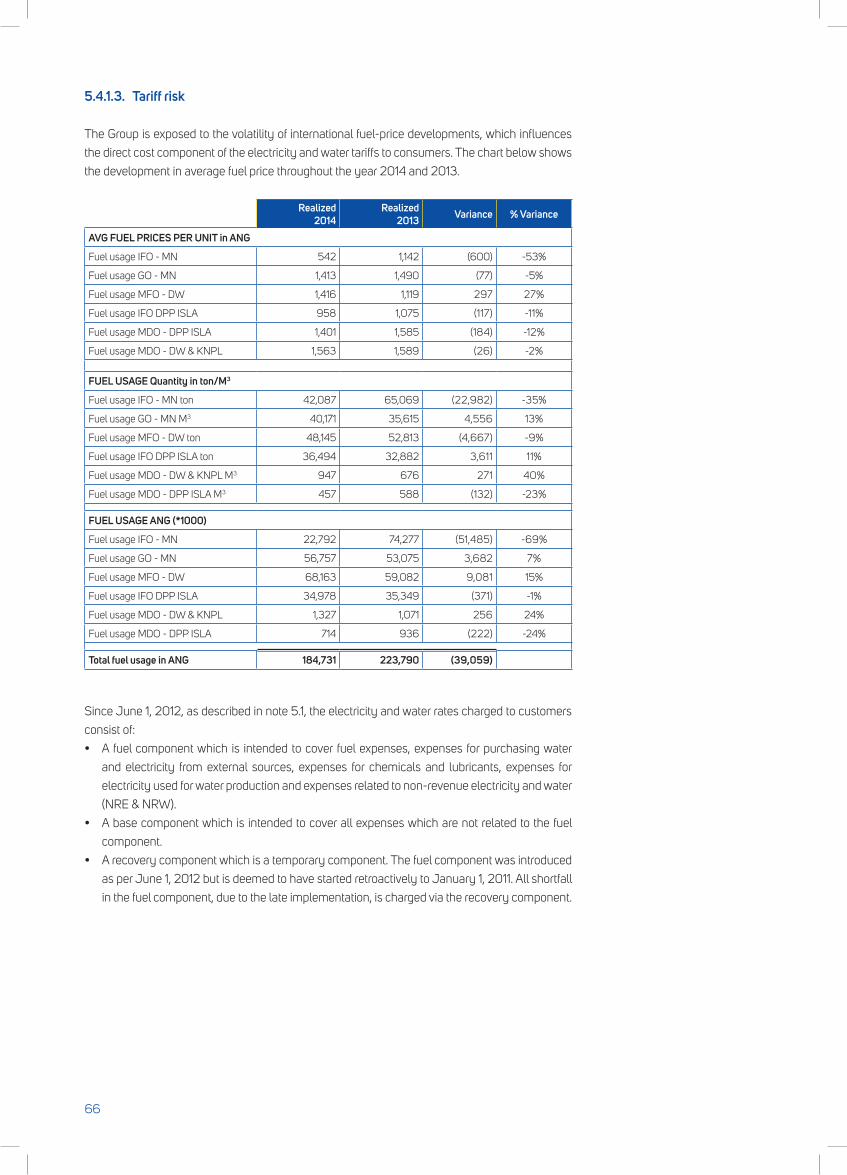
5.4.1.3. Tariff risk
The Group is exposed to the volatility of international fuel-price developments, which influences
the direct cost component of the electricity and water tariffs to consumers. The chart below shows
the development in average fuel price throughout the year 2014 and 2013.
Realized 2014
Realized 2013 Variance % Variance
AVG FUEL PRICES PER UNIT in ANG
Fuel usage IFO - MN 542 1,142 (600) -53%
Fuel usage GO - MN 1,413 1,490 (77) -5%
Fuel usage MFO - DW 1,416 1,119 297 27%
Fuel usage IFO DPP ISLA 958 1,075 (117) -11%
Fuel usage MDO - DPP ISLA 1,401 1,585 (184) -12%
Fuel usage MDO - DW & KNPL 1,563 1,589 (26) -2%
FUEL USAGE Quantity in ton/M3
Fuel usage IFO - MN ton 42,087 65,069 (22,982) -35%
Fuel usage GO - MN M3 40,171 35,615 4,556 13%
Fuel usage MFO - DW ton 48,145 52,813 (4,667) -9%
Fuel usage IFO DPP ISLA ton 36,494 32,882 3,611 11%
Fuel usage MDO - DW & KNPL M3 947 676 271 40%
Fuel usage MDO - DPP ISLA M3 457 588 (132) -23%
FUEL USAGE ANG (*1000)
Fuel usage IFO - MN 22,792 74,277 (51,485) -69%
Fuel usage GO - MN 56,757 53,075 3,682 7%
Fuel usage MFO - DW 68,163 59,082 9,081 15%
Fuel usage IFO DPP ISLA 34,978 35,349 (371) -1%
Fuel usage MDO - DW & KNPL 1,327 1,071 256 24%
Fuel usage MDO - DPP ISLA 714 936 (222) -24%
Total fuel usage in ANG 184,731 223,790 (39,059)
Since June 1, 2012, as described in note 5.1, the electricity and water rates charged to customers
consist of:
• A fuelcomponentwhich is intendedtocover fuelexpenses,expenses forpurchasingwater
and electricity from external sources, expenses for chemicals and lubricants, expenses for
electricity used for water production and expenses related to non-revenue electricity and water
(NRE & NRW).
• Abasecomponentwhichisintendedtocoverallexpenseswhicharenotrelatedtothefuel
component.
• Arecoverycomponentwhichisatemporarycomponent.Thefuelcomponentwasintroduced
as per June 1, 2012 but is deemed to have started retroactively to January 1, 2011. All shortfall
in the fuel component, due to the late implementation, is charged via the recovery component.
66
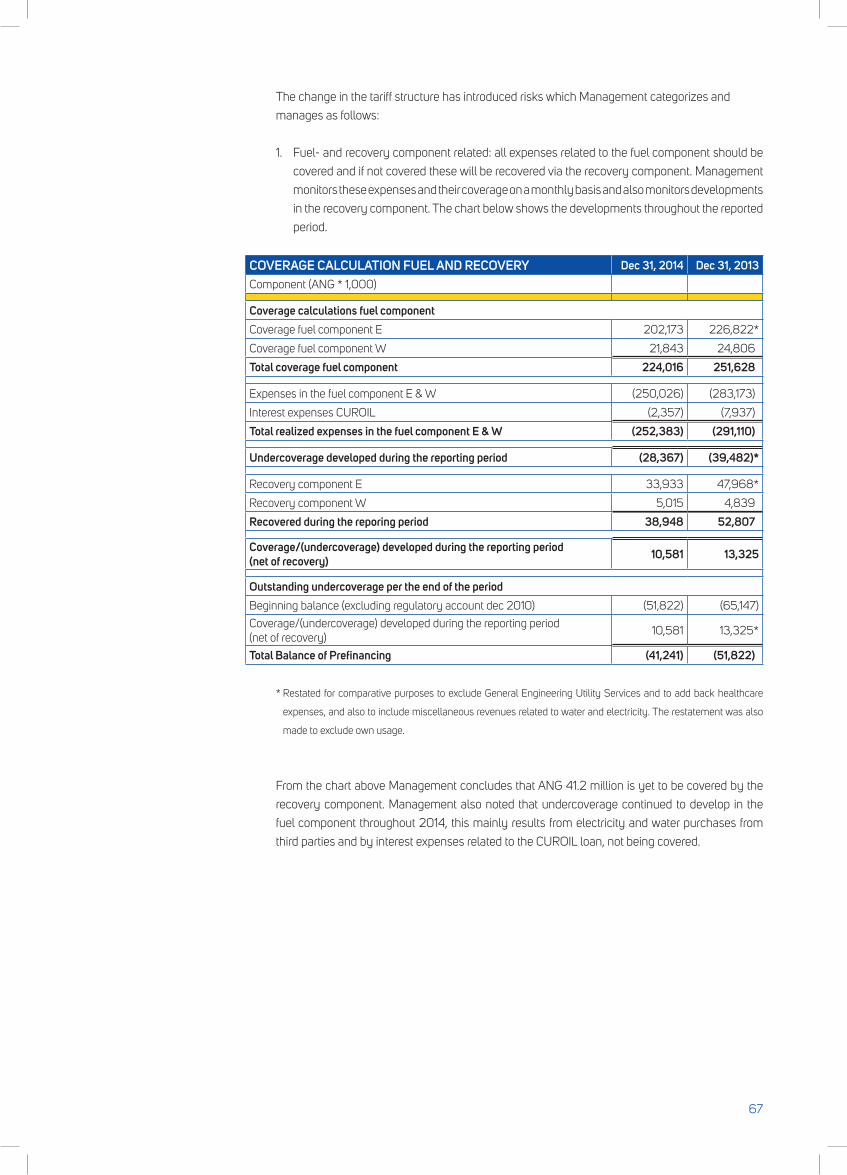
The change in the tariff structure has introduced risks which Management categorizes and
manages as follows:
1. Fuel- and recovery component related: all expenses related to the fuel component should be
covered and if not covered these will be recovered via the recovery component. Management
monitors these expenses and their coverage on a monthly basis and also monitors developments
in the recovery component. The chart below shows the developments throughout the reported
period.
COVERAGE CALCULATION FUEL AND RECOVERY Dec 31, 2014 Dec 31, 2013Component (ANG * 1,000)
Coverage calculations fuel componentCoverage fuel component E 202,173 226,822*
Coverage fuel component W 21,843 24,806
Total coverage fuel component 224,016 251,628
Expenses in the fuel component E & W (250,026) (283,173)
Interest expenses CUROIL (2,357) (7,937)
Total realized expenses in the fuel component E & W (252,383) (291,110)
Undercoverage developed during the reporting period (28,367) (39,482)*
Recovery component E 33,933 47,968*
Recovery component W 5,015 4,839
Recovered during the reporing period 38,948 52,807
Coverage/(undercoverage) developed during the reporting period (net of recovery) 10,581 13,325
Outstanding undercoverage per the end of the periodBeginning balance (excluding regulatory account dec 2010) (51,822) (65,147)
Coverage/(undercoverage) developed during the reporting period (net of recovery)
10,581 13,325*
Total Balance of Prefinancing (41,241) (51,822)
* Restated for comparative purposes to exclude General Engineering Utility Services and to add back healthcare
expenses, and also to include miscellaneous revenues related to water and electricity. The restatement was also
made to exclude own usage.
From the chart above Management concludes that ANG 41.2 million is yet to be covered by the
recovery component. Management also noted that undercoverage continued to develop in the
fuel component throughout 2014, this mainly results from electricity and water purchases from
third parties and by interest expenses related to the CUROIL loan, not being covered.
67
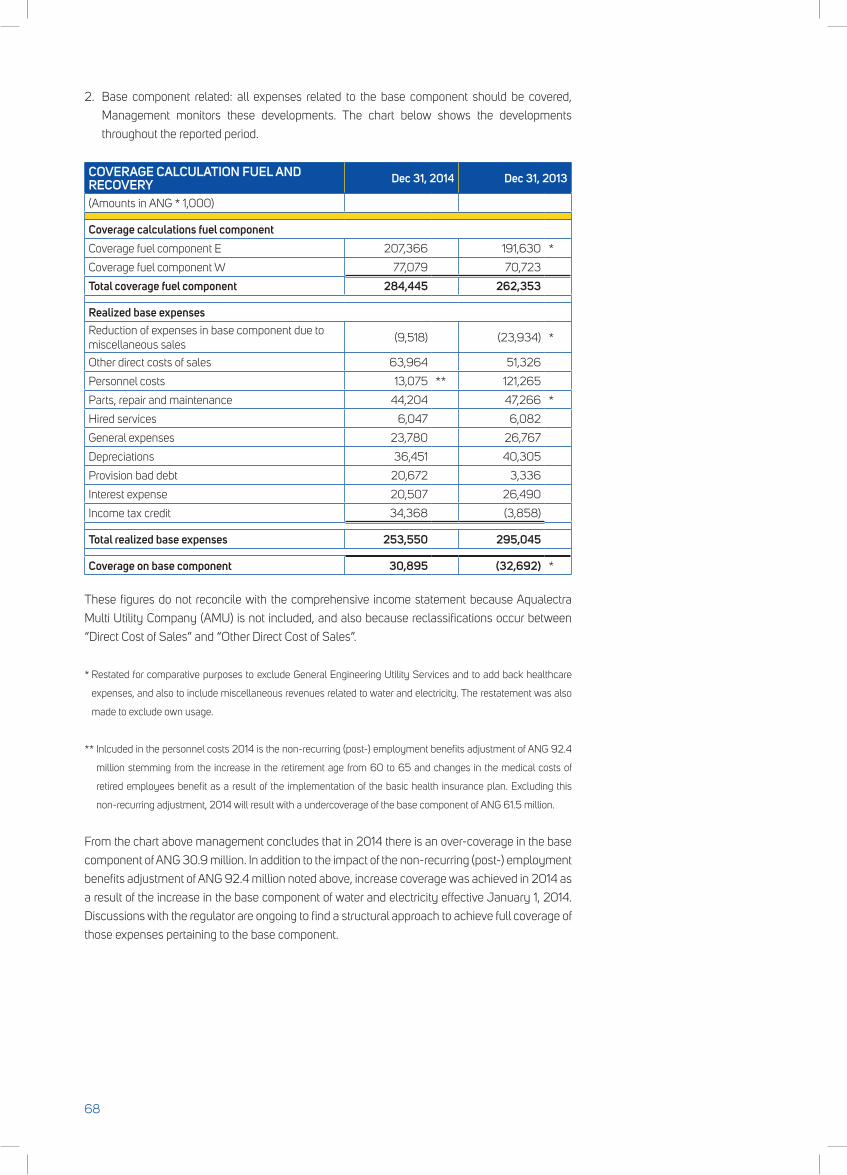
2. Base component related: all expenses related to the base component should be covered,
Management monitors these developments. The chart below shows the developments
throughout the reported period.
COVERAGE CALCULATION FUEL AND RECOVERY Dec 31, 2014 Dec 31, 2013
(Amounts in ANG * 1,000)
Coverage calculations fuel componentCoverage fuel component E 207,366 191,630 *
Coverage fuel component W 77,079 70,723
Total coverage fuel component 284,445 262,353
Realized base expensesReduction of expenses in base component due to miscellaneous sales
(9,518) (23,934) *
Other direct costs of sales 63,964 51,326
Personnel costs 13,075 ** 121,265
Parts, repair and maintenance 44,204 47,266 *
Hired services 6,047 6,082
General expenses 23,780 26,767
Depreciations 36,451 40,305
Provision bad debt 20,672 3,336
Interest expense 20,507 26,490
Income tax credit 34,368 (3,858)
Total realized base expenses 253,550 295,045
Coverage on base component 30,895 (32,692) *
These figures do not reconcile with the comprehensive income statement because Aqualectra
Multi Utility Company (AMU) is not included, and also because reclassifications occur between
“Direct Cost of Sales” and “Other Direct Cost of Sales”.
* Restated for comparative purposes to exclude General Engineering Utility Services and to add back healthcare
expenses, and also to include miscellaneous revenues related to water and electricity. The restatement was also
made to exclude own usage.
** Inlcuded in the personnel costs 2014 is the non-recurring (post-) employment benefits adjustment of ANG 92.4
million stemming from the increase in the retirement age from 60 to 65 and changes in the medical costs of
retired employees benefit as a result of the implementation of the basic health insurance plan. Excluding this
non-recurring adjustment, 2014 will result with a undercoverage of the base component of ANG 61.5 million.
From the chart above management concludes that in 2014 there is an over-coverage in the base
component of ANG 30.9 million. In addition to the impact of the non-recurring (post-) employment
benefits adjustment of ANG 92.4 million noted above, increase coverage was achieved in 2014 as
a result of the increase in the base component of water and electricity effective January 1, 2014.
Discussions with the regulator are ongoing to find a structural approach to achieve full coverage of
those expenses pertaining to the base component.
68
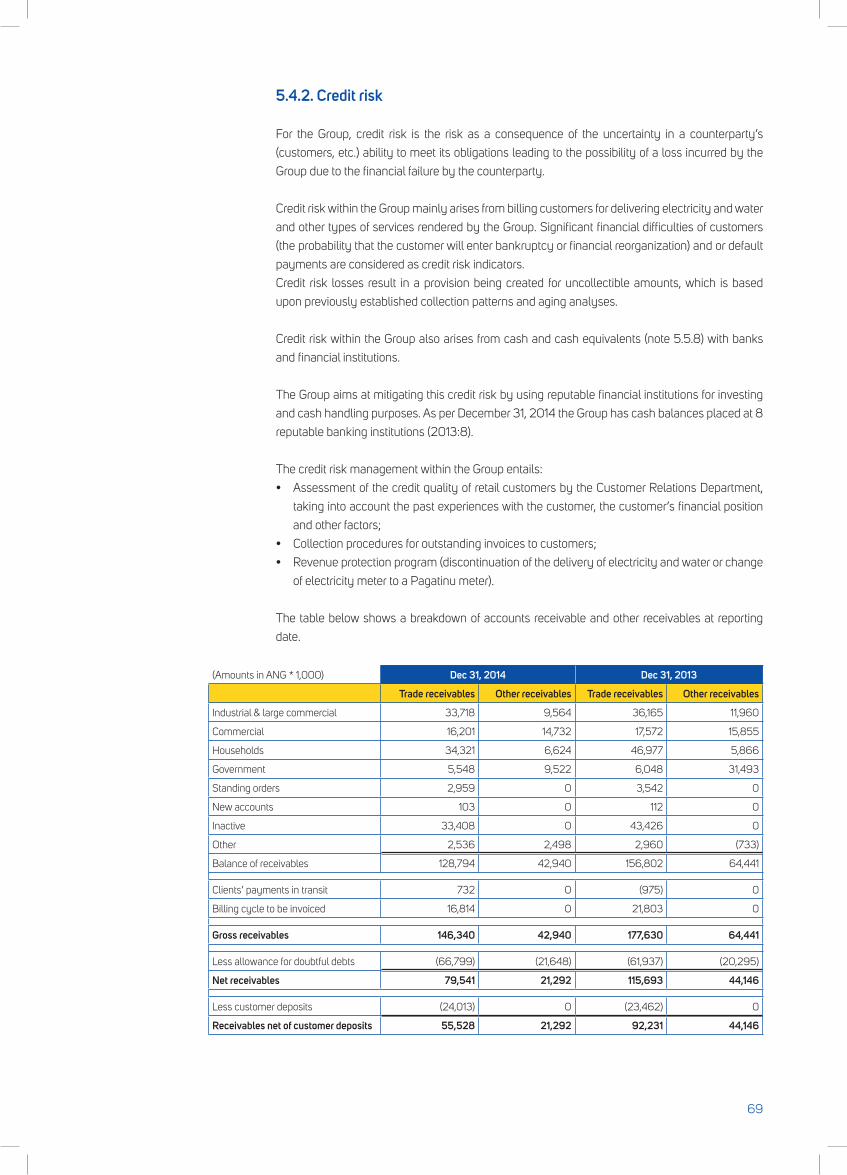
5.4.2. Credit risk
For the Group, credit risk is the risk as a consequence of the uncertainty in a counterparty’s
(customers, etc.) ability to meet its obligations leading to the possibility of a loss incurred by the
Group due to the financial failure by the counterparty.
Credit risk within the Group mainly arises from billing customers for delivering electricity and water
and other types of services rendered by the Group. Significant financial difficulties of customers
(the probability that the customer will enter bankruptcy or financial reorganization) and or default
payments are considered as credit risk indicators.
Credit risk losses result in a provision being created for uncollectible amounts, which is based
upon previously established collection patterns and aging analyses.
Credit risk within the Group also arises from cash and cash equivalents (note 5.5.8) with banks
and financial institutions.
The Group aims at mitigating this credit risk by using reputable financial institutions for investing
and cash handling purposes. As per December 31, 2014 the Group has cash balances placed at 8
reputable banking institutions (2013:8).
The credit risk management within the Group entails:
• AssessmentofthecreditqualityofretailcustomersbytheCustomerRelationsDepartment,
taking into account the past experiences with the customer, the customer’s financial position
andotherfactors;
• Collectionproceduresforoutstandinginvoicestocustomers;
• Revenueprotectionprogram(discontinuationofthedeliveryofelectricityandwaterorchange
of electricity meter to a Pagatinu meter).
The table below shows a breakdown of accounts receivable and other receivables at reporting
date.
(Amounts in ANG * 1,000) Dec 31, 2014 Dec 31, 2013
Trade receivables Other receivables Trade receivables Other receivables
Industrial & large commercial 33,718 9,564 36,165 11,960
Commercial 16,201 14,732 17,572 15,855
Households 34,321 6,624 46,977 5,866
Government 5,548 9,522 6,048 31,493
Standing orders 2,959 0 3,542 0
New accounts 103 0 112 0
Inactive 33,408 0 43,426 0
Other 2,536 2,498 2,960 (733)
Balance of receivables 128,794 42,940 156,802 64,441
Clients’ payments in transit 732 0 (975) 0
Billing cycle to be invoiced 16,814 0 21,803 0
Gross receivables 146,340 42,940 177,630 64,441
Less allowance for doubtful debts (66,799) (21,648) (61,937) (20,295)
Net receivables 79,541 21,292 115,693 44,146
Less customer deposits (24,013) 0 (23,462) 0
Receivables net of customer deposits 55,528 21,292 92,231 44,146
69
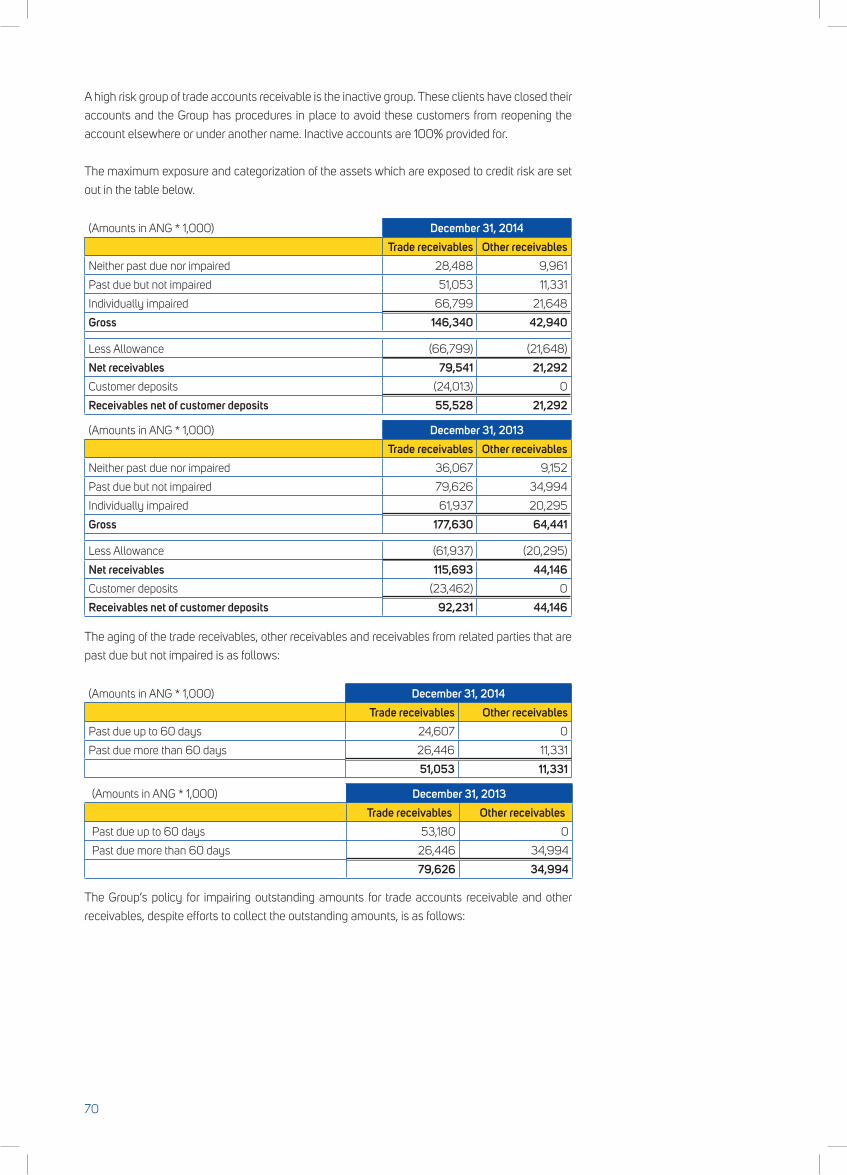
A high risk group of trade accounts receivable is the inactive group. These clients have closed their
accounts and the Group has procedures in place to avoid these customers from reopening the
account elsewhere or under another name. Inactive accounts are 100% provided for.
The maximum exposure and categorization of the assets which are exposed to credit risk are set
out in the table below.
(Amounts in ANG * 1,000) December 31, 2014Trade receivables Other receivables
Neither past due nor impaired 28,488 9,961
Past due but not impaired 51,053 11,331
Individually impaired 66,799 21,648
Gross 146,340 42,940
Less Allowance (66,799) (21,648)
Net receivables 79,541 21,292 Customer deposits (24,013) 0
Receivables net of customer deposits 55,528 21,292
(Amounts in ANG * 1,000) December 31, 2013Trade receivables Other receivables
Neither past due nor impaired 36,067 9,152
Past due but not impaired 79,626 34,994
Individually impaired 61,937 20,295
Gross 177,630 64,441
Less Allowance (61,937) (20,295)
Net receivables 115,693 44,146 Customer deposits (23,462) 0
Receivables net of customer deposits 92,231 44,146
The aging of the trade receivables, other receivables and receivables from related parties that are
past due but not impaired is as follows:
(Amounts in ANG * 1,000) December 31, 2014Trade receivables Other receivables
Past due up to 60 days 24,607 0
Past due more than 60 days 26,446 11,331
51,053 11,331
(Amounts in ANG * 1,000) December 31, 2013Trade receivables Other receivables
Past due up to 60 days 53,180 0
Past due more than 60 days 26,446 34,994
79,626 34,994
The Group’s policy for impairing outstanding amounts for trade accounts receivable and other
receivables, despite efforts to collect the outstanding amounts, is as follows:
70
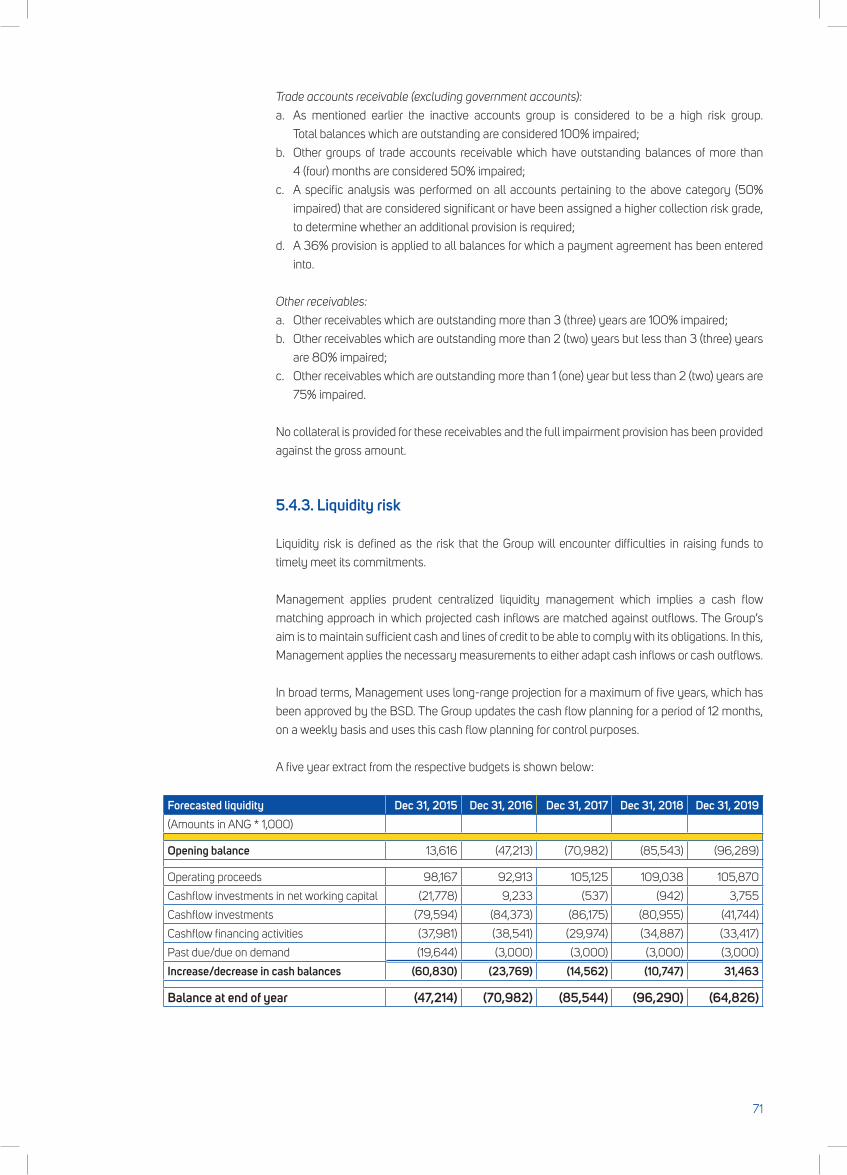
Trade accounts receivable (excluding government accounts):
a. As mentioned earlier the inactive accounts group is considered to be a high risk group.
Totalbalanceswhichareoutstandingareconsidered100%impaired;
b. Other groups of trade accounts receivable which have outstanding balances of more than
4(four)monthsareconsidered50%impaired;
c. A specific analysis was performed on all accounts pertaining to the above category (50%
impaired) that are considered significant or have been assigned a higher collection risk grade,
todeterminewhetheranadditionalprovisionisrequired;
d. A 36% provision is applied to all balances for which a payment agreement has been entered
into.
Other receivables:
a. Otherreceivableswhichareoutstandingmorethan3(three)yearsare100%impaired;
b. Other receivables which are outstanding more than 2 (two) years but less than 3 (three) years
are80%impaired;
c. Other receivables which are outstanding more than 1 (one) year but less than 2 (two) years are
75% impaired.
No collateral is provided for these receivables and the full impairment provision has been provided
against the gross amount.
5.4.3. Liquidity risk
Liquidity risk is defined as the risk that the Group will encounter difficulties in raising funds to
timely meet its commitments.
Management applies prudent centralized liquidity management which implies a cash flow
matching approach in which projected cash inflows are matched against outflows. The Group’s
aim is to maintain sufficient cash and lines of credit to be able to comply with its obligations. In this,
Management applies the necessary measurements to either adapt cash inflows or cash outflows.
In broad terms, Management uses long-range projection for a maximum of five years, which has
been approved by the BSD. The Group updates the cash flow planning for a period of 12 months,
on a weekly basis and uses this cash flow planning for control purposes.
A five year extract from the respective budgets is shown below:
Forecasted liquidity Dec 31, 2015 Dec 31, 2016 Dec 31, 2017 Dec 31, 2018 Dec 31, 2019(Amounts in ANG * 1,000)
Opening balance 13,616 (47,213) (70,982) (85,543) (96,289)
Operating proceeds 98,167 92,913 105,125 109,038 105,870
Cashflow investments in net working capital (21,778) 9,233 (537) (942) 3,755
Cashflow investments (79,594) (84,373) (86,175) (80,955) (41,744)
Cashflow financing activities (37,981) (38,541) (29,974) (34,887) (33,417)
Past due/due on demand (19,644) (3,000) (3,000) (3,000) (3,000)
Increase/decrease in cash balances (60,830) (23,769) (14,562) (10,747) 31,463
Balance at end of year (47,214) (70,982) (85,544) (96,290) (64,826)
71
As depicted in the above noted liquidity projection, the Group’s liquidity position is projected to
deteriorate significantly over the coming years. In 2015 a past due amount equal to ANG 19.6
million is presented to reflect the Group’s true cash position if it were settling all its obligations to
its creditors timely. Adequate tariff adjustments over the past years prior to the introduction of the
new tariff structure in June 2012 would have allowed the Group to generate sufficient cash flow to
remain current on all its obligations.
Another key factor with a yet greater impact on the deterioration of the Group’s liquidity, regards
the significant investments in fixed asset that exceed cash inflow in the form of new loans to
source these investments. The significant capital investments projected to be made, relate to
the distribution infrastructure and new sea water reverse osmosis plant. These investments are
necessary in order to guarantee a more efficient production and distribution of water and electricity.
The recovery of the fuel under coverage up until 2010 of ANG 104 million as depicted in the
regulatory account as per December 31, 2010 is not included. Additional expected recoveries of
the undercovareges of both the base and the fuel component since the introduction of the new
tariff structure are not included in the projected years either. See the subsequent event note 5.8
for developments in this area.
Management is of the opinion that the projected liquidity position can be improved with the
following:
• GrantingoftheremainingrecoverywhichisestimatedatANG104millionduetolackoftimely
adjustments as accounted for in the regulatory accounts up to and including 2010.
• Grantingofaportionoftheundercoveragerelatedtothebasecomponent.
• Securingthenecessaryexternalfundinginordertofinancetheplannedinvestments.
Actions taken by Management:
• ContinuetoinformtheRegulatorandtheGovernmentofCuraçaoabouttheneedtorecoverthe
balances to be compensated in the amount of ANG 104 million as accounted for in the regulatory
accounts and about the need to recover the net undercoverage in the base component
estimated at ANG 27 million over 2012 through 2014 and any remaining undercoverage in the
fuel component over the past 3 years. The Group will significantly improve its financial position
if it obtains this recovery.
• Perform daily cash-flow projection and prioritizing payments while making informal
agreements with creditors of past due amount in order to gradually bring down these balances
to acceptable levels while ensuring the continuation of operations and realization of its turn-
around plan.
The investment in new and efficient machines will on the long run result in lower fuel usage and
operational costs which is reflected in increasing operational cash flow starting in 2015 when the
new machines are put into operation. The negative impact of the changes in fuel prices on the
operations is expected to be neutralized due to the monthly tariff adjustment which will guarantee
that the Group receives the coverage for the fluctuations in the fuel prices.
72
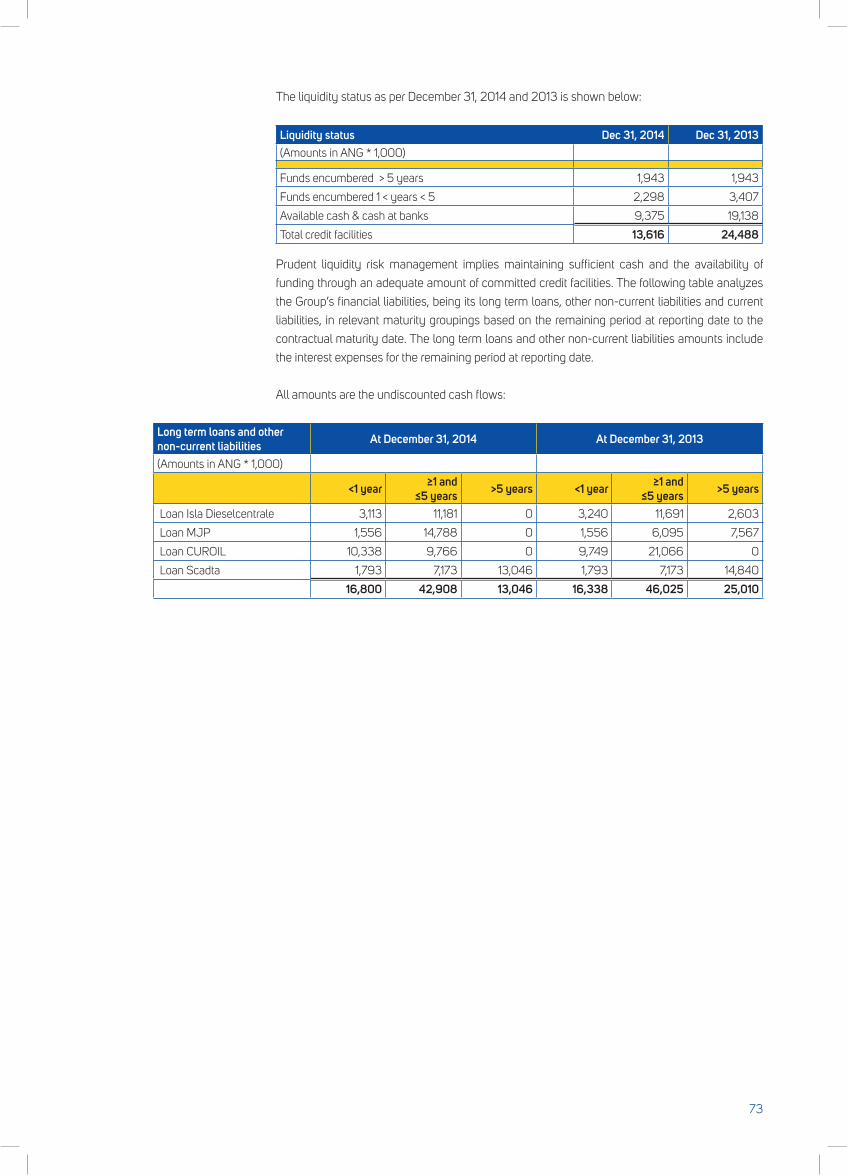
The liquidity status as per December 31, 2014 and 2013 is shown below:
Liquidity status Dec 31, 2014 Dec 31, 2013(Amounts in ANG * 1,000)
Funds encumbered > 5 years 1,943 1,943
Funds encumbered 1 < years < 5 2,298 3,407
Available cash & cash at banks 9,375 19,138
Total credit facilities 13,616 24,488
Prudent liquidity risk management implies maintaining sufficient cash and the availability of
funding through an adequate amount of committed credit facilities. The following table analyzes
the Group’s financial liabilities, being its long term loans, other non-current liabilities and current
liabilities, in relevant maturity groupings based on the remaining period at reporting date to the
contractual maturity date. The long term loans and other non-current liabilities amounts include
the interest expenses for the remaining period at reporting date.
All amounts are the undiscounted cash flows:
Long term loans and other non-current liabilities At December 31, 2014 At December 31, 2013
(Amounts in ANG * 1,000)
<1 year ≥1 and ≤5 years >5 years <1 year ≥1 and
≤5 years >5 years
Loan Isla Dieselcentrale 3,113 11,181 0 3,240 11,691 2,603
Loan MJP 1,556 14,788 0 1,556 6,095 7,567
Loan CUROIL 10,338 9,766 0 9,749 21,066 0
Loan Scadta 1,793 7,173 13,046 1,793 7,173 14,840
16,800 42,908 13,046 16,338 46,025 25,010
73
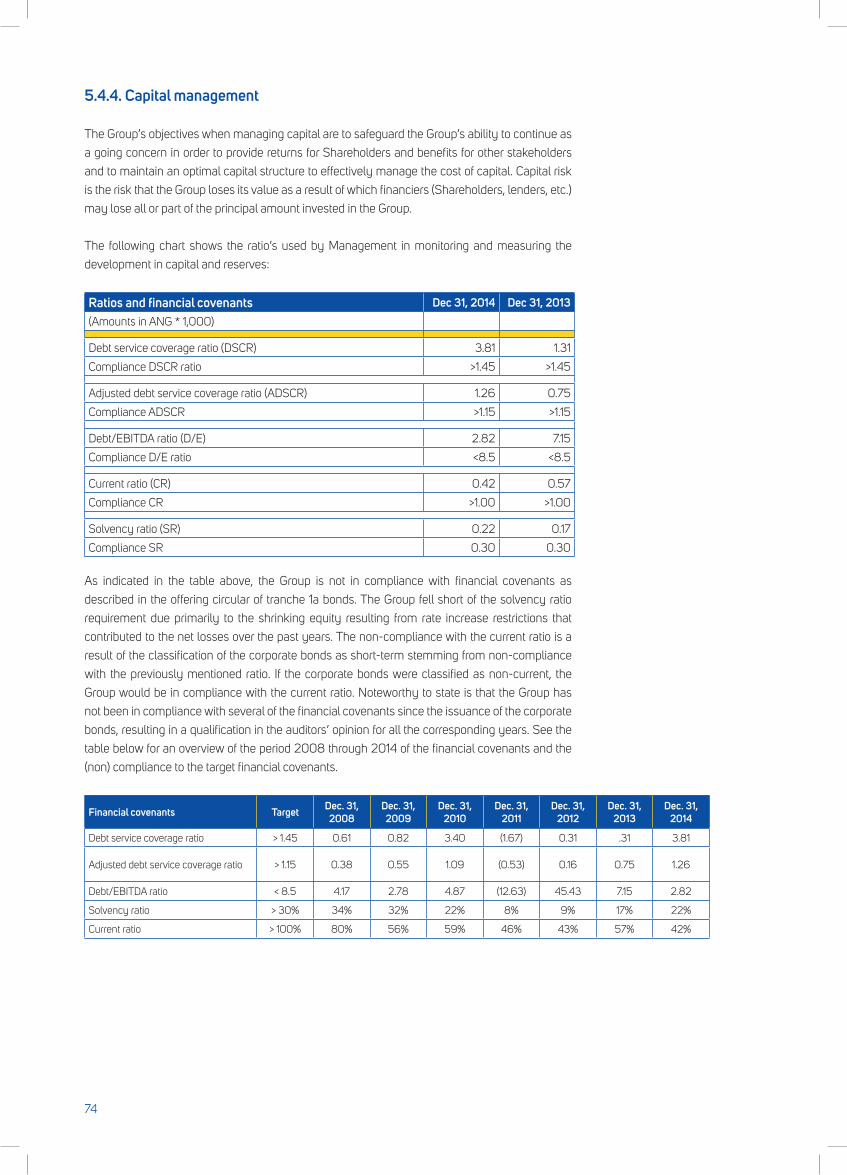
5.4.4. Capital management
The Group’s objectives when managing capital are to safeguard the Group’s ability to continue as
a going concern in order to provide returns for Shareholders and benefits for other stakeholders
and to maintain an optimal capital structure to effectively manage the cost of capital. Capital risk
is the risk that the Group loses its value as a result of which financiers (Shareholders, lenders, etc.)
may lose all or part of the principal amount invested in the Group.
The following chart shows the ratio’s used by Management in monitoring and measuring the
development in capital and reserves:
Ratios and financial covenants Dec 31, 2014 Dec 31, 2013(Amounts in ANG * 1,000)
Debt service coverage ratio (DSCR) 3.81 1.31
Compliance DSCR ratio >1.45 >1.45
Adjusted debt service coverage ratio (ADSCR) 1.26 0.75
Compliance ADSCR >1.15 >1.15
Debt/EBITDA ratio (D/E) 2.82 7.15
Compliance D/E ratio <8.5 <8.5
Current ratio (CR) 0.42 0.57
Compliance CR >1.00 >1.00
Solvency ratio (SR) 0.22 0.17
Compliance SR 0.30 0.30
As indicated in the table above, the Group is not in compliance with financial covenants as
described in the offering circular of tranche 1a bonds. The Group fell short of the solvency ratio
requirement due primarily to the shrinking equity resulting from rate increase restrictions that
contributed to the net losses over the past years. The non-compliance with the current ratio is a
result of the classification of the corporate bonds as short-term stemming from non-compliance
with the previously mentioned ratio. If the corporate bonds were classified as non-current, the
Group would be in compliance with the current ratio. Noteworthy to state is that the Group has
not been in compliance with several of the financial covenants since the issuance of the corporate
bonds, resulting in a qualification in the auditors’ opinion for all the corresponding years. See the
table below for an overview of the period 2008 through 2014 of the financial covenants and the
(non) compliance to the target financial covenants.
Financial covenants Target Dec. 31, 2008
Dec. 31, 2009
Dec. 31, 2010
Dec. 31, 2011
Dec. 31, 2012
Dec. 31, 2013
Dec. 31, 2014
Debt service coverage ratio > 1.45 0.61 0.82 3.40 (1.67) 0.31 .31 3.81
Adjusted debt service coverage ratio > 1.15 0.38 0.55 1.09 (0.53) 0.16 0.75 1.26
Debt/EBITDA ratio < 8.5 4.17 2.78 4.87 (12.63) 45.43 7.15 2.82
Solvency ratio > 30% 34% 32% 22% 8% 9% 17% 22%
Current ratio > 100% 80% 56% 59% 46% 43% 57% 42%
74
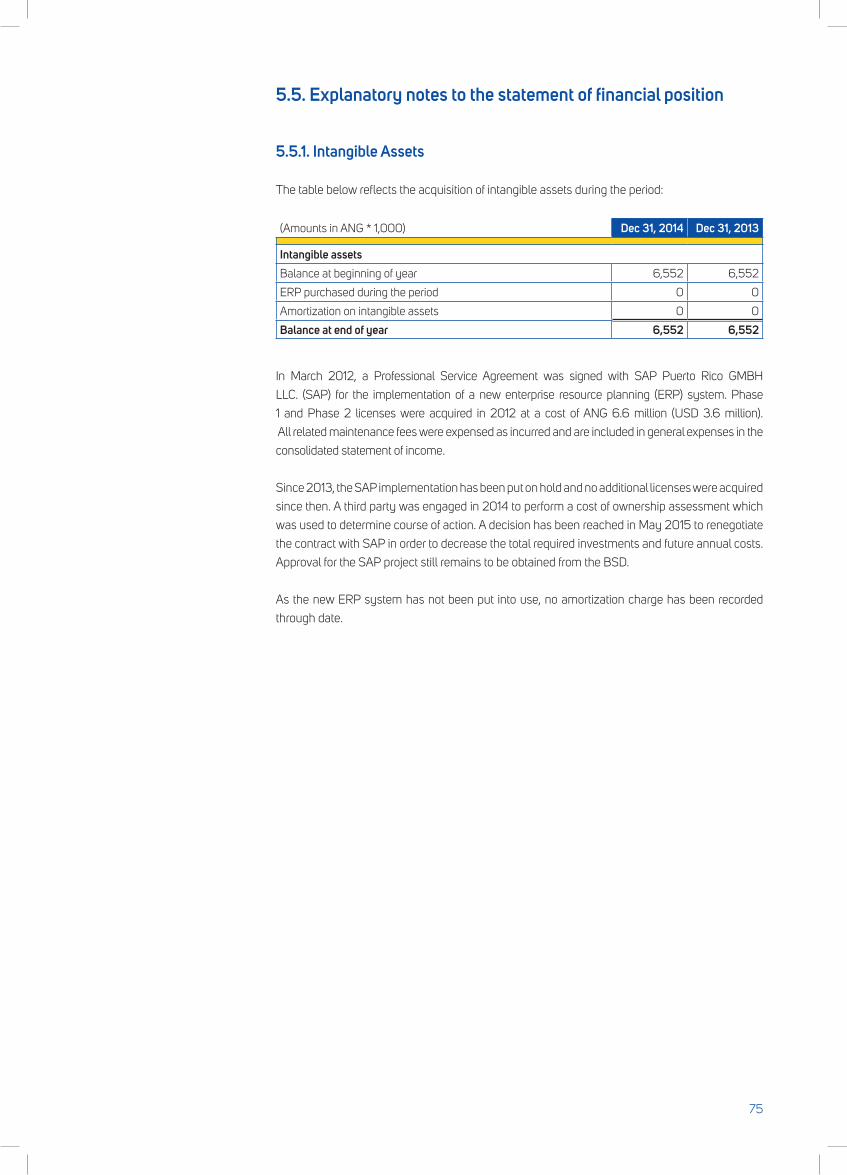
5.5. Explanatory notes to the statement of financial position
5.5.1. Intangible Assets
The table below reflects the acquisition of intangible assets during the period:
(Amounts in ANG * 1,000) Dec 31, 2014 Dec 31, 2013
Intangible assetsBalance at beginning of year 6,552 6,552
ERP purchased during the period 0 0
Amortization on intangible assets 0 0
Balance at end of year 6,552 6,552
In March 2012, a Professional Service Agreement was signed with SAP Puerto Rico GMBH
LLC. (SAP) for the implementation of a new enterprise resource planning (ERP) system. Phase
1 and Phase 2 licenses were acquired in 2012 at a cost of ANG 6.6 million (USD 3.6 million).
All related maintenance fees were expensed as incurred and are included in general expenses in the
consolidated statement of income.
Since 2013, the SAP implementation has been put on hold and no additional licenses were acquired
since then. A third party was engaged in 2014 to perform a cost of ownership assessment which
was used to determine course of action. A decision has been reached in May 2015 to renegotiate
the contract with SAP in order to decrease the total required investments and future annual costs.
Approval for the SAP project still remains to be obtained from the BSD.
As the new ERP system has not been put into use, no amortization charge has been recorded
through date.
75
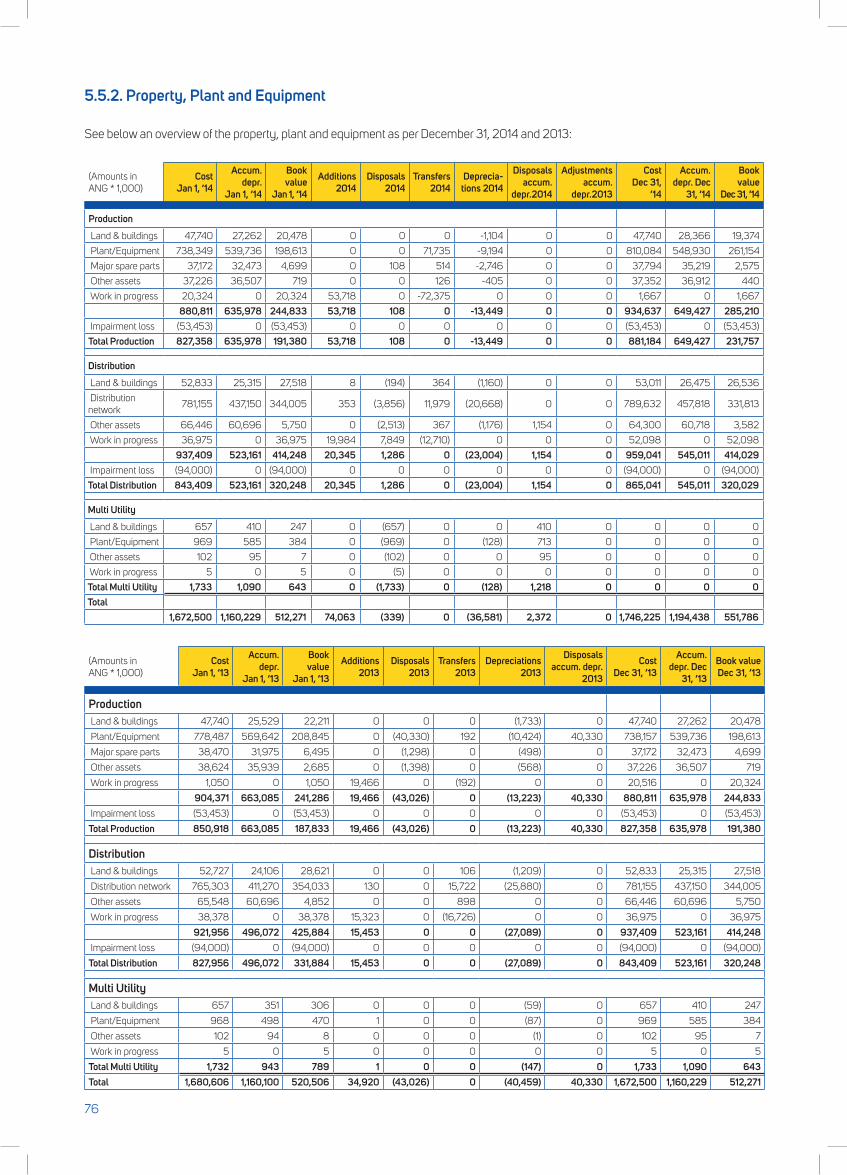
5.5.2. Property, Plant and Equipment
See below an overview of the property, plant and equipment as per December 31, 2014 and 2013:
(Amounts in ANG * 1,000)
Cost Jan 1, ‘14
Accum. depr.
Jan 1, ‘14
Book value
Jan 1, ‘14
Additions 2014
Disposals 2014
Transfers 2014
Deprecia-tions 2014
Disposals accum.
depr.2014
Adjustments accum.
depr.2013
Cost Dec 31,
’14
Accum. depr. Dec
31, ’14
Book value
Dec 31, ’14
Production
Land & buildings 47,740 27,262 20,478 0 0 0 -1,104 0 0 47,740 28,366 19,374
Plant/Equipment 738,349 539,736 198,613 0 0 71,735 -9,194 0 0 810,084 548,930 261,154
Major spare parts 37,172 32,473 4,699 0 108 514 -2,746 0 0 37,794 35,219 2,575
Other assets 37,226 36,507 719 0 0 126 -405 0 0 37,352 36,912 440
Work in progress 20,324 0 20,324 53,718 0 -72,375 0 0 0 1,667 0 1,667
880,811 635,978 244,833 53,718 108 0 -13,449 0 0 934,637 649,427 285,210 Impairment loss (53,453) 0 (53,453) 0 0 0 0 0 0 (53,453) 0 (53,453)
Total Production 827,358 635,978 191,380 53,718 108 0 -13,449 0 0 881,184 649,427 231,757
Distribution
Land & buildings 52,833 25,315 27,518 8 (194) 364 (1,160) 0 0 53,011 26,475 26,536
Distribution network
781,155 437,150 344,005 353 (3,856) 11,979 (20,668) 0 0 789,632 457,818 331,813
Other assets 66,446 60,696 5,750 0 (2,513) 367 (1,176) 1,154 0 64,300 60,718 3,582
Work in progress 36,975 0 36,975 19,984 7,849 (12,710) 0 0 0 52,098 0 52,098
937,409 523,161 414,248 20,345 1,286 0 (23,004) 1,154 0 959,041 545,011 414,029 Impairment loss (94,000) 0 (94,000) 0 0 0 0 0 0 (94,000) 0 (94,000)
Total Distribution 843,409 523,161 320,248 20,345 1,286 0 (23,004) 1,154 0 865,041 545,011 320,029
Multi Utility
Land & buildings 657 410 247 0 (657) 0 0 410 0 0 0 0
Plant/Equipment 969 585 384 0 (969) 0 (128) 713 0 0 0 0
Other assets 102 95 7 0 (102) 0 0 95 0 0 0 0
Work in progress 5 0 5 0 (5) 0 0 0 0 0 0 0
Total Multi Utility 1,733 1,090 643 0 (1,733) 0 (128) 1,218 0 0 0 0Total
1,672,500 1,160,229 512,271 74,063 (339) 0 (36,581) 2,372 0 1,746,225 1,194,438 551,786
(Amounts in ANG * 1,000)
Cost Jan 1, ‘13
Accum. depr.
Jan 1, ‘13
Book value
Jan 1, ‘13
Additions 2013
Disposals 2013
Transfers 2013
Depreciations 2013
Disposals accum. depr.
2013
Cost Dec 31, ’13
Accum. depr. Dec
31, ’13
Book value Dec 31, ’13
Production Land & buildings 47,740 25,529 22,211 0 0 0 (1,733) 0 47,740 27,262 20,478
Plant/Equipment 778,487 569,642 208,845 0 (40,330) 192 (10,424) 40,330 738,157 539,736 198,613
Major spare parts 38,470 31,975 6,495 0 (1,298) 0 (498) 0 37,172 32,473 4,699
Other assets 38,624 35,939 2,685 0 (1,398) 0 (568) 0 37,226 36,507 719
Work in progress 1,050 0 1,050 19,466 0 (192) 0 0 20,516 0 20,324
904,371 663,085 241,286 19,466 (43,026) 0 (13,223) 40,330 880,811 635,978 244,833 Impairment loss (53,453) 0 (53,453) 0 0 0 0 0 (53,453) 0 (53,453)
Total Production 850,918 663,085 187,833 19,466 (43,026) 0 (13,223) 40,330 827,358 635,978 191,380
Distribution Land & buildings 52,727 24,106 28,621 0 0 106 (1,209) 0 52,833 25,315 27,518
Distribution network 765,303 411,270 354,033 130 0 15,722 (25,880) 0 781,155 437,150 344,005
Other assets 65,548 60,696 4,852 0 0 898 0 0 66,446 60,696 5,750
Work in progress 38,378 0 38,378 15,323 0 (16,726) 0 0 36,975 0 36,975
921,956 496,072 425,884 15,453 0 0 (27,089) 0 937,409 523,161 414,248 Impairment loss (94,000) 0 (94,000) 0 0 0 0 0 (94,000) 0 (94,000)
Total Distribution 827,956 496,072 331,884 15,453 0 0 (27,089) 0 843,409 523,161 320,248
Multi Utility Land & buildings 657 351 306 0 0 0 (59) 0 657 410 247
Plant/Equipment 968 498 470 1 0 0 (87) 0 969 585 384
Other assets 102 94 8 0 0 0 (1) 0 102 95 7
Work in progress 5 0 5 0 0 0 0 0 5 0 5
Total Multi Utility 1,732 943 789 1 0 0 (147) 0 1,733 1,090 643Total 1,680,606 1,160,100 520,506 34,920 (43,026) 0 (40,459) 40,330 1,672,500 1,160,229 512,271
76
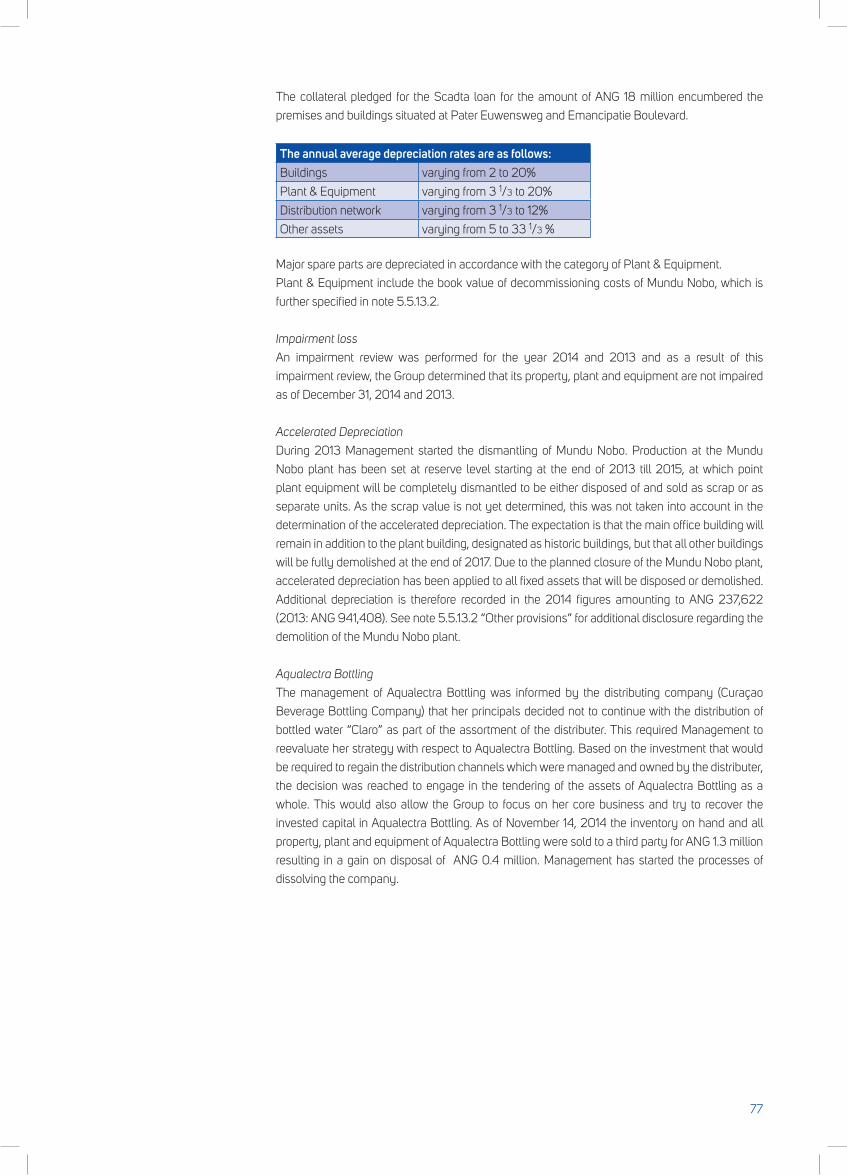
The collateral pledged for the Scadta loan for the amount of ANG 18 million encumbered the
premises and buildings situated at Pater Euwensweg and Emancipatie Boulevard.
The annual average depreciation rates are as follows:Buildings varying from 2 to 20%
Plant & Equipment varying from 3 1/3 to 20%
Distribution network varying from 3 1/3 to 12%
Other assets varying from 5 to 33 1/3 %
Major spare parts are depreciated in accordance with the category of Plant & Equipment.
Plant & Equipment include the book value of decommissioning costs of Mundu Nobo, which is
further specified in note 5.5.13.2.
Impairment loss
An impairment review was performed for the year 2014 and 2013 and as a result of this
impairment review, the Group determined that its property, plant and equipment are not impaired
as of December 31, 2014 and 2013.
Accelerated Depreciation
During 2013 Management started the dismantling of Mundu Nobo. Production at the Mundu
Nobo plant has been set at reserve level starting at the end of 2013 till 2015, at which point
plant equipment will be completely dismantled to be either disposed of and sold as scrap or as
separate units. As the scrap value is not yet determined, this was not taken into account in the
determination of the accelerated depreciation. The expectation is that the main office building will
remain in addition to the plant building, designated as historic buildings, but that all other buildings
will be fully demolished at the end of 2017. Due to the planned closure of the Mundu Nobo plant,
accelerated depreciation has been applied to all fixed assets that will be disposed or demolished.
Additional depreciation is therefore recorded in the 2014 figures amounting to ANG 237,622
(2013: ANG 941,408). See note 5.5.13.2 “Other provisions” for additional disclosure regarding the
demolition of the Mundu Nobo plant.
Aqualectra Bottling
The management of Aqualectra Bottling was informed by the distributing company (Curaçao
Beverage Bottling Company) that her principals decided not to continue with the distribution of
bottled water “Claro” as part of the assortment of the distributer. This required Management to
reevaluate her strategy with respect to Aqualectra Bottling. Based on the investment that would
be required to regain the distribution channels which were managed and owned by the distributer,
the decision was reached to engage in the tendering of the assets of Aqualectra Bottling as a
whole. This would also allow the Group to focus on her core business and try to recover the
invested capital in Aqualectra Bottling. As of November 14, 2014 the inventory on hand and all
property, plant and equipment of Aqualectra Bottling were sold to a third party for ANG 1.3 million
resulting in a gain on disposal of ANG 0.4 million. Management has started the processes of
dissolving the company.
77
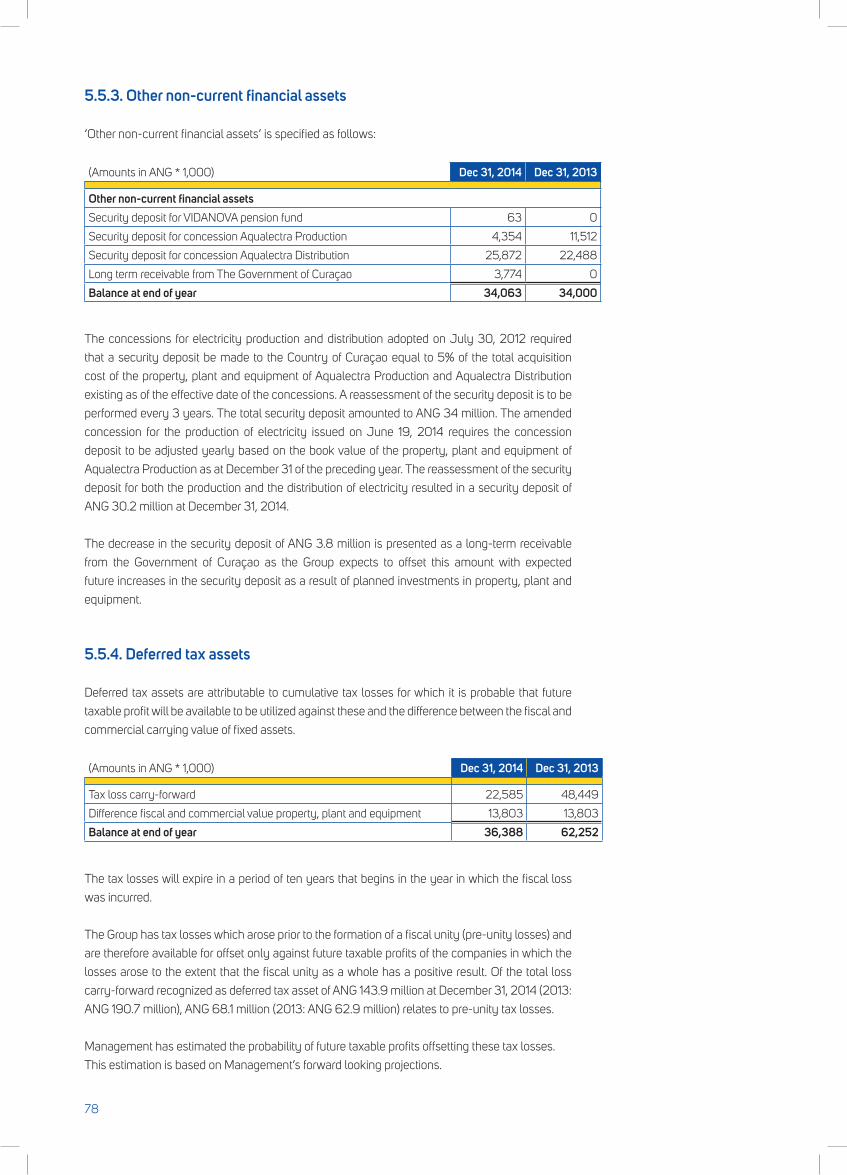
5.5.3. Other non-current financial assets
‘Other non-current financial assets’ is specified as follows:
(Amounts in ANG * 1,000) Dec 31, 2014 Dec 31, 2013
Other non-current financial assetsSecurity deposit for VIDANOVA pension fund 63 0
Security deposit for concession Aqualectra Production 4,354 11,512
Security deposit for concession Aqualectra Distribution 25,872 22,488
Long term receivable from The Government of Curaçao 3,774 0
Balance at end of year 34,063 34,000
The concessions for electricity production and distribution adopted on July 30, 2012 required
that a security deposit be made to the Country of Curaçao equal to 5% of the total acquisition
cost of the property, plant and equipment of Aqualectra Production and Aqualectra Distribution
existing as of the effective date of the concessions. A reassessment of the security deposit is to be
performed every 3 years. The total security deposit amounted to ANG 34 million. The amended
concession for the production of electricity issued on June 19, 2014 requires the concession
deposit to be adjusted yearly based on the book value of the property, plant and equipment of
Aqualectra Production as at December 31 of the preceding year. The reassessment of the security
deposit for both the production and the distribution of electricity resulted in a security deposit of
ANG 30.2 million at December 31, 2014.
The decrease in the security deposit of ANG 3.8 million is presented as a long-term receivable
from the Government of Curaçao as the Group expects to offset this amount with expected
future increases in the security deposit as a result of planned investments in property, plant and
equipment.
5.5.4. Deferred tax assets
Deferred tax assets are attributable to cumulative tax losses for which it is probable that future
taxable profit will be available to be utilized against these and the difference between the fiscal and
commercial carrying value of fixed assets.
(Amounts in ANG * 1,000) Dec 31, 2014 Dec 31, 2013
Tax loss carry-forward 22,585 48,449
Difference fiscal and commercial value property, plant and equipment 13,803 13,803
Balance at end of year 36,388 62,252
The tax losses will expire in a period of ten years that begins in the year in which the fiscal loss
was incurred.
The Group has tax losses which arose prior to the formation of a fiscal unity (pre-unity losses) and
are therefore available for offset only against future taxable profits of the companies in which the
losses arose to the extent that the fiscal unity as a whole has a positive result. Of the total loss
carry-forward recognized as deferred tax asset of ANG 143.9 million at December 31, 2014 (2013:
ANG 190.7 million), ANG 68.1 million (2013: ANG 62.9 million) relates to pre-unity tax losses.
Management has estimated the probability of future taxable profits offsetting these tax losses.
This estimation is based on Management’s forward looking projections.
78
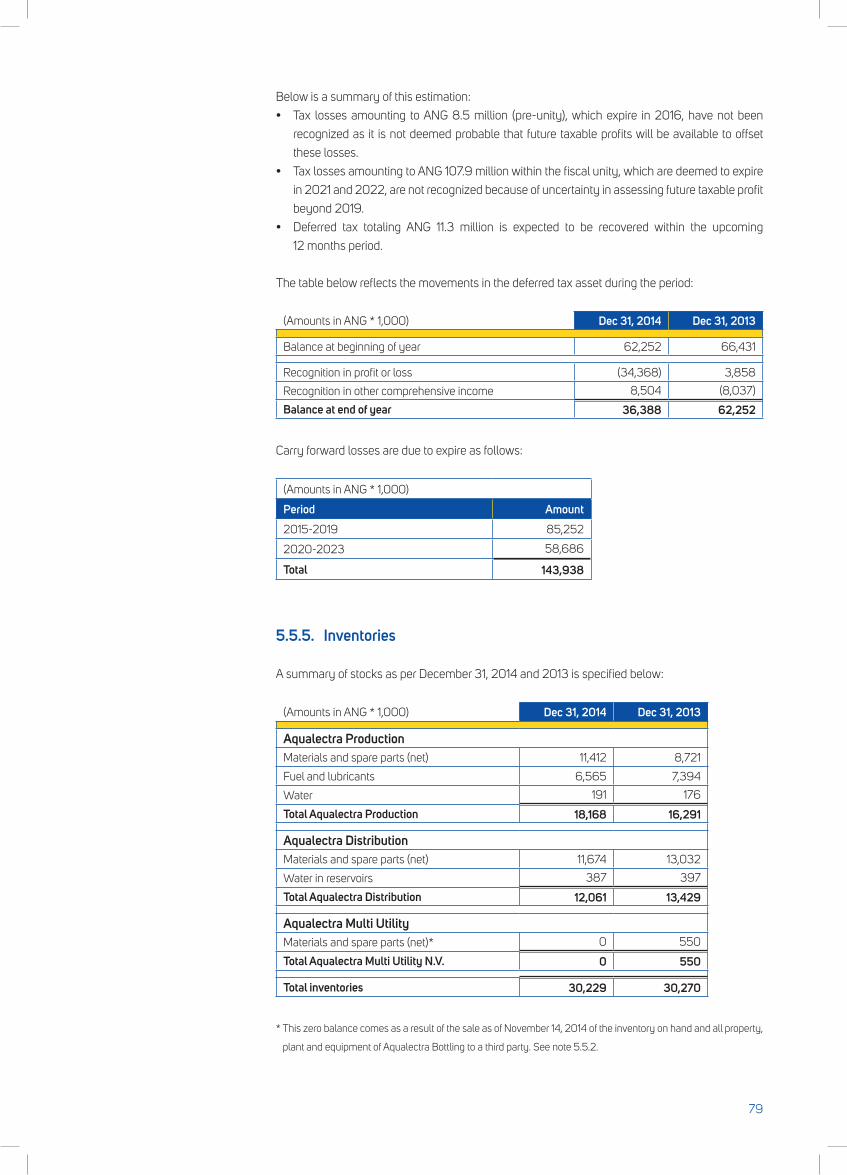
Below is a summary of this estimation:
• Tax lossesamounting toANG8.5million (pre-unity),whichexpire in2016,havenotbeen
recognized as it is not deemed probable that future taxable profits will be available to offset
these losses.
• TaxlossesamountingtoANG107.9millionwithinthefiscalunity,whicharedeemedtoexpire
in 2021 and 2022, are not recognized because of uncertainty in assessing future taxable profit
beyond 2019.
• Deferred tax totaling ANG 11.3 million is expected to be recovered within the upcoming
12 months period.
The table below reflects the movements in the deferred tax asset during the period:
(Amounts in ANG * 1,000) Dec 31, 2014 Dec 31, 2013
Balance at beginning of year 62,252 66,431
Recognition in profit or loss (34,368) 3,858
Recognition in other comprehensive income 8,504 (8,037)
Balance at end of year 36,388 62,252
Carry forward losses are due to expire as follows:
(Amounts in ANG * 1,000)
Period Amount2015-2019 85,252
2020-2023 58,686
Total 143,938
5.5.5. Inventories
A summary of stocks as per December 31, 2014 and 2013 is specified below:
(Amounts in ANG * 1,000) Dec 31, 2014 Dec 31, 2013
Aqualectra ProductionMaterials and spare parts (net) 11,412 8,721
Fuel and lubricants 6,565 7,394
Water 191 176
Total Aqualectra Production 18,168 16,291
Aqualectra DistributionMaterials and spare parts (net) 11,674 13,032
Water in reservoirs 387 397
Total Aqualectra Distribution 12,061 13,429
Aqualectra Multi UtilityMaterials and spare parts (net)* 0 550
Total Aqualectra Multi Utility N.V. 0 550
Total inventories 30,229 30,270
* This zero balance comes as a result of the sale as of November 14, 2014 of the inventory on hand and all property,
plant and equipment of Aqualectra Bottling to a third party. See note 5.5.2.
79
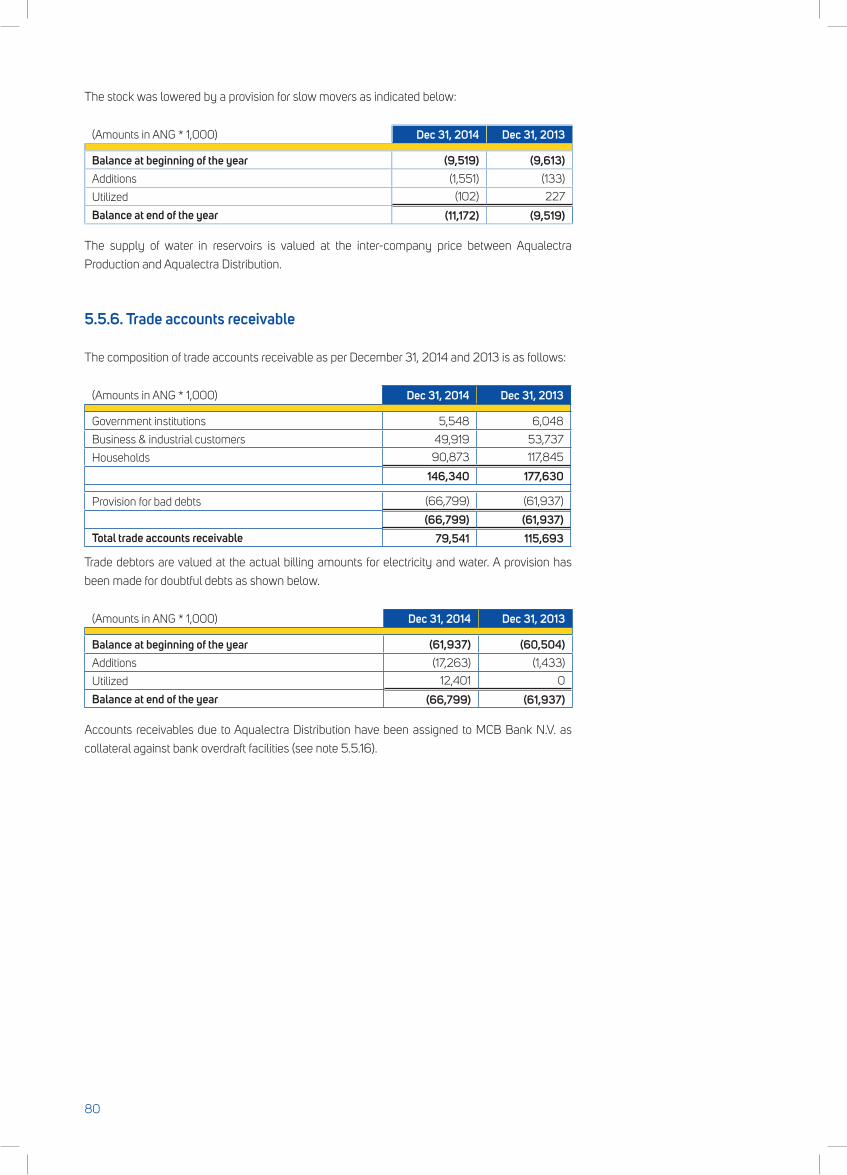
The stock was lowered by a provision for slow movers as indicated below:
(Amounts in ANG * 1,000) Dec 31, 2014 Dec 31, 2013
Balance at beginning of the year (9,519) (9,613)Additions (1,551) (133)
Utilized (102) 227
Balance at end of the year (11,172) (9,519)
The supply of water in reservoirs is valued at the inter-company price between Aqualectra
Production and Aqualectra Distribution.
5.5.6. Trade accounts receivable
The composition of trade accounts receivable as per December 31, 2014 and 2013 is as follows:
(Amounts in ANG * 1,000) Dec 31, 2014 Dec 31, 2013
Government institutions 5,548 6,048
Business & industrial customers 49,919 53,737
Households 90,873 117,845
146,340 177,630
Provision for bad debts (66,799) (61,937)
(66,799) (61,937)Total trade accounts receivable 79,541 115,693
Trade debtors are valued at the actual billing amounts for electricity and water. A provision has
been made for doubtful debts as shown below.
(Amounts in ANG * 1,000) Dec 31, 2014 Dec 31, 2013
Balance at beginning of the year (61,937) (60,504)Additions (17,263) (1,433)
Utilized 12,401 0
Balance at end of the year (66,799) (61,937)
Accounts receivables due to Aqualectra Distribution have been assigned to MCB Bank N.V. as
collateral against bank overdraft facilities (see note 5.5.16).
80
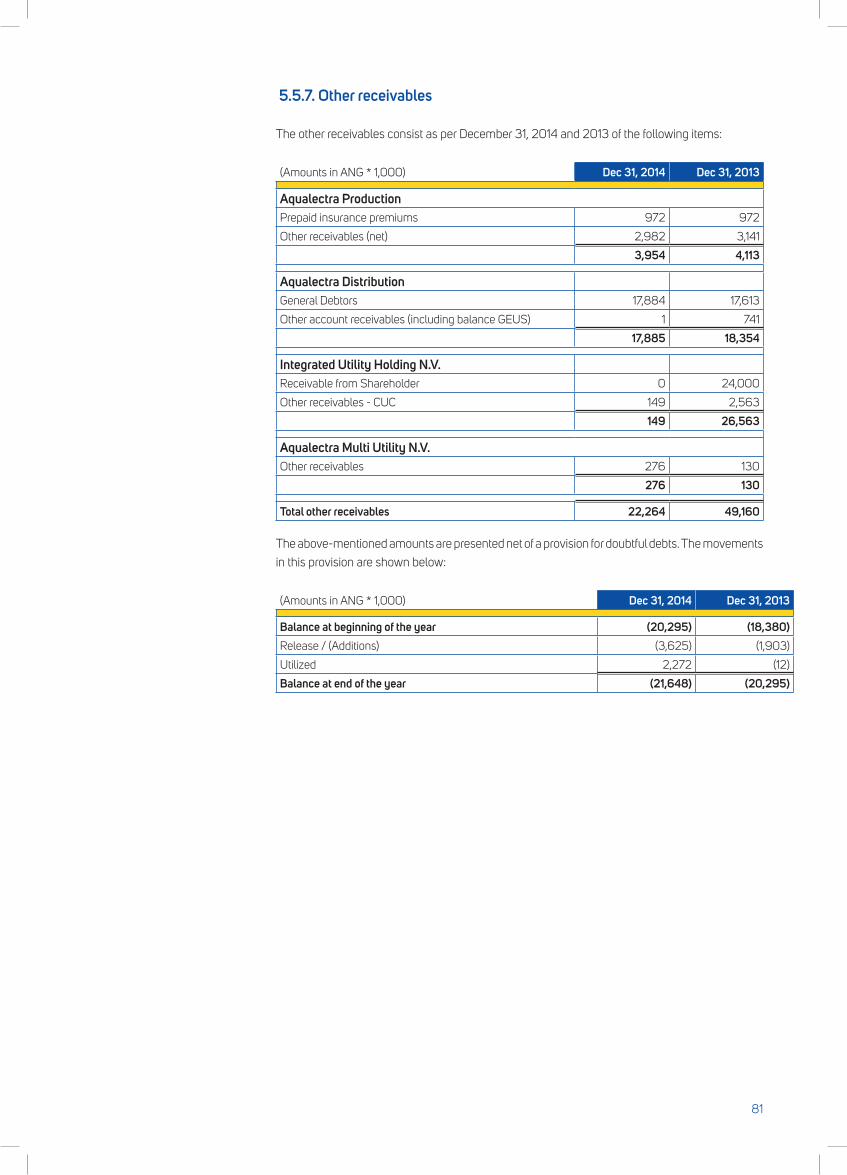
5.5.7. Other receivables
The other receivables consist as per December 31, 2014 and 2013 of the following items:
(Amounts in ANG * 1,000) Dec 31, 2014 Dec 31, 2013
Aqualectra ProductionPrepaid insurance premiums 972 972
Other receivables (net) 2,982 3,141
3,954 4,113
Aqualectra DistributionGeneral Debtors 17,884 17,613
Other account receivables (including balance GEUS) 1 741
17,885 18,354
Integrated Utility Holding N.V.Receivable from Shareholder 0 24,000
Other receivables - CUC 149 2,563
149 26,563
Aqualectra Multi Utility N.V.Other receivables 276 130
276 130
Total other receivables 22,264 49,160
The above-mentioned amounts are presented net of a provision for doubtful debts. The movements
in this provision are shown below:
(Amounts in ANG * 1,000) Dec 31, 2014 Dec 31, 2013
Balance at beginning of the year (20,295) (18,380)Release / (Additions) (3,625) (1,903)
Utilized 2,272 (12)
Balance at end of the year (21,648) (20,295)
81
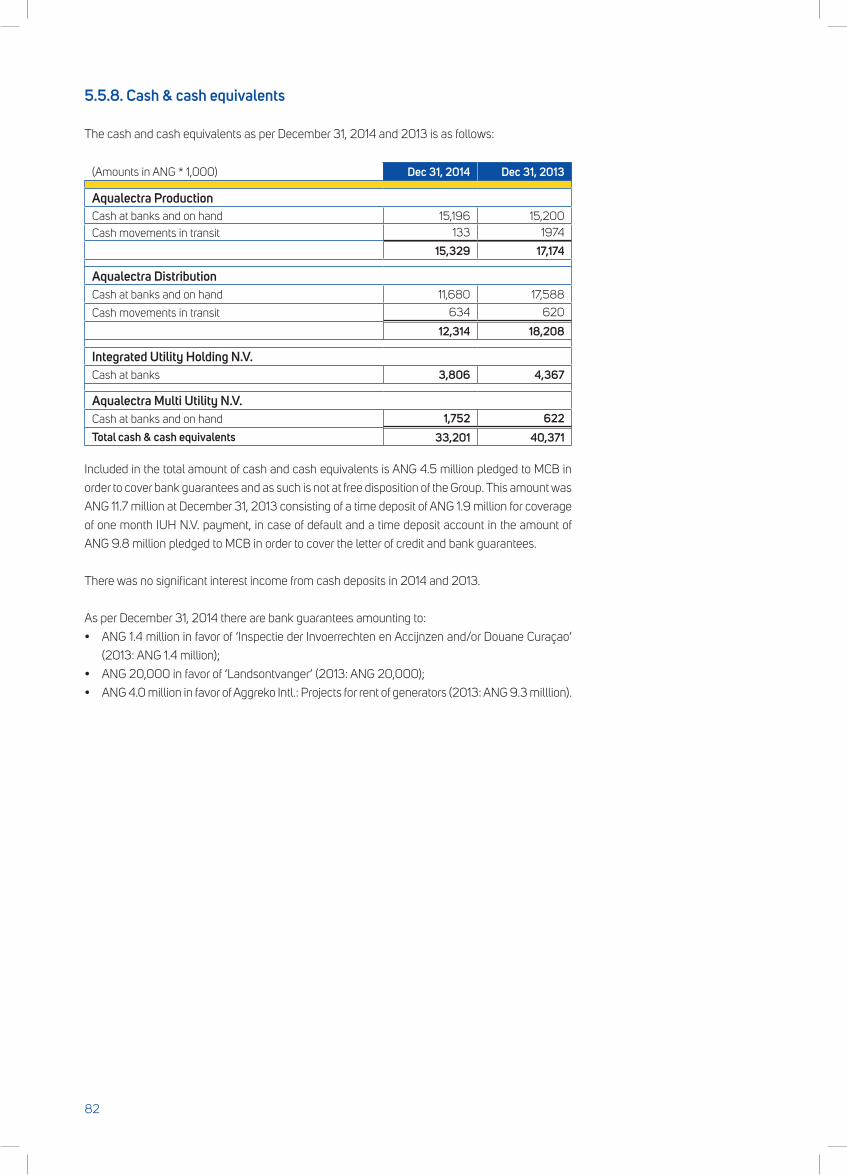
5.5.8. Cash & cash equivalents
The cash and cash equivalents as per December 31, 2014 and 2013 is as follows:
(Amounts in ANG * 1,000) Dec 31, 2014 Dec 31, 2013
Aqualectra ProductionCash at banks and on hand 15,196 15,200 Cash movements in transit 133 1974
15,329 17,174
Aqualectra DistributionCash at banks and on hand 11,680 17,588
Cash movements in transit 634 620
12,314 18,208
Integrated Utility Holding N.V.Cash at banks 3,806 4,367
Aqualectra Multi Utility N.V.Cash at banks and on hand 1,752 622 Total cash & cash equivalents 33,201 40,371
Included in the total amount of cash and cash equivalents is ANG 4.5 million pledged to MCB in
order to cover bank guarantees and as such is not at free disposition of the Group. This amount was
ANG 11.7 million at December 31, 2013 consisting of a time deposit of ANG 1.9 million for coverage
of one month IUH N.V. payment, in case of default and a time deposit account in the amount of
ANG 9.8 million pledged to MCB in order to cover the letter of credit and bank guarantees.
There was no significant interest income from cash deposits in 2014 and 2013.
As per December 31, 2014 there are bank guarantees amounting to:
• ANG1.4millioninfavorof‘InspectiederInvoerrechtenenAccijnzenand/orDouaneCuraçao’
(2013:ANG1.4million);
• ANG20,000infavorof‘Landsontvanger’(2013:ANG20,000);
• ANG4.0millioninfavorofAggrekoIntl.:Projectsforrentofgenerators(2013:ANG9.3milllion).
82
5.5.9. Share capital and share premium
The Company’s authorized capital amounts to ANG 600 million, consisting of 600 shares at
ANG 1 million par value each, of which 470 shares were issued to the Island territory of Curaçao
on June 1, 1998 with an additional 58 shares issued to the Government of Country Curaçao on
January 31, 2013.
All shares are fully paid up as of December 31, 2014. The 470 shares were paid by means of
the contribution of the KODELA (Aqualectra Distribution) and KAE (Aqualectra Production) shares
which resulted in a share premium of ANG 55 million. 34 of the 58 shares issued in 2013, were
paid up in full in 2013 by means of a settlement of the concession security deposit previously due.
The remaining 24 shares were paid during 2014. The shares issued in 2013 were issued at par
value.
During 2014 and 2013 additional movements have occurred directly in equity as a result of IAS 19
calculations (Employee benefits). The movements are detailed in the consolidated statement of
comprehensive income as shown in note 4.2.
5.5.10. Preferred shares and treasury shares
Preferred stock relates to a total of 7,000 shares with a nominal value of ANG 1.- per share sold in
two tranches in accordance with the Preferred Stock Purchase Agreement.
The Purchaser, Mirant, agreed to buy at the First Tranche Closing, December 19, 2001, 2,800
issued shares of Preferred Stock for the total amount of ANG 29.1 million. On September 30,
2002 Mirant agreed to buy at the Second Tranche Closing the remaining 4,200 issued shares of
Preferred Stock for the total amount of ANG 43.7 million.
The 7,000 preferred shares bear a cumulative preferred dividend of 16.75% and were issued for
the financing of future investments in general.
During 2007 Mirant sold its holdings of Aqualectra’s preferred shares to Marubeni TAQA
Corporation.
As per December 30, 2009 the Group entered into a refinancing of its existing debts including
thePreferredStockheldbyMarubeniTAQAandthereforeexerciseditsrighttopurchaseallthe
PreferredStockheldbyMarubeniTAQAandpaidalloutstandingaccruedandunpaidpreferred
dividendsthereontoMarubeniTAQA.
Upon the repurchase of the preferred shares and through date, no decision has been made with
regard to the retirement of these shares. Hence, the repurchase of the shares is presented as a
contra-equity account – Treasury shares.
Currently the Group holds all shares of the company and its subsidiaries.
83
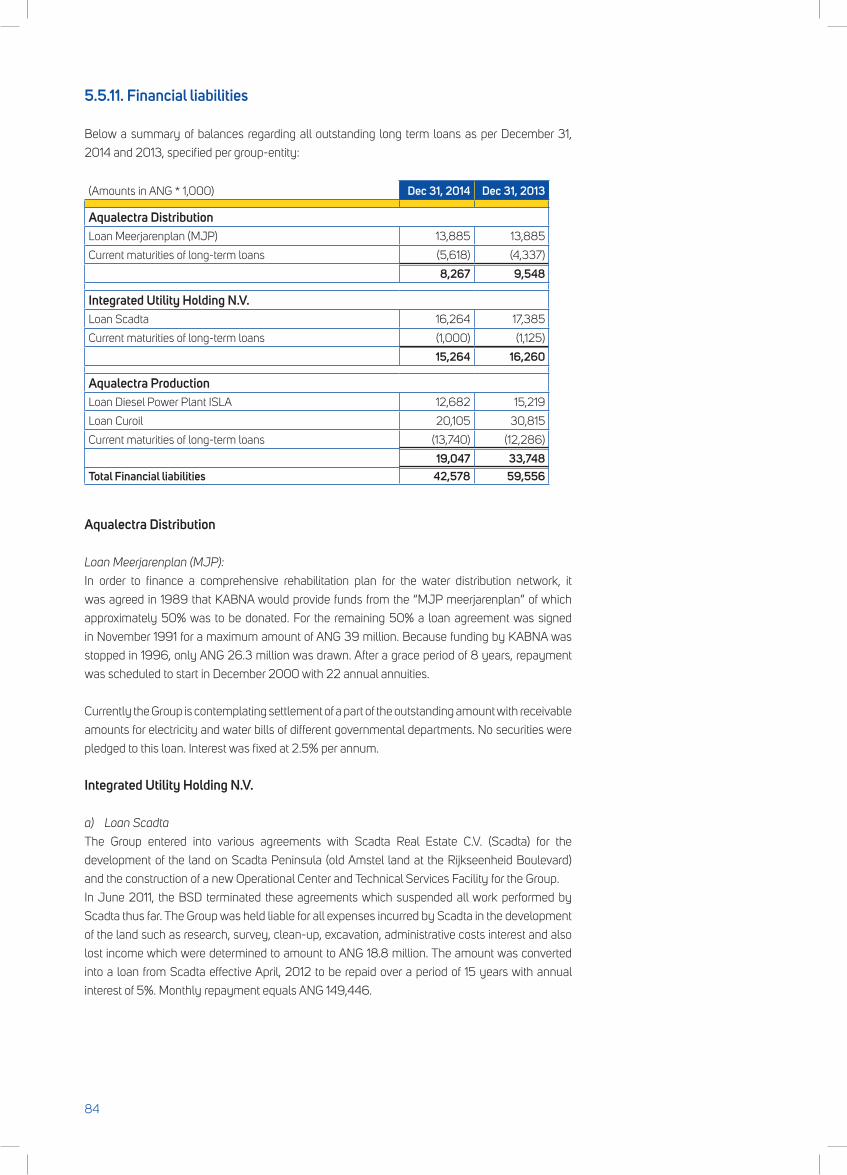
5.5.11. Financial liabilities
Below a summary of balances regarding all outstanding long term loans as per December 31,
2014 and 2013, specified per group-entity:
(Amounts in ANG * 1,000) Dec 31, 2014 Dec 31, 2013
Aqualectra DistributionLoan Meerjarenplan (MJP) 13,885 13,885
Current maturities of long-term loans (5,618) (4,337)
8,267 9,548
Integrated Utility Holding N.V.Loan Scadta 16,264 17,385
Current maturities of long-term loans (1,000) (1,125)
15,264 16,260
Aqualectra ProductionLoan Diesel Power Plant ISLA 12,682 15,219
Loan Curoil 20,105 30,815
Current maturities of long-term loans (13,740) (12,286)
19,047 33,748 Total Financial liabilities 42,578 59,556
Aqualectra Distribution
Loan Meerjarenplan (MJP):
In order to finance a comprehensive rehabilitation plan for the water distribution network, it
was agreed in 1989 that KABNA would provide funds from the “MJP meerjarenplan” of which
approximately 50% was to be donated. For the remaining 50% a loan agreement was signed
in November 1991 for a maximum amount of ANG 39 million. Because funding by KABNA was
stopped in 1996, only ANG 26.3 million was drawn. After a grace period of 8 years, repayment
was scheduled to start in December 2000 with 22 annual annuities.
Currently the Group is contemplating settlement of a part of the outstanding amount with receivable
amounts for electricity and water bills of different governmental departments. No securities were
pledged to this loan. Interest was fixed at 2.5% per annum.
Integrated Utility Holding N.V.
a) Loan Scadta
The Group entered into various agreements with Scadta Real Estate C.V. (Scadta) for the
development of the land on Scadta Peninsula (old Amstel land at the Rijkseenheid Boulevard)
and the construction of a new Operational Center and Technical Services Facility for the Group.
In June 2011, the BSD terminated these agreements which suspended all work performed by
Scadta thus far. The Group was held liable for all expenses incurred by Scadta in the development
of the land such as research, survey, clean-up, excavation, administrative costs interest and also
lost income which were determined to amount to ANG 18.8 million. The amount was converted
into a loan from Scadta effective April, 2012 to be repaid over a period of 15 years with annual
interest of 5%. Monthly repayment equals ANG 149,446.
84
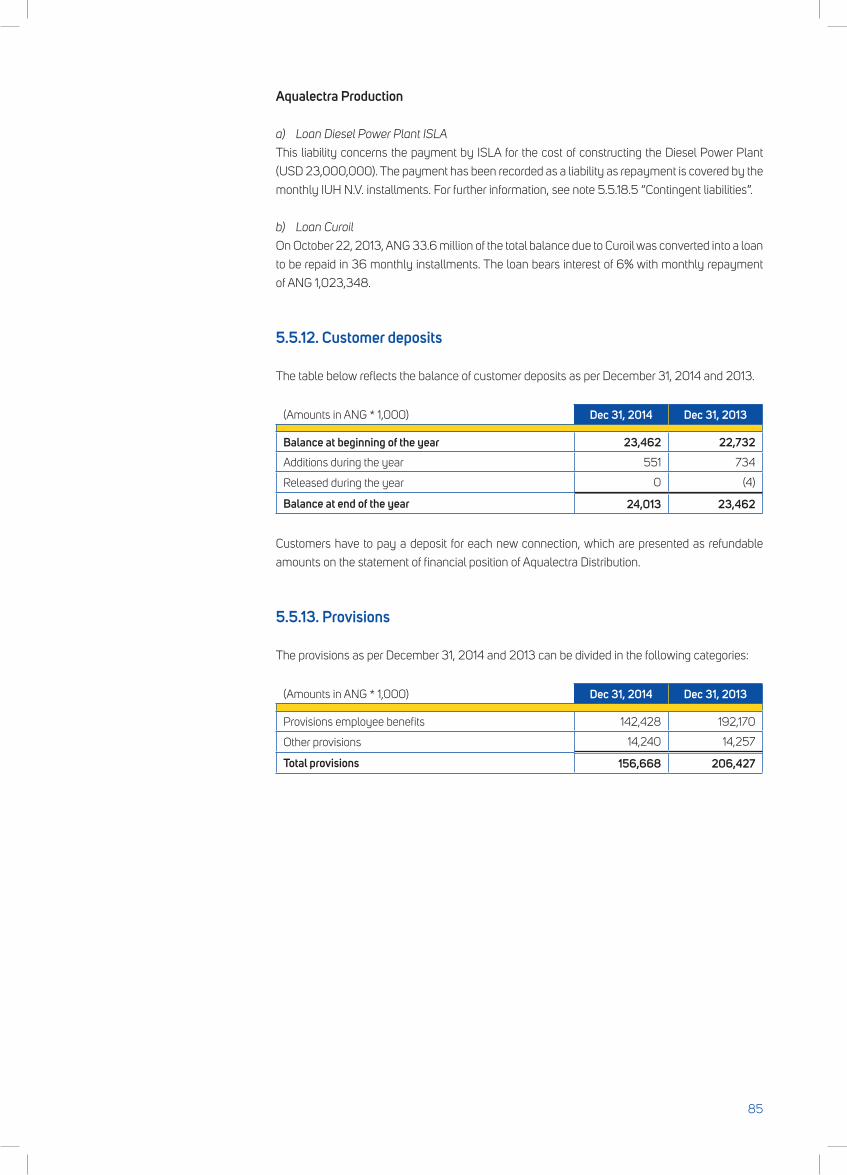
Aqualectra Production
a) Loan Diesel Power Plant ISLA
This liability concerns the payment by ISLA for the cost of constructing the Diesel Power Plant
(USD 23,000,000). The payment has been recorded as a liability as repayment is covered by the
monthly IUH N.V. installments. For further information, see note 5.5.18.5 “Contingent liabilities”.
b) Loan Curoil
On October 22, 2013, ANG 33.6 million of the total balance due to Curoil was converted into a loan
to be repaid in 36 monthly installments. The loan bears interest of 6% with monthly repayment
of ANG 1,023,348.
5.5.12. Customer deposits
The table below reflects the balance of customer deposits as per December 31, 2014 and 2013.
(Amounts in ANG * 1,000) Dec 31, 2014 Dec 31, 2013
Balance at beginning of the year 23,462 22,732Additions during the year 551 734
Released during the year 0 (4)
Balance at end of the year 24,013 23,462
Customers have to pay a deposit for each new connection, which are presented as refundable
amounts on the statement of financial position of Aqualectra Distribution.
5.5.13. Provisions
The provisions as per December 31, 2014 and 2013 can be divided in the following categories:
(Amounts in ANG * 1,000) Dec 31, 2014 Dec 31, 2013
Provisions employee benefits 142,428 192,170
Other provisions 14,240 14,257
Total provisions 156,668 206,427
85
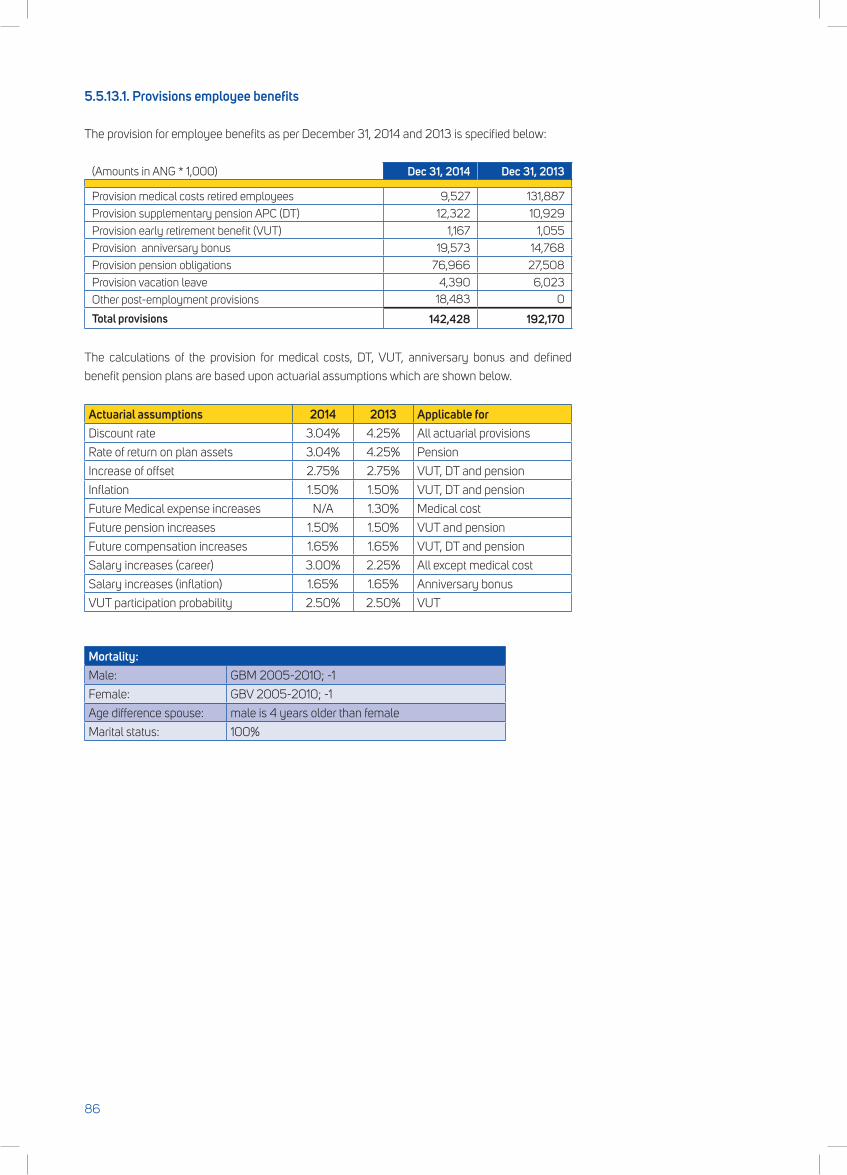
5.5.13.1. Provisions employee benefits
The provision for employee benefits as per December 31, 2014 and 2013 is specified below:
(Amounts in ANG * 1,000) Dec 31, 2014 Dec 31, 2013
Provision medical costs retired employees 9,527 131,887 Provision supplementary pension APC (DT) 12,322 10,929 Provision early retirement benefit (VUT) 1,167 1,055 Provision anniversary bonus 19,573 14,768 Provision pension obligations 76,966 27,508 Provision vacation leave 4,390 6,023 Other post-employment provisions 18,483 0
Total provisions 142,428 192,170
The calculations of the provision for medical costs, DT, VUT, anniversary bonus and defined
benefit pension plans are based upon actuarial assumptions which are shown below.
Actuarial assumptions 2014 2013 Applicable forDiscount rate 3.04% 4.25% All actuarial provisions
Rate of return on plan assets 3.04% 4.25% Pension
Increase of offset 2.75% 2.75% VUT, DT and pension
Inflation 1.50% 1.50% VUT, DT and pension
Future Medical expense increases N/A 1.30% Medical cost
Future pension increases 1.50% 1.50% VUT and pension
Future compensation increases 1.65% 1.65% VUT, DT and pension
Salary increases (career) 3.00% 2.25% All except medical cost
Salary increases (inflation) 1.65% 1.65% Anniversary bonus
VUT participation probability 2.50% 2.50% VUT
Mortality:Male: GBM2005-2010;-1
Female: GBV2005-2010;-1
Age difference spouse: male is 4 years older than female
Marital status: 100%
86
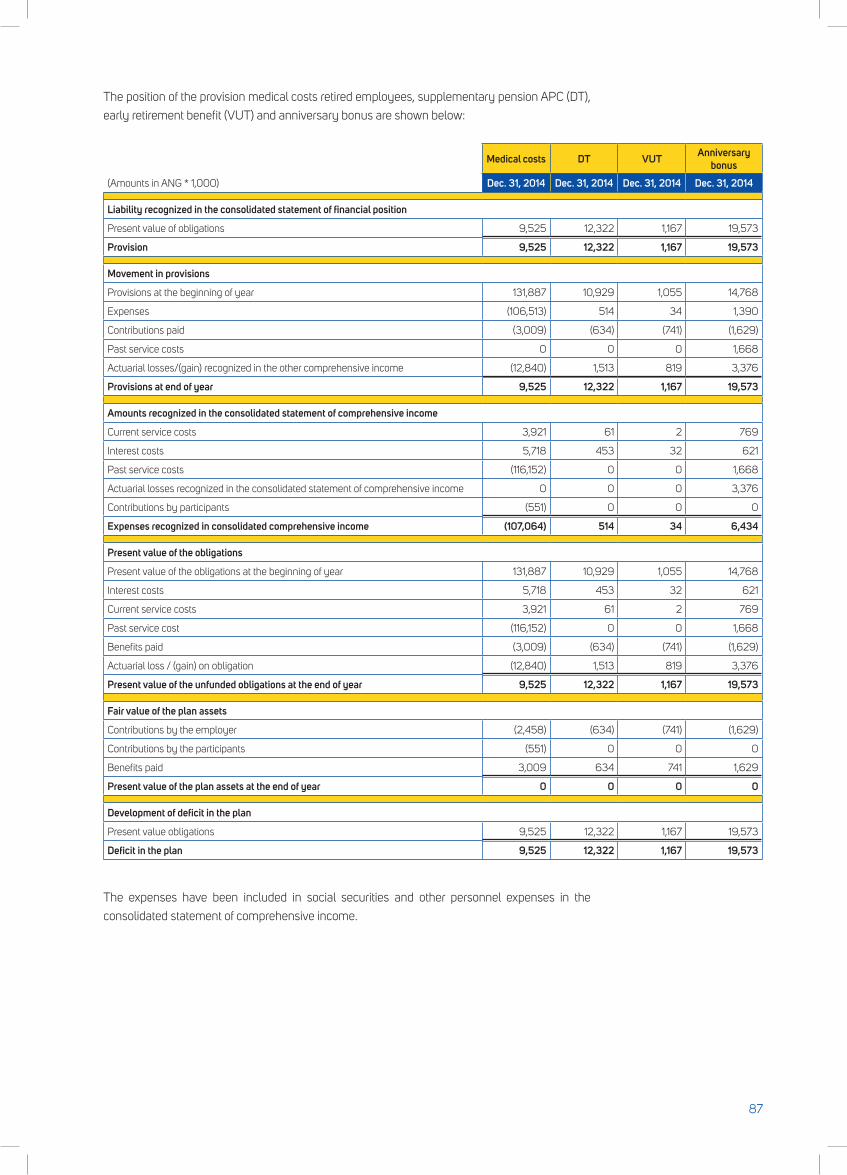
The position of the provision medical costs retired employees, supplementary pension APC (DT),
early retirement benefit (VUT) and anniversary bonus are shown below:
Medical costs DT VUT Anniversary bonus
(Amounts in ANG * 1,000) Dec. 31, 2014 Dec. 31, 2014 Dec. 31, 2014 Dec. 31, 2014
Liability recognized in the consolidated statement of financial position
Present value of obligations 9,525 12,322 1,167 19,573
Provision 9,525 12,322 1,167 19,573
Movement in provisions
Provisions at the beginning of year 131,887 10,929 1,055 14,768
Expenses (106,513) 514 34 1,390
Contributions paid (3,009) (634) (741) (1,629)
Past service costs 0 0 0 1,668
Actuarial losses/(gain) recognized in the other comprehensive income (12,840) 1,513 819 3,376
Provisions at end of year 9,525 12,322 1,167 19,573
Amounts recognized in the consolidated statement of comprehensive income
Current service costs 3,921 61 2 769
Interest costs 5,718 453 32 621
Past service costs (116,152) 0 0 1,668
Actuarial losses recognized in the consolidated statement of comprehensive income 0 0 0 3,376
Contributions by participants (551) 0 0 0
Expenses recognized in consolidated comprehensive income (107,064) 514 34 6,434
Present value of the obligations
Present value of the obligations at the beginning of year 131,887 10,929 1,055 14,768
Interest costs 5,718 453 32 621
Current service costs 3,921 61 2 769
Past service cost (116,152) 0 0 1,668
Benefits paid (3,009) (634) (741) (1,629)
Actuarial loss / (gain) on obligation (12,840) 1,513 819 3,376
Present value of the unfunded obligations at the end of year 9,525 12,322 1,167 19,573
Fair value of the plan assets
Contributions by the employer (2,458) (634) (741) (1,629)
Contributions by the participants (551) 0 0 0
Benefits paid 3,009 634 741 1,629
Present value of the plan assets at the end of year 0 0 0 0
Development of deficit in the plan
Present value obligations 9,525 12,322 1,167 19,573
Deficit in the plan 9,525 12,322 1,167 19,573
The expenses have been included in social securities and other personnel expenses in the
consolidated statement of comprehensive income.
87
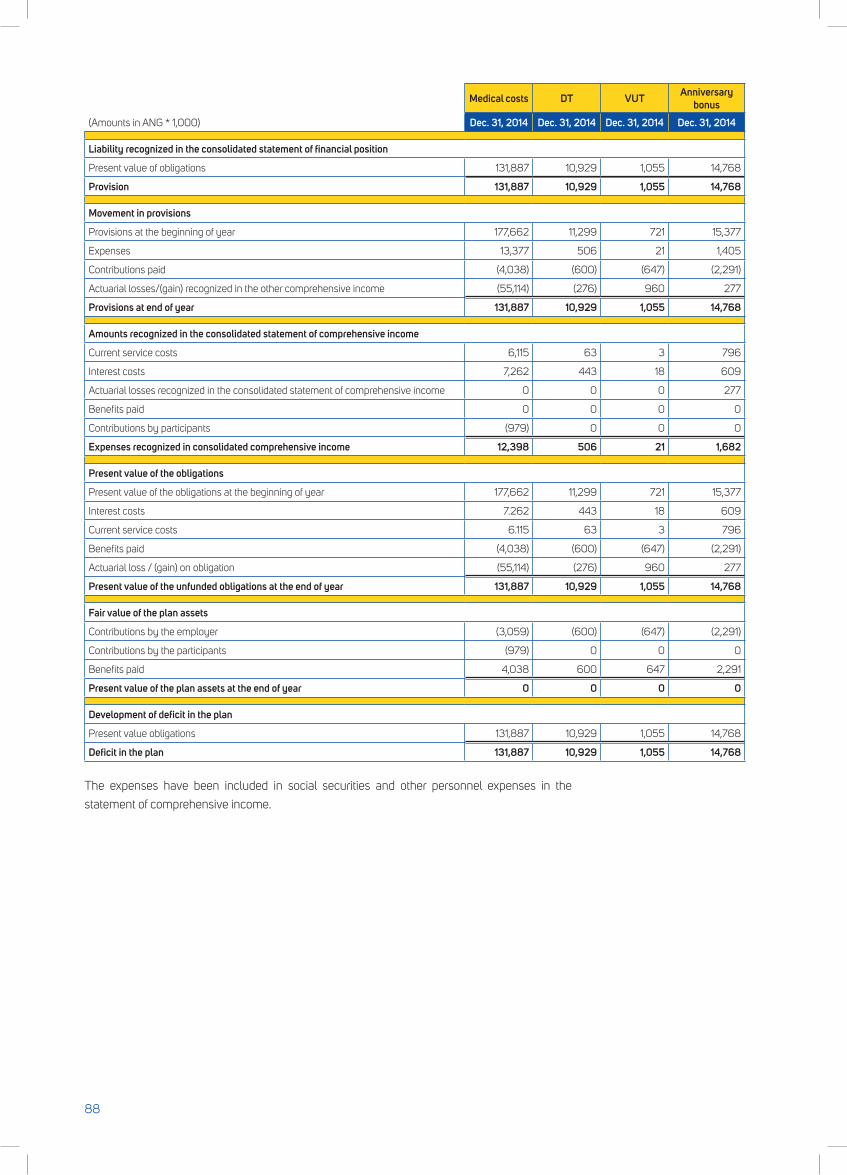
Medical costs DT VUT Anniversary bonus
(Amounts in ANG * 1,000) Dec. 31, 2014 Dec. 31, 2014 Dec. 31, 2014 Dec. 31, 2014
Liability recognized in the consolidated statement of financial position
Present value of obligations 131,887 10,929 1,055 14,768
Provision 131,887 10,929 1,055 14,768
Movement in provisions
Provisions at the beginning of year 177,662 11,299 721 15,377
Expenses 13,377 506 21 1,405
Contributions paid (4,038) (600) (647) (2,291)
Actuarial losses/(gain) recognized in the other comprehensive income (55,114) (276) 960 277
Provisions at end of year 131,887 10,929 1,055 14,768
Amounts recognized in the consolidated statement of comprehensive income
Current service costs 6,115 63 3 796
Interest costs 7,262 443 18 609
Actuarial losses recognized in the consolidated statement of comprehensive income 0 0 0 277
Benefits paid 0 0 0 0
Contributions by participants (979) 0 0 0
Expenses recognized in consolidated comprehensive income 12,398 506 21 1,682
Present value of the obligations
Present value of the obligations at the beginning of year 177,662 11,299 721 15,377
Interest costs 7.262 443 18 609
Current service costs 6.115 63 3 796
Benefits paid (4,038) (600) (647) (2,291)
Actuarial loss / (gain) on obligation (55,114) (276) 960 277
Present value of the unfunded obligations at the end of year 131,887 10,929 1,055 14,768
Fair value of the plan assets
Contributions by the employer (3,059) (600) (647) (2,291)
Contributions by the participants (979) 0 0 0
Benefits paid 4,038 600 647 2,291
Present value of the plan assets at the end of year 0 0 0 0
Development of deficit in the plan
Present value obligations 131,887 10,929 1,055 14,768
Deficit in the plan 131,887 10,929 1,055 14,768
The expenses have been included in social securities and other personnel expenses in the
statement of comprehensive income.
88
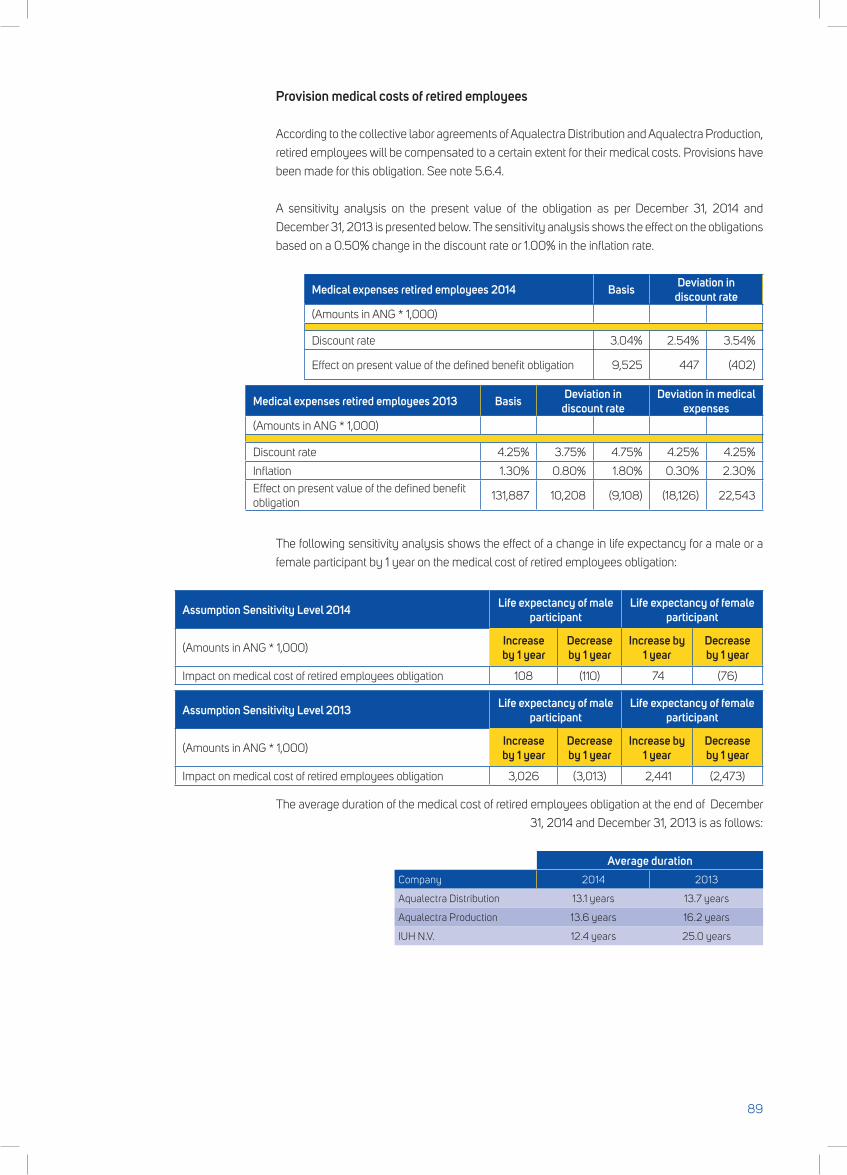
Provision medical costs of retired employees
According to the collective labor agreements of Aqualectra Distribution and Aqualectra Production,
retired employees will be compensated to a certain extent for their medical costs. Provisions have
been made for this obligation. See note 5.6.4.
A sensitivity analysis on the present value of the obligation as per December 31, 2014 and
December 31, 2013 is presented below. The sensitivity analysis shows the effect on the obligations
based on a 0.50% change in the discount rate or 1.00% in the inflation rate.
Medical expenses retired employees 2014 Basis Deviation in discount rate
(Amounts in ANG * 1,000)
Discount rate 3.04% 2.54% 3.54%
Effect on present value of the defined benefit obligation 9,525 447 (402)
Medical expenses retired employees 2013 Basis Deviation in discount rate
Deviation in medical expenses
(Amounts in ANG * 1,000)
Discount rate 4.25% 3.75% 4.75% 4.25% 4.25%
Inflation 1.30% 0.80% 1.80% 0.30% 2.30%Effect on present value of the defined benefit obligation
131,887 10,208 (9,108) (18,126) 22,543
The following sensitivity analysis shows the effect of a change in life expectancy for a male or a
female participant by 1 year on the medical cost of retired employees obligation:
Assumption Sensitivity Level 2014 Life expectancy of male participant
Life expectancy of female participant
(Amounts in ANG * 1,000)Increase by 1 year
Decrease by 1 year
Increase by 1 year
Decrease by 1 year
Impact on medical cost of retired employees obligation 108 (110) 74 (76)
Assumption Sensitivity Level 2013 Life expectancy of male participant
Life expectancy of female participant
(Amounts in ANG * 1,000)Increase by 1 year
Decrease by 1 year
Increase by 1 year
Decrease by 1 year
Impact on medical cost of retired employees obligation 3,026 (3,013) 2,441 (2,473)
The average duration of the medical cost of retired employees obligation at the end of December
31, 2014 and December 31, 2013 is as follows:
Average durationCompany 2014 2013
Aqualectra Distribution 13.1 years 13.7 years
Aqualectra Production 13.6 years 16.2 years
IUH N.V. 12.4 years 25.0 years
89
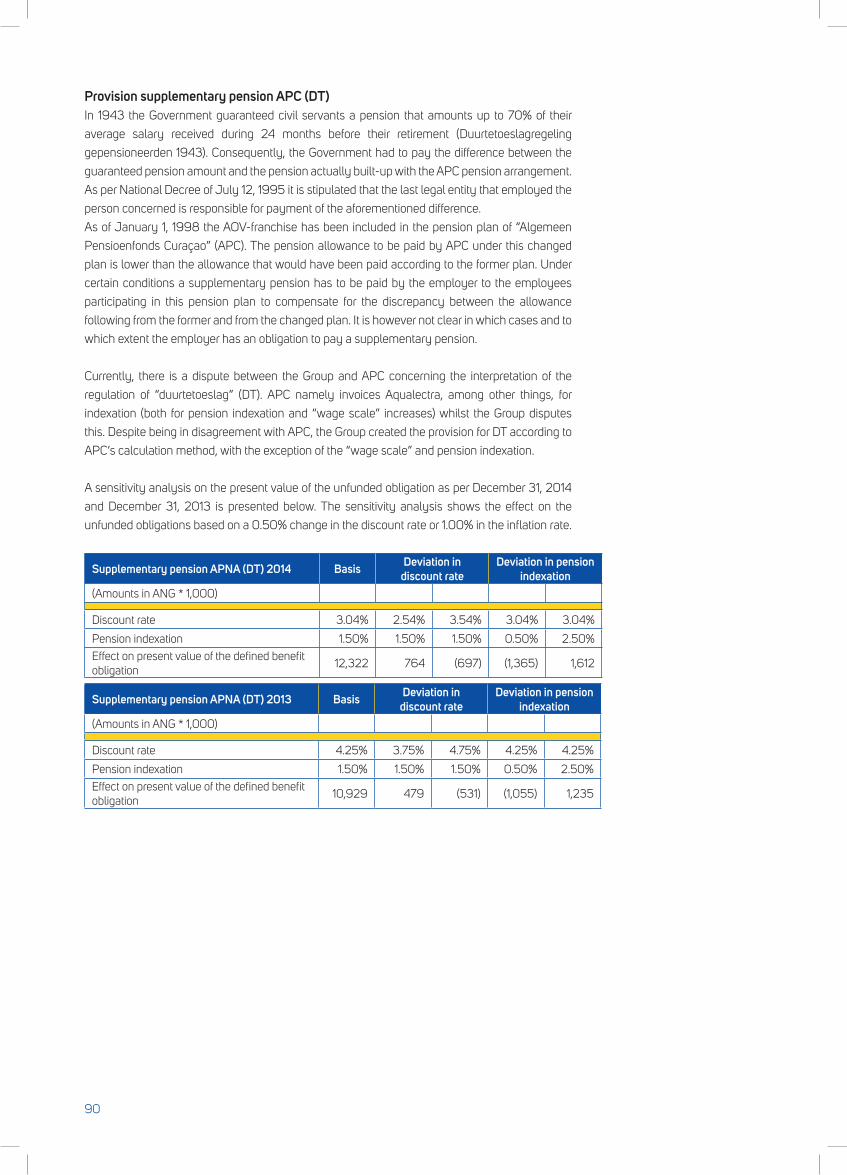
Provision supplementary pension APC (DT)In 1943 the Government guaranteed civil servants a pension that amounts up to 70% of their
average salary received during 24 months before their retirement (Duurtetoeslagregeling
gepensioneerden 1943). Consequently, the Government had to pay the difference between the
guaranteed pension amount and the pension actually built-up with the APC pension arrangement.
As per National Decree of July 12, 1995 it is stipulated that the last legal entity that employed the
person concerned is responsible for payment of the aforementioned difference.
As of January 1, 1998 the AOV-franchise has been included in the pension plan of “Algemeen
Pensioenfonds Curaçao” (APC). The pension allowance to be paid by APC under this changed
plan is lower than the allowance that would have been paid according to the former plan. Under
certain conditions a supplementary pension has to be paid by the employer to the employees
participating in this pension plan to compensate for the discrepancy between the allowance
following from the former and from the changed plan. It is however not clear in which cases and to
which extent the employer has an obligation to pay a supplementary pension.
Currently, there is a dispute between the Group and APC concerning the interpretation of the
regulation of “duurtetoeslag” (DT). APC namely invoices Aqualectra, among other things, for
indexation (both for pension indexation and “wage scale” increases) whilst the Group disputes
this. Despite being in disagreement with APC, the Group created the provision for DT according to
APC’s calculation method, with the exception of the “wage scale” and pension indexation.
A sensitivity analysis on the present value of the unfunded obligation as per December 31, 2014
and December 31, 2013 is presented below. The sensitivity analysis shows the effect on the
unfunded obligations based on a 0.50% change in the discount rate or 1.00% in the inflation rate.
Supplementary pension APNA (DT) 2014 Basis Deviation in discount rate
Deviation in pension indexation
(Amounts in ANG * 1,000)
Discount rate 3.04% 2.54% 3.54% 3.04% 3.04%
Pension indexation 1.50% 1.50% 1.50% 0.50% 2.50%Effect on present value of the defined benefit obligation
12,322 764 (697) (1,365) 1,612
Supplementary pension APNA (DT) 2013 Basis Deviation in discount rate
Deviation in pension indexation
(Amounts in ANG * 1,000)
Discount rate 4.25% 3.75% 4.75% 4.25% 4.25%
Pension indexation 1.50% 1.50% 1.50% 0.50% 2.50%Effect on present value of the defined benefit obligation
10,929 479 (531) (1,055) 1,235
90
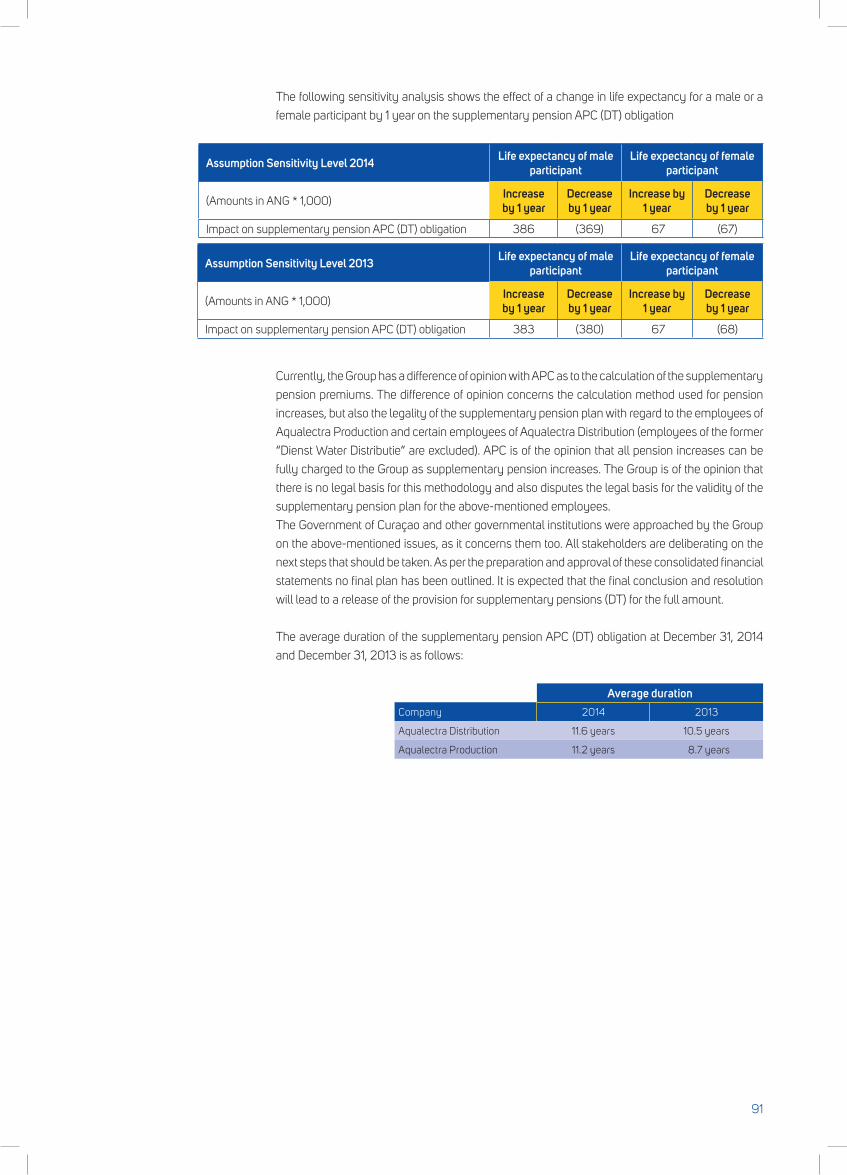
The following sensitivity analysis shows the effect of a change in life expectancy for a male or a
female participant by 1 year on the supplementary pension APC (DT) obligation
Assumption Sensitivity Level 2014 Life expectancy of male participant
Life expectancy of female participant
(Amounts in ANG * 1,000)Increase by 1 year
Decrease by 1 year
Increase by 1 year
Decrease by 1 year
Impact on supplementary pension APC (DT) obligation 386 (369) 67 (67)
Assumption Sensitivity Level 2013 Life expectancy of male participant
Life expectancy of female participant
(Amounts in ANG * 1,000)Increase by 1 year
Decrease by 1 year
Increase by 1 year
Decrease by 1 year
Impact on supplementary pension APC (DT) obligation 383 (380) 67 (68)
Currently, the Group has a difference of opinion with APC as to the calculation of the supplementary
pension premiums. The difference of opinion concerns the calculation method used for pension
increases, but also the legality of the supplementary pension plan with regard to the employees of
Aqualectra Production and certain employees of Aqualectra Distribution (employees of the former
“Dienst Water Distributie” are excluded). APC is of the opinion that all pension increases can be
fully charged to the Group as supplementary pension increases. The Group is of the opinion that
there is no legal basis for this methodology and also disputes the legal basis for the validity of the
supplementary pension plan for the above-mentioned employees.
The Government of Curaçao and other governmental institutions were approached by the Group
on the above-mentioned issues, as it concerns them too. All stakeholders are deliberating on the
next steps that should be taken. As per the preparation and approval of these consolidated financial
statements no final plan has been outlined. It is expected that the final conclusion and resolution
will lead to a release of the provision for supplementary pensions (DT) for the full amount.
The average duration of the supplementary pension APC (DT) obligation at December 31, 2014
and December 31, 2013 is as follows:
Average durationCompany 2014 2013
Aqualectra Distribution 11.6 years 10.5 years
Aqualectra Production 11.2 years 8.7 years
91
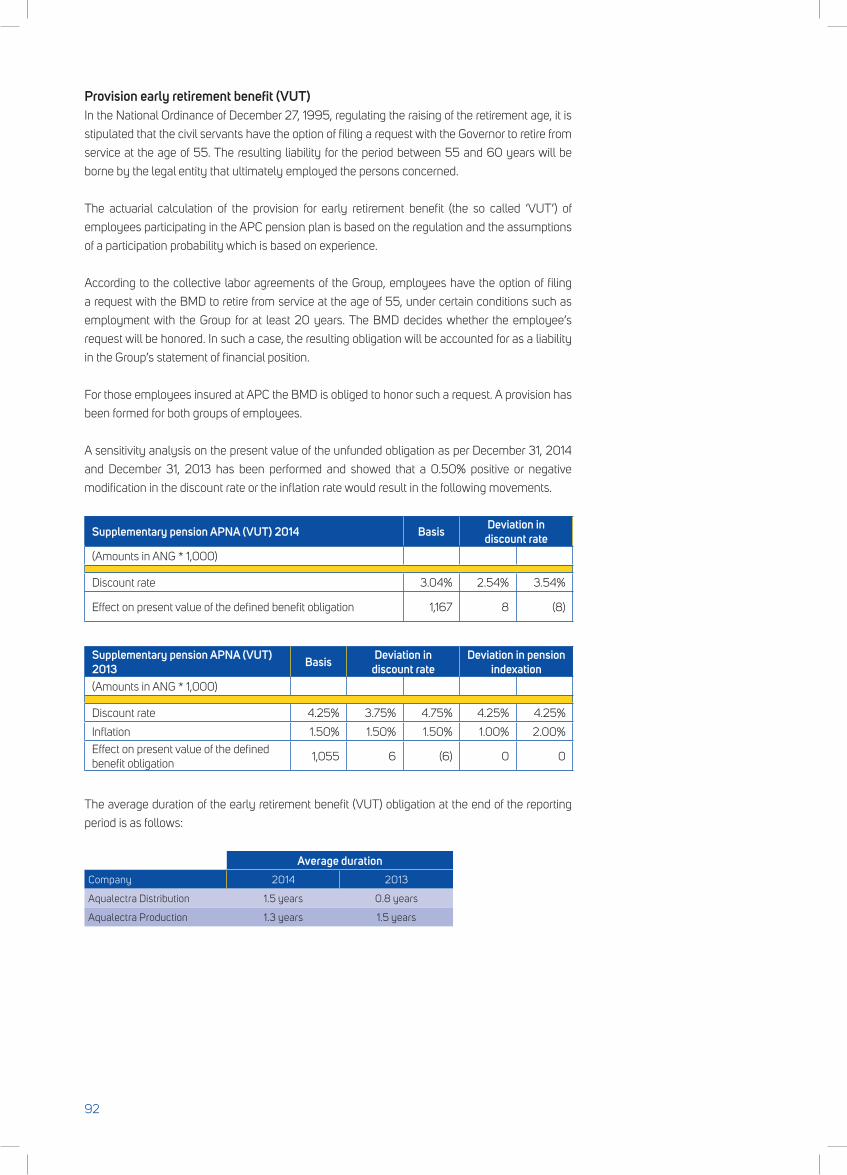
Provision early retirement benefit (VUT)In the National Ordinance of December 27, 1995, regulating the raising of the retirement age, it is
stipulated that the civil servants have the option of filing a request with the Governor to retire from
service at the age of 55. The resulting liability for the period between 55 and 60 years will be
borne by the legal entity that ultimately employed the persons concerned.
The actuarial calculation of the provision for early retirement benefit (the so called ‘VUT’) of
employees participating in the APC pension plan is based on the regulation and the assumptions
of a participation probability which is based on experience.
According to the collective labor agreements of the Group, employees have the option of filing
a request with the BMD to retire from service at the age of 55, under certain conditions such as
employment with the Group for at least 20 years. The BMD decides whether the employee’s
request will be honored. In such a case, the resulting obligation will be accounted for as a liability
in the Group’s statement of financial position.
For those employees insured at APC the BMD is obliged to honor such a request. A provision has
been formed for both groups of employees.
A sensitivity analysis on the present value of the unfunded obligation as per December 31, 2014
and December 31, 2013 has been performed and showed that a 0.50% positive or negative
modification in the discount rate or the inflation rate would result in the following movements.
Supplementary pension APNA (VUT) 2014 Basis Deviation in discount rate
(Amounts in ANG * 1,000)
Discount rate 3.04% 2.54% 3.54%
Effect on present value of the defined benefit obligation 1,167 8 (8)
Supplementary pension APNA (VUT) 2013 Basis Deviation in
discount rateDeviation in pension
indexation(Amounts in ANG * 1,000)
Discount rate 4.25% 3.75% 4.75% 4.25% 4.25%
Inflation 1.50% 1.50% 1.50% 1.00% 2.00%Effect on present value of the defined benefit obligation
1,055 6 (6) 0 0
The average duration of the early retirement benefit (VUT) obligation at the end of the reporting
period is as follows:
Average durationCompany 2014 2013
Aqualectra Distribution 1.5 years 0.8 years
Aqualectra Production 1.3 years 1.5 years
92
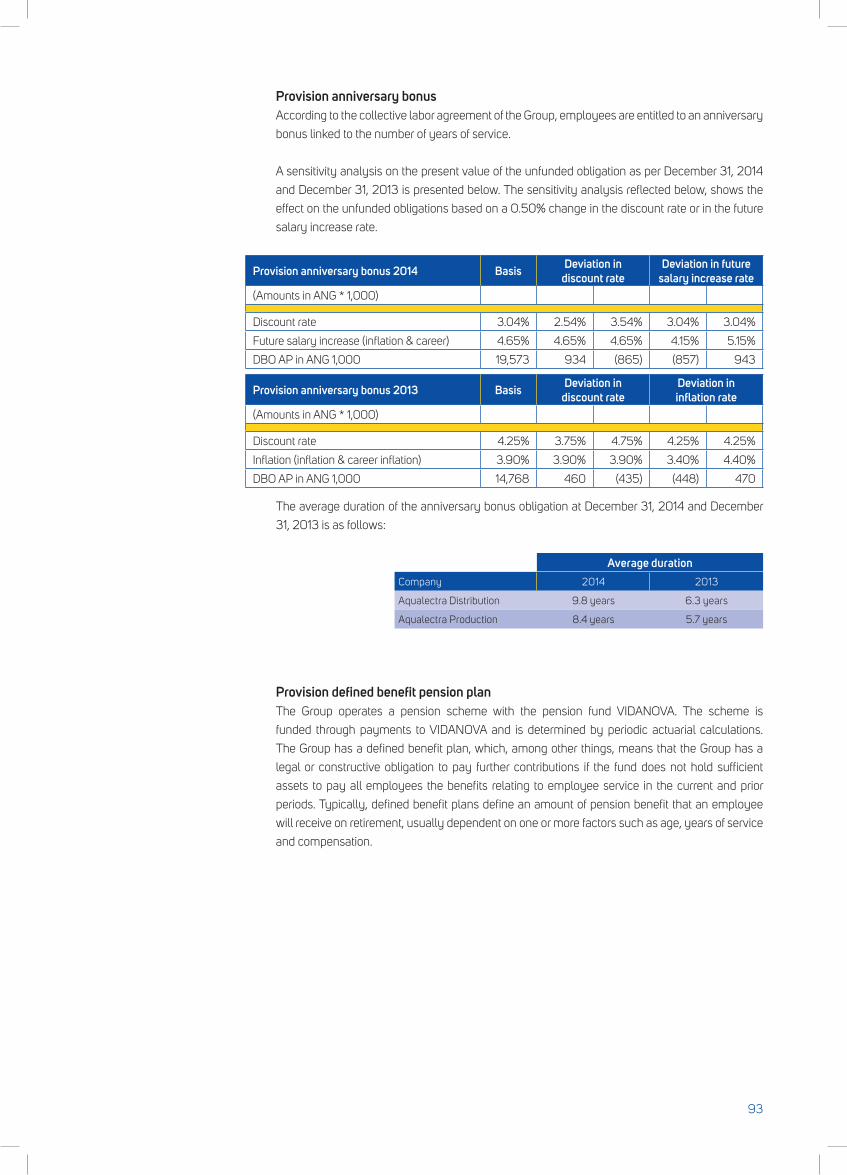
Provision anniversary bonusAccording to the collective labor agreement of the Group, employees are entitled to an anniversary
bonus linked to the number of years of service.
A sensitivity analysis on the present value of the unfunded obligation as per December 31, 2014
and December 31, 2013 is presented below. The sensitivity analysis reflected below, shows the
effect on the unfunded obligations based on a 0.50% change in the discount rate or in the future
salary increase rate.
Provision anniversary bonus 2014 Basis Deviation in discount rate
Deviation in future salary increase rate
(Amounts in ANG * 1,000)
Discount rate 3.04% 2.54% 3.54% 3.04% 3.04%
Future salary increase (inflation & career) 4.65% 4.65% 4.65% 4.15% 5.15%
DBO AP in ANG 1,000 19,573 934 (865) (857) 943
Provision anniversary bonus 2013 Basis Deviation in discount rate
Deviation in inflation rate
(Amounts in ANG * 1,000)
Discount rate 4.25% 3.75% 4.75% 4.25% 4.25%
Inflation (inflation & career inflation) 3.90% 3.90% 3.90% 3.40% 4.40%
DBO AP in ANG 1,000 14,768 460 (435) (448) 470
The average duration of the anniversary bonus obligation at December 31, 2014 and December
31, 2013 is as follows:
Average durationCompany 2014 2013
Aqualectra Distribution 9.8 years 6.3 years
Aqualectra Production 8.4 years 5.7 years
Provision defined benefit pension planThe Group operates a pension scheme with the pension fund VIDANOVA. The scheme is
funded through payments to VIDANOVA and is determined by periodic actuarial calculations.
The Group has a defined benefit plan, which, among other things, means that the Group has a
legal or constructive obligation to pay further contributions if the fund does not hold sufficient
assets to pay all employees the benefits relating to employee service in the current and prior
periods. Typically, defined benefit plans define an amount of pension benefit that an employee
will receive on retirement, usually dependent on one or more factors such as age, years of service
and compensation.
93
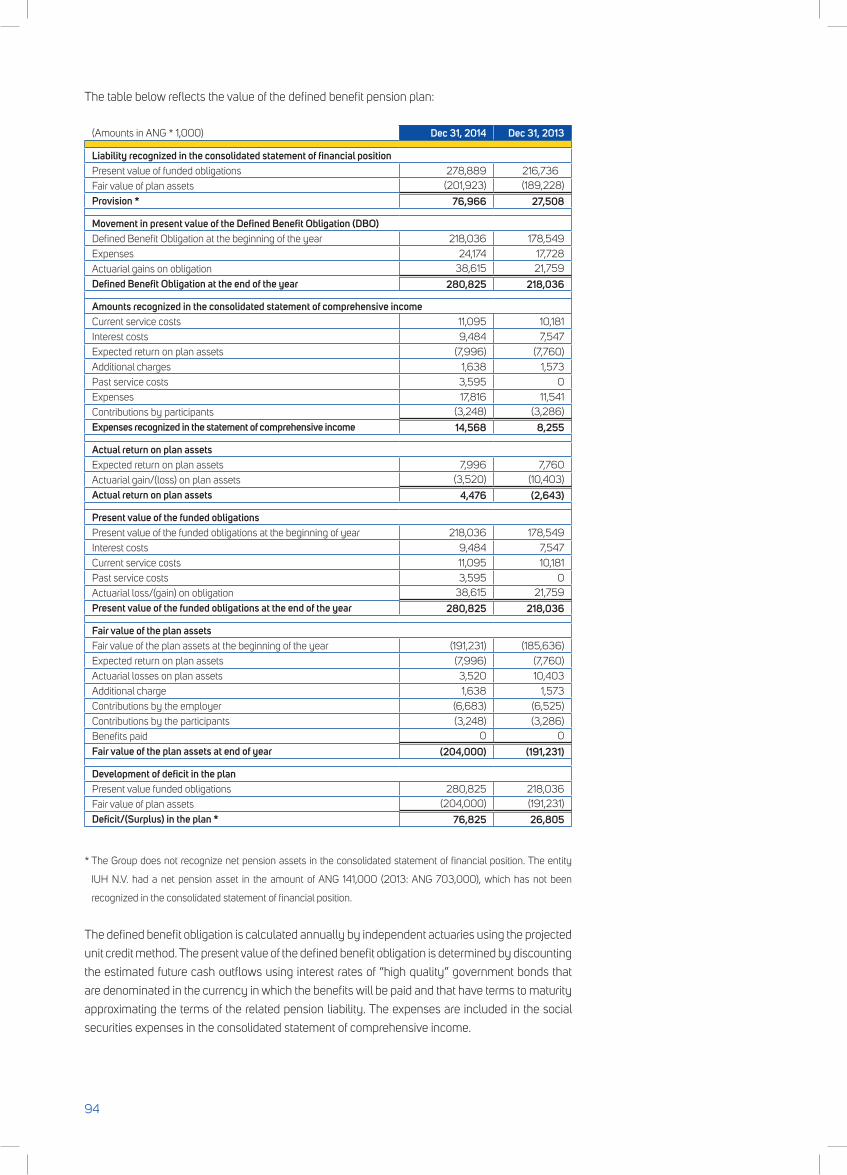
The table below reflects the value of the defined benefit pension plan:
(Amounts in ANG * 1,000) Dec 31, 2014 Dec 31, 2013
Liability recognized in the consolidated statement of financial positionPresent value of funded obligations 278,889 216,736 Fair value of plan assets (201,923) (189,228)
Provision * 76,966 27,508
Movement in present value of the Defined Benefit Obligation (DBO)Defined Benefit Obligation at the beginning of the year 218,036 178,549 Expenses 24,174 17,728 Actuarial gains on obligation 38,615 21,759
Defined Benefit Obligation at the end of the year 280,825 218,036
Amounts recognized in the consolidated statement of comprehensive incomeCurrent service costs 11,095 10,181 Interest costs 9,484 7,547 Expected return on plan assets (7,996) (7,760)Additional charges 1,638 1,573 Past service costs 3,595 0Expenses 17,816 11,541 Contributions by participants (3,248) (3,286)
Expenses recognized in the statement of comprehensive income 14,568 8,255
Actual return on plan assets Expected return on plan assets 7,996 7,760 Actuarial gain/(loss) on plan assets (3,520) (10,403)
Actual return on plan assets 4,476 (2,643)
Present value of the funded obligationsPresent value of the funded obligations at the beginning of year 218,036 178,549 Interest costs 9,484 7,547 Current service costs 11,095 10,181 Past service costs 3,595 0Actuarial loss/(gain) on obligation 38,615 21,759
Present value of the funded obligations at the end of the year 280,825 218,036
Fair value of the plan assetsFair value of the plan assets at the beginning of the year (191,231) (185,636)Expected return on plan assets (7,996) (7,760)Actuarial losses on plan assets 3,520 10,403 Additional charge 1,638 1,573 Contributions by the employer (6,683) (6,525)Contributions by the participants (3,248) (3,286)Benefits paid 0 0
Fair value of the plan assets at end of year (204,000) (191,231)
Development of deficit in the planPresent value funded obligations 280,825 218,036 Fair value of plan assets (204,000) (191,231)
Deficit/(Surplus) in the plan * 76,825 26,805
* The Group does not recognize net pension assets in the consolidated statement of financial position. The entity
IUH N.V. had a net pension asset in the amount of ANG 141,000 (2013: ANG 703,000), which has not been
recognized in the consolidated statement of financial position.
The defined benefit obligation is calculated annually by independent actuaries using the projected
unit credit method. The present value of the defined benefit obligation is determined by discounting
the estimated future cash outflows using interest rates of “high quality” government bonds that
are denominated in the currency in which the benefits will be paid and that have terms to maturity
approximating the terms of the related pension liability. The expenses are included in the social
securities expenses in the consolidated statement of comprehensive income.
94
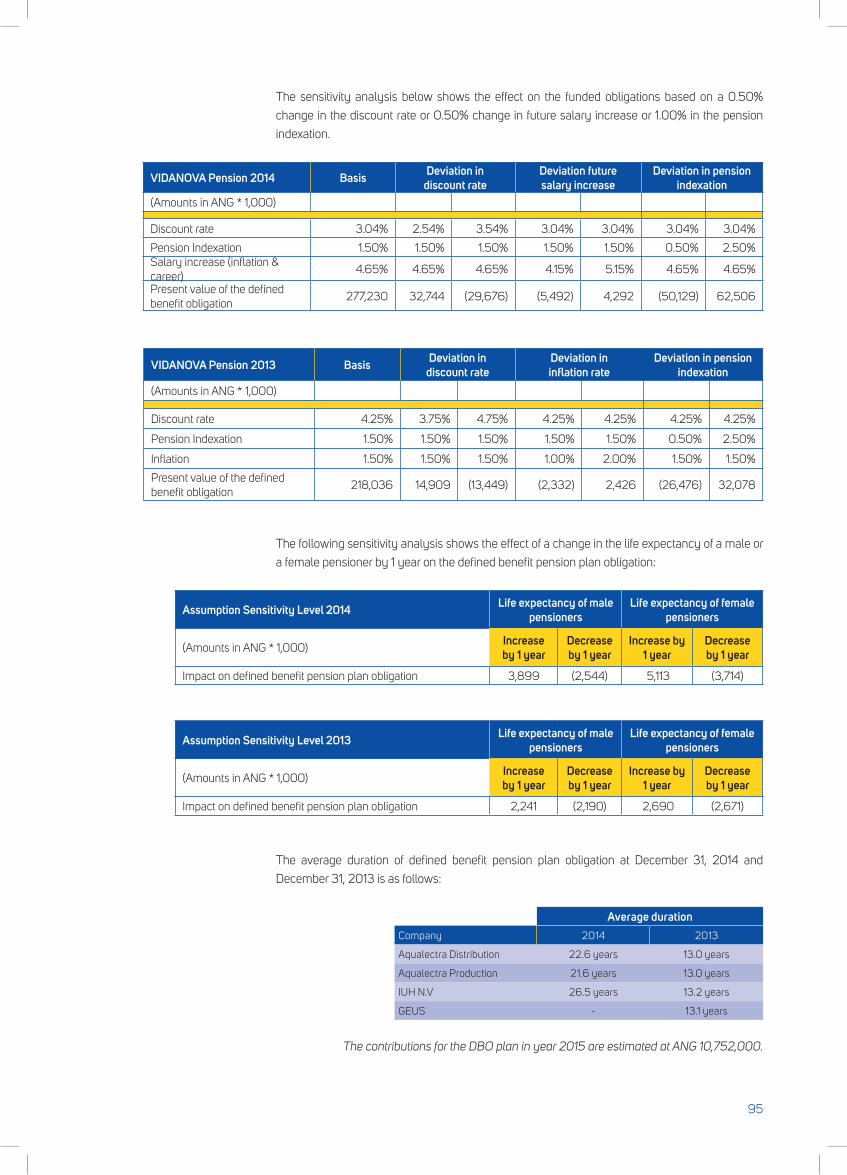
The sensitivity analysis below shows the effect on the funded obligations based on a 0.50%
change in the discount rate or 0.50% change in future salary increase or 1.00% in the pension
indexation.
VIDANOVA Pension 2014 Basis Deviation in discount rate
Deviation future salary increase
Deviation in pension indexation
(Amounts in ANG * 1,000)
Discount rate 3.04% 2.54% 3.54% 3.04% 3.04% 3.04% 3.04%
Pension Indexation 1.50% 1.50% 1.50% 1.50% 1.50% 0.50% 2.50%Salary increase (inflation & career)
4.65% 4.65% 4.65% 4.15% 5.15% 4.65% 4.65%
Present value of the defined benefit obligation
277,230 32,744 (29,676) (5,492) 4,292 (50,129) 62,506
VIDANOVA Pension 2013 Basis Deviation in discount rate
Deviation in inflation rate
Deviation in pension indexation
(Amounts in ANG * 1,000)
Discount rate 4.25% 3.75% 4.75% 4.25% 4.25% 4.25% 4.25%
Pension Indexation 1.50% 1.50% 1.50% 1.50% 1.50% 0.50% 2.50%
Inflation 1.50% 1.50% 1.50% 1.00% 2.00% 1.50% 1.50%
Present value of the defined benefit obligation
218,036 14,909 (13,449) (2,332) 2,426 (26,476) 32,078
The following sensitivity analysis shows the effect of a change in the life expectancy of a male or
a female pensioner by 1 year on the defined benefit pension plan obligation:
Assumption Sensitivity Level 2014 Life expectancy of male pensioners
Life expectancy of female pensioners
(Amounts in ANG * 1,000)Increase by 1 year
Decrease by 1 year
Increase by 1 year
Decrease by 1 year
Impact on defined benefit pension plan obligation 3,899 (2,544) 5,113 (3,714)
Assumption Sensitivity Level 2013 Life expectancy of male pensioners
Life expectancy of female pensioners
(Amounts in ANG * 1,000)Increase by 1 year
Decrease by 1 year
Increase by 1 year
Decrease by 1 year
Impact on defined benefit pension plan obligation 2,241 (2,190) 2,690 (2,671)
The average duration of defined benefit pension plan obligation at December 31, 2014 and
December 31, 2013 is as follows:
Average durationCompany 2014 2013
Aqualectra Distribution 22.6 years 13.0 years
Aqualectra Production 21.6 years 13.0 years
IUH N.V 26.5 years 13.2 years
GEUS - 13.1 years
The contributions for the DBO plan in year 2015 are estimated at ANG 10,752,000.
95
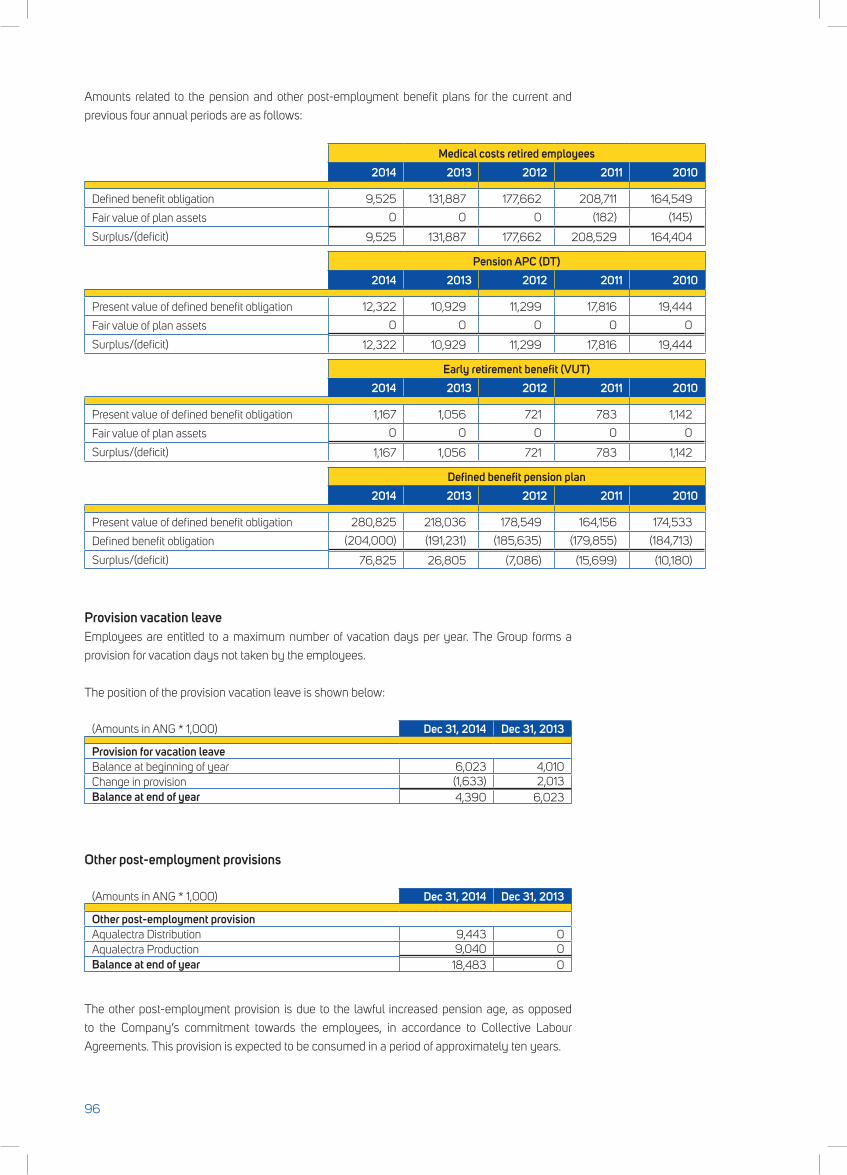
Amounts related to the pension and other post-employment benefit plans for the current and
previous four annual periods are as follows:
Medical costs retired employees2014 2013 2012 2011 2010
Defined benefit obligation 9,525 131,887 177,662 208,711 164,549
Fair value of plan assets 0 0 0 (182) (145)
Surplus/(deficit) 9,525 131,887 177,662 208,529 164,404
Pension APC (DT)2014 2013 2012 2011 2010
Present value of defined benefit obligation 12,322 10,929 11,299 17,816 19,444
Fair value of plan assets 0 0 0 0 0
Surplus/(deficit) 12,322 10,929 11,299 17,816 19,444
Early retirement benefit (VUT)2014 2013 2012 2011 2010
Present value of defined benefit obligation 1,167 1,056 721 783 1,142
Fair value of plan assets 0 0 0 0 0
Surplus/(deficit) 1,167 1,056 721 783 1,142
Defined benefit pension plan2014 2013 2012 2011 2010
Present value of defined benefit obligation 280,825 218,036 178,549 164,156 174,533
Defined benefit obligation (204,000) (191,231) (185,635) (179,855) (184,713)
Surplus/(deficit) 76,825 26,805 (7,086) (15,699) (10,180)
Provision vacation leaveEmployees are entitled to a maximum number of vacation days per year. The Group forms a
provision for vacation days not taken by the employees.
The position of the provision vacation leave is shown below:
(Amounts in ANG * 1,000) Dec 31, 2014 Dec 31, 2013
Provision for vacation leaveBalance at beginning of year 6,023 4,010Change in provision (1,633) 2,013Balance at end of year 4,390 6,023
Other post-employment provisions
(Amounts in ANG * 1,000) Dec 31, 2014 Dec 31, 2013
Other post-employment provisionAqualectra Distribution 9,443 0Aqualectra Production 9,040 0Balance at end of year 18,483 0
The other post-employment provision is due to the lawful increased pension age, as opposed
to the Company’s commitment towards the employees, in accordance to Collective Labour
Agreements. This provision is expected to be consumed in a period of approximately ten years.
96
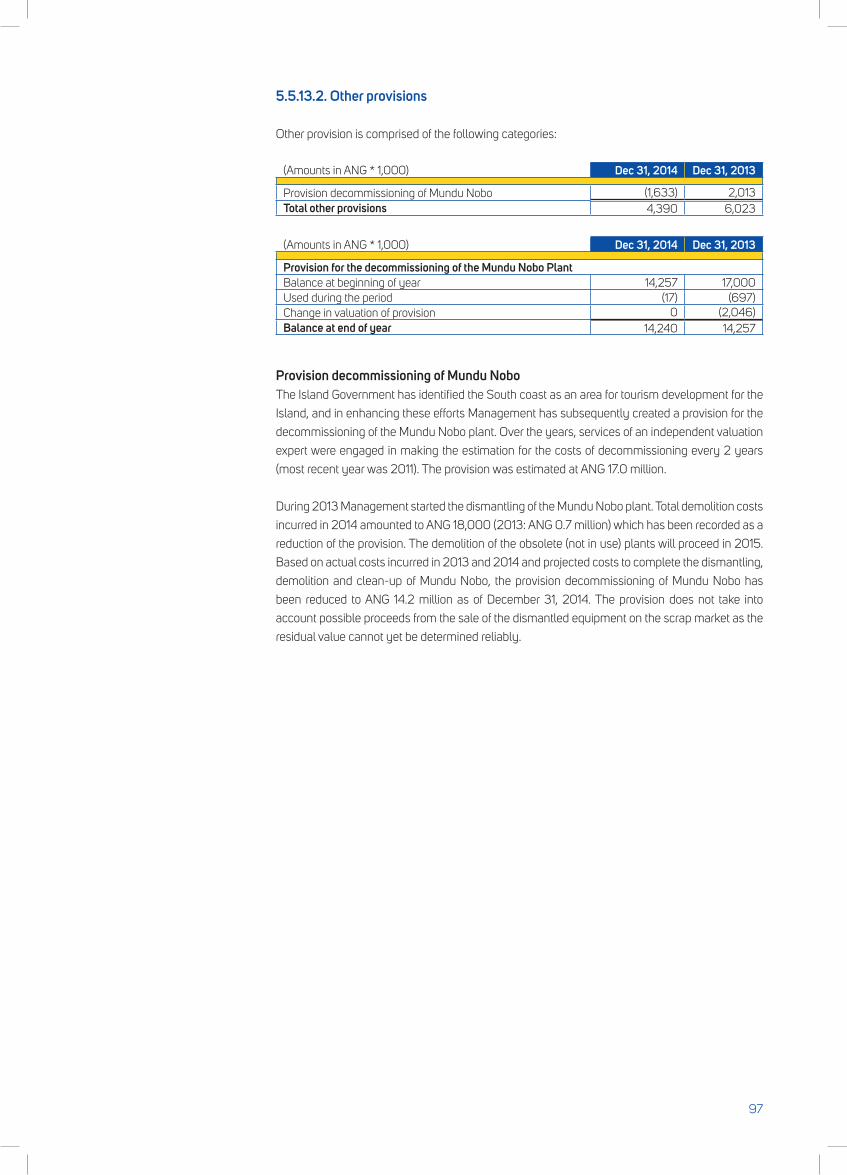
5.5.13.2. Other provisions
Other provision is comprised of the following categories:
(Amounts in ANG * 1,000) Dec 31, 2014 Dec 31, 2013
Provision decommissioning of Mundu Nobo (1,633) 2,013Total other provisions 4,390 6,023
(Amounts in ANG * 1,000) Dec 31, 2014 Dec 31, 2013
Provision for the decommissioning of the Mundu Nobo PlantBalance at beginning of year 14,257 17,000 Used during the period (17) (697)Change in valuation of provision 0 (2,046)Balance at end of year 14,240 14,257
Provision decommissioning of Mundu NoboThe Island Government has identified the South coast as an area for tourism development for the
Island, and in enhancing these efforts Management has subsequently created a provision for the
decommissioning of the Mundu Nobo plant. Over the years, services of an independent valuation
expert were engaged in making the estimation for the costs of decommissioning every 2 years
(most recent year was 2011). The provision was estimated at ANG 17.0 million.
During 2013 Management started the dismantling of the Mundu Nobo plant. Total demolition costs
incurred in 2014 amounted to ANG 18,000 (2013: ANG 0.7 million) which has been recorded as a
reduction of the provision. The demolition of the obsolete (not in use) plants will proceed in 2015.
Based on actual costs incurred in 2013 and 2014 and projected costs to complete the dismantling,
demolition and clean-up of Mundu Nobo, the provision decommissioning of Mundu Nobo has
been reduced to ANG 14.2 million as of December 31, 2014. The provision does not take into
account possible proceeds from the sale of the dismantled equipment on the scrap market as the
residual value cannot yet be determined reliably.
97
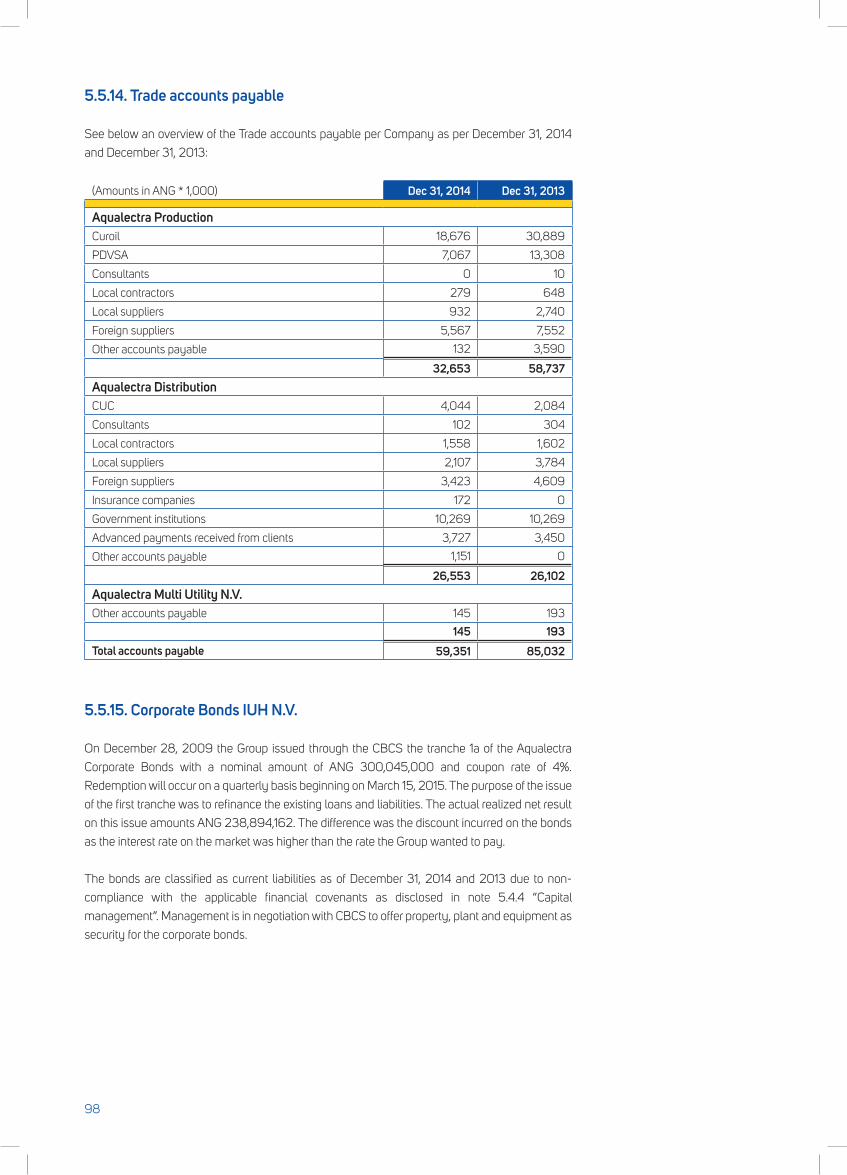
5.5.14. Trade accounts payable
See below an overview of the Trade accounts payable per Company as per December 31, 2014
and December 31, 2013:
(Amounts in ANG * 1,000) Dec 31, 2014 Dec 31, 2013
Aqualectra ProductionCuroil 18,676 30,889
PDVSA 7,067 13,308
Consultants 0 10
Local contractors 279 648
Local suppliers 932 2,740
Foreign suppliers 5,567 7,552
Other accounts payable 132 3,590
32,653 58,737Aqualectra DistributionCUC 4,044 2,084
Consultants 102 304
Local contractors 1,558 1,602
Local suppliers 2,107 3,784
Foreign suppliers 3,423 4,609
Insurance companies 172 0
Government institutions 10,269 10,269
Advanced payments received from clients 3,727 3,450
Other accounts payable 1,151 0
26,553 26,102Aqualectra Multi Utility N.V.Other accounts payable 145 193
145 193Total accounts payable 59,351 85,032
5.5.15. Corporate Bonds IUH N.V.
On December 28, 2009 the Group issued through the CBCS the tranche 1a of the Aqualectra
Corporate Bonds with a nominal amount of ANG 300,045,000 and coupon rate of 4%.
Redemption will occur on a quarterly basis beginning on March 15, 2015. The purpose of the issue
of the first tranche was to refinance the existing loans and liabilities. The actual realized net result
on this issue amounts ANG 238,894,162. The difference was the discount incurred on the bonds
as the interest rate on the market was higher than the rate the Group wanted to pay.
The bonds are classified as current liabilities as of December 31, 2014 and 2013 due to non-
compliance with the applicable financial covenants as disclosed in note 5.4.4 “Capital
management”. Management is in negotiation with CBCS to offer property, plant and equipment as
security for the corporate bonds.
98
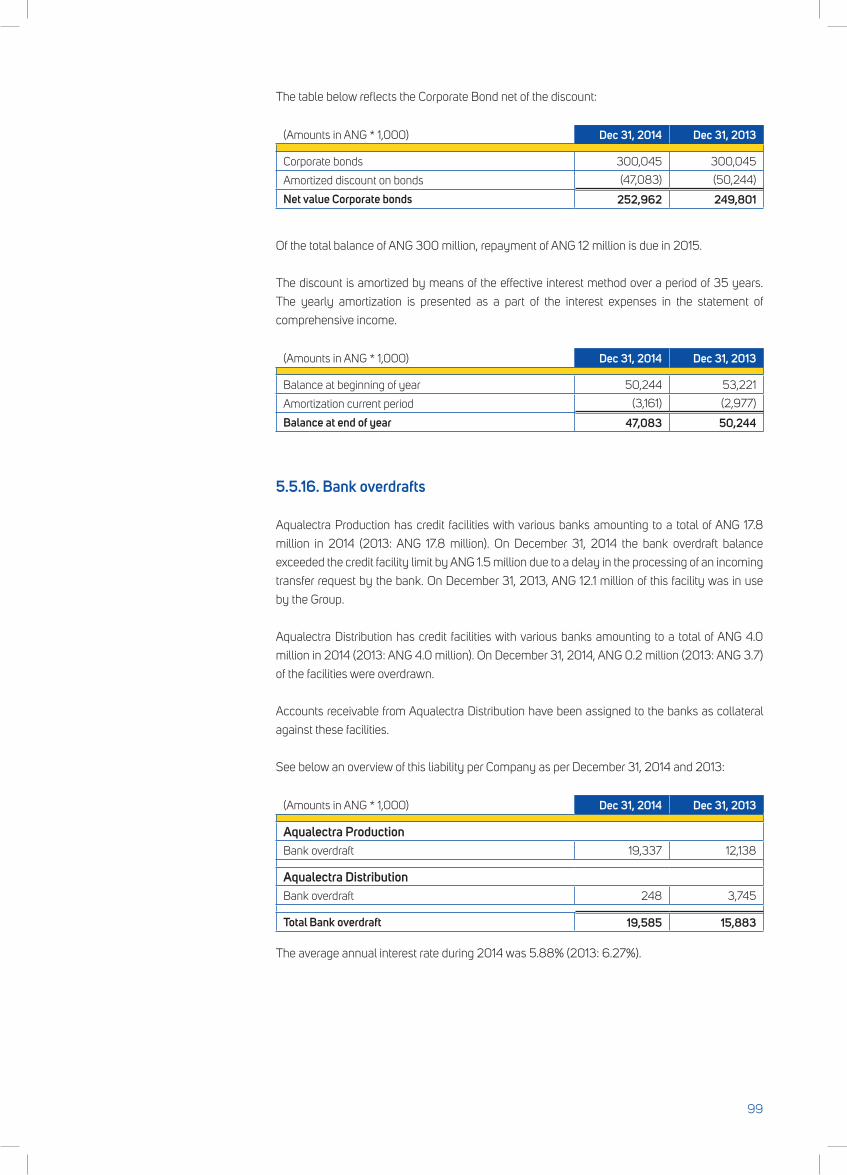
The table below reflects the Corporate Bond net of the discount:
(Amounts in ANG * 1,000) Dec 31, 2014 Dec 31, 2013
Corporate bonds 300,045 300,045
Amortized discount on bonds (47,083) (50,244)
Net value Corporate bonds 252,962 249,801
Of the total balance of ANG 300 million, repayment of ANG 12 million is due in 2015.
The discount is amortized by means of the effective interest method over a period of 35 years.
The yearly amortization is presented as a part of the interest expenses in the statement of
comprehensive income.
(Amounts in ANG * 1,000) Dec 31, 2014 Dec 31, 2013
Balance at beginning of year 50,244 53,221
Amortization current period (3,161) (2,977)
Balance at end of year 47,083 50,244
5.5.16. Bank overdrafts
Aqualectra Production has credit facilities with various banks amounting to a total of ANG 17.8
million in 2014 (2013: ANG 17.8 million). On December 31, 2014 the bank overdraft balance
exceeded the credit facility limit by ANG 1.5 million due to a delay in the processing of an incoming
transfer request by the bank. On December 31, 2013, ANG 12.1 million of this facility was in use
by the Group.
Aqualectra Distribution has credit facilities with various banks amounting to a total of ANG 4.0
million in 2014 (2013: ANG 4.0 million). On December 31, 2014, ANG 0.2 million (2013: ANG 3.7)
of the facilities were overdrawn.
Accounts receivable from Aqualectra Distribution have been assigned to the banks as collateral
against these facilities.
See below an overview of this liability per Company as per December 31, 2014 and 2013:
(Amounts in ANG * 1,000) Dec 31, 2014 Dec 31, 2013
Aqualectra ProductionBank overdraft 19,337 12,138
Aqualectra DistributionBank overdraft 248 3,745
Total Bank overdraft 19,585 15,883
The average annual interest rate during 2014 was 5.88% (2013: 6.27%).
99
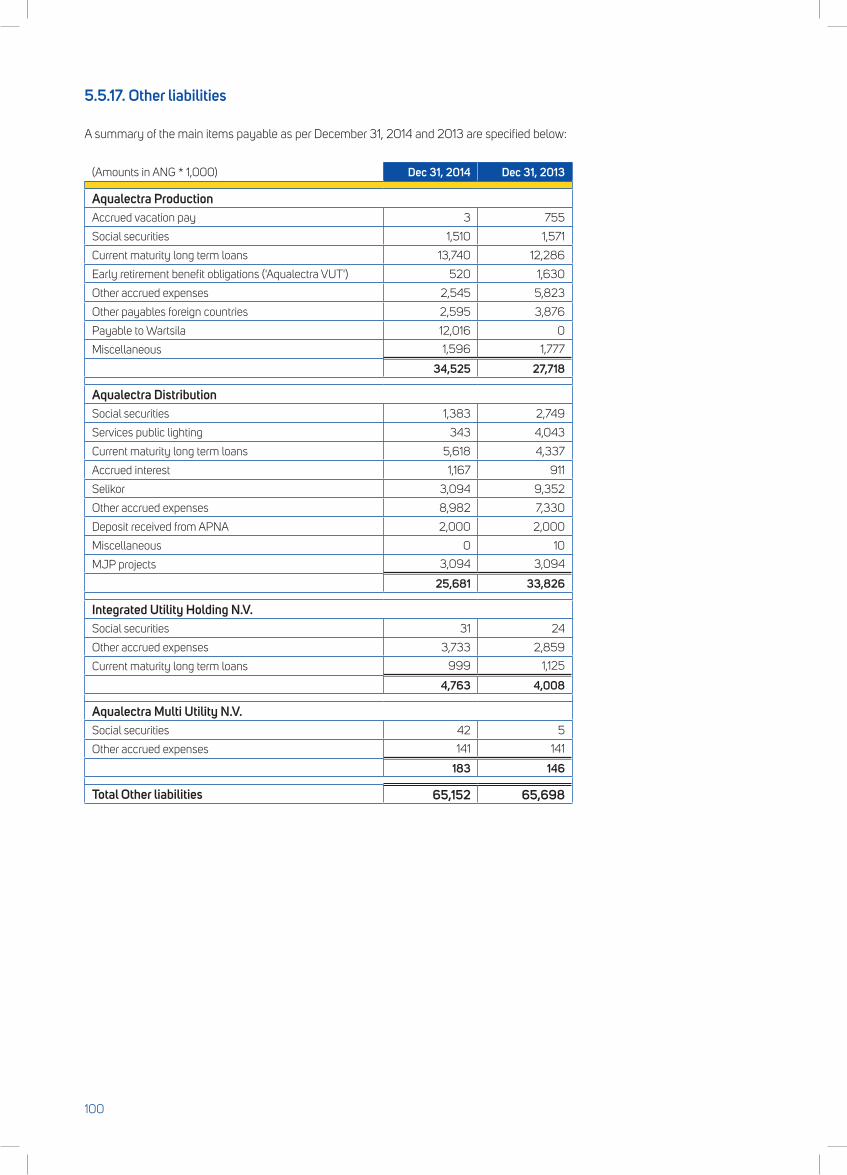
5.5.17. Other liabilities
A summary of the main items payable as per December 31, 2014 and 2013 are specified below:
(Amounts in ANG * 1,000) Dec 31, 2014 Dec 31, 2013
Aqualectra ProductionAccrued vacation pay 3 755
Social securities 1,510 1,571
Current maturity long term loans 13,740 12,286
Early retirement benefit obligations ('Aqualectra VUT') 520 1,630
Other accrued expenses 2,545 5,823
Other payables foreign countries 2,595 3,876
Payable to Wartsila 12,016 0
Miscellaneous 1,596 1,777
34,525 27,718
Aqualectra DistributionSocial securities 1,383 2,749
Services public lighting 343 4,043
Current maturity long term loans 5,618 4,337
Accrued interest 1,167 911
Selikor 3,094 9,352
Other accrued expenses 8,982 7,330
Deposit received from APNA 2,000 2,000
Miscellaneous 0 10
MJP projects 3,094 3,094
25,681 33,826
Integrated Utility Holding N.V.Social securities 31 24
Other accrued expenses 3,733 2,859
Current maturity long term loans 999 1,125
4,763 4,008
Aqualectra Multi Utility N.V.Social securities 42 5
Other accrued expenses 141 141
183 146
Total Other liabilities 65,152 65,698
100
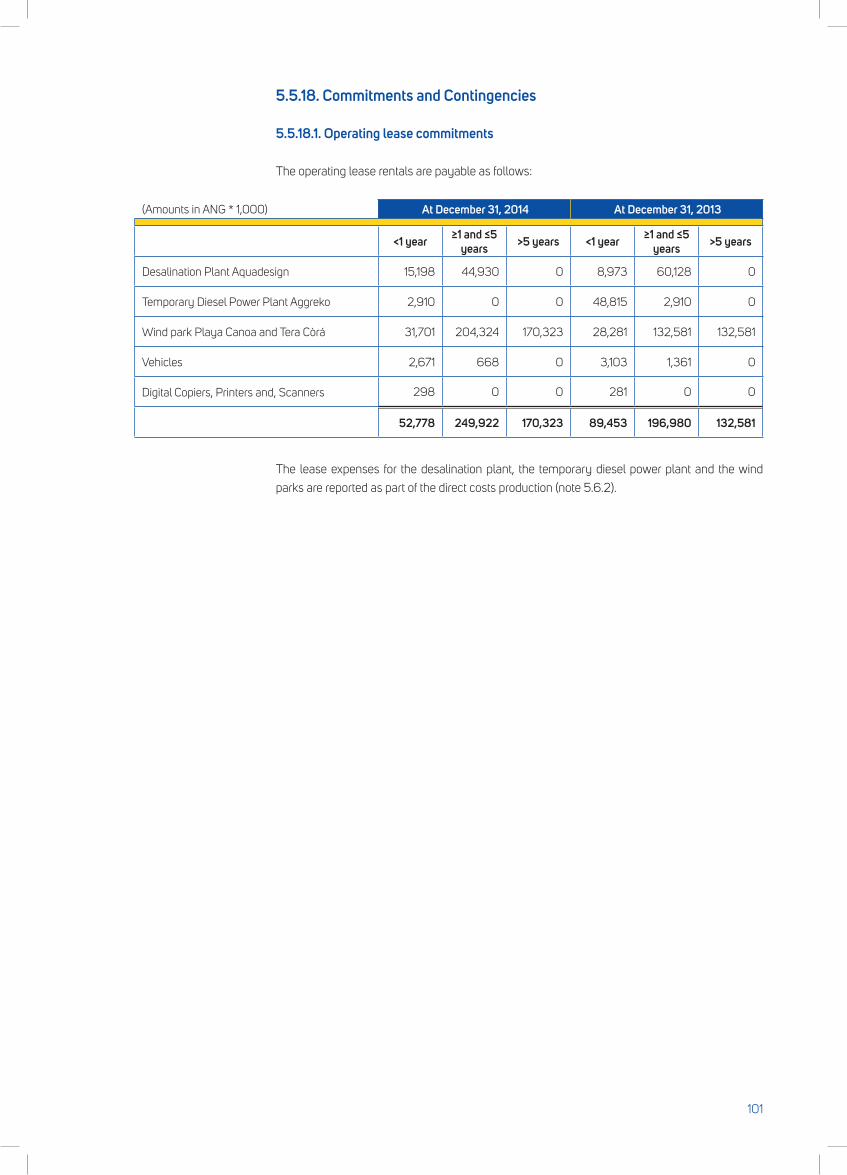
5.5.18. Commitments and Contingencies
5.5.18.1. Operating lease commitments
The operating lease rentals are payable as follows:
(Amounts in ANG * 1,000) At December 31, 2014 At December 31, 2013
<1 year ≥1 and ≤5 years >5 years <1 year ≥1 and ≤5
years >5 years
Desalination Plant Aquadesign 15,198 44,930 0 8,973 60,128 0
Temporary Diesel Power Plant Aggreko 2,910 0 0 48,815 2,910 0
WindparkPlayaCanoaandTeraCòrá 31,701 204,324 170,323 28,281 132,581 132,581
Vehicles 2,671 668 0 3,103 1,361 0
Digital Copiers, Printers and, Scanners 298 0 0 281 0 0
52,778 249,922 170,323 89,453 196,980 132,581
The lease expenses for the desalination plant, the temporary diesel power plant and the wind
parks are reported as part of the direct costs production (note 5.6.2).
101
Desalination Plant AquadesignAs of September 15, 1995 KAE N.V. (Aqualectra Production) had a 6 year agreement with Aqua
Design N.V. (ADNV) (currently Aeonics) for the purchase of approx. 3,000 M3 water/day produced
by the reverse osmosis water plant located at Mundu Nobo.
As per March 31, 1999 this agreement was amended, based on the fact that ADNV had increased
the capacity of thewater plant; the quantity ofwater to be produced and the quantity to be
delivered to KAE increased from 3,000 M3 per day to 10,200 M3 per day. This agreement is
scheduled to terminate on July 28, 2016.
This agreement can be categorized as an operational lease and not a financial lease, as
arrangements in this agreement imply that a substantial part of the risks and rewards remain
with the lessor of the reverse osmosis water plant, being Aeonics (the new owner of the water
plant). Therefore, Aqualectra Production does not recognize the leased asset in its consolidated
statement of financial position.
Temporary Diesel Power Plant AggrekoIn 2008 Aqualectra Production entered into a contract for temporary power generation services
with Aggreko International Projects Ltd (Aggreko) for the generation of 10MW of continuous power
at 12KV – 50 Hz, 0.8 power factor to meet the emergency power requirements of its production
facility. The term of this initial contract was for a period of 39 weeks.
The contract was amended in subsequent years to adjust the total capacity based on Aqualectra’s
needs. In 2014, Amendment 12 was signed extending the operational period of the 56MW HFO
Plant at the Mundu Nobo site to February 28, 2015. The latest amendment (Amendment 13) is
dated March 27, 2015 and states that from November 1, 2014 through November 7, 2014, 35MW
capacity was requested and provided, a reduction in the contracted megawatt capacity to 25MW
took place as per November 8, 2014 and the operational service period of the 20MW diesel plant
in a standby operational regime was extended from March 1, 2015 through June 30, 2015. All
other terms of the contract will continue in full force.
Wind park Playa Canoa The Group has a lease contract for the wind park Playa Canoa which started in 2009 and will end
in 2024. It was determined that substantially all the risks are with the lessor. As such, the Group
determined that the lease is an operational lease.
Purchase contract Wind Turbine Farm Tera Còrá II.In 2009 Aqualectra Distribution entered into a power purchase agreement with NuCuraçao
WindparkenB.V.forWindTurbineFarmTeraCòráII.Thecontracthasadurationof15yearsand
will end in 2024. Aqualectra should purchase during the contracted period all delivered electrical
energy at the tariff of 0,101 x (rate USD/EURO)/1.30 US$ per KWH.
VehiclesAqualectra has lease agreements with several car dealers for the lease of Group cars. These lease
agreements have different terms as per year-end December 2014. The total commitment as per
December 31, 2014 is based on the remaining terms of the lease agreements.
102
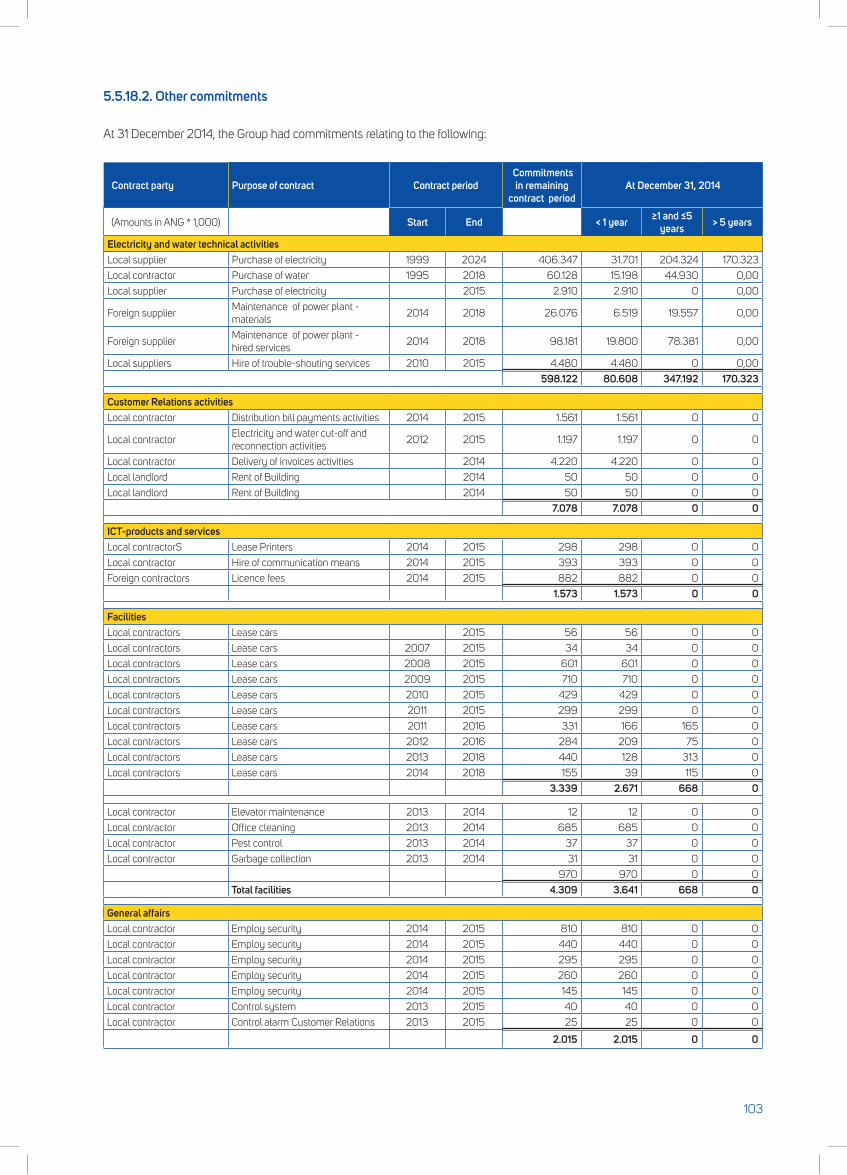
5.5.18.2. Other commitments
At 31 December 2014, the Group had commitments relating to the following:
Contract party Purpose of contract Contract period Commitments
in remaining contract period
At December 31, 2014
(Amounts in ANG * 1,000) Start End < 1 year ≥1 and ≤5 years > 5 years
Electricity and water technical activitiesLocal supplier Purchase of electricity 1999 2024 406.347 31.701 204.324 170.323
Local contractor Purchase of water 1995 2018 60.128 15.198 44.930 0,00
Local supplier Purchase of electricity 2015 2.910 2.910 0 0,00
Foreign supplierMaintenance of power plant - materials
2014 2018 26.076 6.519 19.557 0,00
Foreign supplierMaintenance of power plant - hired services
2014 2018 98.181 19.800 78.381 0,00
Local suppliers Hire of trouble-shouting services 2010 2015 4.480 4.480 0 0,00
598.122 80.608 347.192 170.323
Customer Relations activitiesLocal contractor Distribution bill payments activities 2014 2015 1.561 1.561 0 0
Local contractorElectricity and water cut-off and reconnection activities
2012 2015 1.197 1.197 0 0
Local contractor Delivery of invoices activities 2014 4.220 4.220 0 0
Local landlord Rent of Building 2014 50 50 0 0
Local landlord Rent of Building 2014 50 50 0 0
7.078 7.078 0 0
ICT-products and servicesLocal contractorS Lease Printers 2014 2015 298 298 0 0
Local contractor Hire of communication means 2014 2015 393 393 0 0
Foreign contractors Licence fees 2014 2015 882 882 0 0
1.573 1.573 0 0
FacilitiesLocal contractors Lease cars 2015 56 56 0 0
Local contractors Lease cars 2007 2015 34 34 0 0
Local contractors Lease cars 2008 2015 601 601 0 0
Local contractors Lease cars 2009 2015 710 710 0 0
Local contractors Lease cars 2010 2015 429 429 0 0
Local contractors Lease cars 2011 2015 299 299 0 0
Local contractors Lease cars 2011 2016 331 166 165 0
Local contractors Lease cars 2012 2016 284 209 75 0
Local contractors Lease cars 2013 2018 440 128 313 0
Local contractors Lease cars 2014 2018 155 39 115 0
3.339 2.671 668 0
Local contractor Elevator maintenance 2013 2014 12 12 0 0
Local contractor Office cleaning 2013 2014 685 685 0 0
Local contractor Pest control 2013 2014 37 37 0 0
Local contractor Garbage collection 2013 2014 31 31 0 0
970 970 0 0
Total facilities 4.309 3.641 668 0
General affairsLocal contractor Employ security 2014 2015 810 810 0 0
Local contractor Employ security 2014 2015 440 440 0 0
Local contractor Employ security 2014 2015 295 295 0 0
Local contractor Employ security 2014 2015 260 260 0 0
Local contractor Employ security 2014 2015 145 145 0 0
Local contractor Control system 2013 2015 40 40 0 0
Local contractor Control alarm Customer Relations 2013 2015 25 25 0 0
2.015 2.015 0 0
103
5.5.18.3. Legal claim contingency
Civil investigationBased on the request of the Public Prosecutor (“Openbaar Ministerie”), the Court of Appeal (the
Court) ordered in July 2013 that a civil investigation be carried out at certain governmental entities
including IUH N.V. The investigation puts the policies and affairs of the Group under a microscope
to determine whether mismanagement has taken place. According to the Court, there are well-
founded reasons to doubt that proper policy has been followed. This stems from the relationship
between the BMD, the BSD and the Shareholders that according to the Court does not comply
with the Code Corporate Governance against the backdrop of the deteriorating financial position
of the Group. Inquiry proceedings are currently being executed, which makes it impossible at this
point in time to assess the outcome of this matter.
5.5.18.4. L/C Guarantee
As per December 31, 2014 there are letters of credit (L/C’s) issued for the following amounts:
• ANG4.0million(2013:ANG9.3million) in favorofAggreko InternationalProjectsLtd.This
L/C,relatedtotherentofgenerators(seenote5.5.18.1);
• ANG1.4millioninfavorof‘InspectiederInvoerrechtenenAccijnzenand/orDouaneCuraçao’
(2013:ANG1.4million);
• ANG20,000infavorof‘Landsontvanger’(2013:ANG20,000).
5.5.18.5. Contingent Liabilities
a) Early Retirement Benefit (VUT)According to the collective labor agreements of Aqualectra Distribution and Aqualectra Production,
employees have the option of requesting the BMD to retire from service at the age of 55 under
certain conditions one of which is employment with Aqualectra for at least 20 years. The BMD
decides whether the employee’s request will be honored. In such a case, the resulting obligation
will be accounted for as a liability in the Group’s statement of financial position. For employees
insured at APC, the BMD is obliged to honor such a request. For these employees insured at APC
a provision has been made.
b) Supplementary pension (DT)As of January 1, 1998 the AOV-franchise has been included in the pension plan of “Algemeen
Pensioenfonds van Curaçao (APC)”. The pension allowance to be paid by APC under this changed
plan is lower than the allowance that would have been paid according to the former plan. Under
certain conditions a supplementary pension has to be paid by the employer to the employees
participating in this pension plan to compensate for the discrepancy between the allowance from
the former and the changed plan. It is however not clear in which cases and to which extent the
employer has an obligation to pay a supplementary pension. The provision for pension allowance
as accounted for at reporting date is based on the former plan and is excluding a possible liability
of the employer in relation to the compensation for the difference in allowance according to the
former and the changed plan.
Currently, the Group has a difference of opinion with APC as to the calculation of the supplementary
pension premiums. The difference of opinion concerns the calculation-method used for pension
increases, but also the legality of the supplementary pension plan. APC is of the opinion that all
pension increases can be fully charged to the Group as supplementary pension increases. The
Group is of the opinion that there is no legal basis for this methodology and also disputes the legal
104
basis for the validity of the supplementary pension plan. The Government of Curaçao and other
governmental institutions were approached by the Group on the above-mentioned issues, as it
concerns them too. All stakeholders are deliberating on the next steps that should be taken. As per
the preparation and approval of these Consolidated Financial Statements no final plan has been
outlined. It is expected that the final conclusion and resolution will lead to a release of the provision
for supplementary pensions (DT) for the full amount.
Currently the provision for supplementary pension is provided in full, with the exception of the
“wage scale” indexation and pension indexation.
c) Diesel power plant on the ISLA premisesOn November 22, 2000 the Group, Refineria ISLA (Curaçao) S.A. (Isla) and Refineria di Korsou
N.V. (RdK) entered into an agreement (IUH N.V. Agreement) pursuant to which Isla agreed to
improve and refurbish the Medium Pressure Power Plant (MPPP) then operated by Isla so as to
supply additional power to Aqualectra Distribution for distribution to the community of Curaçao.
Pursuant to a side letter of June 26, 2001, Isla and the Group agreed to investigate the option of
buying a new power unit instead of improving and refurbishing the MPPP.
On August 8, 2002 the Group and Isla agreed by the First Amended and Restated IUH N.V.
Agreement, that instead of improving and refurbishing the MPPP, an EPC contractor chosen by
the Group will construct a new diesel power plant on the premises adjacent to the new 66 kV
substation of the Group located within the Refinery. Based on this amended IUH N.V. Agreement
Isla has committed to pay all amounts owed to the EPC contractor under the EPC contract up
to USD 23,000,000 as reflected therein. The construction of this diesel power plant and the
payment therefore has been set forth in an Engineering, Procurement and Construction Contract
also dated August 8, 2002 and duly signed by Isla, the Group, Aqualectra Production and the
EPC-contractor being MANBWSC. This plant was commissioned in the third quarter of 2003.
The initial annual aggregate IUH N.V. Agreement payment was equal to USD 12,000,000 to be
paid in monthly installments until the year 2019. The IUH N.V. Agreement payment covers in
addition to the construction costs of the diesel plant also a fuel and extension component (as
stated in the contract). As a result of the transfer of the CUC shares in 2011, the extension element
is paid by RDK. The amount mentioned, increases yearly with the consumer price index.
d) CUC - Electricity purchaseCUC and Aqualectra Distribution entered into a Power Purchase Agreement on April 28, 1999,
entailing that CUC would make available to Aqualectra Distribution, as of the Commercial Delivery
Date of the BOO-plant, 22 MW of electricity measured instantaneously, or less if required by
Aqualectra Distribution. This electricity will be provided to Aqualectra Distribution at no charge
other than applicable ‘Fuel Payments’.
According to above-mentioned PPA, CUC can also make electricity available to Aqualectra
Distribution in excess of thementioned 22MW.Quantities of electricity greater than 22MW
(measured instantaneously) and up to and including 25 MW (measured instantaneously) have
been referred to as ‘Level 1 excess’.
Amounts of electricity greater than 25 MW (measured instantaneously) have been referred to as
‘Level 2 excess’. In addition to the applicable ‘Fuel Payments’, the price of each KWH of excess
electricity will be USD 0.02 (Sept. 30, 1997). That price will be subject to upward adjustments
as of January 1st of each year, begin on January 1, 1998, by an increase (if any) in the indexes as
stipulated in the PPA.
105
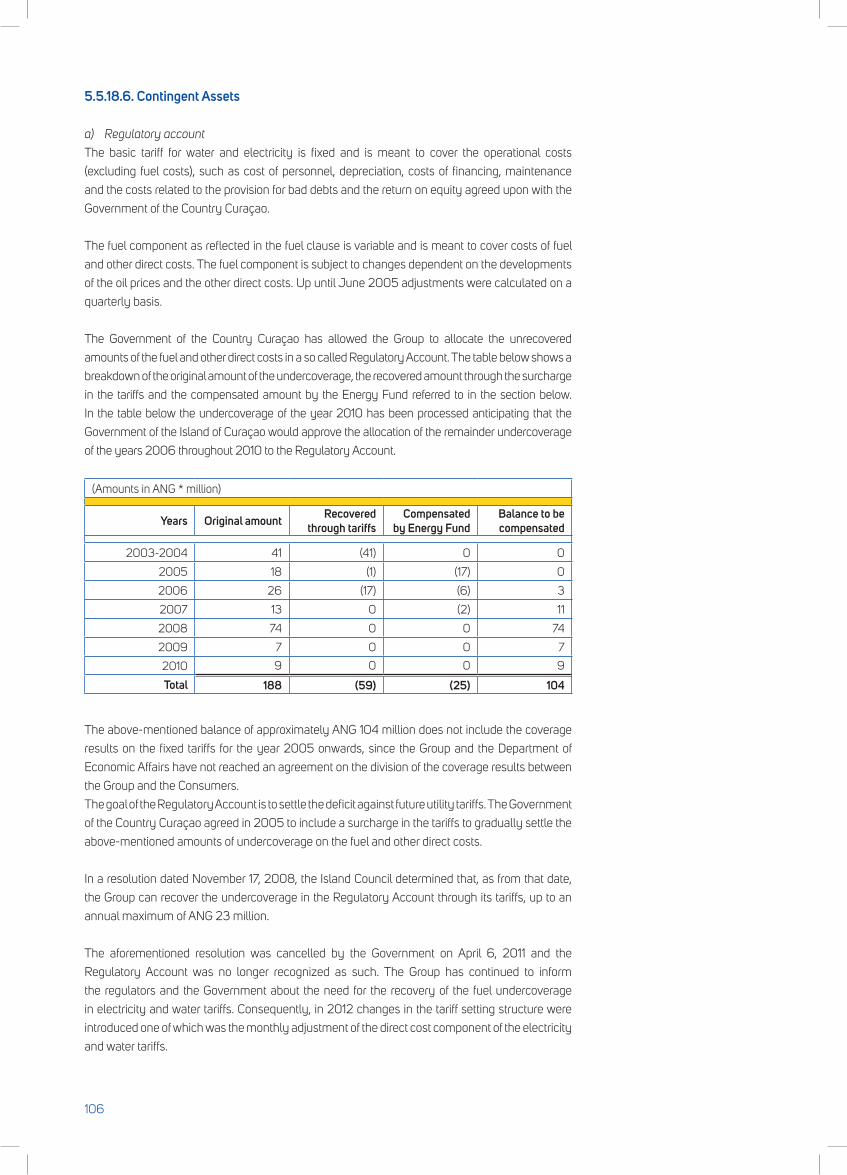
5.5.18.6. Contingent Assets
a) Regulatory account
The basic tariff for water and electricity is fixed and is meant to cover the operational costs
(excluding fuel costs), such as cost of personnel, depreciation, costs of financing, maintenance
and the costs related to the provision for bad debts and the return on equity agreed upon with the
Government of the Country Curaçao.
The fuel component as reflected in the fuel clause is variable and is meant to cover costs of fuel
and other direct costs. The fuel component is subject to changes dependent on the developments
of the oil prices and the other direct costs. Up until June 2005 adjustments were calculated on a
quarterly basis.
The Government of the Country Curaçao has allowed the Group to allocate the unrecovered
amounts of the fuel and other direct costs in a so called Regulatory Account. The table below shows a
breakdown of the original amount of the undercoverage, the recovered amount through the surcharge
in the tariffs and the compensated amount by the Energy Fund referred to in the section below.
In the table below the undercoverage of the year 2010 has been processed anticipating that the
Government of the Island of Curaçao would approve the allocation of the remainder undercoverage
of the years 2006 throughout 2010 to the Regulatory Account.
(Amounts in ANG * million)
Years Original amount Recovered through tariffs
Compensated by Energy Fund
Balance to be compensated
2003-2004 41 (41) 0 0
2005 18 (1) (17) 0
2006 26 (17) (6) 3
2007 13 0 (2) 11
2008 74 0 0 74
2009 7 0 0 7
2010 9 0 0 9
Total 188 (59) (25) 104
The above-mentioned balance of approximately ANG 104 million does not include the coverage
results on the fixed tariffs for the year 2005 onwards, since the Group and the Department of
Economic Affairs have not reached an agreement on the division of the coverage results between
the Group and the Consumers.
The goal of the Regulatory Account is to settle the deficit against future utility tariffs. The Government
of the Country Curaçao agreed in 2005 to include a surcharge in the tariffs to gradually settle the
above-mentioned amounts of undercoverage on the fuel and other direct costs.
In a resolution dated November 17, 2008, the Island Council determined that, as from that date,
the Group can recover the undercoverage in the Regulatory Account through its tariffs, up to an
annual maximum of ANG 23 million.
The aforementioned resolution was cancelled by the Government on April 6, 2011 and the
Regulatory Account was no longer recognized as such. The Group has continued to inform
the regulators and the Government about the need for the recovery of the fuel undercoverage
in electricity and water tariffs. Consequently, in 2012 changes in the tariff setting structure were
introduced one of which was the monthly adjustment of the direct cost component of the electricity
and water tariffs.
106
b) Energy Fund 2005/2006
The Energy Fund 2005/2006 was approved on December 6, 2005 and was established as
a means to stabilize the water and electricity tariffs by compensating the Group for insufficient
coverage of tariffs incurred in 2005 and 2006 due to oil price changes and changes in the other
direct costs.
The Group received a total of ANG 22,650,000 from the Energy Fund in 2006. Of this amount,
ANG 7,790,000 covered the period from January through September 2005, ANG 8,950,000
covered the period from October through December 2005 and ANG 5,910,000 covered the period
from January through March 2006. The Group also received an amount of ANG 2,200,000 from
the remainder of the Energy Fund to minimize the tariff increase in 2007.
Due to the developments in the fuel prices during the period covered by the Energy Fund
2005/2006, the amount originally designated to the Energy Fund 2005/2006 was not
sufficient to compensate the full amount of undercoverage in 2015 and 2016.
An uncompensated balance of ANG 21,200,000 remained, of which ANG 1,600,000 regards
the period of January through September 2005 and ANG 19,600,000 regards the period April
through December 2006.
This uncompensated balance of ANG 21,200,000 was recorded as a receivable. However, since
the funds in the Energy Fund are depleted and the Government of the Country Curaçao does
not have the necessary funds to compensate the Group for undercoverage, the total outstanding
amount has been provided for. In anticipation of the written approval of the Government of the
Country Curaçao this amount has been allocated to the Regulatory Account to be compensated
through future usage of electricity and water. Of the above mentioned receivable of ANG
21,200,000 million, an amount of ANG 18,300,000 million has been recovered through the tariffs
in the years 2007 and 2008 reducing the uncompensated balance to ANG 2,900,000 to date.
IFRS does not allow recognition of the amounts in the Energy Fund. Therefore, the amount in the
Regulatory Account is treated as a contingent asset.
c) Pension premium asset
In the pension agreement between the Group (Aqualectra Production, Aqualectra Distribution
and Integrated Utility Holdings N.V.) and VIDANOVA (formerly Stichting Pensioenfonds
Utiliteitsbedrijven (SPU)) in which part of the employees of the Group participate, it is stipulated
that a yearly premium has to be paid (fixed percentage of the basis for pension) which is used to
cover the yearly expenses related to the plan.
A surplus, the positive difference between the contributions and the yearly expenses, will be first
used to cover eventual shortfalls in the future resulting from back service. No specific agreement
has been made regarding possible reduction of premium as a result of a surplus at year-end.
In any other case the surplus will only be realized upon stepping out of the pension fund. Any
shortfall, being the negative difference between the contributions and the yearly expenses, will be
charged immediately to the respective participating company.
107
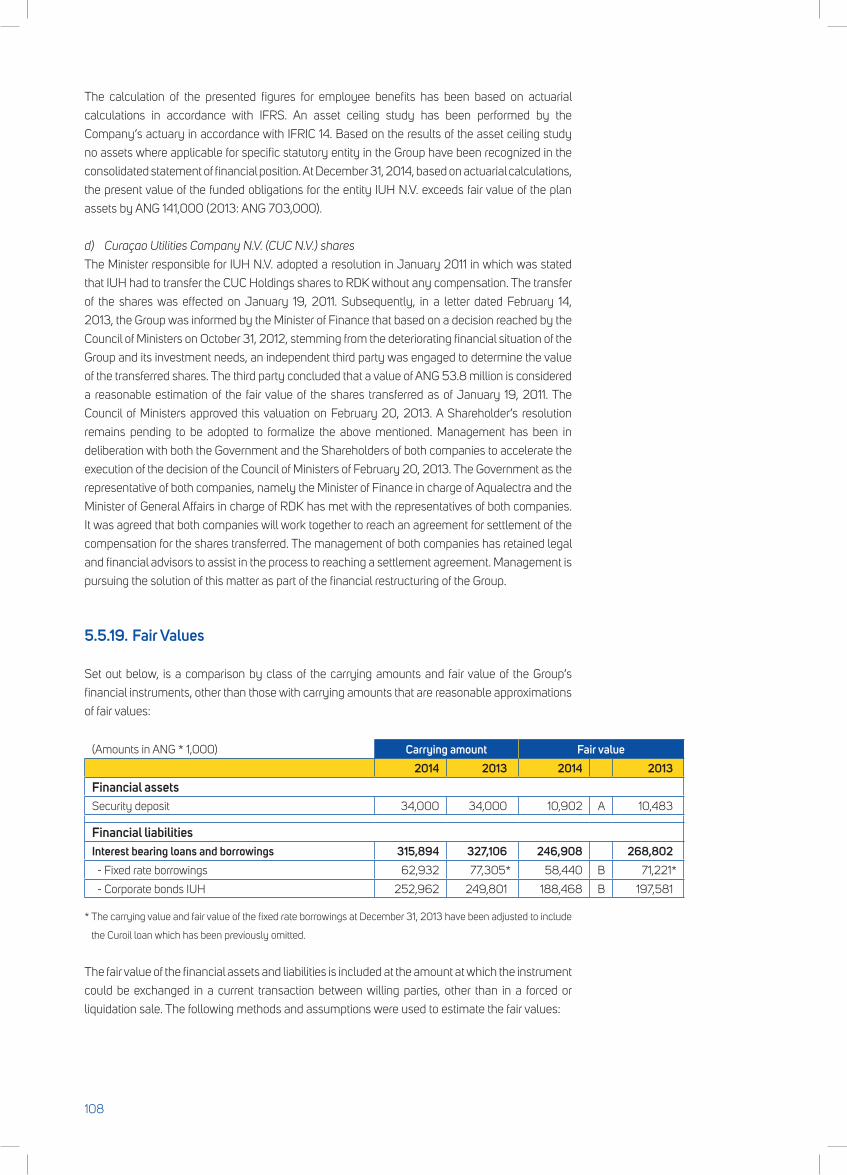
The calculation of the presented figures for employee benefits has been based on actuarial
calculations in accordance with IFRS. An asset ceiling study has been performed by the
Company’s actuary in accordance with IFRIC 14. Based on the results of the asset ceiling study
no assets where applicable for specific statutory entity in the Group have been recognized in the
consolidated statement of financial position. At December 31, 2014, based on actuarial calculations,
the present value of the funded obligations for the entity IUH N.V. exceeds fair value of the plan
assets by ANG 141,000 (2013: ANG 703,000).
d) Curaçao Utilities Company N.V. (CUC N.V.) shares
The Minister responsible for IUH N.V. adopted a resolution in January 2011 in which was stated
that IUH had to transfer the CUC Holdings shares to RDK without any compensation. The transfer
of the shares was effected on January 19, 2011. Subsequently, in a letter dated February 14,
2013, the Group was informed by the Minister of Finance that based on a decision reached by the
Council of Ministers on October 31, 2012, stemming from the deteriorating financial situation of the
Group and its investment needs, an independent third party was engaged to determine the value
of the transferred shares. The third party concluded that a value of ANG 53.8 million is considered
a reasonable estimation of the fair value of the shares transferred as of January 19, 2011. The
Council of Ministers approved this valuation on February 20, 2013. A Shareholder’s resolution
remains pending to be adopted to formalize the above mentioned. Management has been in
deliberation with both the Government and the Shareholders of both companies to accelerate the
execution of the decision of the Council of Ministers of February 20, 2013. The Government as the
representative of both companies, namely the Minister of Finance in charge of Aqualectra and the
Minister of General Affairs in charge of RDK has met with the representatives of both companies.
It was agreed that both companies will work together to reach an agreement for settlement of the
compensation for the shares transferred. The management of both companies has retained legal
and financial advisors to assist in the process to reaching a settlement agreement. Management is
pursuing the solution of this matter as part of the financial restructuring of the Group.
5.5.19. Fair Values
Set out below, is a comparison by class of the carrying amounts and fair value of the Group’s
financial instruments, other than those with carrying amounts that are reasonable approximations
of fair values:
(Amounts in ANG * 1,000) Carrying amount Fair value2014 2013 2014 2013
Financial assetsSecurity deposit 34,000 34,000 10,902 A 10,483
Financial liabilitiesInterest bearing loans and borrowings 315,894 327,106 246,908 268,802 - Fixed rate borrowings 62,932 77,305* 58,440 B 71,221*
- Corporate bonds IUH 252,962 249,801 188,468 B 197,581
* The carrying value and fair value of the fixed rate borrowings at December 31, 2013 have been adjusted to include
the Curoil loan which has been previously omitted.
The fair value of the financial assets and liabilities is included at the amount at which the instrument
could be exchanged in a current transaction between willing parties, other than in a forced or
liquidation sale. The following methods and assumptions were used to estimate the fair values:
108
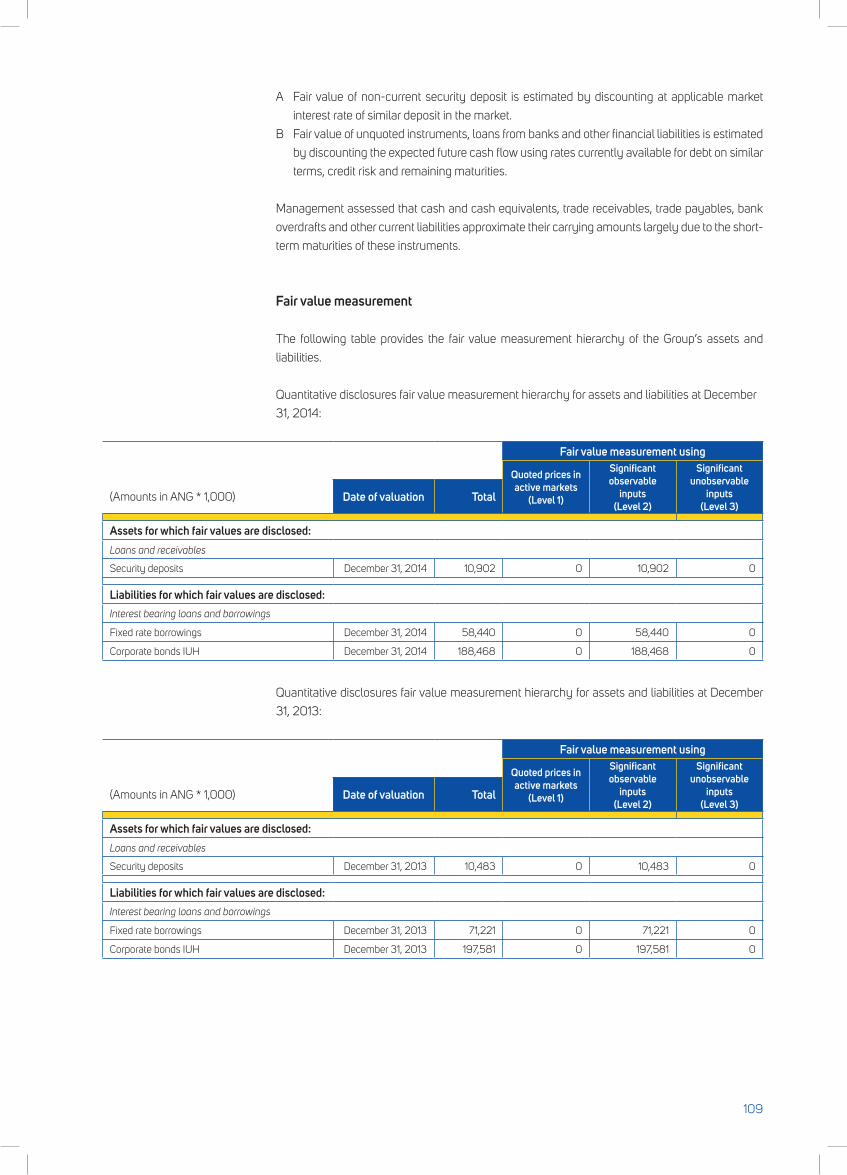
A Fair value of non-current security deposit is estimated by discounting at applicable market
interest rate of similar deposit in the market.
B Fair value of unquoted instruments, loans from banks and other financial liabilities is estimated
by discounting the expected future cash flow using rates currently available for debt on similar
terms, credit risk and remaining maturities.
Management assessed that cash and cash equivalents, trade receivables, trade payables, bank
overdrafts and other current liabilities approximate their carrying amounts largely due to the short-
term maturities of these instruments.
Fair value measurement
The following table provides the fair value measurement hierarchy of the Group’s assets and
liabilities.
QuantitativedisclosuresfairvaluemeasurementhierarchyforassetsandliabilitiesatDecember
31, 2014:
Fair value measurement using
Quoted prices in active markets
(Level 1)
Significant observable
inputs (Level 2)
Significant unobservable
inputs (Level 3)
(Amounts in ANG * 1,000) Date of valuation Total
Assets for which fair values are disclosed:Loans and receivables
Security deposits December 31, 2014 10,902 0 10,902 0
Liabilities for which fair values are disclosed:Interest bearing loans and borrowings
Fixed rate borrowings December 31, 2014 58,440 0 58,440 0
Corporate bonds IUH December 31, 2014 188,468 0 188,468 0
QuantitativedisclosuresfairvaluemeasurementhierarchyforassetsandliabilitiesatDecember
31, 2013:
Fair value measurement using
Quoted prices in active markets
(Level 1)
Significant observable
inputs (Level 2)
Significant unobservable
inputs (Level 3)
(Amounts in ANG * 1,000) Date of valuation Total
Assets for which fair values are disclosed:Loans and receivables
Security deposits December 31, 2013 10,483 0 10,483 0
Liabilities for which fair values are disclosed:Interest bearing loans and borrowings
Fixed rate borrowings December 31, 2013 71,221 0 71,221 0
Corporate bonds IUH December 31, 2013 197,581 0 197,581 0
109
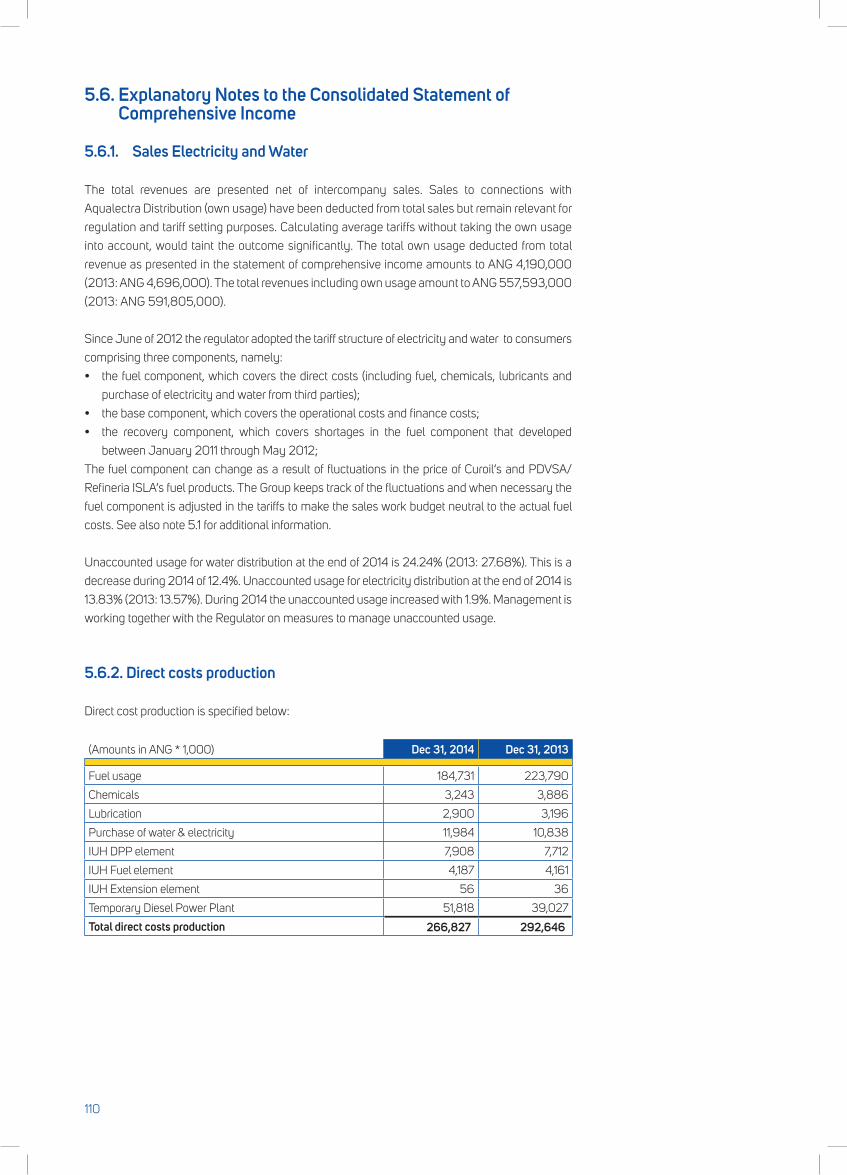
5.6. Explanatory Notes to the Consolidated Statement of Comprehensive Income
5.6.1. Sales Electricity and Water
The total revenues are presented net of intercompany sales. Sales to connections with
Aqualectra Distribution (own usage) have been deducted from total sales but remain relevant for
regulation and tariff setting purposes. Calculating average tariffs without taking the own usage
into account, would taint the outcome significantly. The total own usage deducted from total
revenue as presented in the statement of comprehensive income amounts to ANG 4,190,000
(2013: ANG 4,696,000). The total revenues including own usage amount to ANG 557,593,000
(2013: ANG 591,805,000).
Since June of 2012 the regulator adopted the tariff structure of electricity and water to consumers
comprising three components, namely:
• thefuelcomponent,whichcoversthedirectcosts(includingfuel,chemicals, lubricantsand
purchaseofelectricityandwaterfromthirdparties);
• thebasecomponent,whichcoverstheoperationalcostsandfinancecosts;
• the recovery component, which covers shortages in the fuel component that developed
betweenJanuary2011throughMay2012;
The fuel component can change as a result of fluctuations in the price of Curoil‘s and PDVSA/
Refineria ISLA‘s fuel products. The Group keeps track of the fluctuations and when necessary the
fuel component is adjusted in the tariffs to make the sales work budget neutral to the actual fuel
costs. See also note 5.1 for additional information.
Unaccounted usage for water distribution at the end of 2014 is 24.24% (2013: 27.68%). This is a
decrease during 2014 of 12.4%. Unaccounted usage for electricity distribution at the end of 2014 is
13.83% (2013: 13.57%). During 2014 the unaccounted usage increased with 1.9%. Management is
working together with the Regulator on measures to manage unaccounted usage.
5.6.2. Direct costs production
Direct cost production is specified below:
(Amounts in ANG * 1,000) Dec 31, 2014 Dec 31, 2013
Fuel usage 184,731 223,790
Chemicals 3,243 3,886
Lubrication 2,900 3,196
Purchase of water & electricity 11,984 10,838
IUH DPP element 7,908 7,712
IUH Fuel element 4,187 4,161
IUH Extension element 56 36
Temporary Diesel Power Plant 51,818 39,027
Total direct costs production 266,827 292,646
110
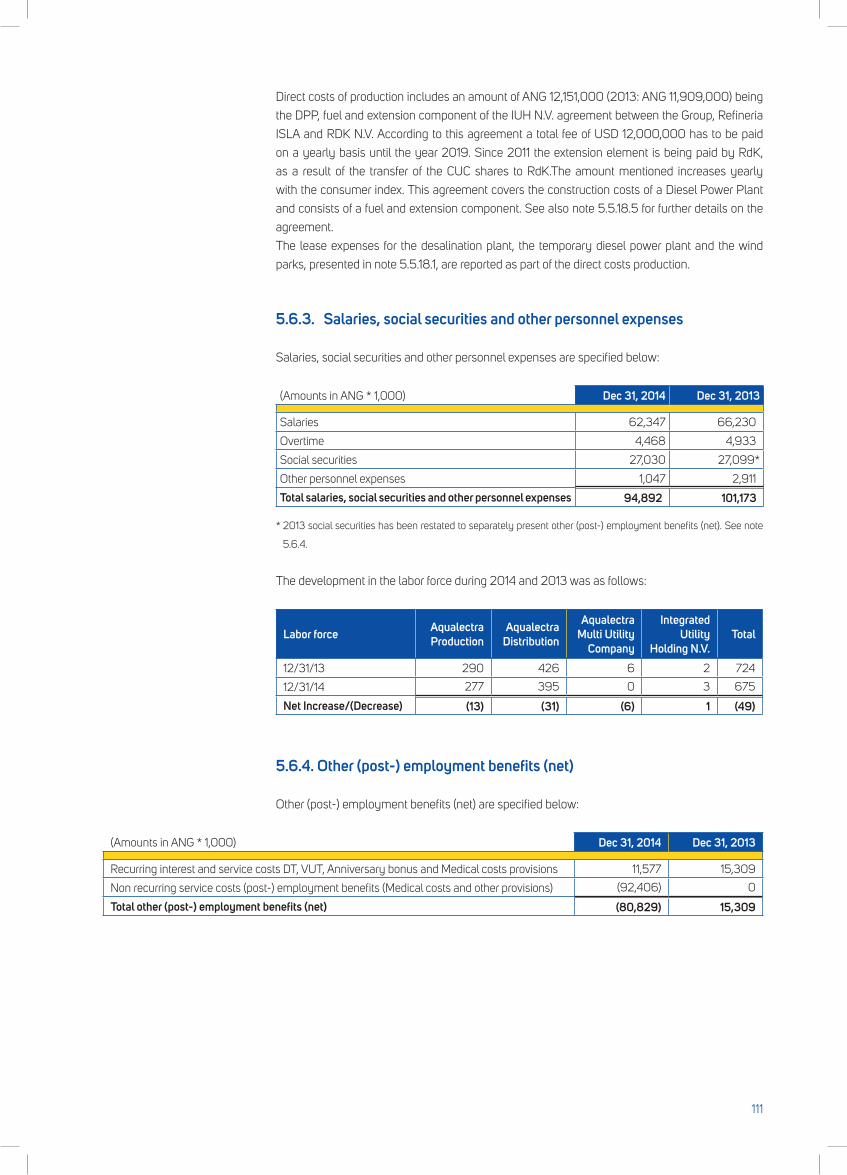
Direct costs of production includes an amount of ANG 12,151,000 (2013: ANG 11,909,000) being
the DPP, fuel and extension component of the IUH N.V. agreement between the Group, Refineria
ISLA and RDK N.V. According to this agreement a total fee of USD 12,000,000 has to be paid
on a yearly basis until the year 2019. Since 2011 the extension element is being paid by RdK,
as a result of the transfer of the CUC shares to RdK.The amount mentioned increases yearly
with the consumer index. This agreement covers the construction costs of a Diesel Power Plant
and consists of a fuel and extension component. See also note 5.5.18.5 for further details on the
agreement.
The lease expenses for the desalination plant, the temporary diesel power plant and the wind
parks, presented in note 5.5.18.1, are reported as part of the direct costs production.
5.6.3. Salaries, social securities and other personnel expenses
Salaries, social securities and other personnel expenses are specified below:
(Amounts in ANG * 1,000) Dec 31, 2014 Dec 31, 2013
Salaries 62,347 66,230
Overtime 4,468 4,933
Social securities 27,030 27,099*
Other personnel expenses 1,047 2,911
Total salaries, social securities and other personnel expenses 94,892 101,173
* 2013 social securities has been restated to separately present other (post-) employment benefits (net). See note
5.6.4.
The development in the labor force during 2014 and 2013 was as follows:
Labor force AqualectraProduction
Aqualectra Distribution
Aqualectra Multi Utility
Company
Integrated Utility
Holding N.V.Total
12/31/13 290 426 6 2 724
12/31/14 277 395 0 3 675
Net Increase/(Decrease) (13) (31) (6) 1 (49)
5.6.4. Other (post-) employment benefits (net)
Other (post-) employment benefits (net) are specified below:
(Amounts in ANG * 1,000) Dec 31, 2014 Dec 31, 2013
Recurring interest and service costs DT, VUT, Anniversary bonus and Medical costs provisions 11,577 15,309
Non recurring service costs (post-) employment benefits (Medical costs and other provisions) (92,406) 0
Total other (post-) employment benefits (net) (80,829) 15,309
111
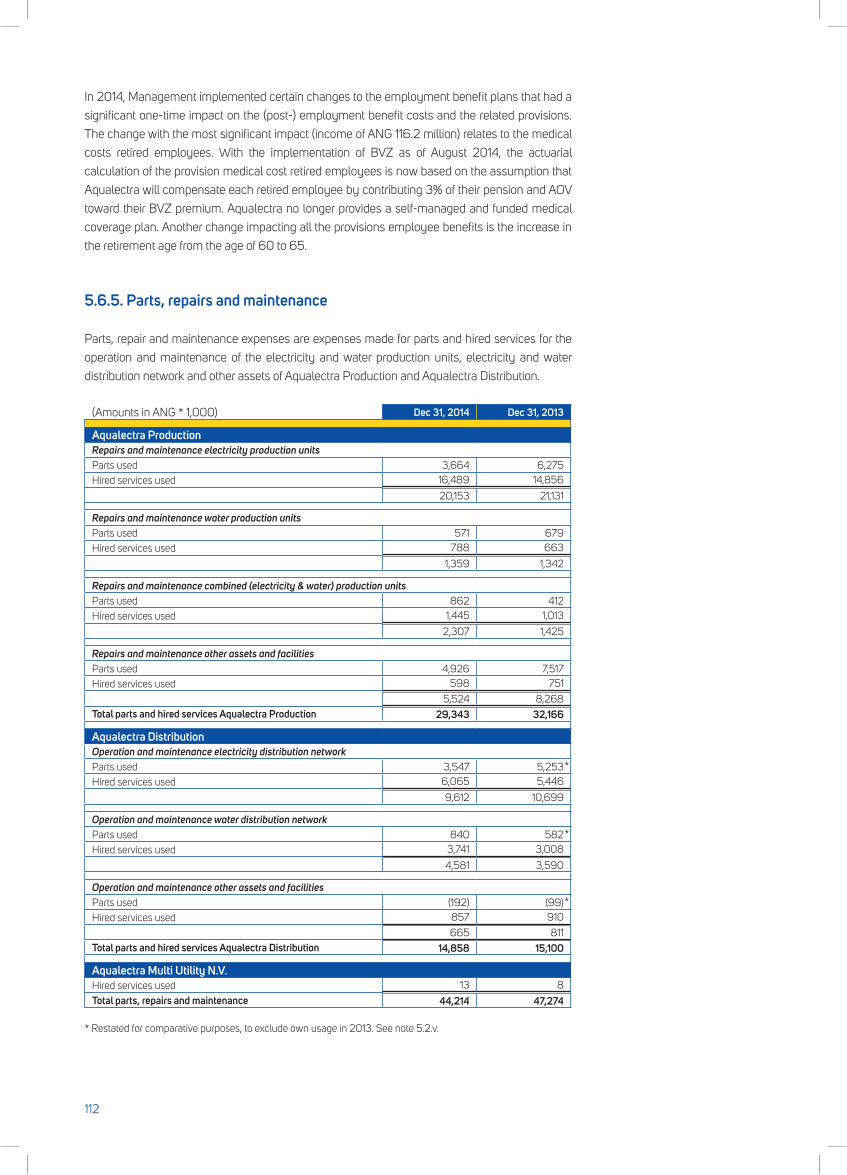
In 2014, Management implemented certain changes to the employment benefit plans that had a
significant one-time impact on the (post-) employment benefit costs and the related provisions.
The change with the most significant impact (income of ANG 116.2 million) relates to the medical
costs retired employees. With the implementation of BVZ as of August 2014, the actuarial
calculation of the provision medical cost retired employees is now based on the assumption that
Aqualectra will compensate each retired employee by contributing 3% of their pension and AOV
toward their BVZ premium. Aqualectra no longer provides a self-managed and funded medical
coverage plan. Another change impacting all the provisions employee benefits is the increase in
the retirement age from the age of 60 to 65.
5.6.5. Parts, repairs and maintenance
Parts, repair and maintenance expenses are expenses made for parts and hired services for the
operation and maintenance of the electricity and water production units, electricity and water
distribution network and other assets of Aqualectra Production and Aqualectra Distribution.
(Amounts in ANG * 1,000) Dec 31, 2014 Dec 31, 2013
Aqualectra ProductionRepairs and maintenance electricity production unitsParts used 3,664 6,275Hired services used 16,489 14,856
20,153 21,131
Repairs and maintenance water production units Parts used 571 679Hired services used 788 663
1,359 1,342
Repairs and maintenance combined (electricity & water) production units Parts used 862 412Hired services used 1,445 1,013
2,307 1,425
Repairs and maintenance other assets and facilities Parts used 4,926 7,517Hired services used 598 751
5,524 8,268Total parts and hired services Aqualectra Production 29,343 32,166
Aqualectra DistributionOperation and maintenance electricity distribution network Parts used 3,547 5,253Hired services used 6,065 5,446
9,612 10,699
Operation and maintenance water distribution network Parts used 840 582Hired services used 3,741 3,008
4,581 3,590
Operation and maintenance other assets and facilities Parts used (192) (99) Hired services used 857 910
665 811Total parts and hired services Aqualectra Distribution 14,858 15,100
Aqualectra Multi Utility N.V. Hired services used 13 8
Total parts, repairs and maintenance 44,214 47,274
* Restated for comparative purposes, to exclude own usage in 2013. See note 5.2.v.
*
*
*
112
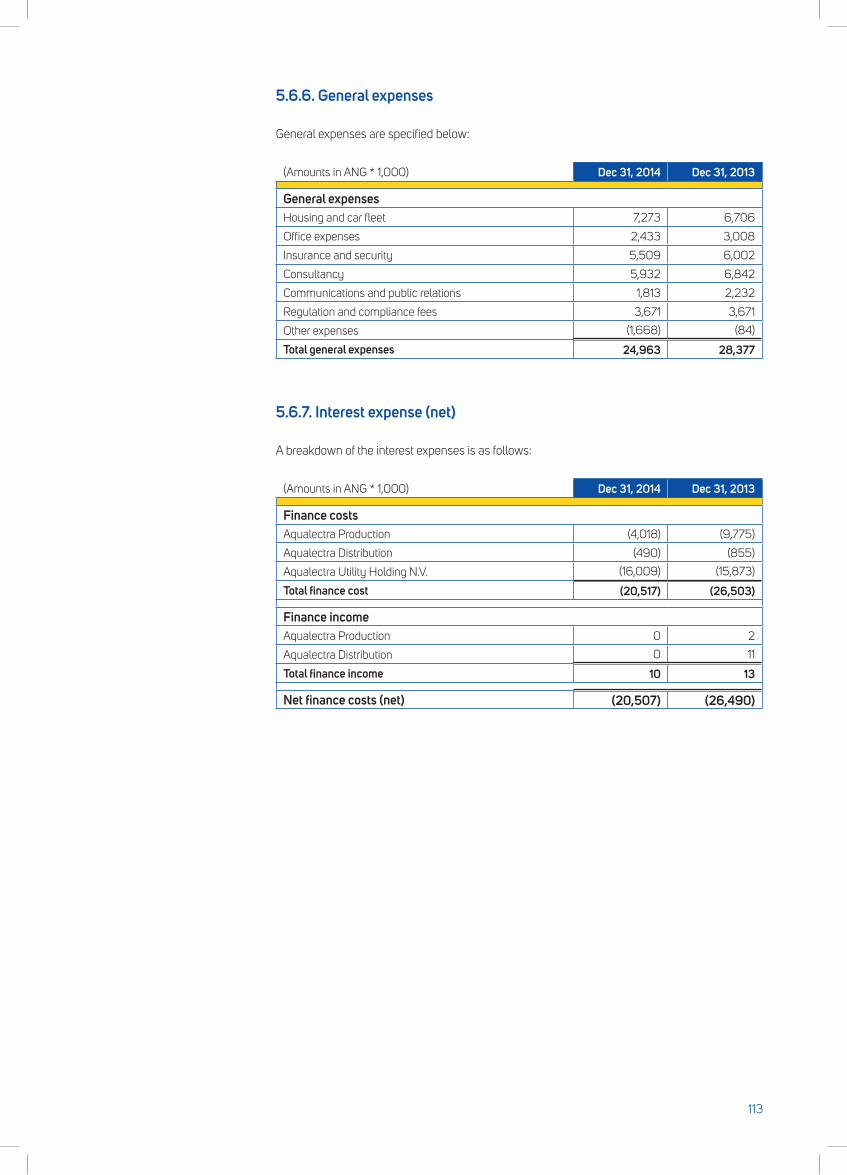
5.6.6. General expenses
General expenses are specified below:
(Amounts in ANG * 1,000) Dec 31, 2014 Dec 31, 2013
General expensesHousing and car fleet 7,273 6,706
Office expenses 2,433 3,008
Insurance and security 5,509 6,002
Consultancy 5,932 6,842
Communications and public relations 1,813 2,232
Regulation and compliance fees 3,671 3,671
Other expenses (1,668) (84)
Total general expenses 24,963 28,377
5.6.7. Interest expense (net)
A breakdown of the interest expenses is as follows:
(Amounts in ANG * 1,000) Dec 31, 2014 Dec 31, 2013
Finance costsAqualectra Production (4,018) (9,775)
Aqualectra Distribution (490) (855)
Aqualectra Utility Holding N.V. (16,009) (15,873)
Total finance cost (20,517) (26,503)
Finance incomeAqualectra Production 0 2
Aqualectra Distribution 0 11
Total finance income 10 13
Net finance costs (net) (20,507) (26,490)
113
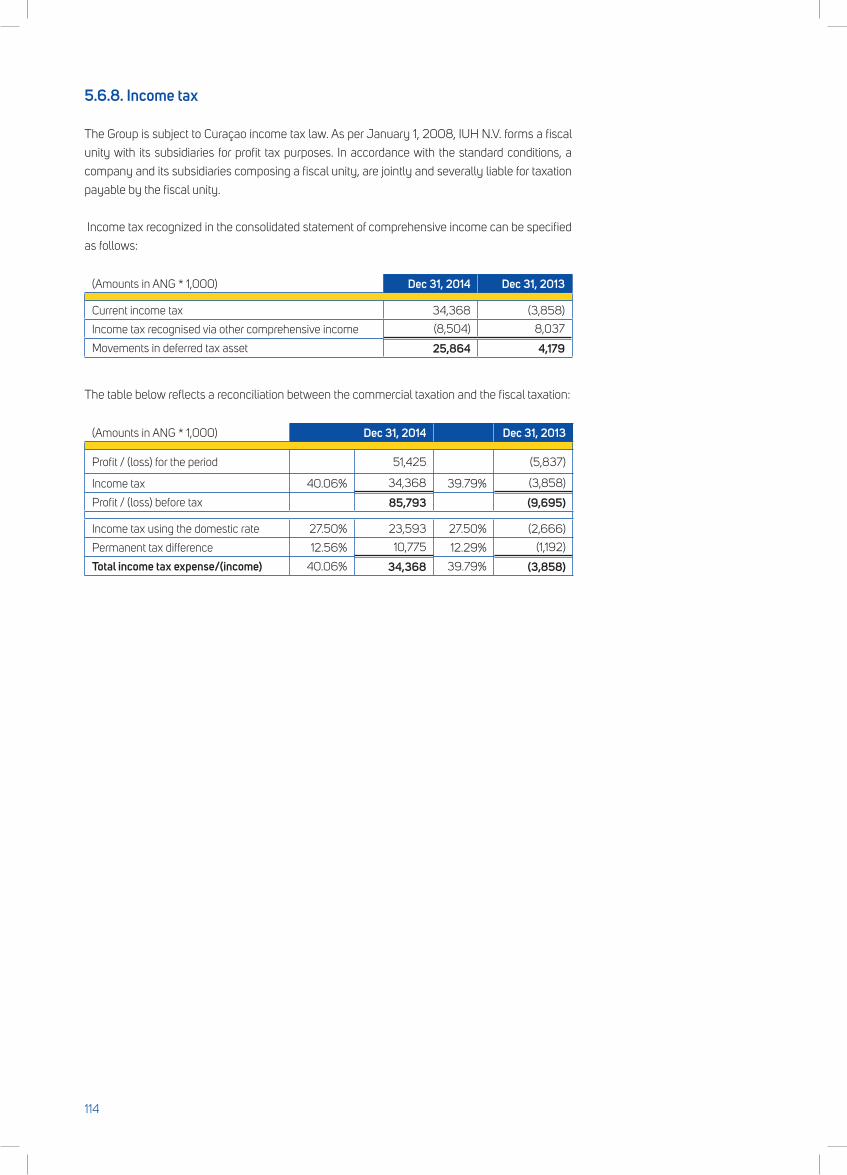
5.6.8. Income tax
The Group is subject to Curaçao income tax law. As per January 1, 2008, IUH N.V. forms a fiscal
unity with its subsidiaries for profit tax purposes. In accordance with the standard conditions, a
company and its subsidiaries composing a fiscal unity, are jointly and severally liable for taxation
payable by the fiscal unity.
Income tax recognized in the consolidated statement of comprehensive income can be specified
as follows:
(Amounts in ANG * 1,000) Dec 31, 2014 Dec 31, 2013
Current income tax 34,368 (3,858)
Income tax recognised via other comprehensive income (8,504) 8,037
Movements in deferred tax asset 25,864 4,179
The table below reflects a reconciliation between the commercial taxation and the fiscal taxation:
(Amounts in ANG * 1,000) Dec 31, 2014 Dec 31, 2013
Profit / (loss) for the period 51,425 (5,837)
Income tax 40.06% 34,368 39.79% (3,858)
Profit / (loss) before tax 85,793 (9,695)
Income tax using the domestic rate 27.50% 23,593 27.50% (2,666)
Permanent tax difference 12.56% 10,775 12.29% (1,192)
Total income tax expense/(income) 40.06% 34,368 39.79% (3,858)
114
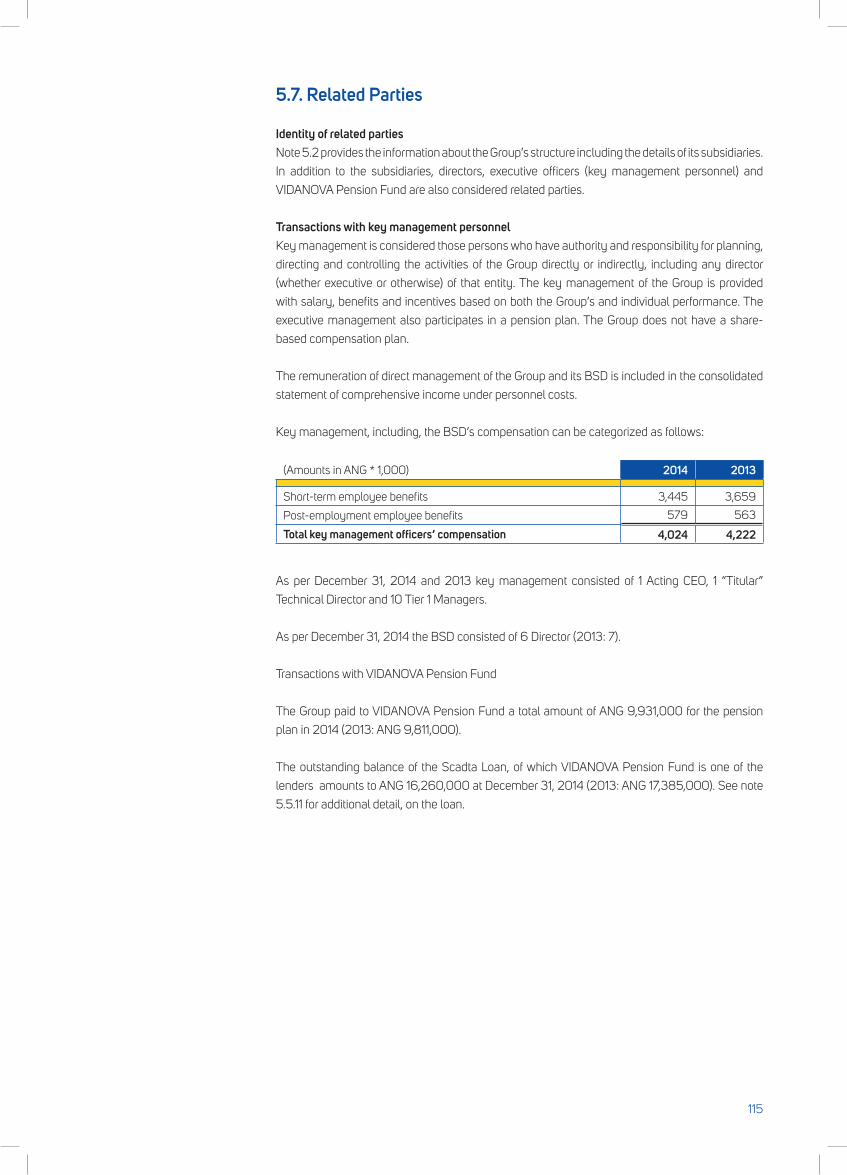
5.7. Related Parties
Identity of related partiesNote 5.2 provides the information about the Group’s structure including the details of its subsidiaries.
In addition to the subsidiaries, directors, executive officers (key management personnel) and
VIDANOVA Pension Fund are also considered related parties.
Transactions with key management personnelKey management is considered those persons who have authority and responsibility for planning,
directing and controlling the activities of the Group directly or indirectly, including any director
(whether executive or otherwise) of that entity. The key management of the Group is provided
with salary, benefits and incentives based on both the Group’s and individual performance. The
executive management also participates in a pension plan. The Group does not have a share-
based compensation plan.
The remuneration of direct management of the Group and its BSD is included in the consolidated
statement of comprehensive income under personnel costs.
Key management, including, the BSD’s compensation can be categorized as follows:
(Amounts in ANG * 1,000) 2014 2013
Short-term employee benefits 3,445 3,659
Post-employment employee benefits 579 563
Total key management officers’ compensation 4,024 4,222
As per December 31, 2014 and 2013 key management consisted of 1 Acting CEO, 1 “Titular”
Technical Director and 10 Tier 1 Managers.
As per December 31, 2014 the BSD consisted of 6 Director (2013: 7).
Transactions with VIDANOVA Pension Fund
The Group paid to VIDANOVA Pension Fund a total amount of ANG 9,931,000 for the pension
plan in 2014 (2013: ANG 9,811,000).
The outstanding balance of the Scadta Loan, of which VIDANOVA Pension Fund is one of the
lenders amounts to ANG 16,260,000 at December 31, 2014 (2013: ANG 17,385,000). See note
5.5.11 for additional detail, on the loan.
115
5.8. Subsequent events
Investment projects
New facilities
The Group received in April 2015 an option
on a land as part of the commitment of the
Government to grant IUH a leasehold land of
a size comparable to the land of the Scadta
Peninsula (old Amstel land at the Rijkseenheid
Boulevard) that was designated for the
construction of a new Operational Center and
Technical Services Facility for the Group prior
to the termination of the related agreements
in 2011. Upon termination of the agreements,
the Group was held liable for all expenses
incurred by Scadta in the development of the
land amounting to ANG 18.8 million which was
recorded in the 2011 consolidated statement
of income. Management intends to construct
a new office at the chosen location as part of
the organizational restructuring. In this matter
the assets at Pater Euwensweg and Rector
Zwijsenstraat will be vacated and put up for
sale.
Recovery 2012 and 2013 undercoverage
On April 29, 2015, the Council of Ministers
reached a resolution in which they agreed to
extend the period of the recovery component
which was set to end at the end of April 2015,
with an additional 6 months based on the
advice of the Regulator. This recovery is meant
to compensate for the costs incurred during
2012 and 2013 related to the IUH Agreement
and also the lease of the temporary diesel
power plant. With the introduction of the new
tariff structure in June 2012, these costs
were assumed to be covered by the base
component. With the significant increase in
the lease costs of the temporary diesel power
plant with no corresponding adjustment to the
base component, a significant undercoverage
was created. These costs amounted to ANG
5.1 million in 2013. The Regulator requires
additional time to determine the accuracy of the
reported undercoverage in order to determine
if further extension of the recovery period is
necessary.
Future projections
The Group prepares a budget and forward
looking projection on a yearly basis. In the most
recent approved budget (2015), a profit of ANG
24.3 million is projected. There are however
various factors that may hamper the Group
from attaining this goal. The following must be
achieved in order for the goals set out in the
2015 budget and forward looking projection to
be met:
• ApropercapitalandfinancingstructureThe presented budget does not include
any financing proposition. Management
consciously chose to not do so since such a
proposition must be accompanied by thorough
financial analysis on investment plans and
a clear financial strategy. These plans and
strategies will be drafted during the first months
of 2015. This will allow Management to tap
only once into the financial markets, with a
solid plan to secure the necessary financing
for the future investments. However, the
Shareholder’s contribution to this process is
essential as financiers will continue to request
for the ‘Heads-of’ agreement in which financial
pre-conditions are set and agreed to by the
Government.
• Furtheramplificationofthetariffsetting mechanism
Although the tariff setting process has been
significantly improved during the last years,
there is still work to be done. The base
component is still not sufficient. However, a
cost-of-service approach is being discussed
with the Regulator and is pending to be
masterminded by Aqualectra together with the
Regulator to ensure tariffs that the Group can
thrive with.
116
• OptimalusageoftheGroup’sassetsin the production and distribution process
This requires the further implementation of an
asset management program. The design of this
program was already executed in 2014 and the
implementation is planned for 2015.
• EmbedtheenvisionedchangesintheGroup’s human capital
Aqualectra’s personnel must become the
ambassadors of the new way of doing business
depicted in its vision statement. A new company
and organizational structure, HR policy and
strategic training and development plans are all
aspects that are considered by Management
and have been included in the budget of 2015.
117
118
119
120

Notes
121

Notes
122