Embed Size (px)
Citation preview

Building Energy Information Systems and Performance Monitoring Tools
Technical Advisory Group Meeting
Mary Ann PiettePhil Price
Jessica GrandersonGirish Ghatikar
Lawrence Berkeley National Laboratory
Sponsored by the California Energy Commission Public Interest Energy Research (PIER) Program
California Institute for Energy and the EnvironmentNovember 21, 2008
http://eis.lbl.gov/
TAG Meeting 11/21/2008 2
Meeting Agenda
1.
Project Goals and Objectives2.
Technical Advisory Group Role
3.
Previous Research at LBNL4.
Key EIS Features Considered
5.
Tools and Products to be Evaluated6.
Case Study Research Questions
7.
Timeline and Next Steps8.
Discussion Questions for TAG
Appendices –
Detailed Framework Questions

TAG Meeting 11/21/2008 3
1. Project Goals
–
Evaluate
EIS and how they support reducing energy
use and costs and emissions from energy use
–
Describe
status of technology and improvements in
information management systems
–
Consider
how facility operators and energy managers
access to energy information
–
Assess
how EIS can improve demand responsiveness
and peak demand reductions
–
Analyze
methods to improve energy information links
to non-energy issues –
maintenance/operations, other
resource consumption (e.g. water)
KWH

TAG Meeting 11/21/2008 4
Specific Objectives
–
Develop
framework to characterize and classify EIS and
PM tools for building energy analysis.
–
Evaluate
and characterize current products, tools, and
systems used, and developed for commercial buildings.
–
Develop
evaluation concept for case studies to evaluate
how facility uses existing and emerging tools
–
Support
state buildings, monitoring based commissioning
–
Update
2003 report –
“Web-based EIS for Energy Management
and Demand Response in Commercial Buildings.”
Scope does not include end-use, EMCS, or HVAC fault diagnostics

TAG Meeting 11/21/2008 5
2. Technical Advisory Group
•
Karl Brown, UC
•
Martha Brook and Norm Bourassa, CEC
•
Ron Hofmann, CIEE
•
Mark Levi, GSA
•
Graham Henderson, BC Hydro
•
Len Pettis, Cal State U
•
Chuck Frost, UC Berkeley
•
John C. Dilliott, UC San Diego
•
Glen Lewis, UC Davis
•
Roger Levy, Consultant to DR Research Center
•
Kathy Turner, New Buildings Institute
•
David Jump and Bill Koran, QuEST
•
Reinhard
Seidl, Taylor Engineering

TAG Meeting 11/21/2008 6
Technical Advisory Group Role
•
Recruit external technical advisors
•
Two-way relationship–
TAG to provide review and feedback to project plans
–
TAG to benefit from results of research
•
Initial TAG Plan–
1st meeting following draft framework plan (Present)
–
2nd meeting to discuss findings for incorporation in the draft final report (Spring 2009)
•
May hold one more meeting
TAG Meeting 11/21/2008 7
3. Previous Research at LBNL•
Information Monitoring and Diagnostic System (1993-1998)
•
Energy Information System Case Study at UC Santa Barbara (2002)
•
GSA Energy and Maintenance Network (GEMnet, 2003)
•
Energy Information Systems Report
•
Performance Monitoring Specifications
•
2003-2008 Open Automated Demand Response Communication Systems Development
TAG Meeting 11/21/2008 8
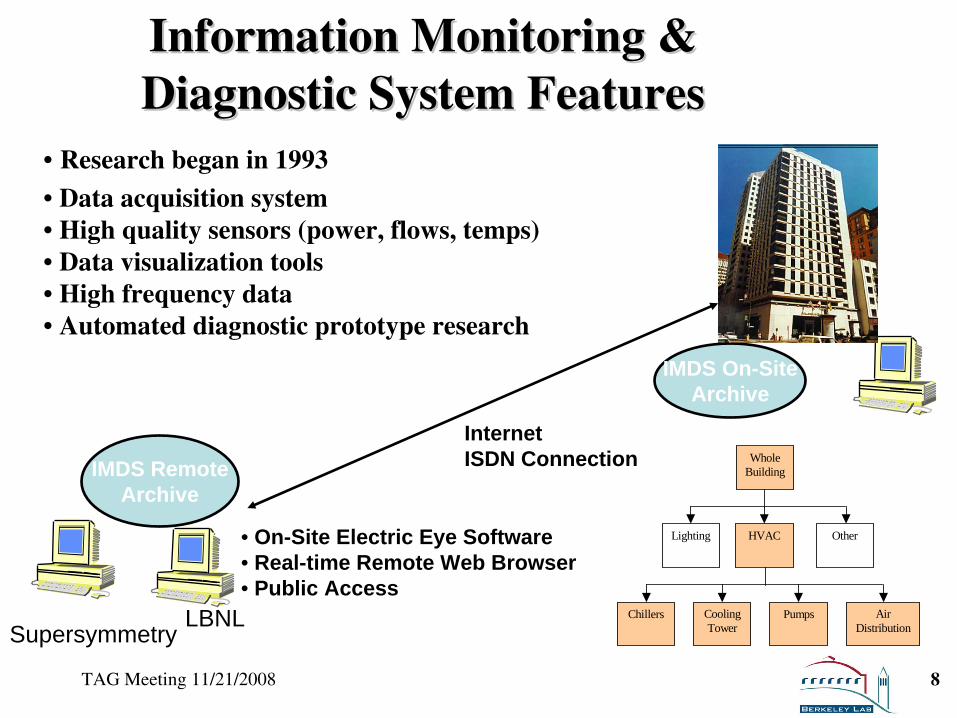
• On-Site Electric Eye Software• Real-time Remote Web Browser• Public Access
InternetISDN ConnectionIMDS Remote
Archive
• Research began in 1993• Data acquisition system • High quality sensors (power, flows, temps)• Data visualization tools• High frequency data• Automated diagnostic prototype research
LBNLSupersymmetry
IMDS On-SiteArchive
WholeBuilding
HVAC OtherLighting
Chillers CoolingTower
Pumps AirDistribution
Information Monitoring & Information Monitoring & Diagnostic System FeaturesDiagnostic System Features
TAG Meeting 11/21/2008 9
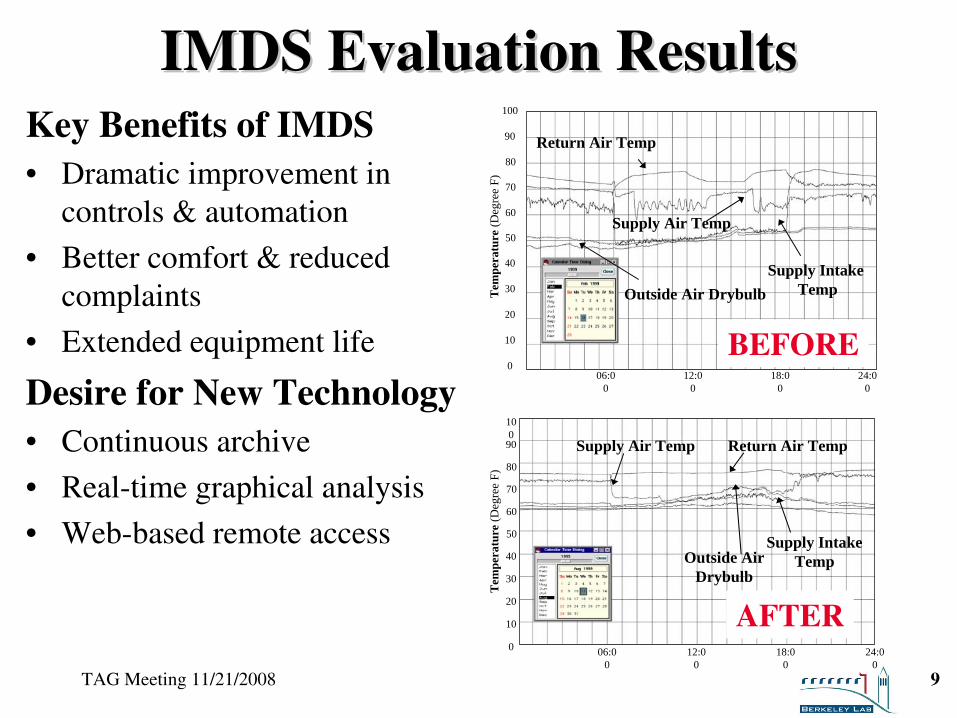
IMDS Evaluation ResultsIMDS Evaluation ResultsKey Benefits of IMDS•
Dramatic improvement in controls & automation
•
Better comfort & reduced complaints
•
Extended equipment life
Desire for New Technology•
Continuous archive
•
Real-time graphical analysis
•
Web-based remote access
Supply Air Temp
Outside Air DrybulbSupply Intake
Temp
Return Air Temp
50
60
70
80
10
20
30
40
0
90
100
06:0 0
12:0 0
18:0 0
24:0 0
Tem
pera
ture
(Deg
ree
F)
Supply Air Temp Return Air Temp
Supply Intake TempOutside Air
Drybulb
50
60
70
80
10
20
30
40
0
90
10 0
06:0 0
12:0 0
18:0 0
24:0 0
Tem
pera
ture
(Deg
ree
F)
BEFORE
AFTER
TAG Meeting 11/21/2008 10
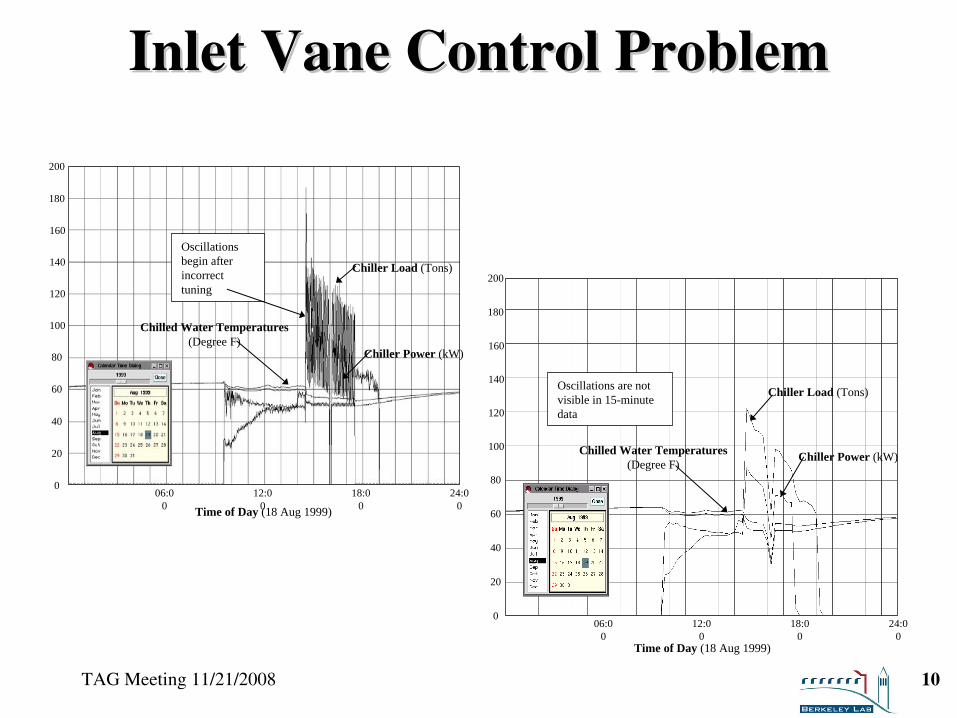
Inlet Vane Control ProblemInlet Vane Control Problem
Time of Day (18 Aug 1999)
100
120
140
160
20
40
60
80
0
180
200
06:0 0
12:0 0
18:0 0
24:0 0
Chiller Load (Tons)
Chiller Power (kW)
Chilled Water Temperatures (Degree F)
Oscillations begin after incorrect tuning
Time of Day (18 Aug 1999)
100
120
140
160
20
40
60
80
0
180
200
06:0 0
12:0 0
18:0 0
24:0 0
Chiller Load (Tons)
Chiller Power (kW)Chilled Water Temperatures (Degree F)
Oscillations are not visible in 15-minute data
TAG Meeting 11/21/2008 11
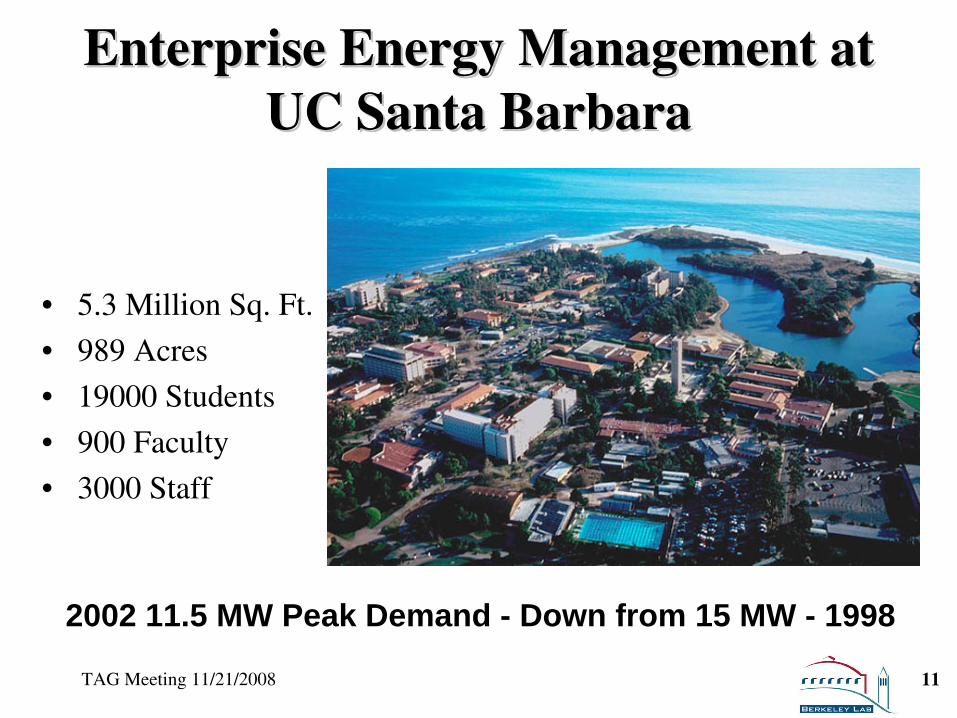
Enterprise Energy Management at Enterprise Energy Management at UC Santa BarbaraUC Santa Barbara
•
5.3 Million Sq. Ft.
•
989 Acres
•
19000 Students
•
900 Faculty
•
3000 Staff
2002 11.5 MW Peak Demand - Down from 15 MW - 1998
TAG Meeting 11/21/2008 12
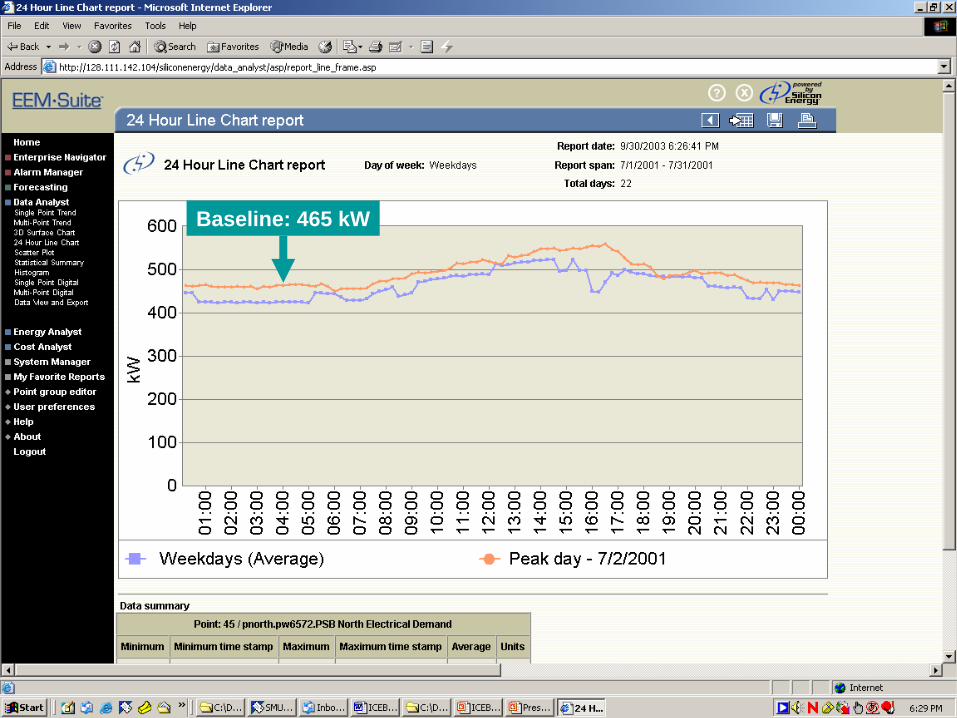
Findings from the EISFindings from the EIS
•
Fan Nighttime ReductionBaseline: 465 kW
TAG Meeting 11/21/2008 13
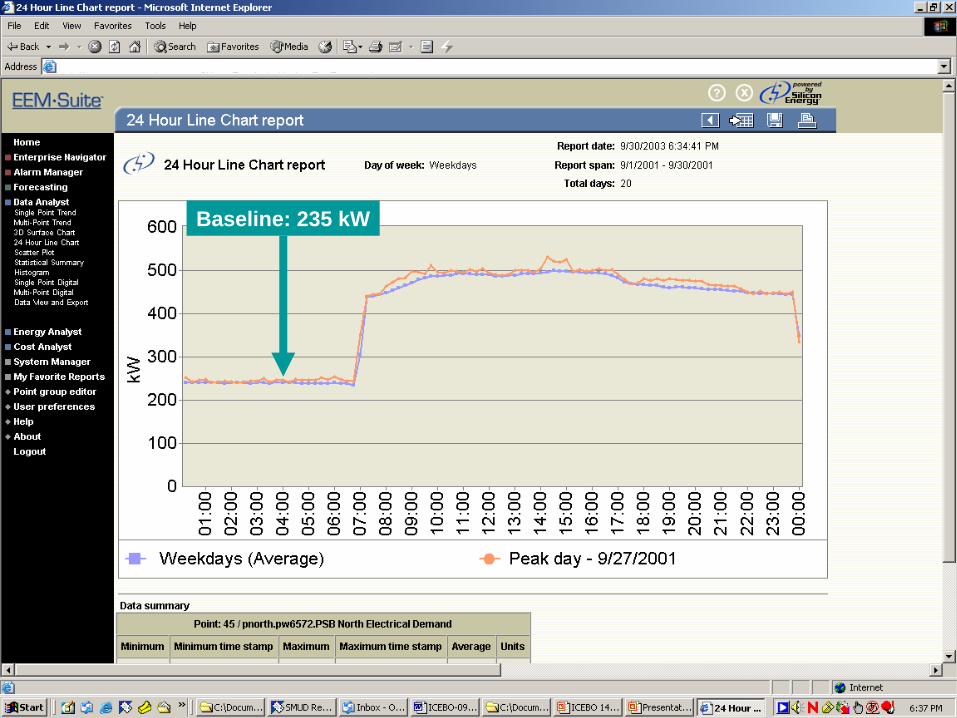
Findings from the EISFindings from the EIS
•
Fan Nighttime ReductionBaseline: 235 kW

TAG Meeting 11/21/2008 14
UCSB Cost Benefit AnalysisUCSB Cost Benefit Analysis
Electricity
[MWH]Peak Demand
[kW]Total
May00-April01 83,700 12,742
May01-April02 75,100 11,362
Saving 8,600 1,300
Cost saved $430,000
(10.3%)$160,000
(12.4%)$590,000
(10.8%)
Due to EIS (50%) $215,000 $80,000 $295,000
Electricity Cost Saving
EIS first year cost: $295,000Payback period: 1.2 year
TAG Meeting 11/21/2008 15
EIS OperationsEIS Operations•
EIS users: energy manager, facility managers
•
EIS use:
30 min per day, and often more when operational settings have been changed
•
EIS data: –
Time-series energy consumption data as daily routine.
–
Reporting features support participation in energy conservation programs
TAG Meeting 11/21/2008 16
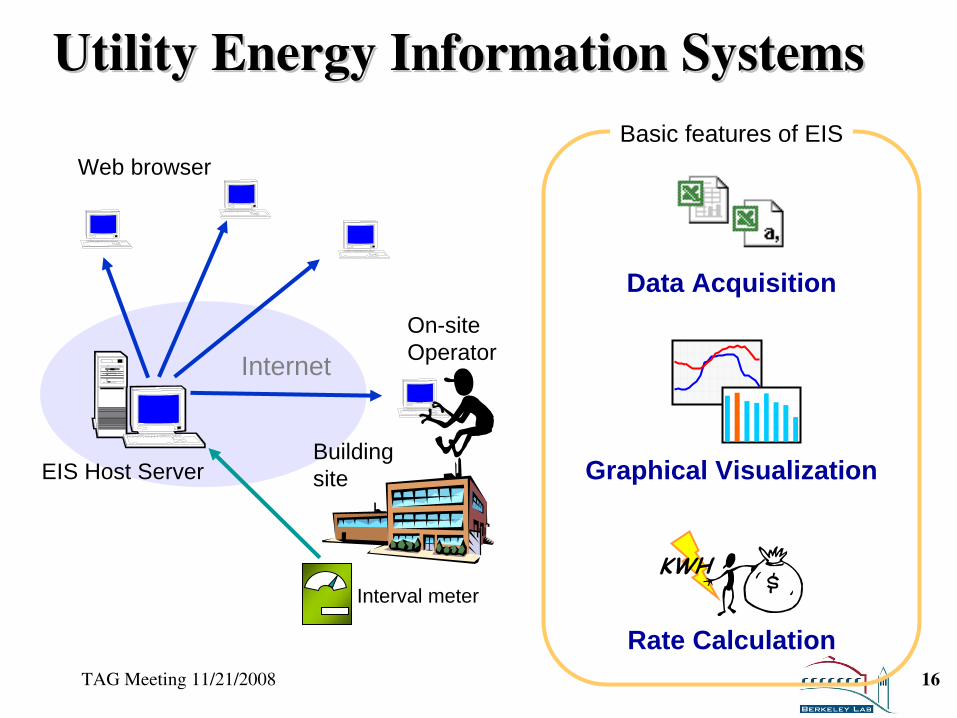
Utility Energy Information SystemsUtility Energy Information Systems
Internet
Interval meter
BuildingsiteEIS Host Server
KWH
Graphical Visualization
Data Acquisition
Rate Calculation
Basic features of EIS
On-siteOperator
Web browser

TAG Meeting 11/21/2008 17
WebWeb--based EMCS Interfacesbased EMCS Interfaces
Internet
EISHost Server On-site
Operator
Energymanager
Diagnostic Agent
Feedback
Intervalmeter
Submeter
EMCS
On-site Gateway
Building Site
[] [] [] [] [][] [] [] [] [][] [] [] [] [][] [] [] [] [][] [] [] [] []
[] [] [] [] [][] [] [] [] [][] [] [] [] [][] [] [] [] [][] [] [] [] []
AHUAnalysis
ChillerAnalysis

TAG Meeting 11/21/2008 18
Types of EISTypes of EIS•
Utility Energy Information Systems (Utility EIS)
•
Demand Response Systems (DRS)
•
Enterprise Energy Management (EEM)
•
Web-base Energy Management & Control System (Web-EMCS)
Energy InformationSystems (EIS)
Utility EIS
EEM
DRS
Monitoringand Control
DemandResponse
Web- EMCS
TAG Meeting 11/21/2008 19
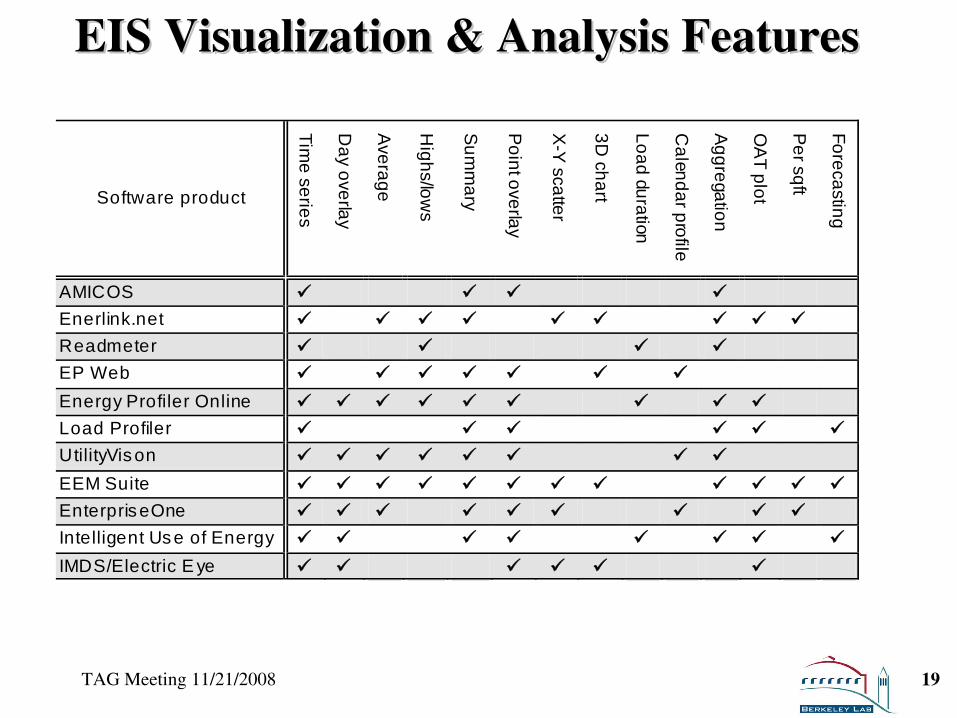
EIS Visualization & Analysis FeaturesEIS Visualization & Analysis Features
Software product
Time series
Day overlay
Average
Highs/low
s
Sum
mary
Point overlay
X-Y
scatter
3D chart
Load duration
Calendar profile
Aggregation
OA
T plot
Per sqft
Forecasting
AMICOS Enerlink.net Readmeter EP Web Energy Profiler Online Load Profiler UtilityVis on EEM Suite EnterpriseOne Intelligent Us e of Energy IMDS/Electric E ye

TAG Meeting 11/21/2008 20
4. EIS Product Evaluations
•
Characterization framework–
Feature categories•
Data collection, TX, storage, security
•
Display and visualization
•
Energy, financial, and advanced analysis,
•
Demand Response
•
Control Management (Automated/Remote)
•
“Meta”
(general product, cost, and company business model)
–
Feature details•
Display -
XY plots, DR status, trend overlays (day, point)
•
Analysis -
normalization, benchmarking, forecasting, FDD, carbon
•
DR -
notification, auto/manual, baseline, real-time response
•
Data -
archived/exported format, protocols and interoperability, upload frequency, security
•
Meta -
cost, target users, upgrades, number of users, browser support

TAG Meeting 11/21/2008 21
Status of EIS Evaluations
•
40-60 EIS targeted for evaluation–
To date, ~12 completed or underway
•
Evaluation process–
1st-pass characterization from public domain info
–
Contact company rep for remaining details, finalization
–
Review company history, goals/mission, future plans
–
Probe for lead users and potential case studies
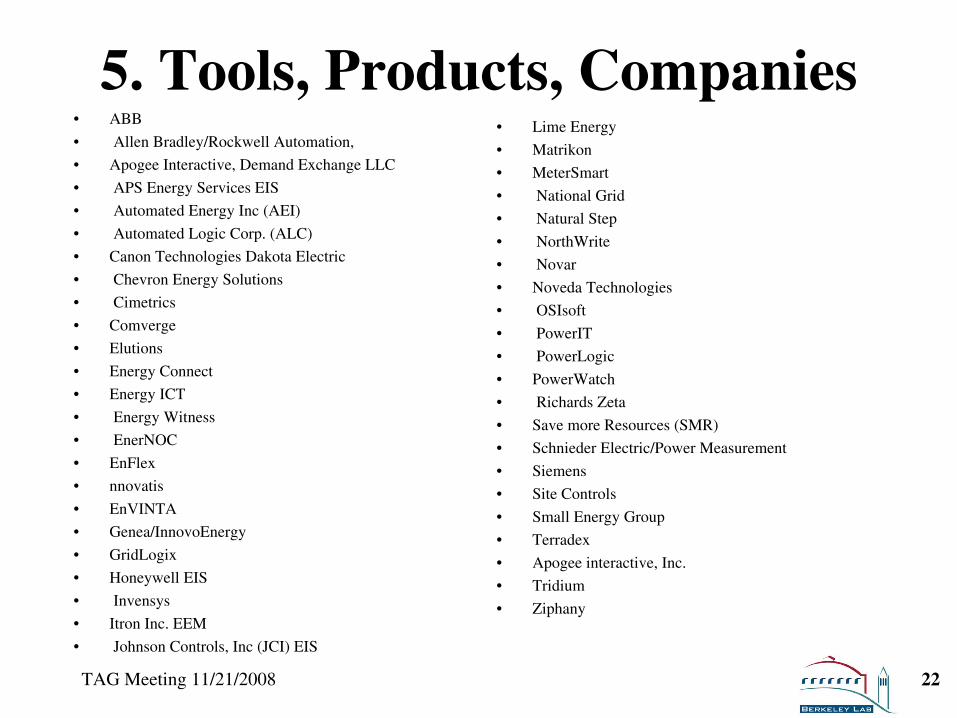
5. Tools, Products, Companies•
ABB
•
Allen Bradley/Rockwell Automation,
•
Apogee Interactive, Demand Exchange LLC
•
APS Energy Services EIS
•
Automated Energy Inc (AEI)
•
Automated Logic Corp. (ALC)
•
Canon Technologies Dakota Electric
•
Chevron Energy Solutions
•
Cimetrics
•
Comverge
•
Elutions
•
Energy Connect
•
Energy ICT
•
Energy Witness
•
EnerNOC
•
EnFlex
•
nnovatis
•
EnVINTA
•
Genea/InnovoEnergy
•
GridLogix
•
Honeywell EIS
•
Invensys
•
Itron Inc. EEM
•
Johnson Controls, Inc (JCI) EIS
•
Lime Energy
•
Matrikon
•
MeterSmart
•
National Grid
•
Natural Step
•
NorthWrite
•
Novar
•
Noveda Technologies
•
OSIsoft
•
PowerIT
•
PowerLogic
•
PowerWatch
•
Richards Zeta
•
Save more Resources (SMR)
•
Schnieder Electric/Power Measurement
•
Siemens
•
Site Controls
•
Small Energy Group
•
Terradex
•
Apogee interactive, Inc.
•
Tridium
•
Ziphany
TAG Meeting 11/21/2008 22
TAG Meeting 11/21/2008 23
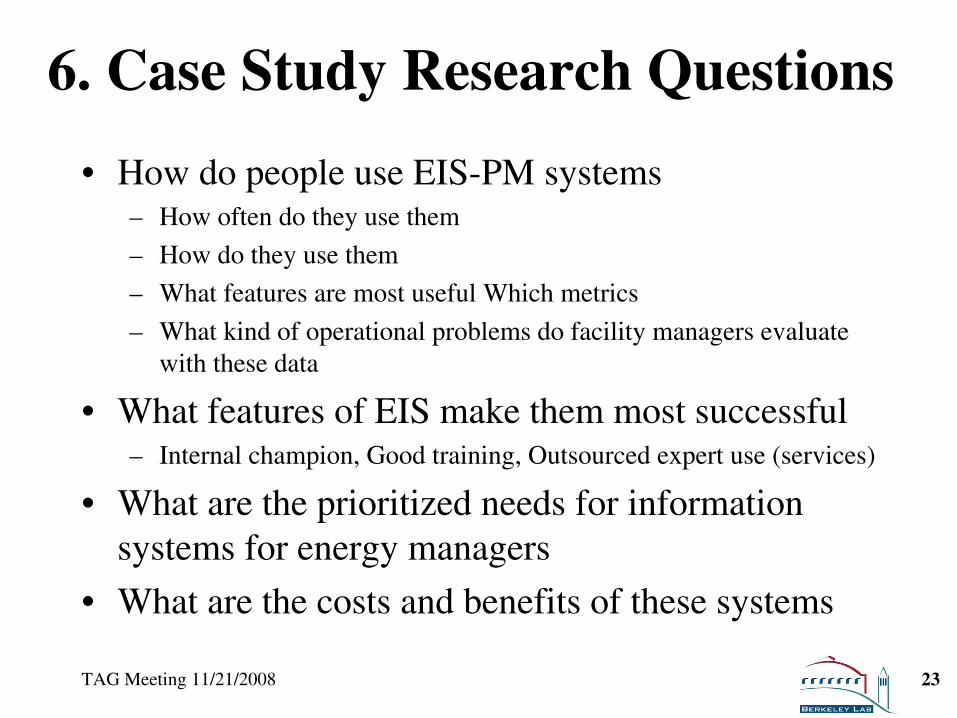
6. Case Study Research Questions
•
How do people use EIS-PM systems–
How often do they use them
–
How do they use them
–
What features are most useful Which metrics
–
What kind of operational problems do facility managers evaluate with these data
•
What features of EIS make them most successful–
Internal champion, Good training, Outsourced expert use (services)
•
What are the prioritized needs for information systems for energy managers
•
What are the costs and benefits of these systems
TAG Meeting 11/21/2008 24
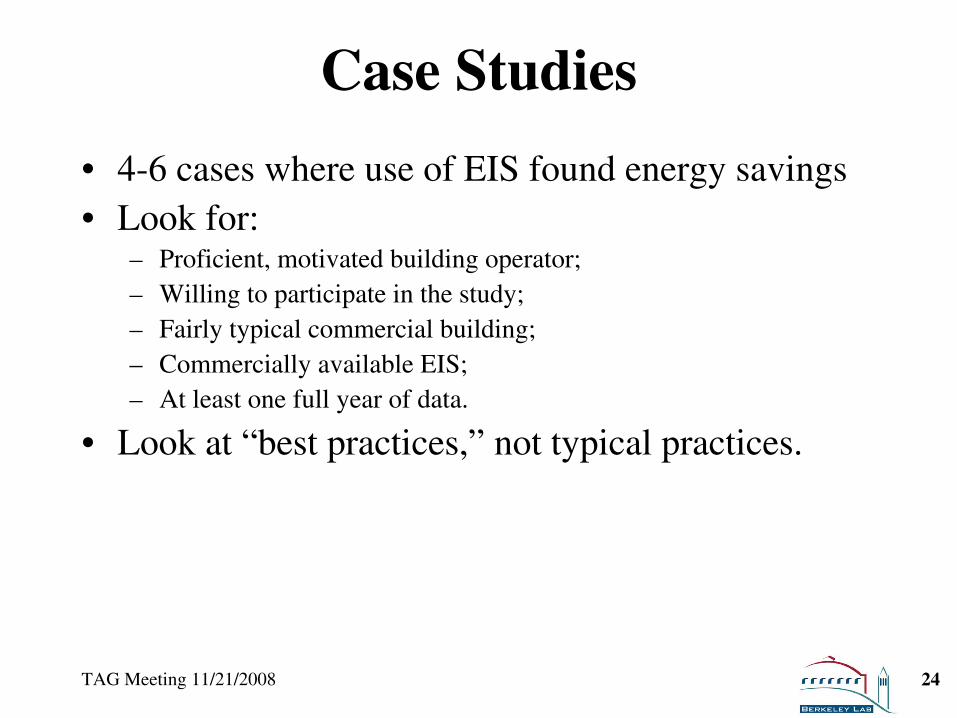
Case Studies
•
4-6 cases where use of EIS found energy savings•
Look for:–
Proficient, motivated building operator; –
Willing to participate in the study;–
Fairly typical commercial building;–
Commercially available EIS;–
At least one full year of data.
•
Look at “best practices,”
not typical practices.
TAG Meeting 11/21/2008 25
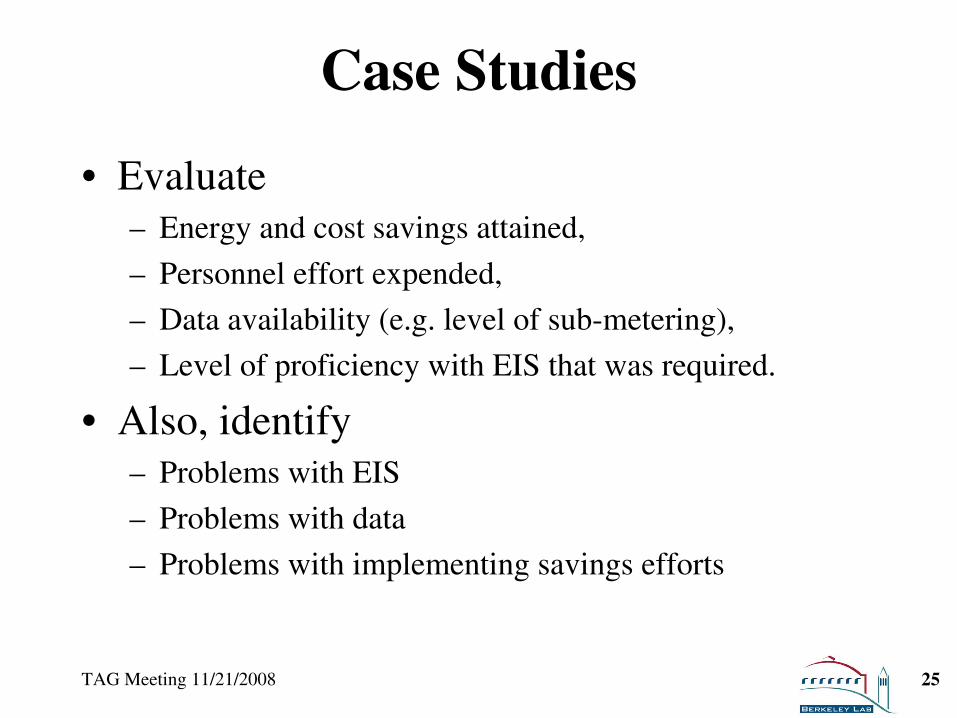
Case Studies
•
Evaluate–
Energy and cost savings attained,
–
Personnel effort expended,
–
Data availability (e.g. level of sub-metering),
–
Level of proficiency with EIS that was required.
•
Also, identify–
Problems with EIS
–
Problems with data
–
Problems with implementing savings efforts

TAG Meeting 11/21/2008 26
7. Project Timeline and Next Steps
•
Tasks 1-4, June-November 2008–
Finalize scope and initial framework for study
–
Develop and manage TAG
–
Identify products/systems for evaluation
–
Finalize categorization framework
•
Next Steps–
January 2009 evaluate 40-60 IES
–
February 2009 hold second TAG meeting
–
February 2009 conduct selected EIS case studies
–
March 2009 compile findings into final report
–
June 2009 present findings at Natl Conf on Bldg Cx

8. Discussion Questions for TAG
•
What other key features should we include
•
What other EIS technologies are we missing
•
What other case study criteria would you consider
•
What possible case study sites would you suggest?
TAG Meeting 11/21/2008 27

Framework –
Feature Details
Data Collection, Transmission and Storage•
What metered energy inputs does the EIS accept? –
gas,
chilled water, oil, steam …•
Does the EIS accept utility billing data?
•
What are the storage limits?
•
How often is data retrieved, what is the minimum resolution of interval data, and does the EIS use internet of telecommunication?
•
Does the EIS provide component level data or whole-
building interval/submeter data?•
How is data archived, and what export formats are supported?
•
What security protocols/procedures does the EIS use?
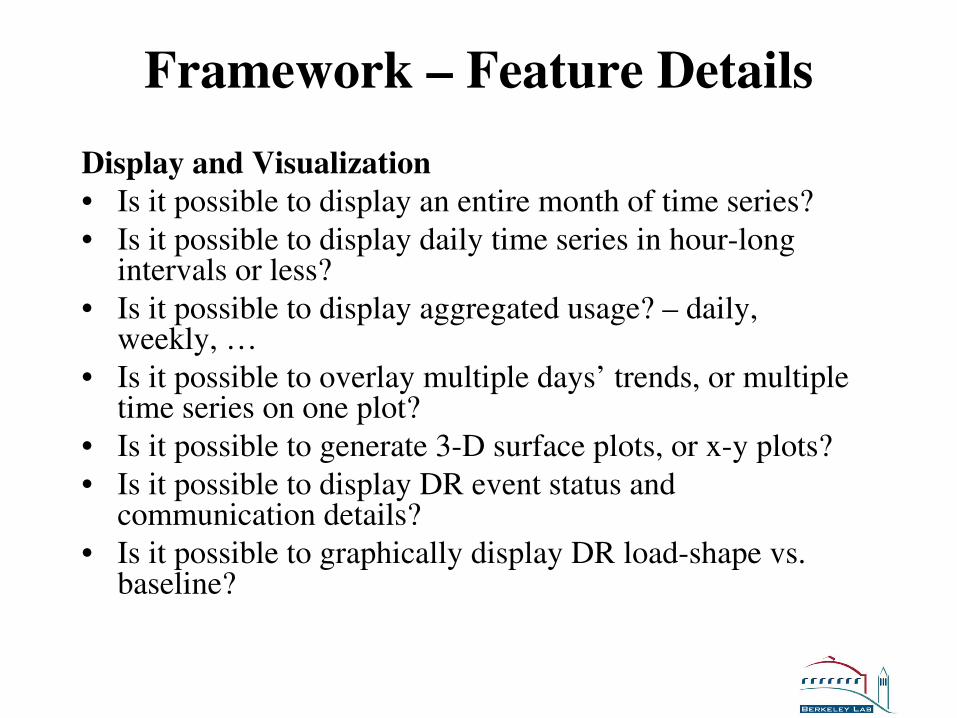
Framework –
Feature Details
Display and Visualization•
Is it possible to display an entire month of time series?
•
Is it possible to display daily time series in hour-long intervals or less?
•
Is it possible to display aggregated usage? –
daily,
weekly, …•
Is it possible to overlay multiple days’
trends, or multiple
time series on one plot?•
Is it possible to generate 3-D surface plots, or x-y plots?
•
Is it possible to display DR event status and communication details?
•
Is it possible to graphically display DR load-shape vs. baseline?
Framework –
Feature Details
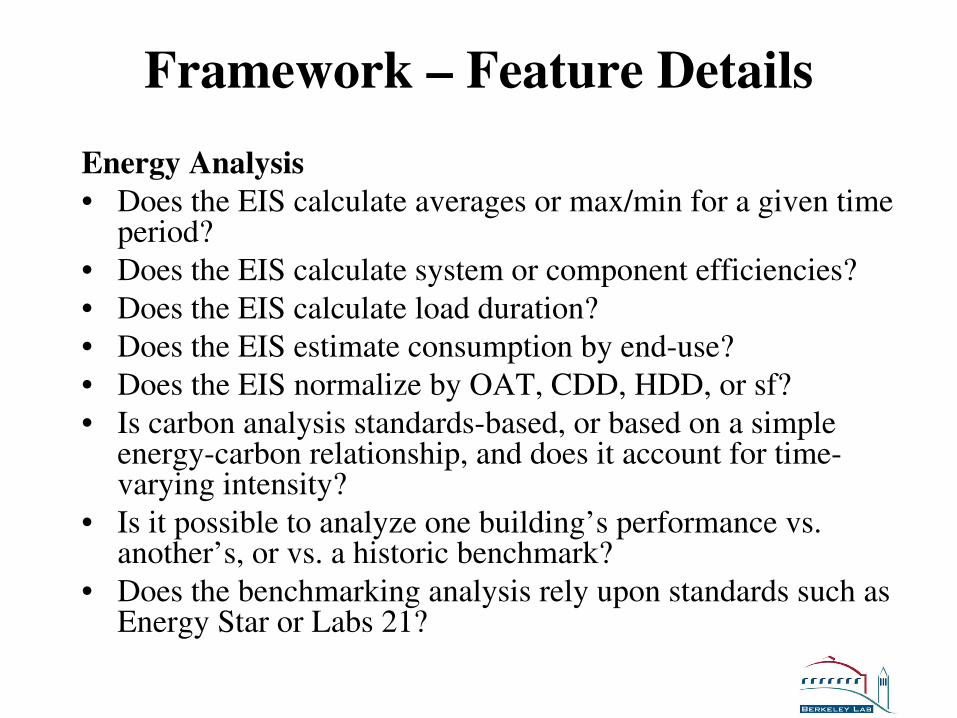
Energy Analysis•
Does the EIS calculate averages or max/min for a given time period?
•
Does the EIS calculate system or component efficiencies?
•
Does the EIS calculate load duration?
•
Does the EIS estimate consumption by end-use?
•
Does the EIS normalize by OAT, CDD, HDD, or sf?
•
Is carbon analysis standards-based, or based on a simple energy-carbon relationship, and does it account for time-
varying intensity?•
Is it possible to analyze one building’s performance vs. another’s, or vs. a historic benchmark?
•
Does the benchmarking analysis rely upon standards such as Energy Star or Labs 21?
Framework –
Feature Details
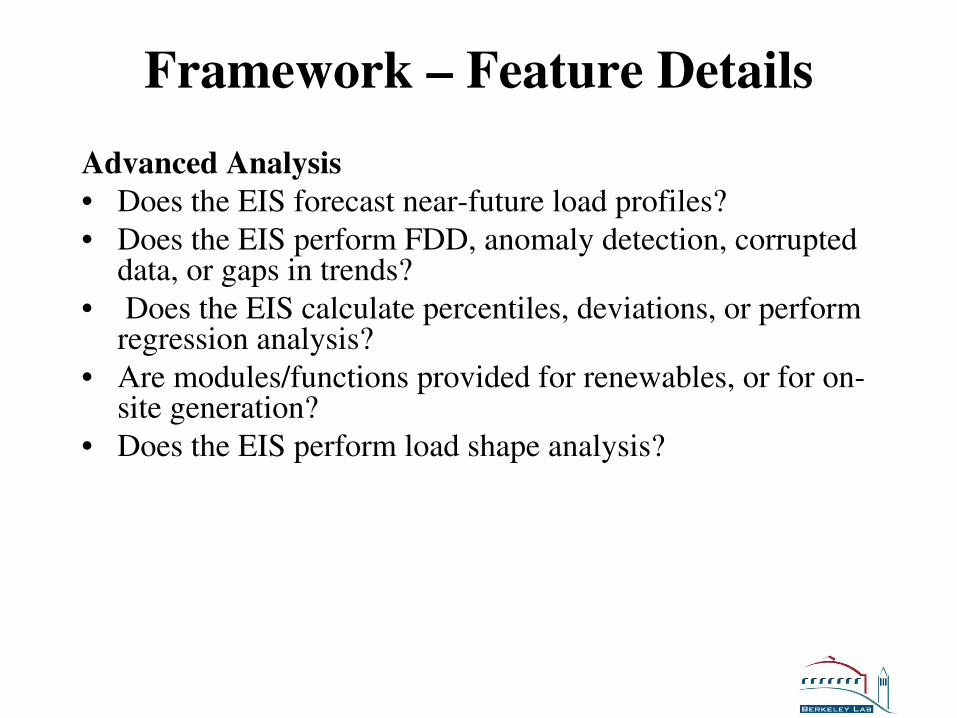
Advanced Analysis•
Does the EIS forecast near-future load profiles?
•
Does the EIS perform FDD, anomaly detection, corrupted data, or gaps in trends?
•
Does the EIS calculate percentiles, deviations, or perform regression analysis?
•
Are modules/functions provided for renewables, or for on-
site generation?•
Does the EIS perform load shape analysis?
Framework –
Feature Details
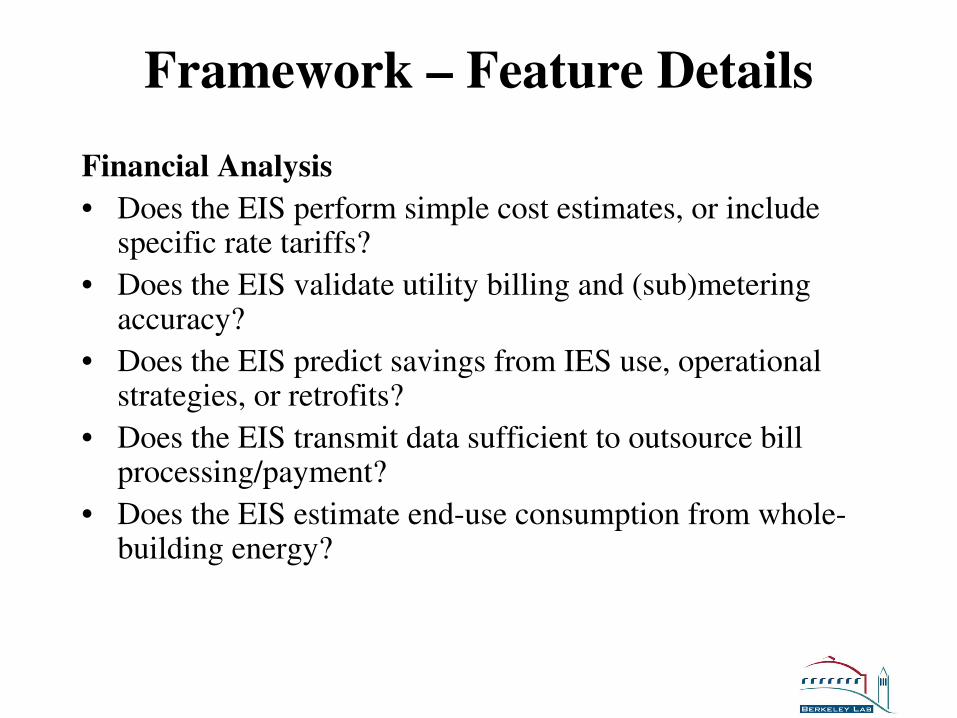
Financial Analysis•
Does the EIS perform simple cost estimates, or include specific rate tariffs?
•
Does the EIS validate utility billing and (sub)metering accuracy?
•
Does the EIS predict savings from IES use, operational strategies, or retrofits?
•
Does the EIS transmit data sufficient to outsource bill processing/payment?
•
Does the EIS estimate end-use consumption from whole-
building energy?
Framework –
Feature Details
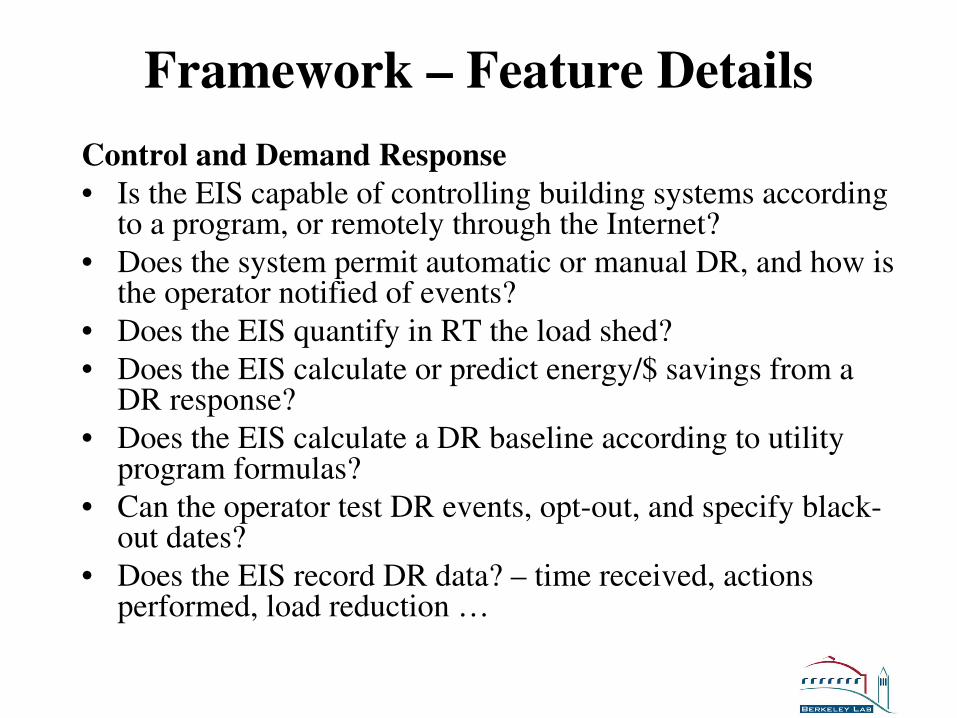
Control and Demand Response•
Is the EIS capable of controlling building systems according to a program, or remotely through the Internet?
•
Does the system permit automatic or manual DR, and how is the operator notified of events?
•
Does the EIS quantify in RT the load shed?
•
Does the EIS calculate or predict energy/$ savings from a DR response?
•
Does the EIS calculate a DR baseline according to utility program formulas?
•
Can the operator test DR events, opt-out, and specify black-
out dates?•
Does the EIS record DR data? –
time received, actions
performed, load reduction …
Framework –
Feature Details
General•
Are all 3 major browsers supported?
•
What are the software and associated hardware costs?
•
What are the license/usage fees, or service and maintenance costs?
•
What is the expected lifespan before major upgrades, and are modules available (vs. full versions)?
•
What market segments does the company traditionally target, and who are the most common end users?
•
How is the company characterized (services, software, controls, etc)?
•
How many users does the product have?