Embed Size (px)
Citation preview
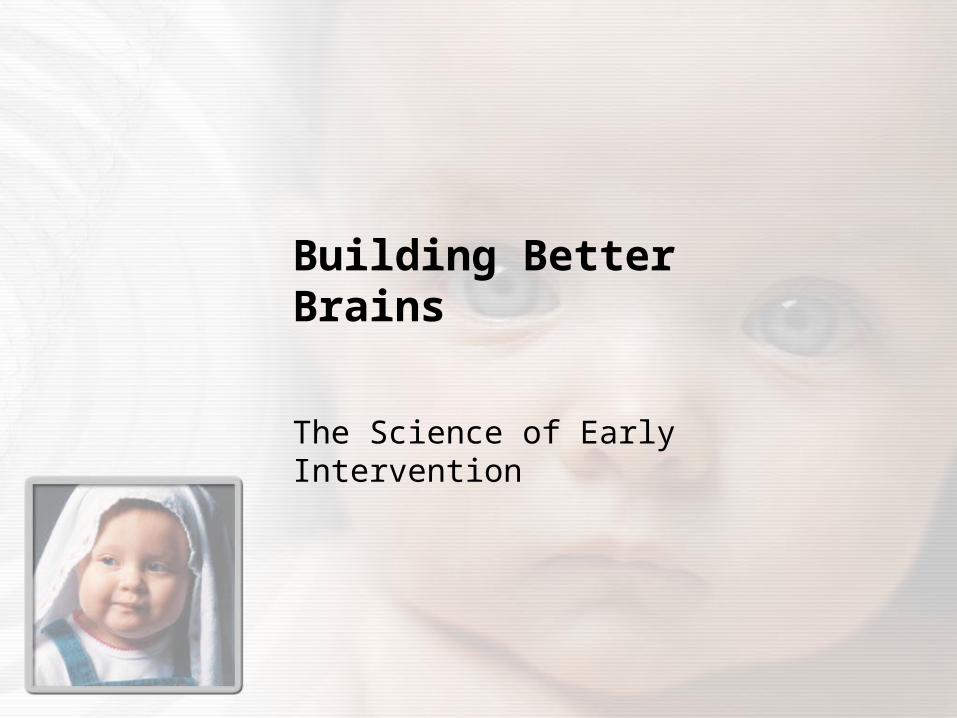
Building Better Brains
The Science of Early Intervention
How does neuroscience bring us together?
http://www.albertafamilywellness.org/resources/video/how-brains-are-built-core-story-brain-development
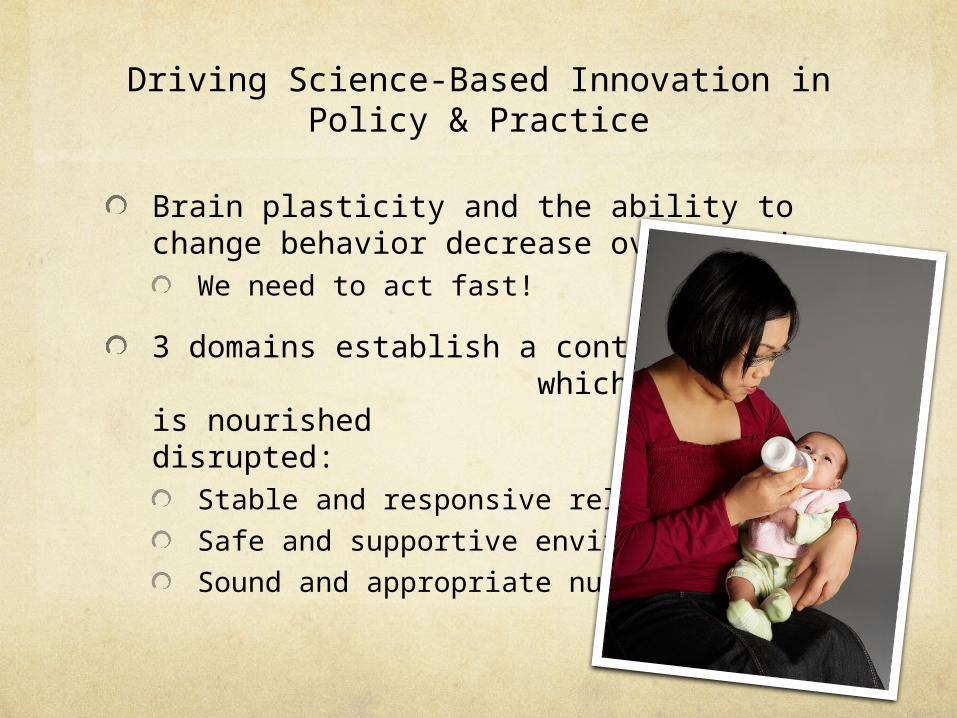
Driving Science-Based Innovation in Policy & Practice
Brain plasticity and the ability to change behavior decrease over time!
We need to act fast!
3 domains establish a context within which development is nourished or disrupted:
Stable and responsive relationships
Safe and supportive environments
Sound and appropriate nutrition
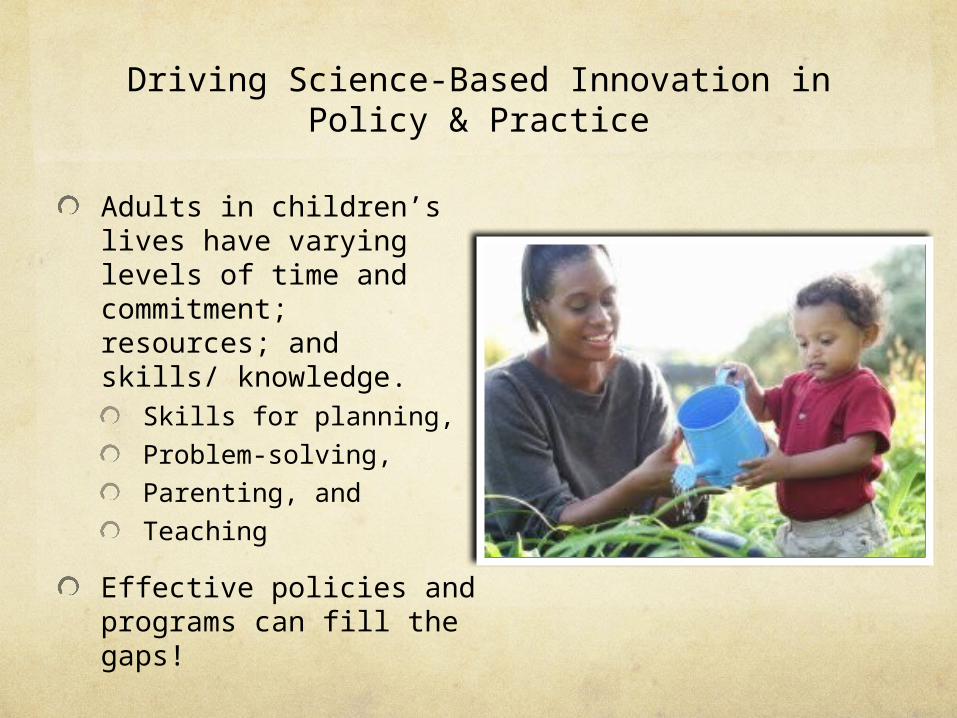
Driving Science-Based Innovation in Policy & Practice
Adults in children’s lives have varying levels of time and commitment; resources; and skills/ knowledge.
Skills for planning,
Problem-solving,
Parenting, and
Teaching
Effective policies and programs can fill the gaps!
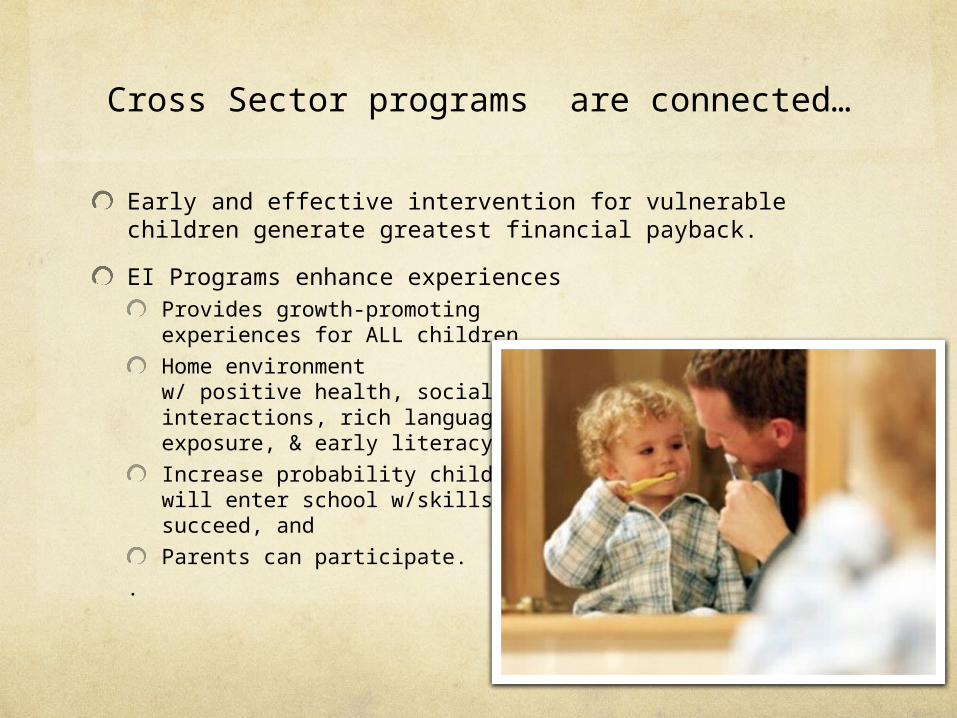
Cross Sector programs are connected…
Early and effective intervention for vulnerable children generate greatest financial payback.
EI Programs enhance experiencesProvides growth-promoting experiences for ALL children
Home environment w/ positive health, socialinteractions, rich languageexposure, & early literacy
Increase probability child will enter school w/skills tosucceed, and
Parents can participate.
.
Double DilemmaDifferences between parents of children with and without disabilities and between advantaged and disadvantaged parents
Advantaged parents invest differently in their children than disadvantaged parents
Parent of children with disabilities may need additional support to invest with their child confidently and competently.
Parents’ investments of TIME in learning activities are predictors of children’s success.
Parents are children’s first teachers. Invest in parents so they can better invest in their children.
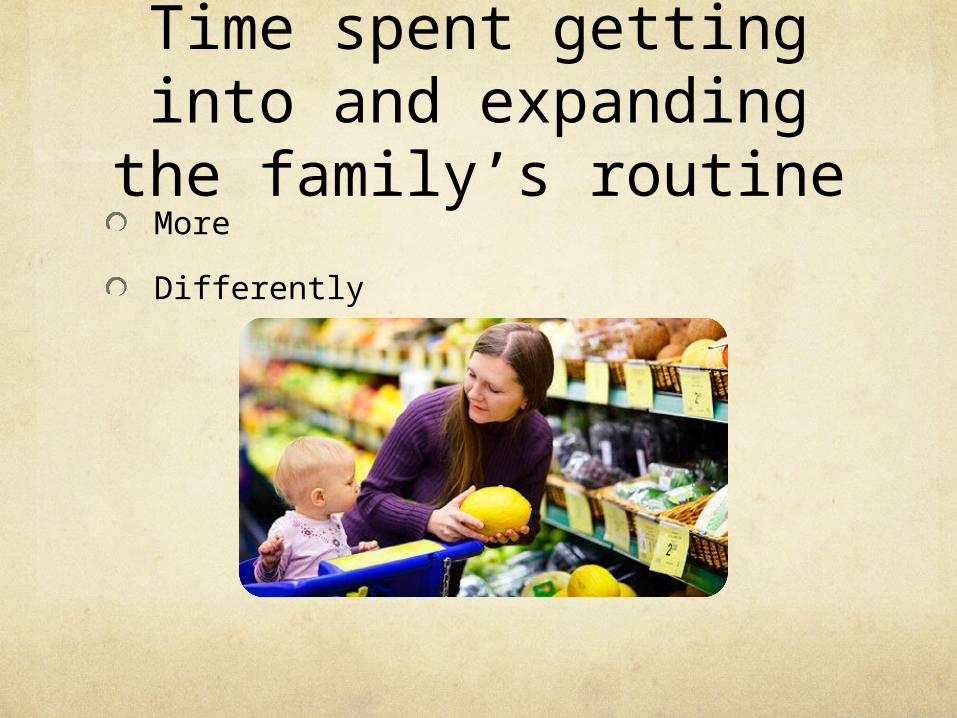
Time spent getting into and expanding the
family’s routineMore
Differently
30,000 Words A Day
Age 3- Grade 3 language linkDirect link between a child’s academic performance in 3rd grade, and the amount of words spoken from birth to 3.
30,000 words a day is the magic numberProfessional parents were more likely to talk enough to reach those numbers than blue-collar or families on public assistance.
It’s not money- it’s wordsChildren from families of lower SES whose parents DID talk close to 30,000 words showed the same results as wealthy peers- better academic success in 3rd grade.
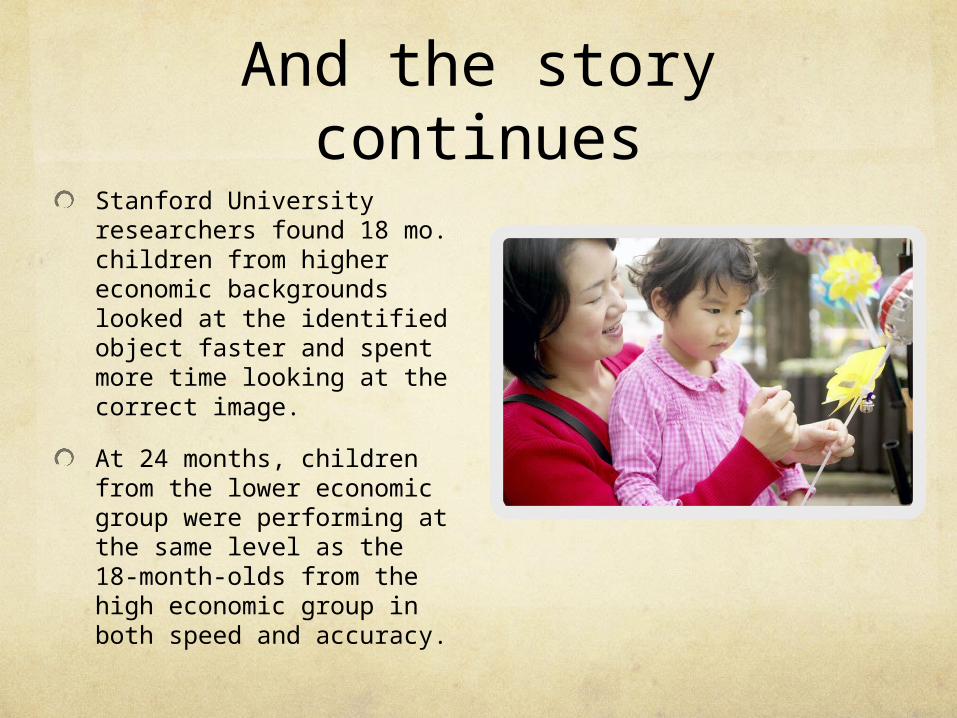
And the story continues
Stanford University researchers found 18 mo. children from higher economic backgrounds looked at the identified object faster and spent more time looking at the correct image.
At 24 months, children from the lower economic group were performing at the same level as the 18-month-olds from the high economic group in both speed and accuracy.

Intersection between Science and Service Delivery
Dose and deliveryAdults are the recipients of our services and supports as well as children
Measurement- assessment of child progress, family self efficacy, fidelity of implementation
FUMM- Functional, universal, meaningful & measureable
Developmentally sensible curriculumCritical periods for learning matched to child’s current status with systematic progression
Evidence based interventionsScientific, socially valid and acceptable
Adult learning to support parent implementationIndividualized, relationship based, participatory
Professional development to support motivation and implementationSufficient, consistent, contextually based, multi-modal, evidence based, supported by coaching

Why adults don’t learn-What we need to do differently
Habituation factors or
“We’ve always done it that way”Join in, change only what is essential, use successive approximations
Information overload or“More isn’t necessarily better”
Relevance and immediate application
Motivation and commitment“You said it- not me”
Jointly designed plans, signatures
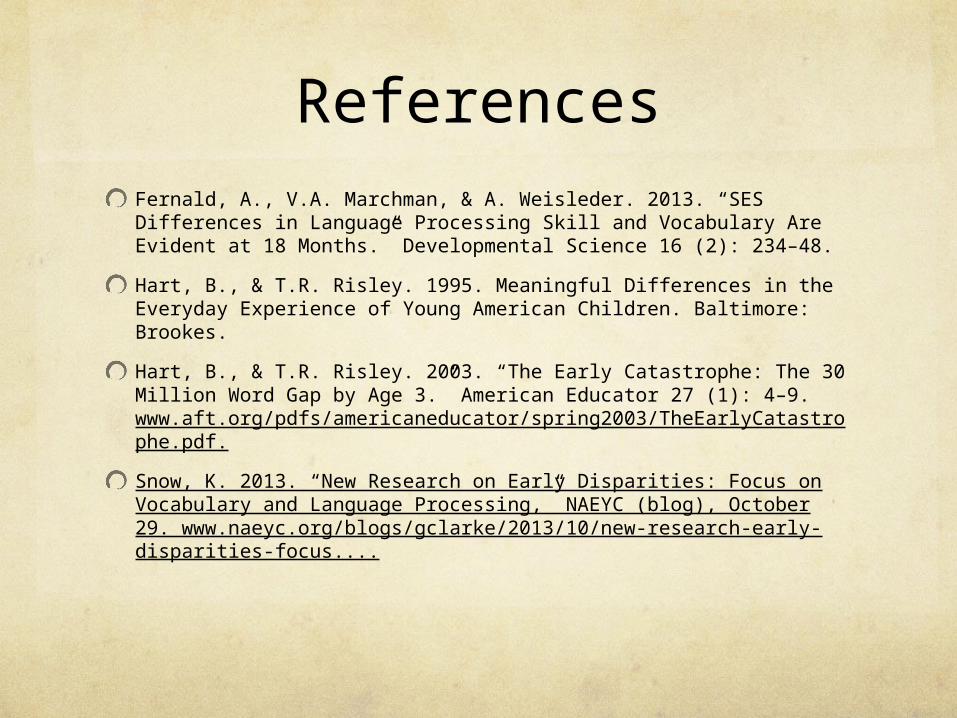
ReferencesFernald, A., V.A. Marchman, & A. Weisleder. 2013. “SES Differences in Language Processing Skill and Vocabulary Are Evident at 18 Months.” Developmental Science 16 (2): 234–48.
Hart, B., & T.R. Risley. 1995. Meaningful Differences in the Everyday Experience of Young American Children. Baltimore: Brookes.
Hart, B., & T.R. Risley. 2003. “The Early Catastrophe: The 30 Million Word Gap by Age 3.” American Educator 27 (1): 4–9. www.aft.org/pdfs/americaneducator/spring2003/TheEarlyCatastrophe.pdf.
Snow, K. 2013. “New Research on Early Disparities: Focus on Vocabulary and Language Processing,” NAEYC (blog), October 29. www.naeyc.org/blogs/gclarke/2013/10/new-research-early-disparities-focus....
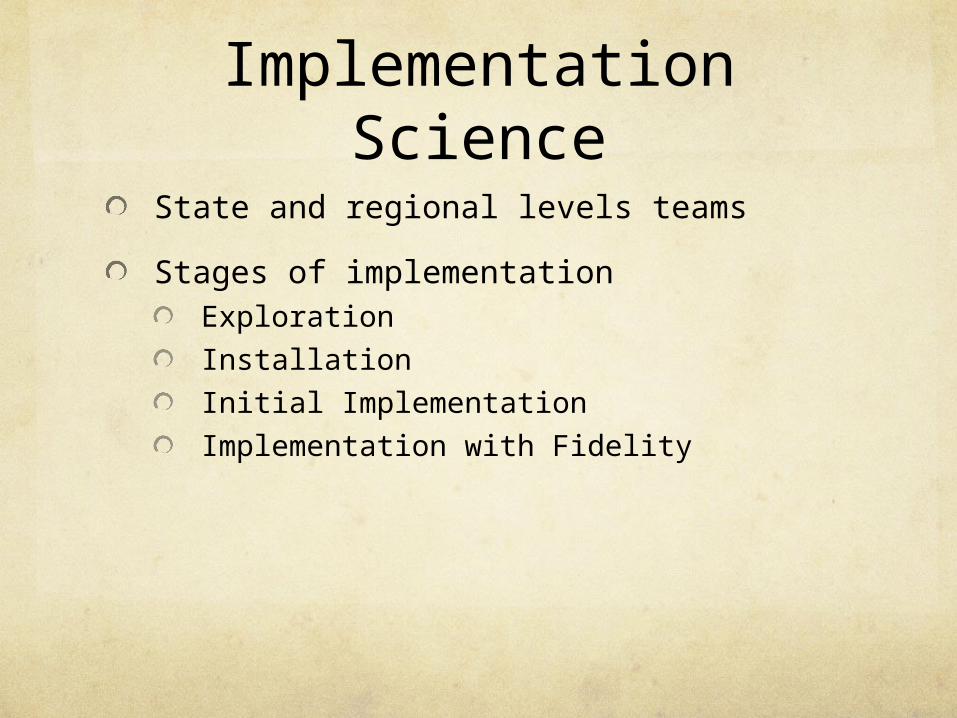
Implementation Science
State and regional levels teams
Stages of implementationExploration
Installation
Initial Implementation
Implementation with Fidelity

WELCOME!
THE JOURNEY CONTINUES!
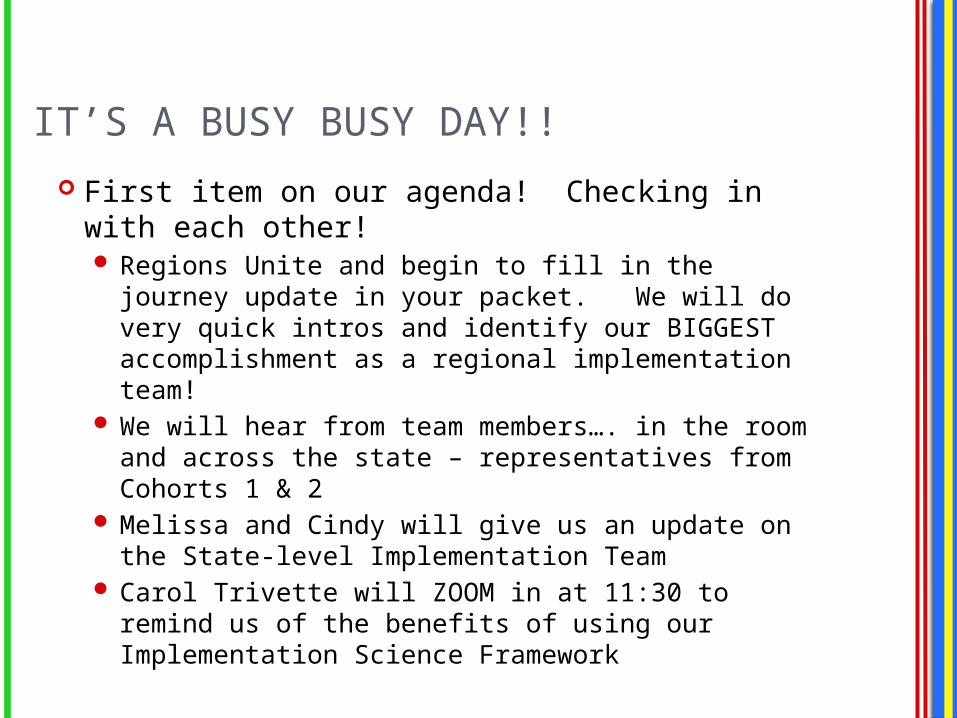
First item on our agenda! Checking in with each other! Regions Unite and begin to fill in the journey
update in your packet. We will do very quick intros and identify our BIGGEST accomplishment as a regional implementation team!
We will hear from team members…. in the room and across the state – representatives from Cohorts 1 & 2
Melissa and Cindy will give us an update on the State-level Implementation Team
Carol Trivette will ZOOM in at 11:30 to remind us of the benefits of using our Implementation Science Framework
IT’S A BUSY BUSY DAY!!
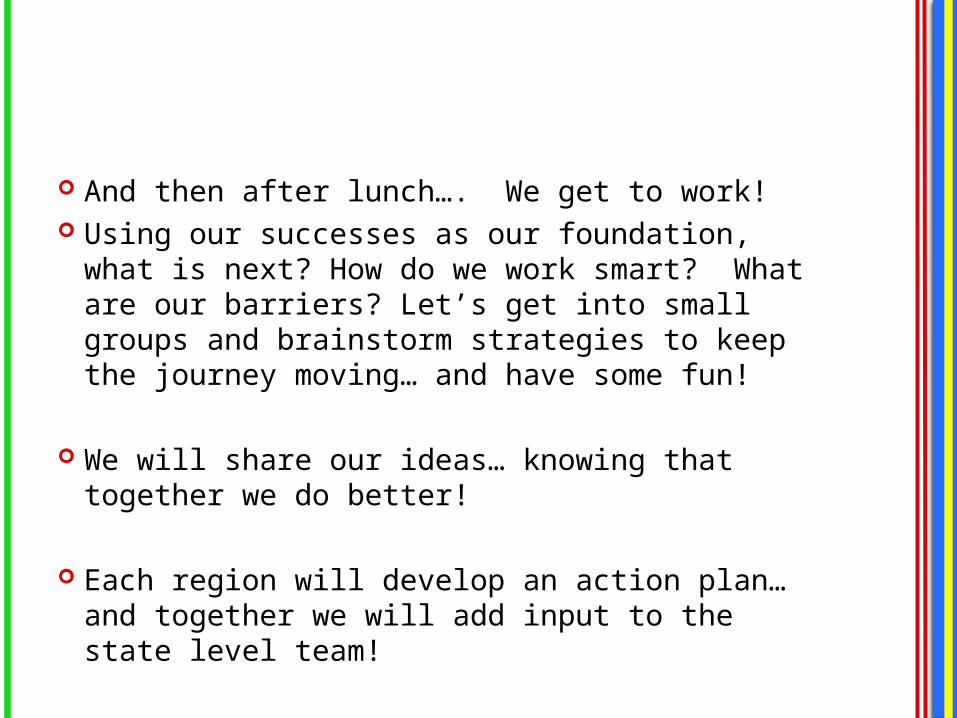
And then after lunch…. We get to work! Using our successes as our foundation, what is
next? How do we work smart? What are our barriers? Let’s get into small groups and brainstorm strategies to keep the journey moving… and have some fun!
We will share our ideas… knowing that together we do better!
Each region will develop an action plan… and together we will add input to the state level team!
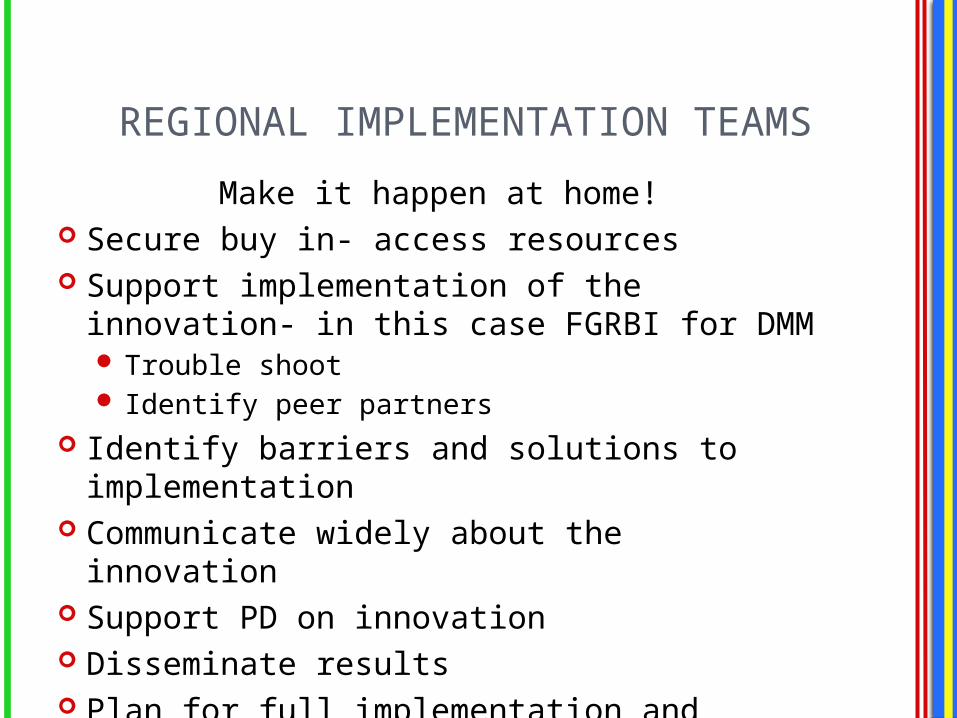
REGIONAL IMPLEMENTATION TEAMS
Make it happen at home! Secure buy in- access resources Support implementation of the innovation- in
this case FGRBI for DMM Trouble shoot Identify peer partners
Identify barriers and solutions to implementation
Communicate widely about the innovation Support PD on innovation Disseminate results Plan for full implementation and
maintenance
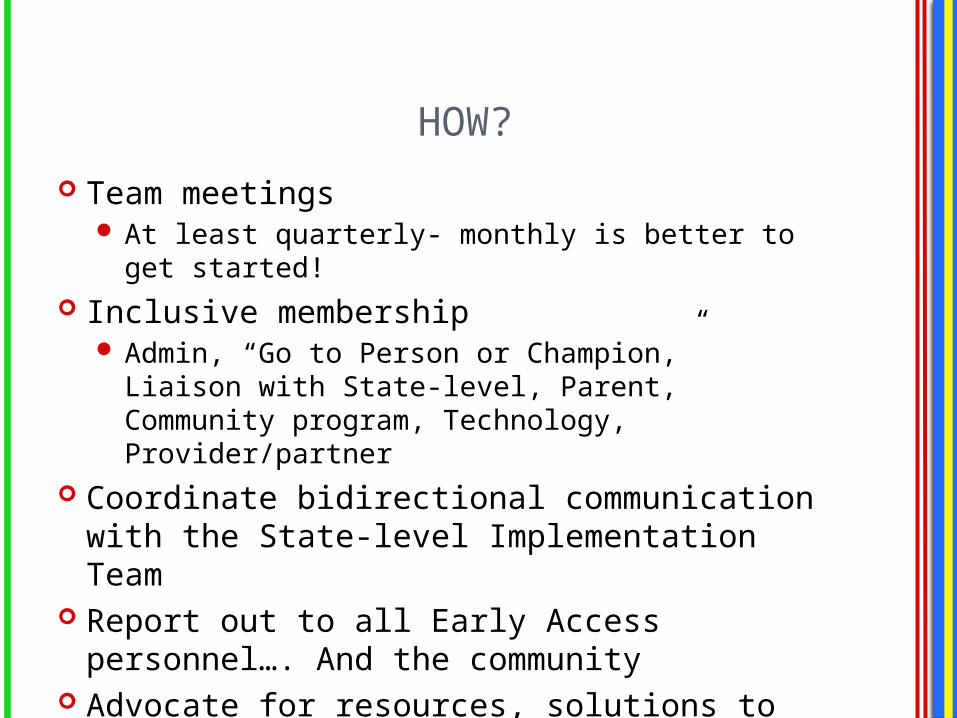
HOW?
Team meetings At least quarterly- monthly is better to get
started! Inclusive membership
Admin, “Go to Person or Champion,” Liaison with State-level, Parent, Community program, Technology, Provider/partner
Coordinate bidirectional communication with the State-level Implementation Team
Report out to all Early Access personnel…. And the community
Advocate for resources, solutions to barriers
The Road To ImplementationState-Level Implementation Team
Update
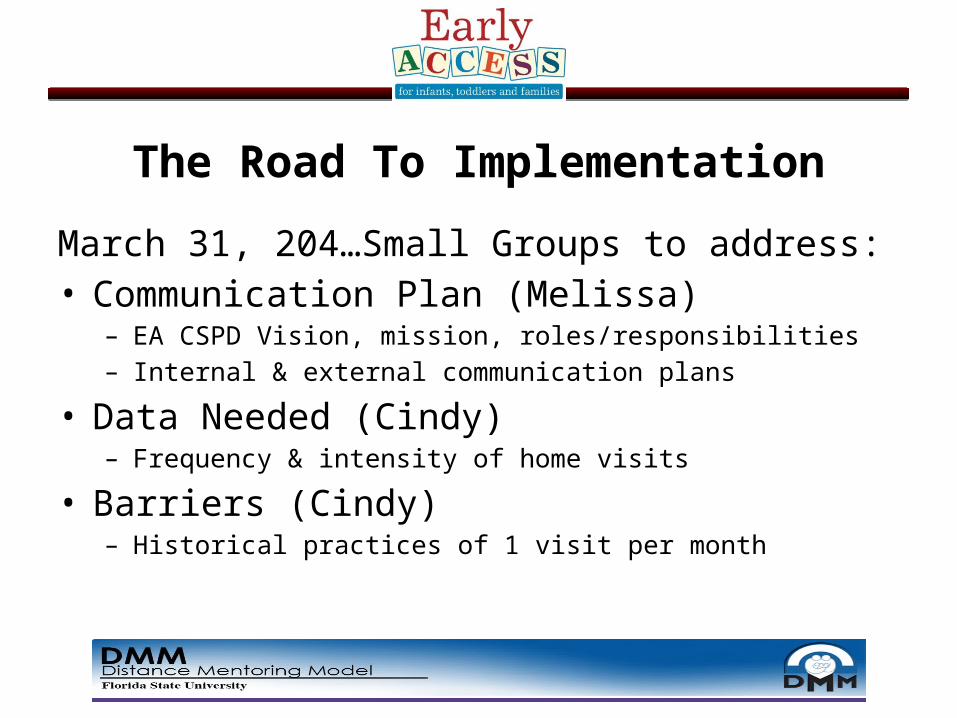
The Road To Implementation
March 31, 204…Small Groups to address:• Communication Plan (Melissa)
– EA CSPD Vision, mission, roles/responsibilities– Internal & external communication plans
• Data Needed (Cindy)– Frequency & intensity of home visits
• Barriers (Cindy)– Historical practices of 1 visit per month
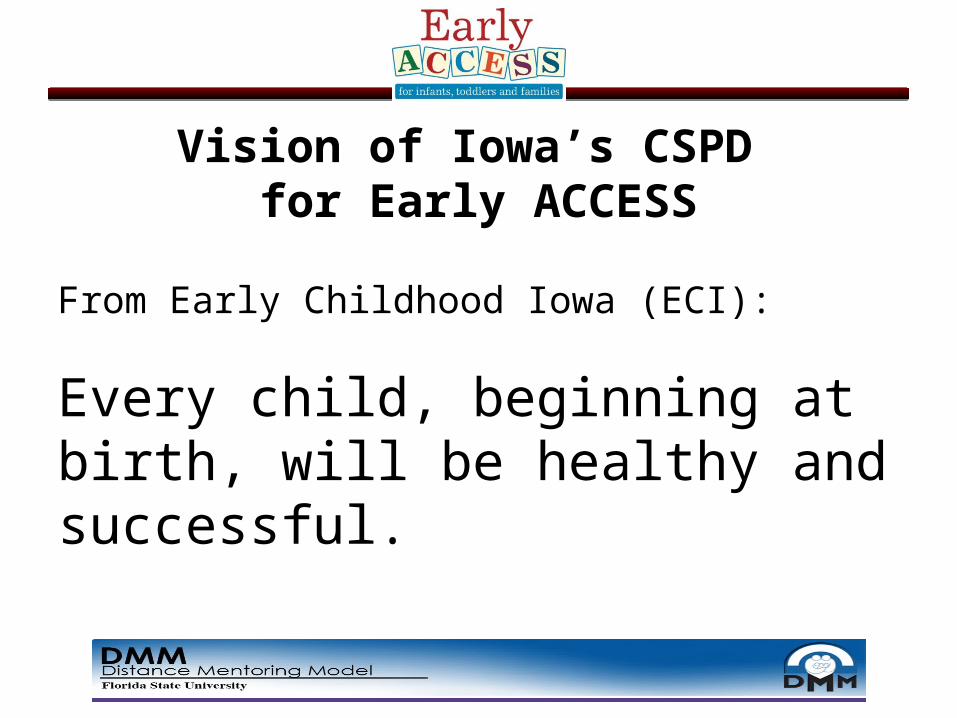
Vision of Iowa’s CSPD for Early ACCESS
From Early Childhood Iowa (ECI):
Every child, beginning at birth, will be healthy and successful.
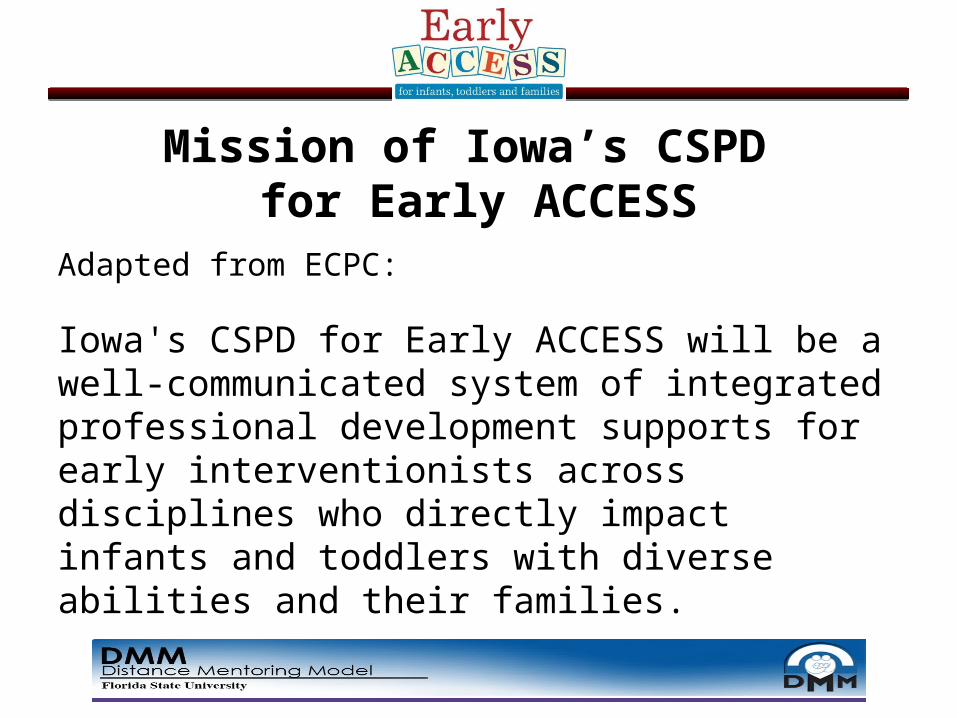
Mission of Iowa’s CSPD for Early ACCESS
Adapted from ECPC:
Iowa's CSPD for Early ACCESS will be a well-communicated system of integrated professional development supports for early interventionists across disciplines who directly impact infants and toddlers with diverse abilities and their families.
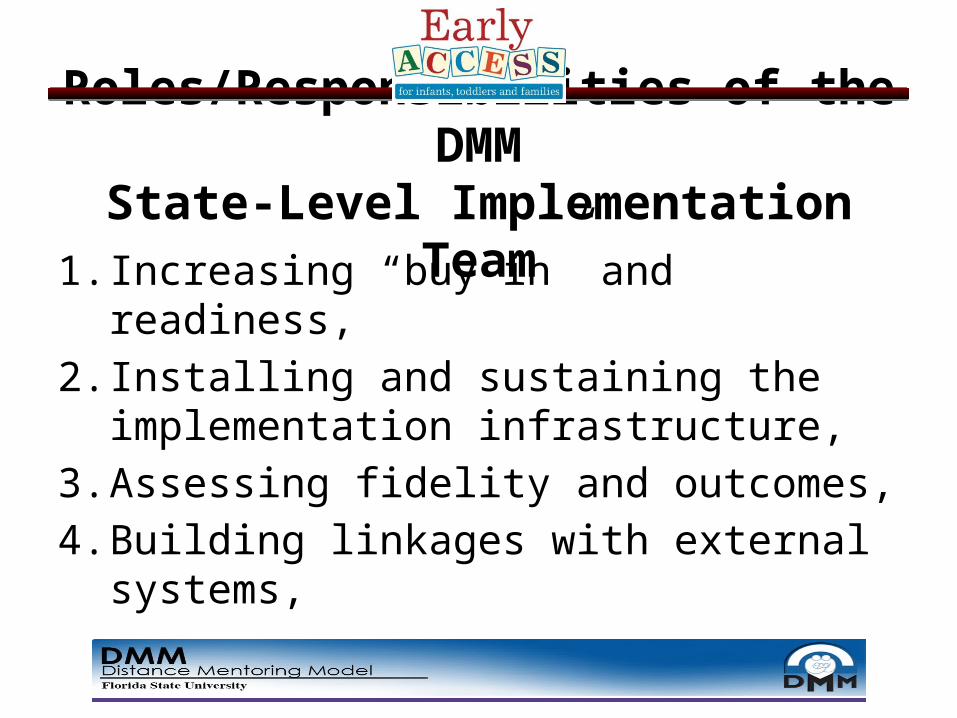
Roles/Responsibilities of the DMMState-Level Implementation Team
1. Increasing “buy-in” and readiness,2. Installing and sustaining the implementation
infrastructure,3. Assessing fidelity and outcomes,4. Building linkages with external systems,

Roles/Responsibilities of the DMM State-Level Implementation Team
5. Problem-solving and sustainability, 6. Supporting the work of the Regional Implementation
Teams,7. Engaging the community, and 8. Actively creating hospitable environments
(scheduling, resources, PD resource allocation, etc).
Tout, K., Metz, A., & Bartley, L. (2013). Considering statewide professional development systems. In T. Halle, A. Metz, & Martinez-Beck, I. (Eds.) Applying Implementation Science in Early Childhood Programs and Systems, 269-294. Baltimore, MD: Paul H. Brookes Publishing Co., Inc.AI Hub, Module 3: Implementation Teams http://implementation.fpg.unc.edu/module-3
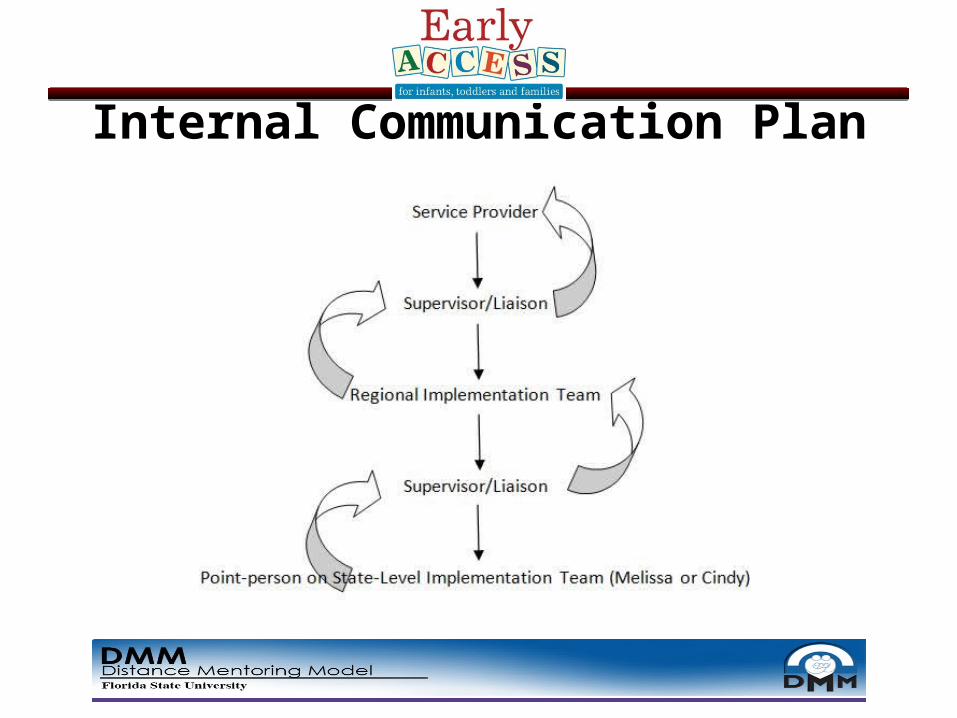
Internal Communication Plan
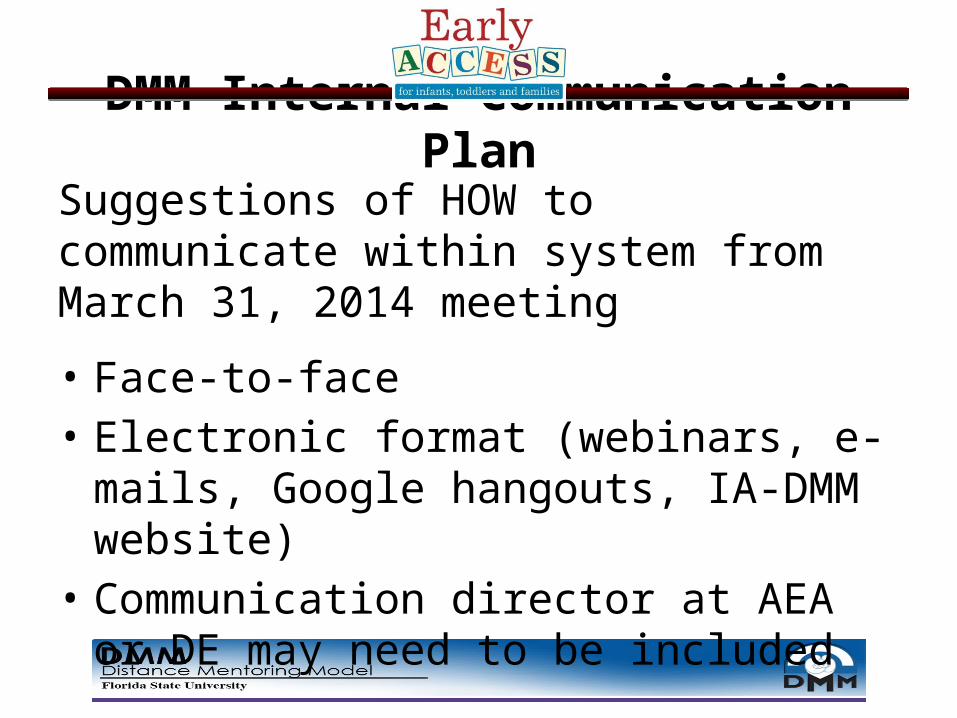
DMM Internal Communication Plan
Suggestions of HOW to communicate within system from March 31, 2014 meeting
• Face-to-face• Electronic format (webinars, e-mails, Google
hangouts, IA-DMM website)• Communication director at AEA or DE may
need to be included
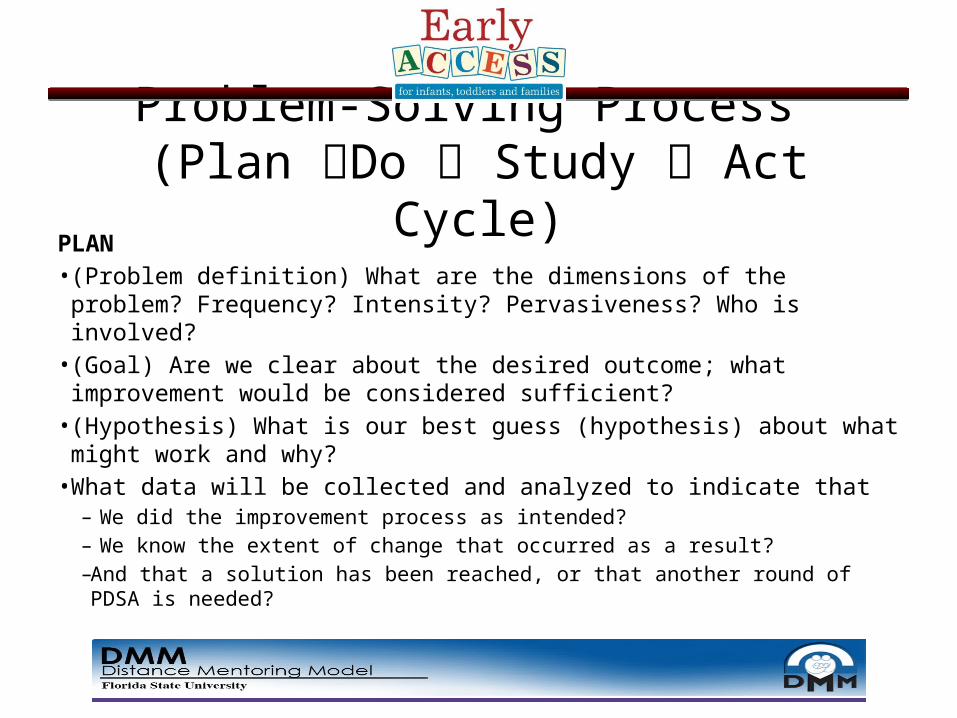
Problem-Solving Process (Plan Do Study Act Cycle)
PLAN• (Problem definition) What are the dimensions of the problem?
Frequency? Intensity? Pervasiveness? Who is involved?• (Goal) Are we clear about the desired outcome; what improvement
would be considered sufficient?• (Hypothesis) What is our best guess (hypothesis) about what might work
and why?• What data will be collected and analyzed to indicate that
– We did the improvement process as intended?– We know the extent of change that occurred as a result?– And that a solution has been reached, or that another round of PDSA is needed?

Problem-Solving Process (Plan Do Study Act Cycle)
Do• Carry-out the plan, document work and record
dataSTUDY• Analyze data, evaluate performance
ACT• Analyze results, make recommendations for new
courses of action

DMM Internal Communication Plan
Suggestions of HOW to communicate within system from March 31, 2014 meeting
• Face-to-face• Electronic format (webinars, e-mails, Google
hangouts, IA-DMM website)• Communication director at AEA or DE may
need to be included
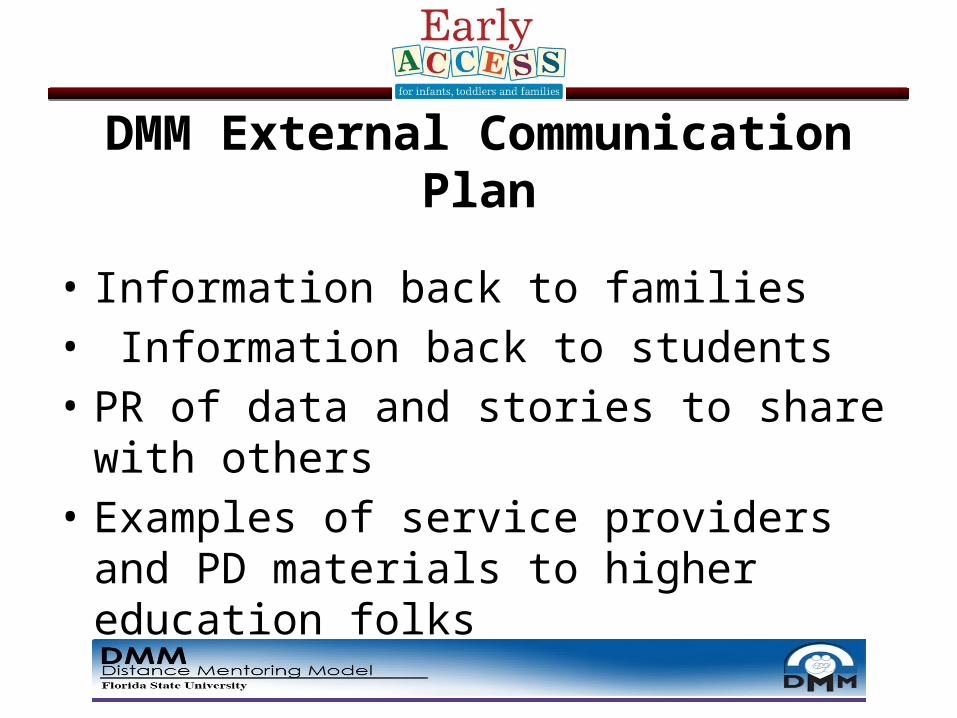
DMM External Communication Plan
• Information back to families• Information back to students • PR of data and stories to share with others• Examples of service providers and PD
materials to higher education folks
DMM External Communication Plan
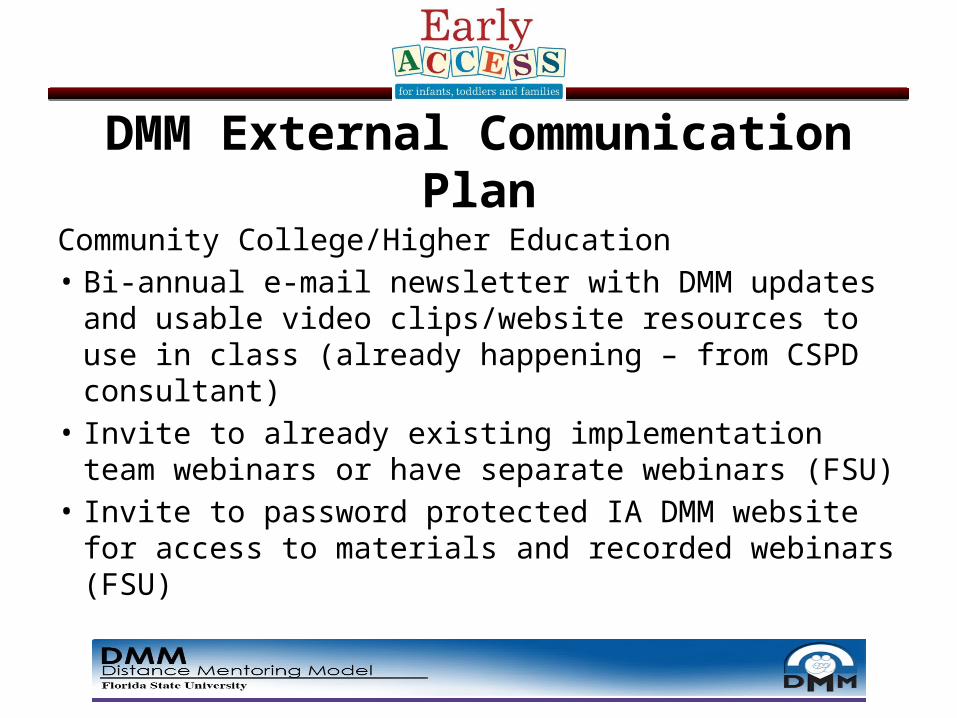
Community College/Higher Education• Bi-annual e-mail newsletter with DMM updates and
usable video clips/website resources to use in class (already happening – from CSPD consultant)
• Invite to already existing implementation team webinars or have separate webinars (FSU)
• Invite to password protected IA DMM website for access to materials and recorded webinars (FSU)
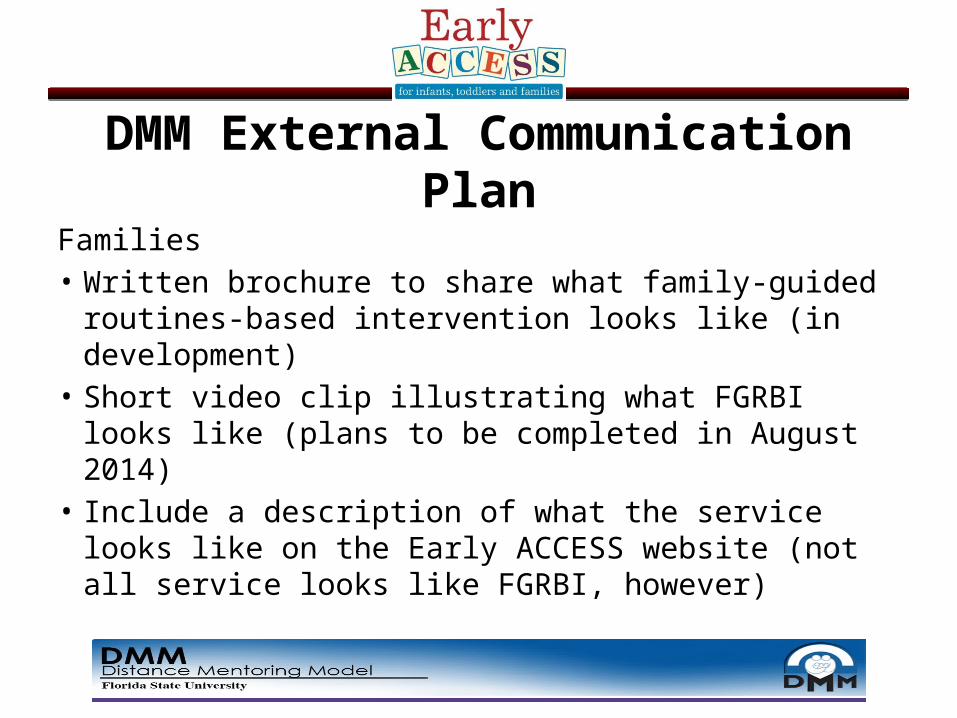
DMM External Communication Plan
Families• Written brochure to share what family-guided
routines-based intervention looks like (in development)• Short video clip illustrating what FGRBI looks like (plans
to be completed in August 2014)• Include a description of what the service looks like on
the Early ACCESS website (not all service looks like FGRBI, however)
The Road To Implementation
Service DataWelcome and Thank You
Tim Glenn, Research Analyst, DE
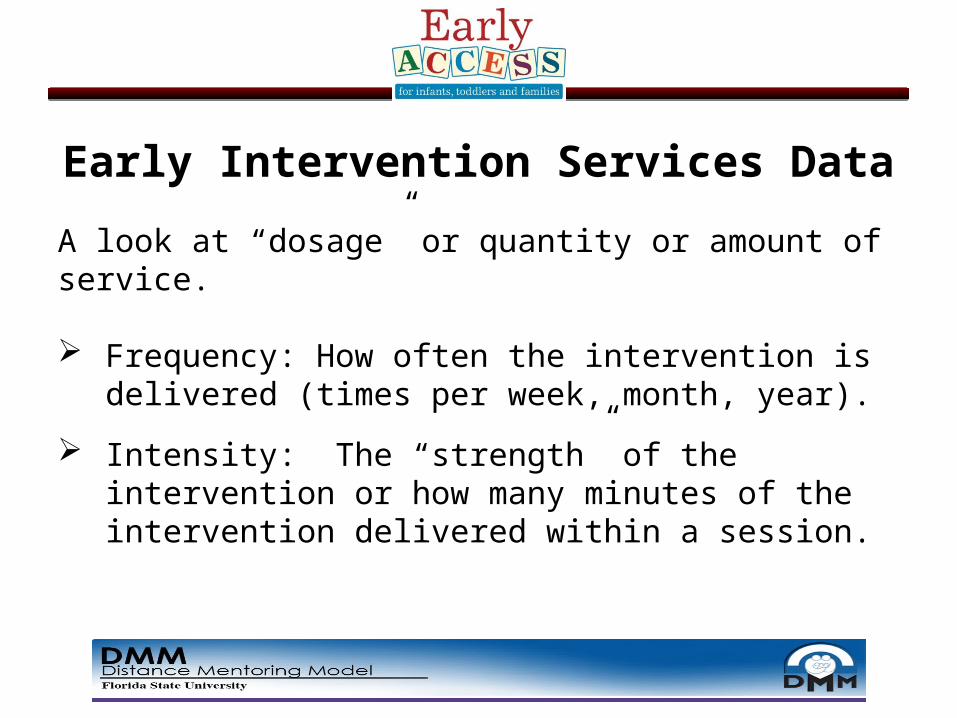
Early Intervention Services Data
A look at “dosage” or quantity or amount of service.
Frequency: How often the intervention is delivered (times per week, month, year).
Intensity: The “strength” of the intervention or how many minutes of the intervention delivered within a session.
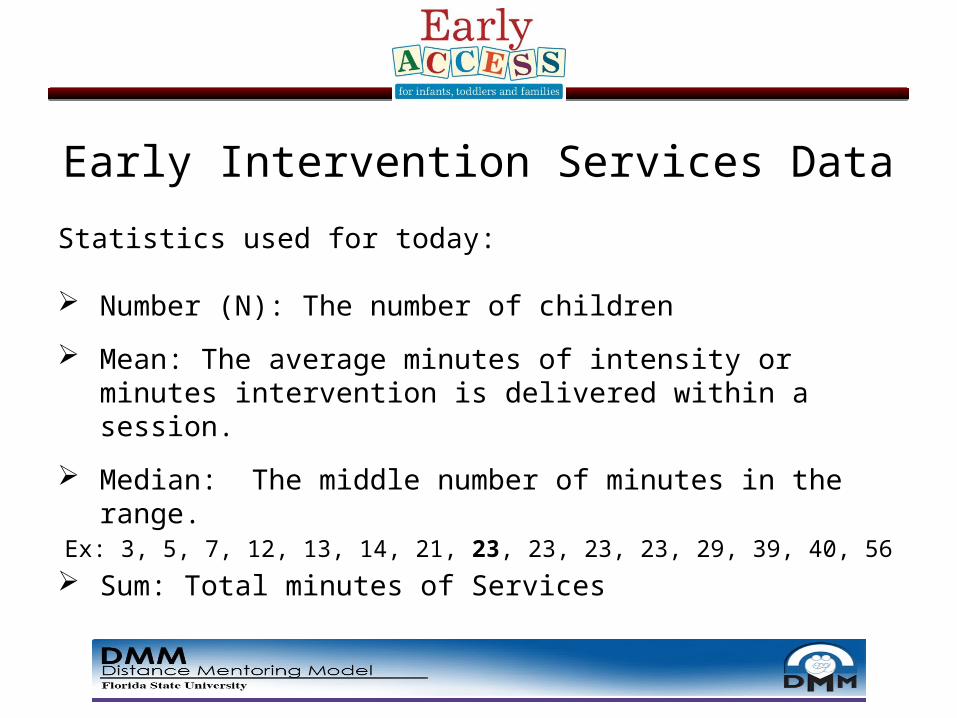
Early Intervention Services Data
Statistics used for today:
Number (N): The number of children
Mean: The average minutes of intensity or minutes intervention is delivered within a session.
Median: The middle number of minutes in the range.Ex: 3, 5, 7, 12, 13, 14, 21, 23, 23, 23, 23, 29, 39, 40, 56
Sum: Total minutes of Services
Early Intervention Services DataData are for services between 7/1/13 and 5/29/14
Limitations:
• Data for current services being received
• Verification needed
Early Intervention Services DataData are for services between 7/1/13 and 5/29/14
Data available for each AEA
Will distribute and discuss and EAGL, ICEA
A glimpse at what the State-Level Implementation Team reviewed
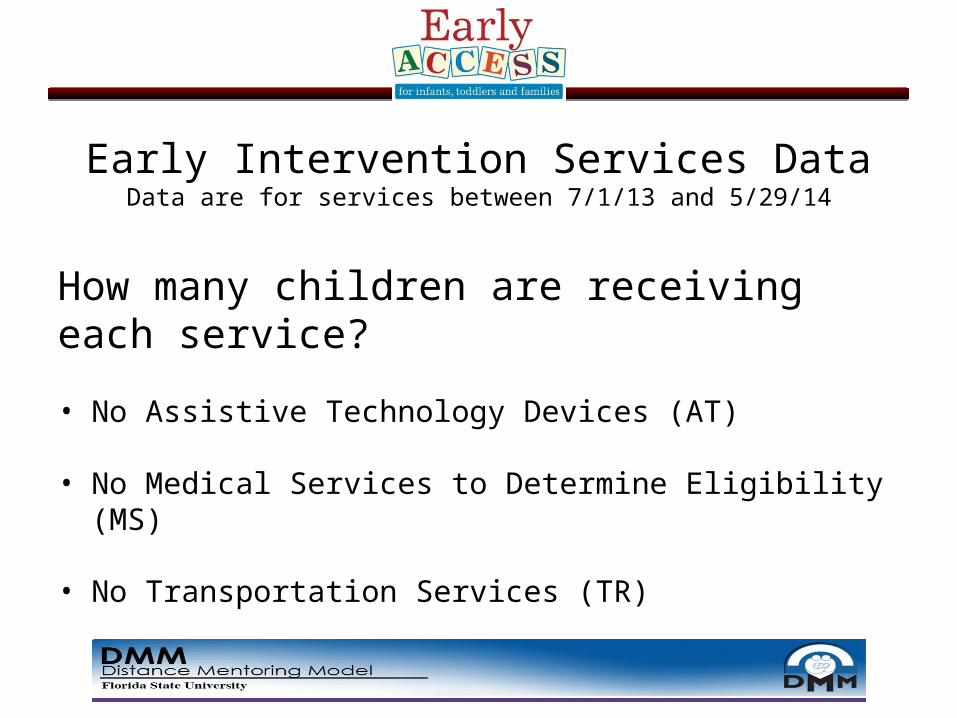
Early Intervention Services DataData are for services between 7/1/13 and 5/29/14
How many children are receiving each service?
• No Assistive Technology Devices (AT)
• No Medical Services to Determine Eligibility (MS)
• No Transportation Services (TR)
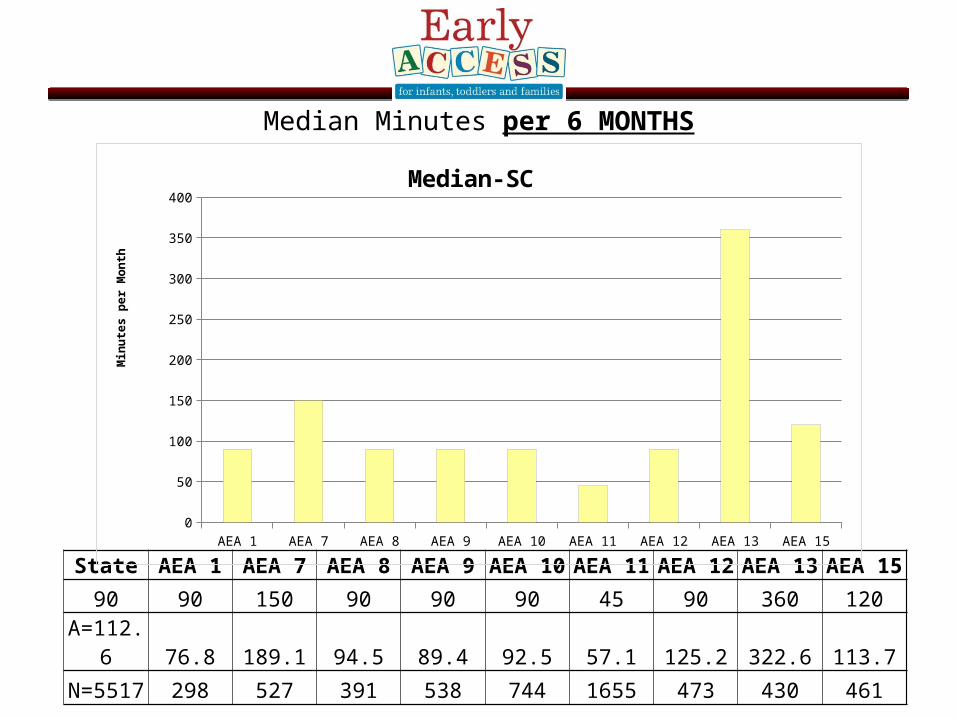
Median Minutes per 6 MONTHS
State AEA 1 AEA 7 AEA 8 AEA 9 AEA 10 AEA 11 AEA 12 AEA 13 AEA 15
90 90 150 90 90 90 45 90 360 120
A=112.6 76.8 189.1 94.5 89.4 92.5 57.1 125.2 322.6 113.7
N=5517 298 527 391 538 744 1655 473 430 461
AEA 1 AEA 7 AEA 8 AEA 9 AEA 10 AEA 11 AEA 12 AEA 13 AEA 150
50
100
150
200
250
300
350
400
Median-SC
Min
ute
s p
er
Mo
nth
Minutes per MONTH
State AEA 1 AEA 7 AEA 8 AEA 9 AEA 10 AEA 11 AEA 12 AEA 13 AEA 15
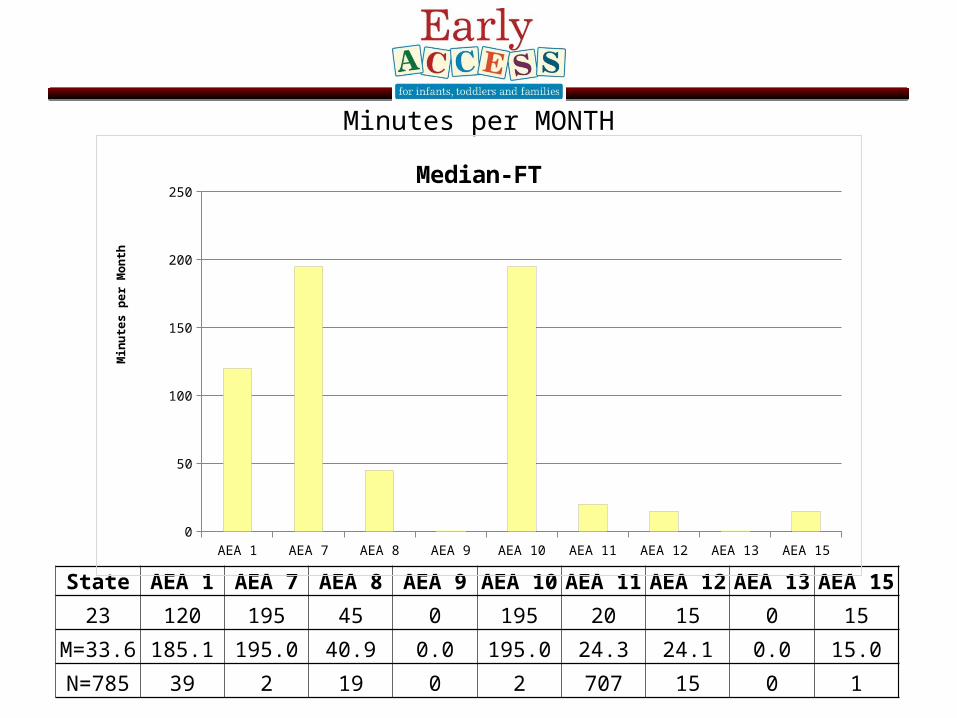
23 120 195 45 0 195 20 15 0 15
M=33.6 185.1 195.0 40.9 0.0 195.0 24.3 24.1 0.0 15.0
N=785 39 2 19 0 2 707 15 0 1
AEA 1 AEA 7 AEA 8 AEA 9 AEA 10 AEA 11 AEA 12 AEA 13 AEA 150
50
100
150
200
250
Median-FT
Min
ute
s p
er
Mo
nth
Minutes per MONTH
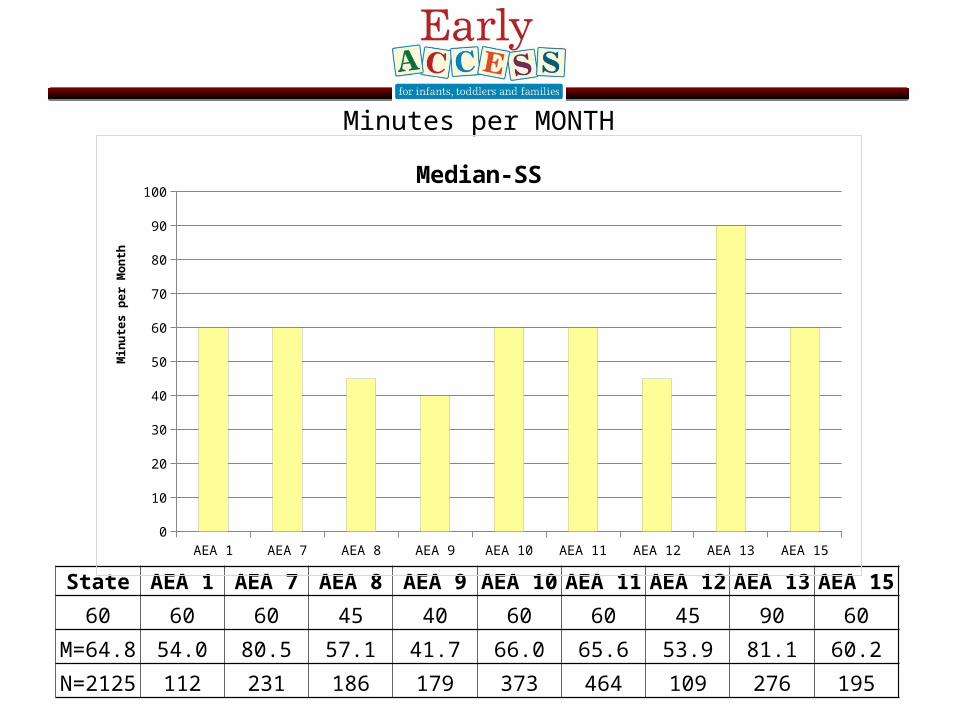
State AEA 1 AEA 7 AEA 8 AEA 9 AEA 10 AEA 11 AEA 12 AEA 13 AEA 15
60 60 60 45 40 60 60 45 90 60
M=64.8 54.0 80.5 57.1 41.7 66.0 65.6 53.9 81.1 60.2
N=2125 112 231 186 179 373 464 109 276 195
AEA 1 AEA 7 AEA 8 AEA 9 AEA 10 AEA 11 AEA 12 AEA 13 AEA 150
10
20
30
40
50
60
70
80
90
100
Median-SS
Min
ute
s p
er
Mo
nth
Early Intervention Services Data
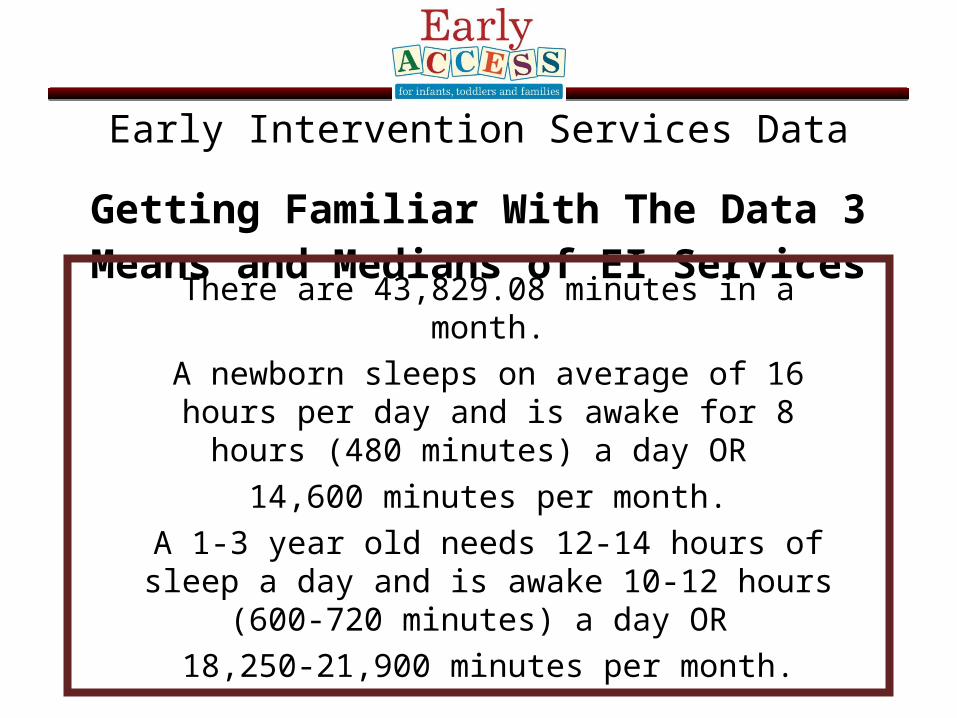
Getting Familiar With The Data 3Means and Medians of EI Services
There are 43,829.08 minutes in a month.A newborn sleeps on average of 16 hours per day and
is awake for 8 hours (480 minutes) a day OR 14,600 minutes per month.
A 1-3 year old needs 12-14 hours of sleep a day and is awake 10-12 hours (600-720 minutes) a day OR
18,250-21,900 minutes per month.