Embed Size (px)
Citation preview

BUILDING BACK GREENER India Inc Demonstrates Climate Resilience
CDP India Annual Report 2020Written on behalf of 515 investors representing US$106 trillion in assets
March 2021
DISCLOSURE I NSIGHT ACTION
CONTENTS
CEO FOREWORD 2INTRODUCTION 3SUSTAINABILITY ndash HEART OF GOOD GOVERNANCE 7CLIMATE-RELATED RISKS amp OPPORTUNITIES 9EMISSIONS TRENDS AND VERIFICATION 13DECARBONISING ACROSS VALUE CHAIN 17TARGETS AND PERFORMANCE 19SCIENCE-BASED TARGETS AMBITIOUS CORPORATE CLIMATE ACTION 21INTERNAL CARBON PRICEndash ROBUST CLIMATE STRATEGY 27THE RENEWABLE ENERGY THRUST 33WATER SECURITY 37PROTECTING OUR FOREST WEALTH 47CITIES STATES AND REGIONS 51ANNEXURES 52
CEO FOREWORD
When it comes to climate change water security and deforestation we have now entered a global emergency and the decade of action our last chance to make rapid and deep cuts to global emissions and to protect biodiversity to avoid the full force of these other global crises
Despite the pandemic we are bolstered by the environmental leadership from companies investors governments cities and regions worldwide With so much at stake and the clock running down 2020 saw record disclosures through CDPrsquos platform with over 10000 entities now disclosing their data on climate change water security and deforestation issues
More than 9600 companies worth over 50 of global market capitalisation now disclose through CDP and corporate disclosures are up 70 compared to five years ago when the Paris agreement was formed This is in addition to the cities states and regions that disclosed to us last year
2020 was a year of firsts for Indian corporate climate action For the first time Indian companies have featured on the CDP A List Of the 220 Indian companies that disclosed through CDP four made it onto our A List (Hindustan Zinc Limited IndusInd Bank Mahindra amp Mahindra and Tech Mahindra) We also witnessed the first Indian company disclose on forests a promising sign of increasing environmental ambition in the countryrsquos private sector These leading companies join a growing league of businesses that have recognised the climate emergency and are taking steps to respond to the associated risks and opportunities
At CDP we are led by the latest climate science As it evolves so must we ensuring that the right information is embedded into the capital markets and placed into the hands of policymakers and decision-makers worldwide CDPrsquos systems enable this and it is particularly critical as capital flows seek to transition towards the Net Zero sustainable economy
One thing is certain we cannot afford to go back to lsquonormalrsquo from an environmental perspective Propping up the old system with impending climate change hazards increasing will lock us into a pathway of even greater risk Instead we must reinvent and renew our economy into one with greater resilience and more inclusivity
Disclosure transparency data and science will be crucial to building a more resilient society As wersquove learned from this current pandemic and from climate change the best time for action is long before the problem becomes severe Measuring and managing environmental risks through disclosure helps companies cities states and regions to build resiliency and plan for the future
We must build back better from the COVID-19 pandemic Our economies societies and livelihoods depend on it
The time for action is now
ndash Paul Simpson Chief Executive at CDP
2020 was a year of firsts for Indian corporate climate action For the first time Indian companies have featured on the CDP A List
As 2021 unfolds we reflect on the challenging and extraordinary times of the last year As the world worked to collectively respond to the COVID-19 pandemic we reeled from the tragic human impact of the crisis and its impact on our health financial and social systems Sadly we are still grappling with these crises but the rollout of the vaccine provides great hope for later this year
INTRODUCTION
Separately 2020 marked CDPrsquos 20th anniversary with our 18th disclosure request sent out on behalf of more than 515 investors representing over US$106 trillion in assets and over 150 global organisations worth over US$4 trillion in purchasing power A record number of 9600+ companies responded in a year that was likely one of the most challenging in their history
The imminent climate emergency is already manifesting itself through extreme weather events across the world For instance in India and Bangladesh alone the lives of millions of poor people were devastated by the impact of floods cyclone Amphan and COVID-19 Home to some of the most disaster-prone areas in the world India also recorded the highest deaths due to climate crisis-led disasters in 2018 ranking it fifth in the The Global Climate Risk Index 20201
The climate crisis was compounded by the unprecedented disruption caused by the pandemic that overwhelmed the worldrsquos most efficient healthcare systems and pushed the global economy into recession However in its wake the pandemic offers the world the opportunity to build back better through a greener more climate-resilient economy
Though projections from the International Monetary Fund the World Bank and the Reserve Bank of India show an alarming pandemic-induced contraction in a country that was till recently the fastest growing
1 httpsgermanwatchorgsitesgermanwatchorgfiles20-2-01e20Global20Climate20Risk20Index202020_10pdf
2 httpsunfcccintsitesdefaultfilesresource1GCP_pdf3 httpsclimateactiontrackerorgcountriesindia4 httpsclimateactiontrackerorgcountriesindia5 httpswwwdwcomenindia-coal-energy-solar-power-renewables-changea-546881076 httpsenergyeconomictimesindiatimescomnewsrenewableindia-to-have-220-gw-renewable-energy-capacity-by-
2022-pm-narendra-modi78008063
large economy in the world India is still uniquely positioned to build back greener For this it needs to adopt an inclusive developmental model that integrates environment social and corporate governance (ESG) comprehensively into its decision-making processes and factors in greater sustainability and resilience parameters into post COVID-19 recovery plans
The pandemic-induced global lockdown2 led to a sharp drop in emissions and India is expected to record 6-10 lower GHG emissions in 2020 compared to 20193 This is an opportune time to build on this momentum by strategising a green COVID-19 recovery strategy with the potential to facilitate an accelerated transition away from coal and towards renewable energy Even though India is comfortably placed to not only meet but overachieve its NDC targets aligned with the 2009 Copenhagen 2degC goal under currently implemented policies the Climate Action Tracker suggests these efforts are insufficient to achieve the long-term climate goal of limiting temperature increase below 15degC in line with the Paris Agreement4 To achieve this crucial target India must begin focussing on phasing out coal for power generation by 20405
However despite setting ambitious targets and reiterating its commitment towards adoption of renewable energy and other low carbon avenues such as electric vehicles India is walking down a parallel and inconsistent policy pathway6 While no
In 2020 the COVID-19 pandemic tested the resilience of the global community demanding a concerted effort to battle its fallouts It was also the year the world celebrated the 5th anniversary of the Paris Accord an opportunity to assess progress establish enhanced targets and reaffirm commitment to mitigating the climate crisis
4
A N N U A L R E P O R T 2 0 2 0
new coal power stations have been set up in 2020 we continue to promote coal mining pursue increased coal production targets and have lately also allowed private investors into the market despite reduced utilisation of coal power plants and declining profitability7 Moreover even though a 50 decrease in the cost of solar power in two years is a major stimulus for adoption of renewable energy by targeting the concurrent development of 90+ GW of coal-based power capacity under the 2018 National Electricity Plan8 (NEP) India not only risks increasing its emissions but also turning the project into a stranded asset
Beyond the broad NDC targets Indian policymakers have started detailed consultations with companies to prepare them for broader action
Considering this focus on stranded assets and ESG emerging as an investment opportunity with over a third of global assets being built around ESG themes the Securities and Exchange Board of India (SEBI) hosted a roundtable in January 2021 to deliberate upon business preparedness to align with the sustainability-focused requirements it proposed9 This comes on back of the 77-page consultation paper issued by the SEBI in April 2020 on business responsibility and sustainability reporting10
The Ministry of Environment Forests and Climate Change (MoEFCC) also held a similar India CEO Forum on climate change in November 2020 to ldquoforge long standing and sustainable partnership between the Government and private sectorrdquo During the Forum a Declaration of Private Sector on Climate Change endorsed by 24 industry leaders and MoEFCC was released11 The industries included the likes of ITC Reliance Industries TATA Piramal Dalmia Mahindra ACClt Ambuja JSW Steel Renew Vedanta Dr Reddyrsquos and SUN Pharma12
Around the same time CDP also worked with its industry colleagues and partners (TERI We Mean Business World Business Council for Sustainable Development World Resources Institute and Climate Group) to develop a lsquoCall to Actionrsquo on eight business priorities for a green recovery This was signed by 24 business leaders and emphasised the need to
^ Invest in social infrastructure ensuring greater access and resilience
^ Accelerate power sector transition and clean mobility adoption
^ Deploy solutions for growing amp managing food to support growing needs
^ Collaborate and invest to achieve Land Degradation Neutrality ^ Pioneer green manufacturing and industrialisation ^ Transform to green building as the new normal across
geographies amp demographics
7 httpsclimateactiontrackerorgcountriesindia8 httpswwwcarbonbrieforgthe-carbon-brief-profile-india9 httpswwwmoneycontrolcomnewsbusinessmarketsformat-for-business-responsibility-sustainability-reporting-to-bring-in-more-transparency-ajay-tyagi-6353091html10 httpswwwsebigovinreports-and-statisticsreportsaug-2020consultation-paper-on-the-format-for-business-responsibility-and-sustainability-reporting_47345html11 httpspibgovinPressReleasePageaspxPRID=167035112 httpsstaticpibgovinWriteReadDatauserfilesFinal20Declarationpdf13 httpspibgovinPressReleaseIframePageaspxPRID=167763014 httpseceuropaeuinfobusiness-economy-eurobanking-and-financesustainable-financeinternational-platform-sustainable-finance_en15 httpswwwbusiness-standardcomarticlecurrent-affairsone-sun-one-world-one-grid-all-you-need-to-know-about-solar-strategy-120081500417_1html16 httpswwwnews18comnewsindiamodi-says-india-on-track-to-achieve-paris-climate-accord-targets-3172190html17 httpswwwnrdcorgsitesdefaultfilesroad-from-paris-202009pdf18 httpsnitigovinsitesdefaultfiles2020-06India_Green_Stimulus_Report_NITI_VF_June_29pdf
^ Invest in research for new clean energy sources to strengthen Indias energy outlook
^ Provide access to green finance to support emission saving measures across sectors
To further strengthen corporate action and adopt a more structured policy approach the Indian Government recently formed an Apex committee for the Implementation of Paris Agreement13 (AIPA) This committee will oversee Indiarsquos NDCs and monitor the contribution made by the private sector as well as multi- and bi-lateral agencies in the field of climate change under the chairmanship of the secretary MoEFCC India is also a part of the International Platform on Sustainable Finance14 launched by the European Commission in October 2019 to develop globally acceptable finance standards that can aid the mobilisation of private funds towards environmentally sustainable investments
Most importantly the recent initiative ldquoOne Solar One World and One Grid15rdquo (OSOWOG) launched by the International Solar Alliance (ISA) is an endeavour to connect 140 countries through a single grid that will be used for the transfer of solar power
We have reduced our emission intensity by 21 per cent over 2005 levels Our solar capacity has grown from 263GW in 2014 to 36 GW in 2020 Our renewable energy capacity is the fourth largest in the world It will reach 175GW before 2022 - Narendra Modi Prime Minister of India at Climate Ambition Summit16
In response to the COVID-19 economic crisis India also announced a large stimulus package ldquoAtmanirbharrdquo (self-reliant) amounting to US$260 billion17(10 of its GDP in 2019-20) Considered a step towards greater self-reliance the package intends to promote sustainable development and enhance job creation through investments in local manufacturing energy efficiency and renewable energy generation18 For instance while the stimulus allocates `30000 crores (US$4 billion) for agriculture and rural development these funds can be utilised for the installation of solar pumps and solar irrigation However to achieve an ambitious target of 450-GW installation capacity by 2030 it will need to channel a massive investment of US$700 billion This ambition can be realised only through funding support by international agencies including development finance institutions and other private players The domestic public and private institutions alone will not suffice Mark Carney the Governor of the Bank of England suggests that this is not just a financing challenge but a multi-
5
A N N U A L R E P O R T 2 0 2 0
trillion business opportunity Incidentally an IFC report released in 2018 highlights that the potential of climate finance in India is US$31 trillion
The Indian railway has also reiterated its commitment to achieving complete electrification of its network by 2023 targeting an ambitious net zero emissions by 203019
While governments have poured close to US$13 tn of public stimulus into economies so far the recovery packages are expected to have a net positive environmental impact in only seven of the 25 major world economies analysed stated the updated Greenness of Stimulus Index (GSI) report from Vivid Economics and Finance for Biodiversity20 A nature-based stimulus investment scenario outperforms a business-as-usual stimulus investment scenario globally by delivering more jobs more economic activity more carbon sequestration better nature outcomes and stronger resilience to extreme weather events including flood control says report co-author Jeffrey Beyer from Vivid Economics21
At the recently held Climate Ambition Summit on December 12 2020 UN Chief Antonio Guterres called on world leaders to declare a State of Climate Emergency in their countries until carbon neutrality is achieved22 To recover better from the COVID19 pandemic he urged countries to adhere to a green and resilient pathway by calling for investments in green jobs refusing bail-outs to polluting industries ending fossil-fuel subsidies and factoring climate risks into all financial and policy decisions
In this light this year has witnessed unprecedented calls for commitment action and investments not only from states but also from businesses and civil society groups The global momentum on climate action has been building with several European countries committing to net-zero emissions According to Blackrock23 88 of sustainable funds outperformed their non-sustainable counterparts from JanuaryndashApril 2020 highlighting the fact that ESGsustainable investing can future-proof investments while shaping a better future
Interestingly this year CDP also witnessed record-breaking disclosures mdash 10000+ companies cities states and regions disclosed through its platform Of these 9600+ companies with a combined worth of over 50 in global market capitalisation disclosed through CDP resulting in a 70 rise in corporate disclosures compared to 2015 the year the Paris agreement was signed24 CDP also launched its temperature ratings25 in collaboration with Europersquos largest asset manager Amundi enabling investors to access a temperature pathway for over 2850 global companies based on company emission reduction targets
19 httpspibgovinPressReleasePageaspxPRID=163826920 httpsenvironment-analystcomglobal106352recovery-stimulus-packages-are-causing-harm-to-nature21 httpsenvironment-analystcomglobal106352recovery-stimulus-packages-are-causing-harm-to-nature22 httpswwwindiatodayinworldstorydeclare-climate-emergency-un-chief-guterres-urges-leaders-of-every-country-1749078-2020-12-1323 httpswwwblackrockcomcorporateliteratureinvestor-educationsustainable-investing-resiliencepdf24 httpswwwcdpnetenarticlesclimate2020-lessons-from-an-extraordinary-year25 httpswwwcdpneteninvestortemperature-ratings
In India CDP witnessed a nearly 17 increase in corporate disclosure compared to 2019 with 220 Indian companies disclosing to investors and customers Climate change disclosure to investors recorded a rise of 14 Remarkably water security disclosure to investors also witnessed a significant increase of 87 Moreover for the first time a company responded to the forests request from investors through CDP India
With an ever-increasing number of companies choosing to disclose through CDP it is imperative to leverage the opportunity provided by the pandemic to transition from a grey to a green economy and join a growing league of climate leaders like Hindustan Zinc Limited IndusInd Bank Mahindra amp Mahindra and Tech Mahindra that deserve a special mention for being among the first Indian companies to make it to the prestigious CDP A List
Today Indian businesses realise that the risks posed by climate change are here to stay Therefore business leaders like Reliance Industries (a large conglomerate with businesses across oil amp gas telecom and retail amongst others) and JSW Energy (a thermal power company) have taken voluntary commitments to go net-zero (by 2035) and carbon-neutral (by 2050) respectively
Indian companies in highlight this year
Hindustan Zinc AIndusind Bank AMahindra amp Mahindra ATech Mahindra AGodrej Consumer Products Limited A-Infosys Ltd A-JSW Steel Ltd A-Marico A-Mindtree Ltd A-Tata Communications A-Tata Consultancy Services A-Tata Consumer Products A-Tata Motors A-Tata Steel A-Wipro A-YES BANK Limited A-
6
A N N U A L R E P O R T 2 0 2 0
Further the attempt to integrate climate action into business is also reflected in the disclosure responses received by CDP in the 2020 cycle
The business community is uniquely positioned to innovate and execute solutions with greater rigour and efficiency by integrating sustainability in the core business decision making with or without changes to the regulatory landscape Corporates can drive the desired change towards clean energy transitions by joining initiatives such as environmental disclosure the Science-Based Targets initiative RE100 and by incorporating an internal carbon price to deliver faster emission cuts in key areas However corporations need to be supported by governments through clearer long-term policies on energy and climate to instil the confidence needed to invest in technologies and innovation towards a zero-carbon future26
26 httpswwwwemeanbusinesscoalitionorgblogparis-agreement-the-power-of-ingenuity-with-collaboration-is-insurmountable
India is endowed with high social and environmental diversity and cannot expect to formulate a one- size- fits- all solution for its climate concerns What it requires is the coming together of all stakeholders to showcase the power of the collective especially its 13 billion people without whom no solution would be truly impactful
As disclosure and transparency are vital in lsquobuilding back betterrsquo CDP is poised to play a pivotal role as a global environmental disclosure platform helping companies cities states and regions measure and manage their environmental risks through disclosure The COP26 in Glasgow will be an important milestone in this direction and will enable countries to assess progress on their Paris Agreement goals and commit to more ambitious targets
As we work towards a low carbon future we must also pledge to build a more equitable world where vulnerable sections are no longer left to bear the brunt of tragedies triggered by climate change
17
Investor requested corporate disclosures for climate
change from Indian companies grew by
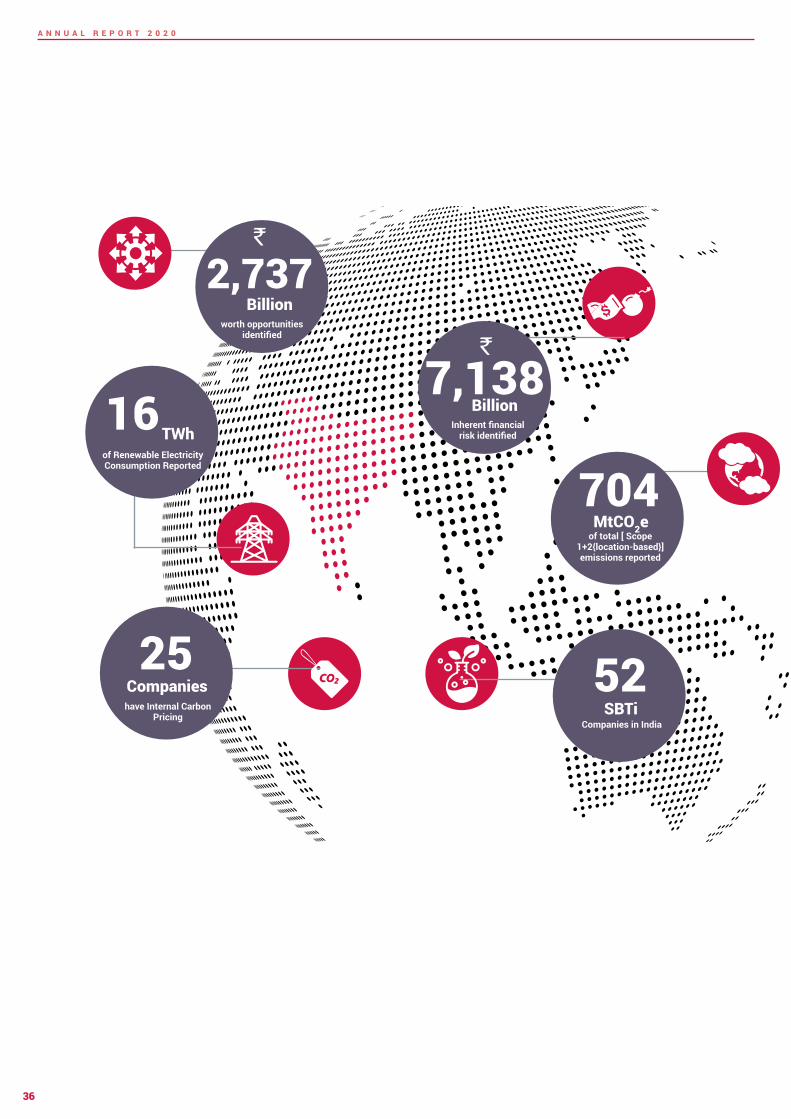
increase in investor requested corporate disclosures for Water Security Disclosures
87growth has been witnessed
over last year
` 7138Billion
worth of climate related risks calculated
by companies
3752
Indian companies have committed to the
SBTi by 2020
companies58
are pricing carbon or are planning to do so in the
next two years
7
A N N U A L R E P O R T 2 0 2 0
Business leaders are almost unanimously deliberating on climate issues and an overwhelming majority of companies now incentivise their managements to undertake climate action About three-fourths of these incentives are in the form of a financial compensation GAIL has a portal where staff members can give their suggestions on how to manage climate risks and employees whose suggestions are accepted are given a financial reward of `100000 Among the various types of non-monetary rewards BPCL recognises employees for undertaking initiatives in Health Safety Security and Environment (HSSE) through an annual performance award Mahindra amp Mahindra provide acknowledgement certificates to employees for energy efficiency projects as well as to those contributing to the annual sustainability reporting
The most commonly appointed positions that companies have chosen to place the responsibility of overseeing climate-related issues are board-level committee members the CEO the director the board chair and the CSO These individuals are also at the top of the corporate ladder which denotes the growing importance of climate change not just as a sustainability issue but as a broader global risk that threatens to undermine financial bottom lines erode shareholder value and tarnish brands
More than 75 companies provide an update to their respective boards on climate change-related issues at least
27 httpcbsteriinorgindiaghgphp~text=The20total20inventory20managed20bypercent20of20Indias20total20emissions
every quarter highlighting the growing importance of environmental sustainability as a core business value
Sustainability is deeply entrenched in the financial structure of companies today influencing access to capital capital expenditure direct and indirect costs and capital allocation Hence it comes as no surprise that 66 out of 67 companies stated that climate-related risks and opportunities have had an impact on their organisationrsquos strategy for financial planning Of these 66 companies 46 have also developed a low-carbon transition plan to minimise the losses to their bottom lines
SUSTAINABILITY ndash HEART OF GOOD GOVERNANCE
Businesses that currently account for 76 of the total energy consumption are vital for the country to tread the path of sustainable development As engines that will drive economic growth in the aftermath of the pandemic corporates present an immense opportunity for India to meet its climate commitments (NDCs) under the Paris Agreement through large-scale emissions reduction29
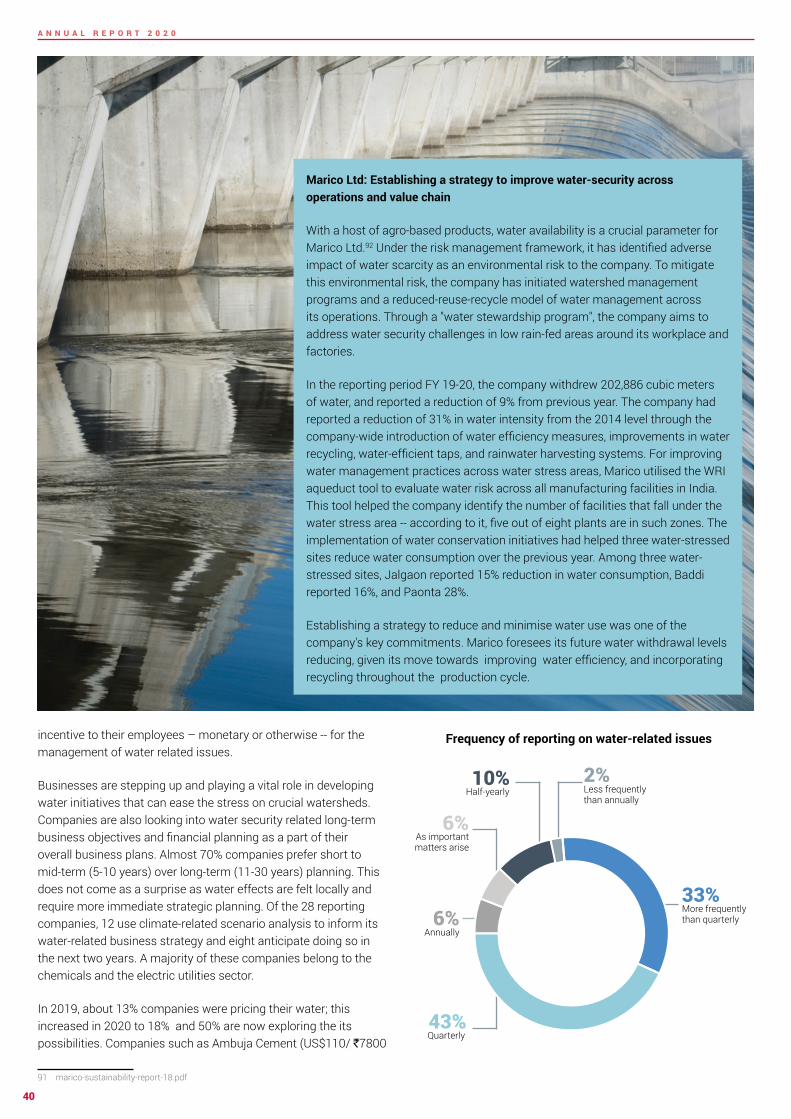
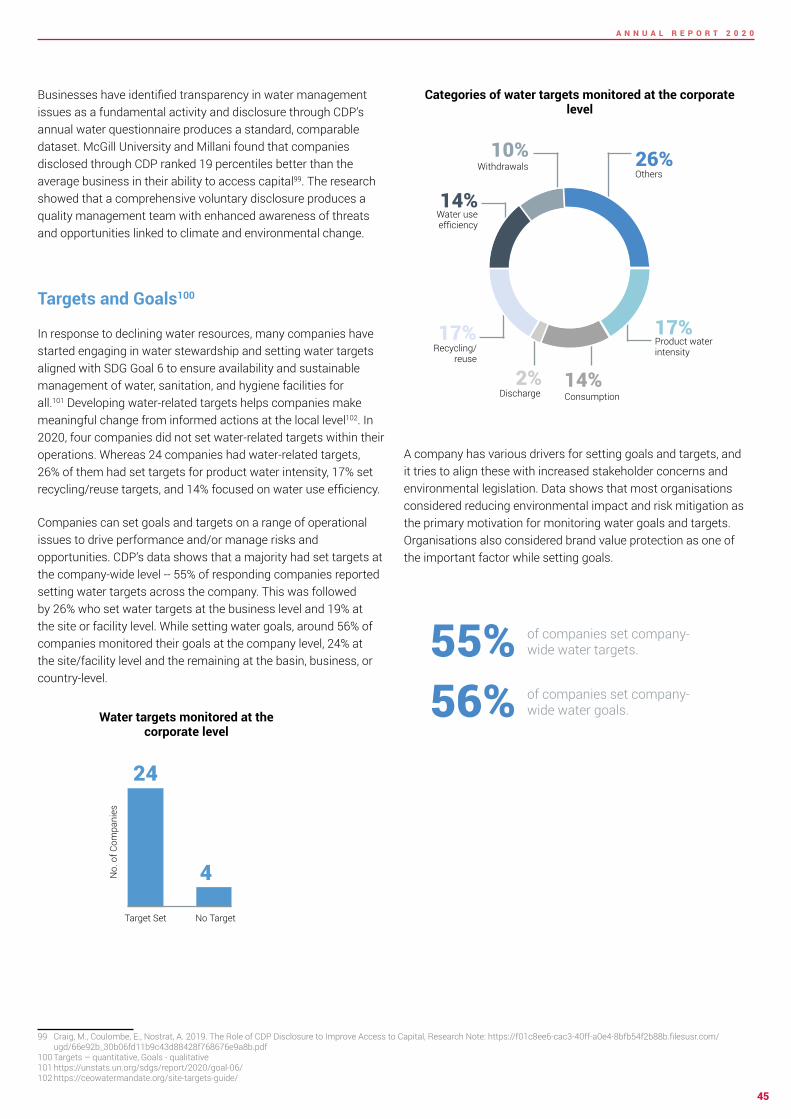
Frequency of reporting of climate-related issues
Oversight amp Incentive
Board- level oversight Incentive to management
99 8845
34
8
53
More frequency than quarterly
Quarterly
Half-yearly
4Annually
As important
matters arise
Not reported to the board
a
ge o
f com
pani
es
8
A N N U A L R E P O R T 2 0 2 0
Climate-related scenario analysis allows businesses to not only project future operational emissions but also mobilise necessary resources to offset the carbon footprint in their sustainability measurement approach It is especially important that the application of scenario analysis incorporates dynamic and unstable conditions under which companies are operating such as the COVID-19 pandemic that has resulted in mass layoffs economic recession and lockdowns across the world This would enable corporations to explore a broader range of uncertainties and be more resilient to external drivers of change28
The rigorous computational analysis would provide direction to enterprises on how to set emission reduction targets in line with the 20C scenario About 63 of the reporting companies use climate analysis tools such as models or scenarios enumerated
28 httpswwwfsborgwp-contentuploadsP291020-3pdf
under the Nationally Determined Contributions and International Energy Agencyrsquos 2 Degree Scenario (2DS) to inform their business strategy
Climate-based risks and opportunities have also influenced the strategy of companies in the sphere of investment in RampD Products amp Services Operations and Supply ChainValue chain Among these areas 87 companies claimed that Operations were affected and 84 reported changes in planning for Products and Services
Investmentin RampD
343
657
No
of C
ompa
nies
No Yes
Product amp Services 164
836
No Yes
No
of C
ompa
nies
Supply chain Value chain
701
298
No Yes
No
of C
ompa
nies
Operations
866
134No
of C
ompa
nies
No Yes
9
A N N U A L R E P O R T 2 0 2 0
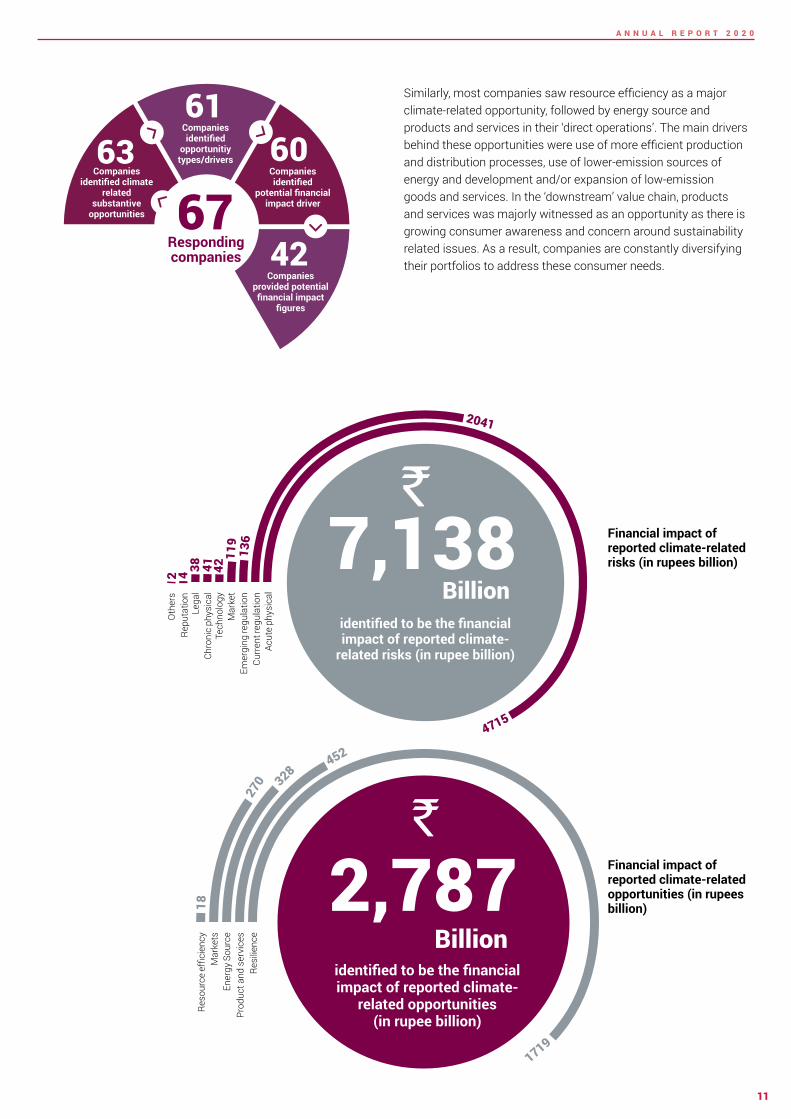
CLIMATE-RELATED RISKS amp OPPORTUNITIESMore often than not the financial impacts of climate-related issues are not quantified and identifying them in the first place could be challenging These issues necessitate actions Increasingly investors lenders and other financial regulators are becoming more focused on ensuring that the private sector is ready to address climate risks and grab opportunities brought by changing climate
29 httpthoughtleadershipaoncomDocuments20200122-if-natcat2020pdfutm_source=cerosamputm_medium=storypageamputm_campaign=natcat20
30 httpswwwbankofenglandcouk-mediaboefilesspeech2019avoiding-the-storm-climate-change-and-the-financial-system-speech-by-sarah-breedenpdf
31 httpsreadoecd-ilibraryorgviewref=136_136201-ctwt8p7qs5amptitle=Making-the-Green-Recovery-Work-for-Jobs-Income-and-Growth_
32 https6fefcbb86e61af1b2fc4-c70d8ead6ced550b4d987d7c03fcdd1dsslcf3rackcdncomcmsreportsdocuments000005312originalAnalysis_of_CA100__Data_for_CDP_Investor_Signatories_v5pdf1596046258
33 Climate Action 100+ is an investor initiative to ensure the worldrsquos largest corporate GHG emitters take necessary action on climate change The companies include 100 lsquosystemically important emittersrsquo accounting for 23rd of annual global industrial emissions alongside more than 60 others with significant opportunity to drive the clean energy transition Read more at httpwwwclimateaction100org
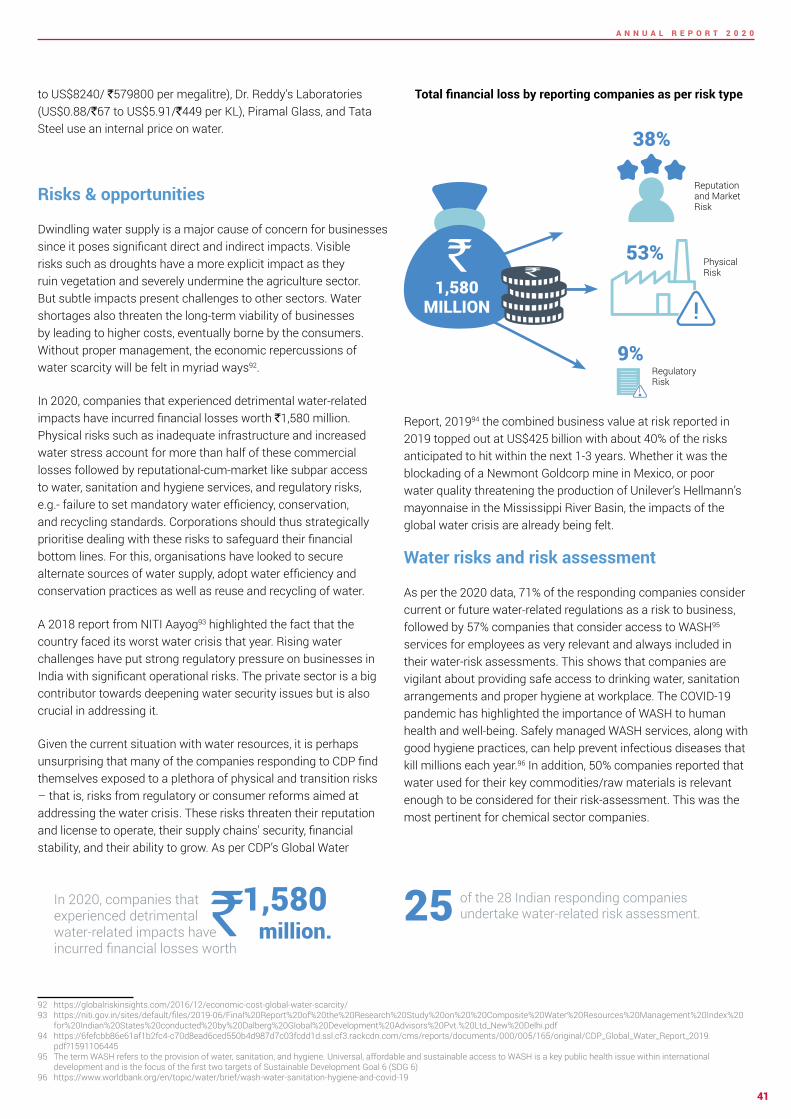
Climate change has already shown substantial impacts on businesses all around the world and this is expected to continue As per a 2019 report 29 the total direct economic losses incurred due to climate-related natural disasters in 2019 were estimated at US$232 billion In India the monsoon floods in June-October 2019 caused an economic loss of US$10 billion and claimed 1750 lives Additionally the Bank of England has estimated asset losses worth US$20 trillion due to climate change if no action is taken now 30
COVID-19 has taught the world how the pandemic can actually be used as an
opportunity to better understand and mitigate climate-related
risks Investors are now more than ever more focussed on risk exposure Post-COVID-19 civil society groups governments and business are all have aligned in trying to reduce the risks to our economy and world going forward
As per an OECD report despite widespread socio-
economic suffering suffering there is an increase in public
consciousness about the risks to the natural system from anthropogenic activities31
CDP recently released a report32 on the analysis of CA100+ companies for CDP Investor Signatories Up to 118 of 122 CA100+33 companies report being exposed to substantive climate-related risks and opportunities 93 companies identified climate-related risks and 91 identified climate-related opportunities as having the potential to have a substantive financial or strategic impact on their businesses
As per CDP Indiarsquos 2020 data companies have a varied definition of what short medium and long-term means for them -- a rough average across the sample would be three years for short term five years for medium term and 15-20 years for the long term although the latter also ranges up to 100 years These time frames are important in planning risk management processes -- contextualisation of risks in terms of potential market changes and evolving technological scenarios around risk management at enterprise level
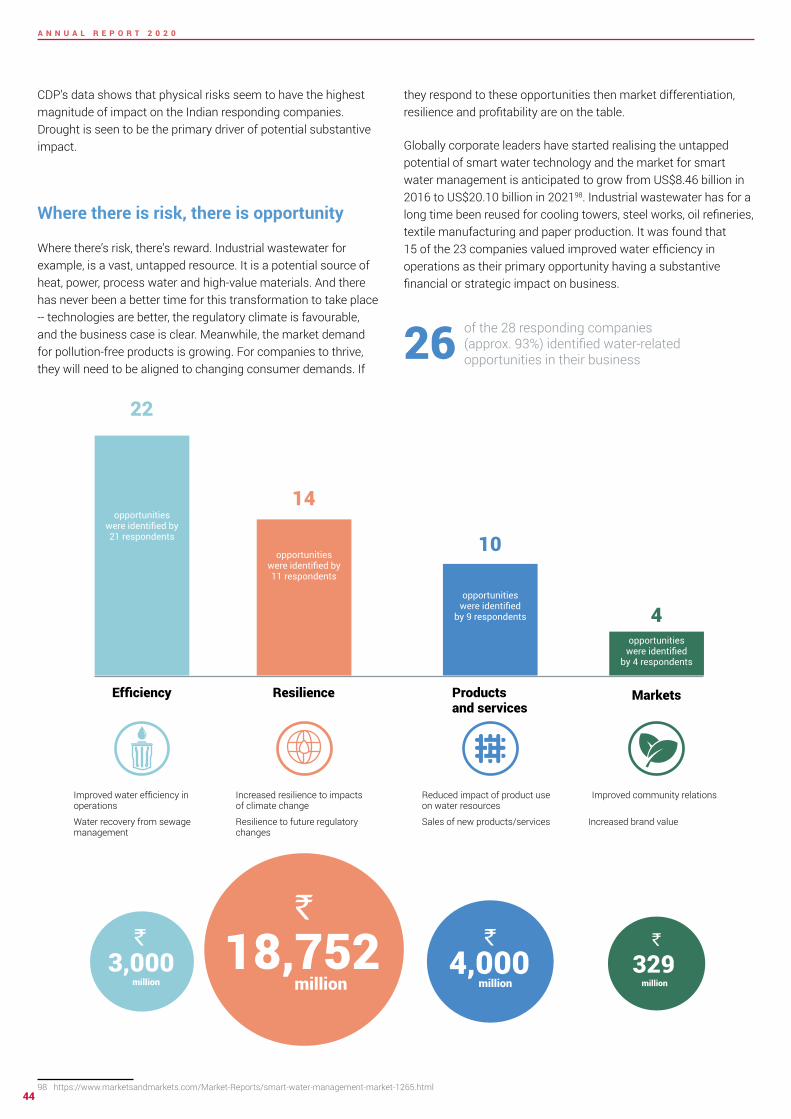
Responding companies
67Companies identified
climate related substantive risks
62Companies
identified risk typesdrivers
60Companies
identified potential financial impact
driver
60
Companies provided potential financial
impact figures
42
10
A N N U A L R E P O R T 2 0 2 0
THE RISKS OF CLIMATE CHANGE
In terms of risk types current regulation was deemed to be most relevant and always included in 97 of the organisationsrsquo climate-related risk assessments This was followed by emerging regulation and technology Interestingly findings from responses submitted by global companies corroborate this trend analysis as almost all CA100+ respondents reported policy and legal risks as potential drivers for substantive impact when it comes to transition risk34 With regular compliance checks increased stakeholder concern and sustainably evolving consumer demands climate-related risk assessment procedures can help companies become better equipped to handle longer-term uncertainties and liabilities
The number of companies that identified inherent climate-related risks with potential substantive financial or strategic impact on businesses rose to 94 from 88 in 2019 Up to 63 of reporting companies were able to get to the last mile of providing a financial impact figure to the risks identified Disclosing Indian companies put the total inherent financial impact of climate risks at `7138 billion with an average risk per company being `92 billion
Companies have also identified climate-related risks across their value chain with direct operations being the most severely affected and exposed most to acute physical risks followed by emerging regulation current regulations and chronic physical risks Companiesrsquo lsquodownstreamrsquo value chain is affected the most by market risks followed by acute physical risks Downstream value chain refers to the third parties benefiting from the outputs products and services of business activities This may be a companyrsquos customers and clients or the organisations and projects the business invests in This could possibly mean that changing customer behaviour could gravely affect a business operation if there is a shift in the demand for a comparatively low-carbon intensive product as well as greater demand for product efficiency regulations and standards providing clear evidence that there is a continuous shift towards sustainable products
CLIMATE RISKS AN OPPORTUNITY TO RESTRATEGISE
Up to 94 of reporting companies have identified climate-related opportunities as having the potential to make a substantive financial or strategic impact on businesses And 63 have provided a potential financial impact figure to the opportunities related to climate change Disclosing companies put the cost of climate-related opportunities at a total of `2787 billion The figure is a testament to the evolution of the climate change mitigation program and how organisations see this
34 https6fefcbb86e61af1b2fc4-c70d8ead6ced550b4d987d7c03fcdd1dsslcf3rackcdncomcmsreportsdocuments000005312originalAnalysis_of_CA100__Data_for_CDP_Investor_Signatories_v5pdf1596046258
No of Companies
Opp
ortu
nity
typ
es
Opportunity identified in value chain
Direct operations
Downstream
Upstream
Resource efficiency
Product and services
Energy source
Markets
Resilience
41
25 18
34 7
7
9 3
3
2
3
396
6
Risks relevant to Indian companies
Current regulation97Emerging regulations90Reputation90Market85Technology85Legal
Acute physical
Chronic physical
827973
No of Companies
Risk occuring in value chain
No of Companies
Risk
type
s
Reputation
Legal
Emerging regulation
Chronic physical
Technology
Market
Current regulation
Acute physical
Direct operations
Downstream
Upstream
5115
2
2923 4 8
17
8 14 7122 4
40 5 8
2
31
11
A N N U A L R E P O R T 2 0 2 0
Similarly most companies saw resource efficiency as a major climate-related opportunity followed by energy source and products and services in their lsquodirect operationsrsquo The main drivers behind these opportunities were use of more efficient production and distribution processes use of lower-emission sources of energy and development andor expansion of low-emission goods and services In the lsquodownstreamrsquo value chain products and services was majorly witnessed as an opportunity as there is growing consumer awareness and concern around sustainability related issues As a result companies are constantly diversifying their portfolios to address these consumer needs
Prod
uct a
nd s
ervi
ces
Ener
gy S
ourc
e
Resi
lienc
e
Resi
lienc
e
Ener
gy S
ourc
e
Reso
urce
effi
cien
cyM
arke
ts
2787identified to be the financial impact of reported climate-
related opportunities (in rupee billion)
Billion
`452
328
270
18
1719
Responding companies
67Companies
identified climate related
substantive opportunities
63Companies identified
opportunitiy typesdrivers
61
Companies identified
potential financial impact driver
60
Companies provided potential financial impact
figures
42
2041
4715
136
119
42413842
Acut
e ph
ysic
alCu
rren
t reg
ulat
ion
Emer
ging
regu
latio
n
Chro
nic
phys
ical
Repu
tatio
nO
ther
s
Lega
l
Tech
nolo
gyM
arke
t
7138identified to be the financial impact of reported climate-
related risks (in rupee billion)
Billion
`Financial impact of reported climate-related risks (in rupees billion)
Financial impact of reported climate-related opportunities (in rupees billion)
12
A N N U A L R E P O R T 2 0 2 0
Tech Mahindra Tapping into climate-related opportunities
Tech Mahindrarsquos approach towards climate change mitigation strategies is a testament to the efficacy of tapping into and realising climate-related opportunities The company has adopted Science-Based Targets to reduce its emissions and is a signatory to Business Ambition of 15 degree Celsius Tech Mahindra is committed to responsibly managing its operations through continuous improvement in sustainability practices across its value chain The company focuses on carbon emission reductions energy consumption reduction self-generation of energy from renewable energy sources and encouragement for green projects through Power Purchase Agreements The company has taken a target to increase Renewable Energy (RE) to 50 by 2025 Their sustainability report is aligned with CDSB amp Task Force on Climate-related Financial Disclosures (TCFD) frameworks
A constant focus on green energy and sustainable operations has provided a significant saving of US$27 million brought about by increasing renewable energy capacity to 1383MW leading to a saving of 28 million units of electricity adopting energy efficient practices across their facilities
Tech Mahindra has harnessed the power of disruptive next-generation technologies such as Artificial Intelligence (AI) analytics and blockchain to create solutions that ensure both its own and its customersrsquo carbon footprint reduction The company has contextualised opportunities for its customers as well by creating smart city offerings such as SMART Grid Micro-Grid-As-A-Service Intelligent Electric Vehicle Charging System (IEVCS) smart energy management smart traffic management smart lightening management smart waste management systems and command amp control centres These smart city offerings will help reduce carbon footprints across multiple smart cities globally thereby reducing carbon emissions and contributing to green and sustainable solutions It is claimed that the market size for this is expected to reach US$4639 billion by 2027
At present the risks identified by the responding companies significantly outweigh the opportunities Opportunities are slow to emerge and companies need to focus on the use of lower-emission sources of energy development andor expansion of low-emissions goods and services development of climate adaptation resilience and insurance risk solutions and use of more efficient production and distribution processes
In 2015 at the request of the G20 Finance Ministers and Central Bank Governors the Financial Stability Board (FSB) and its chair Mark Carney established the industry-led TCFD This was set up in response to increasing demands from investors lenders insurers regulators policy makers and other stakeholders in the financial markets for decision-useful climate-related information CDP has aligned its information requests with the TCFD alongside introducing a sectoral focus and adopting a forward-looking approach to climate-risk disclosure We are already going in the direction of mandatory disclosure of climate risks how they are present in a companyrsquos activities how they manage it and how resilient they are to it The UK will be the first country in the world to make TCFD-aligned disclosures fully mandatory across the economy by 2025 going beyond the lsquocomply or explain approachrsquo35
35 httpswwwgovukgovernmentnewschancellor-sets-out-ambition-for-future-of-uk-financial-services
13
A N N U A L R E P O R T 2 0 2 0
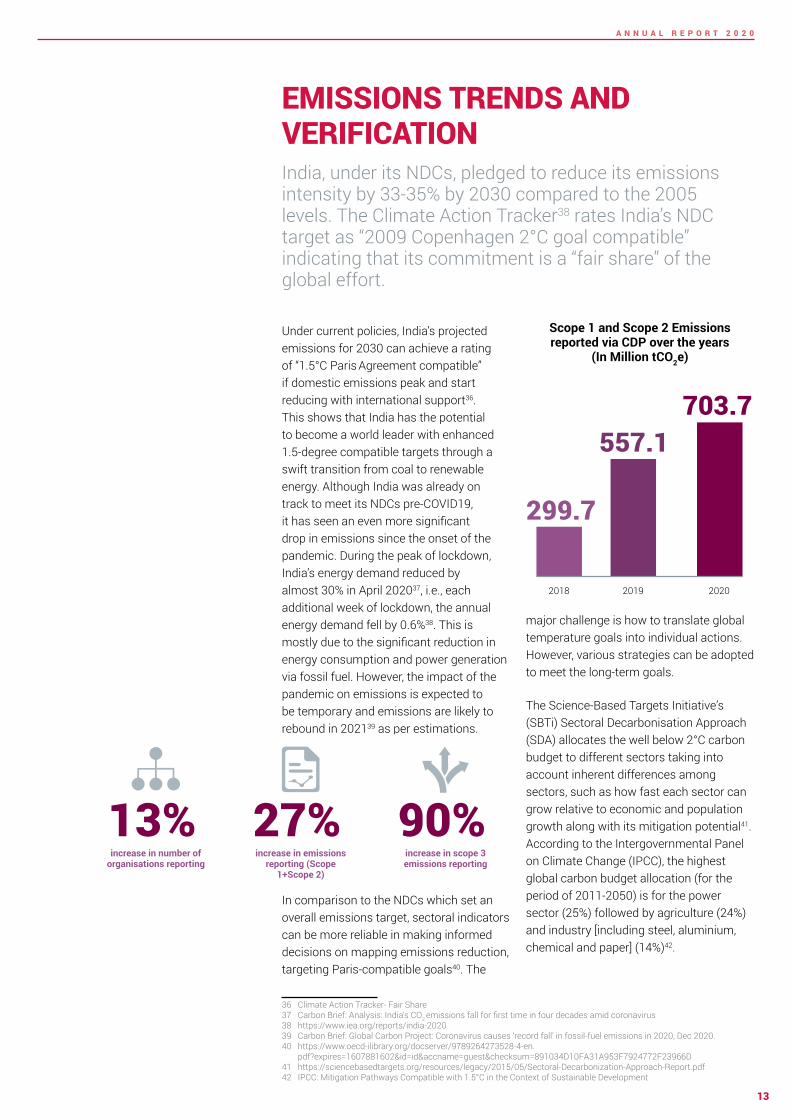
Under current policies Indiarsquos projected emissions for 2030 can achieve a rating of ldquo15degC Paris Agreement compatiblerdquo if domestic emissions peak and start reducing with international support36 This shows that India has the potential to become a world leader with enhanced 15-degree compatible targets through a swift transition from coal to renewable energy Although India was already on track to meet its NDCs pre-COVID19 it has seen an even more significant drop in emissions since the onset of the pandemic During the peak of lockdown Indiarsquos energy demand reduced by almost 30 in April 202037 ie each additional week of lockdown the annual energy demand fell by 0638 This is mostly due to the significant reduction in energy consumption and power generation via fossil fuel However the impact of the pandemic on emissions is expected to be temporary and emissions are likely to rebound in 202139 as per estimations
In comparison to the NDCs which set an overall emissions target sectoral indicators can be more reliable in making informed decisions on mapping emissions reduction targeting Paris-compatible goals40 The
36 Climate Action Tracker- Fair Share37 Carbon Brief Analysis Indiarsquos CO2 emissions fall for first time in four decades amid coronavirus38 httpswwwieaorgreportsindia-202039 Carbon Brief Global Carbon Project Coronavirus causes lsquorecord fallrsquo in fossil-fuel emissions in 2020 Dec 202040 httpswwwoecd-ilibraryorgdocserver9789264273528-4-en
pdfexpires=1607881602ampid=idampaccname=guestampchecksum=891034D10FA31A953F7924772F23966D41 httpssciencebasedtargetsorgresourceslegacy201505Sectoral-Decarbonization-Approach-Reportpdf42 IPCC Mitigation Pathways Compatible with 15degC in the Context of Sustainable Development
major challenge is how to translate global temperature goals into individual actions However various strategies can be adopted to meet the long-term goals
The Science-Based Targets Initiativersquos (SBTi) Sectoral Decarbonisation Approach (SDA) allocates the well below 2degC carbon budget to different sectors taking into account inherent differences among sectors such as how fast each sector can grow relative to economic and population growth along with its mitigation potential41 According to the Intergovernmental Panel on Climate Change (IPCC) the highest global carbon budget allocation (for the period of 2011-2050) is for the power sector (25) followed by agriculture (24) and industry [including steel aluminium chemical and paper] (14)42
EMISSIONS TRENDS AND VERIFICATION
13increase in number of
organisations reporting
27increase in emissions
reporting (Scope 1+Scope 2)
90increase in scope 3 emissions reporting
India under its NDCs pledged to reduce its emissions intensity by 33-35 by 2030 compared to the 2005 levels The Climate Action Tracker38 rates Indiarsquos NDC target as ldquo2009 Copenhagen 2degC goal compatiblerdquo indicating that its commitment is a ldquofair sharerdquo of the global effort
Scope 1 and Scope 2 Emissions reported via CDP over the years
(In Million tCO2e)
2018 2019 2020
2997
55717037
14
A N N U A L R E P O R T 2 0 2 0
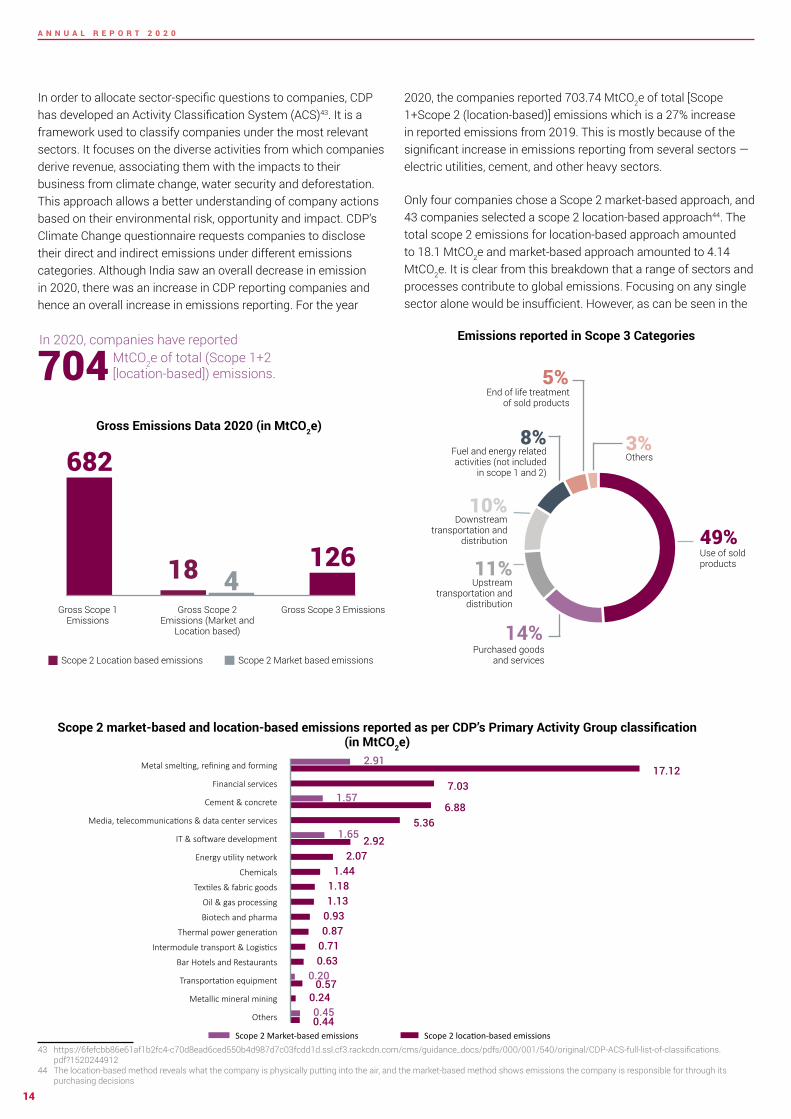
In order to allocate sector-specific questions to companies CDP has developed an Activity Classification System (ACS)43 It is a framework used to classify companies under the most relevant sectors It focuses on the diverse activities from which companies derive revenue associating them with the impacts to their business from climate change water security and deforestation This approach allows a better understanding of company actions based on their environmental risk opportunity and impact CDPrsquos Climate Change questionnaire requests companies to disclose their direct and indirect emissions under different emissions categories Although India saw an overall decrease in emission in 2020 there was an increase in CDP reporting companies and hence an overall increase in emissions reporting For the year
43 https6fefcbb86e61af1b2fc4-c70d8ead6ced550b4d987d7c03fcdd1dsslcf3rackcdncomcmsguidance_docspdfs000001540originalCDP-ACS-full-list-of-classificationspdf1520244912
44 The location-based method reveals what the company is physically putting into the air and the market-based method shows emissions the company is responsible for through its purchasing decisions
2020 the companies reported 70374 MtCO2e of total [Scope 1+Scope 2 (location-based)] emissions which is a 27 increase in reported emissions from 2019 This is mostly because of the significant increase in emissions reporting from several sectors mdash electric utilities cement and other heavy sectors
Only four companies chose a Scope 2 market-based approach and 43 companies selected a scope 2 location-based approach44 The total scope 2 emissions for location-based approach amounted to 181 MtCO2e and market-based approach amounted to 414 MtCO2e It is clear from this breakdown that a range of sectors and processes contribute to global emissions Focusing on any single sector alone would be insufficient However as can be seen in the
Emissions reported in Scope 3 Categories
4949
1414
1111
1010
88
55
33
Use of sold products
Purchased goods and services
Upstream transportation and
distribution
Downstream transportation and
distribution
Fuel and energy related activities (not included
in scope 1 and 2)
End of life treatment of sold products
Others
In 2020 companies have reported MtCO2e of total (Scope 1+2 [location-based]) emissions704
Gross Emissions Data 2020 (in MtCO2e)
682
126418
Gross Scope 1 Emissions
Gross Scope 3 EmissionsGross Scope 2 Emissions (Market and
Location based)
Scope 2 Location based emissions Scope 2 Market based emissions
Metal smelting refining and forming
Financial services
Cement amp concrete
Media telecommunications amp data center services
IT amp software development
Energy utility network
Chemicals
Textiles amp fabric goods
Oil amp gas processing
Biotech and pharma
Thermal power generation
Intermodule transport amp Logistics
Bar Hotels and Restaurants
Transportation equipment
Metallic mineral mining
Others
2911712
703
688536
165 292207
144118113
093087
071063
020057
024045044
157
Scope 2 Market-based emissions Scope 2 location-based emissions
Scope 2 market-based and location-based emissions reported as per CDPrsquos Primary Activity Group classification (in MtCO2e)
15
A N N U A L R E P O R T 2 0 2 0
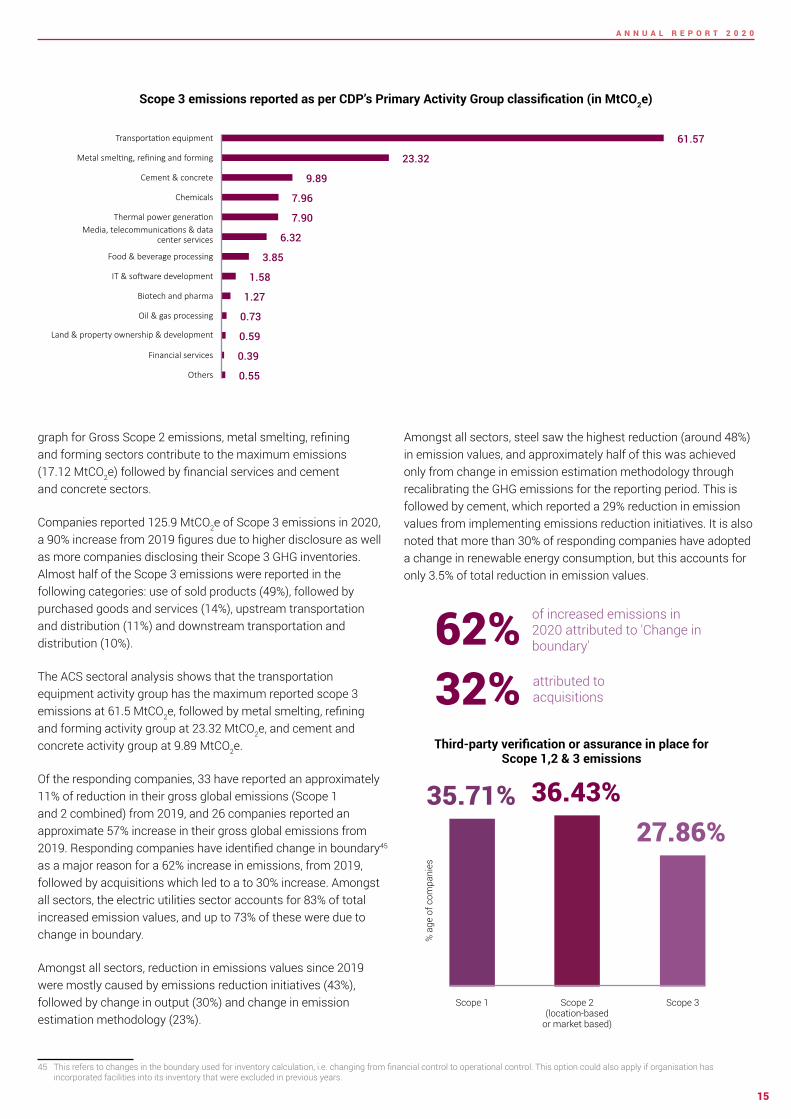
graph for Gross Scope 2 emissions metal smelting refining and forming sectors contribute to the maximum emissions (1712 MtCO2e) followed by financial services and cement and concrete sectors
Companies reported 1259 MtCO2e of Scope 3 emissions in 2020 a 90 increase from 2019 figures due to higher disclosure as well as more companies disclosing their Scope 3 GHG inventories Almost half of the Scope 3 emissions were reported in the following categories use of sold products (49) followed by purchased goods and services (14) upstream transportation and distribution (11) and downstream transportation and distribution (10)
The ACS sectoral analysis shows that the transportation equipment activity group has the maximum reported scope 3 emissions at 615 MtCO2e followed by metal smelting refining and forming activity group at 2332 MtCO2e and cement and concrete activity group at 989 MtCO2e
Of the responding companies 33 have reported an approximately 11 of reduction in their gross global emissions (Scope 1 and 2 combined) from 2019 and 26 companies reported an approximate 57 increase in their gross global emissions from 2019 Responding companies have identified change in boundary45 as a major reason for a 62 increase in emissions from 2019 followed by acquisitions which led to a to 30 increase Amongst all sectors the electric utilities sector accounts for 83 of total increased emission values and up to 73 of these were due to change in boundary
Amongst all sectors reduction in emissions values since 2019 were mostly caused by emissions reduction initiatives (43) followed by change in output (30) and change in emission estimation methodology (23)
45 This refers to changes in the boundary used for inventory calculation ie changing from financial control to operational control This option could also apply if organisation has incorporated facilities into its inventory that were excluded in previous years
Amongst all sectors steel saw the highest reduction (around 48) in emission values and approximately half of this was achieved only from change in emission estimation methodology through recalibrating the GHG emissions for the reporting period This is followed by cement which reported a 29 reduction in emission values from implementing emissions reduction initiatives It is also noted that more than 30 of responding companies have adopted a change in renewable energy consumption but this accounts for only 35 of total reduction in emission values
Scope 3 emissions reported as per CDPrsquos Primary Activity Group classification (in MtCO2e)
of increased emissions in 2020 attributed to Change in boundary62
32 attributed to acquisitions
Metal smelting refining and forming
Cement amp concrete
Media telecommunications amp data center services
Chemicals
IT amp software development
Food amp beverage processing
Oil amp gas processing
Biotech and pharma
Thermal power generation
Land amp property ownership amp development
Financial services
Transportation equipment
Others
6157
2332
989
796
790
632
385
158
127
073
059
039
055
Third-party verification or assurance in place for Scope 12 amp 3 emissions
3571
Scope 1
3643
Scope 2 (location-based
or market based)
2786
Scope 3
a
ge o
f com
pani
es
16
A N N U A L R E P O R T 2 0 2 0
Third-party verification is one of the significant components of emission reporting An independent verification of self-reported data provides credibility and assurance It helps companies improve their internal processes identify risks and opportunities increase the reliability of their data reduce operational costs and building a strong reputation46 When an organisation monitors and verifies its emissions it can accurately identify and understand the true proportions of emissions from its sources and this can help it realise the major opportunities for emission reduction along with cost benefits
In 2020 50 companies reported third-party verification or assurance for Scope 1 emissions 51 companies for Scope 2 emissions and 39 companies for Scope 3 emissions Compared to 2019 there is an 18 increase in companies that have verified Scope 3 GHG emissions This indicates that Indian companies are becoming increasingly aware of their emission managementaccounting Amongst all sectoral companies which opt for third-party verification of their reported emissions around 25 are from IT amp software development and financial services Cement and concrete sectors rank the lowest on the list CDP encourages companies to have verified data submitted
46 The business benefits of third party verification of climate data A CDP Guide
Building a stronger reputation via third party verification
bull Increase confidence in data for internal and external use
bull Develop and demonstrate an effective carbon reduction strategy Improve business processes
bull Reduce operational costsbull Full-fill one of the mandatory criteria for entry
to the CDP A-list by gaining full points on CDPrsquos Scope 1 and 2 verification questions
bull Provide credibility for products services and internal processes
bull Counteract claims of greenwashing
17
A N N U A L R E P O R T 2 0 2 0
DECARBONISING ACROSS VALUE CHAIN Scope 3 emissions typically arise from the supply chain and the consumers using the product It has been found that the emissions from the supply chain are 5-6 times more than the carbon footprint of a companyrsquos direct operations and hence account for lionrsquos share of an organisationrsquos overall emissions47
47 httpswwwcdpnetenarticlessupply-chainsupplier-engagement-leaderboard-201948 httpswwwbcgcomen-inpublications2020supply-chain-needs-sustainability-strategy
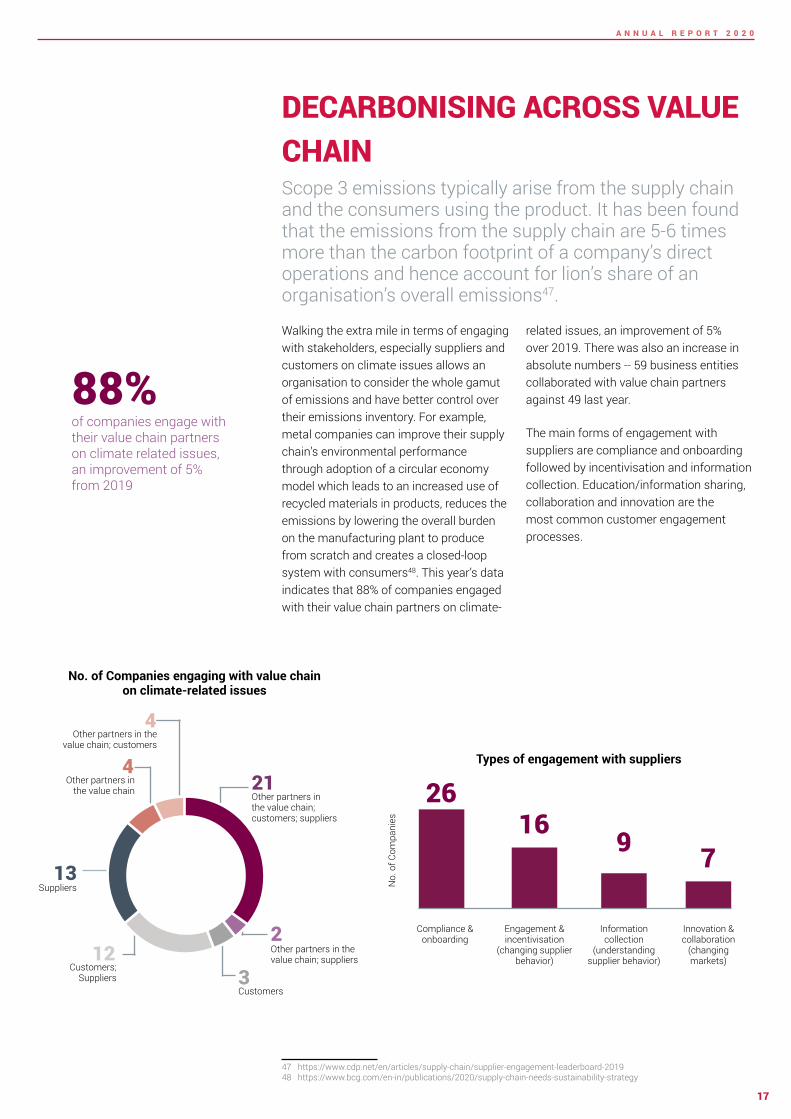
Walking the extra mile in terms of engaging with stakeholders especially suppliers and customers on climate issues allows an organisation to consider the whole gamut of emissions and have better control over their emissions inventory For example metal companies can improve their supply chainrsquos environmental performance through adoption of a circular economy model which leads to an increased use of recycled materials in products reduces the emissions by lowering the overall burden on the manufacturing plant to produce from scratch and creates a closed-loop system with consumers48 This yearrsquos data indicates that 88 of companies engaged with their value chain partners on climate-
related issues an improvement of 5 over 2019 There was also an increase in absolute numbers -- 59 business entities collaborated with value chain partners against 49 last year
The main forms of engagement with suppliers are compliance and onboarding followed by incentivisation and information collection Educationinformation sharing collaboration and innovation are the most common customer engagement processes
Types of engagement with suppliers
No of Companies engaging with value chain on climate-related issues
2121
22
331212
1313
44
44
Other partners in the value chain customers suppliers
Other partners in the value chain suppliers
Customers
Customers Suppliers
Suppliers
Other partners in the value chain
Other partners in the value chain customers
of companies engage with their value chain partners on climate related issues an improvement of 5 from 2019
88
26
Compliance amp onboarding
16
Engagement amp incentivisation
(changing supplier behavior)
9
Information collection
(understanding supplier behavior)
7
Innovation amp collaboration
(changing markets)
No
of C
ompa
nies
18
A N N U A L R E P O R T 2 0 2 0
Organisations are mindful of the fact that climate issues need to be dealt using a participatory approach that encompasses all partners in the value chain as well as engages other external stakeholders Companies are thus getting serious about engaging in a comprehensive dialogue on climate change as this will allow them to have inputs in shaping public policy In their attempt to influence climate policies organisations are establishing communication channels with stakeholders like policymakers trade associations and research funding organisations A positive sign emerging is that majority of the businesses are agreeing to comply with environmental legislations unconditionally Energy efficiency and clean energy generation have garnered the support of 71 and 68 of responding companies respectively Mandatory carbon reporting and increased climate resilience have also found acceptance
With the COVID-19 pandemic wreaking havoc across the world and leading to the first-ever recorded recession in India it is important that companies view this as an opportunity to build a more resilient economy one in harmony with nature and encouraging of a more inclusive environment for supplier engagement that would expedite decarbonising Engaging with the value chain offer a strategic advantage as it allows companies to take a lead on corporate sustainability and puts them in a position to set the blueprint for other businesses to follow
19
A N N U A L R E P O R T 2 0 2 0
Emission reduction targets and initiatives
Targets
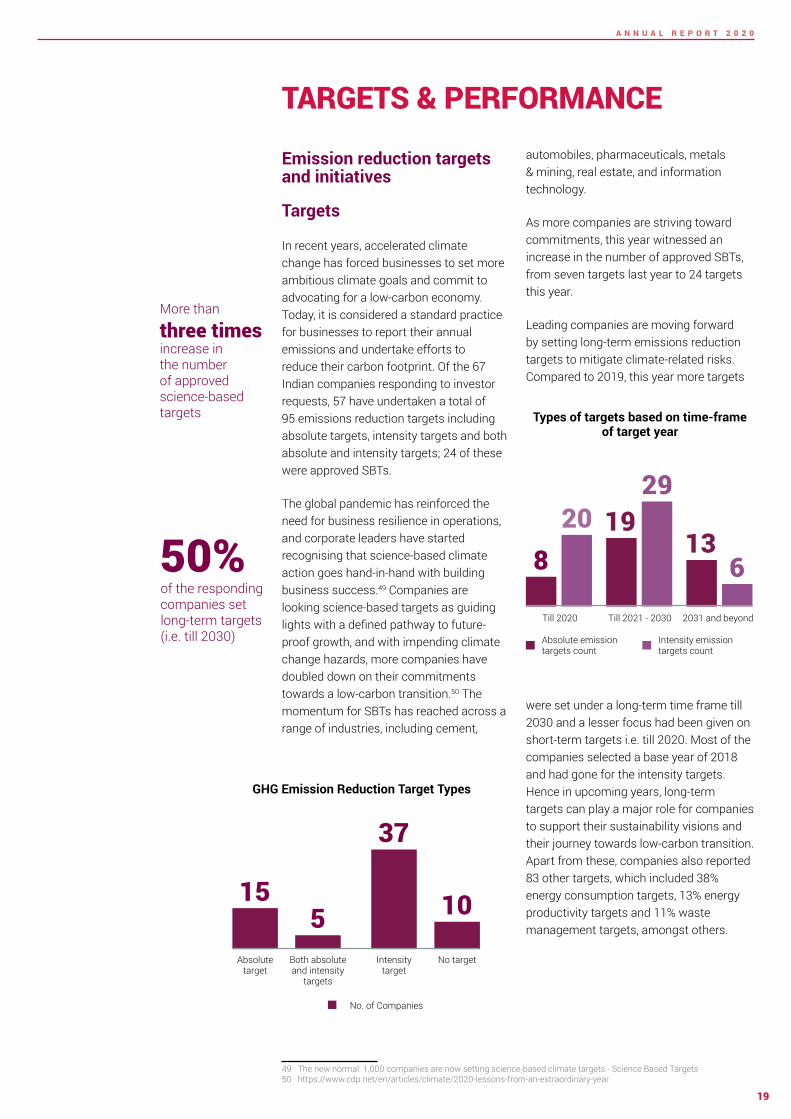
In recent years accelerated climate change has forced businesses to set more ambitious climate goals and commit to advocating for a low-carbon economy Today it is considered a standard practice for businesses to report their annual emissions and undertake efforts to reduce their carbon footprint Of the 67 Indian companies responding to investor requests 57 have undertaken a total of 95 emissions reduction targets including absolute targets intensity targets and both absolute and intensity targets 24 of these were approved SBTs
The global pandemic has reinforced the need for business resilience in operations and corporate leaders have started recognising that science-based climate action goes hand-in-hand with building business success49 Companies are looking science-based targets as guiding lights with a defined pathway to future-proof growth and with impending climate change hazards more companies have doubled down on their commitments towards a low-carbon transition50 The momentum for SBTs has reached across a range of industries including cement
49 The new normal 1000 companies are now setting science-based climate targets - Science Based Targets50 httpswwwcdpnetenarticlesclimate2020-lessons-from-an-extraordinary-year
automobiles pharmaceuticals metals amp mining real estate and information technology
As more companies are striving toward commitments this year witnessed an increase in the number of approved SBTs from seven targets last year to 24 targets this year
Leading companies are moving forward by setting long-term emissions reduction targets to mitigate climate-related risks Compared to 2019 this year more targets
were set under a long-term time frame till 2030 and a lesser focus had been given on short-term targets ie till 2020 Most of the companies selected a base year of 2018 and had gone for the intensity targets Hence in upcoming years long-term targets can play a major role for companies to support their sustainability visions and their journey towards low-carbon transition Apart from these companies also reported 83 other targets which included 38 energy consumption targets 13 energy productivity targets and 11 waste management targets amongst others
TARGETS amp PERFORMANCE
More than
three times increase in the number of approved science-based targets
of the responding companies set long-term targets (ie till 2030)
50
15
Absolute target
5Both absolute and intensity
targets
37
Intensity target
10
No target
No of Companies
GHG Emission Reduction Target Types
Absolute emission targets count
Intensity emission targets count
Types of targets based on time-frame of target year
820
Till 2020
1929
Till 2021 - 2030
136
2031 and beyond
20
A N N U A L R E P O R T 2 0 2 0
Emission reduction initiatives
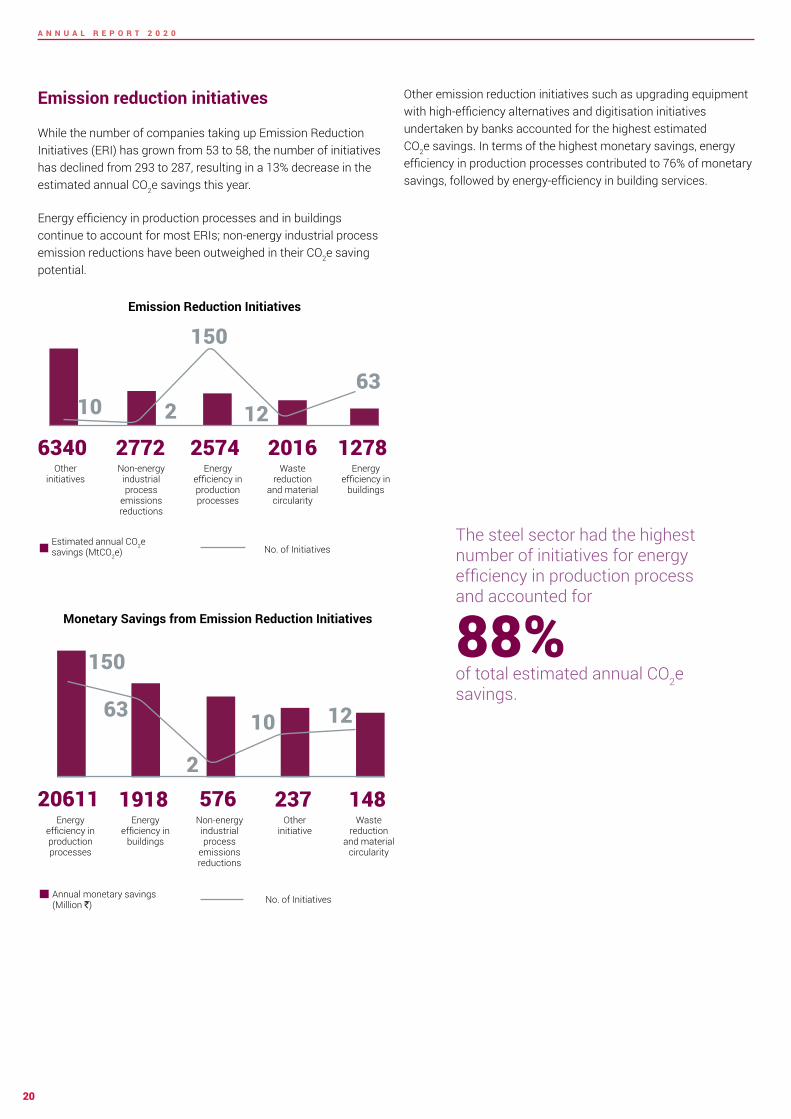
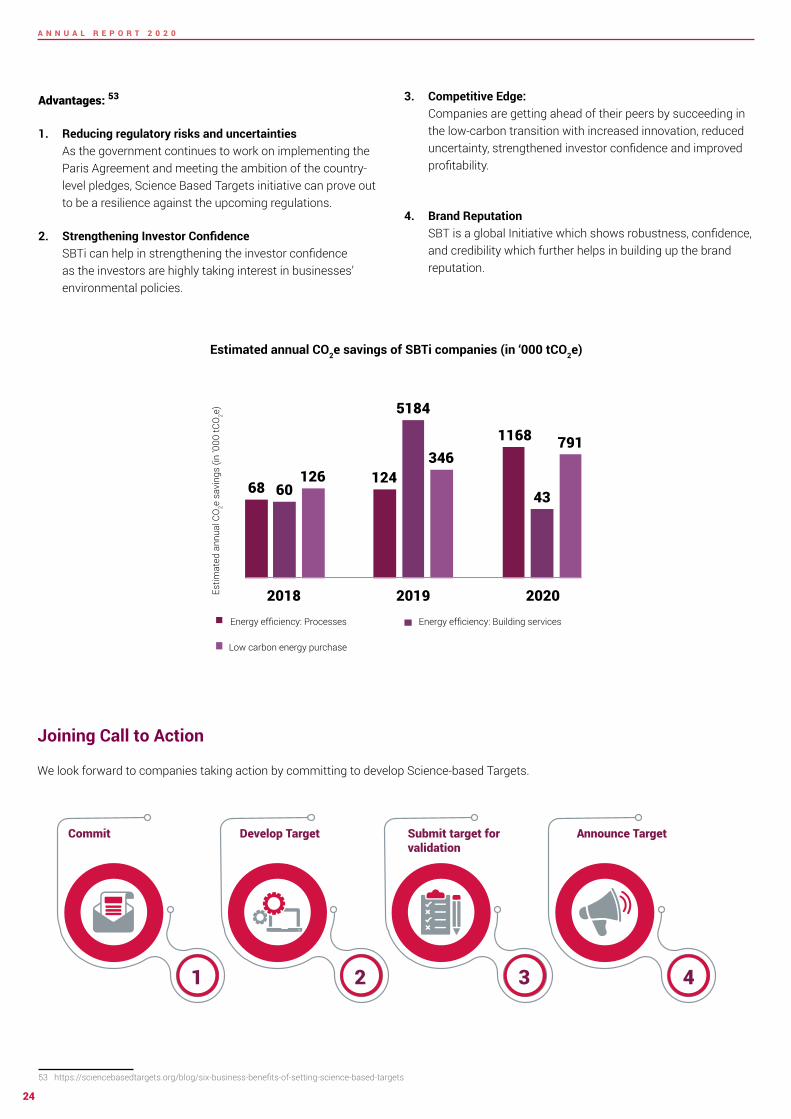
While the number of companies taking up Emission Reduction Initiatives (ERI) has grown from 53 to 58 the number of initiatives has declined from 293 to 287 resulting in a 13 decrease in the estimated annual CO2e savings this year
Energy efficiency in production processes and in buildings continue to account for most ERIs non-energy industrial process emission reductions have been outweighed in their CO2e saving potential
Other emission reduction initiatives such as upgrading equipment with high-efficiency alternatives and digitisation initiatives undertaken by banks accounted for the highest estimated CO2e savings In terms of the highest monetary savings energy efficiency in production processes contributed to 76 of monetary savings followed by energy-efficiency in building services
The steel sector had the highest number of initiatives for energy efficiency in production process and accounted for
of total estimated annual CO2e savings
88Monetary Savings from Emission Reduction Initiatives
Annual monetary savings (Million `) No of Initiatives
20611 1918 576 237 148Energy
efficiency in production processes
Non-energy industrial process
emissions reductions
Other initiative
Waste reduction
and material circularity
Energy efficiency in
buildings
150
63 1210
2
Emission Reduction Initiatives
6340 2772 2574 2016 1278
6310
150
122
Other initiatives
Non-energy industrial process
emissions reductions
Energy efficiency in production processes
Waste reduction
and material circularity
Energy efficiency in
buildings
No of InitiativesEstimated annual CO2e savings (MtCO2e)
21
A N N U A L R E P O R T 2 0 2 0
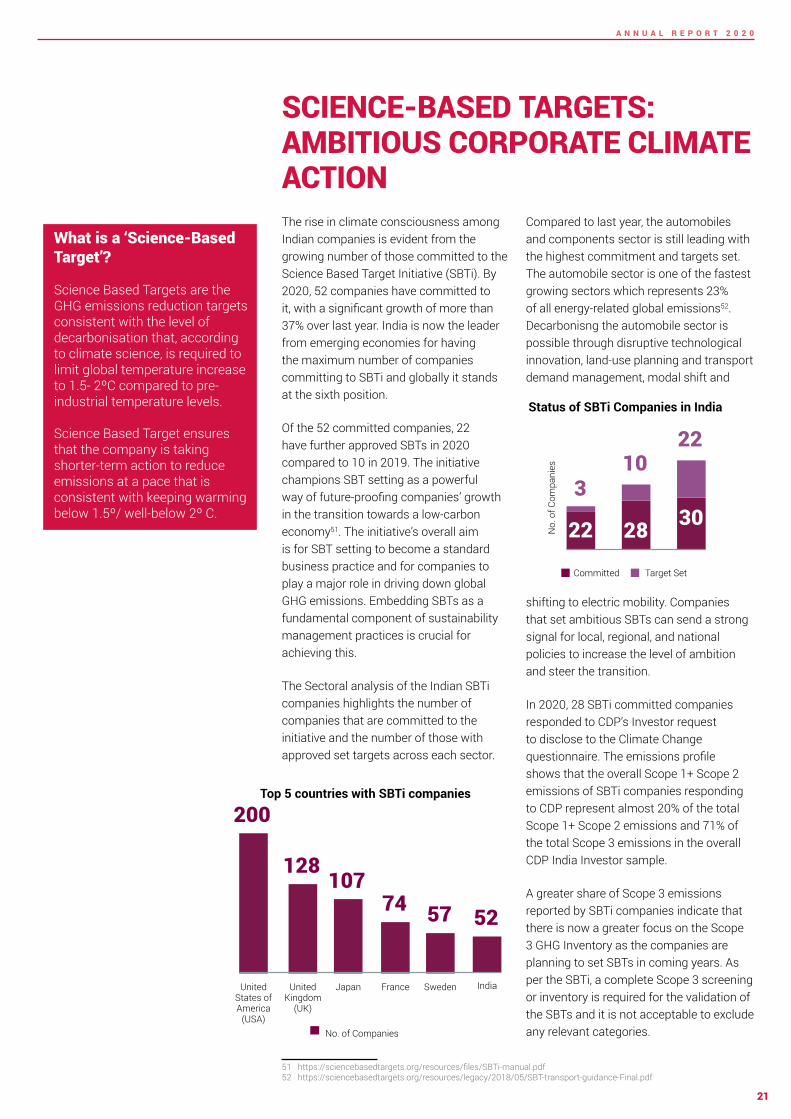
The rise in climate consciousness among Indian companies is evident from the growing number of those committed to the Science Based Target Initiative (SBTi) By 2020 52 companies have committed to it with a significant growth of more than 37 over last year India is now the leader from emerging economies for having the maximum number of companies committing to SBTi and globally it stands at the sixth position
Of the 52 committed companies 22 have further approved SBTs in 2020 compared to 10 in 2019 The initiative champions SBT setting as a powerful way of future-proofing companiesrsquo growth in the transition towards a low-carbon economy51 The initiativersquos overall aim is for SBT setting to become a standard business practice and for companies to play a major role in driving down global GHG emissions Embedding SBTs as a fundamental component of sustainability management practices is crucial for achieving this
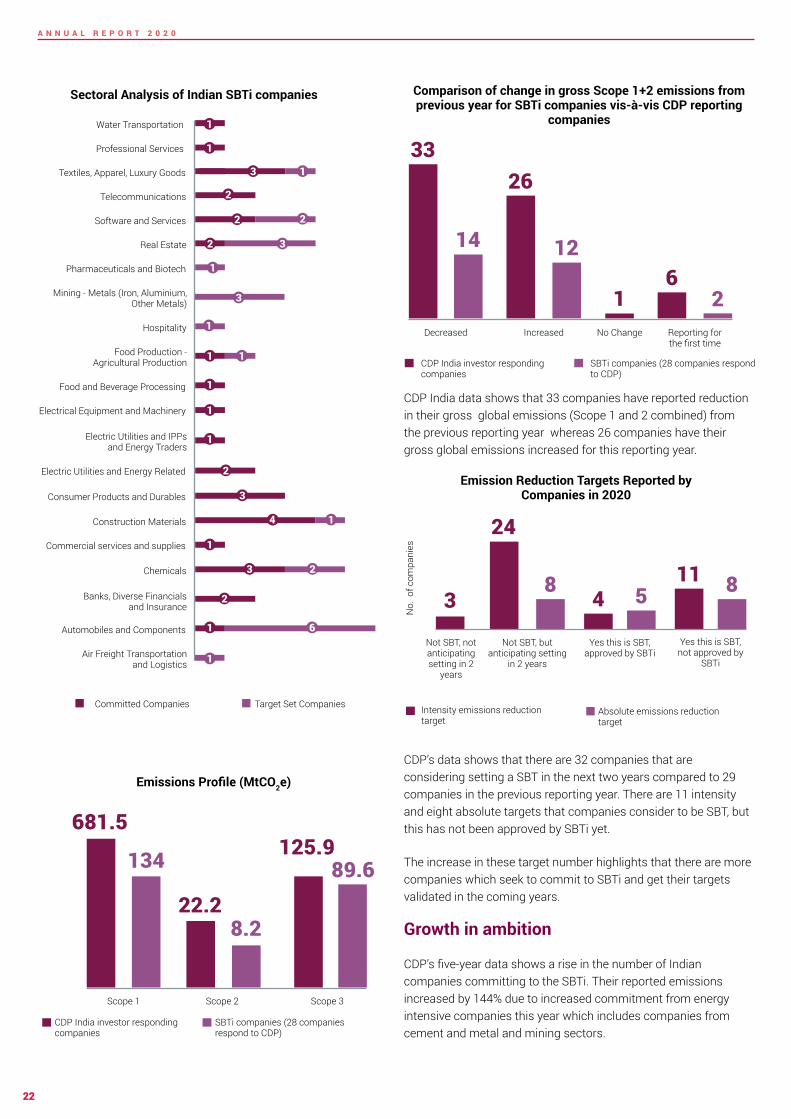
The Sectoral analysis of the Indian SBTi companies highlights the number of companies that are committed to the initiative and the number of those with approved set targets across each sector
51 httpssciencebasedtargetsorgresourcesfilesSBTi-manualpdf52 httpssciencebasedtargetsorgresourceslegacy201805SBT-transport-guidance-Finalpdf
Compared to last year the automobiles and components sector is still leading with the highest commitment and targets set The automobile sector is one of the fastest growing sectors which represents 23 of all energy-related global emissions52 Decarbonisng the automobile sector is possible through disruptive technological innovation land-use planning and transport demand management modal shift and
shifting to electric mobility Companies that set ambitious SBTs can send a strong signal for local regional and national policies to increase the level of ambition and steer the transition
In 2020 28 SBTi committed companies responded to CDPrsquos Investor request to disclose to the Climate Change questionnaire The emissions profile shows that the overall Scope 1+ Scope 2 emissions of SBTi companies responding to CDP represent almost 20 of the total Scope 1+ Scope 2 emissions and 71 of the total Scope 3 emissions in the overall CDP India Investor sample
A greater share of Scope 3 emissions reported by SBTi companies indicate that there is now a greater focus on the Scope 3 GHG Inventory as the companies are planning to set SBTs in coming years As per the SBTi a complete Scope 3 screening or inventory is required for the validation of the SBTs and it is not acceptable to exclude any relevant categories
What is a lsquoScience-Based Targetrsquo
Science Based Targets are the GHG emissions reduction targets consistent with the level of decarbonisation that according to climate science is required to limit global temperature increase to 15- 2ordmC compared to pre-industrial temperature levels
Science Based Target ensures that the company is taking shorter-term action to reduce emissions at a pace that is consistent with keeping warming below 15ordm well-below 2ordm C
SCIENCE-BASED TARGETS AMBITIOUS CORPORATE CLIMATE ACTION
200
128107
74 57 52
United States of America
(USA)
United Kingdom
(UK)
Japan Sweden IndiaFrance
No of Companies
Top 5 countries with SBTi companies
22 28 303
No
of C
ompa
nies 10
22Status of SBTi Companies in India
Committed Target Set
22
A N N U A L R E P O R T 2 0 2 0
CDP India data shows that 33 companies have reported reduction in their gross global emissions (Scope 1 and 2 combined) from the previous reporting year whereas 26 companies have their gross global emissions increased for this reporting year
CDPrsquos data shows that there are 32 companies that are considering setting a SBT in the next two years compared to 29 companies in the previous reporting year There are 11 intensity and eight absolute targets that companies consider to be SBT but this has not been approved by SBTi yet
The increase in these target number highlights that there are more companies which seek to commit to SBTi and get their targets validated in the coming years
Growth in ambition
CDPrsquos five-year data shows a rise in the number of Indian companies committing to the SBTi Their reported emissions increased by 144 due to increased commitment from energy intensive companies this year which includes companies from cement and metal and mining sectors
CDP India investor responding companies
SBTi companies (28 companies respond to CDP)
Emissions Profile (MtCO2e)
6815
134
Scope 1 Scope 2
22282
Scope 3
1259896
NO of Companies
Water Transportation
Professional Services
Textiles Apparel Luxury Goods
Software and Services
Pharmaceuticals and Biotech
Mining - Metals (Iron Aluminium Other Metals)
Food Production - Agricultural Production
Electrical Equipment and Machinery
Electric Utilities and Energy Related
Commercial services and supplies
Air Freight Transportation and Logistics
Food and Beverage Processing
Electric Utilities and IPPs and Energy Traders
Construction Materials
Automobiles and Components
Consumer Products and Durables
Banks Diverse Financials and Insurance
Chemicals
Hospitality
Real Estate
Telecommunications
1
1
3
2
2
2
1
1
1
1
1
1
1
1
2
3
3
2
1
1
6
2
4
1
1
2
3
3
Sectoral Analysis of Indian SBTi companies
Committed Companies Target Set Companies
33
14
Decreased
26
12
Increased
62
Reporting for the first time
1No Change
CDP India investor responding companies
SBTi companies (28 companies respond to CDP)
Comparison of change in gross Scope 1+2 emissions from previous year for SBTi companies vis-agrave-vis CDP reporting
companies
Emission Reduction Targets Reported by Companies in 2020
3
Not SBT not anticipating setting in 2
years
24
8
Not SBT but anticipating setting
in 2 years
4 5
Yes this is SBT approved by SBTi
11 8
Yes this is SBT not approved by
SBTi
Intensity emissions reduction target
Absolute emissions reduction target
No
of c
ompa
nies
23
A N N U A L R E P O R T 2 0 2 0
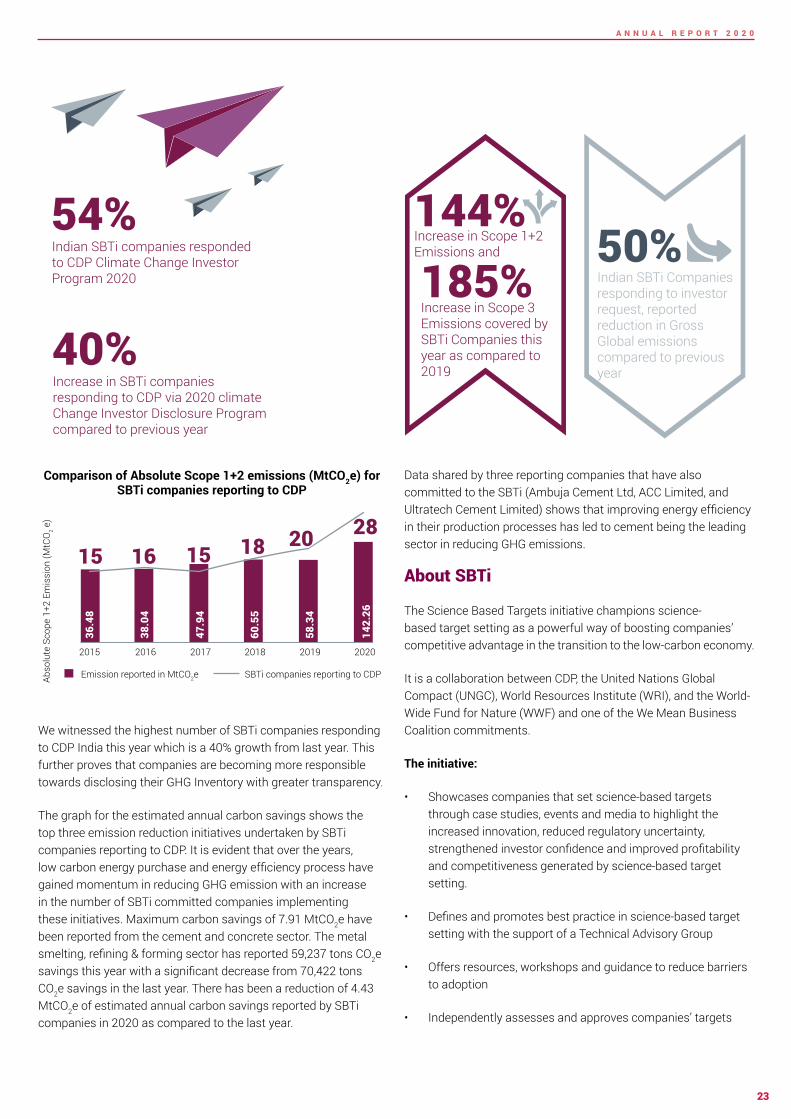
We witnessed the highest number of SBTi companies responding to CDP India this year which is a 40 growth from last year This further proves that companies are becoming more responsible towards disclosing their GHG Inventory with greater transparency
The graph for the estimated annual carbon savings shows the top three emission reduction initiatives undertaken by SBTi companies reporting to CDP It is evident that over the years low carbon energy purchase and energy efficiency process have gained momentum in reducing GHG emission with an increase in the number of SBTi committed companies implementing these initiatives Maximum carbon savings of 791 MtCO2e have been reported from the cement and concrete sector The metal smelting refining amp forming sector has reported 59237 tons CO2e savings this year with a significant decrease from 70422 tons CO2e savings in the last year There has been a reduction of 443 MtCO2e of estimated annual carbon savings reported by SBTi companies in 2020 as compared to the last year
Data shared by three reporting companies that have also committed to the SBTi (Ambuja Cement Ltd ACC Limited and Ultratech Cement Limited) shows that improving energy efficiency in their production processes has led to cement being the leading sector in reducing GHG emissions
About SBTi
The Science Based Targets initiative champions science-based target setting as a powerful way of boosting companiesrsquo competitive advantage in the transition to the low-carbon economy
It is a collaboration between CDP the United Nations Global Compact (UNGC) World Resources Institute (WRI) and the World-Wide Fund for Nature (WWF) and one of the We Mean Business Coalition commitments
The initiative
bull Showcases companies that set science-based targets through case studies events and media to highlight the increased innovation reduced regulatory uncertainty strengthened investor confidence and improved profitability and competitiveness generated by science-based target setting
bull Defines and promotes best practice in science-based target setting with the support of a Technical Advisory Group
bull Offers resources workshops and guidance to reduce barriers to adoption
bull Independently assesses and approves companiesrsquo targets
Indian SBTi companies responded to CDP Climate Change Investor Program 2020
54
Increase in SBTi companies responding to CDP via 2020 climate Change Investor Disclosure Program compared to previous year
40
Increase in Scope 1+2 Emissions and
Indian SBTi Companies responding to investor request reported reduction in Gross Global emissions compared to previous year
Increase in Scope 3 Emissions covered by SBTi Companies this year as compared to 2019
14450
185
Comparison of Absolute Scope 1+2 emissions (MtCO2e) for SBTi companies reporting to CDP
Emission reported in MtCO2e SBTi companies reporting to CDP
15 16 15 18 20 28
2015 2016 2017 2018 2019 2020
Abso
lute
Sco
pe 1
+2 E
mis
sion
(MtC
O2 e
)
364
8
380
4
479
4
605
5
583
4
142
26
24
A N N U A L R E P O R T 2 0 2 0
Advantages 53
1 Reducing regulatory risks and uncertainties As the government continues to work on implementing the Paris Agreement and meeting the ambition of the country-level pledges Science Based Targets initiative can prove out to be a resilience against the upcoming regulations
2 Strengthening Investor Confidence SBTi can help in strengthening the investor confidence as the investors are highly taking interest in businessesrsquo environmental policies
53 httpssciencebasedtargetsorgblogsix-business-benefits-of-setting-science-based-targets
3 Competitive Edge Companies are getting ahead of their peers by succeeding in the low-carbon transition with increased innovation reduced uncertainty strengthened investor confidence and improved profitability
4 Brand Reputation SBT is a global Initiative which shows robustness confidence and credibility which further helps in building up the brand reputation
Estimated annual CO2e savings of SBTi companies (in lsquo000 tCO2e)
2
Develop Target
3
Submit target for validation
4
Announce Target
1
Commit
Joining Call to Action
We look forward to companies taking action by committing to develop Science-based Targets
68
Energy efficiency Processes
Low carbon energy purchase
Energy efficiency Building services
Estim
ated
ann
ual C
O2e
sav
ings
(in
000
tCO
2e)
60126
2018 2019 2020
124
5184
346
43
7911168
25
A N N U A L R E P O R T 2 0 2 0
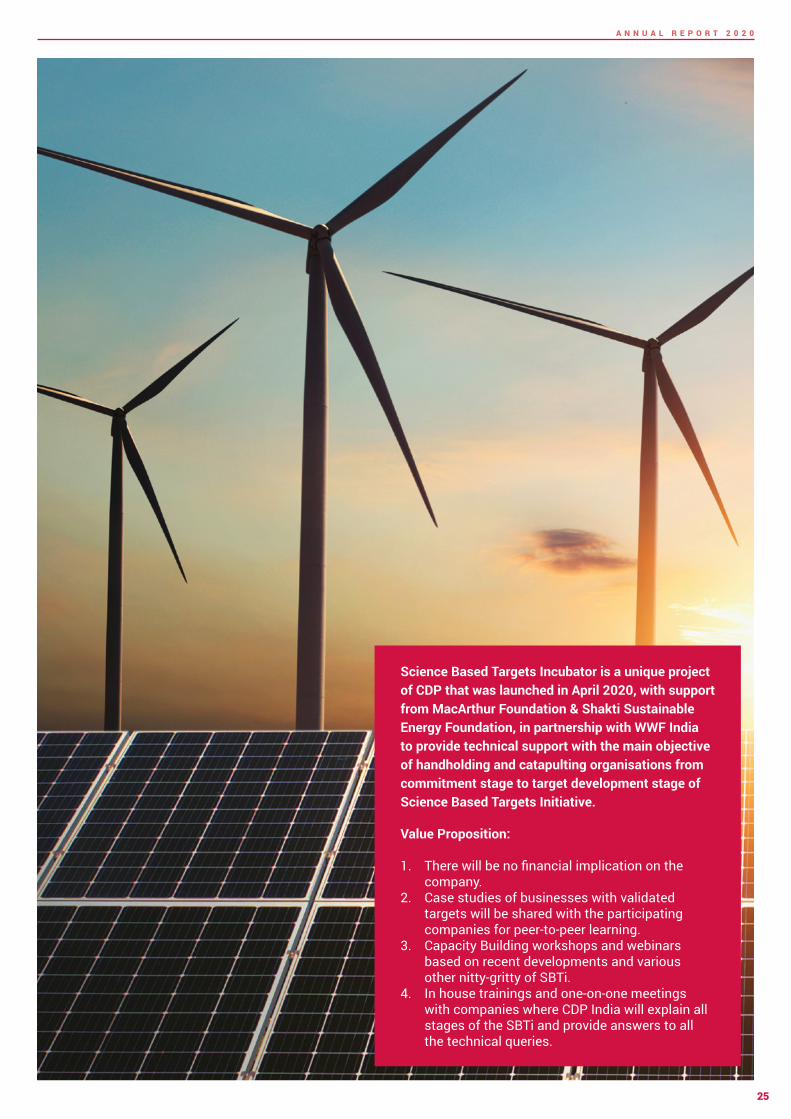
Science Based Targets Incubator is a unique project of CDP that was launched in April 2020 with support from MacArthur Foundation amp Shakti Sustainable Energy Foundation in partnership with WWF India to provide technical support with the main objective of handholding and catapulting organisations from commitment stage to target development stage of Science Based Targets Initiative Value Proposition
1 There will be no financial implication on the company
2 Case studies of businesses with validated targets will be shared with the participating companies for peer-to-peer learning
3 Capacity Building workshops and webinars based on recent developments and various other nitty-gritty of SBTi
4 In house trainings and one-on-one meetings with companies where CDP India will explain all stages of the SBTi and provide answers to all the technical queries
26
A N N U A L R E P O R T 2 0 2 0
BUSINESS AMBITION FOR 15degC
lsquoBusiness Ambition for 15degCrsquo is an urgent call to action from a global coalition of UN agencies business and industry leaders Businesses can make a critical contribution to limit the worst impacts of climate change by setting a net-zero target in line with 15degC future57
So far over 300 companies representing more than $36 trillion in market cap have responded to the open letter from global leaders and signed the Business Ambition for 15degC commitment
bull In India 13 companies55 have already aligned and set their target with the most ambitious aim of the Paris Agreement to level global temperature rise to 15degC above preindustrial levels
bull Automobiles and Components and Real Estate are the top sectors that have approved targets aligning with 15degC Ambition
bull In India 13 companies are further committed to Business Ambition for 15degC
bull All the companies in the Real Estate sector from India have approved targets aligning with 15degC Scenario
54 httpssciencebasedtargetsorgbusiness-ambition-for-1-5c55 Mahindra Logistics Ltd Mahindra Heavy Engines Ltd White House Dr Reddys Laboratories Ltd Mahindra EPC Irrigation Limited Swaraj Engines Limited Gromax Agri Equipment
Limited Mahindra Accelo Mahindra Holidays and Resorts India Limited Mahindra Lifespaces Developers Limited Mahindra World City (Jaipur) Ltd Mahindra World City Developers Ltd and Polygenta Technologies Limited
56 httpssciencebasedtargetsorgnet-zero
Net zero a north star for climate action
According to the latest report by the IPCC to limit global warming to 15degC above pre-industrial levels and to avoid the most disastrous impacts of climate change the world must halve CO2 emissions by around 2030 and reach net-zero CO2 emissions by 2050
Companies are increasingly adopting the net-zero climate targets by recognising the importance of keeping global warming to 15degC Between July 2019 and June 2020 over 230 companies committed to reach net-zero emissions as part of the Business Ambition for 15degC campaign an urgent call-to-action for companies to set emissions reduction targets in line with a 15degC future The campaign is led by the SBTi and supported by a global coalition of UN leaders business organisations and NGOs56
27
A N N U A L R E P O R T 2 0 2 0
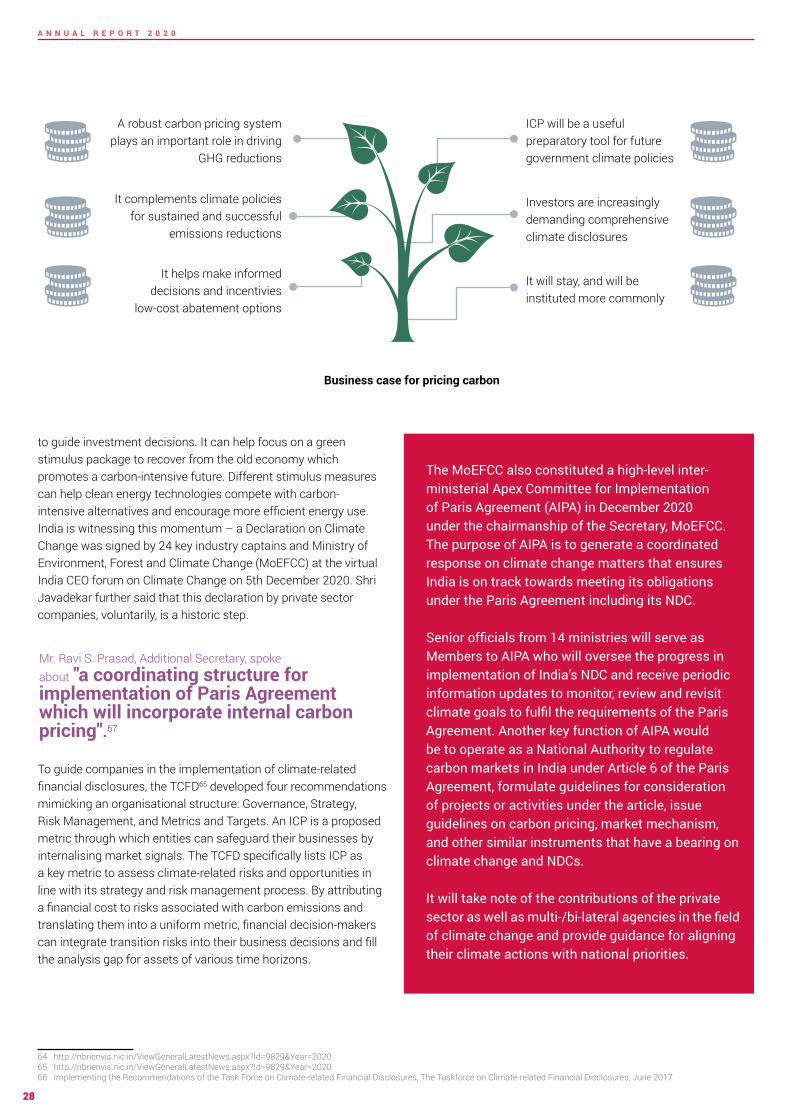
A carbon price is a cost applied to carbon pollution to discourage polluters Economists agree a carbon price is the single most effective tool for countries to reduce their emissions57 Corporations have been using internal carbon pricing (ICP) as a strategy to manage climate-related business risks and prepare for the transition to a low-carbon economy Carbon pricing policies create strong transparent incentives for firms to internalise the social costs of carbon emissions58 Major investors and financial regulators are calling for businesses to disclose their climate risks and their policies to mitigate emissions59 The most sought-after benefits are that a company can use ICP both as a risk management tool and as a part of its decarbonisation strategy
To see how fast carbon pricing is spreading consider Paragraph 136 of the decision text of the Paris Agreement ldquoproviding incentives for emission reduction activities including tools such as domestic policies and carbon pricingrdquo The final agreement recognised carbon pricingrsquos importance as a powerful incentive to cut emissions by companies and regional state and local governments
The IPCC special report on the impacts of global warming of 15 degC above pre-industrial levels states that an explicit carbon pricing mechanism can theoretically achieve cost-effective emission reductions Along with best practice policies a moderate carbon pricing can help reduce global CO2 emissions significantly60 Parties are encouraged to set prices consistent with Carbon Pricing Leadership Coalitionrsquos
57 What is a carbon price and why do we need one58 Energy the Environment and Technological Change59 Firms ignoring climate crisis will go bankrupt says Mark Carney60 An I P C C Special Report on the impacts of global warming of 15 C above pre-industrial levels and related global
greenhouse gas emission pathways in the context of strengthening the global response to the threat of climate change sustainable development and efforts to eradicate poverty Intergovernmental Panel on Climate Change (2018)
61 Carbon Pricing WBCSD policy paper 2019httpsdocswbcsdorg201909Carbon-Pricing-WBCSD-Policy-Paper-2019pdf WBCSD 2019
62 SHOULD EVERY COUNTRY ON EARTH COPY SWEDENrsquoS CARBON TAX63 httpswwwedienetregistrationregwall
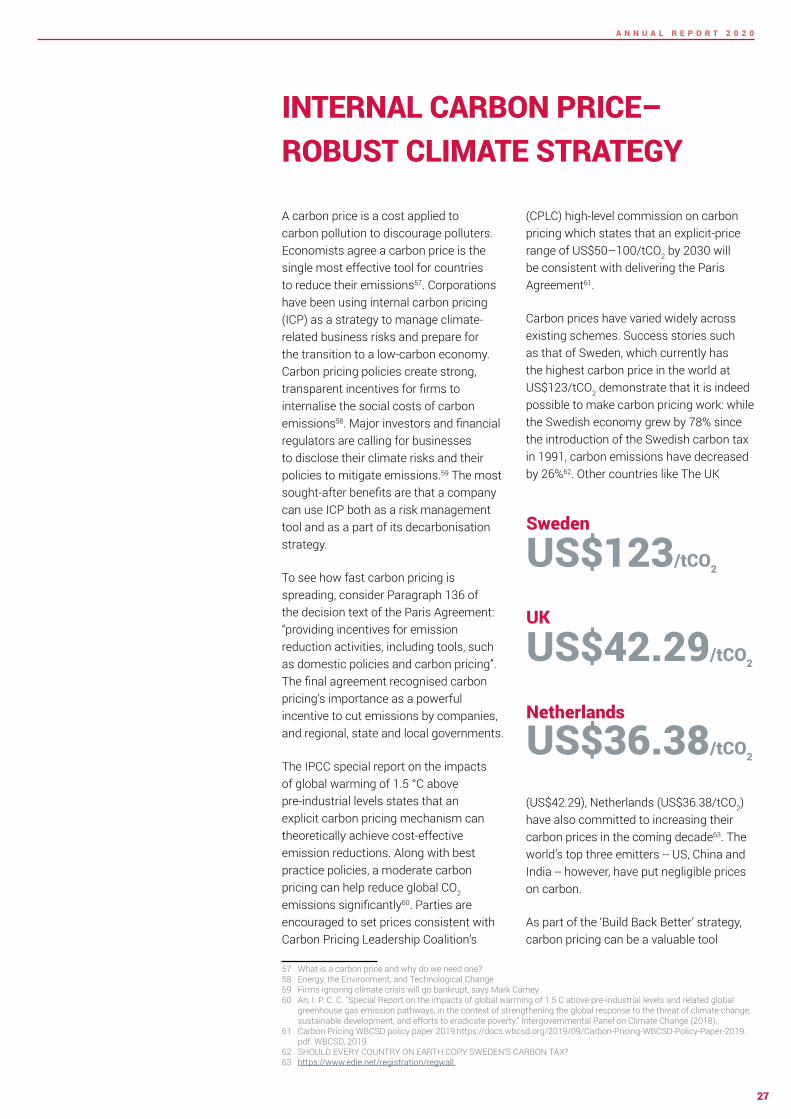
(CPLC) high-level commission on carbon pricing which states that an explicit-price range of US$50ndash100tCO2 by 2030 will be consistent with delivering the Paris Agreement61
Carbon prices have varied widely across existing schemes Success stories such as that of Sweden which currently has the highest carbon price in the world at US$123tCO2 demonstrate that it is indeed possible to make carbon pricing work while the Swedish economy grew by 78 since the introduction of the Swedish carbon tax in 1991 carbon emissions have decreased by 2662 Other countries like The UK
(US$4229) Netherlands (US$3638tCO2) have also committed to increasing their carbon prices in the coming decade63 The worldrsquos top three emitters -- US China and India -- however have put negligible prices on carbon
As part of the lsquoBuild Back Betterrsquo strategy carbon pricing can be a valuable tool
US$123tCO2
Sweden
US$4229tCO2
UK
US$3638tCO2
Netherlands
INTERNAL CARBON PRICEndash ROBUST CLIMATE STRATEGY
28
A N N U A L R E P O R T 2 0 2 0
to guide investment decisions It can help focus on a green stimulus package to recover from the old economy which promotes a carbon-intensive future Different stimulus measures can help clean energy technologies compete with carbon-intensive alternatives and encourage more efficient energy use India is witnessing this momentum ndash a Declaration on Climate Change was signed by 24 key industry captains and Ministry of Environment Forest and Climate Change (MoEFCC) at the virtual India CEO forum on Climate Change on 5th December 2020 Shri Javadekar further said that this declaration by private sector companies voluntarily is a historic step
To guide companies in the implementation of climate-related financial disclosures the TCFD65 developed four recommendations mimicking an organisational structure Governance Strategy Risk Management and Metrics and Targets An ICP is a proposed metric through which entities can safeguard their businesses by internalising market signals The TCFD specifically lists ICP as a key metric to assess climate-related risks and opportunities in line with its strategy and risk management process By attributing a financial cost to risks associated with carbon emissions and translating them into a uniform metric financial decision-makers can integrate transition risks into their business decisions and fill the analysis gap for assets of various time horizons
64 httpnbrienvisnicinViewGeneralLatestNewsaspxId=9829ampYear=202065 httpnbrienvisnicinViewGeneralLatestNewsaspxId=9829ampYear=202066 Implementing the Recommendations of the Task Force on Climate-related Financial Disclosures The Taskforce on Climate-related Financial Disclosures June 2017
Mr Ravi S Prasad Additional Secretary spoke about a coordinating structure for implementation of Paris Agreement which will incorporate internal carbon pricing67
The MoEFCC also constituted a high-level inter-ministerial Apex Committee for Implementation of Paris Agreement (AIPA) in December 2020 under the chairmanship of the Secretary MoEFCCThe purpose of AIPA is to generate a coordinated response on climate change matters that ensures India is on track towards meeting its obligations under the Paris Agreement including its NDC
Senior officials from 14 ministries will serve as Members to AIPA who will oversee the progress in implementation of Indiarsquos NDC and receive periodic information updates to monitor review and revisit climate goals to fulfil the requirements of the Paris Agreement Another key function of AIPA would be to operate as a National Authority to regulate carbon markets in India under Article 6 of the Paris Agreement formulate guidelines for consideration of projects or activities under the article issue guidelines on carbon pricing market mechanism and other similar instruments that have a bearing on climate change and NDCs
It will take note of the contributions of the private sector as well as multi-bi-lateral agencies in the field of climate change and provide guidance for aligning their climate actions with national priorities
ICP will be a useful preparatory tool for future government climate policies
Investors are increasingly demanding comprehensive climate disclosures
It will stay and will be instituted more commonly
A robust carbon pricing system plays an important role in driving
GHG reductions
It complements climate policies for sustained and successful
emissions reductions
It helps make informed decisions and incentivies
low-cost abatement options
Business case for pricing carbon
29
A N N U A L R E P O R T 2 0 2 0
When disclosing on ICP the TCFD recommends that companies should disclose on the followingbull what assumptions are made about how carbon price(s)
would develop over time (within tax andor emissions trading frameworks)
bull geographic scope of implementationbull whether the carbon price would apply only at the mar-
gin or as a base costbull whether the price is applied to specific economic sec-
tors or across the whole economy and in what regionsbull whether a common carbon price is used (at multiple
points in time) or differentiated prices bull assumptions about scope and modality of a CO2 price
via tax or trading scheme
67 httpswwwgreentechmediacomarticlesreadeuropean-oil-majors-ready-to-scale-up-energy-transition-investment68 httpswwwgreenbizcomarticlebp-walks-away-three-us-trade-groups-over-carbon-pricing69 Convention on Biological Diversity ndash Markets for Carbon Offsets Accessible at httpswwwcbdintfinancialoffsetsg-offsetclimatecarbonpdf page 8
Earlier this year BP one of Europersquos oil supermajors announced a carbon price of US$100tonne of CO2 a giant increase from their previous price of US$4067 and walked away from three US-based oil and gas trade organisations - American Fuel and Petrochemical Manufacturers (AFPM) the Western States Petroleum Association (WSPA) and the Western Energy Alliance (WEA) over differences regarding policy positions on carbon pricing68
CDP has been asking companies to disclose their practice of using ICP since 2013 In 2020 23 of the investor responding companies have reported putting a price on carbon as compared to last yearrsquos 19 while the number of companies planning to price in the next two years reduced to 21 from 23 in 2019 After adding Supply Chain responding companies a total of 58 companies are pricing or are planning to price carbon in the next two years in 2020 a 12 increase from 2019 It was further seen that of the 23 companies that are pricing carbon in 2020 52 use a shadow price followed by implicit price
The Task Force defines an internal carbon price as ldquoan internally developed estimated cost of carbon emissionsrdquo which can be used as a planning tool to help identify revenue opportunities and risks as an incentive to drive energy efficiencies to reduce costs and to guide capital investment decisions69
52
26
4
9
44
Shadow price
Implicit price
Implicit price Internal fee
Internal fee
Offsets
Implicit price Shadow price
Types of ICP used by Indian companies
Pricing Planning to price in the next 2 years
2
25
2015
8
36
2016 2017
26
14
2018
14
32
2019
20
31
2020
2533
No
of C
ompa
nies
ICP trend in India
30
A N N U A L R E P O R T 2 0 2 0
Type of ICP Shadow price Carbon fee Implicit price Internal trading
Description Hypothetical cost of carbon emissions
A per-unit fee based on the amount of GHG the company emits (eg `700 per tCO2e)
Helps quantify the capital investments required to meet climate-related targets
Allows business units within a company to trade their allocated carbon credits based on respective emissions
Objectivesusage
The most common form of ICP is a shadow price helps organisations better understand the impacts of climate-related risks such as technological shifts or future regulations It can help a company with both risk management as well as internal strategic planning
It allows companies to model or test how a range of carbon prices affect their divisions capital investments and other planned projects It is similar to forecasting with a range of energy prices
Putting a fee on carbon helps create an actual pool of funds generating a revenue stream to help pave the way for greener projects and further RampD This prepares a company for a carbon-resilient world This tool has the ability to encourage a business to transform into an environmental leader It allows for the creation of internal funds to invest into energy efficiency or renewable energy projects in order to cut energy costs
It also builds awareness of the importance of emission reductions within different business units
An implicit price helps companies understand their initial carbon footprint and is also used as a benchmark to implement a more strategic internal price
Internal trading helps create awareness It allows companies to prepare for stringent forms such as shadow prices or internal fees
Method An additional criterion is introduced in investment analysis during the calculation of the internal rate of return (IRR)
The additional criterion is the carbon value which is incorporated into each investment decision and applied to resulting GHG emissions This carbon price is assumed the same way assumptions are made about exchange rates or commodity prices
It is implemented by voluntarily adding a cost to GHG emissions in relation to operational costs
It increases the operating expenses (OPEX)
There are short-term emissions reductions Transfers of actual funds within the company are done through two mechanisms First by offsetting GHG emissions by purchasing offset credits externally Second by providing internal financing for emission reduction projects low- carbon products amp services and RampD
The carbon fee also provides monetary incentives for pro-environment initiativesactivities
Some companies with emissions reduction or renewable energy targets calculate their lsquoimplicit carbon pricersquo by dividing the cost of abatement procurement by the tonnes of CO2e abated
Trading is driven by the allocation of a fixed number of carbon dioxide emission lsquoallowancesrsquo for individual business units with each allowance equivalent to 1 metric tCO2 If business units exceed their cap they must purchase additional allowances to offset their excess emissions
Where business units under-emit they may sell allowances Business units may also choose to invest in carbon offsets outside their own units in order to sell on the internal trading scheme72
A sectoral analysis of the data finds two high emissions intensive sectors cement and concrete followed by IT and software development An increasing number of companies from cement and IT sectors are now committing to the SBTi and moving towards aligning emissions in line with 15-degree an ICP in such cases can be effectively used as a tool for mitigating climate risks and achieving the greater goal of a SBT or a net-zero target It helps companies build their internal capacity and measure their progress
1313
2626
2222
1313
44 44
1818
Metal smelting refining amp forming
Cement amp concrete
IT amp software development
Biotech amp pharmaFood amp beverage
processing
Chemicals
Transportation equipment
31
A N N U A L R E P O R T 2 0 2 0
Below are the ICP disclosed by Indian companies in 2020
Company Price in INR (`) Price in USD ($) Type of ICP used
ACC 2541 3394 Implicit price Shadow price
Ambuja Cements 21639 3074 Implicit price
Dalmia Bharat Ltd 77334 11 Shadow price
Dr Reddyrsquos Laboratories 937 1332 Implicit price
Godrej Consumer Products Limited 750 10 Shadow price
Godrej Industries 740 10 Shadow price
Hero Motocorp Ltd private private private
Hindustan Zinc 111846 159 Implicit price
Infosys Limited 100182 1425 Implicit price
JSW Cement Limited 1566 21 Shadow price
JSW Steel Ltd 1400 20 Shadow price
Mahindra amp Mahindra 98242 1397 Internal fee
Mindtree Ltd private private private
Shree Cement private private private
Tata Chemicals 140607 20 Shadow price
Tata Consultancy Services 1131 1608 Implicit price Shadow price
Tata Consumer Products Ltd 315 448 Offsets
Tata Motors 980 14 Shadow price
Tata Steel 975 - 2720 15 -3868 Implicit price Shadow Price
Tech Mahindra 70303 10 Implicit price Internal fee
Ultratech Cement 750 1066 Shadow price
Wipro 352291 5011 Shadow price
Since these companies did not provide a conversion rate the average conversion rate for the 2019 calendar year was taken (1` = 0014224USD)
Managing climate risk with Internal Carbon Price and Science Based Targets
By integrating ICP into ambitions targets set by SBT companies can achieve greater emissions reduction SBTs empower companies to engage internal teams with a common data-driven goal and integrate their carbon reduction strategies with other business objectives70 A step that organisations can take to implement TCFD recommendations as well as achieve their SBTs is putting an internal price on carbon It is observed that having an internal carbon price can enhance an organisationrsquos competitiveness71 Several companies are already using ICP to highlight their progress towards targets and inform a business case for low-carbon investments Of the 25 companies that have disclosed to CDP in 2020 13 that committed to SBTi also have an ICP
Setting a carbon price can be a strong commitment towards driving change and action Clear goals for the ICP enable
70 Science-Based Targets How Aligning Carbon Reduction Targets With Climate Science Can Drive Business Growth SampP Dow Jones Indices 201771 httpswwwgreenbizcomarticlemanaging-climate-risk-carbon-pricing-and-science-based-targets72 CDP Handbook on Carbon Pricing73 httpswwwcdpnetenreportsdownloads491874 httpsb8f65cb373b1b7b15feb-c70d8ead6ced550b4d987d7c03fcdd1dsslcf3rackcdncomcmsreportsdocuments000002771originalCDP-Carbon-Pricing-Handbook
pdf1508927220
companies to make better decisions regarding the type and price of carbon72 A high-level commitment can provide a companyrsquos perspective and insight on how other companies have been able to adopt innovative financing practices such as ICP and carbon taxes which are spurred by setting ambitious targets in line with the SBT initiative
In January 2020 in partnership with TERI CDP India released a second handbook in ICP - Putting a Price on Carbon A Handbook for Indian Companies 20 73 a second edition to the handbook released in October 17 74The first handbook was prepared to lay out the landscape of carbon pricing and help companies understand about external and ICP along with guidance on how to approach an internal carbon price The aim of the second handbook was to further mobilise the adoption of internal carbon price by companies The handbook discusses steps to arrive at a price and use it in an organisation including details on indicative pricing levels
32
A N N U A L R E P O R T 2 0 2 0
ACC Ltd are using internal carbon price as a tool to drive and incentivise low-carbon initiatives and emissionenergy reduction projects We have observed that ICP helps ROI to look attractive and helps us make informed decisions
ACC Ltd has already committed and published their 2030 targets for specific CO2 emission reduction and use of waste derived resources (as a part of SD 2030 plan) We have also committed to SBTi and are working on setting stricter targets aligning with below 2 DS To achieve these commitments and relevant targets we believe that ICP may play an important role in prioritising our future actions and investments Going forward we also plan to use the ICP for managing risk and leveraging opportunities
mdash ACC Ltd
Steps to Setting an
internal carbon price
Make a commitment
Communicate your progress
Set the scope of the internal carbon price
Decide price level and variance
Monitoring and reporting
Define the type of ICP
01
02
03
0405
06
07
08
Map your objectives
Establish the degree of influence in business application
33
A N N U A L R E P O R T 2 0 2 0
THE RENEWABLE ENERGY THRUST In 2020 the 67 companies headquartered in India have reported a total of 291 Terra Watt hours (TWh) electricity consumption more than double the previous yearrsquos number Notably the significant increase in total electricity consumption is attributed to just one company ndash Vedanta Limited with 151 TWh of electricity consumption for its global operations
The total electricity consumption excluding Vedanta is 140 TWh 48 higher than the previous year The rise in the total reported electricity consumption is primarily due to an increase in the number of responding companies from the energy intensive sectors These 67 companies have consumed about 16 TWh renewable electricity which is 6 of the total electricity consumption reported in 2020 The share of renewable electricity is 11 without counting Vedanta in the sample This is 6 higher than the previous year
The growth in the share of renewable electricity consumption is due to multiple factors such as the increasing number of voluntary corporate GHG emission reduction targets renewable energy targets and compliance targets such as Renewable Energy Purchase Obligations (RPO) In 2020 18 companies from India have reported various types of renewable energy targets Some of these companies have taken more than one renewable energy target type These 18 companies have reported 98 TWh of electricity consumption of which 13 is from renewable energy sources The level
Type of renewable energy targets
Renewable Energy Targets
17
1 1 2Renewable Electricity
Consumption
Renewable Electricity
Production
Renewable Electricity Capacity
Renewable Energy Financing
Target
No
of C
ompa
nies
RE100 is the global corporate renewable energy initiative bringing together hundreds of large and ambitious businesses committed to 100 renewable electricity Led by the Climate Group and in partnership with CDP RE100rsquos mission is to accelerate change towards zero carbon grids at scale There are 4 companies headquartered in India that have committed to the RE100 initiative - Dalmia Bharat Ltd Infosys Ltd Mahindra Holidays amp Resorts India Ltd and Tata Motors Ltd
The RE100 membership continues to grow and diversify - with 42 of new members coming from the Asia-Pacific region in 2020 With 260+ members and gt278 TWh of electricity consumption aggregated electricity demand of RE100 members is higher than Australiarsquos The share of renewable electricity is 42 of total consumption showing strong progress towards 100 goal
Over 70 global RE100 members have operations in India ndash with gt2 TWh of electricity consumption in the country About 39 of electricity consumed in India came from renewable energy sources largely sourced through unbundled energy attribute certificates and power purchase agreements
Visit RE100org and follow RE100 on Twitter
34
A N N U A L R E P O R T 2 0 2 0
Note Some companies have reported renewable electricity consumption total instead of break-down details as per the sourcing method Data for those companies is not included in the above chart
131
17
03
01
Renewable Electricity Sourcing Methods (TWh)
Self-generation
Unbundled Energy Attribute Certificates (EACs)
Power Purchase Agreement (PPA)
Green Electricity Products
of ambition ie a share of renewable energy in the target year for most of the companies varies between 20-100 Showing the leadership in renewable electricity sourcing 3 companies75 have committed to source 100 renewable electricity across their operations and joined RE100 initiative
GHG emission reduction targets are popular among companies in India and 57 companies have reported absolute intensity or both absolute and intensity targets Among these 30 companies have committed to science-based targets Initiative and their targets are in line with climate science Six companies have dedicated scope 2 emission reduction targets Scope 2 emissions are indirect emissions from the generation of purchased energy consumed by the reporting company Companies with GHG emission reduction targets tend to source renewable energy to reduce their emissions primarily scope 2 emissions The Majority of these companies have taken exclusive renewable energy targets to support meeting their GHG emission reduction targets
Renewable energy plays an important role in the corporate value chain due to its zero-carbon intensity and ability to provide long-term energy security About 34 companies have identified opportunities related to shifting energy usage towards low-carbon energy sources across the value chain Of these 32 have identified opportunities in the direct operations followed by 6 companies in the upstream and 2 in the downstream of the value chain These companies have estimated energy related opportunities worth `317 billion mainly in the direct operations Half of these companies anticipate short time frame (1-5 years) to tap these
75 4 India headquartered companies are committed to the RE100 initiative 3 of them report to CDPrsquos climate questionnaire
opportunities Companies have not just identified energy related opportunities but implemented energy related initiatives in the reporting year across their operations About 31 companies have implemented low-carbon energy consumption or production related initiatives in the reporting year that resulted in an estimated annual carbon savings of 18 million tCO2 and `27 billion of annual monetary savings
Companies from the manufacturing and materials sectors have reported the highest volume -14 TWh of renewable electricity consumption Manufacturing sector companies are relatively performing better than companies from the materials sector in terms of the share of renewable energy in total electricity consumption There are 25 companies from these two sectors mainly energy intensive business such as cement metals and mining steel and transport original equipment manufacturers (OEMs) The aggregate electricity consumption of these companies is over 100 TWh The companies from the fossil fuel-based energy generation are not included in the following charts
A detailed breakdown shows that self-generation of renewable electricity is the most preferred sourcing option among companies followed by purchase of renewable electricity through unbundled Energy Attribute Certificates (EACs) and Power Purchase Agreement (PPA) with an onsiteoffsite generator Up to 10 companies have reported 03 TWh of total renewable electricity consumption via PPA (on-grid and off-grid) which has declined from 11 TWh of consumption reported in the previous year
35
A N N U A L R E P O R T 2 0 2 0
Materials Manufacturing Food beverage amp agriculture
Biotech health care amp pharma
OtherInfrastructureServices
3
17
6
35
3
20
12
Total Electricity Consumption (TWh) Total RE Consumption (TWh) RE
Electricity consumption by sector with Vedanta Limited included in the analysis
Electricity consumption by sector excluding Vedanta Limited
Materials Manufacturing Food beverage amp agriculture
Biotech health care amp pharma
OtherInfrastructureServices
7
17
35
20
1236
Total Electricity Consumption (TWh) Total RE Consumption (TWh) RE
TWh
TWh
36
A N N U A L R E P O R T 2 0 2 0
2737worth opportunities
identified
Billion
`
16of Renewable Electricity Consumption Reported
TWh
704of total [ Scope
1+2location-based] emissions reported
MtCO2e
7138Inherent financial
risk identified
Billion
`
25have Internal Carbon
Pricing
Companies 52Companies in India
SBTi
37
A N N U A L R E P O R T 2 0 2 0
WATER SECURITY The way out of water crisis
Five of the worldrsquos largest cities under water stress are in India with Delhi ranked second on the list76 The water crisis is more alarming than imagined ndash 600 million people in India face high-to-extreme water stress77 Indiarsquos water demand is projected to increase by two times the available supply by 2030 putting hundreds of million people at the risk of water scarcity and ultimately losing the country 6 of its GDP78 In 2019 the country witnessed the worst droughts in recorded history Over 500 million people were affected across the country and major cities such as Chennai experienced lsquozero dayrsquo scenarios wherein water literally ran out Since improvements in water security are essential for Indiarsquos development investing in water merits a sound business case
Though 80 of Indian states have legislations on water conservation and prevention of encroachment of water bodies79 poor data management absence of water pricing inefficient irrigation techniques and the lack of adequate sewage treatment curb the countryrsquos ability to manage water sustainably80 In recent times companies have become more aware of the risks of increased water consumption pollution and unstable precipitation aggravated by climate change81 A 2019 World Bank Report (Quality Unknown)82 warned of the economic health and environmental damage caused by contaminated water highlighting water quality as an ldquoinvisible crisisrdquo that is under-appreciated and underestimated It warned that poor water quality driven by industrial agricultural and urban pollution could lead to a reduction by 13rd of economic growth in some places
76 httpsocialnitigovinuploadssamplewater_index_report2pdf77 httpsnitigovinsitesdefaultfiles2019-06Final20Report20of20the20Research20Study20on2020
Composite20Water20Resources20Management20Index20for20Indian20States20conducted20by20Dalberg20Global20Development20Advisors20Pvt20Ltd_New20Delhipdf
78 httpsnitigovinsitesdefaultfiles2019-06Final20Report20of20the20Research20Study20on2020Composite20Water20Resources20Management20Index20for20Indian20States20conducted20by20Dalberg20Global20Development20Advisors20Pvt20Ltd_New20Delhipdf
79 httpsocialnitigovinuploadssamplewater_index_report2pdf80 httpswwwcdpnetenarticlescompaniesindias-looming-water-crisis-a-call-to-action-for-companies81 Think globally act locally new guidance for companies on sustainable water use - CDP82 httpsopenknowledgeworldbankorghandle109863224583 httpswwwwriorgaqueduct84 Aqueduct Country Ranking (wriorg)85 The objective of the campaign is to drive further corporate transparency around climate change deforestation and water
security by encouraging companies to respond to CDPrsquos disclosure request
Water stress in India remains a key challenge Aqueduct83 ranked India 13th in the world on high water stress score -- 412 out of 584 The private sector is vital to delivering a water secure future Companies in the food textile retail energy industrial chemicals pharmaceuticals and mining sectors account for and wield influence over 70 of the worldrsquos water use and pollution The decisions one takes about how to grow and expand can make or break onersquos ability to tackle the global water crisis
CDPs Water Security program requests companies to disclose critical information on water parameters which are crucial to the business It helps companies monitor and benchmark their performance on these critical parameters to ensure adequate water availability for their businesses Investors and customers are increasingly keen to know how companies respond and adapt to water-related risks The Non-Disclosure Campaign (NDC) is an annual CDP initiative where investors can target companies that have been requested to respond but failed to do so85 Globally for water security Indian companies achieved the highest response rate to the NDC campaign with 50 of engaged companies submitting a response on this critical issue ndash 28 times higher than their control group Responding through CDPrsquos Water Security questionnaire will help businesses understand the risks and opportunities associated with water-related issues
Reduction in Economic Growth caused by power water in some countries
13rd
Water stress by 2030-ratio of withdrawals to renewable supply
People will live in water stress area by 2030
Increase in water demand in last 100 years
WRI 2020
UNEP
UN World Waterdevelopment Report 2020
increase in Water Security investor responding companies in India
8756
1in 2
x6
38
A N N U A L R E P O R T 2 0 2 0
helping them capitalise on actions to safeguard water resources86 The number of disclosing companies increased from 15 last year to 28 companies this year an increase of approximately 87
Measuring Monitoring and Verification
Regular measuring and monitoring of water-related parameters across all operations and the entire value-chain is the first step in laying the path for efficient water management In 2020 28 companies measured a total of 268 water related parameters It was found that amongst volumetric water metrics water discharge was the most monitored accounting for 41 of all measurements Water withdrawals accounted for 29 of all measurements water consumption for 10 and water recycling and reuse accounted for 10 each Although these metrics were being continuously monitored and measured by companies a sector-wide analysis shows that significant growth in some water-intensive sectors has put pressure on the demand for industrial water The electric utilities sector for example reported an increased water demand of 771174 megalitres in 2020 which was the highest amongst all sectors Adani Power Ltd highlighted new aqusitions and increased power generation as major reasons for rise in water demand this year The chemicals sector showed the second highest rise in water demand this year -- 195832 megalitres this year
Some companies have shouldered the responsibility of having audits conducted on their reported water metrics for greater
86 httpsb8f65cb373b1b7b15feb-c70d8ead6ced550b4d987d7c03fcdd1dsslcf3rackcdncomcmsreportsdocuments000000893originalCDP-india-business-case-for-water-disclosurepdf1472051621
87 https6fefcbb86e61af1b2fc4-c70d8ead6ced550b4d987d7c03fcdd1dsslcf3rackcdncomcmsreportsdocuments000005312originalAnalysis_of_CA100__Data_for_CDP_Investor_Signatories_v5pdf1596046258
88 https6fefcbb86e61af1b2fc4-c70d8ead6ced550b4d987d7c03fcdd1dsslcf3rackcdncomcmsreportsdocuments000005312originalAnalysis_of_CA100__Data_for_CDP_Investor_Signatories_v5pdf1596046258
89 https6fefcbb86e61af1b2fc4-c70d8ead6ced550b4d987d7c03fcdd1dsslcf3rackcdncomcmsreportsdocuments000005312originalAnalysis_of_CA100__Data_for_CDP_
transparency and credibility Amongst the verification standards that were employed 26 of the responding organisations used ISAE 3000 with Tata Chemicals being the sole company to apply both ISAE 3000 and AA1000AS to meet assurance standards
In 2020 25 responding companies withdrew consumed and discharged 7933064 megalitres 1403171 megalitres and 6625032 megalitres of water respectively However in 2019 these figures stood at 217736 megalitres 860517 megalitres and 67686 megalitres respectively for 15 responding companies
WATER ASPECTSWater Consumptionndash the amount of water a company has drawn into its boundaries and has permanently removed from the local water cycle90
Of the 28 respondents three did not disclose water consumption data or were in their first year of measurement 9 increased their water consumption over the previous reporting year 12 decreased it and 4 reported no change
Water Withdrawalsndash the amount of water the company has temporarily removed from the local water cycle and returned as discharge water91
Of the 28 respondents three did not disclose water withdrawal data or were in their first year of measurement 7 reported an increase over the previous year 14 had lowered their withdrawal and 4 reported no change
Water Discharges ndash the amount of water that leaves a companys facility and if left untreated could be a source of pollution92
Of the 28 respondents three did not disclose water discharge data or were in their first year of measurement 9 reported an increase in water discharge over the previous year 6 lowered it and 10 reported no change CDPrsquos data highlights new acquisitions increased production activities and project expansions as the primary reasons for increased water demand amongst the companies
of companies measured all water aspects (withdrawals discharge and consumption) across 100 of facilities
64
of companies believe that availbility of good quality freshwater is vital for the success of their business39
2910
4110
10
Water withdrawalsWater recycledreused
Water discharge
Water consumption
Others
Measured and monitored water aspects
39
A N N U A L R E P O R T 2 0 2 0
Data further shows that brackish surface water and seawater were the primary water sources for industries followed by fresh surface water source The electric utilities sector was the most reliant on brackish surface water and seawater accounting for 72 of the sectorrsquos total water withdrawals At 59 fresh surface water was the primary source of withdrawal for the chemicals sector Of the 28 companies 13 had implemented water conservation measures to reduce water withdrawals from groundwater sources this year Water withdrawals from groundwater - renewable accounted for less than 05 of total withdrawals
In terms of water discharge most (81) was released into brackish surface water and seawater environments Discharges into fresh surface water accounted for the remaining 19 of the total discharges Our data suggests more companies are installing zero liquid discharge units and water harvesting techniques across their facilities leading to less groundwater discharge
Fresh surface water accounted for 29 of total water withdrawals by source in 2020 Indiarsquos major river basins - Ganges Brahmaputra Godavari Indus and Cauvery are the primary source of freshwater for the industries Around 15 of total freshwater demand from CDP responding companies was supplied by the
Investor_Signatories_v5pdf159604625890 Worldrsquos 18 Most Water-Stressed Rivers | World Resources Institute (wriorg)
Ganges and Brahmaputra river basins another 15 came from the Godavari basin followed by Cauvery Indus Banas and Sabarmati river basins The demand for water has increased over the years causing these basins to rank among the most water-stressed catchments in the world90 Of the 83 facilities in India 53 were in water-stressed regions Our data shows that around 60 of total responding companies withdrew water from water-stressed regions Of these nine were from the materials industry and two were from the food beverage amp agriculture industry
Governance and Business Strategy
For a long time corporate sustainability strategies have focused on measurable and manageable challenges such as product footprint efficiency in supply chain water conservation and others Businesses have begun to take stock of water security by innovating for improved efficiency measuring direct withdrawals assessing risk to neighbours and considering leakages
CDPrsquos data shows that corporate leaders across India are responding to this crisis by focusing on their water policy to monitor risks and opportunities and integrate it in their strategies Around 71 companies report having a documented water policy that is accessible to the public Up to 93 companies indicated that they have a board-level oversight of water related issues within the organisation observed either by the Chief Executive Officer (CEO) or the director on board followed by the board-level committee
Around 43 of the responding companies report on water-related issues quarterly and 33 more frequently This shows the increasing self-awareness among companies on water-related issues Further 63 of these companies offer some form of
facilities out of a total of 83 from the responding companies were in areas with water-stress53
Water discharge by destination
Brackish surface
water and Seawater
Fresh surface water
Groundwater
Third party
532
225
2
975
156
93
Water discharge (megalitersyear)
125
013
1
Brackish surface
water and Seawater
Groundwater ndash non
renewable
Groundwater ndash renewable
ProducedEntrained
water
Third party
Fresh surface water
231
800
261
04
405
21
489
Water withdrawals (megalitersyear)
Water withdrawals by destination
7564
662
6
No
of c
ampa
nies
Industry
1
Appa
rel
1
Biot
ech
hea
lth
care
amp p
harm
a
1
Man
ufac
turin
g
2Fo
od b
ever
age
amp ag
ricul
ture
1
Pow
er
gene
ratio
n
1
Tran
spor
tatio
n se
rvic
es
1
Serv
ices
9
Mat
eria
ls
Industry-wise water withdrawals from water-stressed areas
40
A N N U A L R E P O R T 2 0 2 0
incentive to their employees ndash monetary or otherwise -- for the management of water related issues
Businesses are stepping up and playing a vital role in developing water initiatives that can ease the stress on crucial watersheds Companies are also looking into water security related long-term business objectives and financial planning as a part of their overall business plans Almost 70 companies prefer short to mid-term (5-10 years) over long-term (11-30 years) planning This does not come as a surprise as water effects are felt locally and require more immediate strategic planning Of the 28 reporting companies 12 use climate-related scenario analysis to inform its water-related business strategy and eight anticipate doing so in the next two years A majority of these companies belong to the chemicals and the electric utilities sector
In 2019 about 13 companies were pricing their water this increased in 2020 to 18 and 50 are now exploring the its possibilities Companies such as Ambuja Cement (US$110 `7800
91 marico-sustainability-report-18pdf
Marico Ltd Establishing a strategy to improve water-security across operations and value chain
With a host of agro-based products water availability is a crucial parameter for Marico Ltd92 Under the risk management framework it has identified adverse impact of water scarcity as an environmental risk to the company To mitigate this environmental risk the company has initiated watershed management programs and a reduced-reuse-recycle model of water management across its operations Through a water stewardship program the company aims to address water security challenges in low rain-fed areas around its workplace and factories
In the reporting period FY 19-20 the company withdrew 202886 cubic meters of water and reported a reduction of 9 from previous year The company had reported a reduction of 31 in water intensity from the 2014 level through the company-wide introduction of water efficiency measures improvements in water recycling water-efficient taps and rainwater harvesting systems For improving water management practices across water stress areas Marico utilised the WRI aqueduct tool to evaluate water risk across all manufacturing facilities in India This tool helped the company identify the number of facilities that fall under the water stress area -- according to it five out of eight plants are in such zones The implementation of water conservation initiatives had helped three water-stressed sites reduce water consumption over the previous year Among three water-stressed sites Jalgaon reported 15 reduction in water consumption Baddi reported 16 and Paonta 28
Establishing a strategy to reduce and minimise water use was one of the companys key commitments Marico foresees its future water withdrawal levels reducing given its move towards improving water efficiency and incorporating recycling throughout the production cycle
Frequency of reporting on water-related issues
633
43
Annually
More frequently than quarterly
Quarterly
6
10 2Half-yearly
As important matters arise
Less frequently than annually
41
A N N U A L R E P O R T 2 0 2 0
to US$8240 `579800 per megalitre) Dr Reddyrsquos Laboratories (US$088`67 to US$591`449 per KL) Piramal Glass and Tata Steel use an internal price on water
Risks amp opportunities
Dwindling water supply is a major cause of concern for businesses since it poses significant direct and indirect impacts Visible risks such as droughts have a more explicit impact as they ruin vegetation and severely undermine the agriculture sector But subtle impacts present challenges to other sectors Water shortages also threaten the long-term viability of businesses by leading to higher costs eventually borne by the consumers Without proper management the economic repercussions of water scarcity will be felt in myriad ways92
In 2020 companies that experienced detrimental water-related impacts have incurred financial losses worth `1580 million Physical risks such as inadequate infrastructure and increased water stress account for more than half of these commercial losses followed by reputational-cum-market like subpar access to water sanitation and hygiene services and regulatory risks eg- failure to set mandatory water efficiency conservation and recycling standards Corporations should thus strategically prioritise dealing with these risks to safeguard their financial bottom lines For this organisations have looked to secure alternate sources of water supply adopt water efficiency and conservation practices as well as reuse and recycling of water
A 2018 report from NITI Aayog93 highlighted the fact that the country faced its worst water crisis that year Rising water challenges have put strong regulatory pressure on businesses in India with significant operational risks The private sector is a big contributor towards deepening water security issues but is also crucial in addressing it
Given the current situation with water resources it is perhaps unsurprising that many of the companies responding to CDP find themselves exposed to a plethora of physical and transition risks ndash that is risks from regulatory or consumer reforms aimed at addressing the water crisis These risks threaten their reputation and license to operate their supply chains security financial stability and their ability to grow As per CDPrsquos Global Water
92 httpsglobalriskinsightscom201612economic-cost-global-water-scarcity93 httpsnitigovinsitesdefaultfiles2019-06Final20Report20of20the20Research20Study20on2020Composite20Water20Resources20Management20Index20
for20Indian20States20conducted20by20Dalberg20Global20Development20Advisors20Pvt20Ltd_New20Delhipdf94 https6fefcbb86e61af1b2fc4-c70d8ead6ced550b4d987d7c03fcdd1dsslcf3rackcdncomcmsreportsdocuments000005165originalCDP_Global_Water_Report_2019
pdf159110644595 The term WASH refers to the provision of water sanitation and hygiene Universal affordable and sustainable access to WASH is a key public health issue within international
development and is the focus of the first two targets of Sustainable Development Goal 6 (SDG 6)96 httpswwwworldbankorgentopicwaterbriefwash-water-sanitation-hygiene-and-covid-19
Report 201994 the combined business value at risk reported in 2019 topped out at US$425 billion with about 40 of the risks anticipated to hit within the next 1-3 years Whether it was the blockading of a Newmont Goldcorp mine in Mexico or poor water quality threatening the production of Unileverrsquos Hellmannrsquos mayonnaise in the Mississippi River Basin the impacts of the global water crisis are already being felt
Water risks and risk assessment
As per the 2020 data 71 of the responding companies consider current or future water-related regulations as a risk to business followed by 57 companies that consider access to WASH95 services for employees as very relevant and always included in their water-risk assessments This shows that companies are vigilant about providing safe access to drinking water sanitation arrangements and proper hygiene at workplace The COVID-19 pandemic has highlighted the importance of WASH to human health and well-being Safely managed WASH services along with good hygiene practices can help prevent infectious diseases that kill millions each year96 In addition 50 companies reported that water used for their key commoditiesraw materials is relevant enough to be considered for their risk-assessment This was the most pertinent for chemical sector companies
of the 28 Indian responding companies undertake water-related risk assessment25
Total financial loss by reporting companies as per risk type
38
53
9
Reputation and Market Risk
Physical Risk
Regulatory Risk
1580 MILLION
In 2020 companies that experienced detrimental water-related impacts have incurred financial losses worth
1580 million
42
A N N U A L R E P O R T 2 0 2 0
It is crucial to consider stakeholders in risk assessment procedures for a comprehensive understanding of water-related risks Of the 25 companies that undertake water-related risk
97 httpswwwweforumorgreportsthe-global-risks-report-2020
assessments 68 always include employees in their internal assessment procedures by conducting training and awareness programs on water conversation initiatives communicating water-related policies etc This is followed by regulators and local communities who are relevant in water-risk assessment procedures at 61 and 54 respectively for the responding companies It is a positive sign that Indian companies are engaging with their employees and local communities and ensuring that the latter are not negatively impacted in terms of habitation health and water availability
According to The World Economic Forumrsquos Global Risk Report 202097 water crises are among the top five risks in terms of impact for the past ten consecutive years Water-related risks are substantive in the risk assessment processes and identified as a threat to companiesrsquo bottom line putting at risk a combined business value of US$425 billion according to CDP 2019 data
RegulatoryPhysical
Reputational
Risk due to company
Risk due to context
Expectedunexpected change or uncertainty in law or regulation
Water scarcity too much water water
unfit for use
Litigation product risks due to changes in
consumer behavior
Caused by inefficient operations produces and services resulting in water pollution over exploitation etc
Caused by changing environmental and social conditions like droughts
flooding etc
Relevancy of water-related risks
7157 57 50 46 46 43
11
Water-related
regulatory frameworks
Access to fully-
functioning safely
managed WASH
services for all employees
Water availability at a basincatchment
level
Implications of water on
your key commoditiesraw materials
Stakeholder conflicts
concerning water
resources at a basincatchment
level
Water quality at a basin
catchment level
Status of ecosystems and habitats
Other contextual
issues please specify
Empl
oyee
s
Regu
lato
rs
Loca
l com
mun
ities
Rive
r bas
in m
anag
emen
t au
thor
ities
Wat
er u
tiliti
es a
t a lo
cal l
evel
Stat
utor
y sp
ecia
l int
eres
t gr
oups
at a
loca
l lev
el
Inve
stor
s
Supp
liers
Oth
er w
ater
use
rs a
t a
basi
nca
tchm
ent l
evel
Oth
er
NG
Os
Cust
omer
s
No of Companies age of Companies
Relevancy of stakeholders in water-risk assessment
6861 54 50 50 46 46 39 36 32 2918
43
A N N U A L R E P O R T 2 0 2 0
Water risk event
Impacting business
Increased Operational amp maintenance Costs Increased Compliance amp
Administration Costs
Closure of Operations
Supply chain distributions
Brand Damage and LitigationsShareholder
Distributions
Risk transferRisk avoidance and mitigation
Technological Risks
Repurational amp Market Risks
Regulatory Risks
Physical Risks
Financial ImpactsResidual Water RiskInherent Water Risks
Increased water stress
143721Increased water scarcity
41105Drought
17604Inadequate infrastructure
820
Physical Risks
Ecosystem vulnerability
300Severe weather events
69Declining water quality
63Flooding
13
Regulatory Risks
Technology Risks
Higher water prices Transition to
water intensive low carbon energy sources
Tighter regulatory standards
2333
120
All the figures reported are in million rupees
44
A N N U A L R E P O R T 2 0 2 0
CDPrsquos data shows that physical risks seem to have the highest magnitude of impact on the Indian responding companies Drought is seen to be the primary driver of potential substantive impact
Where there is risk there is opportunity
Where therersquos risk therersquos reward Industrial wastewater for example is a vast untapped resource It is a potential source of heat power process water and high-value materials And there has never been a better time for this transformation to take place -- technologies are better the regulatory climate is favourable and the business case is clear Meanwhile the market demand for pollution-free products is growing For companies to thrive they will need to be aligned to changing consumer demands If
98 httpswwwmarketsandmarketscomMarket-Reportssmart-water-management-market-1265html
they respond to these opportunities then market differentiation resilience and profitability are on the table
Globally corporate leaders have started realising the untapped potential of smart water technology and the market for smart water management is anticipated to grow from US$846 billion in 2016 to US$2010 billion in 202198 Industrial wastewater has for a long time been reused for cooling towers steel works oil refineries textile manufacturing and paper production It was found that 15 of the 23 companies valued improved water efficiency in operations as their primary opportunity having a substantive financial or strategic impact on business
of the 28 responding companies (approx 93) identified water-related opportunities in their business26
Improved water efficiency in operations
Increased resilience to impacts of climate change
Reduced impact of product use on water resources
Improved community relations
Water recovery from sewage management
Resilience to future regulatory changes
Sales of new productsservices Increased brand value
3000million
`4000
million18752
million
opportunities were identified by 21 respondents
opportunities were identified by 11 respondents
opportunities were identified
by 9 respondents
opportunities were identified
by 4 respondents
Efficiency Resilience Products and services
Markets
22
14
10
4
`329
million
`
`
45
A N N U A L R E P O R T 2 0 2 0
26
17
14
17
2
Others
Recyclingreuse
Consumption
Product water intensity
Discharge
14
10Withdrawals
Water use efficiency
Categories of water targets monitored at the corporate level
of companies set company-wide water targets
of companies set company-wide water goals
5556
Businesses have identified transparency in water management issues as a fundamental activity and disclosure through CDPrsquos annual water questionnaire produces a standard comparable dataset McGill University and Millani found that companies disclosed through CDP ranked 19 percentiles better than the average business in their ability to access capital99 The research showed that a comprehensive voluntary disclosure produces a quality management team with enhanced awareness of threats and opportunities linked to climate and environmental change
Targets and Goals100
In response to declining water resources many companies have started engaging in water stewardship and setting water targets aligned with SDG Goal 6 to ensure availability and sustainable management of water sanitation and hygiene facilities for all101 Developing water-related targets helps companies make meaningful change from informed actions at the local level102 In 2020 four companies did not set water-related targets within their operations Whereas 24 companies had water-related targets 26 of them had set targets for product water intensity 17 set recyclingreuse targets and 14 focused on water use efficiency
Companies can set goals and targets on a range of operational issues to drive performance andor manage risks and opportunities CDPrsquos data shows that a majority had set targets at the company-wide level -- 55 of responding companies reported setting water targets across the company This was followed by 26 who set water targets at the business level and 19 at the site or facility level While setting water goals around 56 of companies monitored their goals at the company level 24 at the sitefacility level and the remaining at the basin business or country-level
99 Craig M Coulombe E Nostrat A 2019 The Role of CDP Disclosure to Improve Access to Capital Research Note httpsf01c8ee6-cac3-40ff-a0e4-8bfb54f2b88bfilesusrcomugd66e92b_30b06fd11b9c43d88428f768676e9a8bpdf
100 Targets ndash quantitative Goals - qualitative101 httpsunstatsunorgsdgsreport2020goal-06102 httpsceowatermandateorgsite-targets-guide
A company has various drivers for setting goals and targets and it tries to align these with increased stakeholder concerns and environmental legislation Data shows that most organisations considered reducing environmental impact and risk mitigation as the primary motivation for monitoring water goals and targets Organisations also considered brand value protection as one of the important factor while setting goals
24
4
Target Set No Target
No
of C
ompa
nies
Water targets monitored at the corporate level
46
A N N U A L R E P O R T 2 0 2 0
Drivers behind setting water targets and goals at the corporate level
Reduced environmental impact
Water stewardship
Risk mitigation
Recommended sector best practice
Corporate social responsibility
Brand value protection
Cost savings
Shared value
Climate change adaptation amp mitigation strategiess
Commitment to the UN SDG
Increase freshwater availability for users
Other drivers
45
14
14
2
2
2
5
14
16
12
161212
12
4
4
4
44
GoalsTargets
age of Companies
47
A N N U A L R E P O R T 2 0 2 0
PROTECTING OUR FOREST WEALTH
The world lost an estimated 10 million hectares of forest annually between 2015 and 2020104 Protecting and restoring forests and other natural ecosystems could provide up to 30 of climate change mitigation action needed to limit global warming to below 20C by 2030105
Global demand for agricultural commodities is the primary driver of deforestation and ecosystem conversion -- timber is extracted unsustainably and land is cleared for agricultural production This represents major risks to businesses as commodities associated with deforestation such as palm oil soy cattle and timber products are the building blocks of millions of products traded globally and therefore feature in the supply chains of numerous organisations
103 httpswwwipccchsrccl104 The State of the Worldrsquos Forests 2020 Forests biodiversity and people105 httpswwwpnasorgcontent1144411645106 httpsappsfasusdagovnewgainapiapiReportDownloadReportByFileNamefileName=Oilseeds20and20
Products20Annual_New20Delhi_India_04-01-2020
The unsustainable production and supply of these commodities and activities not only poses a significant business risk but also has a severe negative impact on the environment especially the climate crisis
Deforestation is fundamentally linked to climate change According to the IPCC Special Report on Climate Change and Land (2019)103 11 of global GHG emissions are from deforestation and from the conversion of natural ecosystems for human use
At an 8 annual growth rate edible oil consumption in India is growing faster than the 3 growth rate in production Imports and imports are rising to fill the gap As a result India still is the largest importer of edible oils followed by China European Union and the United States Indiarsquos edible oil imports in MY 202021 are predicted to rise 6 to 15 MMT of this 85 MMT will be palm oil 35 MMT soybean 28 MMT sunflower seed oil and 02 MMT rapeseed (canola) oil
-United States Department of Agriculture106
In 2020 three Indian companies responded to CDPrsquos forests questionnaire -- one responded to the request for disclosure from investors while two responded to their customers Globally 687 companies responded to CDPrsquos forests questionnaire and 57 of them evaluated deforestation-related risks at US$5312 billion
13The mitigation potential of reduced deforestation is
13 of the global emissions
We cant address climate change without protecting our forests
They are vital carbon stores that help reduce global warming
48
A N N U A L R E P O R T 2 0 2 0
Disclosure on deforestation management through CDP could be a significant opportunity for companies operating in India one of the largest importers of palm oil in the world This can help Indian companies tap into lucrative opportunities by scaling sustainable trends CDPrsquos forests questionnaire allows companies that produce source or use palm oil soy timber cattle cocoa coffee and rubber to disclose Moreover new biodiversity-focused metals amp mining and coal sector questionnaires were introduced in 2019
Palm oil is the most commonly used processed oil in industrial food production with its production being responsible for 5 of global tropical deforestation107 Indiarsquos palm oil imports account for nearly 23rd of its total imports of edible oil This demand was shaken in 2020 when the pandemic hit with a 40 fall in the consumption of palm oil during the lockdown108 Indiarsquos imports which account for nearly 20 of the global trade in palm oil will have a major effect on efforts to make its production and processing sustainable The primary barrier for sustainable palm oil consumption in
India stems from it belonging to a more price-sensitive and volume driven market making environmental impacts a low or non- existent priority in the minds of consumers
Climate change can reduce palm oil production and with demand outstripping supply prices could rise The Roundtable on Sustainable Palm Oil (RSPO) has developed a set of environmental and social criteria which companies must comply with in order to produce Certified Sustainable Palm Oil (CSPO) When properly applied these criteria can help in minimising the negative impacts of palm oil cultivation
107 Deforestation amp Palm Oil 108 As worldrsquos largest importer of palm oil India has a duty to push for ethical production practices109 httpsseaofindiacominterim-data-on-import-of-edible-oils-march-2020-down-by-32-percent-nov19-to-mar20-down-by-10-percent110 httpsappsfasusdagovnewgainapiapiReportDownloadReportByFileNamefileName=Oilseeds20and20Products20Annual_New20Delhi_India_04-01-2020111 httpsresourcetradeearthyear=2018ampexporter=76ampimporter=699ampcategory=87ampunits=value112 httpswwwrvonlsitesdefaultfiles201705poultry-sector-in-india-2017pdf113 httpsresourcetradeearthpublicationscocoa-trade-climate-change-and-deforestation
The Sustainable Palm Oil Coalition for India (I-SPOC) was formed to promote the uptake of sustainable palm oil and its derivatives in India CDP amongst others has joined it as a member
Soy cultivation is the second largest soft commodity driver of tropical deforestation after cattle products Various aspects of soy production generate GHGs that contribute to climate change India imports around 33 lakh tons of soybean oil109 According to data from the US Department of Agriculture India
is set to import 35 lakh metric ton of soybean oil in 20202021110 In addition India is also responsible for clearing huge spaces of forest land in Brazil that contributed to 23 of soybean imports to India in 2018111 Soy is also used as fodder for livestock and a growing local demand for poultry products will further affect Indiarsquos position on deforestation The country ranks amongst the top four producers of egg and chicken in the world and it is increasingly exporting to the Middle East and Europe112
Cocoa has been a notable agent of deforestation since the last century The global production of cocoa has increased from 34 million to 45 million tonnes between 2000 and 2014 while the land use footprint of its plantations rose by 37 to 257 million acres113 About 90 of
cocoa is produced by 7 countries -- Ivory Coast Ghana Indonesia Ecuador Cameroon Brazil and Nigeria The dearth of incentives for improving the plantations combine with high investment costs to make cocoa a low yield crop forcing farmers to resort to clearing untouched forest lands in order to meet the growing demand and
lsquoPalm oil consumption dropped by
in 2020 in India due to COVID-19rsquo
40
Climate-Water-Forest nexus
Water is an essential component of mitigation and adaptation strategies
Rising temperatures and changing weather patterns increase stress on water availability
Tropical forests provide substantial emission reductions by acting as carbon sinks
Droughts resulting from rising temperatures and changes in weather patterns increase the risk of forests fires
A major portion of gobal freshwater depends on forests
49
A N N U A L R E P O R T 2 0 2 0
for cutting down production costs114 In Southern India Cocoa is mainly grown as an intercrop in conjunction with coconut areca nut oil and rubber plantations Indiarsquos consumption in 2015-16 was 30000 tonnes of which 57 was imported while the domestic production rose at an annual rate of 37 in the same period115 Failure to protect forests in the event of a sharp cocoa price increase will lead to unsustainable levels of deforestation116
The US$10 billion coffee industry too leaves a gargantuan ecological footprint It is estimated that every cup of coffee consumed results in the loss of one square inch of forest cover117 Each year around 250000 acres of land is cleared for coffee which is unsustainable The Kodagu district
in the Western Ghats of India is a major biodiversity hotspot which produces about one-third of the countryrsquos coffee This region has more than 270 tree species which are all under significant ecological stress due to the coffee farms that threaten land use and land cover while potentially leading to the felling of about 21000 trees118
An estimated 8-10 of global production of low-cost timber products comes from illegal logging in forests To meet the burgeoning demand of timber produce about 25 million acres of land is converted to fast-
wood forests (timber plantations) across the world annually and this hampers the ecosystem services that nature provides us119 With the World Bank forecasting that the global market for wood is set to quadruple by 2050120 reducing timberrsquos environmental footprint is vital for the industryrsquos success In India there is no provision of a central data pool that maintains records of production and consumption of timber There is a need to address this inconsistency in reporting and data collection by forging a comprehensive strategic policy and providing institutional support121 This would ensure effective collaboration among all stakeholders that would result not only in the production of quality forest products but also a sustainable timber sector
114 httpsresourcetradeearthpublicationscocoa-trade-climate-change-and-deforestation~text=As20cocoa20tends20to20beforest20loss20over20this20time115 httpseconomictimesindiatimescomindustrycons-productsfoodalthough-indias-consumption-of-chocolate-is-steadily-growing-but-we-still-depend-on-imports-for-116 httpsnationalzoosieduscbimigratorybirdsresearchcacaorufcfm117 httpsohiostatepressbookspubsciencebiteschaptera-bitter-brew-coffee-production-deforestation-soil-erosion-and-water-contamination~text=For20every20cup20of20
coffeeinch20of20rainforest20was20destroyedamptext=Chemical20buildup20in20soils20andsoil20eroding2C20and20land20degradation118 httpswebcachegoogleusercontentcomsearchq=cacheYhaeYHVPWasJhttpswwwmdpicom1999-4907114480pdf+ampcd=6amphl=enampct=clnkampgl=in119 httpsresourcetradeearthyear=2018ampexporter=76ampimporter=699ampcategory=87ampunits=value120 httpdocuments1worldbankorgcurateden240231467291388831pdf106467-REVISED-v1-PUBLICpdf121 httpsonlinelibrarywileycomdoifull1011111477-894712094122 httpsglobalforestatlasyaleeduamazonland-usecattle-ranching123 httpsresourcetradeearthyear=2018ampimporter=699ampcategory=779ampunits=value124 httpsresourcetradeearthyear=2018ampimporter=699ampcategory=779ampunits=value125 httplargestanfordeducourses2018ph240halper1~text=Every20half20hour2C20a20cowmore20potent20than20carbon20dioxideamptext=There20is20
rampant20deforestation2C20especiallyto20make20room20for20cattle126 httpswwwinvestopediacomarticlesinvesting0929155-countries-produce-most-carbon-dioxide-co2asp127 httpwwwcwejournalorgvol9no3do-extensive-rubber-plantation-influences-local-environment-a-case-study-from-tripura-northeast-india128 httpswwwibeforgdownloadRubber_Plastics_220708pdf
Beef production remains by far the largest driver of deforestation in the worldrsquos tropical forests as forest land cleared for cattle is more than twice the combined area required for producing soy palm oil and wooden products The problem of cattle ranching
is particularly profound in the Amazon region the largest forest reserve in the world leading to 80 of present deforestation rates122 Clearing land for grazing causes irreversible habitat loss soil degradation and conflict between humans and wild animals India imports 15 and 12 of bovine leather from Turkey and Brazil respectively which poses a great threat to the forest areas of these countries123 It also jeopardises the earnings of the Indian companies manufacturing such products for its European consumers who have a high degree of sensitivity and awareness around deforestation124 In a larger context the impact of cattle stretches far beyond the realm of forests and is one of the key reasons for rising global emissions and climate change There are more than 15 billion cows on Earth with each of them capable of expelling 17 times more GHG emissions than cars in the form of methane burps a gas several times more potent than CO2 in terms of trapping heat It is therefore not surprising that cattle accounts for a colossal 18 in atmospheric carbon emissions125 To put this in perspective this surpasses emissions of the third largest CO2 emitter India which accounts for a 7 share in worldwide emissions126
Another commodity whose production has significant impact on the environment is rubber Environmentalists have warned for years that the rapid expansion of rubber plantations would come at the expense of natural forests Rubber has
not been subjected to extensive publicity in a way that palm oil soy and paper have been over the years given their impact on the environmentmdashpublicity that has led to adoption of robust sustainability criteria for these commodities Indiarsquos natural rubber plantation spans across an area of 183 million acres as of 2012 with the raw material being used as an input for making 35000 finished products of industrial importance127 Currently the impact assessment of large-scale rubber plantations on the environment is non-existent in the country a worrying sign considering Indiarsquos position as the 4th largest consumer in the world128
50
A N N U A L R E P O R T 2 0 2 0
Fossil-fuel and mineral mining accounts for 7 of global deforestation Moreover it not only presents a threat to forest cover and resource extraction but also leads to long-term impacts such as soil and water pollution infrastructure development and
increased anthropogenic activity129 While the effects of large-scale mining are easier to quantify as they are well regulated and undertake environmental impact assessments it is the scope and impact of artisanal and small-scale mining (ASM) that goes under the radar due to lack of data and a high degree of informality in the sector In India this problem warrants special attention since over 12 million people are engaged in the ASM business with women and girls from backward communities and those living below the poverty line being its primary employees130 A landscape-level approach is critical not only to identify and monitor the environmental and social impacts of individual mining projects but also to consider its interactions with other land uses as well given the crucial role forests play in balancing the ecosystem131 Indiarsquos investor requested company Hindustan Zinc Ltd was the first to disclose this year under the mining sector
129 httpsglobalforestatlasyaleeduland-usemining-extraction130 httpswwwpactworldorgstate20of20asm131 httpswwwresearchgatenetpublication38084575_Landscape_approach_for_quantifying_land_use_land_cover_change_1972-2006_and_habitat_diversity_in_a_mining_area_in_
Central_India_Bokaro_Jharkhand
Hindustan Zinc Pioneering forest and biodiversity conservation in the mining sectorHindustan Zinc Limited is the first investor-requested company in India to respond to CDPrsquos Forests questionnaire It demonstrated that a dedicated Biodiversity Policy and Management Standard is its compass in reducing flora and fauna disruption and in minimising or compensating its impact of operation through project scoping site closure and beyond
Companies in India currently lag behind their regional peers in terms of disclosure on deforestation management with only 3 companies disclosing on this topic in 2020
40
65
22
3China Japan IndiaSEA
(Indonesia Malaysia
Phillipines Singapore Vietnam)
Total no of companies disclosing through CDPs Forests questionnaire in 2020 by HQ countryregion
51
A N N U A L R E P O R T 2 0 2 0
Nagpur
Udaipur
Panaji
Kochi
Rajkot
Vadodara
Delhi
Dehradun
Ahmedabad
Thane
Chennai
Tiruchirappalli Coimbatore
Bangalore
Kolkata
Gangtok
Siliguri
India Snapshot
CITIES STATES AND REGIONS
Cities
In 2020 over 800 cities disclosed their environmental information through CDP including 16 Indian cities The number of cities in India disclosing through the CDP-ICLEI Unified Reporting System increased from 13 in 2019 to 17 This was largely due to citiesrsquo ongoing commitments to climate leadership initiatives such as the C40 Cities Climate Leadership Group (C40) the Global Covenant of Mayors for Climate and Energy (GCoM) and our partnership with ICLEI whose South Asia Regional Office also acts as the GCoM South Asia Helpdesk
88 global cities reached CDPrsquos A list which include Bristol (UK) Miami (USA) Cape Town (South Africa) Buenos Aires (Argentina) and Auckland (New Zealand)
despite the COVID-19 pandemic The USA accounts for the highest number
(25) of cities on the A List making up 28 despite the US pulling out of
the Paris Agreement In India more than half the cities in disclosed
that
they either have sustainability targets incorporated into the master planning of the city or it is in progress while only 43 of the cities have a published plan that addresses climate change adaptation Approximately half of the disclosing Indian cities have identified opportunities as a result of addressing climate change and one-third of them have a GHG emission reduction target which is a strong indication towards a low carbon development pathway
States and Regions
In 2020 the Union Territories of Delhi and Jammu amp Kashmir along with over 120 states and regions from across the world disclosed their environmental impacts through CDP Globally 90 of states and regions reporting a 2030 target have one in line with the IPCCrsquos goal to reduce global greenhouse gas emissions by 40-50 from 2010 levels by 2030 and 55 of states and regions with a 2030 emissions reduction
target are showing greater ambition than their national
counterparts
Indian cities and 16
Indian states disclosed to CDP
2
52
A N N U A L R E P O R T 2 0 2 0
ANNEXURESAppendix I Table of emissions scores and sector by company
Sector Company Name 2020 permission Status
Final score 2020
Scope 1 Scope 2 Scope 3 Number of categories reported in Scope 3
Bars hotels amp restaurants
Indian Hotels Co Ltd
public C 50610 239568 23824 3
Biotech amp pharma Biocon public C 41948 133110 Not Provided
Dr Reddyrsquos Laboratories
public B 247317 154836 1272548 8
ZCL Chemicals public D- Not Provided Not Provided Not Provided
Cement amp concrete ACC public B 16966585 643870 648068 3
Ambuja Cements public B 14523738 551219 1973622 7
Dalmia Bharat Ltd
public B 11280051 537968 1320736048 9
JK Cement non public D Private Private Private Private
JSW Cement Limited
public B- 1398609 647870 572488 4
Shree Cement non public C Private Private Private Private
Ultratech Cement
public B 47954830 1327185 5376354 4
Chemicals Aarav Frances amp Flavors Private
Limited
public Not Scored
GHCL LIMITED public D 109470536 496707 Not Provided
Godrej Industries public B 32311 44361 6735893 3
Gujarat Fluorochemicals
non public C Private Private Private Private
Jubilant Life Sciences Ltd
non public C Private Private Private Private
Kansai Nerolac Paints Limited
non public Not Scored Private Private Private Private
Tata Chemicals public B 444988061 4505956 12162395 5
UPL Limited non public Private Private Private Private Private
Godrej Consumer
Products Limited
public A- 33980 30848 26433 2
Note Due to increase in sample size more samples were considered for this report These samples include companies from the BSE Top 200 list CDPrsquos Fixed Income sample FAIRR sample Emerging markets sample Environmental sample and Continuity climate change sampleFor further details visit https6fefcbb86e61af1b2fc4-c70d8ead6ced550b4d987d7c03fcdd1dsslcf3rackcdncomcomfycmsfilesfiles000003423originalCDP_Climate_Change_Sample_Investor_Request_2020pdfNot Scored- Companies who have submitted the minimum version questionnaire
53
A N N U A L R E P O R T 2 0 2 0
Sector Company Name 2020 permission Status
Final score 2020
Scope 1 Scope 2 Scope 3 Number of categories reported in Scope 3
Energy utility networks
Adani Transmission
Ltd
public D 31870076 21155 9379637 3
GAIL public C 4925087 387358 1071 1
Financial services Axis Bank public B 6250 168043 4414712 3
HDFC Bank Ltd public B 764919 390176 1642453 3
Indusind Bank public A 88316 6278567 1277912 3
Kotak Mahindra Bank
public C 9078 69780 4290177 3
LampT Finance Holdings Limited
non public Private Private Private Private Private
State Bank of India
public B- 390 1066386 257902 5
YES BANK Limited
public A- 344515 3099369 4859625 3
Agricultural commodities
Tata Consumer Products Ltd
public A- 11731 34238 3348672939 10
Marico public A- 1380 12140 499568 9
Intermodal transport amp logistics
Adani Ports amp Special
Economic Zone
public B- 95905791 176946845 202567171 3
IT amp software development
HCL Technologies
non public Private Private Private Private Private
Infosys Limited public A- 15344 124063 371602 6
Larsen amp Toubro Infotech Ltd
public B 39485 2521874 1908034 2
Mindtree Ltd non public A- Private Private Private Private
Tata Consultancy
Services
public A- 26714 811815 702615 7
Tech Mahindra public A 1803807 105736586 39285212 5
Wipro public A- 13366 124564 421527 7
Land amp property ownership amp development
Godrej Properties Limited
public Not Scored 4400 2429 422
Mahindra Lifespace
Developers Limited
public B 397 2675 589525 8
Light manufacturing APOLLO TYRES LTD
public Not Scored 24207 60717 Not Provided
JK Tyres amp Industries
public C 158568 88424 Not Provided
54
A N N U A L R E P O R T 2 0 2 0
Sector Company Name 2020 permission Status
Final score 2020
Scope 1 Scope 2 Scope 3 Number of categories reported in Scope 3
Media telecommunications amp data center services
Bharti Airtel non public D Private Private Private Private
Reliance Jio Infocomm
Limited
public B 105018 1826762 243195034 3
Tata Communications
public A- 6376 108482 6938 3
Metal smelting refining amp forming
Hindustan Zinc public A 4480887 253756 4182181 10
Vedanta Ltd public B- 57482869 1864711 Not Provided
JSW Steel Ltd public A- 40045307 476901 4168823 8
Tata Steel public A- 60116322 5687999 14970000 12
Metallic mineral mining
NMDC public D 29004 63671 1957 1
Oil amp gas processing Bharat Petroleum
Corporation
public B 5023580 366230 729820 2
Indian Oil Corporation
public D 18690000 54700 Not Provided
Renewable power generation
Adani Green Energy
public D 841 13313 1174 1
Azure Power public Private 323 2767
Specialized professional services
Mahindra amp Mahindra Financial Services
public B 3370 18847 22922 3
Piramal Enterprises
public C 4430568 8692844 Not Provided
Vakrangee Softwares Ltd
public B 2053355 35409 Not Provided
Textiles amp fabric goods
ARVIND Ltd public B- 3514561 238894 Not Provided
Thermal power generation
Adani Power Ltd public D 58970705 14607 6910800 1
JSW Energy public B 17200521 36117 61151 2
NTPC Ltd public D 252495018 15845 978052 3
Tata Power Co public C 34952981 22051 1226 1
Tobacco ITC Limited public B- 1241718 230192 206064 5
Transportation equipment
Hero Motocorp Ltd
non public D Private Private Private Private
Mahindra amp Mahindra
public A 40654 414552 58425531 11
Tata Motors public A- 60533 266200 3140861 8
55
A N N U A L R E P O R T 2 0 2 0
Climate Change ndash Investor requested companies132
CDP Activity Group Company name Response Status
Air transport InterGlobe Aviation Ltd Not submitted
Jet Airways (India) Ltd Not submitted
Apparel design Page Industries Ltd Not submitted
Bars hotels amp restaurants
Indian Hotels Co Ltd Submitted
Jubilant Foodworks Ltd Not submitted
Biotech amp pharma Abbott India Ltd See Another
Ajanta Pharma Ltd Not submitted
Alkem Laboratories Ltd Not submitted
Aurobindo Pharma Not submitted
Biocon Submitted
Cadila Healthcare Not submitted
Cipla Not submitted
Divirsquos Laboratories Not submitted
Dr Reddyrsquos Laboratories
Submitted
Glenmark Pharmaceuticals
Not submitted
Lupin Not submitted
Natco Pharma Ltd Not submitted
Pfizer Ltd See Another
Sun Pharma Advanced Research Company Ltd
Not submitted
Sun Pharmaceutical Industries
Not submitted
Torrent Pharmaceuticals
Not submitted
Cement amp concrete ACC Submitted
Ambuja Cements Submitted
Dalmia Bharat Ltd Submitted
India Cements Not submitted
JK Cement Ltd Submitted
Orient Cement Limited Not submitted
Shree Cement Submitted
The Ramco Cements Ltd
Not submitted
Ultratech Cement Submitted
132 These include companies from the BSE Top 200 list CDPrsquos Fixed Income sample FAIRR sample Emerging markets sample Environmental sample and Continuity climate change sample For further details visit https6fefcbb86e61af1b2fc4-c70d8ead6ced550b4d987d7c03fcdd1dsslcf3rackcdncomcomfycmsfilesfiles000003423originalCDP_Climate_Change_Sample_Investor_Request_2020pdf
See Another -The response is covered by another CDP reporting company usually the parent company
CDP Activity Group Company name Response Status
Chemicals Asian Paints Not submitted
Berger Paints India Ltd Not submitted
Castrol India Not submitted
Colgate Palmolive India See Another
Coromandel International
Not submitted
Dabur India Not submitted
Emami Ltd Not submitted
Godrej Consumer Products Limited
Submitted
Godrej Industries Submitted
GRAPHITE INDIA LTD Not submitted
HEG LTD Not submitted
Jubilant Life Sciences Ltd
Submitted
Kansai Nerolac Paints Limited
Submitted
PI Industries Ltd Not submitted
Pidilite Industries Ltd Not submitted
Procter amp Gamble Hygiene amp Health Care Ltd
See Another
SRF Ltd Not submitted
Supreme Industries Ltd Not submitted
Tata Chemicals Submitted
UPL Limited Submitted
Coal mining Adani Enterprises Not submitted
Coal India Not submitted
Gujarat Mineral Devp Corpn
Not submitted
Commercial amp consumer services
Quess Corp Ltd Not submitted
Construction Bharti Infratel Limited Not submitted
GVK Power amp Infrastructure
Not submitted
Honeywell Automation India Ltd
See Another
Larsen amp Toubro Not submitted
Voltas Not submitted
Appendix II List of companies invited to respond to CDP
56
A N N U A L R E P O R T 2 0 2 0
CDP Activity Group Company name Response Status
Financial services Gruh Finance Ltd Not submitted
HDFC Asset Management
Not submitted
HDFC Bank Ltd Submitted
HDFC Life Insurance Company Ltd
Not submitted
Housing Development Finance Corporation
Not submitted
ICICI Bank Limited Not submitted
ICICI Lombard General Insurance Company Ltd
Not submitted
ICICI Prudential Life Insurance Company Ltd
Not submitted
IDBI Bank Ltd Not submitted
IDFC First Bank Ltd Not submitted
Indiabulls Housing Finance Ltd
Not submitted
Indiabulls Ventures Ltd Not submitted
Indian Bank Not submitted
Indusind Bank Submitted
Kotak Mahindra Bank Submitted
LampT Finance Holdings Limited
Submitted
LIC Housing Finance Not submitted
Max Financial Services Not submitted
Motilal Oswal Financial Services Ltd
Not submitted
Muthoot Finance Limited
Not submitted
PNB Housing Finance Ltd
Not submitted
Power Finance Corporation
Not submitted
Punjab National Bank Not submitted
RBL Bank Ltd Not submitted
REC Ltd Not submitted
Reliance Nippon Life Asset Management Ltd
Not submitted
SBI Life Insurance Company Ltd
Not submitted
Shriram Transport Finance Co
Not submitted
State Bank of India Submitted
Union Bank of India Not submitted
YES BANK Limited Submitted
CDP Activity Group Company name Response Status
Convenience retail Avenue Supermarts Ltd Not submitted
Discretionary retail Aditya Birla Fashion and Retail Ltd
Not submitted
Future Retail Ltd Not submitted
Electrical amp electronic equipment
Amara Raja Batteries Ltd
Not submitted
Bharat Electronics Not submitted
Crompton Greaves Consumer Electricals Ltd
Not submitted
Exide Industries Not submitted
Havells India Not submitted
Motherson Sumi Systems
Not submitted
Whirlpool of India Ltd See Another
Energy utility networks
Adani Gas Ltd Not submitted
Adani Transmission Ltd Submitted
CESC Ltd Not submitted
GAIL Submitted
Indraprastha Gas Ltd Not submitted
Power Grid Corpn of India
Not submitted
Reliance Infrastructure Not submitted
Torrent Power Not submitted
Financial services AU Small Finance Bank Ltd
Not submitted
Axis Bank Submitted
Bajaj Finance Limited Not submitted
Bajaj Finserv Not submitted
Bajaj Holdings amp Invst (BHIL)
Not submitted
Bandhan Bank Not submitted
Bank of Baroda Not submitted
Bank of India Not submitted
Canara Bank Not submitted
Cholamandalam Investment and Finance Co Ltd
Not submitted
Cholamandalam Investment and Finance Company Ltd
Not submitted
City Union Bank Ltd Not submitted
Edelweiss Financial Services Ltd
Not submitted
Federal Bank Not submitted
General Insurance Corporation of India
Not submitted
57
A N N U A L R E P O R T 2 0 2 0
CDP Activity Group Company name Response Status
Food amp beverage processing
Britannia Industries Not submitted
Marico Submitted
Tata Consumer Products
Submitted
United Breweries Not submitted
United Spirits Not submitted
Varun Beverages Ltd Not submitted
Venkys India Ltd Not submitted
Health care provision Apollo Hospitals Enterprises
Not submitted
Industrial support services
GMR Infrastructure Limited
Not submitted
Intermodal transport amp logistics
Adani Ports amp Special Economic Zone
Submitted
Container Corporation of India
Not submitted
IT amp software development
HCL Technologies Submitted
Infosys Limited Submitted
Larsen amp Toubro Infotech Ltd
Submitted
Mindtree Ltd Submitted
MphasiS Not submitted
Oracle Financial Services
See Another
Tata Consultancy Services
Submitted
Tech Mahindra Submitted
Wipro Submitted
WNS Holdings ADR Not submitted
Land amp property ownership amp development
DLF Not submitted
Godrej Properties Limited
Submitted
Housing Development amp Infrastructure
Not submitted
Oberoi Realty Not submitted
Leisure amp home manufacturing
Rajesh Exports Ltd Not submitted
Titan Company Limited Not submitted
Light manufacturing 3M India Ltd Not submitted
APOLLO TYRES LTD Submitted
Balkrishna Industries Ltd
Not submitted
Ceat Ltd Not submitted
MRF LTD Not submitted
CDP Activity Group Company name Response Status
Media telecommunications amp data center services
Bharti Airtel Submitted
Reliance Communications
Not submitted
Sun TV Network Not submitted
Tata Communications Submitted
Vodafone Idea Ltd Not submitted
Zee Entertainment Enterprises
Not submitted
Metal products manufacturing
AIA Engineering Ltd Not submitted
Bosch Ltd See Another
Endurance Technologies Ltd
Not submitted
Gillette India Not submitted
Metal smelting refining amp forming
Bharat Forge Ltd Not submitted
Essar Steel Limited Not submitted
Hindalco Industries Not submitted
Hindustan Zinc Submitted
Jindal Stainless Ltd Not submitted
Jindal Steel amp Power Not submitted
JSW Steel Ltd Submitted
Steel Authority of India Not submitted
Tata Metaliks Ltd Not submitted
Tata Steel Submitted
Vedanta Ltd Submitted
Metallic mineral mining
National Aluminium Co Not submitted
NMDC Submitted
Oil amp gas extraction amp production
Oil India Ltd Not submitted
Petronet LNG Not submitted
Oil amp gas processing Bharat Petroleum Corporation
Submitted
Hindustan Petroleum Corporation
Not submitted
Indian Oil Corporation Submitted
Mangalore Refinery and Petrochemicals
Not submitted
Nayara Energy Limited Not submitted
Oil amp Natural Gas Corporation
Not submitted
Reliance Industries Not submitted
Oil amp gas storage amp transportation
Gujarat State Petronet Not submitted
Other materials Astral Poly Technik Ltd Not submitted
Powered machinery Bharat Heavy Electricals
Not submitted
Cummins India See Another
58
A N N U A L R E P O R T 2 0 2 0
CDP Activity Group Company name Response Status
Renewable power generation
Adani Green Energy Submitted
Azure Power Submitted
National Hydroelectric Power Corporation Ltd (NHPC)
Not submitted
ReNew Power Private Limited
Not submitted
SJVN Ltd Not submitted
Specialized professional services
LampT Technology Services Ltd
Not submitted
Mahindra amp Mahindra Financial Services
Submitted
NBCC Ltd Not submitted
Piramal Enterprises Submitted
Vakrangee Softwares Ltd
Submitted
Textiles amp fabric goods
ARVIND Ltd Submitted
Birla CelluloseGrasim Industries
Not submitted
Chennai Petroleum Corporation
Not submitted
Thermal power generation
Adani Power Ltd Submitted
Aditya Birla Capital Not submitted
JSW Energy Submitted
KSK Energy Ventures Limited
Not submitted
NLC India Ltd Not submitted
NTPC Ltd Submitted
Reliance Power Not submitted
Tata Power Co Submitted
Tobacco ITC Limited Submitted
Transportation equipment
Ashok Leyland Not submitted
Bajaj Auto Not submitted
Eicher Motors Ltd Not submitted
Hero Motocorp Ltd Submitted
Mahindra amp Mahindra Submitted
Maruti Suzuki India Not submitted
Tata Motors Submitted
TVS Motor Company Ltd
Not submitted
Web amp marketing services
Info Edge (India) Ltd Not submitted
Wood amp paper materials
Century Textiles amp Industries
Not submitted
59
A N N U A L R E P O R T 2 0 2 0
Climate Change ndash Self Selected companies
CDP Activity Group Company name Response Status
Chemicals AARAV FRANCES amp FLAVORS PRIVATE LIMITED Submitted
GHCL LIMITED Submitted
Gujarat Fluorochemicals Submitted
Light manufacturing JK Tyres amp Industries Submitted
Cement amp concrete JSW Cement Limited Submitted
Land amp property ownership amp development Mahindra Lifespace Developers Limited Submitted
Media telecommunications amp data center services
Reliance Jio Infocomm Limited Submitted
Biotech amp pharma ZCL Chemicals Submitted
Water Security ndash Investor requested companies133
CDP Activity Group Name Response Status
Bars hotels amp restaurants Indian Hotels Co Ltd Submitted
Biotech amp pharma Ajanta Pharma Ltd Not submitted
Alkem Laboratories Ltd Not submitted
Aurobindo Pharma Not submitted
Biocon Not submitted
Cadila Healthcare Not submitted
Cipla Not submitted
Divirsquos Laboratories Not submitted
Dr Reddyrsquos Laboratories Submitted
Glenmark Pharmaceuticals Not submitted
Lupin Not submitted
Natco Pharma Ltd Not submitted
Sun Pharmaceutical Industries Not submitted
Torrent Pharmaceuticals Not submitted
ZCL Chemicals Submitted
Cement amp concrete ACC Not submitted
Ambuja Cements Submitted
Dalmia Bharat Ltd Not submitted
Shree Cement Not submitted
The Ramco Cements Ltd Not submitted
Ultratech Cement Submitted
Chemicals Asian Paints Not submitted
Berger Paints India Ltd Not submitted
Castrol India Not submitted
Coromandel International Not submitted
Dabur India Submitted
Emami Ltd Not submitted
Godrej Consumer Products Limited Submitted
Godrej Industries Submitted
Jubilant Life Sciences Ltd Submitted
Kansai Nerolac Paints Limited Submitted
Pidilite Industries Ltd Not submitted
Procter amp Gamble Hygiene amp Health Care Ltd Not submitted
SRF Ltd Not submitted
Supreme Industries Ltd Not submitted
Tata Chemicals Submitted
133 These include companies from the Water Global sample and Continuity water security sample For further details visit https6fefcbb86e61af1b2fc4-c70d8ead6ced550b4d987d7c03fcdd1dsslcf3rackcdncomcomfycmsfilesfiles000003422originalCDP_Water_Security_Sample_Investor_Request_2020pdf
60
A N N U A L R E P O R T 2 0 2 0
CDP Activity Group Name Response Status
UPL Limited Submitted
VVF Ltd Not submitted
Coal mining Adani Enterprises Not submitted
Coal India Not submitted
Construction Larsen amp Toubro Not submitted
Discretionary retail Aditya Birla Fashion and Retail Ltd Not submitted
Electrical amp electronic equipment Amara Raja Batteries Ltd Not submitted
Exide Industries Not submitted
Havells India Not submitted
Energy utility networks GAIL Not submitted
Power Grid Corpn of India Not submitted
Food amp beverage processing Marico Submitted
Tata Consumer Products Ltd Submitted
IT amp software development Tech Mahindra Submitted
Light manufacturing APOLLO TYRES LTD Not submitted
JK Tyres amp Industries Submitted
MRF LTD Not submitted
Media telecommunications amp data center services
Tata Communications Not submitted
Metal smelting refining amp forming Bharat Forge Ltd Not submitted
Hindalco Industries Not submitted
Hindustan Zinc Submitted
Jindal Steel amp Power Not submitted
JSW Steel Ltd Not submitted
Tata Steel Submitted
Metallic mineral mining National Aluminium Co Not submitted
NMDC Not submitted
Oil amp gas extraction amp production Oil India Ltd Not submitted
Petronet LNG Not submitted
Oil amp gas processing Bharat Petroleum Corporation Not submitted
Hindustan Petroleum Corporation Not submitted
Indian Oil Corporation Not submitted
Oil amp Natural Gas Corporation Not submitted
Reliance Industries Not submitted
Oil amp gas storage amp transportation Gujarat State Petronet Not submitted
Specialized professional services Piramal Enterprises Submitted
Textiles amp fabric goods ARVIND Ltd Submitted
Birla CelluloseGrasim Industries Not submitted
Thermal power generation Adani Power Ltd Submitted
JSW Energy Not submitted
NTPC Ltd Submitted
Tata Power Co Submitted
Tobacco ITC Limited Submitted
Transportation equipment Ashok Leyland Not submitted
Bajaj Auto Not submitted
Hero Motocorp Ltd Not submitted
Mahindra amp Mahindra Submitted
Maruti Suzuki India Not submitted
Tata Motors Not submitted
61
A N N U A L R E P O R T 2 0 2 0
Water Security ndash Self Selected companies
CDP Activity Group Name Response Status
Chemicals AARAV FRANCES amp FLAVORS PRIVATE LIMITED Submitted
Transportation services Adani Ports amp Special Economic Zones Submitted
Other materials Piramal Glass Submitted
62
A N N U A L R E P O R T 2 0 2 0
Appendix III - Indian Companies Committed to ActionScience-based Target initiative (SBTi)Approved 15degC
Mahindra Heavy Engines Ltd Mahindra EPC Irrigation Limited White House
Dr Reddys Laboratories Ltd Swaraj Engines Limited Gromax Agri Equipment Limited
Mahindra Accelo Mahindra Holidays and Resorts India Limited Mahindra Lifespaces Developers Limited
Mahindra Lifespaces Developers Limited Mahindra World City (Jaipur) Ltd Mahindra World City Developers Ltd
Polygenta Technologies Limited
Approved well-below 2degC
Tata Chemicals Limited Mahindra amp Mahindra Limited Wipro
Mahindra First Choice Services Ltd Mahindra Electric Mobility Ltd
Approved 2degC
Hindustan Zinc Limited Mahindra Sanyo Special Steel Shree Cement Ltd
Tech Mahindra
SBTi Committed
Infosys Limited UPL Limited JSW Energy Limited
Godrej Agrovet Limited Godrej Consumer Products Limited Godrej Industries
Godrej Properties Limited Godrej amp Boyce Mfg Co Ltd Ultratech Cement Limited
Vakrangee Limited ACC Limited Adani Ports and Special Economic Zone Limited
SCM Garments PVT Limited Nahar Industrial Enterprises Limited Ambuja Cement Ltd
Adani Green Energy Ltd Reliance Jio Infocomm Limited Bharti Airtel Limited
Gujarat Fluorochemicals Ltd (GFL) Dalmia Bharat Limited HCL Technologies
Havells India Limited Mahindra Susten Eastman Exports Global Clothing Pvt Ltd
JK Tyre amp Industries Ltd Marico Limited Tata Global Beverages Ltd
EPC Industries Limited Mahindra amp Mahindra Financial Services Limited YES BankSBTi companies not in CDP Sample
RE100Dalmia Bharat Ltd Infosys Ltd Mahindra Holidays amp Resorts India Ltd
Tata Motors Ltd
RE100 companies not in CDP Sample
Internal Carbon Pricing (ICP)Pricing carbon in 2020
ACC Ambuja Cements Dalmia Bharat Ltd
Dr Reddyrsquos Laboratories Godrej Consumer Products Godrej Industries
Gujarat Fluorochemicals Hero Motocorp Ltd Hindustan Zinc
63
A N N U A L R E P O R T 2 0 2 0
Infosys Limited JSW Cement Limited JSW Steel Ltd
Mahindra amp Mahindra Mindtree Ltd Shree Cement
Tata Chemicals Tata Consultancy Services Tata Consumer Products
Tata Motors Tata Steel Tech Mahindra
Ultratech Cement Wipro
Planning to price in the next two years
Adani Ports amp Special Economic Zone ARVIND Ltd GAIL
GHCL LIMITED Indian Hotels Co Ltd JK Tyres amp Industries
JSW Energy Jubilant Life Sciences Ltd Larsen amp Toubro Infotech Ltd
Mahindra amp Mahindra Financial Services Mahindra Lifespace Developers Limited Marico
NTPC Ltd Piramal Enterprises Reliance Jio Infocomm Limited
Tata Communications Tata Power Co UPL Limited
Vakrangee Softwares Ltd Vedanta Ltd YES BANK Limited
64
A N N U A L R E P O R T 2 0 2 0
About CDPCDP is a not-for-profit charity that runs the global disclosure system or investors companies cities states and regions to manage their environmental impacts by running a global environmental disclosure system Each year CDP supports thousands of companies cities states and regions to measure and manage their risks and opportunities on climate change water security and deforestation We do so at the request of their investors purchasers and city stakeholders
Over the last two decades we have created a system that has resulted in unparalleled engagement on environmental issues worldwide In 2020 Over 9600 companies reported through CDP on climate change water security and forests and over 800 cities and more than 120 states and regions disclosed their environmental impacts through CDP
CDP IndiaCDP began working in India in 2008 and was formally registered in 2012 working on disclosure and driving climate action It serves as a source of knowledge for hundreds of Indian corporations from those that are just beginning on the road to corporate environmental disclosure through to those looking to improve sustainability and make commitments to reduce environmental impact
It is the only NGO to be named in Indiarsquos INDC submission to the UNFCCC owing to its corporate environmental data repository and tracking of emissions and mitigation data from the Indian Industry CDP India also actively participated in Government of Indiarsquos Ministry of Environment Forests amp Climate Change (MoEFCC) work on future carbon market mechanisms In addition to our work on disclosure CDP India is actively engaged in other initiatives including Internal Carbon Pricing (ICP) Science-based targets (SBT) and RE100
65
A N N U A L R E P O R T 2 0 2 0
CDP ContactsFor more info contact Damandeep Singh Director CDP India damandeepsinghcdpnet infoindiacdpnet
CDP Board of Directors
Bharati Chaturvedi Founder amp Director Chintan Environmental Research and Action Group
Ramakrishnan Mukundan Managing Director amp CEO Tata Chemicals Limited
Damandeep Singh Director CDP India
Important Notice
The contents of this report may be used by anyone providing acknowledgement is given to CDP Worldwide (CDP) This does not represent a license to repackage or resell any of the data reported to CDP or the contributing authors and presented in this report If you intend to repackage or resell any of the contents of this report you need to obtain express permission from CDP before doing so
CDP India has prepared the data and analysis in this report based on responses to the CDP 2020 information request No representation or warranty (express or implied) is given by CDP India as to the accuracy or completeness of the information and opinions contained in this report You should not act upon the information contained in this publication without obtaining specific professional advice To the extent permitted by law CDP India do not accept or assume any liability responsibility or duty of care for any consequences of you or anyone else acting or refraining to act in reliance on the information contained in this report or for any decision based on it All information and views expressed herein by CDP India is based on their judgment at the time of this report and are subject to change without notice due to economic political industry and firm-specific factors Guest commentaries where included in this report reflect the views of their respective authors their inclusion is not an endorsement of them
CDP India their affiliated member firms or companies or their respective shareholders members partners principals directors officers andor employees may have a position in the securities of the companies discussed herein The securities of the companies mentioned in this document may not be eligible for sale in some states or countries nor suitable for all types of investors their value and the income they produce may fluctuate andor be adversely affected by exchange rates
lsquoCDP Worldwidersquo and lsquoCDPrsquo refer to CDP Worldwide a registered charity number 1122330 and a company limited by guarantee registered in England number 05013650
copy 2020 CDP Worldwide All rights reserved
This report is printed on recycled paper
This report is printed on CyclusPrint based on 100 recycled fibres
This report is printed on CyclusPrint based on 100 recycled fibres
Supported by Scoring partner

CONTENTS
CEO FOREWORD 2INTRODUCTION 3SUSTAINABILITY ndash HEART OF GOOD GOVERNANCE 7CLIMATE-RELATED RISKS amp OPPORTUNITIES 9EMISSIONS TRENDS AND VERIFICATION 13DECARBONISING ACROSS VALUE CHAIN 17TARGETS AND PERFORMANCE 19SCIENCE-BASED TARGETS AMBITIOUS CORPORATE CLIMATE ACTION 21INTERNAL CARBON PRICEndash ROBUST CLIMATE STRATEGY 27THE RENEWABLE ENERGY THRUST 33WATER SECURITY 37PROTECTING OUR FOREST WEALTH 47CITIES STATES AND REGIONS 51ANNEXURES 52
CEO FOREWORD
When it comes to climate change water security and deforestation we have now entered a global emergency and the decade of action our last chance to make rapid and deep cuts to global emissions and to protect biodiversity to avoid the full force of these other global crises
Despite the pandemic we are bolstered by the environmental leadership from companies investors governments cities and regions worldwide With so much at stake and the clock running down 2020 saw record disclosures through CDPrsquos platform with over 10000 entities now disclosing their data on climate change water security and deforestation issues
More than 9600 companies worth over 50 of global market capitalisation now disclose through CDP and corporate disclosures are up 70 compared to five years ago when the Paris agreement was formed This is in addition to the cities states and regions that disclosed to us last year
2020 was a year of firsts for Indian corporate climate action For the first time Indian companies have featured on the CDP A List Of the 220 Indian companies that disclosed through CDP four made it onto our A List (Hindustan Zinc Limited IndusInd Bank Mahindra amp Mahindra and Tech Mahindra) We also witnessed the first Indian company disclose on forests a promising sign of increasing environmental ambition in the countryrsquos private sector These leading companies join a growing league of businesses that have recognised the climate emergency and are taking steps to respond to the associated risks and opportunities
At CDP we are led by the latest climate science As it evolves so must we ensuring that the right information is embedded into the capital markets and placed into the hands of policymakers and decision-makers worldwide CDPrsquos systems enable this and it is particularly critical as capital flows seek to transition towards the Net Zero sustainable economy
One thing is certain we cannot afford to go back to lsquonormalrsquo from an environmental perspective Propping up the old system with impending climate change hazards increasing will lock us into a pathway of even greater risk Instead we must reinvent and renew our economy into one with greater resilience and more inclusivity
Disclosure transparency data and science will be crucial to building a more resilient society As wersquove learned from this current pandemic and from climate change the best time for action is long before the problem becomes severe Measuring and managing environmental risks through disclosure helps companies cities states and regions to build resiliency and plan for the future
We must build back better from the COVID-19 pandemic Our economies societies and livelihoods depend on it
The time for action is now
ndash Paul Simpson Chief Executive at CDP
2020 was a year of firsts for Indian corporate climate action For the first time Indian companies have featured on the CDP A List
As 2021 unfolds we reflect on the challenging and extraordinary times of the last year As the world worked to collectively respond to the COVID-19 pandemic we reeled from the tragic human impact of the crisis and its impact on our health financial and social systems Sadly we are still grappling with these crises but the rollout of the vaccine provides great hope for later this year
INTRODUCTION
Separately 2020 marked CDPrsquos 20th anniversary with our 18th disclosure request sent out on behalf of more than 515 investors representing over US$106 trillion in assets and over 150 global organisations worth over US$4 trillion in purchasing power A record number of 9600+ companies responded in a year that was likely one of the most challenging in their history
The imminent climate emergency is already manifesting itself through extreme weather events across the world For instance in India and Bangladesh alone the lives of millions of poor people were devastated by the impact of floods cyclone Amphan and COVID-19 Home to some of the most disaster-prone areas in the world India also recorded the highest deaths due to climate crisis-led disasters in 2018 ranking it fifth in the The Global Climate Risk Index 20201
The climate crisis was compounded by the unprecedented disruption caused by the pandemic that overwhelmed the worldrsquos most efficient healthcare systems and pushed the global economy into recession However in its wake the pandemic offers the world the opportunity to build back better through a greener more climate-resilient economy
Though projections from the International Monetary Fund the World Bank and the Reserve Bank of India show an alarming pandemic-induced contraction in a country that was till recently the fastest growing
1 httpsgermanwatchorgsitesgermanwatchorgfiles20-2-01e20Global20Climate20Risk20Index202020_10pdf
2 httpsunfcccintsitesdefaultfilesresource1GCP_pdf3 httpsclimateactiontrackerorgcountriesindia4 httpsclimateactiontrackerorgcountriesindia5 httpswwwdwcomenindia-coal-energy-solar-power-renewables-changea-546881076 httpsenergyeconomictimesindiatimescomnewsrenewableindia-to-have-220-gw-renewable-energy-capacity-by-
2022-pm-narendra-modi78008063
large economy in the world India is still uniquely positioned to build back greener For this it needs to adopt an inclusive developmental model that integrates environment social and corporate governance (ESG) comprehensively into its decision-making processes and factors in greater sustainability and resilience parameters into post COVID-19 recovery plans
The pandemic-induced global lockdown2 led to a sharp drop in emissions and India is expected to record 6-10 lower GHG emissions in 2020 compared to 20193 This is an opportune time to build on this momentum by strategising a green COVID-19 recovery strategy with the potential to facilitate an accelerated transition away from coal and towards renewable energy Even though India is comfortably placed to not only meet but overachieve its NDC targets aligned with the 2009 Copenhagen 2degC goal under currently implemented policies the Climate Action Tracker suggests these efforts are insufficient to achieve the long-term climate goal of limiting temperature increase below 15degC in line with the Paris Agreement4 To achieve this crucial target India must begin focussing on phasing out coal for power generation by 20405
However despite setting ambitious targets and reiterating its commitment towards adoption of renewable energy and other low carbon avenues such as electric vehicles India is walking down a parallel and inconsistent policy pathway6 While no
In 2020 the COVID-19 pandemic tested the resilience of the global community demanding a concerted effort to battle its fallouts It was also the year the world celebrated the 5th anniversary of the Paris Accord an opportunity to assess progress establish enhanced targets and reaffirm commitment to mitigating the climate crisis
4
A N N U A L R E P O R T 2 0 2 0
new coal power stations have been set up in 2020 we continue to promote coal mining pursue increased coal production targets and have lately also allowed private investors into the market despite reduced utilisation of coal power plants and declining profitability7 Moreover even though a 50 decrease in the cost of solar power in two years is a major stimulus for adoption of renewable energy by targeting the concurrent development of 90+ GW of coal-based power capacity under the 2018 National Electricity Plan8 (NEP) India not only risks increasing its emissions but also turning the project into a stranded asset
Beyond the broad NDC targets Indian policymakers have started detailed consultations with companies to prepare them for broader action
Considering this focus on stranded assets and ESG emerging as an investment opportunity with over a third of global assets being built around ESG themes the Securities and Exchange Board of India (SEBI) hosted a roundtable in January 2021 to deliberate upon business preparedness to align with the sustainability-focused requirements it proposed9 This comes on back of the 77-page consultation paper issued by the SEBI in April 2020 on business responsibility and sustainability reporting10
The Ministry of Environment Forests and Climate Change (MoEFCC) also held a similar India CEO Forum on climate change in November 2020 to ldquoforge long standing and sustainable partnership between the Government and private sectorrdquo During the Forum a Declaration of Private Sector on Climate Change endorsed by 24 industry leaders and MoEFCC was released11 The industries included the likes of ITC Reliance Industries TATA Piramal Dalmia Mahindra ACClt Ambuja JSW Steel Renew Vedanta Dr Reddyrsquos and SUN Pharma12
Around the same time CDP also worked with its industry colleagues and partners (TERI We Mean Business World Business Council for Sustainable Development World Resources Institute and Climate Group) to develop a lsquoCall to Actionrsquo on eight business priorities for a green recovery This was signed by 24 business leaders and emphasised the need to
^ Invest in social infrastructure ensuring greater access and resilience
^ Accelerate power sector transition and clean mobility adoption
^ Deploy solutions for growing amp managing food to support growing needs
^ Collaborate and invest to achieve Land Degradation Neutrality ^ Pioneer green manufacturing and industrialisation ^ Transform to green building as the new normal across
geographies amp demographics
7 httpsclimateactiontrackerorgcountriesindia8 httpswwwcarbonbrieforgthe-carbon-brief-profile-india9 httpswwwmoneycontrolcomnewsbusinessmarketsformat-for-business-responsibility-sustainability-reporting-to-bring-in-more-transparency-ajay-tyagi-6353091html10 httpswwwsebigovinreports-and-statisticsreportsaug-2020consultation-paper-on-the-format-for-business-responsibility-and-sustainability-reporting_47345html11 httpspibgovinPressReleasePageaspxPRID=167035112 httpsstaticpibgovinWriteReadDatauserfilesFinal20Declarationpdf13 httpspibgovinPressReleaseIframePageaspxPRID=167763014 httpseceuropaeuinfobusiness-economy-eurobanking-and-financesustainable-financeinternational-platform-sustainable-finance_en15 httpswwwbusiness-standardcomarticlecurrent-affairsone-sun-one-world-one-grid-all-you-need-to-know-about-solar-strategy-120081500417_1html16 httpswwwnews18comnewsindiamodi-says-india-on-track-to-achieve-paris-climate-accord-targets-3172190html17 httpswwwnrdcorgsitesdefaultfilesroad-from-paris-202009pdf18 httpsnitigovinsitesdefaultfiles2020-06India_Green_Stimulus_Report_NITI_VF_June_29pdf
^ Invest in research for new clean energy sources to strengthen Indias energy outlook
^ Provide access to green finance to support emission saving measures across sectors
To further strengthen corporate action and adopt a more structured policy approach the Indian Government recently formed an Apex committee for the Implementation of Paris Agreement13 (AIPA) This committee will oversee Indiarsquos NDCs and monitor the contribution made by the private sector as well as multi- and bi-lateral agencies in the field of climate change under the chairmanship of the secretary MoEFCC India is also a part of the International Platform on Sustainable Finance14 launched by the European Commission in October 2019 to develop globally acceptable finance standards that can aid the mobilisation of private funds towards environmentally sustainable investments
Most importantly the recent initiative ldquoOne Solar One World and One Grid15rdquo (OSOWOG) launched by the International Solar Alliance (ISA) is an endeavour to connect 140 countries through a single grid that will be used for the transfer of solar power
We have reduced our emission intensity by 21 per cent over 2005 levels Our solar capacity has grown from 263GW in 2014 to 36 GW in 2020 Our renewable energy capacity is the fourth largest in the world It will reach 175GW before 2022 - Narendra Modi Prime Minister of India at Climate Ambition Summit16
In response to the COVID-19 economic crisis India also announced a large stimulus package ldquoAtmanirbharrdquo (self-reliant) amounting to US$260 billion17(10 of its GDP in 2019-20) Considered a step towards greater self-reliance the package intends to promote sustainable development and enhance job creation through investments in local manufacturing energy efficiency and renewable energy generation18 For instance while the stimulus allocates `30000 crores (US$4 billion) for agriculture and rural development these funds can be utilised for the installation of solar pumps and solar irrigation However to achieve an ambitious target of 450-GW installation capacity by 2030 it will need to channel a massive investment of US$700 billion This ambition can be realised only through funding support by international agencies including development finance institutions and other private players The domestic public and private institutions alone will not suffice Mark Carney the Governor of the Bank of England suggests that this is not just a financing challenge but a multi-
5
A N N U A L R E P O R T 2 0 2 0
trillion business opportunity Incidentally an IFC report released in 2018 highlights that the potential of climate finance in India is US$31 trillion
The Indian railway has also reiterated its commitment to achieving complete electrification of its network by 2023 targeting an ambitious net zero emissions by 203019
While governments have poured close to US$13 tn of public stimulus into economies so far the recovery packages are expected to have a net positive environmental impact in only seven of the 25 major world economies analysed stated the updated Greenness of Stimulus Index (GSI) report from Vivid Economics and Finance for Biodiversity20 A nature-based stimulus investment scenario outperforms a business-as-usual stimulus investment scenario globally by delivering more jobs more economic activity more carbon sequestration better nature outcomes and stronger resilience to extreme weather events including flood control says report co-author Jeffrey Beyer from Vivid Economics21
At the recently held Climate Ambition Summit on December 12 2020 UN Chief Antonio Guterres called on world leaders to declare a State of Climate Emergency in their countries until carbon neutrality is achieved22 To recover better from the COVID19 pandemic he urged countries to adhere to a green and resilient pathway by calling for investments in green jobs refusing bail-outs to polluting industries ending fossil-fuel subsidies and factoring climate risks into all financial and policy decisions
In this light this year has witnessed unprecedented calls for commitment action and investments not only from states but also from businesses and civil society groups The global momentum on climate action has been building with several European countries committing to net-zero emissions According to Blackrock23 88 of sustainable funds outperformed their non-sustainable counterparts from JanuaryndashApril 2020 highlighting the fact that ESGsustainable investing can future-proof investments while shaping a better future
Interestingly this year CDP also witnessed record-breaking disclosures mdash 10000+ companies cities states and regions disclosed through its platform Of these 9600+ companies with a combined worth of over 50 in global market capitalisation disclosed through CDP resulting in a 70 rise in corporate disclosures compared to 2015 the year the Paris agreement was signed24 CDP also launched its temperature ratings25 in collaboration with Europersquos largest asset manager Amundi enabling investors to access a temperature pathway for over 2850 global companies based on company emission reduction targets
19 httpspibgovinPressReleasePageaspxPRID=163826920 httpsenvironment-analystcomglobal106352recovery-stimulus-packages-are-causing-harm-to-nature21 httpsenvironment-analystcomglobal106352recovery-stimulus-packages-are-causing-harm-to-nature22 httpswwwindiatodayinworldstorydeclare-climate-emergency-un-chief-guterres-urges-leaders-of-every-country-1749078-2020-12-1323 httpswwwblackrockcomcorporateliteratureinvestor-educationsustainable-investing-resiliencepdf24 httpswwwcdpnetenarticlesclimate2020-lessons-from-an-extraordinary-year25 httpswwwcdpneteninvestortemperature-ratings
In India CDP witnessed a nearly 17 increase in corporate disclosure compared to 2019 with 220 Indian companies disclosing to investors and customers Climate change disclosure to investors recorded a rise of 14 Remarkably water security disclosure to investors also witnessed a significant increase of 87 Moreover for the first time a company responded to the forests request from investors through CDP India
With an ever-increasing number of companies choosing to disclose through CDP it is imperative to leverage the opportunity provided by the pandemic to transition from a grey to a green economy and join a growing league of climate leaders like Hindustan Zinc Limited IndusInd Bank Mahindra amp Mahindra and Tech Mahindra that deserve a special mention for being among the first Indian companies to make it to the prestigious CDP A List
Today Indian businesses realise that the risks posed by climate change are here to stay Therefore business leaders like Reliance Industries (a large conglomerate with businesses across oil amp gas telecom and retail amongst others) and JSW Energy (a thermal power company) have taken voluntary commitments to go net-zero (by 2035) and carbon-neutral (by 2050) respectively
Indian companies in highlight this year
Hindustan Zinc AIndusind Bank AMahindra amp Mahindra ATech Mahindra AGodrej Consumer Products Limited A-Infosys Ltd A-JSW Steel Ltd A-Marico A-Mindtree Ltd A-Tata Communications A-Tata Consultancy Services A-Tata Consumer Products A-Tata Motors A-Tata Steel A-Wipro A-YES BANK Limited A-
6
A N N U A L R E P O R T 2 0 2 0
Further the attempt to integrate climate action into business is also reflected in the disclosure responses received by CDP in the 2020 cycle
The business community is uniquely positioned to innovate and execute solutions with greater rigour and efficiency by integrating sustainability in the core business decision making with or without changes to the regulatory landscape Corporates can drive the desired change towards clean energy transitions by joining initiatives such as environmental disclosure the Science-Based Targets initiative RE100 and by incorporating an internal carbon price to deliver faster emission cuts in key areas However corporations need to be supported by governments through clearer long-term policies on energy and climate to instil the confidence needed to invest in technologies and innovation towards a zero-carbon future26
26 httpswwwwemeanbusinesscoalitionorgblogparis-agreement-the-power-of-ingenuity-with-collaboration-is-insurmountable
India is endowed with high social and environmental diversity and cannot expect to formulate a one- size- fits- all solution for its climate concerns What it requires is the coming together of all stakeholders to showcase the power of the collective especially its 13 billion people without whom no solution would be truly impactful
As disclosure and transparency are vital in lsquobuilding back betterrsquo CDP is poised to play a pivotal role as a global environmental disclosure platform helping companies cities states and regions measure and manage their environmental risks through disclosure The COP26 in Glasgow will be an important milestone in this direction and will enable countries to assess progress on their Paris Agreement goals and commit to more ambitious targets
As we work towards a low carbon future we must also pledge to build a more equitable world where vulnerable sections are no longer left to bear the brunt of tragedies triggered by climate change
17
Investor requested corporate disclosures for climate
change from Indian companies grew by
increase in investor requested corporate disclosures for Water Security Disclosures
87growth has been witnessed
over last year
` 7138Billion
worth of climate related risks calculated
by companies
3752
Indian companies have committed to the
SBTi by 2020
companies58
are pricing carbon or are planning to do so in the
next two years
7
A N N U A L R E P O R T 2 0 2 0
Business leaders are almost unanimously deliberating on climate issues and an overwhelming majority of companies now incentivise their managements to undertake climate action About three-fourths of these incentives are in the form of a financial compensation GAIL has a portal where staff members can give their suggestions on how to manage climate risks and employees whose suggestions are accepted are given a financial reward of `100000 Among the various types of non-monetary rewards BPCL recognises employees for undertaking initiatives in Health Safety Security and Environment (HSSE) through an annual performance award Mahindra amp Mahindra provide acknowledgement certificates to employees for energy efficiency projects as well as to those contributing to the annual sustainability reporting
The most commonly appointed positions that companies have chosen to place the responsibility of overseeing climate-related issues are board-level committee members the CEO the director the board chair and the CSO These individuals are also at the top of the corporate ladder which denotes the growing importance of climate change not just as a sustainability issue but as a broader global risk that threatens to undermine financial bottom lines erode shareholder value and tarnish brands
More than 75 companies provide an update to their respective boards on climate change-related issues at least
27 httpcbsteriinorgindiaghgphp~text=The20total20inventory20managed20bypercent20of20Indias20total20emissions
every quarter highlighting the growing importance of environmental sustainability as a core business value
Sustainability is deeply entrenched in the financial structure of companies today influencing access to capital capital expenditure direct and indirect costs and capital allocation Hence it comes as no surprise that 66 out of 67 companies stated that climate-related risks and opportunities have had an impact on their organisationrsquos strategy for financial planning Of these 66 companies 46 have also developed a low-carbon transition plan to minimise the losses to their bottom lines
SUSTAINABILITY ndash HEART OF GOOD GOVERNANCE
Businesses that currently account for 76 of the total energy consumption are vital for the country to tread the path of sustainable development As engines that will drive economic growth in the aftermath of the pandemic corporates present an immense opportunity for India to meet its climate commitments (NDCs) under the Paris Agreement through large-scale emissions reduction29
Frequency of reporting of climate-related issues
Oversight amp Incentive
Board- level oversight Incentive to management
99 8845
34
8
53
More frequency than quarterly
Quarterly
Half-yearly
4Annually
As important
matters arise
Not reported to the board
a
ge o
f com
pani
es
8
A N N U A L R E P O R T 2 0 2 0
Climate-related scenario analysis allows businesses to not only project future operational emissions but also mobilise necessary resources to offset the carbon footprint in their sustainability measurement approach It is especially important that the application of scenario analysis incorporates dynamic and unstable conditions under which companies are operating such as the COVID-19 pandemic that has resulted in mass layoffs economic recession and lockdowns across the world This would enable corporations to explore a broader range of uncertainties and be more resilient to external drivers of change28
The rigorous computational analysis would provide direction to enterprises on how to set emission reduction targets in line with the 20C scenario About 63 of the reporting companies use climate analysis tools such as models or scenarios enumerated
28 httpswwwfsborgwp-contentuploadsP291020-3pdf
under the Nationally Determined Contributions and International Energy Agencyrsquos 2 Degree Scenario (2DS) to inform their business strategy
Climate-based risks and opportunities have also influenced the strategy of companies in the sphere of investment in RampD Products amp Services Operations and Supply ChainValue chain Among these areas 87 companies claimed that Operations were affected and 84 reported changes in planning for Products and Services
Investmentin RampD
343
657
No
of C
ompa
nies
No Yes
Product amp Services 164
836
No Yes
No
of C
ompa
nies
Supply chain Value chain
701
298
No Yes
No
of C
ompa
nies
Operations
866
134No
of C
ompa
nies
No Yes
9
A N N U A L R E P O R T 2 0 2 0
CLIMATE-RELATED RISKS amp OPPORTUNITIESMore often than not the financial impacts of climate-related issues are not quantified and identifying them in the first place could be challenging These issues necessitate actions Increasingly investors lenders and other financial regulators are becoming more focused on ensuring that the private sector is ready to address climate risks and grab opportunities brought by changing climate
29 httpthoughtleadershipaoncomDocuments20200122-if-natcat2020pdfutm_source=cerosamputm_medium=storypageamputm_campaign=natcat20
30 httpswwwbankofenglandcouk-mediaboefilesspeech2019avoiding-the-storm-climate-change-and-the-financial-system-speech-by-sarah-breedenpdf
31 httpsreadoecd-ilibraryorgviewref=136_136201-ctwt8p7qs5amptitle=Making-the-Green-Recovery-Work-for-Jobs-Income-and-Growth_
32 https6fefcbb86e61af1b2fc4-c70d8ead6ced550b4d987d7c03fcdd1dsslcf3rackcdncomcmsreportsdocuments000005312originalAnalysis_of_CA100__Data_for_CDP_Investor_Signatories_v5pdf1596046258
33 Climate Action 100+ is an investor initiative to ensure the worldrsquos largest corporate GHG emitters take necessary action on climate change The companies include 100 lsquosystemically important emittersrsquo accounting for 23rd of annual global industrial emissions alongside more than 60 others with significant opportunity to drive the clean energy transition Read more at httpwwwclimateaction100org
Climate change has already shown substantial impacts on businesses all around the world and this is expected to continue As per a 2019 report 29 the total direct economic losses incurred due to climate-related natural disasters in 2019 were estimated at US$232 billion In India the monsoon floods in June-October 2019 caused an economic loss of US$10 billion and claimed 1750 lives Additionally the Bank of England has estimated asset losses worth US$20 trillion due to climate change if no action is taken now 30
COVID-19 has taught the world how the pandemic can actually be used as an
opportunity to better understand and mitigate climate-related
risks Investors are now more than ever more focussed on risk exposure Post-COVID-19 civil society groups governments and business are all have aligned in trying to reduce the risks to our economy and world going forward
As per an OECD report despite widespread socio-
economic suffering suffering there is an increase in public
consciousness about the risks to the natural system from anthropogenic activities31
CDP recently released a report32 on the analysis of CA100+ companies for CDP Investor Signatories Up to 118 of 122 CA100+33 companies report being exposed to substantive climate-related risks and opportunities 93 companies identified climate-related risks and 91 identified climate-related opportunities as having the potential to have a substantive financial or strategic impact on their businesses
As per CDP Indiarsquos 2020 data companies have a varied definition of what short medium and long-term means for them -- a rough average across the sample would be three years for short term five years for medium term and 15-20 years for the long term although the latter also ranges up to 100 years These time frames are important in planning risk management processes -- contextualisation of risks in terms of potential market changes and evolving technological scenarios around risk management at enterprise level
Responding companies
67Companies identified
climate related substantive risks
62Companies
identified risk typesdrivers
60Companies
identified potential financial impact
driver
60
Companies provided potential financial
impact figures
42
10
A N N U A L R E P O R T 2 0 2 0
THE RISKS OF CLIMATE CHANGE
In terms of risk types current regulation was deemed to be most relevant and always included in 97 of the organisationsrsquo climate-related risk assessments This was followed by emerging regulation and technology Interestingly findings from responses submitted by global companies corroborate this trend analysis as almost all CA100+ respondents reported policy and legal risks as potential drivers for substantive impact when it comes to transition risk34 With regular compliance checks increased stakeholder concern and sustainably evolving consumer demands climate-related risk assessment procedures can help companies become better equipped to handle longer-term uncertainties and liabilities
The number of companies that identified inherent climate-related risks with potential substantive financial or strategic impact on businesses rose to 94 from 88 in 2019 Up to 63 of reporting companies were able to get to the last mile of providing a financial impact figure to the risks identified Disclosing Indian companies put the total inherent financial impact of climate risks at `7138 billion with an average risk per company being `92 billion
Companies have also identified climate-related risks across their value chain with direct operations being the most severely affected and exposed most to acute physical risks followed by emerging regulation current regulations and chronic physical risks Companiesrsquo lsquodownstreamrsquo value chain is affected the most by market risks followed by acute physical risks Downstream value chain refers to the third parties benefiting from the outputs products and services of business activities This may be a companyrsquos customers and clients or the organisations and projects the business invests in This could possibly mean that changing customer behaviour could gravely affect a business operation if there is a shift in the demand for a comparatively low-carbon intensive product as well as greater demand for product efficiency regulations and standards providing clear evidence that there is a continuous shift towards sustainable products
CLIMATE RISKS AN OPPORTUNITY TO RESTRATEGISE
Up to 94 of reporting companies have identified climate-related opportunities as having the potential to make a substantive financial or strategic impact on businesses And 63 have provided a potential financial impact figure to the opportunities related to climate change Disclosing companies put the cost of climate-related opportunities at a total of `2787 billion The figure is a testament to the evolution of the climate change mitigation program and how organisations see this
34 https6fefcbb86e61af1b2fc4-c70d8ead6ced550b4d987d7c03fcdd1dsslcf3rackcdncomcmsreportsdocuments000005312originalAnalysis_of_CA100__Data_for_CDP_Investor_Signatories_v5pdf1596046258
No of Companies
Opp
ortu
nity
typ
es
Opportunity identified in value chain
Direct operations
Downstream
Upstream
Resource efficiency
Product and services
Energy source
Markets
Resilience
41
25 18
34 7
7
9 3
3
2
3
396
6
Risks relevant to Indian companies
Current regulation97Emerging regulations90Reputation90Market85Technology85Legal
Acute physical
Chronic physical
827973
No of Companies
Risk occuring in value chain
No of Companies
Risk
type
s
Reputation
Legal
Emerging regulation
Chronic physical
Technology
Market
Current regulation
Acute physical
Direct operations
Downstream
Upstream
5115
2
2923 4 8
17
8 14 7122 4
40 5 8
2
31
11
A N N U A L R E P O R T 2 0 2 0
Similarly most companies saw resource efficiency as a major climate-related opportunity followed by energy source and products and services in their lsquodirect operationsrsquo The main drivers behind these opportunities were use of more efficient production and distribution processes use of lower-emission sources of energy and development andor expansion of low-emission goods and services In the lsquodownstreamrsquo value chain products and services was majorly witnessed as an opportunity as there is growing consumer awareness and concern around sustainability related issues As a result companies are constantly diversifying their portfolios to address these consumer needs
Prod
uct a
nd s
ervi
ces
Ener
gy S
ourc
e
Resi
lienc
e
Resi
lienc
e
Ener
gy S
ourc
e
Reso
urce
effi
cien
cyM
arke
ts
2787identified to be the financial impact of reported climate-
related opportunities (in rupee billion)
Billion
`452
328
270
18
1719
Responding companies
67Companies
identified climate related
substantive opportunities
63Companies identified
opportunitiy typesdrivers
61
Companies identified
potential financial impact driver
60
Companies provided potential financial impact
figures
42
2041
4715
136
119
42413842
Acut
e ph
ysic
alCu
rren
t reg
ulat
ion
Emer
ging
regu
latio
n
Chro
nic
phys
ical
Repu
tatio
nO
ther
s
Lega
l
Tech
nolo
gyM
arke
t
7138identified to be the financial impact of reported climate-
related risks (in rupee billion)
Billion
`Financial impact of reported climate-related risks (in rupees billion)
Financial impact of reported climate-related opportunities (in rupees billion)
12
A N N U A L R E P O R T 2 0 2 0
Tech Mahindra Tapping into climate-related opportunities
Tech Mahindrarsquos approach towards climate change mitigation strategies is a testament to the efficacy of tapping into and realising climate-related opportunities The company has adopted Science-Based Targets to reduce its emissions and is a signatory to Business Ambition of 15 degree Celsius Tech Mahindra is committed to responsibly managing its operations through continuous improvement in sustainability practices across its value chain The company focuses on carbon emission reductions energy consumption reduction self-generation of energy from renewable energy sources and encouragement for green projects through Power Purchase Agreements The company has taken a target to increase Renewable Energy (RE) to 50 by 2025 Their sustainability report is aligned with CDSB amp Task Force on Climate-related Financial Disclosures (TCFD) frameworks
A constant focus on green energy and sustainable operations has provided a significant saving of US$27 million brought about by increasing renewable energy capacity to 1383MW leading to a saving of 28 million units of electricity adopting energy efficient practices across their facilities
Tech Mahindra has harnessed the power of disruptive next-generation technologies such as Artificial Intelligence (AI) analytics and blockchain to create solutions that ensure both its own and its customersrsquo carbon footprint reduction The company has contextualised opportunities for its customers as well by creating smart city offerings such as SMART Grid Micro-Grid-As-A-Service Intelligent Electric Vehicle Charging System (IEVCS) smart energy management smart traffic management smart lightening management smart waste management systems and command amp control centres These smart city offerings will help reduce carbon footprints across multiple smart cities globally thereby reducing carbon emissions and contributing to green and sustainable solutions It is claimed that the market size for this is expected to reach US$4639 billion by 2027
At present the risks identified by the responding companies significantly outweigh the opportunities Opportunities are slow to emerge and companies need to focus on the use of lower-emission sources of energy development andor expansion of low-emissions goods and services development of climate adaptation resilience and insurance risk solutions and use of more efficient production and distribution processes
In 2015 at the request of the G20 Finance Ministers and Central Bank Governors the Financial Stability Board (FSB) and its chair Mark Carney established the industry-led TCFD This was set up in response to increasing demands from investors lenders insurers regulators policy makers and other stakeholders in the financial markets for decision-useful climate-related information CDP has aligned its information requests with the TCFD alongside introducing a sectoral focus and adopting a forward-looking approach to climate-risk disclosure We are already going in the direction of mandatory disclosure of climate risks how they are present in a companyrsquos activities how they manage it and how resilient they are to it The UK will be the first country in the world to make TCFD-aligned disclosures fully mandatory across the economy by 2025 going beyond the lsquocomply or explain approachrsquo35
35 httpswwwgovukgovernmentnewschancellor-sets-out-ambition-for-future-of-uk-financial-services
13
A N N U A L R E P O R T 2 0 2 0
Under current policies Indiarsquos projected emissions for 2030 can achieve a rating of ldquo15degC Paris Agreement compatiblerdquo if domestic emissions peak and start reducing with international support36 This shows that India has the potential to become a world leader with enhanced 15-degree compatible targets through a swift transition from coal to renewable energy Although India was already on track to meet its NDCs pre-COVID19 it has seen an even more significant drop in emissions since the onset of the pandemic During the peak of lockdown Indiarsquos energy demand reduced by almost 30 in April 202037 ie each additional week of lockdown the annual energy demand fell by 0638 This is mostly due to the significant reduction in energy consumption and power generation via fossil fuel However the impact of the pandemic on emissions is expected to be temporary and emissions are likely to rebound in 202139 as per estimations
In comparison to the NDCs which set an overall emissions target sectoral indicators can be more reliable in making informed decisions on mapping emissions reduction targeting Paris-compatible goals40 The
36 Climate Action Tracker- Fair Share37 Carbon Brief Analysis Indiarsquos CO2 emissions fall for first time in four decades amid coronavirus38 httpswwwieaorgreportsindia-202039 Carbon Brief Global Carbon Project Coronavirus causes lsquorecord fallrsquo in fossil-fuel emissions in 2020 Dec 202040 httpswwwoecd-ilibraryorgdocserver9789264273528-4-en
pdfexpires=1607881602ampid=idampaccname=guestampchecksum=891034D10FA31A953F7924772F23966D41 httpssciencebasedtargetsorgresourceslegacy201505Sectoral-Decarbonization-Approach-Reportpdf42 IPCC Mitigation Pathways Compatible with 15degC in the Context of Sustainable Development
major challenge is how to translate global temperature goals into individual actions However various strategies can be adopted to meet the long-term goals
The Science-Based Targets Initiativersquos (SBTi) Sectoral Decarbonisation Approach (SDA) allocates the well below 2degC carbon budget to different sectors taking into account inherent differences among sectors such as how fast each sector can grow relative to economic and population growth along with its mitigation potential41 According to the Intergovernmental Panel on Climate Change (IPCC) the highest global carbon budget allocation (for the period of 2011-2050) is for the power sector (25) followed by agriculture (24) and industry [including steel aluminium chemical and paper] (14)42
EMISSIONS TRENDS AND VERIFICATION
13increase in number of
organisations reporting
27increase in emissions
reporting (Scope 1+Scope 2)
90increase in scope 3 emissions reporting
India under its NDCs pledged to reduce its emissions intensity by 33-35 by 2030 compared to the 2005 levels The Climate Action Tracker38 rates Indiarsquos NDC target as ldquo2009 Copenhagen 2degC goal compatiblerdquo indicating that its commitment is a ldquofair sharerdquo of the global effort
Scope 1 and Scope 2 Emissions reported via CDP over the years
(In Million tCO2e)
2018 2019 2020
2997
55717037
14
A N N U A L R E P O R T 2 0 2 0
In order to allocate sector-specific questions to companies CDP has developed an Activity Classification System (ACS)43 It is a framework used to classify companies under the most relevant sectors It focuses on the diverse activities from which companies derive revenue associating them with the impacts to their business from climate change water security and deforestation This approach allows a better understanding of company actions based on their environmental risk opportunity and impact CDPrsquos Climate Change questionnaire requests companies to disclose their direct and indirect emissions under different emissions categories Although India saw an overall decrease in emission in 2020 there was an increase in CDP reporting companies and hence an overall increase in emissions reporting For the year
43 https6fefcbb86e61af1b2fc4-c70d8ead6ced550b4d987d7c03fcdd1dsslcf3rackcdncomcmsguidance_docspdfs000001540originalCDP-ACS-full-list-of-classificationspdf1520244912
44 The location-based method reveals what the company is physically putting into the air and the market-based method shows emissions the company is responsible for through its purchasing decisions
2020 the companies reported 70374 MtCO2e of total [Scope 1+Scope 2 (location-based)] emissions which is a 27 increase in reported emissions from 2019 This is mostly because of the significant increase in emissions reporting from several sectors mdash electric utilities cement and other heavy sectors
Only four companies chose a Scope 2 market-based approach and 43 companies selected a scope 2 location-based approach44 The total scope 2 emissions for location-based approach amounted to 181 MtCO2e and market-based approach amounted to 414 MtCO2e It is clear from this breakdown that a range of sectors and processes contribute to global emissions Focusing on any single sector alone would be insufficient However as can be seen in the
Emissions reported in Scope 3 Categories
4949
1414
1111
1010
88
55
33
Use of sold products
Purchased goods and services
Upstream transportation and
distribution
Downstream transportation and
distribution
Fuel and energy related activities (not included
in scope 1 and 2)
End of life treatment of sold products
Others
In 2020 companies have reported MtCO2e of total (Scope 1+2 [location-based]) emissions704
Gross Emissions Data 2020 (in MtCO2e)
682
126418
Gross Scope 1 Emissions
Gross Scope 3 EmissionsGross Scope 2 Emissions (Market and
Location based)
Scope 2 Location based emissions Scope 2 Market based emissions
Metal smelting refining and forming
Financial services
Cement amp concrete
Media telecommunications amp data center services
IT amp software development
Energy utility network
Chemicals
Textiles amp fabric goods
Oil amp gas processing
Biotech and pharma
Thermal power generation
Intermodule transport amp Logistics
Bar Hotels and Restaurants
Transportation equipment
Metallic mineral mining
Others
2911712
703
688536
165 292207
144118113
093087
071063
020057
024045044
157
Scope 2 Market-based emissions Scope 2 location-based emissions
Scope 2 market-based and location-based emissions reported as per CDPrsquos Primary Activity Group classification (in MtCO2e)
15
A N N U A L R E P O R T 2 0 2 0
graph for Gross Scope 2 emissions metal smelting refining and forming sectors contribute to the maximum emissions (1712 MtCO2e) followed by financial services and cement and concrete sectors
Companies reported 1259 MtCO2e of Scope 3 emissions in 2020 a 90 increase from 2019 figures due to higher disclosure as well as more companies disclosing their Scope 3 GHG inventories Almost half of the Scope 3 emissions were reported in the following categories use of sold products (49) followed by purchased goods and services (14) upstream transportation and distribution (11) and downstream transportation and distribution (10)
The ACS sectoral analysis shows that the transportation equipment activity group has the maximum reported scope 3 emissions at 615 MtCO2e followed by metal smelting refining and forming activity group at 2332 MtCO2e and cement and concrete activity group at 989 MtCO2e
Of the responding companies 33 have reported an approximately 11 of reduction in their gross global emissions (Scope 1 and 2 combined) from 2019 and 26 companies reported an approximate 57 increase in their gross global emissions from 2019 Responding companies have identified change in boundary45 as a major reason for a 62 increase in emissions from 2019 followed by acquisitions which led to a to 30 increase Amongst all sectors the electric utilities sector accounts for 83 of total increased emission values and up to 73 of these were due to change in boundary
Amongst all sectors reduction in emissions values since 2019 were mostly caused by emissions reduction initiatives (43) followed by change in output (30) and change in emission estimation methodology (23)
45 This refers to changes in the boundary used for inventory calculation ie changing from financial control to operational control This option could also apply if organisation has incorporated facilities into its inventory that were excluded in previous years
Amongst all sectors steel saw the highest reduction (around 48) in emission values and approximately half of this was achieved only from change in emission estimation methodology through recalibrating the GHG emissions for the reporting period This is followed by cement which reported a 29 reduction in emission values from implementing emissions reduction initiatives It is also noted that more than 30 of responding companies have adopted a change in renewable energy consumption but this accounts for only 35 of total reduction in emission values
Scope 3 emissions reported as per CDPrsquos Primary Activity Group classification (in MtCO2e)
of increased emissions in 2020 attributed to Change in boundary62
32 attributed to acquisitions
Metal smelting refining and forming
Cement amp concrete
Media telecommunications amp data center services
Chemicals
IT amp software development
Food amp beverage processing
Oil amp gas processing
Biotech and pharma
Thermal power generation
Land amp property ownership amp development
Financial services
Transportation equipment
Others
6157
2332
989
796
790
632
385
158
127
073
059
039
055
Third-party verification or assurance in place for Scope 12 amp 3 emissions
3571
Scope 1
3643
Scope 2 (location-based
or market based)
2786
Scope 3
a
ge o
f com
pani
es
16
A N N U A L R E P O R T 2 0 2 0
Third-party verification is one of the significant components of emission reporting An independent verification of self-reported data provides credibility and assurance It helps companies improve their internal processes identify risks and opportunities increase the reliability of their data reduce operational costs and building a strong reputation46 When an organisation monitors and verifies its emissions it can accurately identify and understand the true proportions of emissions from its sources and this can help it realise the major opportunities for emission reduction along with cost benefits
In 2020 50 companies reported third-party verification or assurance for Scope 1 emissions 51 companies for Scope 2 emissions and 39 companies for Scope 3 emissions Compared to 2019 there is an 18 increase in companies that have verified Scope 3 GHG emissions This indicates that Indian companies are becoming increasingly aware of their emission managementaccounting Amongst all sectoral companies which opt for third-party verification of their reported emissions around 25 are from IT amp software development and financial services Cement and concrete sectors rank the lowest on the list CDP encourages companies to have verified data submitted
46 The business benefits of third party verification of climate data A CDP Guide
Building a stronger reputation via third party verification
bull Increase confidence in data for internal and external use
bull Develop and demonstrate an effective carbon reduction strategy Improve business processes
bull Reduce operational costsbull Full-fill one of the mandatory criteria for entry
to the CDP A-list by gaining full points on CDPrsquos Scope 1 and 2 verification questions
bull Provide credibility for products services and internal processes
bull Counteract claims of greenwashing
17
A N N U A L R E P O R T 2 0 2 0
DECARBONISING ACROSS VALUE CHAIN Scope 3 emissions typically arise from the supply chain and the consumers using the product It has been found that the emissions from the supply chain are 5-6 times more than the carbon footprint of a companyrsquos direct operations and hence account for lionrsquos share of an organisationrsquos overall emissions47
47 httpswwwcdpnetenarticlessupply-chainsupplier-engagement-leaderboard-201948 httpswwwbcgcomen-inpublications2020supply-chain-needs-sustainability-strategy
Walking the extra mile in terms of engaging with stakeholders especially suppliers and customers on climate issues allows an organisation to consider the whole gamut of emissions and have better control over their emissions inventory For example metal companies can improve their supply chainrsquos environmental performance through adoption of a circular economy model which leads to an increased use of recycled materials in products reduces the emissions by lowering the overall burden on the manufacturing plant to produce from scratch and creates a closed-loop system with consumers48 This yearrsquos data indicates that 88 of companies engaged with their value chain partners on climate-
related issues an improvement of 5 over 2019 There was also an increase in absolute numbers -- 59 business entities collaborated with value chain partners against 49 last year
The main forms of engagement with suppliers are compliance and onboarding followed by incentivisation and information collection Educationinformation sharing collaboration and innovation are the most common customer engagement processes
Types of engagement with suppliers
No of Companies engaging with value chain on climate-related issues
2121
22
331212
1313
44
44
Other partners in the value chain customers suppliers
Other partners in the value chain suppliers
Customers
Customers Suppliers
Suppliers
Other partners in the value chain
Other partners in the value chain customers
of companies engage with their value chain partners on climate related issues an improvement of 5 from 2019
88
26
Compliance amp onboarding
16
Engagement amp incentivisation
(changing supplier behavior)
9
Information collection
(understanding supplier behavior)
7
Innovation amp collaboration
(changing markets)
No
of C
ompa
nies
18
A N N U A L R E P O R T 2 0 2 0
Organisations are mindful of the fact that climate issues need to be dealt using a participatory approach that encompasses all partners in the value chain as well as engages other external stakeholders Companies are thus getting serious about engaging in a comprehensive dialogue on climate change as this will allow them to have inputs in shaping public policy In their attempt to influence climate policies organisations are establishing communication channels with stakeholders like policymakers trade associations and research funding organisations A positive sign emerging is that majority of the businesses are agreeing to comply with environmental legislations unconditionally Energy efficiency and clean energy generation have garnered the support of 71 and 68 of responding companies respectively Mandatory carbon reporting and increased climate resilience have also found acceptance
With the COVID-19 pandemic wreaking havoc across the world and leading to the first-ever recorded recession in India it is important that companies view this as an opportunity to build a more resilient economy one in harmony with nature and encouraging of a more inclusive environment for supplier engagement that would expedite decarbonising Engaging with the value chain offer a strategic advantage as it allows companies to take a lead on corporate sustainability and puts them in a position to set the blueprint for other businesses to follow
19
A N N U A L R E P O R T 2 0 2 0
Emission reduction targets and initiatives
Targets
In recent years accelerated climate change has forced businesses to set more ambitious climate goals and commit to advocating for a low-carbon economy Today it is considered a standard practice for businesses to report their annual emissions and undertake efforts to reduce their carbon footprint Of the 67 Indian companies responding to investor requests 57 have undertaken a total of 95 emissions reduction targets including absolute targets intensity targets and both absolute and intensity targets 24 of these were approved SBTs
The global pandemic has reinforced the need for business resilience in operations and corporate leaders have started recognising that science-based climate action goes hand-in-hand with building business success49 Companies are looking science-based targets as guiding lights with a defined pathway to future-proof growth and with impending climate change hazards more companies have doubled down on their commitments towards a low-carbon transition50 The momentum for SBTs has reached across a range of industries including cement
49 The new normal 1000 companies are now setting science-based climate targets - Science Based Targets50 httpswwwcdpnetenarticlesclimate2020-lessons-from-an-extraordinary-year
automobiles pharmaceuticals metals amp mining real estate and information technology
As more companies are striving toward commitments this year witnessed an increase in the number of approved SBTs from seven targets last year to 24 targets this year
Leading companies are moving forward by setting long-term emissions reduction targets to mitigate climate-related risks Compared to 2019 this year more targets
were set under a long-term time frame till 2030 and a lesser focus had been given on short-term targets ie till 2020 Most of the companies selected a base year of 2018 and had gone for the intensity targets Hence in upcoming years long-term targets can play a major role for companies to support their sustainability visions and their journey towards low-carbon transition Apart from these companies also reported 83 other targets which included 38 energy consumption targets 13 energy productivity targets and 11 waste management targets amongst others
TARGETS amp PERFORMANCE
More than
three times increase in the number of approved science-based targets
of the responding companies set long-term targets (ie till 2030)
50
15
Absolute target
5Both absolute and intensity
targets
37
Intensity target
10
No target
No of Companies
GHG Emission Reduction Target Types
Absolute emission targets count
Intensity emission targets count
Types of targets based on time-frame of target year
820
Till 2020
1929
Till 2021 - 2030
136
2031 and beyond
20
A N N U A L R E P O R T 2 0 2 0
Emission reduction initiatives
While the number of companies taking up Emission Reduction Initiatives (ERI) has grown from 53 to 58 the number of initiatives has declined from 293 to 287 resulting in a 13 decrease in the estimated annual CO2e savings this year
Energy efficiency in production processes and in buildings continue to account for most ERIs non-energy industrial process emission reductions have been outweighed in their CO2e saving potential
Other emission reduction initiatives such as upgrading equipment with high-efficiency alternatives and digitisation initiatives undertaken by banks accounted for the highest estimated CO2e savings In terms of the highest monetary savings energy efficiency in production processes contributed to 76 of monetary savings followed by energy-efficiency in building services
The steel sector had the highest number of initiatives for energy efficiency in production process and accounted for
of total estimated annual CO2e savings
88Monetary Savings from Emission Reduction Initiatives
Annual monetary savings (Million `) No of Initiatives
20611 1918 576 237 148Energy
efficiency in production processes
Non-energy industrial process
emissions reductions
Other initiative
Waste reduction
and material circularity
Energy efficiency in
buildings
150
63 1210
2
Emission Reduction Initiatives
6340 2772 2574 2016 1278
6310
150
122
Other initiatives
Non-energy industrial process
emissions reductions
Energy efficiency in production processes
Waste reduction
and material circularity
Energy efficiency in
buildings
No of InitiativesEstimated annual CO2e savings (MtCO2e)
21
A N N U A L R E P O R T 2 0 2 0
The rise in climate consciousness among Indian companies is evident from the growing number of those committed to the Science Based Target Initiative (SBTi) By 2020 52 companies have committed to it with a significant growth of more than 37 over last year India is now the leader from emerging economies for having the maximum number of companies committing to SBTi and globally it stands at the sixth position
Of the 52 committed companies 22 have further approved SBTs in 2020 compared to 10 in 2019 The initiative champions SBT setting as a powerful way of future-proofing companiesrsquo growth in the transition towards a low-carbon economy51 The initiativersquos overall aim is for SBT setting to become a standard business practice and for companies to play a major role in driving down global GHG emissions Embedding SBTs as a fundamental component of sustainability management practices is crucial for achieving this
The Sectoral analysis of the Indian SBTi companies highlights the number of companies that are committed to the initiative and the number of those with approved set targets across each sector
51 httpssciencebasedtargetsorgresourcesfilesSBTi-manualpdf52 httpssciencebasedtargetsorgresourceslegacy201805SBT-transport-guidance-Finalpdf
Compared to last year the automobiles and components sector is still leading with the highest commitment and targets set The automobile sector is one of the fastest growing sectors which represents 23 of all energy-related global emissions52 Decarbonisng the automobile sector is possible through disruptive technological innovation land-use planning and transport demand management modal shift and
shifting to electric mobility Companies that set ambitious SBTs can send a strong signal for local regional and national policies to increase the level of ambition and steer the transition
In 2020 28 SBTi committed companies responded to CDPrsquos Investor request to disclose to the Climate Change questionnaire The emissions profile shows that the overall Scope 1+ Scope 2 emissions of SBTi companies responding to CDP represent almost 20 of the total Scope 1+ Scope 2 emissions and 71 of the total Scope 3 emissions in the overall CDP India Investor sample
A greater share of Scope 3 emissions reported by SBTi companies indicate that there is now a greater focus on the Scope 3 GHG Inventory as the companies are planning to set SBTs in coming years As per the SBTi a complete Scope 3 screening or inventory is required for the validation of the SBTs and it is not acceptable to exclude any relevant categories
What is a lsquoScience-Based Targetrsquo
Science Based Targets are the GHG emissions reduction targets consistent with the level of decarbonisation that according to climate science is required to limit global temperature increase to 15- 2ordmC compared to pre-industrial temperature levels
Science Based Target ensures that the company is taking shorter-term action to reduce emissions at a pace that is consistent with keeping warming below 15ordm well-below 2ordm C
SCIENCE-BASED TARGETS AMBITIOUS CORPORATE CLIMATE ACTION
200
128107
74 57 52
United States of America
(USA)
United Kingdom
(UK)
Japan Sweden IndiaFrance
No of Companies
Top 5 countries with SBTi companies
22 28 303
No
of C
ompa
nies 10
22Status of SBTi Companies in India
Committed Target Set
22
A N N U A L R E P O R T 2 0 2 0
CDP India data shows that 33 companies have reported reduction in their gross global emissions (Scope 1 and 2 combined) from the previous reporting year whereas 26 companies have their gross global emissions increased for this reporting year
CDPrsquos data shows that there are 32 companies that are considering setting a SBT in the next two years compared to 29 companies in the previous reporting year There are 11 intensity and eight absolute targets that companies consider to be SBT but this has not been approved by SBTi yet
The increase in these target number highlights that there are more companies which seek to commit to SBTi and get their targets validated in the coming years
Growth in ambition
CDPrsquos five-year data shows a rise in the number of Indian companies committing to the SBTi Their reported emissions increased by 144 due to increased commitment from energy intensive companies this year which includes companies from cement and metal and mining sectors
CDP India investor responding companies
SBTi companies (28 companies respond to CDP)
Emissions Profile (MtCO2e)
6815
134
Scope 1 Scope 2
22282
Scope 3
1259896
NO of Companies
Water Transportation
Professional Services
Textiles Apparel Luxury Goods
Software and Services
Pharmaceuticals and Biotech
Mining - Metals (Iron Aluminium Other Metals)
Food Production - Agricultural Production
Electrical Equipment and Machinery
Electric Utilities and Energy Related
Commercial services and supplies
Air Freight Transportation and Logistics
Food and Beverage Processing
Electric Utilities and IPPs and Energy Traders
Construction Materials
Automobiles and Components
Consumer Products and Durables
Banks Diverse Financials and Insurance
Chemicals
Hospitality
Real Estate
Telecommunications
1
1
3
2
2
2
1
1
1
1
1
1
1
1
2
3
3
2
1
1
6
2
4
1
1
2
3
3
Sectoral Analysis of Indian SBTi companies
Committed Companies Target Set Companies
33
14
Decreased
26
12
Increased
62
Reporting for the first time
1No Change
CDP India investor responding companies
SBTi companies (28 companies respond to CDP)
Comparison of change in gross Scope 1+2 emissions from previous year for SBTi companies vis-agrave-vis CDP reporting
companies
Emission Reduction Targets Reported by Companies in 2020
3
Not SBT not anticipating setting in 2
years
24
8
Not SBT but anticipating setting
in 2 years
4 5
Yes this is SBT approved by SBTi
11 8
Yes this is SBT not approved by
SBTi
Intensity emissions reduction target
Absolute emissions reduction target
No
of c
ompa
nies
23
A N N U A L R E P O R T 2 0 2 0
We witnessed the highest number of SBTi companies responding to CDP India this year which is a 40 growth from last year This further proves that companies are becoming more responsible towards disclosing their GHG Inventory with greater transparency
The graph for the estimated annual carbon savings shows the top three emission reduction initiatives undertaken by SBTi companies reporting to CDP It is evident that over the years low carbon energy purchase and energy efficiency process have gained momentum in reducing GHG emission with an increase in the number of SBTi committed companies implementing these initiatives Maximum carbon savings of 791 MtCO2e have been reported from the cement and concrete sector The metal smelting refining amp forming sector has reported 59237 tons CO2e savings this year with a significant decrease from 70422 tons CO2e savings in the last year There has been a reduction of 443 MtCO2e of estimated annual carbon savings reported by SBTi companies in 2020 as compared to the last year
Data shared by three reporting companies that have also committed to the SBTi (Ambuja Cement Ltd ACC Limited and Ultratech Cement Limited) shows that improving energy efficiency in their production processes has led to cement being the leading sector in reducing GHG emissions
About SBTi
The Science Based Targets initiative champions science-based target setting as a powerful way of boosting companiesrsquo competitive advantage in the transition to the low-carbon economy
It is a collaboration between CDP the United Nations Global Compact (UNGC) World Resources Institute (WRI) and the World-Wide Fund for Nature (WWF) and one of the We Mean Business Coalition commitments
The initiative
bull Showcases companies that set science-based targets through case studies events and media to highlight the increased innovation reduced regulatory uncertainty strengthened investor confidence and improved profitability and competitiveness generated by science-based target setting
bull Defines and promotes best practice in science-based target setting with the support of a Technical Advisory Group
bull Offers resources workshops and guidance to reduce barriers to adoption
bull Independently assesses and approves companiesrsquo targets
Indian SBTi companies responded to CDP Climate Change Investor Program 2020
54
Increase in SBTi companies responding to CDP via 2020 climate Change Investor Disclosure Program compared to previous year
40
Increase in Scope 1+2 Emissions and
Indian SBTi Companies responding to investor request reported reduction in Gross Global emissions compared to previous year
Increase in Scope 3 Emissions covered by SBTi Companies this year as compared to 2019
14450
185
Comparison of Absolute Scope 1+2 emissions (MtCO2e) for SBTi companies reporting to CDP
Emission reported in MtCO2e SBTi companies reporting to CDP
15 16 15 18 20 28
2015 2016 2017 2018 2019 2020
Abso
lute
Sco
pe 1
+2 E
mis
sion
(MtC
O2 e
)
364
8
380
4
479
4
605
5
583
4
142
26
24
A N N U A L R E P O R T 2 0 2 0
Advantages 53
1 Reducing regulatory risks and uncertainties As the government continues to work on implementing the Paris Agreement and meeting the ambition of the country-level pledges Science Based Targets initiative can prove out to be a resilience against the upcoming regulations
2 Strengthening Investor Confidence SBTi can help in strengthening the investor confidence as the investors are highly taking interest in businessesrsquo environmental policies
53 httpssciencebasedtargetsorgblogsix-business-benefits-of-setting-science-based-targets
3 Competitive Edge Companies are getting ahead of their peers by succeeding in the low-carbon transition with increased innovation reduced uncertainty strengthened investor confidence and improved profitability
4 Brand Reputation SBT is a global Initiative which shows robustness confidence and credibility which further helps in building up the brand reputation
Estimated annual CO2e savings of SBTi companies (in lsquo000 tCO2e)
2
Develop Target
3
Submit target for validation
4
Announce Target
1
Commit
Joining Call to Action
We look forward to companies taking action by committing to develop Science-based Targets
68
Energy efficiency Processes
Low carbon energy purchase
Energy efficiency Building services
Estim
ated
ann
ual C
O2e
sav
ings
(in
000
tCO
2e)
60126
2018 2019 2020
124
5184
346
43
7911168
25
A N N U A L R E P O R T 2 0 2 0
Science Based Targets Incubator is a unique project of CDP that was launched in April 2020 with support from MacArthur Foundation amp Shakti Sustainable Energy Foundation in partnership with WWF India to provide technical support with the main objective of handholding and catapulting organisations from commitment stage to target development stage of Science Based Targets Initiative Value Proposition
1 There will be no financial implication on the company
2 Case studies of businesses with validated targets will be shared with the participating companies for peer-to-peer learning
3 Capacity Building workshops and webinars based on recent developments and various other nitty-gritty of SBTi
4 In house trainings and one-on-one meetings with companies where CDP India will explain all stages of the SBTi and provide answers to all the technical queries
26
A N N U A L R E P O R T 2 0 2 0
BUSINESS AMBITION FOR 15degC
lsquoBusiness Ambition for 15degCrsquo is an urgent call to action from a global coalition of UN agencies business and industry leaders Businesses can make a critical contribution to limit the worst impacts of climate change by setting a net-zero target in line with 15degC future57
So far over 300 companies representing more than $36 trillion in market cap have responded to the open letter from global leaders and signed the Business Ambition for 15degC commitment
bull In India 13 companies55 have already aligned and set their target with the most ambitious aim of the Paris Agreement to level global temperature rise to 15degC above preindustrial levels
bull Automobiles and Components and Real Estate are the top sectors that have approved targets aligning with 15degC Ambition
bull In India 13 companies are further committed to Business Ambition for 15degC
bull All the companies in the Real Estate sector from India have approved targets aligning with 15degC Scenario
54 httpssciencebasedtargetsorgbusiness-ambition-for-1-5c55 Mahindra Logistics Ltd Mahindra Heavy Engines Ltd White House Dr Reddys Laboratories Ltd Mahindra EPC Irrigation Limited Swaraj Engines Limited Gromax Agri Equipment
Limited Mahindra Accelo Mahindra Holidays and Resorts India Limited Mahindra Lifespaces Developers Limited Mahindra World City (Jaipur) Ltd Mahindra World City Developers Ltd and Polygenta Technologies Limited
56 httpssciencebasedtargetsorgnet-zero
Net zero a north star for climate action
According to the latest report by the IPCC to limit global warming to 15degC above pre-industrial levels and to avoid the most disastrous impacts of climate change the world must halve CO2 emissions by around 2030 and reach net-zero CO2 emissions by 2050
Companies are increasingly adopting the net-zero climate targets by recognising the importance of keeping global warming to 15degC Between July 2019 and June 2020 over 230 companies committed to reach net-zero emissions as part of the Business Ambition for 15degC campaign an urgent call-to-action for companies to set emissions reduction targets in line with a 15degC future The campaign is led by the SBTi and supported by a global coalition of UN leaders business organisations and NGOs56
27
A N N U A L R E P O R T 2 0 2 0
A carbon price is a cost applied to carbon pollution to discourage polluters Economists agree a carbon price is the single most effective tool for countries to reduce their emissions57 Corporations have been using internal carbon pricing (ICP) as a strategy to manage climate-related business risks and prepare for the transition to a low-carbon economy Carbon pricing policies create strong transparent incentives for firms to internalise the social costs of carbon emissions58 Major investors and financial regulators are calling for businesses to disclose their climate risks and their policies to mitigate emissions59 The most sought-after benefits are that a company can use ICP both as a risk management tool and as a part of its decarbonisation strategy
To see how fast carbon pricing is spreading consider Paragraph 136 of the decision text of the Paris Agreement ldquoproviding incentives for emission reduction activities including tools such as domestic policies and carbon pricingrdquo The final agreement recognised carbon pricingrsquos importance as a powerful incentive to cut emissions by companies and regional state and local governments
The IPCC special report on the impacts of global warming of 15 degC above pre-industrial levels states that an explicit carbon pricing mechanism can theoretically achieve cost-effective emission reductions Along with best practice policies a moderate carbon pricing can help reduce global CO2 emissions significantly60 Parties are encouraged to set prices consistent with Carbon Pricing Leadership Coalitionrsquos
57 What is a carbon price and why do we need one58 Energy the Environment and Technological Change59 Firms ignoring climate crisis will go bankrupt says Mark Carney60 An I P C C Special Report on the impacts of global warming of 15 C above pre-industrial levels and related global
greenhouse gas emission pathways in the context of strengthening the global response to the threat of climate change sustainable development and efforts to eradicate poverty Intergovernmental Panel on Climate Change (2018)
61 Carbon Pricing WBCSD policy paper 2019httpsdocswbcsdorg201909Carbon-Pricing-WBCSD-Policy-Paper-2019pdf WBCSD 2019
62 SHOULD EVERY COUNTRY ON EARTH COPY SWEDENrsquoS CARBON TAX63 httpswwwedienetregistrationregwall
(CPLC) high-level commission on carbon pricing which states that an explicit-price range of US$50ndash100tCO2 by 2030 will be consistent with delivering the Paris Agreement61
Carbon prices have varied widely across existing schemes Success stories such as that of Sweden which currently has the highest carbon price in the world at US$123tCO2 demonstrate that it is indeed possible to make carbon pricing work while the Swedish economy grew by 78 since the introduction of the Swedish carbon tax in 1991 carbon emissions have decreased by 2662 Other countries like The UK
(US$4229) Netherlands (US$3638tCO2) have also committed to increasing their carbon prices in the coming decade63 The worldrsquos top three emitters -- US China and India -- however have put negligible prices on carbon
As part of the lsquoBuild Back Betterrsquo strategy carbon pricing can be a valuable tool
US$123tCO2
Sweden
US$4229tCO2
UK
US$3638tCO2
Netherlands
INTERNAL CARBON PRICEndash ROBUST CLIMATE STRATEGY
28
A N N U A L R E P O R T 2 0 2 0
to guide investment decisions It can help focus on a green stimulus package to recover from the old economy which promotes a carbon-intensive future Different stimulus measures can help clean energy technologies compete with carbon-intensive alternatives and encourage more efficient energy use India is witnessing this momentum ndash a Declaration on Climate Change was signed by 24 key industry captains and Ministry of Environment Forest and Climate Change (MoEFCC) at the virtual India CEO forum on Climate Change on 5th December 2020 Shri Javadekar further said that this declaration by private sector companies voluntarily is a historic step
To guide companies in the implementation of climate-related financial disclosures the TCFD65 developed four recommendations mimicking an organisational structure Governance Strategy Risk Management and Metrics and Targets An ICP is a proposed metric through which entities can safeguard their businesses by internalising market signals The TCFD specifically lists ICP as a key metric to assess climate-related risks and opportunities in line with its strategy and risk management process By attributing a financial cost to risks associated with carbon emissions and translating them into a uniform metric financial decision-makers can integrate transition risks into their business decisions and fill the analysis gap for assets of various time horizons
64 httpnbrienvisnicinViewGeneralLatestNewsaspxId=9829ampYear=202065 httpnbrienvisnicinViewGeneralLatestNewsaspxId=9829ampYear=202066 Implementing the Recommendations of the Task Force on Climate-related Financial Disclosures The Taskforce on Climate-related Financial Disclosures June 2017
Mr Ravi S Prasad Additional Secretary spoke about a coordinating structure for implementation of Paris Agreement which will incorporate internal carbon pricing67
The MoEFCC also constituted a high-level inter-ministerial Apex Committee for Implementation of Paris Agreement (AIPA) in December 2020 under the chairmanship of the Secretary MoEFCCThe purpose of AIPA is to generate a coordinated response on climate change matters that ensures India is on track towards meeting its obligations under the Paris Agreement including its NDC
Senior officials from 14 ministries will serve as Members to AIPA who will oversee the progress in implementation of Indiarsquos NDC and receive periodic information updates to monitor review and revisit climate goals to fulfil the requirements of the Paris Agreement Another key function of AIPA would be to operate as a National Authority to regulate carbon markets in India under Article 6 of the Paris Agreement formulate guidelines for consideration of projects or activities under the article issue guidelines on carbon pricing market mechanism and other similar instruments that have a bearing on climate change and NDCs
It will take note of the contributions of the private sector as well as multi-bi-lateral agencies in the field of climate change and provide guidance for aligning their climate actions with national priorities
ICP will be a useful preparatory tool for future government climate policies
Investors are increasingly demanding comprehensive climate disclosures
It will stay and will be instituted more commonly
A robust carbon pricing system plays an important role in driving
GHG reductions
It complements climate policies for sustained and successful
emissions reductions
It helps make informed decisions and incentivies
low-cost abatement options
Business case for pricing carbon
29
A N N U A L R E P O R T 2 0 2 0
When disclosing on ICP the TCFD recommends that companies should disclose on the followingbull what assumptions are made about how carbon price(s)
would develop over time (within tax andor emissions trading frameworks)
bull geographic scope of implementationbull whether the carbon price would apply only at the mar-
gin or as a base costbull whether the price is applied to specific economic sec-
tors or across the whole economy and in what regionsbull whether a common carbon price is used (at multiple
points in time) or differentiated prices bull assumptions about scope and modality of a CO2 price
via tax or trading scheme
67 httpswwwgreentechmediacomarticlesreadeuropean-oil-majors-ready-to-scale-up-energy-transition-investment68 httpswwwgreenbizcomarticlebp-walks-away-three-us-trade-groups-over-carbon-pricing69 Convention on Biological Diversity ndash Markets for Carbon Offsets Accessible at httpswwwcbdintfinancialoffsetsg-offsetclimatecarbonpdf page 8
Earlier this year BP one of Europersquos oil supermajors announced a carbon price of US$100tonne of CO2 a giant increase from their previous price of US$4067 and walked away from three US-based oil and gas trade organisations - American Fuel and Petrochemical Manufacturers (AFPM) the Western States Petroleum Association (WSPA) and the Western Energy Alliance (WEA) over differences regarding policy positions on carbon pricing68
CDP has been asking companies to disclose their practice of using ICP since 2013 In 2020 23 of the investor responding companies have reported putting a price on carbon as compared to last yearrsquos 19 while the number of companies planning to price in the next two years reduced to 21 from 23 in 2019 After adding Supply Chain responding companies a total of 58 companies are pricing or are planning to price carbon in the next two years in 2020 a 12 increase from 2019 It was further seen that of the 23 companies that are pricing carbon in 2020 52 use a shadow price followed by implicit price
The Task Force defines an internal carbon price as ldquoan internally developed estimated cost of carbon emissionsrdquo which can be used as a planning tool to help identify revenue opportunities and risks as an incentive to drive energy efficiencies to reduce costs and to guide capital investment decisions69
52
26
4
9
44
Shadow price
Implicit price
Implicit price Internal fee
Internal fee
Offsets
Implicit price Shadow price
Types of ICP used by Indian companies
Pricing Planning to price in the next 2 years
2
25
2015
8
36
2016 2017
26
14
2018
14
32
2019
20
31
2020
2533
No
of C
ompa
nies
ICP trend in India
30
A N N U A L R E P O R T 2 0 2 0
Type of ICP Shadow price Carbon fee Implicit price Internal trading
Description Hypothetical cost of carbon emissions
A per-unit fee based on the amount of GHG the company emits (eg `700 per tCO2e)
Helps quantify the capital investments required to meet climate-related targets
Allows business units within a company to trade their allocated carbon credits based on respective emissions
Objectivesusage
The most common form of ICP is a shadow price helps organisations better understand the impacts of climate-related risks such as technological shifts or future regulations It can help a company with both risk management as well as internal strategic planning
It allows companies to model or test how a range of carbon prices affect their divisions capital investments and other planned projects It is similar to forecasting with a range of energy prices
Putting a fee on carbon helps create an actual pool of funds generating a revenue stream to help pave the way for greener projects and further RampD This prepares a company for a carbon-resilient world This tool has the ability to encourage a business to transform into an environmental leader It allows for the creation of internal funds to invest into energy efficiency or renewable energy projects in order to cut energy costs
It also builds awareness of the importance of emission reductions within different business units
An implicit price helps companies understand their initial carbon footprint and is also used as a benchmark to implement a more strategic internal price
Internal trading helps create awareness It allows companies to prepare for stringent forms such as shadow prices or internal fees
Method An additional criterion is introduced in investment analysis during the calculation of the internal rate of return (IRR)
The additional criterion is the carbon value which is incorporated into each investment decision and applied to resulting GHG emissions This carbon price is assumed the same way assumptions are made about exchange rates or commodity prices
It is implemented by voluntarily adding a cost to GHG emissions in relation to operational costs
It increases the operating expenses (OPEX)
There are short-term emissions reductions Transfers of actual funds within the company are done through two mechanisms First by offsetting GHG emissions by purchasing offset credits externally Second by providing internal financing for emission reduction projects low- carbon products amp services and RampD
The carbon fee also provides monetary incentives for pro-environment initiativesactivities
Some companies with emissions reduction or renewable energy targets calculate their lsquoimplicit carbon pricersquo by dividing the cost of abatement procurement by the tonnes of CO2e abated
Trading is driven by the allocation of a fixed number of carbon dioxide emission lsquoallowancesrsquo for individual business units with each allowance equivalent to 1 metric tCO2 If business units exceed their cap they must purchase additional allowances to offset their excess emissions
Where business units under-emit they may sell allowances Business units may also choose to invest in carbon offsets outside their own units in order to sell on the internal trading scheme72
A sectoral analysis of the data finds two high emissions intensive sectors cement and concrete followed by IT and software development An increasing number of companies from cement and IT sectors are now committing to the SBTi and moving towards aligning emissions in line with 15-degree an ICP in such cases can be effectively used as a tool for mitigating climate risks and achieving the greater goal of a SBT or a net-zero target It helps companies build their internal capacity and measure their progress
1313
2626
2222
1313
44 44
1818
Metal smelting refining amp forming
Cement amp concrete
IT amp software development
Biotech amp pharmaFood amp beverage
processing
Chemicals
Transportation equipment
31
A N N U A L R E P O R T 2 0 2 0
Below are the ICP disclosed by Indian companies in 2020
Company Price in INR (`) Price in USD ($) Type of ICP used
ACC 2541 3394 Implicit price Shadow price
Ambuja Cements 21639 3074 Implicit price
Dalmia Bharat Ltd 77334 11 Shadow price
Dr Reddyrsquos Laboratories 937 1332 Implicit price
Godrej Consumer Products Limited 750 10 Shadow price
Godrej Industries 740 10 Shadow price
Hero Motocorp Ltd private private private
Hindustan Zinc 111846 159 Implicit price
Infosys Limited 100182 1425 Implicit price
JSW Cement Limited 1566 21 Shadow price
JSW Steel Ltd 1400 20 Shadow price
Mahindra amp Mahindra 98242 1397 Internal fee
Mindtree Ltd private private private
Shree Cement private private private
Tata Chemicals 140607 20 Shadow price
Tata Consultancy Services 1131 1608 Implicit price Shadow price
Tata Consumer Products Ltd 315 448 Offsets
Tata Motors 980 14 Shadow price
Tata Steel 975 - 2720 15 -3868 Implicit price Shadow Price
Tech Mahindra 70303 10 Implicit price Internal fee
Ultratech Cement 750 1066 Shadow price
Wipro 352291 5011 Shadow price
Since these companies did not provide a conversion rate the average conversion rate for the 2019 calendar year was taken (1` = 0014224USD)
Managing climate risk with Internal Carbon Price and Science Based Targets
By integrating ICP into ambitions targets set by SBT companies can achieve greater emissions reduction SBTs empower companies to engage internal teams with a common data-driven goal and integrate their carbon reduction strategies with other business objectives70 A step that organisations can take to implement TCFD recommendations as well as achieve their SBTs is putting an internal price on carbon It is observed that having an internal carbon price can enhance an organisationrsquos competitiveness71 Several companies are already using ICP to highlight their progress towards targets and inform a business case for low-carbon investments Of the 25 companies that have disclosed to CDP in 2020 13 that committed to SBTi also have an ICP
Setting a carbon price can be a strong commitment towards driving change and action Clear goals for the ICP enable
70 Science-Based Targets How Aligning Carbon Reduction Targets With Climate Science Can Drive Business Growth SampP Dow Jones Indices 201771 httpswwwgreenbizcomarticlemanaging-climate-risk-carbon-pricing-and-science-based-targets72 CDP Handbook on Carbon Pricing73 httpswwwcdpnetenreportsdownloads491874 httpsb8f65cb373b1b7b15feb-c70d8ead6ced550b4d987d7c03fcdd1dsslcf3rackcdncomcmsreportsdocuments000002771originalCDP-Carbon-Pricing-Handbook
pdf1508927220
companies to make better decisions regarding the type and price of carbon72 A high-level commitment can provide a companyrsquos perspective and insight on how other companies have been able to adopt innovative financing practices such as ICP and carbon taxes which are spurred by setting ambitious targets in line with the SBT initiative
In January 2020 in partnership with TERI CDP India released a second handbook in ICP - Putting a Price on Carbon A Handbook for Indian Companies 20 73 a second edition to the handbook released in October 17 74The first handbook was prepared to lay out the landscape of carbon pricing and help companies understand about external and ICP along with guidance on how to approach an internal carbon price The aim of the second handbook was to further mobilise the adoption of internal carbon price by companies The handbook discusses steps to arrive at a price and use it in an organisation including details on indicative pricing levels
32
A N N U A L R E P O R T 2 0 2 0
ACC Ltd are using internal carbon price as a tool to drive and incentivise low-carbon initiatives and emissionenergy reduction projects We have observed that ICP helps ROI to look attractive and helps us make informed decisions
ACC Ltd has already committed and published their 2030 targets for specific CO2 emission reduction and use of waste derived resources (as a part of SD 2030 plan) We have also committed to SBTi and are working on setting stricter targets aligning with below 2 DS To achieve these commitments and relevant targets we believe that ICP may play an important role in prioritising our future actions and investments Going forward we also plan to use the ICP for managing risk and leveraging opportunities
mdash ACC Ltd
Steps to Setting an
internal carbon price
Make a commitment
Communicate your progress
Set the scope of the internal carbon price
Decide price level and variance
Monitoring and reporting
Define the type of ICP
01
02
03
0405
06
07
08
Map your objectives
Establish the degree of influence in business application
33
A N N U A L R E P O R T 2 0 2 0
THE RENEWABLE ENERGY THRUST In 2020 the 67 companies headquartered in India have reported a total of 291 Terra Watt hours (TWh) electricity consumption more than double the previous yearrsquos number Notably the significant increase in total electricity consumption is attributed to just one company ndash Vedanta Limited with 151 TWh of electricity consumption for its global operations
The total electricity consumption excluding Vedanta is 140 TWh 48 higher than the previous year The rise in the total reported electricity consumption is primarily due to an increase in the number of responding companies from the energy intensive sectors These 67 companies have consumed about 16 TWh renewable electricity which is 6 of the total electricity consumption reported in 2020 The share of renewable electricity is 11 without counting Vedanta in the sample This is 6 higher than the previous year
The growth in the share of renewable electricity consumption is due to multiple factors such as the increasing number of voluntary corporate GHG emission reduction targets renewable energy targets and compliance targets such as Renewable Energy Purchase Obligations (RPO) In 2020 18 companies from India have reported various types of renewable energy targets Some of these companies have taken more than one renewable energy target type These 18 companies have reported 98 TWh of electricity consumption of which 13 is from renewable energy sources The level
Type of renewable energy targets
Renewable Energy Targets
17
1 1 2Renewable Electricity
Consumption
Renewable Electricity
Production
Renewable Electricity Capacity
Renewable Energy Financing
Target
No
of C
ompa
nies
RE100 is the global corporate renewable energy initiative bringing together hundreds of large and ambitious businesses committed to 100 renewable electricity Led by the Climate Group and in partnership with CDP RE100rsquos mission is to accelerate change towards zero carbon grids at scale There are 4 companies headquartered in India that have committed to the RE100 initiative - Dalmia Bharat Ltd Infosys Ltd Mahindra Holidays amp Resorts India Ltd and Tata Motors Ltd
The RE100 membership continues to grow and diversify - with 42 of new members coming from the Asia-Pacific region in 2020 With 260+ members and gt278 TWh of electricity consumption aggregated electricity demand of RE100 members is higher than Australiarsquos The share of renewable electricity is 42 of total consumption showing strong progress towards 100 goal
Over 70 global RE100 members have operations in India ndash with gt2 TWh of electricity consumption in the country About 39 of electricity consumed in India came from renewable energy sources largely sourced through unbundled energy attribute certificates and power purchase agreements
Visit RE100org and follow RE100 on Twitter
34
A N N U A L R E P O R T 2 0 2 0
Note Some companies have reported renewable electricity consumption total instead of break-down details as per the sourcing method Data for those companies is not included in the above chart
131
17
03
01
Renewable Electricity Sourcing Methods (TWh)
Self-generation
Unbundled Energy Attribute Certificates (EACs)
Power Purchase Agreement (PPA)
Green Electricity Products
of ambition ie a share of renewable energy in the target year for most of the companies varies between 20-100 Showing the leadership in renewable electricity sourcing 3 companies75 have committed to source 100 renewable electricity across their operations and joined RE100 initiative
GHG emission reduction targets are popular among companies in India and 57 companies have reported absolute intensity or both absolute and intensity targets Among these 30 companies have committed to science-based targets Initiative and their targets are in line with climate science Six companies have dedicated scope 2 emission reduction targets Scope 2 emissions are indirect emissions from the generation of purchased energy consumed by the reporting company Companies with GHG emission reduction targets tend to source renewable energy to reduce their emissions primarily scope 2 emissions The Majority of these companies have taken exclusive renewable energy targets to support meeting their GHG emission reduction targets
Renewable energy plays an important role in the corporate value chain due to its zero-carbon intensity and ability to provide long-term energy security About 34 companies have identified opportunities related to shifting energy usage towards low-carbon energy sources across the value chain Of these 32 have identified opportunities in the direct operations followed by 6 companies in the upstream and 2 in the downstream of the value chain These companies have estimated energy related opportunities worth `317 billion mainly in the direct operations Half of these companies anticipate short time frame (1-5 years) to tap these
75 4 India headquartered companies are committed to the RE100 initiative 3 of them report to CDPrsquos climate questionnaire
opportunities Companies have not just identified energy related opportunities but implemented energy related initiatives in the reporting year across their operations About 31 companies have implemented low-carbon energy consumption or production related initiatives in the reporting year that resulted in an estimated annual carbon savings of 18 million tCO2 and `27 billion of annual monetary savings
Companies from the manufacturing and materials sectors have reported the highest volume -14 TWh of renewable electricity consumption Manufacturing sector companies are relatively performing better than companies from the materials sector in terms of the share of renewable energy in total electricity consumption There are 25 companies from these two sectors mainly energy intensive business such as cement metals and mining steel and transport original equipment manufacturers (OEMs) The aggregate electricity consumption of these companies is over 100 TWh The companies from the fossil fuel-based energy generation are not included in the following charts
A detailed breakdown shows that self-generation of renewable electricity is the most preferred sourcing option among companies followed by purchase of renewable electricity through unbundled Energy Attribute Certificates (EACs) and Power Purchase Agreement (PPA) with an onsiteoffsite generator Up to 10 companies have reported 03 TWh of total renewable electricity consumption via PPA (on-grid and off-grid) which has declined from 11 TWh of consumption reported in the previous year
35
A N N U A L R E P O R T 2 0 2 0
Materials Manufacturing Food beverage amp agriculture
Biotech health care amp pharma
OtherInfrastructureServices
3
17
6
35
3
20
12
Total Electricity Consumption (TWh) Total RE Consumption (TWh) RE
Electricity consumption by sector with Vedanta Limited included in the analysis
Electricity consumption by sector excluding Vedanta Limited
Materials Manufacturing Food beverage amp agriculture
Biotech health care amp pharma
OtherInfrastructureServices
7
17
35
20
1236
Total Electricity Consumption (TWh) Total RE Consumption (TWh) RE
TWh
TWh
36
A N N U A L R E P O R T 2 0 2 0
2737worth opportunities
identified
Billion
`
16of Renewable Electricity Consumption Reported
TWh
704of total [ Scope
1+2location-based] emissions reported
MtCO2e
7138Inherent financial
risk identified
Billion
`
25have Internal Carbon
Pricing
Companies 52Companies in India
SBTi
37
A N N U A L R E P O R T 2 0 2 0
WATER SECURITY The way out of water crisis
Five of the worldrsquos largest cities under water stress are in India with Delhi ranked second on the list76 The water crisis is more alarming than imagined ndash 600 million people in India face high-to-extreme water stress77 Indiarsquos water demand is projected to increase by two times the available supply by 2030 putting hundreds of million people at the risk of water scarcity and ultimately losing the country 6 of its GDP78 In 2019 the country witnessed the worst droughts in recorded history Over 500 million people were affected across the country and major cities such as Chennai experienced lsquozero dayrsquo scenarios wherein water literally ran out Since improvements in water security are essential for Indiarsquos development investing in water merits a sound business case
Though 80 of Indian states have legislations on water conservation and prevention of encroachment of water bodies79 poor data management absence of water pricing inefficient irrigation techniques and the lack of adequate sewage treatment curb the countryrsquos ability to manage water sustainably80 In recent times companies have become more aware of the risks of increased water consumption pollution and unstable precipitation aggravated by climate change81 A 2019 World Bank Report (Quality Unknown)82 warned of the economic health and environmental damage caused by contaminated water highlighting water quality as an ldquoinvisible crisisrdquo that is under-appreciated and underestimated It warned that poor water quality driven by industrial agricultural and urban pollution could lead to a reduction by 13rd of economic growth in some places
76 httpsocialnitigovinuploadssamplewater_index_report2pdf77 httpsnitigovinsitesdefaultfiles2019-06Final20Report20of20the20Research20Study20on2020
Composite20Water20Resources20Management20Index20for20Indian20States20conducted20by20Dalberg20Global20Development20Advisors20Pvt20Ltd_New20Delhipdf
78 httpsnitigovinsitesdefaultfiles2019-06Final20Report20of20the20Research20Study20on2020Composite20Water20Resources20Management20Index20for20Indian20States20conducted20by20Dalberg20Global20Development20Advisors20Pvt20Ltd_New20Delhipdf
79 httpsocialnitigovinuploadssamplewater_index_report2pdf80 httpswwwcdpnetenarticlescompaniesindias-looming-water-crisis-a-call-to-action-for-companies81 Think globally act locally new guidance for companies on sustainable water use - CDP82 httpsopenknowledgeworldbankorghandle109863224583 httpswwwwriorgaqueduct84 Aqueduct Country Ranking (wriorg)85 The objective of the campaign is to drive further corporate transparency around climate change deforestation and water
security by encouraging companies to respond to CDPrsquos disclosure request
Water stress in India remains a key challenge Aqueduct83 ranked India 13th in the world on high water stress score -- 412 out of 584 The private sector is vital to delivering a water secure future Companies in the food textile retail energy industrial chemicals pharmaceuticals and mining sectors account for and wield influence over 70 of the worldrsquos water use and pollution The decisions one takes about how to grow and expand can make or break onersquos ability to tackle the global water crisis
CDPs Water Security program requests companies to disclose critical information on water parameters which are crucial to the business It helps companies monitor and benchmark their performance on these critical parameters to ensure adequate water availability for their businesses Investors and customers are increasingly keen to know how companies respond and adapt to water-related risks The Non-Disclosure Campaign (NDC) is an annual CDP initiative where investors can target companies that have been requested to respond but failed to do so85 Globally for water security Indian companies achieved the highest response rate to the NDC campaign with 50 of engaged companies submitting a response on this critical issue ndash 28 times higher than their control group Responding through CDPrsquos Water Security questionnaire will help businesses understand the risks and opportunities associated with water-related issues
Reduction in Economic Growth caused by power water in some countries
13rd
Water stress by 2030-ratio of withdrawals to renewable supply
People will live in water stress area by 2030
Increase in water demand in last 100 years
WRI 2020
UNEP
UN World Waterdevelopment Report 2020
increase in Water Security investor responding companies in India
8756
1in 2
x6
38
A N N U A L R E P O R T 2 0 2 0
helping them capitalise on actions to safeguard water resources86 The number of disclosing companies increased from 15 last year to 28 companies this year an increase of approximately 87
Measuring Monitoring and Verification
Regular measuring and monitoring of water-related parameters across all operations and the entire value-chain is the first step in laying the path for efficient water management In 2020 28 companies measured a total of 268 water related parameters It was found that amongst volumetric water metrics water discharge was the most monitored accounting for 41 of all measurements Water withdrawals accounted for 29 of all measurements water consumption for 10 and water recycling and reuse accounted for 10 each Although these metrics were being continuously monitored and measured by companies a sector-wide analysis shows that significant growth in some water-intensive sectors has put pressure on the demand for industrial water The electric utilities sector for example reported an increased water demand of 771174 megalitres in 2020 which was the highest amongst all sectors Adani Power Ltd highlighted new aqusitions and increased power generation as major reasons for rise in water demand this year The chemicals sector showed the second highest rise in water demand this year -- 195832 megalitres this year
Some companies have shouldered the responsibility of having audits conducted on their reported water metrics for greater
86 httpsb8f65cb373b1b7b15feb-c70d8ead6ced550b4d987d7c03fcdd1dsslcf3rackcdncomcmsreportsdocuments000000893originalCDP-india-business-case-for-water-disclosurepdf1472051621
87 https6fefcbb86e61af1b2fc4-c70d8ead6ced550b4d987d7c03fcdd1dsslcf3rackcdncomcmsreportsdocuments000005312originalAnalysis_of_CA100__Data_for_CDP_Investor_Signatories_v5pdf1596046258
88 https6fefcbb86e61af1b2fc4-c70d8ead6ced550b4d987d7c03fcdd1dsslcf3rackcdncomcmsreportsdocuments000005312originalAnalysis_of_CA100__Data_for_CDP_Investor_Signatories_v5pdf1596046258
89 https6fefcbb86e61af1b2fc4-c70d8ead6ced550b4d987d7c03fcdd1dsslcf3rackcdncomcmsreportsdocuments000005312originalAnalysis_of_CA100__Data_for_CDP_
transparency and credibility Amongst the verification standards that were employed 26 of the responding organisations used ISAE 3000 with Tata Chemicals being the sole company to apply both ISAE 3000 and AA1000AS to meet assurance standards
In 2020 25 responding companies withdrew consumed and discharged 7933064 megalitres 1403171 megalitres and 6625032 megalitres of water respectively However in 2019 these figures stood at 217736 megalitres 860517 megalitres and 67686 megalitres respectively for 15 responding companies
WATER ASPECTSWater Consumptionndash the amount of water a company has drawn into its boundaries and has permanently removed from the local water cycle90
Of the 28 respondents three did not disclose water consumption data or were in their first year of measurement 9 increased their water consumption over the previous reporting year 12 decreased it and 4 reported no change
Water Withdrawalsndash the amount of water the company has temporarily removed from the local water cycle and returned as discharge water91
Of the 28 respondents three did not disclose water withdrawal data or were in their first year of measurement 7 reported an increase over the previous year 14 had lowered their withdrawal and 4 reported no change
Water Discharges ndash the amount of water that leaves a companys facility and if left untreated could be a source of pollution92
Of the 28 respondents three did not disclose water discharge data or were in their first year of measurement 9 reported an increase in water discharge over the previous year 6 lowered it and 10 reported no change CDPrsquos data highlights new acquisitions increased production activities and project expansions as the primary reasons for increased water demand amongst the companies
of companies measured all water aspects (withdrawals discharge and consumption) across 100 of facilities
64
of companies believe that availbility of good quality freshwater is vital for the success of their business39
2910
4110
10
Water withdrawalsWater recycledreused
Water discharge
Water consumption
Others
Measured and monitored water aspects
39
A N N U A L R E P O R T 2 0 2 0
Data further shows that brackish surface water and seawater were the primary water sources for industries followed by fresh surface water source The electric utilities sector was the most reliant on brackish surface water and seawater accounting for 72 of the sectorrsquos total water withdrawals At 59 fresh surface water was the primary source of withdrawal for the chemicals sector Of the 28 companies 13 had implemented water conservation measures to reduce water withdrawals from groundwater sources this year Water withdrawals from groundwater - renewable accounted for less than 05 of total withdrawals
In terms of water discharge most (81) was released into brackish surface water and seawater environments Discharges into fresh surface water accounted for the remaining 19 of the total discharges Our data suggests more companies are installing zero liquid discharge units and water harvesting techniques across their facilities leading to less groundwater discharge
Fresh surface water accounted for 29 of total water withdrawals by source in 2020 Indiarsquos major river basins - Ganges Brahmaputra Godavari Indus and Cauvery are the primary source of freshwater for the industries Around 15 of total freshwater demand from CDP responding companies was supplied by the
Investor_Signatories_v5pdf159604625890 Worldrsquos 18 Most Water-Stressed Rivers | World Resources Institute (wriorg)
Ganges and Brahmaputra river basins another 15 came from the Godavari basin followed by Cauvery Indus Banas and Sabarmati river basins The demand for water has increased over the years causing these basins to rank among the most water-stressed catchments in the world90 Of the 83 facilities in India 53 were in water-stressed regions Our data shows that around 60 of total responding companies withdrew water from water-stressed regions Of these nine were from the materials industry and two were from the food beverage amp agriculture industry
Governance and Business Strategy
For a long time corporate sustainability strategies have focused on measurable and manageable challenges such as product footprint efficiency in supply chain water conservation and others Businesses have begun to take stock of water security by innovating for improved efficiency measuring direct withdrawals assessing risk to neighbours and considering leakages
CDPrsquos data shows that corporate leaders across India are responding to this crisis by focusing on their water policy to monitor risks and opportunities and integrate it in their strategies Around 71 companies report having a documented water policy that is accessible to the public Up to 93 companies indicated that they have a board-level oversight of water related issues within the organisation observed either by the Chief Executive Officer (CEO) or the director on board followed by the board-level committee
Around 43 of the responding companies report on water-related issues quarterly and 33 more frequently This shows the increasing self-awareness among companies on water-related issues Further 63 of these companies offer some form of
facilities out of a total of 83 from the responding companies were in areas with water-stress53
Water discharge by destination
Brackish surface
water and Seawater
Fresh surface water
Groundwater
Third party
532
225
2
975
156
93
Water discharge (megalitersyear)
125
013
1
Brackish surface
water and Seawater
Groundwater ndash non
renewable
Groundwater ndash renewable
ProducedEntrained
water
Third party
Fresh surface water
231
800
261
04
405
21
489
Water withdrawals (megalitersyear)
Water withdrawals by destination
7564
662
6
No
of c
ampa
nies
Industry
1
Appa
rel
1
Biot
ech
hea
lth
care
amp p
harm
a
1
Man
ufac
turin
g
2Fo
od b
ever
age
amp ag
ricul
ture
1
Pow
er
gene
ratio
n
1
Tran
spor
tatio
n se
rvic
es
1
Serv
ices
9
Mat
eria
ls
Industry-wise water withdrawals from water-stressed areas
40
A N N U A L R E P O R T 2 0 2 0
incentive to their employees ndash monetary or otherwise -- for the management of water related issues
Businesses are stepping up and playing a vital role in developing water initiatives that can ease the stress on crucial watersheds Companies are also looking into water security related long-term business objectives and financial planning as a part of their overall business plans Almost 70 companies prefer short to mid-term (5-10 years) over long-term (11-30 years) planning This does not come as a surprise as water effects are felt locally and require more immediate strategic planning Of the 28 reporting companies 12 use climate-related scenario analysis to inform its water-related business strategy and eight anticipate doing so in the next two years A majority of these companies belong to the chemicals and the electric utilities sector
In 2019 about 13 companies were pricing their water this increased in 2020 to 18 and 50 are now exploring the its possibilities Companies such as Ambuja Cement (US$110 `7800
91 marico-sustainability-report-18pdf
Marico Ltd Establishing a strategy to improve water-security across operations and value chain
With a host of agro-based products water availability is a crucial parameter for Marico Ltd92 Under the risk management framework it has identified adverse impact of water scarcity as an environmental risk to the company To mitigate this environmental risk the company has initiated watershed management programs and a reduced-reuse-recycle model of water management across its operations Through a water stewardship program the company aims to address water security challenges in low rain-fed areas around its workplace and factories
In the reporting period FY 19-20 the company withdrew 202886 cubic meters of water and reported a reduction of 9 from previous year The company had reported a reduction of 31 in water intensity from the 2014 level through the company-wide introduction of water efficiency measures improvements in water recycling water-efficient taps and rainwater harvesting systems For improving water management practices across water stress areas Marico utilised the WRI aqueduct tool to evaluate water risk across all manufacturing facilities in India This tool helped the company identify the number of facilities that fall under the water stress area -- according to it five out of eight plants are in such zones The implementation of water conservation initiatives had helped three water-stressed sites reduce water consumption over the previous year Among three water-stressed sites Jalgaon reported 15 reduction in water consumption Baddi reported 16 and Paonta 28
Establishing a strategy to reduce and minimise water use was one of the companys key commitments Marico foresees its future water withdrawal levels reducing given its move towards improving water efficiency and incorporating recycling throughout the production cycle
Frequency of reporting on water-related issues
633
43
Annually
More frequently than quarterly
Quarterly
6
10 2Half-yearly
As important matters arise
Less frequently than annually
41
A N N U A L R E P O R T 2 0 2 0
to US$8240 `579800 per megalitre) Dr Reddyrsquos Laboratories (US$088`67 to US$591`449 per KL) Piramal Glass and Tata Steel use an internal price on water
Risks amp opportunities
Dwindling water supply is a major cause of concern for businesses since it poses significant direct and indirect impacts Visible risks such as droughts have a more explicit impact as they ruin vegetation and severely undermine the agriculture sector But subtle impacts present challenges to other sectors Water shortages also threaten the long-term viability of businesses by leading to higher costs eventually borne by the consumers Without proper management the economic repercussions of water scarcity will be felt in myriad ways92
In 2020 companies that experienced detrimental water-related impacts have incurred financial losses worth `1580 million Physical risks such as inadequate infrastructure and increased water stress account for more than half of these commercial losses followed by reputational-cum-market like subpar access to water sanitation and hygiene services and regulatory risks eg- failure to set mandatory water efficiency conservation and recycling standards Corporations should thus strategically prioritise dealing with these risks to safeguard their financial bottom lines For this organisations have looked to secure alternate sources of water supply adopt water efficiency and conservation practices as well as reuse and recycling of water
A 2018 report from NITI Aayog93 highlighted the fact that the country faced its worst water crisis that year Rising water challenges have put strong regulatory pressure on businesses in India with significant operational risks The private sector is a big contributor towards deepening water security issues but is also crucial in addressing it
Given the current situation with water resources it is perhaps unsurprising that many of the companies responding to CDP find themselves exposed to a plethora of physical and transition risks ndash that is risks from regulatory or consumer reforms aimed at addressing the water crisis These risks threaten their reputation and license to operate their supply chains security financial stability and their ability to grow As per CDPrsquos Global Water
92 httpsglobalriskinsightscom201612economic-cost-global-water-scarcity93 httpsnitigovinsitesdefaultfiles2019-06Final20Report20of20the20Research20Study20on2020Composite20Water20Resources20Management20Index20
for20Indian20States20conducted20by20Dalberg20Global20Development20Advisors20Pvt20Ltd_New20Delhipdf94 https6fefcbb86e61af1b2fc4-c70d8ead6ced550b4d987d7c03fcdd1dsslcf3rackcdncomcmsreportsdocuments000005165originalCDP_Global_Water_Report_2019
pdf159110644595 The term WASH refers to the provision of water sanitation and hygiene Universal affordable and sustainable access to WASH is a key public health issue within international
development and is the focus of the first two targets of Sustainable Development Goal 6 (SDG 6)96 httpswwwworldbankorgentopicwaterbriefwash-water-sanitation-hygiene-and-covid-19
Report 201994 the combined business value at risk reported in 2019 topped out at US$425 billion with about 40 of the risks anticipated to hit within the next 1-3 years Whether it was the blockading of a Newmont Goldcorp mine in Mexico or poor water quality threatening the production of Unileverrsquos Hellmannrsquos mayonnaise in the Mississippi River Basin the impacts of the global water crisis are already being felt
Water risks and risk assessment
As per the 2020 data 71 of the responding companies consider current or future water-related regulations as a risk to business followed by 57 companies that consider access to WASH95 services for employees as very relevant and always included in their water-risk assessments This shows that companies are vigilant about providing safe access to drinking water sanitation arrangements and proper hygiene at workplace The COVID-19 pandemic has highlighted the importance of WASH to human health and well-being Safely managed WASH services along with good hygiene practices can help prevent infectious diseases that kill millions each year96 In addition 50 companies reported that water used for their key commoditiesraw materials is relevant enough to be considered for their risk-assessment This was the most pertinent for chemical sector companies
of the 28 Indian responding companies undertake water-related risk assessment25
Total financial loss by reporting companies as per risk type
38
53
9
Reputation and Market Risk
Physical Risk
Regulatory Risk
1580 MILLION
In 2020 companies that experienced detrimental water-related impacts have incurred financial losses worth
1580 million
42
A N N U A L R E P O R T 2 0 2 0
It is crucial to consider stakeholders in risk assessment procedures for a comprehensive understanding of water-related risks Of the 25 companies that undertake water-related risk
97 httpswwwweforumorgreportsthe-global-risks-report-2020
assessments 68 always include employees in their internal assessment procedures by conducting training and awareness programs on water conversation initiatives communicating water-related policies etc This is followed by regulators and local communities who are relevant in water-risk assessment procedures at 61 and 54 respectively for the responding companies It is a positive sign that Indian companies are engaging with their employees and local communities and ensuring that the latter are not negatively impacted in terms of habitation health and water availability
According to The World Economic Forumrsquos Global Risk Report 202097 water crises are among the top five risks in terms of impact for the past ten consecutive years Water-related risks are substantive in the risk assessment processes and identified as a threat to companiesrsquo bottom line putting at risk a combined business value of US$425 billion according to CDP 2019 data
RegulatoryPhysical
Reputational
Risk due to company
Risk due to context
Expectedunexpected change or uncertainty in law or regulation
Water scarcity too much water water
unfit for use
Litigation product risks due to changes in
consumer behavior
Caused by inefficient operations produces and services resulting in water pollution over exploitation etc
Caused by changing environmental and social conditions like droughts
flooding etc
Relevancy of water-related risks
7157 57 50 46 46 43
11
Water-related
regulatory frameworks
Access to fully-
functioning safely
managed WASH
services for all employees
Water availability at a basincatchment
level
Implications of water on
your key commoditiesraw materials
Stakeholder conflicts
concerning water
resources at a basincatchment
level
Water quality at a basin
catchment level
Status of ecosystems and habitats
Other contextual
issues please specify
Empl
oyee
s
Regu
lato
rs
Loca
l com
mun
ities
Rive
r bas
in m
anag
emen
t au
thor
ities
Wat
er u
tiliti
es a
t a lo
cal l
evel
Stat
utor
y sp
ecia
l int
eres
t gr
oups
at a
loca
l lev
el
Inve
stor
s
Supp
liers
Oth
er w
ater
use
rs a
t a
basi
nca
tchm
ent l
evel
Oth
er
NG
Os
Cust
omer
s
No of Companies age of Companies
Relevancy of stakeholders in water-risk assessment
6861 54 50 50 46 46 39 36 32 2918
43
A N N U A L R E P O R T 2 0 2 0
Water risk event
Impacting business
Increased Operational amp maintenance Costs Increased Compliance amp
Administration Costs
Closure of Operations
Supply chain distributions
Brand Damage and LitigationsShareholder
Distributions
Risk transferRisk avoidance and mitigation
Technological Risks
Repurational amp Market Risks
Regulatory Risks
Physical Risks
Financial ImpactsResidual Water RiskInherent Water Risks
Increased water stress
143721Increased water scarcity
41105Drought
17604Inadequate infrastructure
820
Physical Risks
Ecosystem vulnerability
300Severe weather events
69Declining water quality
63Flooding
13
Regulatory Risks
Technology Risks
Higher water prices Transition to
water intensive low carbon energy sources
Tighter regulatory standards
2333
120
All the figures reported are in million rupees
44
A N N U A L R E P O R T 2 0 2 0
CDPrsquos data shows that physical risks seem to have the highest magnitude of impact on the Indian responding companies Drought is seen to be the primary driver of potential substantive impact
Where there is risk there is opportunity
Where therersquos risk therersquos reward Industrial wastewater for example is a vast untapped resource It is a potential source of heat power process water and high-value materials And there has never been a better time for this transformation to take place -- technologies are better the regulatory climate is favourable and the business case is clear Meanwhile the market demand for pollution-free products is growing For companies to thrive they will need to be aligned to changing consumer demands If
98 httpswwwmarketsandmarketscomMarket-Reportssmart-water-management-market-1265html
they respond to these opportunities then market differentiation resilience and profitability are on the table
Globally corporate leaders have started realising the untapped potential of smart water technology and the market for smart water management is anticipated to grow from US$846 billion in 2016 to US$2010 billion in 202198 Industrial wastewater has for a long time been reused for cooling towers steel works oil refineries textile manufacturing and paper production It was found that 15 of the 23 companies valued improved water efficiency in operations as their primary opportunity having a substantive financial or strategic impact on business
of the 28 responding companies (approx 93) identified water-related opportunities in their business26
Improved water efficiency in operations
Increased resilience to impacts of climate change
Reduced impact of product use on water resources
Improved community relations
Water recovery from sewage management
Resilience to future regulatory changes
Sales of new productsservices Increased brand value
3000million
`4000
million18752
million
opportunities were identified by 21 respondents
opportunities were identified by 11 respondents
opportunities were identified
by 9 respondents
opportunities were identified
by 4 respondents
Efficiency Resilience Products and services
Markets
22
14
10
4
`329
million
`
`
45
A N N U A L R E P O R T 2 0 2 0
26
17
14
17
2
Others
Recyclingreuse
Consumption
Product water intensity
Discharge
14
10Withdrawals
Water use efficiency
Categories of water targets monitored at the corporate level
of companies set company-wide water targets
of companies set company-wide water goals
5556
Businesses have identified transparency in water management issues as a fundamental activity and disclosure through CDPrsquos annual water questionnaire produces a standard comparable dataset McGill University and Millani found that companies disclosed through CDP ranked 19 percentiles better than the average business in their ability to access capital99 The research showed that a comprehensive voluntary disclosure produces a quality management team with enhanced awareness of threats and opportunities linked to climate and environmental change
Targets and Goals100
In response to declining water resources many companies have started engaging in water stewardship and setting water targets aligned with SDG Goal 6 to ensure availability and sustainable management of water sanitation and hygiene facilities for all101 Developing water-related targets helps companies make meaningful change from informed actions at the local level102 In 2020 four companies did not set water-related targets within their operations Whereas 24 companies had water-related targets 26 of them had set targets for product water intensity 17 set recyclingreuse targets and 14 focused on water use efficiency
Companies can set goals and targets on a range of operational issues to drive performance andor manage risks and opportunities CDPrsquos data shows that a majority had set targets at the company-wide level -- 55 of responding companies reported setting water targets across the company This was followed by 26 who set water targets at the business level and 19 at the site or facility level While setting water goals around 56 of companies monitored their goals at the company level 24 at the sitefacility level and the remaining at the basin business or country-level
99 Craig M Coulombe E Nostrat A 2019 The Role of CDP Disclosure to Improve Access to Capital Research Note httpsf01c8ee6-cac3-40ff-a0e4-8bfb54f2b88bfilesusrcomugd66e92b_30b06fd11b9c43d88428f768676e9a8bpdf
100 Targets ndash quantitative Goals - qualitative101 httpsunstatsunorgsdgsreport2020goal-06102 httpsceowatermandateorgsite-targets-guide
A company has various drivers for setting goals and targets and it tries to align these with increased stakeholder concerns and environmental legislation Data shows that most organisations considered reducing environmental impact and risk mitigation as the primary motivation for monitoring water goals and targets Organisations also considered brand value protection as one of the important factor while setting goals
24
4
Target Set No Target
No
of C
ompa
nies
Water targets monitored at the corporate level
46
A N N U A L R E P O R T 2 0 2 0
Drivers behind setting water targets and goals at the corporate level
Reduced environmental impact
Water stewardship
Risk mitigation
Recommended sector best practice
Corporate social responsibility
Brand value protection
Cost savings
Shared value
Climate change adaptation amp mitigation strategiess
Commitment to the UN SDG
Increase freshwater availability for users
Other drivers
45
14
14
2
2
2
5
14
16
12
161212
12
4
4
4
44
GoalsTargets
age of Companies
47
A N N U A L R E P O R T 2 0 2 0
PROTECTING OUR FOREST WEALTH
The world lost an estimated 10 million hectares of forest annually between 2015 and 2020104 Protecting and restoring forests and other natural ecosystems could provide up to 30 of climate change mitigation action needed to limit global warming to below 20C by 2030105
Global demand for agricultural commodities is the primary driver of deforestation and ecosystem conversion -- timber is extracted unsustainably and land is cleared for agricultural production This represents major risks to businesses as commodities associated with deforestation such as palm oil soy cattle and timber products are the building blocks of millions of products traded globally and therefore feature in the supply chains of numerous organisations
103 httpswwwipccchsrccl104 The State of the Worldrsquos Forests 2020 Forests biodiversity and people105 httpswwwpnasorgcontent1144411645106 httpsappsfasusdagovnewgainapiapiReportDownloadReportByFileNamefileName=Oilseeds20and20
Products20Annual_New20Delhi_India_04-01-2020
The unsustainable production and supply of these commodities and activities not only poses a significant business risk but also has a severe negative impact on the environment especially the climate crisis
Deforestation is fundamentally linked to climate change According to the IPCC Special Report on Climate Change and Land (2019)103 11 of global GHG emissions are from deforestation and from the conversion of natural ecosystems for human use
At an 8 annual growth rate edible oil consumption in India is growing faster than the 3 growth rate in production Imports and imports are rising to fill the gap As a result India still is the largest importer of edible oils followed by China European Union and the United States Indiarsquos edible oil imports in MY 202021 are predicted to rise 6 to 15 MMT of this 85 MMT will be palm oil 35 MMT soybean 28 MMT sunflower seed oil and 02 MMT rapeseed (canola) oil
-United States Department of Agriculture106
In 2020 three Indian companies responded to CDPrsquos forests questionnaire -- one responded to the request for disclosure from investors while two responded to their customers Globally 687 companies responded to CDPrsquos forests questionnaire and 57 of them evaluated deforestation-related risks at US$5312 billion
13The mitigation potential of reduced deforestation is
13 of the global emissions
We cant address climate change without protecting our forests
They are vital carbon stores that help reduce global warming
48
A N N U A L R E P O R T 2 0 2 0
Disclosure on deforestation management through CDP could be a significant opportunity for companies operating in India one of the largest importers of palm oil in the world This can help Indian companies tap into lucrative opportunities by scaling sustainable trends CDPrsquos forests questionnaire allows companies that produce source or use palm oil soy timber cattle cocoa coffee and rubber to disclose Moreover new biodiversity-focused metals amp mining and coal sector questionnaires were introduced in 2019
Palm oil is the most commonly used processed oil in industrial food production with its production being responsible for 5 of global tropical deforestation107 Indiarsquos palm oil imports account for nearly 23rd of its total imports of edible oil This demand was shaken in 2020 when the pandemic hit with a 40 fall in the consumption of palm oil during the lockdown108 Indiarsquos imports which account for nearly 20 of the global trade in palm oil will have a major effect on efforts to make its production and processing sustainable The primary barrier for sustainable palm oil consumption in
India stems from it belonging to a more price-sensitive and volume driven market making environmental impacts a low or non- existent priority in the minds of consumers
Climate change can reduce palm oil production and with demand outstripping supply prices could rise The Roundtable on Sustainable Palm Oil (RSPO) has developed a set of environmental and social criteria which companies must comply with in order to produce Certified Sustainable Palm Oil (CSPO) When properly applied these criteria can help in minimising the negative impacts of palm oil cultivation
107 Deforestation amp Palm Oil 108 As worldrsquos largest importer of palm oil India has a duty to push for ethical production practices109 httpsseaofindiacominterim-data-on-import-of-edible-oils-march-2020-down-by-32-percent-nov19-to-mar20-down-by-10-percent110 httpsappsfasusdagovnewgainapiapiReportDownloadReportByFileNamefileName=Oilseeds20and20Products20Annual_New20Delhi_India_04-01-2020111 httpsresourcetradeearthyear=2018ampexporter=76ampimporter=699ampcategory=87ampunits=value112 httpswwwrvonlsitesdefaultfiles201705poultry-sector-in-india-2017pdf113 httpsresourcetradeearthpublicationscocoa-trade-climate-change-and-deforestation
The Sustainable Palm Oil Coalition for India (I-SPOC) was formed to promote the uptake of sustainable palm oil and its derivatives in India CDP amongst others has joined it as a member
Soy cultivation is the second largest soft commodity driver of tropical deforestation after cattle products Various aspects of soy production generate GHGs that contribute to climate change India imports around 33 lakh tons of soybean oil109 According to data from the US Department of Agriculture India
is set to import 35 lakh metric ton of soybean oil in 20202021110 In addition India is also responsible for clearing huge spaces of forest land in Brazil that contributed to 23 of soybean imports to India in 2018111 Soy is also used as fodder for livestock and a growing local demand for poultry products will further affect Indiarsquos position on deforestation The country ranks amongst the top four producers of egg and chicken in the world and it is increasingly exporting to the Middle East and Europe112
Cocoa has been a notable agent of deforestation since the last century The global production of cocoa has increased from 34 million to 45 million tonnes between 2000 and 2014 while the land use footprint of its plantations rose by 37 to 257 million acres113 About 90 of
cocoa is produced by 7 countries -- Ivory Coast Ghana Indonesia Ecuador Cameroon Brazil and Nigeria The dearth of incentives for improving the plantations combine with high investment costs to make cocoa a low yield crop forcing farmers to resort to clearing untouched forest lands in order to meet the growing demand and
lsquoPalm oil consumption dropped by
in 2020 in India due to COVID-19rsquo
40
Climate-Water-Forest nexus
Water is an essential component of mitigation and adaptation strategies
Rising temperatures and changing weather patterns increase stress on water availability
Tropical forests provide substantial emission reductions by acting as carbon sinks
Droughts resulting from rising temperatures and changes in weather patterns increase the risk of forests fires
A major portion of gobal freshwater depends on forests
49
A N N U A L R E P O R T 2 0 2 0
for cutting down production costs114 In Southern India Cocoa is mainly grown as an intercrop in conjunction with coconut areca nut oil and rubber plantations Indiarsquos consumption in 2015-16 was 30000 tonnes of which 57 was imported while the domestic production rose at an annual rate of 37 in the same period115 Failure to protect forests in the event of a sharp cocoa price increase will lead to unsustainable levels of deforestation116
The US$10 billion coffee industry too leaves a gargantuan ecological footprint It is estimated that every cup of coffee consumed results in the loss of one square inch of forest cover117 Each year around 250000 acres of land is cleared for coffee which is unsustainable The Kodagu district
in the Western Ghats of India is a major biodiversity hotspot which produces about one-third of the countryrsquos coffee This region has more than 270 tree species which are all under significant ecological stress due to the coffee farms that threaten land use and land cover while potentially leading to the felling of about 21000 trees118
An estimated 8-10 of global production of low-cost timber products comes from illegal logging in forests To meet the burgeoning demand of timber produce about 25 million acres of land is converted to fast-
wood forests (timber plantations) across the world annually and this hampers the ecosystem services that nature provides us119 With the World Bank forecasting that the global market for wood is set to quadruple by 2050120 reducing timberrsquos environmental footprint is vital for the industryrsquos success In India there is no provision of a central data pool that maintains records of production and consumption of timber There is a need to address this inconsistency in reporting and data collection by forging a comprehensive strategic policy and providing institutional support121 This would ensure effective collaboration among all stakeholders that would result not only in the production of quality forest products but also a sustainable timber sector
114 httpsresourcetradeearthpublicationscocoa-trade-climate-change-and-deforestation~text=As20cocoa20tends20to20beforest20loss20over20this20time115 httpseconomictimesindiatimescomindustrycons-productsfoodalthough-indias-consumption-of-chocolate-is-steadily-growing-but-we-still-depend-on-imports-for-116 httpsnationalzoosieduscbimigratorybirdsresearchcacaorufcfm117 httpsohiostatepressbookspubsciencebiteschaptera-bitter-brew-coffee-production-deforestation-soil-erosion-and-water-contamination~text=For20every20cup20of20
coffeeinch20of20rainforest20was20destroyedamptext=Chemical20buildup20in20soils20andsoil20eroding2C20and20land20degradation118 httpswebcachegoogleusercontentcomsearchq=cacheYhaeYHVPWasJhttpswwwmdpicom1999-4907114480pdf+ampcd=6amphl=enampct=clnkampgl=in119 httpsresourcetradeearthyear=2018ampexporter=76ampimporter=699ampcategory=87ampunits=value120 httpdocuments1worldbankorgcurateden240231467291388831pdf106467-REVISED-v1-PUBLICpdf121 httpsonlinelibrarywileycomdoifull1011111477-894712094122 httpsglobalforestatlasyaleeduamazonland-usecattle-ranching123 httpsresourcetradeearthyear=2018ampimporter=699ampcategory=779ampunits=value124 httpsresourcetradeearthyear=2018ampimporter=699ampcategory=779ampunits=value125 httplargestanfordeducourses2018ph240halper1~text=Every20half20hour2C20a20cowmore20potent20than20carbon20dioxideamptext=There20is20
rampant20deforestation2C20especiallyto20make20room20for20cattle126 httpswwwinvestopediacomarticlesinvesting0929155-countries-produce-most-carbon-dioxide-co2asp127 httpwwwcwejournalorgvol9no3do-extensive-rubber-plantation-influences-local-environment-a-case-study-from-tripura-northeast-india128 httpswwwibeforgdownloadRubber_Plastics_220708pdf
Beef production remains by far the largest driver of deforestation in the worldrsquos tropical forests as forest land cleared for cattle is more than twice the combined area required for producing soy palm oil and wooden products The problem of cattle ranching
is particularly profound in the Amazon region the largest forest reserve in the world leading to 80 of present deforestation rates122 Clearing land for grazing causes irreversible habitat loss soil degradation and conflict between humans and wild animals India imports 15 and 12 of bovine leather from Turkey and Brazil respectively which poses a great threat to the forest areas of these countries123 It also jeopardises the earnings of the Indian companies manufacturing such products for its European consumers who have a high degree of sensitivity and awareness around deforestation124 In a larger context the impact of cattle stretches far beyond the realm of forests and is one of the key reasons for rising global emissions and climate change There are more than 15 billion cows on Earth with each of them capable of expelling 17 times more GHG emissions than cars in the form of methane burps a gas several times more potent than CO2 in terms of trapping heat It is therefore not surprising that cattle accounts for a colossal 18 in atmospheric carbon emissions125 To put this in perspective this surpasses emissions of the third largest CO2 emitter India which accounts for a 7 share in worldwide emissions126
Another commodity whose production has significant impact on the environment is rubber Environmentalists have warned for years that the rapid expansion of rubber plantations would come at the expense of natural forests Rubber has
not been subjected to extensive publicity in a way that palm oil soy and paper have been over the years given their impact on the environmentmdashpublicity that has led to adoption of robust sustainability criteria for these commodities Indiarsquos natural rubber plantation spans across an area of 183 million acres as of 2012 with the raw material being used as an input for making 35000 finished products of industrial importance127 Currently the impact assessment of large-scale rubber plantations on the environment is non-existent in the country a worrying sign considering Indiarsquos position as the 4th largest consumer in the world128
50
A N N U A L R E P O R T 2 0 2 0
Fossil-fuel and mineral mining accounts for 7 of global deforestation Moreover it not only presents a threat to forest cover and resource extraction but also leads to long-term impacts such as soil and water pollution infrastructure development and
increased anthropogenic activity129 While the effects of large-scale mining are easier to quantify as they are well regulated and undertake environmental impact assessments it is the scope and impact of artisanal and small-scale mining (ASM) that goes under the radar due to lack of data and a high degree of informality in the sector In India this problem warrants special attention since over 12 million people are engaged in the ASM business with women and girls from backward communities and those living below the poverty line being its primary employees130 A landscape-level approach is critical not only to identify and monitor the environmental and social impacts of individual mining projects but also to consider its interactions with other land uses as well given the crucial role forests play in balancing the ecosystem131 Indiarsquos investor requested company Hindustan Zinc Ltd was the first to disclose this year under the mining sector
129 httpsglobalforestatlasyaleeduland-usemining-extraction130 httpswwwpactworldorgstate20of20asm131 httpswwwresearchgatenetpublication38084575_Landscape_approach_for_quantifying_land_use_land_cover_change_1972-2006_and_habitat_diversity_in_a_mining_area_in_
Central_India_Bokaro_Jharkhand
Hindustan Zinc Pioneering forest and biodiversity conservation in the mining sectorHindustan Zinc Limited is the first investor-requested company in India to respond to CDPrsquos Forests questionnaire It demonstrated that a dedicated Biodiversity Policy and Management Standard is its compass in reducing flora and fauna disruption and in minimising or compensating its impact of operation through project scoping site closure and beyond
Companies in India currently lag behind their regional peers in terms of disclosure on deforestation management with only 3 companies disclosing on this topic in 2020
40
65
22
3China Japan IndiaSEA
(Indonesia Malaysia
Phillipines Singapore Vietnam)
Total no of companies disclosing through CDPs Forests questionnaire in 2020 by HQ countryregion
51
A N N U A L R E P O R T 2 0 2 0
Nagpur
Udaipur
Panaji
Kochi
Rajkot
Vadodara
Delhi
Dehradun
Ahmedabad
Thane
Chennai
Tiruchirappalli Coimbatore
Bangalore
Kolkata
Gangtok
Siliguri
India Snapshot
CITIES STATES AND REGIONS
Cities
In 2020 over 800 cities disclosed their environmental information through CDP including 16 Indian cities The number of cities in India disclosing through the CDP-ICLEI Unified Reporting System increased from 13 in 2019 to 17 This was largely due to citiesrsquo ongoing commitments to climate leadership initiatives such as the C40 Cities Climate Leadership Group (C40) the Global Covenant of Mayors for Climate and Energy (GCoM) and our partnership with ICLEI whose South Asia Regional Office also acts as the GCoM South Asia Helpdesk
88 global cities reached CDPrsquos A list which include Bristol (UK) Miami (USA) Cape Town (South Africa) Buenos Aires (Argentina) and Auckland (New Zealand)
despite the COVID-19 pandemic The USA accounts for the highest number
(25) of cities on the A List making up 28 despite the US pulling out of
the Paris Agreement In India more than half the cities in disclosed
that
they either have sustainability targets incorporated into the master planning of the city or it is in progress while only 43 of the cities have a published plan that addresses climate change adaptation Approximately half of the disclosing Indian cities have identified opportunities as a result of addressing climate change and one-third of them have a GHG emission reduction target which is a strong indication towards a low carbon development pathway
States and Regions
In 2020 the Union Territories of Delhi and Jammu amp Kashmir along with over 120 states and regions from across the world disclosed their environmental impacts through CDP Globally 90 of states and regions reporting a 2030 target have one in line with the IPCCrsquos goal to reduce global greenhouse gas emissions by 40-50 from 2010 levels by 2030 and 55 of states and regions with a 2030 emissions reduction
target are showing greater ambition than their national
counterparts
Indian cities and 16
Indian states disclosed to CDP
2
52
A N N U A L R E P O R T 2 0 2 0
ANNEXURESAppendix I Table of emissions scores and sector by company
Sector Company Name 2020 permission Status
Final score 2020
Scope 1 Scope 2 Scope 3 Number of categories reported in Scope 3
Bars hotels amp restaurants
Indian Hotels Co Ltd
public C 50610 239568 23824 3
Biotech amp pharma Biocon public C 41948 133110 Not Provided
Dr Reddyrsquos Laboratories
public B 247317 154836 1272548 8
ZCL Chemicals public D- Not Provided Not Provided Not Provided
Cement amp concrete ACC public B 16966585 643870 648068 3
Ambuja Cements public B 14523738 551219 1973622 7
Dalmia Bharat Ltd
public B 11280051 537968 1320736048 9
JK Cement non public D Private Private Private Private
JSW Cement Limited
public B- 1398609 647870 572488 4
Shree Cement non public C Private Private Private Private
Ultratech Cement
public B 47954830 1327185 5376354 4
Chemicals Aarav Frances amp Flavors Private
Limited
public Not Scored
GHCL LIMITED public D 109470536 496707 Not Provided
Godrej Industries public B 32311 44361 6735893 3
Gujarat Fluorochemicals
non public C Private Private Private Private
Jubilant Life Sciences Ltd
non public C Private Private Private Private
Kansai Nerolac Paints Limited
non public Not Scored Private Private Private Private
Tata Chemicals public B 444988061 4505956 12162395 5
UPL Limited non public Private Private Private Private Private
Godrej Consumer
Products Limited
public A- 33980 30848 26433 2
Note Due to increase in sample size more samples were considered for this report These samples include companies from the BSE Top 200 list CDPrsquos Fixed Income sample FAIRR sample Emerging markets sample Environmental sample and Continuity climate change sampleFor further details visit https6fefcbb86e61af1b2fc4-c70d8ead6ced550b4d987d7c03fcdd1dsslcf3rackcdncomcomfycmsfilesfiles000003423originalCDP_Climate_Change_Sample_Investor_Request_2020pdfNot Scored- Companies who have submitted the minimum version questionnaire
53
A N N U A L R E P O R T 2 0 2 0
Sector Company Name 2020 permission Status
Final score 2020
Scope 1 Scope 2 Scope 3 Number of categories reported in Scope 3
Energy utility networks
Adani Transmission
Ltd
public D 31870076 21155 9379637 3
GAIL public C 4925087 387358 1071 1
Financial services Axis Bank public B 6250 168043 4414712 3
HDFC Bank Ltd public B 764919 390176 1642453 3
Indusind Bank public A 88316 6278567 1277912 3
Kotak Mahindra Bank
public C 9078 69780 4290177 3
LampT Finance Holdings Limited
non public Private Private Private Private Private
State Bank of India
public B- 390 1066386 257902 5
YES BANK Limited
public A- 344515 3099369 4859625 3
Agricultural commodities
Tata Consumer Products Ltd
public A- 11731 34238 3348672939 10
Marico public A- 1380 12140 499568 9
Intermodal transport amp logistics
Adani Ports amp Special
Economic Zone
public B- 95905791 176946845 202567171 3
IT amp software development
HCL Technologies
non public Private Private Private Private Private
Infosys Limited public A- 15344 124063 371602 6
Larsen amp Toubro Infotech Ltd
public B 39485 2521874 1908034 2
Mindtree Ltd non public A- Private Private Private Private
Tata Consultancy
Services
public A- 26714 811815 702615 7
Tech Mahindra public A 1803807 105736586 39285212 5
Wipro public A- 13366 124564 421527 7
Land amp property ownership amp development
Godrej Properties Limited
public Not Scored 4400 2429 422
Mahindra Lifespace
Developers Limited
public B 397 2675 589525 8
Light manufacturing APOLLO TYRES LTD
public Not Scored 24207 60717 Not Provided
JK Tyres amp Industries
public C 158568 88424 Not Provided
54
A N N U A L R E P O R T 2 0 2 0
Sector Company Name 2020 permission Status
Final score 2020
Scope 1 Scope 2 Scope 3 Number of categories reported in Scope 3
Media telecommunications amp data center services
Bharti Airtel non public D Private Private Private Private
Reliance Jio Infocomm
Limited
public B 105018 1826762 243195034 3
Tata Communications
public A- 6376 108482 6938 3
Metal smelting refining amp forming
Hindustan Zinc public A 4480887 253756 4182181 10
Vedanta Ltd public B- 57482869 1864711 Not Provided
JSW Steel Ltd public A- 40045307 476901 4168823 8
Tata Steel public A- 60116322 5687999 14970000 12
Metallic mineral mining
NMDC public D 29004 63671 1957 1
Oil amp gas processing Bharat Petroleum
Corporation
public B 5023580 366230 729820 2
Indian Oil Corporation
public D 18690000 54700 Not Provided
Renewable power generation
Adani Green Energy
public D 841 13313 1174 1
Azure Power public Private 323 2767
Specialized professional services
Mahindra amp Mahindra Financial Services
public B 3370 18847 22922 3
Piramal Enterprises
public C 4430568 8692844 Not Provided
Vakrangee Softwares Ltd
public B 2053355 35409 Not Provided
Textiles amp fabric goods
ARVIND Ltd public B- 3514561 238894 Not Provided
Thermal power generation
Adani Power Ltd public D 58970705 14607 6910800 1
JSW Energy public B 17200521 36117 61151 2
NTPC Ltd public D 252495018 15845 978052 3
Tata Power Co public C 34952981 22051 1226 1
Tobacco ITC Limited public B- 1241718 230192 206064 5
Transportation equipment
Hero Motocorp Ltd
non public D Private Private Private Private
Mahindra amp Mahindra
public A 40654 414552 58425531 11
Tata Motors public A- 60533 266200 3140861 8
55
A N N U A L R E P O R T 2 0 2 0
Climate Change ndash Investor requested companies132
CDP Activity Group Company name Response Status
Air transport InterGlobe Aviation Ltd Not submitted
Jet Airways (India) Ltd Not submitted
Apparel design Page Industries Ltd Not submitted
Bars hotels amp restaurants
Indian Hotels Co Ltd Submitted
Jubilant Foodworks Ltd Not submitted
Biotech amp pharma Abbott India Ltd See Another
Ajanta Pharma Ltd Not submitted
Alkem Laboratories Ltd Not submitted
Aurobindo Pharma Not submitted
Biocon Submitted
Cadila Healthcare Not submitted
Cipla Not submitted
Divirsquos Laboratories Not submitted
Dr Reddyrsquos Laboratories
Submitted
Glenmark Pharmaceuticals
Not submitted
Lupin Not submitted
Natco Pharma Ltd Not submitted
Pfizer Ltd See Another
Sun Pharma Advanced Research Company Ltd
Not submitted
Sun Pharmaceutical Industries
Not submitted
Torrent Pharmaceuticals
Not submitted
Cement amp concrete ACC Submitted
Ambuja Cements Submitted
Dalmia Bharat Ltd Submitted
India Cements Not submitted
JK Cement Ltd Submitted
Orient Cement Limited Not submitted
Shree Cement Submitted
The Ramco Cements Ltd
Not submitted
Ultratech Cement Submitted
132 These include companies from the BSE Top 200 list CDPrsquos Fixed Income sample FAIRR sample Emerging markets sample Environmental sample and Continuity climate change sample For further details visit https6fefcbb86e61af1b2fc4-c70d8ead6ced550b4d987d7c03fcdd1dsslcf3rackcdncomcomfycmsfilesfiles000003423originalCDP_Climate_Change_Sample_Investor_Request_2020pdf
See Another -The response is covered by another CDP reporting company usually the parent company
CDP Activity Group Company name Response Status
Chemicals Asian Paints Not submitted
Berger Paints India Ltd Not submitted
Castrol India Not submitted
Colgate Palmolive India See Another
Coromandel International
Not submitted
Dabur India Not submitted
Emami Ltd Not submitted
Godrej Consumer Products Limited
Submitted
Godrej Industries Submitted
GRAPHITE INDIA LTD Not submitted
HEG LTD Not submitted
Jubilant Life Sciences Ltd
Submitted
Kansai Nerolac Paints Limited
Submitted
PI Industries Ltd Not submitted
Pidilite Industries Ltd Not submitted
Procter amp Gamble Hygiene amp Health Care Ltd
See Another
SRF Ltd Not submitted
Supreme Industries Ltd Not submitted
Tata Chemicals Submitted
UPL Limited Submitted
Coal mining Adani Enterprises Not submitted
Coal India Not submitted
Gujarat Mineral Devp Corpn
Not submitted
Commercial amp consumer services
Quess Corp Ltd Not submitted
Construction Bharti Infratel Limited Not submitted
GVK Power amp Infrastructure
Not submitted
Honeywell Automation India Ltd
See Another
Larsen amp Toubro Not submitted
Voltas Not submitted
Appendix II List of companies invited to respond to CDP
56
A N N U A L R E P O R T 2 0 2 0
CDP Activity Group Company name Response Status
Financial services Gruh Finance Ltd Not submitted
HDFC Asset Management
Not submitted
HDFC Bank Ltd Submitted
HDFC Life Insurance Company Ltd
Not submitted
Housing Development Finance Corporation
Not submitted
ICICI Bank Limited Not submitted
ICICI Lombard General Insurance Company Ltd
Not submitted
ICICI Prudential Life Insurance Company Ltd
Not submitted
IDBI Bank Ltd Not submitted
IDFC First Bank Ltd Not submitted
Indiabulls Housing Finance Ltd
Not submitted
Indiabulls Ventures Ltd Not submitted
Indian Bank Not submitted
Indusind Bank Submitted
Kotak Mahindra Bank Submitted
LampT Finance Holdings Limited
Submitted
LIC Housing Finance Not submitted
Max Financial Services Not submitted
Motilal Oswal Financial Services Ltd
Not submitted
Muthoot Finance Limited
Not submitted
PNB Housing Finance Ltd
Not submitted
Power Finance Corporation
Not submitted
Punjab National Bank Not submitted
RBL Bank Ltd Not submitted
REC Ltd Not submitted
Reliance Nippon Life Asset Management Ltd
Not submitted
SBI Life Insurance Company Ltd
Not submitted
Shriram Transport Finance Co
Not submitted
State Bank of India Submitted
Union Bank of India Not submitted
YES BANK Limited Submitted
CDP Activity Group Company name Response Status
Convenience retail Avenue Supermarts Ltd Not submitted
Discretionary retail Aditya Birla Fashion and Retail Ltd
Not submitted
Future Retail Ltd Not submitted
Electrical amp electronic equipment
Amara Raja Batteries Ltd
Not submitted
Bharat Electronics Not submitted
Crompton Greaves Consumer Electricals Ltd
Not submitted
Exide Industries Not submitted
Havells India Not submitted
Motherson Sumi Systems
Not submitted
Whirlpool of India Ltd See Another
Energy utility networks
Adani Gas Ltd Not submitted
Adani Transmission Ltd Submitted
CESC Ltd Not submitted
GAIL Submitted
Indraprastha Gas Ltd Not submitted
Power Grid Corpn of India
Not submitted
Reliance Infrastructure Not submitted
Torrent Power Not submitted
Financial services AU Small Finance Bank Ltd
Not submitted
Axis Bank Submitted
Bajaj Finance Limited Not submitted
Bajaj Finserv Not submitted
Bajaj Holdings amp Invst (BHIL)
Not submitted
Bandhan Bank Not submitted
Bank of Baroda Not submitted
Bank of India Not submitted
Canara Bank Not submitted
Cholamandalam Investment and Finance Co Ltd
Not submitted
Cholamandalam Investment and Finance Company Ltd
Not submitted
City Union Bank Ltd Not submitted
Edelweiss Financial Services Ltd
Not submitted
Federal Bank Not submitted
General Insurance Corporation of India
Not submitted
57
A N N U A L R E P O R T 2 0 2 0
CDP Activity Group Company name Response Status
Food amp beverage processing
Britannia Industries Not submitted
Marico Submitted
Tata Consumer Products
Submitted
United Breweries Not submitted
United Spirits Not submitted
Varun Beverages Ltd Not submitted
Venkys India Ltd Not submitted
Health care provision Apollo Hospitals Enterprises
Not submitted
Industrial support services
GMR Infrastructure Limited
Not submitted
Intermodal transport amp logistics
Adani Ports amp Special Economic Zone
Submitted
Container Corporation of India
Not submitted
IT amp software development
HCL Technologies Submitted
Infosys Limited Submitted
Larsen amp Toubro Infotech Ltd
Submitted
Mindtree Ltd Submitted
MphasiS Not submitted
Oracle Financial Services
See Another
Tata Consultancy Services
Submitted
Tech Mahindra Submitted
Wipro Submitted
WNS Holdings ADR Not submitted
Land amp property ownership amp development
DLF Not submitted
Godrej Properties Limited
Submitted
Housing Development amp Infrastructure
Not submitted
Oberoi Realty Not submitted
Leisure amp home manufacturing
Rajesh Exports Ltd Not submitted
Titan Company Limited Not submitted
Light manufacturing 3M India Ltd Not submitted
APOLLO TYRES LTD Submitted
Balkrishna Industries Ltd
Not submitted
Ceat Ltd Not submitted
MRF LTD Not submitted
CDP Activity Group Company name Response Status
Media telecommunications amp data center services
Bharti Airtel Submitted
Reliance Communications
Not submitted
Sun TV Network Not submitted
Tata Communications Submitted
Vodafone Idea Ltd Not submitted
Zee Entertainment Enterprises
Not submitted
Metal products manufacturing
AIA Engineering Ltd Not submitted
Bosch Ltd See Another
Endurance Technologies Ltd
Not submitted
Gillette India Not submitted
Metal smelting refining amp forming
Bharat Forge Ltd Not submitted
Essar Steel Limited Not submitted
Hindalco Industries Not submitted
Hindustan Zinc Submitted
Jindal Stainless Ltd Not submitted
Jindal Steel amp Power Not submitted
JSW Steel Ltd Submitted
Steel Authority of India Not submitted
Tata Metaliks Ltd Not submitted
Tata Steel Submitted
Vedanta Ltd Submitted
Metallic mineral mining
National Aluminium Co Not submitted
NMDC Submitted
Oil amp gas extraction amp production
Oil India Ltd Not submitted
Petronet LNG Not submitted
Oil amp gas processing Bharat Petroleum Corporation
Submitted
Hindustan Petroleum Corporation
Not submitted
Indian Oil Corporation Submitted
Mangalore Refinery and Petrochemicals
Not submitted
Nayara Energy Limited Not submitted
Oil amp Natural Gas Corporation
Not submitted
Reliance Industries Not submitted
Oil amp gas storage amp transportation
Gujarat State Petronet Not submitted
Other materials Astral Poly Technik Ltd Not submitted
Powered machinery Bharat Heavy Electricals
Not submitted
Cummins India See Another
58
A N N U A L R E P O R T 2 0 2 0
CDP Activity Group Company name Response Status
Renewable power generation
Adani Green Energy Submitted
Azure Power Submitted
National Hydroelectric Power Corporation Ltd (NHPC)
Not submitted
ReNew Power Private Limited
Not submitted
SJVN Ltd Not submitted
Specialized professional services
LampT Technology Services Ltd
Not submitted
Mahindra amp Mahindra Financial Services
Submitted
NBCC Ltd Not submitted
Piramal Enterprises Submitted
Vakrangee Softwares Ltd
Submitted
Textiles amp fabric goods
ARVIND Ltd Submitted
Birla CelluloseGrasim Industries
Not submitted
Chennai Petroleum Corporation
Not submitted
Thermal power generation
Adani Power Ltd Submitted
Aditya Birla Capital Not submitted
JSW Energy Submitted
KSK Energy Ventures Limited
Not submitted
NLC India Ltd Not submitted
NTPC Ltd Submitted
Reliance Power Not submitted
Tata Power Co Submitted
Tobacco ITC Limited Submitted
Transportation equipment
Ashok Leyland Not submitted
Bajaj Auto Not submitted
Eicher Motors Ltd Not submitted
Hero Motocorp Ltd Submitted
Mahindra amp Mahindra Submitted
Maruti Suzuki India Not submitted
Tata Motors Submitted
TVS Motor Company Ltd
Not submitted
Web amp marketing services
Info Edge (India) Ltd Not submitted
Wood amp paper materials
Century Textiles amp Industries
Not submitted
59
A N N U A L R E P O R T 2 0 2 0
Climate Change ndash Self Selected companies
CDP Activity Group Company name Response Status
Chemicals AARAV FRANCES amp FLAVORS PRIVATE LIMITED Submitted
GHCL LIMITED Submitted
Gujarat Fluorochemicals Submitted
Light manufacturing JK Tyres amp Industries Submitted
Cement amp concrete JSW Cement Limited Submitted
Land amp property ownership amp development Mahindra Lifespace Developers Limited Submitted
Media telecommunications amp data center services
Reliance Jio Infocomm Limited Submitted
Biotech amp pharma ZCL Chemicals Submitted
Water Security ndash Investor requested companies133
CDP Activity Group Name Response Status
Bars hotels amp restaurants Indian Hotels Co Ltd Submitted
Biotech amp pharma Ajanta Pharma Ltd Not submitted
Alkem Laboratories Ltd Not submitted
Aurobindo Pharma Not submitted
Biocon Not submitted
Cadila Healthcare Not submitted
Cipla Not submitted
Divirsquos Laboratories Not submitted
Dr Reddyrsquos Laboratories Submitted
Glenmark Pharmaceuticals Not submitted
Lupin Not submitted
Natco Pharma Ltd Not submitted
Sun Pharmaceutical Industries Not submitted
Torrent Pharmaceuticals Not submitted
ZCL Chemicals Submitted
Cement amp concrete ACC Not submitted
Ambuja Cements Submitted
Dalmia Bharat Ltd Not submitted
Shree Cement Not submitted
The Ramco Cements Ltd Not submitted
Ultratech Cement Submitted
Chemicals Asian Paints Not submitted
Berger Paints India Ltd Not submitted
Castrol India Not submitted
Coromandel International Not submitted
Dabur India Submitted
Emami Ltd Not submitted
Godrej Consumer Products Limited Submitted
Godrej Industries Submitted
Jubilant Life Sciences Ltd Submitted
Kansai Nerolac Paints Limited Submitted
Pidilite Industries Ltd Not submitted
Procter amp Gamble Hygiene amp Health Care Ltd Not submitted
SRF Ltd Not submitted
Supreme Industries Ltd Not submitted
Tata Chemicals Submitted
133 These include companies from the Water Global sample and Continuity water security sample For further details visit https6fefcbb86e61af1b2fc4-c70d8ead6ced550b4d987d7c03fcdd1dsslcf3rackcdncomcomfycmsfilesfiles000003422originalCDP_Water_Security_Sample_Investor_Request_2020pdf
60
A N N U A L R E P O R T 2 0 2 0
CDP Activity Group Name Response Status
UPL Limited Submitted
VVF Ltd Not submitted
Coal mining Adani Enterprises Not submitted
Coal India Not submitted
Construction Larsen amp Toubro Not submitted
Discretionary retail Aditya Birla Fashion and Retail Ltd Not submitted
Electrical amp electronic equipment Amara Raja Batteries Ltd Not submitted
Exide Industries Not submitted
Havells India Not submitted
Energy utility networks GAIL Not submitted
Power Grid Corpn of India Not submitted
Food amp beverage processing Marico Submitted
Tata Consumer Products Ltd Submitted
IT amp software development Tech Mahindra Submitted
Light manufacturing APOLLO TYRES LTD Not submitted
JK Tyres amp Industries Submitted
MRF LTD Not submitted
Media telecommunications amp data center services
Tata Communications Not submitted
Metal smelting refining amp forming Bharat Forge Ltd Not submitted
Hindalco Industries Not submitted
Hindustan Zinc Submitted
Jindal Steel amp Power Not submitted
JSW Steel Ltd Not submitted
Tata Steel Submitted
Metallic mineral mining National Aluminium Co Not submitted
NMDC Not submitted
Oil amp gas extraction amp production Oil India Ltd Not submitted
Petronet LNG Not submitted
Oil amp gas processing Bharat Petroleum Corporation Not submitted
Hindustan Petroleum Corporation Not submitted
Indian Oil Corporation Not submitted
Oil amp Natural Gas Corporation Not submitted
Reliance Industries Not submitted
Oil amp gas storage amp transportation Gujarat State Petronet Not submitted
Specialized professional services Piramal Enterprises Submitted
Textiles amp fabric goods ARVIND Ltd Submitted
Birla CelluloseGrasim Industries Not submitted
Thermal power generation Adani Power Ltd Submitted
JSW Energy Not submitted
NTPC Ltd Submitted
Tata Power Co Submitted
Tobacco ITC Limited Submitted
Transportation equipment Ashok Leyland Not submitted
Bajaj Auto Not submitted
Hero Motocorp Ltd Not submitted
Mahindra amp Mahindra Submitted
Maruti Suzuki India Not submitted
Tata Motors Not submitted
61
A N N U A L R E P O R T 2 0 2 0
Water Security ndash Self Selected companies
CDP Activity Group Name Response Status
Chemicals AARAV FRANCES amp FLAVORS PRIVATE LIMITED Submitted
Transportation services Adani Ports amp Special Economic Zones Submitted
Other materials Piramal Glass Submitted
62
A N N U A L R E P O R T 2 0 2 0
Appendix III - Indian Companies Committed to ActionScience-based Target initiative (SBTi)Approved 15degC
Mahindra Heavy Engines Ltd Mahindra EPC Irrigation Limited White House
Dr Reddys Laboratories Ltd Swaraj Engines Limited Gromax Agri Equipment Limited
Mahindra Accelo Mahindra Holidays and Resorts India Limited Mahindra Lifespaces Developers Limited
Mahindra Lifespaces Developers Limited Mahindra World City (Jaipur) Ltd Mahindra World City Developers Ltd
Polygenta Technologies Limited
Approved well-below 2degC
Tata Chemicals Limited Mahindra amp Mahindra Limited Wipro
Mahindra First Choice Services Ltd Mahindra Electric Mobility Ltd
Approved 2degC
Hindustan Zinc Limited Mahindra Sanyo Special Steel Shree Cement Ltd
Tech Mahindra
SBTi Committed
Infosys Limited UPL Limited JSW Energy Limited
Godrej Agrovet Limited Godrej Consumer Products Limited Godrej Industries
Godrej Properties Limited Godrej amp Boyce Mfg Co Ltd Ultratech Cement Limited
Vakrangee Limited ACC Limited Adani Ports and Special Economic Zone Limited
SCM Garments PVT Limited Nahar Industrial Enterprises Limited Ambuja Cement Ltd
Adani Green Energy Ltd Reliance Jio Infocomm Limited Bharti Airtel Limited
Gujarat Fluorochemicals Ltd (GFL) Dalmia Bharat Limited HCL Technologies
Havells India Limited Mahindra Susten Eastman Exports Global Clothing Pvt Ltd
JK Tyre amp Industries Ltd Marico Limited Tata Global Beverages Ltd
EPC Industries Limited Mahindra amp Mahindra Financial Services Limited YES BankSBTi companies not in CDP Sample
RE100Dalmia Bharat Ltd Infosys Ltd Mahindra Holidays amp Resorts India Ltd
Tata Motors Ltd
RE100 companies not in CDP Sample
Internal Carbon Pricing (ICP)Pricing carbon in 2020
ACC Ambuja Cements Dalmia Bharat Ltd
Dr Reddyrsquos Laboratories Godrej Consumer Products Godrej Industries
Gujarat Fluorochemicals Hero Motocorp Ltd Hindustan Zinc
63
A N N U A L R E P O R T 2 0 2 0
Infosys Limited JSW Cement Limited JSW Steel Ltd
Mahindra amp Mahindra Mindtree Ltd Shree Cement
Tata Chemicals Tata Consultancy Services Tata Consumer Products
Tata Motors Tata Steel Tech Mahindra
Ultratech Cement Wipro
Planning to price in the next two years
Adani Ports amp Special Economic Zone ARVIND Ltd GAIL
GHCL LIMITED Indian Hotels Co Ltd JK Tyres amp Industries
JSW Energy Jubilant Life Sciences Ltd Larsen amp Toubro Infotech Ltd
Mahindra amp Mahindra Financial Services Mahindra Lifespace Developers Limited Marico
NTPC Ltd Piramal Enterprises Reliance Jio Infocomm Limited
Tata Communications Tata Power Co UPL Limited
Vakrangee Softwares Ltd Vedanta Ltd YES BANK Limited
64
A N N U A L R E P O R T 2 0 2 0
About CDPCDP is a not-for-profit charity that runs the global disclosure system or investors companies cities states and regions to manage their environmental impacts by running a global environmental disclosure system Each year CDP supports thousands of companies cities states and regions to measure and manage their risks and opportunities on climate change water security and deforestation We do so at the request of their investors purchasers and city stakeholders
Over the last two decades we have created a system that has resulted in unparalleled engagement on environmental issues worldwide In 2020 Over 9600 companies reported through CDP on climate change water security and forests and over 800 cities and more than 120 states and regions disclosed their environmental impacts through CDP
CDP IndiaCDP began working in India in 2008 and was formally registered in 2012 working on disclosure and driving climate action It serves as a source of knowledge for hundreds of Indian corporations from those that are just beginning on the road to corporate environmental disclosure through to those looking to improve sustainability and make commitments to reduce environmental impact
It is the only NGO to be named in Indiarsquos INDC submission to the UNFCCC owing to its corporate environmental data repository and tracking of emissions and mitigation data from the Indian Industry CDP India also actively participated in Government of Indiarsquos Ministry of Environment Forests amp Climate Change (MoEFCC) work on future carbon market mechanisms In addition to our work on disclosure CDP India is actively engaged in other initiatives including Internal Carbon Pricing (ICP) Science-based targets (SBT) and RE100
65
A N N U A L R E P O R T 2 0 2 0
CDP ContactsFor more info contact Damandeep Singh Director CDP India damandeepsinghcdpnet infoindiacdpnet
CDP Board of Directors
Bharati Chaturvedi Founder amp Director Chintan Environmental Research and Action Group
Ramakrishnan Mukundan Managing Director amp CEO Tata Chemicals Limited
Damandeep Singh Director CDP India
Important Notice
The contents of this report may be used by anyone providing acknowledgement is given to CDP Worldwide (CDP) This does not represent a license to repackage or resell any of the data reported to CDP or the contributing authors and presented in this report If you intend to repackage or resell any of the contents of this report you need to obtain express permission from CDP before doing so
CDP India has prepared the data and analysis in this report based on responses to the CDP 2020 information request No representation or warranty (express or implied) is given by CDP India as to the accuracy or completeness of the information and opinions contained in this report You should not act upon the information contained in this publication without obtaining specific professional advice To the extent permitted by law CDP India do not accept or assume any liability responsibility or duty of care for any consequences of you or anyone else acting or refraining to act in reliance on the information contained in this report or for any decision based on it All information and views expressed herein by CDP India is based on their judgment at the time of this report and are subject to change without notice due to economic political industry and firm-specific factors Guest commentaries where included in this report reflect the views of their respective authors their inclusion is not an endorsement of them
CDP India their affiliated member firms or companies or their respective shareholders members partners principals directors officers andor employees may have a position in the securities of the companies discussed herein The securities of the companies mentioned in this document may not be eligible for sale in some states or countries nor suitable for all types of investors their value and the income they produce may fluctuate andor be adversely affected by exchange rates
lsquoCDP Worldwidersquo and lsquoCDPrsquo refer to CDP Worldwide a registered charity number 1122330 and a company limited by guarantee registered in England number 05013650
copy 2020 CDP Worldwide All rights reserved
This report is printed on recycled paper
This report is printed on CyclusPrint based on 100 recycled fibres
This report is printed on CyclusPrint based on 100 recycled fibres
Supported by Scoring partner
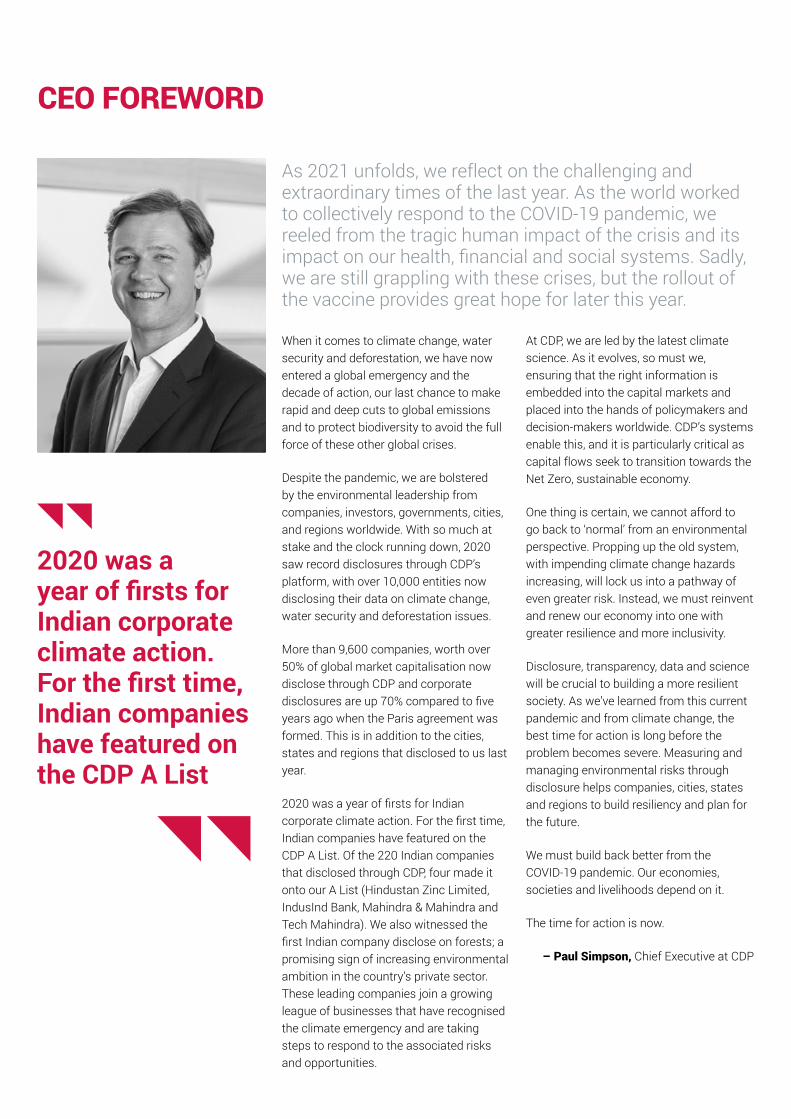
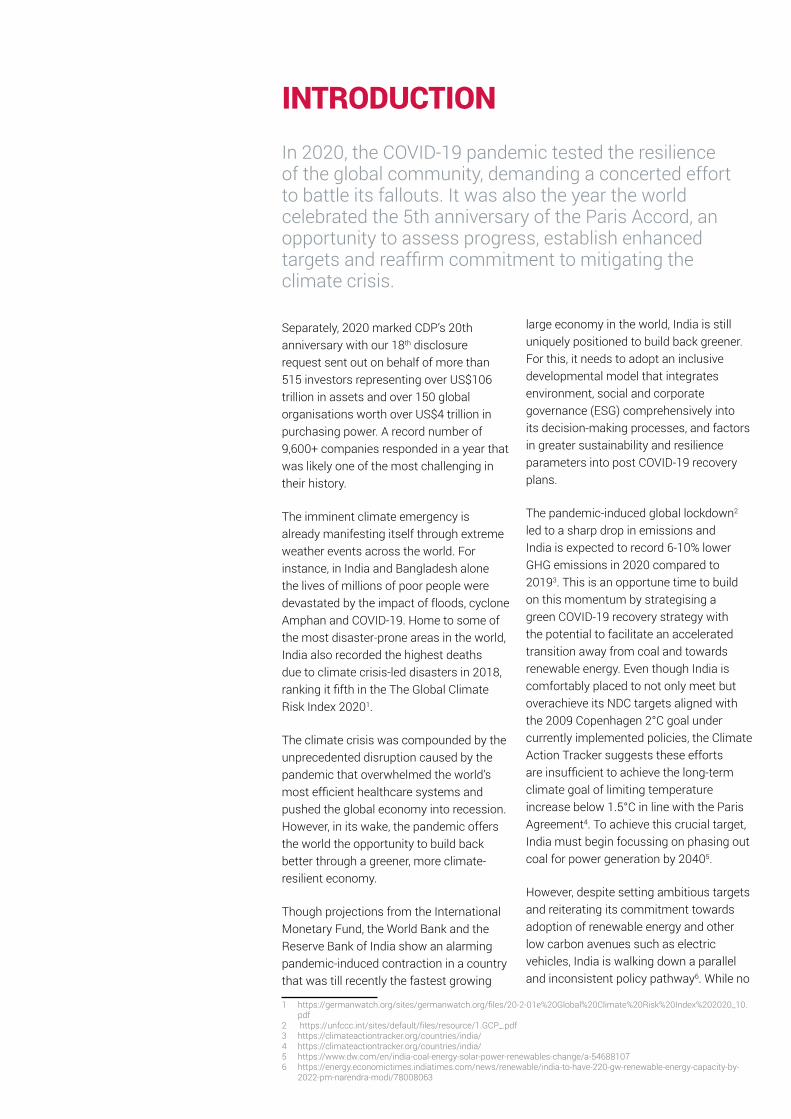
4
A N N U A L R E P O R T 2 0 2 0
new coal power stations have been set up in 2020 we continue to promote coal mining pursue increased coal production targets and have lately also allowed private investors into the market despite reduced utilisation of coal power plants and declining profitability7 Moreover even though a 50 decrease in the cost of solar power in two years is a major stimulus for adoption of renewable energy by targeting the concurrent development of 90+ GW of coal-based power capacity under the 2018 National Electricity Plan8 (NEP) India not only risks increasing its emissions but also turning the project into a stranded asset
Beyond the broad NDC targets Indian policymakers have started detailed consultations with companies to prepare them for broader action
Considering this focus on stranded assets and ESG emerging as an investment opportunity with over a third of global assets being built around ESG themes the Securities and Exchange Board of India (SEBI) hosted a roundtable in January 2021 to deliberate upon business preparedness to align with the sustainability-focused requirements it proposed9 This comes on back of the 77-page consultation paper issued by the SEBI in April 2020 on business responsibility and sustainability reporting10
The Ministry of Environment Forests and Climate Change (MoEFCC) also held a similar India CEO Forum on climate change in November 2020 to ldquoforge long standing and sustainable partnership between the Government and private sectorrdquo During the Forum a Declaration of Private Sector on Climate Change endorsed by 24 industry leaders and MoEFCC was released11 The industries included the likes of ITC Reliance Industries TATA Piramal Dalmia Mahindra ACClt Ambuja JSW Steel Renew Vedanta Dr Reddyrsquos and SUN Pharma12
Around the same time CDP also worked with its industry colleagues and partners (TERI We Mean Business World Business Council for Sustainable Development World Resources Institute and Climate Group) to develop a lsquoCall to Actionrsquo on eight business priorities for a green recovery This was signed by 24 business leaders and emphasised the need to
^ Invest in social infrastructure ensuring greater access and resilience
^ Accelerate power sector transition and clean mobility adoption
^ Deploy solutions for growing amp managing food to support growing needs
^ Collaborate and invest to achieve Land Degradation Neutrality ^ Pioneer green manufacturing and industrialisation ^ Transform to green building as the new normal across
geographies amp demographics
7 httpsclimateactiontrackerorgcountriesindia8 httpswwwcarbonbrieforgthe-carbon-brief-profile-india9 httpswwwmoneycontrolcomnewsbusinessmarketsformat-for-business-responsibility-sustainability-reporting-to-bring-in-more-transparency-ajay-tyagi-6353091html10 httpswwwsebigovinreports-and-statisticsreportsaug-2020consultation-paper-on-the-format-for-business-responsibility-and-sustainability-reporting_47345html11 httpspibgovinPressReleasePageaspxPRID=167035112 httpsstaticpibgovinWriteReadDatauserfilesFinal20Declarationpdf13 httpspibgovinPressReleaseIframePageaspxPRID=167763014 httpseceuropaeuinfobusiness-economy-eurobanking-and-financesustainable-financeinternational-platform-sustainable-finance_en15 httpswwwbusiness-standardcomarticlecurrent-affairsone-sun-one-world-one-grid-all-you-need-to-know-about-solar-strategy-120081500417_1html16 httpswwwnews18comnewsindiamodi-says-india-on-track-to-achieve-paris-climate-accord-targets-3172190html17 httpswwwnrdcorgsitesdefaultfilesroad-from-paris-202009pdf18 httpsnitigovinsitesdefaultfiles2020-06India_Green_Stimulus_Report_NITI_VF_June_29pdf
^ Invest in research for new clean energy sources to strengthen Indias energy outlook
^ Provide access to green finance to support emission saving measures across sectors
To further strengthen corporate action and adopt a more structured policy approach the Indian Government recently formed an Apex committee for the Implementation of Paris Agreement13 (AIPA) This committee will oversee Indiarsquos NDCs and monitor the contribution made by the private sector as well as multi- and bi-lateral agencies in the field of climate change under the chairmanship of the secretary MoEFCC India is also a part of the International Platform on Sustainable Finance14 launched by the European Commission in October 2019 to develop globally acceptable finance standards that can aid the mobilisation of private funds towards environmentally sustainable investments
Most importantly the recent initiative ldquoOne Solar One World and One Grid15rdquo (OSOWOG) launched by the International Solar Alliance (ISA) is an endeavour to connect 140 countries through a single grid that will be used for the transfer of solar power
We have reduced our emission intensity by 21 per cent over 2005 levels Our solar capacity has grown from 263GW in 2014 to 36 GW in 2020 Our renewable energy capacity is the fourth largest in the world It will reach 175GW before 2022 - Narendra Modi Prime Minister of India at Climate Ambition Summit16
In response to the COVID-19 economic crisis India also announced a large stimulus package ldquoAtmanirbharrdquo (self-reliant) amounting to US$260 billion17(10 of its GDP in 2019-20) Considered a step towards greater self-reliance the package intends to promote sustainable development and enhance job creation through investments in local manufacturing energy efficiency and renewable energy generation18 For instance while the stimulus allocates `30000 crores (US$4 billion) for agriculture and rural development these funds can be utilised for the installation of solar pumps and solar irrigation However to achieve an ambitious target of 450-GW installation capacity by 2030 it will need to channel a massive investment of US$700 billion This ambition can be realised only through funding support by international agencies including development finance institutions and other private players The domestic public and private institutions alone will not suffice Mark Carney the Governor of the Bank of England suggests that this is not just a financing challenge but a multi-
5
A N N U A L R E P O R T 2 0 2 0
trillion business opportunity Incidentally an IFC report released in 2018 highlights that the potential of climate finance in India is US$31 trillion
The Indian railway has also reiterated its commitment to achieving complete electrification of its network by 2023 targeting an ambitious net zero emissions by 203019
While governments have poured close to US$13 tn of public stimulus into economies so far the recovery packages are expected to have a net positive environmental impact in only seven of the 25 major world economies analysed stated the updated Greenness of Stimulus Index (GSI) report from Vivid Economics and Finance for Biodiversity20 A nature-based stimulus investment scenario outperforms a business-as-usual stimulus investment scenario globally by delivering more jobs more economic activity more carbon sequestration better nature outcomes and stronger resilience to extreme weather events including flood control says report co-author Jeffrey Beyer from Vivid Economics21
At the recently held Climate Ambition Summit on December 12 2020 UN Chief Antonio Guterres called on world leaders to declare a State of Climate Emergency in their countries until carbon neutrality is achieved22 To recover better from the COVID19 pandemic he urged countries to adhere to a green and resilient pathway by calling for investments in green jobs refusing bail-outs to polluting industries ending fossil-fuel subsidies and factoring climate risks into all financial and policy decisions
In this light this year has witnessed unprecedented calls for commitment action and investments not only from states but also from businesses and civil society groups The global momentum on climate action has been building with several European countries committing to net-zero emissions According to Blackrock23 88 of sustainable funds outperformed their non-sustainable counterparts from JanuaryndashApril 2020 highlighting the fact that ESGsustainable investing can future-proof investments while shaping a better future
Interestingly this year CDP also witnessed record-breaking disclosures mdash 10000+ companies cities states and regions disclosed through its platform Of these 9600+ companies with a combined worth of over 50 in global market capitalisation disclosed through CDP resulting in a 70 rise in corporate disclosures compared to 2015 the year the Paris agreement was signed24 CDP also launched its temperature ratings25 in collaboration with Europersquos largest asset manager Amundi enabling investors to access a temperature pathway for over 2850 global companies based on company emission reduction targets
19 httpspibgovinPressReleasePageaspxPRID=163826920 httpsenvironment-analystcomglobal106352recovery-stimulus-packages-are-causing-harm-to-nature21 httpsenvironment-analystcomglobal106352recovery-stimulus-packages-are-causing-harm-to-nature22 httpswwwindiatodayinworldstorydeclare-climate-emergency-un-chief-guterres-urges-leaders-of-every-country-1749078-2020-12-1323 httpswwwblackrockcomcorporateliteratureinvestor-educationsustainable-investing-resiliencepdf24 httpswwwcdpnetenarticlesclimate2020-lessons-from-an-extraordinary-year25 httpswwwcdpneteninvestortemperature-ratings
In India CDP witnessed a nearly 17 increase in corporate disclosure compared to 2019 with 220 Indian companies disclosing to investors and customers Climate change disclosure to investors recorded a rise of 14 Remarkably water security disclosure to investors also witnessed a significant increase of 87 Moreover for the first time a company responded to the forests request from investors through CDP India
With an ever-increasing number of companies choosing to disclose through CDP it is imperative to leverage the opportunity provided by the pandemic to transition from a grey to a green economy and join a growing league of climate leaders like Hindustan Zinc Limited IndusInd Bank Mahindra amp Mahindra and Tech Mahindra that deserve a special mention for being among the first Indian companies to make it to the prestigious CDP A List
Today Indian businesses realise that the risks posed by climate change are here to stay Therefore business leaders like Reliance Industries (a large conglomerate with businesses across oil amp gas telecom and retail amongst others) and JSW Energy (a thermal power company) have taken voluntary commitments to go net-zero (by 2035) and carbon-neutral (by 2050) respectively
Indian companies in highlight this year
Hindustan Zinc AIndusind Bank AMahindra amp Mahindra ATech Mahindra AGodrej Consumer Products Limited A-Infosys Ltd A-JSW Steel Ltd A-Marico A-Mindtree Ltd A-Tata Communications A-Tata Consultancy Services A-Tata Consumer Products A-Tata Motors A-Tata Steel A-Wipro A-YES BANK Limited A-
6
A N N U A L R E P O R T 2 0 2 0
Further the attempt to integrate climate action into business is also reflected in the disclosure responses received by CDP in the 2020 cycle
The business community is uniquely positioned to innovate and execute solutions with greater rigour and efficiency by integrating sustainability in the core business decision making with or without changes to the regulatory landscape Corporates can drive the desired change towards clean energy transitions by joining initiatives such as environmental disclosure the Science-Based Targets initiative RE100 and by incorporating an internal carbon price to deliver faster emission cuts in key areas However corporations need to be supported by governments through clearer long-term policies on energy and climate to instil the confidence needed to invest in technologies and innovation towards a zero-carbon future26
26 httpswwwwemeanbusinesscoalitionorgblogparis-agreement-the-power-of-ingenuity-with-collaboration-is-insurmountable
India is endowed with high social and environmental diversity and cannot expect to formulate a one- size- fits- all solution for its climate concerns What it requires is the coming together of all stakeholders to showcase the power of the collective especially its 13 billion people without whom no solution would be truly impactful
As disclosure and transparency are vital in lsquobuilding back betterrsquo CDP is poised to play a pivotal role as a global environmental disclosure platform helping companies cities states and regions measure and manage their environmental risks through disclosure The COP26 in Glasgow will be an important milestone in this direction and will enable countries to assess progress on their Paris Agreement goals and commit to more ambitious targets
As we work towards a low carbon future we must also pledge to build a more equitable world where vulnerable sections are no longer left to bear the brunt of tragedies triggered by climate change
17
Investor requested corporate disclosures for climate
change from Indian companies grew by
increase in investor requested corporate disclosures for Water Security Disclosures
87growth has been witnessed
over last year
` 7138Billion
worth of climate related risks calculated
by companies
3752
Indian companies have committed to the
SBTi by 2020
companies58
are pricing carbon or are planning to do so in the
next two years
7
A N N U A L R E P O R T 2 0 2 0
Business leaders are almost unanimously deliberating on climate issues and an overwhelming majority of companies now incentivise their managements to undertake climate action About three-fourths of these incentives are in the form of a financial compensation GAIL has a portal where staff members can give their suggestions on how to manage climate risks and employees whose suggestions are accepted are given a financial reward of `100000 Among the various types of non-monetary rewards BPCL recognises employees for undertaking initiatives in Health Safety Security and Environment (HSSE) through an annual performance award Mahindra amp Mahindra provide acknowledgement certificates to employees for energy efficiency projects as well as to those contributing to the annual sustainability reporting
The most commonly appointed positions that companies have chosen to place the responsibility of overseeing climate-related issues are board-level committee members the CEO the director the board chair and the CSO These individuals are also at the top of the corporate ladder which denotes the growing importance of climate change not just as a sustainability issue but as a broader global risk that threatens to undermine financial bottom lines erode shareholder value and tarnish brands
More than 75 companies provide an update to their respective boards on climate change-related issues at least
27 httpcbsteriinorgindiaghgphp~text=The20total20inventory20managed20bypercent20of20Indias20total20emissions
every quarter highlighting the growing importance of environmental sustainability as a core business value
Sustainability is deeply entrenched in the financial structure of companies today influencing access to capital capital expenditure direct and indirect costs and capital allocation Hence it comes as no surprise that 66 out of 67 companies stated that climate-related risks and opportunities have had an impact on their organisationrsquos strategy for financial planning Of these 66 companies 46 have also developed a low-carbon transition plan to minimise the losses to their bottom lines
SUSTAINABILITY ndash HEART OF GOOD GOVERNANCE
Businesses that currently account for 76 of the total energy consumption are vital for the country to tread the path of sustainable development As engines that will drive economic growth in the aftermath of the pandemic corporates present an immense opportunity for India to meet its climate commitments (NDCs) under the Paris Agreement through large-scale emissions reduction29
Frequency of reporting of climate-related issues
Oversight amp Incentive
Board- level oversight Incentive to management
99 8845
34
8
53
More frequency than quarterly
Quarterly
Half-yearly
4Annually
As important
matters arise
Not reported to the board
a
ge o
f com
pani
es
8
A N N U A L R E P O R T 2 0 2 0
Climate-related scenario analysis allows businesses to not only project future operational emissions but also mobilise necessary resources to offset the carbon footprint in their sustainability measurement approach It is especially important that the application of scenario analysis incorporates dynamic and unstable conditions under which companies are operating such as the COVID-19 pandemic that has resulted in mass layoffs economic recession and lockdowns across the world This would enable corporations to explore a broader range of uncertainties and be more resilient to external drivers of change28
The rigorous computational analysis would provide direction to enterprises on how to set emission reduction targets in line with the 20C scenario About 63 of the reporting companies use climate analysis tools such as models or scenarios enumerated
28 httpswwwfsborgwp-contentuploadsP291020-3pdf
under the Nationally Determined Contributions and International Energy Agencyrsquos 2 Degree Scenario (2DS) to inform their business strategy
Climate-based risks and opportunities have also influenced the strategy of companies in the sphere of investment in RampD Products amp Services Operations and Supply ChainValue chain Among these areas 87 companies claimed that Operations were affected and 84 reported changes in planning for Products and Services
Investmentin RampD
343
657
No
of C
ompa
nies
No Yes
Product amp Services 164
836
No Yes
No
of C
ompa
nies
Supply chain Value chain
701
298
No Yes
No
of C
ompa
nies
Operations
866
134No
of C
ompa
nies
No Yes
9
A N N U A L R E P O R T 2 0 2 0
CLIMATE-RELATED RISKS amp OPPORTUNITIESMore often than not the financial impacts of climate-related issues are not quantified and identifying them in the first place could be challenging These issues necessitate actions Increasingly investors lenders and other financial regulators are becoming more focused on ensuring that the private sector is ready to address climate risks and grab opportunities brought by changing climate
29 httpthoughtleadershipaoncomDocuments20200122-if-natcat2020pdfutm_source=cerosamputm_medium=storypageamputm_campaign=natcat20
30 httpswwwbankofenglandcouk-mediaboefilesspeech2019avoiding-the-storm-climate-change-and-the-financial-system-speech-by-sarah-breedenpdf
31 httpsreadoecd-ilibraryorgviewref=136_136201-ctwt8p7qs5amptitle=Making-the-Green-Recovery-Work-for-Jobs-Income-and-Growth_
32 https6fefcbb86e61af1b2fc4-c70d8ead6ced550b4d987d7c03fcdd1dsslcf3rackcdncomcmsreportsdocuments000005312originalAnalysis_of_CA100__Data_for_CDP_Investor_Signatories_v5pdf1596046258
33 Climate Action 100+ is an investor initiative to ensure the worldrsquos largest corporate GHG emitters take necessary action on climate change The companies include 100 lsquosystemically important emittersrsquo accounting for 23rd of annual global industrial emissions alongside more than 60 others with significant opportunity to drive the clean energy transition Read more at httpwwwclimateaction100org
Climate change has already shown substantial impacts on businesses all around the world and this is expected to continue As per a 2019 report 29 the total direct economic losses incurred due to climate-related natural disasters in 2019 were estimated at US$232 billion In India the monsoon floods in June-October 2019 caused an economic loss of US$10 billion and claimed 1750 lives Additionally the Bank of England has estimated asset losses worth US$20 trillion due to climate change if no action is taken now 30
COVID-19 has taught the world how the pandemic can actually be used as an
opportunity to better understand and mitigate climate-related
risks Investors are now more than ever more focussed on risk exposure Post-COVID-19 civil society groups governments and business are all have aligned in trying to reduce the risks to our economy and world going forward
As per an OECD report despite widespread socio-
economic suffering suffering there is an increase in public
consciousness about the risks to the natural system from anthropogenic activities31
CDP recently released a report32 on the analysis of CA100+ companies for CDP Investor Signatories Up to 118 of 122 CA100+33 companies report being exposed to substantive climate-related risks and opportunities 93 companies identified climate-related risks and 91 identified climate-related opportunities as having the potential to have a substantive financial or strategic impact on their businesses
As per CDP Indiarsquos 2020 data companies have a varied definition of what short medium and long-term means for them -- a rough average across the sample would be three years for short term five years for medium term and 15-20 years for the long term although the latter also ranges up to 100 years These time frames are important in planning risk management processes -- contextualisation of risks in terms of potential market changes and evolving technological scenarios around risk management at enterprise level
Responding companies
67Companies identified
climate related substantive risks
62Companies
identified risk typesdrivers
60Companies
identified potential financial impact
driver
60
Companies provided potential financial
impact figures
42
10
A N N U A L R E P O R T 2 0 2 0
THE RISKS OF CLIMATE CHANGE
In terms of risk types current regulation was deemed to be most relevant and always included in 97 of the organisationsrsquo climate-related risk assessments This was followed by emerging regulation and technology Interestingly findings from responses submitted by global companies corroborate this trend analysis as almost all CA100+ respondents reported policy and legal risks as potential drivers for substantive impact when it comes to transition risk34 With regular compliance checks increased stakeholder concern and sustainably evolving consumer demands climate-related risk assessment procedures can help companies become better equipped to handle longer-term uncertainties and liabilities
The number of companies that identified inherent climate-related risks with potential substantive financial or strategic impact on businesses rose to 94 from 88 in 2019 Up to 63 of reporting companies were able to get to the last mile of providing a financial impact figure to the risks identified Disclosing Indian companies put the total inherent financial impact of climate risks at `7138 billion with an average risk per company being `92 billion
Companies have also identified climate-related risks across their value chain with direct operations being the most severely affected and exposed most to acute physical risks followed by emerging regulation current regulations and chronic physical risks Companiesrsquo lsquodownstreamrsquo value chain is affected the most by market risks followed by acute physical risks Downstream value chain refers to the third parties benefiting from the outputs products and services of business activities This may be a companyrsquos customers and clients or the organisations and projects the business invests in This could possibly mean that changing customer behaviour could gravely affect a business operation if there is a shift in the demand for a comparatively low-carbon intensive product as well as greater demand for product efficiency regulations and standards providing clear evidence that there is a continuous shift towards sustainable products
CLIMATE RISKS AN OPPORTUNITY TO RESTRATEGISE
Up to 94 of reporting companies have identified climate-related opportunities as having the potential to make a substantive financial or strategic impact on businesses And 63 have provided a potential financial impact figure to the opportunities related to climate change Disclosing companies put the cost of climate-related opportunities at a total of `2787 billion The figure is a testament to the evolution of the climate change mitigation program and how organisations see this
34 https6fefcbb86e61af1b2fc4-c70d8ead6ced550b4d987d7c03fcdd1dsslcf3rackcdncomcmsreportsdocuments000005312originalAnalysis_of_CA100__Data_for_CDP_Investor_Signatories_v5pdf1596046258
No of Companies
Opp
ortu
nity
typ
es
Opportunity identified in value chain
Direct operations
Downstream
Upstream
Resource efficiency
Product and services
Energy source
Markets
Resilience
41
25 18
34 7
7
9 3
3
2
3
396
6
Risks relevant to Indian companies
Current regulation97Emerging regulations90Reputation90Market85Technology85Legal
Acute physical
Chronic physical
827973
No of Companies
Risk occuring in value chain
No of Companies
Risk
type
s
Reputation
Legal
Emerging regulation
Chronic physical
Technology
Market
Current regulation
Acute physical
Direct operations
Downstream
Upstream
5115
2
2923 4 8
17
8 14 7122 4
40 5 8
2
31
11
A N N U A L R E P O R T 2 0 2 0
Similarly most companies saw resource efficiency as a major climate-related opportunity followed by energy source and products and services in their lsquodirect operationsrsquo The main drivers behind these opportunities were use of more efficient production and distribution processes use of lower-emission sources of energy and development andor expansion of low-emission goods and services In the lsquodownstreamrsquo value chain products and services was majorly witnessed as an opportunity as there is growing consumer awareness and concern around sustainability related issues As a result companies are constantly diversifying their portfolios to address these consumer needs
Prod
uct a
nd s
ervi
ces
Ener
gy S
ourc
e
Resi
lienc
e
Resi
lienc
e
Ener
gy S
ourc
e
Reso
urce
effi
cien
cyM
arke
ts
2787identified to be the financial impact of reported climate-
related opportunities (in rupee billion)
Billion
`452
328
270
18
1719
Responding companies
67Companies
identified climate related
substantive opportunities
63Companies identified
opportunitiy typesdrivers
61
Companies identified
potential financial impact driver
60
Companies provided potential financial impact
figures
42
2041
4715
136
119
42413842
Acut
e ph
ysic
alCu
rren
t reg
ulat
ion
Emer
ging
regu
latio
n
Chro
nic
phys
ical
Repu
tatio
nO
ther
s
Lega
l
Tech
nolo
gyM
arke
t
7138identified to be the financial impact of reported climate-
related risks (in rupee billion)
Billion
`Financial impact of reported climate-related risks (in rupees billion)
Financial impact of reported climate-related opportunities (in rupees billion)
12
A N N U A L R E P O R T 2 0 2 0
Tech Mahindra Tapping into climate-related opportunities
Tech Mahindrarsquos approach towards climate change mitigation strategies is a testament to the efficacy of tapping into and realising climate-related opportunities The company has adopted Science-Based Targets to reduce its emissions and is a signatory to Business Ambition of 15 degree Celsius Tech Mahindra is committed to responsibly managing its operations through continuous improvement in sustainability practices across its value chain The company focuses on carbon emission reductions energy consumption reduction self-generation of energy from renewable energy sources and encouragement for green projects through Power Purchase Agreements The company has taken a target to increase Renewable Energy (RE) to 50 by 2025 Their sustainability report is aligned with CDSB amp Task Force on Climate-related Financial Disclosures (TCFD) frameworks
A constant focus on green energy and sustainable operations has provided a significant saving of US$27 million brought about by increasing renewable energy capacity to 1383MW leading to a saving of 28 million units of electricity adopting energy efficient practices across their facilities
Tech Mahindra has harnessed the power of disruptive next-generation technologies such as Artificial Intelligence (AI) analytics and blockchain to create solutions that ensure both its own and its customersrsquo carbon footprint reduction The company has contextualised opportunities for its customers as well by creating smart city offerings such as SMART Grid Micro-Grid-As-A-Service Intelligent Electric Vehicle Charging System (IEVCS) smart energy management smart traffic management smart lightening management smart waste management systems and command amp control centres These smart city offerings will help reduce carbon footprints across multiple smart cities globally thereby reducing carbon emissions and contributing to green and sustainable solutions It is claimed that the market size for this is expected to reach US$4639 billion by 2027
At present the risks identified by the responding companies significantly outweigh the opportunities Opportunities are slow to emerge and companies need to focus on the use of lower-emission sources of energy development andor expansion of low-emissions goods and services development of climate adaptation resilience and insurance risk solutions and use of more efficient production and distribution processes
In 2015 at the request of the G20 Finance Ministers and Central Bank Governors the Financial Stability Board (FSB) and its chair Mark Carney established the industry-led TCFD This was set up in response to increasing demands from investors lenders insurers regulators policy makers and other stakeholders in the financial markets for decision-useful climate-related information CDP has aligned its information requests with the TCFD alongside introducing a sectoral focus and adopting a forward-looking approach to climate-risk disclosure We are already going in the direction of mandatory disclosure of climate risks how they are present in a companyrsquos activities how they manage it and how resilient they are to it The UK will be the first country in the world to make TCFD-aligned disclosures fully mandatory across the economy by 2025 going beyond the lsquocomply or explain approachrsquo35
35 httpswwwgovukgovernmentnewschancellor-sets-out-ambition-for-future-of-uk-financial-services
13
A N N U A L R E P O R T 2 0 2 0
Under current policies Indiarsquos projected emissions for 2030 can achieve a rating of ldquo15degC Paris Agreement compatiblerdquo if domestic emissions peak and start reducing with international support36 This shows that India has the potential to become a world leader with enhanced 15-degree compatible targets through a swift transition from coal to renewable energy Although India was already on track to meet its NDCs pre-COVID19 it has seen an even more significant drop in emissions since the onset of the pandemic During the peak of lockdown Indiarsquos energy demand reduced by almost 30 in April 202037 ie each additional week of lockdown the annual energy demand fell by 0638 This is mostly due to the significant reduction in energy consumption and power generation via fossil fuel However the impact of the pandemic on emissions is expected to be temporary and emissions are likely to rebound in 202139 as per estimations
In comparison to the NDCs which set an overall emissions target sectoral indicators can be more reliable in making informed decisions on mapping emissions reduction targeting Paris-compatible goals40 The
36 Climate Action Tracker- Fair Share37 Carbon Brief Analysis Indiarsquos CO2 emissions fall for first time in four decades amid coronavirus38 httpswwwieaorgreportsindia-202039 Carbon Brief Global Carbon Project Coronavirus causes lsquorecord fallrsquo in fossil-fuel emissions in 2020 Dec 202040 httpswwwoecd-ilibraryorgdocserver9789264273528-4-en
pdfexpires=1607881602ampid=idampaccname=guestampchecksum=891034D10FA31A953F7924772F23966D41 httpssciencebasedtargetsorgresourceslegacy201505Sectoral-Decarbonization-Approach-Reportpdf42 IPCC Mitigation Pathways Compatible with 15degC in the Context of Sustainable Development
major challenge is how to translate global temperature goals into individual actions However various strategies can be adopted to meet the long-term goals
The Science-Based Targets Initiativersquos (SBTi) Sectoral Decarbonisation Approach (SDA) allocates the well below 2degC carbon budget to different sectors taking into account inherent differences among sectors such as how fast each sector can grow relative to economic and population growth along with its mitigation potential41 According to the Intergovernmental Panel on Climate Change (IPCC) the highest global carbon budget allocation (for the period of 2011-2050) is for the power sector (25) followed by agriculture (24) and industry [including steel aluminium chemical and paper] (14)42
EMISSIONS TRENDS AND VERIFICATION
13increase in number of
organisations reporting
27increase in emissions
reporting (Scope 1+Scope 2)
90increase in scope 3 emissions reporting
India under its NDCs pledged to reduce its emissions intensity by 33-35 by 2030 compared to the 2005 levels The Climate Action Tracker38 rates Indiarsquos NDC target as ldquo2009 Copenhagen 2degC goal compatiblerdquo indicating that its commitment is a ldquofair sharerdquo of the global effort
Scope 1 and Scope 2 Emissions reported via CDP over the years
(In Million tCO2e)
2018 2019 2020
2997
55717037
14
A N N U A L R E P O R T 2 0 2 0
In order to allocate sector-specific questions to companies CDP has developed an Activity Classification System (ACS)43 It is a framework used to classify companies under the most relevant sectors It focuses on the diverse activities from which companies derive revenue associating them with the impacts to their business from climate change water security and deforestation This approach allows a better understanding of company actions based on their environmental risk opportunity and impact CDPrsquos Climate Change questionnaire requests companies to disclose their direct and indirect emissions under different emissions categories Although India saw an overall decrease in emission in 2020 there was an increase in CDP reporting companies and hence an overall increase in emissions reporting For the year
43 https6fefcbb86e61af1b2fc4-c70d8ead6ced550b4d987d7c03fcdd1dsslcf3rackcdncomcmsguidance_docspdfs000001540originalCDP-ACS-full-list-of-classificationspdf1520244912
44 The location-based method reveals what the company is physically putting into the air and the market-based method shows emissions the company is responsible for through its purchasing decisions
2020 the companies reported 70374 MtCO2e of total [Scope 1+Scope 2 (location-based)] emissions which is a 27 increase in reported emissions from 2019 This is mostly because of the significant increase in emissions reporting from several sectors mdash electric utilities cement and other heavy sectors
Only four companies chose a Scope 2 market-based approach and 43 companies selected a scope 2 location-based approach44 The total scope 2 emissions for location-based approach amounted to 181 MtCO2e and market-based approach amounted to 414 MtCO2e It is clear from this breakdown that a range of sectors and processes contribute to global emissions Focusing on any single sector alone would be insufficient However as can be seen in the
Emissions reported in Scope 3 Categories
4949
1414
1111
1010
88
55
33
Use of sold products
Purchased goods and services
Upstream transportation and
distribution
Downstream transportation and
distribution
Fuel and energy related activities (not included
in scope 1 and 2)
End of life treatment of sold products
Others
In 2020 companies have reported MtCO2e of total (Scope 1+2 [location-based]) emissions704
Gross Emissions Data 2020 (in MtCO2e)
682
126418
Gross Scope 1 Emissions
Gross Scope 3 EmissionsGross Scope 2 Emissions (Market and
Location based)
Scope 2 Location based emissions Scope 2 Market based emissions
Metal smelting refining and forming
Financial services
Cement amp concrete
Media telecommunications amp data center services
IT amp software development
Energy utility network
Chemicals
Textiles amp fabric goods
Oil amp gas processing
Biotech and pharma
Thermal power generation
Intermodule transport amp Logistics
Bar Hotels and Restaurants
Transportation equipment
Metallic mineral mining
Others
2911712
703
688536
165 292207
144118113
093087
071063
020057
024045044
157
Scope 2 Market-based emissions Scope 2 location-based emissions
Scope 2 market-based and location-based emissions reported as per CDPrsquos Primary Activity Group classification (in MtCO2e)
15
A N N U A L R E P O R T 2 0 2 0
graph for Gross Scope 2 emissions metal smelting refining and forming sectors contribute to the maximum emissions (1712 MtCO2e) followed by financial services and cement and concrete sectors
Companies reported 1259 MtCO2e of Scope 3 emissions in 2020 a 90 increase from 2019 figures due to higher disclosure as well as more companies disclosing their Scope 3 GHG inventories Almost half of the Scope 3 emissions were reported in the following categories use of sold products (49) followed by purchased goods and services (14) upstream transportation and distribution (11) and downstream transportation and distribution (10)
The ACS sectoral analysis shows that the transportation equipment activity group has the maximum reported scope 3 emissions at 615 MtCO2e followed by metal smelting refining and forming activity group at 2332 MtCO2e and cement and concrete activity group at 989 MtCO2e
Of the responding companies 33 have reported an approximately 11 of reduction in their gross global emissions (Scope 1 and 2 combined) from 2019 and 26 companies reported an approximate 57 increase in their gross global emissions from 2019 Responding companies have identified change in boundary45 as a major reason for a 62 increase in emissions from 2019 followed by acquisitions which led to a to 30 increase Amongst all sectors the electric utilities sector accounts for 83 of total increased emission values and up to 73 of these were due to change in boundary
Amongst all sectors reduction in emissions values since 2019 were mostly caused by emissions reduction initiatives (43) followed by change in output (30) and change in emission estimation methodology (23)
45 This refers to changes in the boundary used for inventory calculation ie changing from financial control to operational control This option could also apply if organisation has incorporated facilities into its inventory that were excluded in previous years
Amongst all sectors steel saw the highest reduction (around 48) in emission values and approximately half of this was achieved only from change in emission estimation methodology through recalibrating the GHG emissions for the reporting period This is followed by cement which reported a 29 reduction in emission values from implementing emissions reduction initiatives It is also noted that more than 30 of responding companies have adopted a change in renewable energy consumption but this accounts for only 35 of total reduction in emission values
Scope 3 emissions reported as per CDPrsquos Primary Activity Group classification (in MtCO2e)
of increased emissions in 2020 attributed to Change in boundary62
32 attributed to acquisitions
Metal smelting refining and forming
Cement amp concrete
Media telecommunications amp data center services
Chemicals
IT amp software development
Food amp beverage processing
Oil amp gas processing
Biotech and pharma
Thermal power generation
Land amp property ownership amp development
Financial services
Transportation equipment
Others
6157
2332
989
796
790
632
385
158
127
073
059
039
055
Third-party verification or assurance in place for Scope 12 amp 3 emissions
3571
Scope 1
3643
Scope 2 (location-based
or market based)
2786
Scope 3
a
ge o
f com
pani
es
16
A N N U A L R E P O R T 2 0 2 0
Third-party verification is one of the significant components of emission reporting An independent verification of self-reported data provides credibility and assurance It helps companies improve their internal processes identify risks and opportunities increase the reliability of their data reduce operational costs and building a strong reputation46 When an organisation monitors and verifies its emissions it can accurately identify and understand the true proportions of emissions from its sources and this can help it realise the major opportunities for emission reduction along with cost benefits
In 2020 50 companies reported third-party verification or assurance for Scope 1 emissions 51 companies for Scope 2 emissions and 39 companies for Scope 3 emissions Compared to 2019 there is an 18 increase in companies that have verified Scope 3 GHG emissions This indicates that Indian companies are becoming increasingly aware of their emission managementaccounting Amongst all sectoral companies which opt for third-party verification of their reported emissions around 25 are from IT amp software development and financial services Cement and concrete sectors rank the lowest on the list CDP encourages companies to have verified data submitted
46 The business benefits of third party verification of climate data A CDP Guide
Building a stronger reputation via third party verification
bull Increase confidence in data for internal and external use
bull Develop and demonstrate an effective carbon reduction strategy Improve business processes
bull Reduce operational costsbull Full-fill one of the mandatory criteria for entry
to the CDP A-list by gaining full points on CDPrsquos Scope 1 and 2 verification questions
bull Provide credibility for products services and internal processes
bull Counteract claims of greenwashing
17
A N N U A L R E P O R T 2 0 2 0
DECARBONISING ACROSS VALUE CHAIN Scope 3 emissions typically arise from the supply chain and the consumers using the product It has been found that the emissions from the supply chain are 5-6 times more than the carbon footprint of a companyrsquos direct operations and hence account for lionrsquos share of an organisationrsquos overall emissions47
47 httpswwwcdpnetenarticlessupply-chainsupplier-engagement-leaderboard-201948 httpswwwbcgcomen-inpublications2020supply-chain-needs-sustainability-strategy
Walking the extra mile in terms of engaging with stakeholders especially suppliers and customers on climate issues allows an organisation to consider the whole gamut of emissions and have better control over their emissions inventory For example metal companies can improve their supply chainrsquos environmental performance through adoption of a circular economy model which leads to an increased use of recycled materials in products reduces the emissions by lowering the overall burden on the manufacturing plant to produce from scratch and creates a closed-loop system with consumers48 This yearrsquos data indicates that 88 of companies engaged with their value chain partners on climate-
related issues an improvement of 5 over 2019 There was also an increase in absolute numbers -- 59 business entities collaborated with value chain partners against 49 last year
The main forms of engagement with suppliers are compliance and onboarding followed by incentivisation and information collection Educationinformation sharing collaboration and innovation are the most common customer engagement processes
Types of engagement with suppliers
No of Companies engaging with value chain on climate-related issues
2121
22
331212
1313
44
44
Other partners in the value chain customers suppliers
Other partners in the value chain suppliers
Customers
Customers Suppliers
Suppliers
Other partners in the value chain
Other partners in the value chain customers
of companies engage with their value chain partners on climate related issues an improvement of 5 from 2019
88
26
Compliance amp onboarding
16
Engagement amp incentivisation
(changing supplier behavior)
9
Information collection
(understanding supplier behavior)
7
Innovation amp collaboration
(changing markets)
No
of C
ompa
nies
18
A N N U A L R E P O R T 2 0 2 0
Organisations are mindful of the fact that climate issues need to be dealt using a participatory approach that encompasses all partners in the value chain as well as engages other external stakeholders Companies are thus getting serious about engaging in a comprehensive dialogue on climate change as this will allow them to have inputs in shaping public policy In their attempt to influence climate policies organisations are establishing communication channels with stakeholders like policymakers trade associations and research funding organisations A positive sign emerging is that majority of the businesses are agreeing to comply with environmental legislations unconditionally Energy efficiency and clean energy generation have garnered the support of 71 and 68 of responding companies respectively Mandatory carbon reporting and increased climate resilience have also found acceptance
With the COVID-19 pandemic wreaking havoc across the world and leading to the first-ever recorded recession in India it is important that companies view this as an opportunity to build a more resilient economy one in harmony with nature and encouraging of a more inclusive environment for supplier engagement that would expedite decarbonising Engaging with the value chain offer a strategic advantage as it allows companies to take a lead on corporate sustainability and puts them in a position to set the blueprint for other businesses to follow
19
A N N U A L R E P O R T 2 0 2 0
Emission reduction targets and initiatives
Targets
In recent years accelerated climate change has forced businesses to set more ambitious climate goals and commit to advocating for a low-carbon economy Today it is considered a standard practice for businesses to report their annual emissions and undertake efforts to reduce their carbon footprint Of the 67 Indian companies responding to investor requests 57 have undertaken a total of 95 emissions reduction targets including absolute targets intensity targets and both absolute and intensity targets 24 of these were approved SBTs
The global pandemic has reinforced the need for business resilience in operations and corporate leaders have started recognising that science-based climate action goes hand-in-hand with building business success49 Companies are looking science-based targets as guiding lights with a defined pathway to future-proof growth and with impending climate change hazards more companies have doubled down on their commitments towards a low-carbon transition50 The momentum for SBTs has reached across a range of industries including cement
49 The new normal 1000 companies are now setting science-based climate targets - Science Based Targets50 httpswwwcdpnetenarticlesclimate2020-lessons-from-an-extraordinary-year
automobiles pharmaceuticals metals amp mining real estate and information technology
As more companies are striving toward commitments this year witnessed an increase in the number of approved SBTs from seven targets last year to 24 targets this year
Leading companies are moving forward by setting long-term emissions reduction targets to mitigate climate-related risks Compared to 2019 this year more targets
were set under a long-term time frame till 2030 and a lesser focus had been given on short-term targets ie till 2020 Most of the companies selected a base year of 2018 and had gone for the intensity targets Hence in upcoming years long-term targets can play a major role for companies to support their sustainability visions and their journey towards low-carbon transition Apart from these companies also reported 83 other targets which included 38 energy consumption targets 13 energy productivity targets and 11 waste management targets amongst others
TARGETS amp PERFORMANCE
More than
three times increase in the number of approved science-based targets
of the responding companies set long-term targets (ie till 2030)
50
15
Absolute target
5Both absolute and intensity
targets
37
Intensity target
10
No target
No of Companies
GHG Emission Reduction Target Types
Absolute emission targets count
Intensity emission targets count
Types of targets based on time-frame of target year
820
Till 2020
1929
Till 2021 - 2030
136
2031 and beyond
20
A N N U A L R E P O R T 2 0 2 0
Emission reduction initiatives
While the number of companies taking up Emission Reduction Initiatives (ERI) has grown from 53 to 58 the number of initiatives has declined from 293 to 287 resulting in a 13 decrease in the estimated annual CO2e savings this year
Energy efficiency in production processes and in buildings continue to account for most ERIs non-energy industrial process emission reductions have been outweighed in their CO2e saving potential
Other emission reduction initiatives such as upgrading equipment with high-efficiency alternatives and digitisation initiatives undertaken by banks accounted for the highest estimated CO2e savings In terms of the highest monetary savings energy efficiency in production processes contributed to 76 of monetary savings followed by energy-efficiency in building services
The steel sector had the highest number of initiatives for energy efficiency in production process and accounted for
of total estimated annual CO2e savings
88Monetary Savings from Emission Reduction Initiatives
Annual monetary savings (Million `) No of Initiatives
20611 1918 576 237 148Energy
efficiency in production processes
Non-energy industrial process
emissions reductions
Other initiative
Waste reduction
and material circularity
Energy efficiency in
buildings
150
63 1210
2
Emission Reduction Initiatives
6340 2772 2574 2016 1278
6310
150
122
Other initiatives
Non-energy industrial process
emissions reductions
Energy efficiency in production processes
Waste reduction
and material circularity
Energy efficiency in
buildings
No of InitiativesEstimated annual CO2e savings (MtCO2e)
21
A N N U A L R E P O R T 2 0 2 0
The rise in climate consciousness among Indian companies is evident from the growing number of those committed to the Science Based Target Initiative (SBTi) By 2020 52 companies have committed to it with a significant growth of more than 37 over last year India is now the leader from emerging economies for having the maximum number of companies committing to SBTi and globally it stands at the sixth position
Of the 52 committed companies 22 have further approved SBTs in 2020 compared to 10 in 2019 The initiative champions SBT setting as a powerful way of future-proofing companiesrsquo growth in the transition towards a low-carbon economy51 The initiativersquos overall aim is for SBT setting to become a standard business practice and for companies to play a major role in driving down global GHG emissions Embedding SBTs as a fundamental component of sustainability management practices is crucial for achieving this
The Sectoral analysis of the Indian SBTi companies highlights the number of companies that are committed to the initiative and the number of those with approved set targets across each sector
51 httpssciencebasedtargetsorgresourcesfilesSBTi-manualpdf52 httpssciencebasedtargetsorgresourceslegacy201805SBT-transport-guidance-Finalpdf
Compared to last year the automobiles and components sector is still leading with the highest commitment and targets set The automobile sector is one of the fastest growing sectors which represents 23 of all energy-related global emissions52 Decarbonisng the automobile sector is possible through disruptive technological innovation land-use planning and transport demand management modal shift and
shifting to electric mobility Companies that set ambitious SBTs can send a strong signal for local regional and national policies to increase the level of ambition and steer the transition
In 2020 28 SBTi committed companies responded to CDPrsquos Investor request to disclose to the Climate Change questionnaire The emissions profile shows that the overall Scope 1+ Scope 2 emissions of SBTi companies responding to CDP represent almost 20 of the total Scope 1+ Scope 2 emissions and 71 of the total Scope 3 emissions in the overall CDP India Investor sample
A greater share of Scope 3 emissions reported by SBTi companies indicate that there is now a greater focus on the Scope 3 GHG Inventory as the companies are planning to set SBTs in coming years As per the SBTi a complete Scope 3 screening or inventory is required for the validation of the SBTs and it is not acceptable to exclude any relevant categories
What is a lsquoScience-Based Targetrsquo
Science Based Targets are the GHG emissions reduction targets consistent with the level of decarbonisation that according to climate science is required to limit global temperature increase to 15- 2ordmC compared to pre-industrial temperature levels
Science Based Target ensures that the company is taking shorter-term action to reduce emissions at a pace that is consistent with keeping warming below 15ordm well-below 2ordm C
SCIENCE-BASED TARGETS AMBITIOUS CORPORATE CLIMATE ACTION
200
128107
74 57 52
United States of America
(USA)
United Kingdom
(UK)
Japan Sweden IndiaFrance
No of Companies
Top 5 countries with SBTi companies
22 28 303
No
of C
ompa
nies 10
22Status of SBTi Companies in India
Committed Target Set
22
A N N U A L R E P O R T 2 0 2 0
CDP India data shows that 33 companies have reported reduction in their gross global emissions (Scope 1 and 2 combined) from the previous reporting year whereas 26 companies have their gross global emissions increased for this reporting year
CDPrsquos data shows that there are 32 companies that are considering setting a SBT in the next two years compared to 29 companies in the previous reporting year There are 11 intensity and eight absolute targets that companies consider to be SBT but this has not been approved by SBTi yet
The increase in these target number highlights that there are more companies which seek to commit to SBTi and get their targets validated in the coming years
Growth in ambition
CDPrsquos five-year data shows a rise in the number of Indian companies committing to the SBTi Their reported emissions increased by 144 due to increased commitment from energy intensive companies this year which includes companies from cement and metal and mining sectors
CDP India investor responding companies
SBTi companies (28 companies respond to CDP)
Emissions Profile (MtCO2e)
6815
134
Scope 1 Scope 2
22282
Scope 3
1259896
NO of Companies
Water Transportation
Professional Services
Textiles Apparel Luxury Goods
Software and Services
Pharmaceuticals and Biotech
Mining - Metals (Iron Aluminium Other Metals)
Food Production - Agricultural Production
Electrical Equipment and Machinery
Electric Utilities and Energy Related
Commercial services and supplies
Air Freight Transportation and Logistics
Food and Beverage Processing
Electric Utilities and IPPs and Energy Traders
Construction Materials
Automobiles and Components
Consumer Products and Durables
Banks Diverse Financials and Insurance
Chemicals
Hospitality
Real Estate
Telecommunications
1
1
3
2
2
2
1
1
1
1
1
1
1
1
2
3
3
2
1
1
6
2
4
1
1
2
3
3
Sectoral Analysis of Indian SBTi companies
Committed Companies Target Set Companies
33
14
Decreased
26
12
Increased
62
Reporting for the first time
1No Change
CDP India investor responding companies
SBTi companies (28 companies respond to CDP)
Comparison of change in gross Scope 1+2 emissions from previous year for SBTi companies vis-agrave-vis CDP reporting
companies
Emission Reduction Targets Reported by Companies in 2020
3
Not SBT not anticipating setting in 2
years
24
8
Not SBT but anticipating setting
in 2 years
4 5
Yes this is SBT approved by SBTi
11 8
Yes this is SBT not approved by
SBTi
Intensity emissions reduction target
Absolute emissions reduction target
No
of c
ompa
nies
23
A N N U A L R E P O R T 2 0 2 0
We witnessed the highest number of SBTi companies responding to CDP India this year which is a 40 growth from last year This further proves that companies are becoming more responsible towards disclosing their GHG Inventory with greater transparency
The graph for the estimated annual carbon savings shows the top three emission reduction initiatives undertaken by SBTi companies reporting to CDP It is evident that over the years low carbon energy purchase and energy efficiency process have gained momentum in reducing GHG emission with an increase in the number of SBTi committed companies implementing these initiatives Maximum carbon savings of 791 MtCO2e have been reported from the cement and concrete sector The metal smelting refining amp forming sector has reported 59237 tons CO2e savings this year with a significant decrease from 70422 tons CO2e savings in the last year There has been a reduction of 443 MtCO2e of estimated annual carbon savings reported by SBTi companies in 2020 as compared to the last year
Data shared by three reporting companies that have also committed to the SBTi (Ambuja Cement Ltd ACC Limited and Ultratech Cement Limited) shows that improving energy efficiency in their production processes has led to cement being the leading sector in reducing GHG emissions
About SBTi
The Science Based Targets initiative champions science-based target setting as a powerful way of boosting companiesrsquo competitive advantage in the transition to the low-carbon economy
It is a collaboration between CDP the United Nations Global Compact (UNGC) World Resources Institute (WRI) and the World-Wide Fund for Nature (WWF) and one of the We Mean Business Coalition commitments
The initiative
bull Showcases companies that set science-based targets through case studies events and media to highlight the increased innovation reduced regulatory uncertainty strengthened investor confidence and improved profitability and competitiveness generated by science-based target setting
bull Defines and promotes best practice in science-based target setting with the support of a Technical Advisory Group
bull Offers resources workshops and guidance to reduce barriers to adoption
bull Independently assesses and approves companiesrsquo targets
Indian SBTi companies responded to CDP Climate Change Investor Program 2020
54
Increase in SBTi companies responding to CDP via 2020 climate Change Investor Disclosure Program compared to previous year
40
Increase in Scope 1+2 Emissions and
Indian SBTi Companies responding to investor request reported reduction in Gross Global emissions compared to previous year
Increase in Scope 3 Emissions covered by SBTi Companies this year as compared to 2019
14450
185
Comparison of Absolute Scope 1+2 emissions (MtCO2e) for SBTi companies reporting to CDP
Emission reported in MtCO2e SBTi companies reporting to CDP
15 16 15 18 20 28
2015 2016 2017 2018 2019 2020
Abso
lute
Sco
pe 1
+2 E
mis
sion
(MtC
O2 e
)
364
8
380
4
479
4
605
5
583
4
142
26
24
A N N U A L R E P O R T 2 0 2 0
Advantages 53
1 Reducing regulatory risks and uncertainties As the government continues to work on implementing the Paris Agreement and meeting the ambition of the country-level pledges Science Based Targets initiative can prove out to be a resilience against the upcoming regulations
2 Strengthening Investor Confidence SBTi can help in strengthening the investor confidence as the investors are highly taking interest in businessesrsquo environmental policies
53 httpssciencebasedtargetsorgblogsix-business-benefits-of-setting-science-based-targets
3 Competitive Edge Companies are getting ahead of their peers by succeeding in the low-carbon transition with increased innovation reduced uncertainty strengthened investor confidence and improved profitability
4 Brand Reputation SBT is a global Initiative which shows robustness confidence and credibility which further helps in building up the brand reputation
Estimated annual CO2e savings of SBTi companies (in lsquo000 tCO2e)
2
Develop Target
3
Submit target for validation
4
Announce Target
1
Commit
Joining Call to Action
We look forward to companies taking action by committing to develop Science-based Targets
68
Energy efficiency Processes
Low carbon energy purchase
Energy efficiency Building services
Estim
ated
ann
ual C
O2e
sav
ings
(in
000
tCO
2e)
60126
2018 2019 2020
124
5184
346
43
7911168
25
A N N U A L R E P O R T 2 0 2 0
Science Based Targets Incubator is a unique project of CDP that was launched in April 2020 with support from MacArthur Foundation amp Shakti Sustainable Energy Foundation in partnership with WWF India to provide technical support with the main objective of handholding and catapulting organisations from commitment stage to target development stage of Science Based Targets Initiative Value Proposition
1 There will be no financial implication on the company
2 Case studies of businesses with validated targets will be shared with the participating companies for peer-to-peer learning
3 Capacity Building workshops and webinars based on recent developments and various other nitty-gritty of SBTi
4 In house trainings and one-on-one meetings with companies where CDP India will explain all stages of the SBTi and provide answers to all the technical queries
26
A N N U A L R E P O R T 2 0 2 0
BUSINESS AMBITION FOR 15degC
lsquoBusiness Ambition for 15degCrsquo is an urgent call to action from a global coalition of UN agencies business and industry leaders Businesses can make a critical contribution to limit the worst impacts of climate change by setting a net-zero target in line with 15degC future57
So far over 300 companies representing more than $36 trillion in market cap have responded to the open letter from global leaders and signed the Business Ambition for 15degC commitment
bull In India 13 companies55 have already aligned and set their target with the most ambitious aim of the Paris Agreement to level global temperature rise to 15degC above preindustrial levels
bull Automobiles and Components and Real Estate are the top sectors that have approved targets aligning with 15degC Ambition
bull In India 13 companies are further committed to Business Ambition for 15degC
bull All the companies in the Real Estate sector from India have approved targets aligning with 15degC Scenario
54 httpssciencebasedtargetsorgbusiness-ambition-for-1-5c55 Mahindra Logistics Ltd Mahindra Heavy Engines Ltd White House Dr Reddys Laboratories Ltd Mahindra EPC Irrigation Limited Swaraj Engines Limited Gromax Agri Equipment
Limited Mahindra Accelo Mahindra Holidays and Resorts India Limited Mahindra Lifespaces Developers Limited Mahindra World City (Jaipur) Ltd Mahindra World City Developers Ltd and Polygenta Technologies Limited
56 httpssciencebasedtargetsorgnet-zero
Net zero a north star for climate action
According to the latest report by the IPCC to limit global warming to 15degC above pre-industrial levels and to avoid the most disastrous impacts of climate change the world must halve CO2 emissions by around 2030 and reach net-zero CO2 emissions by 2050
Companies are increasingly adopting the net-zero climate targets by recognising the importance of keeping global warming to 15degC Between July 2019 and June 2020 over 230 companies committed to reach net-zero emissions as part of the Business Ambition for 15degC campaign an urgent call-to-action for companies to set emissions reduction targets in line with a 15degC future The campaign is led by the SBTi and supported by a global coalition of UN leaders business organisations and NGOs56
27
A N N U A L R E P O R T 2 0 2 0
A carbon price is a cost applied to carbon pollution to discourage polluters Economists agree a carbon price is the single most effective tool for countries to reduce their emissions57 Corporations have been using internal carbon pricing (ICP) as a strategy to manage climate-related business risks and prepare for the transition to a low-carbon economy Carbon pricing policies create strong transparent incentives for firms to internalise the social costs of carbon emissions58 Major investors and financial regulators are calling for businesses to disclose their climate risks and their policies to mitigate emissions59 The most sought-after benefits are that a company can use ICP both as a risk management tool and as a part of its decarbonisation strategy
To see how fast carbon pricing is spreading consider Paragraph 136 of the decision text of the Paris Agreement ldquoproviding incentives for emission reduction activities including tools such as domestic policies and carbon pricingrdquo The final agreement recognised carbon pricingrsquos importance as a powerful incentive to cut emissions by companies and regional state and local governments
The IPCC special report on the impacts of global warming of 15 degC above pre-industrial levels states that an explicit carbon pricing mechanism can theoretically achieve cost-effective emission reductions Along with best practice policies a moderate carbon pricing can help reduce global CO2 emissions significantly60 Parties are encouraged to set prices consistent with Carbon Pricing Leadership Coalitionrsquos
57 What is a carbon price and why do we need one58 Energy the Environment and Technological Change59 Firms ignoring climate crisis will go bankrupt says Mark Carney60 An I P C C Special Report on the impacts of global warming of 15 C above pre-industrial levels and related global
greenhouse gas emission pathways in the context of strengthening the global response to the threat of climate change sustainable development and efforts to eradicate poverty Intergovernmental Panel on Climate Change (2018)
61 Carbon Pricing WBCSD policy paper 2019httpsdocswbcsdorg201909Carbon-Pricing-WBCSD-Policy-Paper-2019pdf WBCSD 2019
62 SHOULD EVERY COUNTRY ON EARTH COPY SWEDENrsquoS CARBON TAX63 httpswwwedienetregistrationregwall
(CPLC) high-level commission on carbon pricing which states that an explicit-price range of US$50ndash100tCO2 by 2030 will be consistent with delivering the Paris Agreement61
Carbon prices have varied widely across existing schemes Success stories such as that of Sweden which currently has the highest carbon price in the world at US$123tCO2 demonstrate that it is indeed possible to make carbon pricing work while the Swedish economy grew by 78 since the introduction of the Swedish carbon tax in 1991 carbon emissions have decreased by 2662 Other countries like The UK
(US$4229) Netherlands (US$3638tCO2) have also committed to increasing their carbon prices in the coming decade63 The worldrsquos top three emitters -- US China and India -- however have put negligible prices on carbon
As part of the lsquoBuild Back Betterrsquo strategy carbon pricing can be a valuable tool
US$123tCO2
Sweden
US$4229tCO2
UK
US$3638tCO2
Netherlands
INTERNAL CARBON PRICEndash ROBUST CLIMATE STRATEGY
28
A N N U A L R E P O R T 2 0 2 0
to guide investment decisions It can help focus on a green stimulus package to recover from the old economy which promotes a carbon-intensive future Different stimulus measures can help clean energy technologies compete with carbon-intensive alternatives and encourage more efficient energy use India is witnessing this momentum ndash a Declaration on Climate Change was signed by 24 key industry captains and Ministry of Environment Forest and Climate Change (MoEFCC) at the virtual India CEO forum on Climate Change on 5th December 2020 Shri Javadekar further said that this declaration by private sector companies voluntarily is a historic step
To guide companies in the implementation of climate-related financial disclosures the TCFD65 developed four recommendations mimicking an organisational structure Governance Strategy Risk Management and Metrics and Targets An ICP is a proposed metric through which entities can safeguard their businesses by internalising market signals The TCFD specifically lists ICP as a key metric to assess climate-related risks and opportunities in line with its strategy and risk management process By attributing a financial cost to risks associated with carbon emissions and translating them into a uniform metric financial decision-makers can integrate transition risks into their business decisions and fill the analysis gap for assets of various time horizons
64 httpnbrienvisnicinViewGeneralLatestNewsaspxId=9829ampYear=202065 httpnbrienvisnicinViewGeneralLatestNewsaspxId=9829ampYear=202066 Implementing the Recommendations of the Task Force on Climate-related Financial Disclosures The Taskforce on Climate-related Financial Disclosures June 2017
Mr Ravi S Prasad Additional Secretary spoke about a coordinating structure for implementation of Paris Agreement which will incorporate internal carbon pricing67
The MoEFCC also constituted a high-level inter-ministerial Apex Committee for Implementation of Paris Agreement (AIPA) in December 2020 under the chairmanship of the Secretary MoEFCCThe purpose of AIPA is to generate a coordinated response on climate change matters that ensures India is on track towards meeting its obligations under the Paris Agreement including its NDC
Senior officials from 14 ministries will serve as Members to AIPA who will oversee the progress in implementation of Indiarsquos NDC and receive periodic information updates to monitor review and revisit climate goals to fulfil the requirements of the Paris Agreement Another key function of AIPA would be to operate as a National Authority to regulate carbon markets in India under Article 6 of the Paris Agreement formulate guidelines for consideration of projects or activities under the article issue guidelines on carbon pricing market mechanism and other similar instruments that have a bearing on climate change and NDCs
It will take note of the contributions of the private sector as well as multi-bi-lateral agencies in the field of climate change and provide guidance for aligning their climate actions with national priorities
ICP will be a useful preparatory tool for future government climate policies
Investors are increasingly demanding comprehensive climate disclosures
It will stay and will be instituted more commonly
A robust carbon pricing system plays an important role in driving
GHG reductions
It complements climate policies for sustained and successful
emissions reductions
It helps make informed decisions and incentivies
low-cost abatement options
Business case for pricing carbon
29
A N N U A L R E P O R T 2 0 2 0
When disclosing on ICP the TCFD recommends that companies should disclose on the followingbull what assumptions are made about how carbon price(s)
would develop over time (within tax andor emissions trading frameworks)
bull geographic scope of implementationbull whether the carbon price would apply only at the mar-
gin or as a base costbull whether the price is applied to specific economic sec-
tors or across the whole economy and in what regionsbull whether a common carbon price is used (at multiple
points in time) or differentiated prices bull assumptions about scope and modality of a CO2 price
via tax or trading scheme
67 httpswwwgreentechmediacomarticlesreadeuropean-oil-majors-ready-to-scale-up-energy-transition-investment68 httpswwwgreenbizcomarticlebp-walks-away-three-us-trade-groups-over-carbon-pricing69 Convention on Biological Diversity ndash Markets for Carbon Offsets Accessible at httpswwwcbdintfinancialoffsetsg-offsetclimatecarbonpdf page 8
Earlier this year BP one of Europersquos oil supermajors announced a carbon price of US$100tonne of CO2 a giant increase from their previous price of US$4067 and walked away from three US-based oil and gas trade organisations - American Fuel and Petrochemical Manufacturers (AFPM) the Western States Petroleum Association (WSPA) and the Western Energy Alliance (WEA) over differences regarding policy positions on carbon pricing68
CDP has been asking companies to disclose their practice of using ICP since 2013 In 2020 23 of the investor responding companies have reported putting a price on carbon as compared to last yearrsquos 19 while the number of companies planning to price in the next two years reduced to 21 from 23 in 2019 After adding Supply Chain responding companies a total of 58 companies are pricing or are planning to price carbon in the next two years in 2020 a 12 increase from 2019 It was further seen that of the 23 companies that are pricing carbon in 2020 52 use a shadow price followed by implicit price
The Task Force defines an internal carbon price as ldquoan internally developed estimated cost of carbon emissionsrdquo which can be used as a planning tool to help identify revenue opportunities and risks as an incentive to drive energy efficiencies to reduce costs and to guide capital investment decisions69
52
26
4
9
44
Shadow price
Implicit price
Implicit price Internal fee
Internal fee
Offsets
Implicit price Shadow price
Types of ICP used by Indian companies
Pricing Planning to price in the next 2 years
2
25
2015
8
36
2016 2017
26
14
2018
14
32
2019
20
31
2020
2533
No
of C
ompa
nies
ICP trend in India
30
A N N U A L R E P O R T 2 0 2 0
Type of ICP Shadow price Carbon fee Implicit price Internal trading
Description Hypothetical cost of carbon emissions
A per-unit fee based on the amount of GHG the company emits (eg `700 per tCO2e)
Helps quantify the capital investments required to meet climate-related targets
Allows business units within a company to trade their allocated carbon credits based on respective emissions
Objectivesusage
The most common form of ICP is a shadow price helps organisations better understand the impacts of climate-related risks such as technological shifts or future regulations It can help a company with both risk management as well as internal strategic planning
It allows companies to model or test how a range of carbon prices affect their divisions capital investments and other planned projects It is similar to forecasting with a range of energy prices
Putting a fee on carbon helps create an actual pool of funds generating a revenue stream to help pave the way for greener projects and further RampD This prepares a company for a carbon-resilient world This tool has the ability to encourage a business to transform into an environmental leader It allows for the creation of internal funds to invest into energy efficiency or renewable energy projects in order to cut energy costs
It also builds awareness of the importance of emission reductions within different business units
An implicit price helps companies understand their initial carbon footprint and is also used as a benchmark to implement a more strategic internal price
Internal trading helps create awareness It allows companies to prepare for stringent forms such as shadow prices or internal fees
Method An additional criterion is introduced in investment analysis during the calculation of the internal rate of return (IRR)
The additional criterion is the carbon value which is incorporated into each investment decision and applied to resulting GHG emissions This carbon price is assumed the same way assumptions are made about exchange rates or commodity prices
It is implemented by voluntarily adding a cost to GHG emissions in relation to operational costs
It increases the operating expenses (OPEX)
There are short-term emissions reductions Transfers of actual funds within the company are done through two mechanisms First by offsetting GHG emissions by purchasing offset credits externally Second by providing internal financing for emission reduction projects low- carbon products amp services and RampD
The carbon fee also provides monetary incentives for pro-environment initiativesactivities
Some companies with emissions reduction or renewable energy targets calculate their lsquoimplicit carbon pricersquo by dividing the cost of abatement procurement by the tonnes of CO2e abated
Trading is driven by the allocation of a fixed number of carbon dioxide emission lsquoallowancesrsquo for individual business units with each allowance equivalent to 1 metric tCO2 If business units exceed their cap they must purchase additional allowances to offset their excess emissions
Where business units under-emit they may sell allowances Business units may also choose to invest in carbon offsets outside their own units in order to sell on the internal trading scheme72
A sectoral analysis of the data finds two high emissions intensive sectors cement and concrete followed by IT and software development An increasing number of companies from cement and IT sectors are now committing to the SBTi and moving towards aligning emissions in line with 15-degree an ICP in such cases can be effectively used as a tool for mitigating climate risks and achieving the greater goal of a SBT or a net-zero target It helps companies build their internal capacity and measure their progress
1313
2626
2222
1313
44 44
1818
Metal smelting refining amp forming
Cement amp concrete
IT amp software development
Biotech amp pharmaFood amp beverage
processing
Chemicals
Transportation equipment
31
A N N U A L R E P O R T 2 0 2 0
Below are the ICP disclosed by Indian companies in 2020
Company Price in INR (`) Price in USD ($) Type of ICP used
ACC 2541 3394 Implicit price Shadow price
Ambuja Cements 21639 3074 Implicit price
Dalmia Bharat Ltd 77334 11 Shadow price
Dr Reddyrsquos Laboratories 937 1332 Implicit price
Godrej Consumer Products Limited 750 10 Shadow price
Godrej Industries 740 10 Shadow price
Hero Motocorp Ltd private private private
Hindustan Zinc 111846 159 Implicit price
Infosys Limited 100182 1425 Implicit price
JSW Cement Limited 1566 21 Shadow price
JSW Steel Ltd 1400 20 Shadow price
Mahindra amp Mahindra 98242 1397 Internal fee
Mindtree Ltd private private private
Shree Cement private private private
Tata Chemicals 140607 20 Shadow price
Tata Consultancy Services 1131 1608 Implicit price Shadow price
Tata Consumer Products Ltd 315 448 Offsets
Tata Motors 980 14 Shadow price
Tata Steel 975 - 2720 15 -3868 Implicit price Shadow Price
Tech Mahindra 70303 10 Implicit price Internal fee
Ultratech Cement 750 1066 Shadow price
Wipro 352291 5011 Shadow price
Since these companies did not provide a conversion rate the average conversion rate for the 2019 calendar year was taken (1` = 0014224USD)
Managing climate risk with Internal Carbon Price and Science Based Targets
By integrating ICP into ambitions targets set by SBT companies can achieve greater emissions reduction SBTs empower companies to engage internal teams with a common data-driven goal and integrate their carbon reduction strategies with other business objectives70 A step that organisations can take to implement TCFD recommendations as well as achieve their SBTs is putting an internal price on carbon It is observed that having an internal carbon price can enhance an organisationrsquos competitiveness71 Several companies are already using ICP to highlight their progress towards targets and inform a business case for low-carbon investments Of the 25 companies that have disclosed to CDP in 2020 13 that committed to SBTi also have an ICP
Setting a carbon price can be a strong commitment towards driving change and action Clear goals for the ICP enable
70 Science-Based Targets How Aligning Carbon Reduction Targets With Climate Science Can Drive Business Growth SampP Dow Jones Indices 201771 httpswwwgreenbizcomarticlemanaging-climate-risk-carbon-pricing-and-science-based-targets72 CDP Handbook on Carbon Pricing73 httpswwwcdpnetenreportsdownloads491874 httpsb8f65cb373b1b7b15feb-c70d8ead6ced550b4d987d7c03fcdd1dsslcf3rackcdncomcmsreportsdocuments000002771originalCDP-Carbon-Pricing-Handbook
pdf1508927220
companies to make better decisions regarding the type and price of carbon72 A high-level commitment can provide a companyrsquos perspective and insight on how other companies have been able to adopt innovative financing practices such as ICP and carbon taxes which are spurred by setting ambitious targets in line with the SBT initiative
In January 2020 in partnership with TERI CDP India released a second handbook in ICP - Putting a Price on Carbon A Handbook for Indian Companies 20 73 a second edition to the handbook released in October 17 74The first handbook was prepared to lay out the landscape of carbon pricing and help companies understand about external and ICP along with guidance on how to approach an internal carbon price The aim of the second handbook was to further mobilise the adoption of internal carbon price by companies The handbook discusses steps to arrive at a price and use it in an organisation including details on indicative pricing levels
32
A N N U A L R E P O R T 2 0 2 0
ACC Ltd are using internal carbon price as a tool to drive and incentivise low-carbon initiatives and emissionenergy reduction projects We have observed that ICP helps ROI to look attractive and helps us make informed decisions
ACC Ltd has already committed and published their 2030 targets for specific CO2 emission reduction and use of waste derived resources (as a part of SD 2030 plan) We have also committed to SBTi and are working on setting stricter targets aligning with below 2 DS To achieve these commitments and relevant targets we believe that ICP may play an important role in prioritising our future actions and investments Going forward we also plan to use the ICP for managing risk and leveraging opportunities
mdash ACC Ltd
Steps to Setting an
internal carbon price
Make a commitment
Communicate your progress
Set the scope of the internal carbon price
Decide price level and variance
Monitoring and reporting
Define the type of ICP
01
02
03
0405
06
07
08
Map your objectives
Establish the degree of influence in business application
33
A N N U A L R E P O R T 2 0 2 0
THE RENEWABLE ENERGY THRUST In 2020 the 67 companies headquartered in India have reported a total of 291 Terra Watt hours (TWh) electricity consumption more than double the previous yearrsquos number Notably the significant increase in total electricity consumption is attributed to just one company ndash Vedanta Limited with 151 TWh of electricity consumption for its global operations
The total electricity consumption excluding Vedanta is 140 TWh 48 higher than the previous year The rise in the total reported electricity consumption is primarily due to an increase in the number of responding companies from the energy intensive sectors These 67 companies have consumed about 16 TWh renewable electricity which is 6 of the total electricity consumption reported in 2020 The share of renewable electricity is 11 without counting Vedanta in the sample This is 6 higher than the previous year
The growth in the share of renewable electricity consumption is due to multiple factors such as the increasing number of voluntary corporate GHG emission reduction targets renewable energy targets and compliance targets such as Renewable Energy Purchase Obligations (RPO) In 2020 18 companies from India have reported various types of renewable energy targets Some of these companies have taken more than one renewable energy target type These 18 companies have reported 98 TWh of electricity consumption of which 13 is from renewable energy sources The level
Type of renewable energy targets
Renewable Energy Targets
17
1 1 2Renewable Electricity
Consumption
Renewable Electricity
Production
Renewable Electricity Capacity
Renewable Energy Financing
Target
No
of C
ompa
nies
RE100 is the global corporate renewable energy initiative bringing together hundreds of large and ambitious businesses committed to 100 renewable electricity Led by the Climate Group and in partnership with CDP RE100rsquos mission is to accelerate change towards zero carbon grids at scale There are 4 companies headquartered in India that have committed to the RE100 initiative - Dalmia Bharat Ltd Infosys Ltd Mahindra Holidays amp Resorts India Ltd and Tata Motors Ltd
The RE100 membership continues to grow and diversify - with 42 of new members coming from the Asia-Pacific region in 2020 With 260+ members and gt278 TWh of electricity consumption aggregated electricity demand of RE100 members is higher than Australiarsquos The share of renewable electricity is 42 of total consumption showing strong progress towards 100 goal
Over 70 global RE100 members have operations in India ndash with gt2 TWh of electricity consumption in the country About 39 of electricity consumed in India came from renewable energy sources largely sourced through unbundled energy attribute certificates and power purchase agreements
Visit RE100org and follow RE100 on Twitter
34
A N N U A L R E P O R T 2 0 2 0
Note Some companies have reported renewable electricity consumption total instead of break-down details as per the sourcing method Data for those companies is not included in the above chart
131
17
03
01
Renewable Electricity Sourcing Methods (TWh)
Self-generation
Unbundled Energy Attribute Certificates (EACs)
Power Purchase Agreement (PPA)
Green Electricity Products
of ambition ie a share of renewable energy in the target year for most of the companies varies between 20-100 Showing the leadership in renewable electricity sourcing 3 companies75 have committed to source 100 renewable electricity across their operations and joined RE100 initiative
GHG emission reduction targets are popular among companies in India and 57 companies have reported absolute intensity or both absolute and intensity targets Among these 30 companies have committed to science-based targets Initiative and their targets are in line with climate science Six companies have dedicated scope 2 emission reduction targets Scope 2 emissions are indirect emissions from the generation of purchased energy consumed by the reporting company Companies with GHG emission reduction targets tend to source renewable energy to reduce their emissions primarily scope 2 emissions The Majority of these companies have taken exclusive renewable energy targets to support meeting their GHG emission reduction targets
Renewable energy plays an important role in the corporate value chain due to its zero-carbon intensity and ability to provide long-term energy security About 34 companies have identified opportunities related to shifting energy usage towards low-carbon energy sources across the value chain Of these 32 have identified opportunities in the direct operations followed by 6 companies in the upstream and 2 in the downstream of the value chain These companies have estimated energy related opportunities worth `317 billion mainly in the direct operations Half of these companies anticipate short time frame (1-5 years) to tap these
75 4 India headquartered companies are committed to the RE100 initiative 3 of them report to CDPrsquos climate questionnaire
opportunities Companies have not just identified energy related opportunities but implemented energy related initiatives in the reporting year across their operations About 31 companies have implemented low-carbon energy consumption or production related initiatives in the reporting year that resulted in an estimated annual carbon savings of 18 million tCO2 and `27 billion of annual monetary savings
Companies from the manufacturing and materials sectors have reported the highest volume -14 TWh of renewable electricity consumption Manufacturing sector companies are relatively performing better than companies from the materials sector in terms of the share of renewable energy in total electricity consumption There are 25 companies from these two sectors mainly energy intensive business such as cement metals and mining steel and transport original equipment manufacturers (OEMs) The aggregate electricity consumption of these companies is over 100 TWh The companies from the fossil fuel-based energy generation are not included in the following charts
A detailed breakdown shows that self-generation of renewable electricity is the most preferred sourcing option among companies followed by purchase of renewable electricity through unbundled Energy Attribute Certificates (EACs) and Power Purchase Agreement (PPA) with an onsiteoffsite generator Up to 10 companies have reported 03 TWh of total renewable electricity consumption via PPA (on-grid and off-grid) which has declined from 11 TWh of consumption reported in the previous year
35
A N N U A L R E P O R T 2 0 2 0
Materials Manufacturing Food beverage amp agriculture
Biotech health care amp pharma
OtherInfrastructureServices
3
17
6
35
3
20
12
Total Electricity Consumption (TWh) Total RE Consumption (TWh) RE
Electricity consumption by sector with Vedanta Limited included in the analysis
Electricity consumption by sector excluding Vedanta Limited
Materials Manufacturing Food beverage amp agriculture
Biotech health care amp pharma
OtherInfrastructureServices
7
17
35
20
1236
Total Electricity Consumption (TWh) Total RE Consumption (TWh) RE
TWh
TWh
36
A N N U A L R E P O R T 2 0 2 0
2737worth opportunities
identified
Billion
`
16of Renewable Electricity Consumption Reported
TWh
704of total [ Scope
1+2location-based] emissions reported
MtCO2e
7138Inherent financial
risk identified
Billion
`
25have Internal Carbon
Pricing
Companies 52Companies in India
SBTi
37
A N N U A L R E P O R T 2 0 2 0
WATER SECURITY The way out of water crisis
Five of the worldrsquos largest cities under water stress are in India with Delhi ranked second on the list76 The water crisis is more alarming than imagined ndash 600 million people in India face high-to-extreme water stress77 Indiarsquos water demand is projected to increase by two times the available supply by 2030 putting hundreds of million people at the risk of water scarcity and ultimately losing the country 6 of its GDP78 In 2019 the country witnessed the worst droughts in recorded history Over 500 million people were affected across the country and major cities such as Chennai experienced lsquozero dayrsquo scenarios wherein water literally ran out Since improvements in water security are essential for Indiarsquos development investing in water merits a sound business case
Though 80 of Indian states have legislations on water conservation and prevention of encroachment of water bodies79 poor data management absence of water pricing inefficient irrigation techniques and the lack of adequate sewage treatment curb the countryrsquos ability to manage water sustainably80 In recent times companies have become more aware of the risks of increased water consumption pollution and unstable precipitation aggravated by climate change81 A 2019 World Bank Report (Quality Unknown)82 warned of the economic health and environmental damage caused by contaminated water highlighting water quality as an ldquoinvisible crisisrdquo that is under-appreciated and underestimated It warned that poor water quality driven by industrial agricultural and urban pollution could lead to a reduction by 13rd of economic growth in some places
76 httpsocialnitigovinuploadssamplewater_index_report2pdf77 httpsnitigovinsitesdefaultfiles2019-06Final20Report20of20the20Research20Study20on2020
Composite20Water20Resources20Management20Index20for20Indian20States20conducted20by20Dalberg20Global20Development20Advisors20Pvt20Ltd_New20Delhipdf
78 httpsnitigovinsitesdefaultfiles2019-06Final20Report20of20the20Research20Study20on2020Composite20Water20Resources20Management20Index20for20Indian20States20conducted20by20Dalberg20Global20Development20Advisors20Pvt20Ltd_New20Delhipdf
79 httpsocialnitigovinuploadssamplewater_index_report2pdf80 httpswwwcdpnetenarticlescompaniesindias-looming-water-crisis-a-call-to-action-for-companies81 Think globally act locally new guidance for companies on sustainable water use - CDP82 httpsopenknowledgeworldbankorghandle109863224583 httpswwwwriorgaqueduct84 Aqueduct Country Ranking (wriorg)85 The objective of the campaign is to drive further corporate transparency around climate change deforestation and water
security by encouraging companies to respond to CDPrsquos disclosure request
Water stress in India remains a key challenge Aqueduct83 ranked India 13th in the world on high water stress score -- 412 out of 584 The private sector is vital to delivering a water secure future Companies in the food textile retail energy industrial chemicals pharmaceuticals and mining sectors account for and wield influence over 70 of the worldrsquos water use and pollution The decisions one takes about how to grow and expand can make or break onersquos ability to tackle the global water crisis
CDPs Water Security program requests companies to disclose critical information on water parameters which are crucial to the business It helps companies monitor and benchmark their performance on these critical parameters to ensure adequate water availability for their businesses Investors and customers are increasingly keen to know how companies respond and adapt to water-related risks The Non-Disclosure Campaign (NDC) is an annual CDP initiative where investors can target companies that have been requested to respond but failed to do so85 Globally for water security Indian companies achieved the highest response rate to the NDC campaign with 50 of engaged companies submitting a response on this critical issue ndash 28 times higher than their control group Responding through CDPrsquos Water Security questionnaire will help businesses understand the risks and opportunities associated with water-related issues
Reduction in Economic Growth caused by power water in some countries
13rd
Water stress by 2030-ratio of withdrawals to renewable supply
People will live in water stress area by 2030
Increase in water demand in last 100 years
WRI 2020
UNEP
UN World Waterdevelopment Report 2020
increase in Water Security investor responding companies in India
8756
1in 2
x6
38
A N N U A L R E P O R T 2 0 2 0
helping them capitalise on actions to safeguard water resources86 The number of disclosing companies increased from 15 last year to 28 companies this year an increase of approximately 87
Measuring Monitoring and Verification
Regular measuring and monitoring of water-related parameters across all operations and the entire value-chain is the first step in laying the path for efficient water management In 2020 28 companies measured a total of 268 water related parameters It was found that amongst volumetric water metrics water discharge was the most monitored accounting for 41 of all measurements Water withdrawals accounted for 29 of all measurements water consumption for 10 and water recycling and reuse accounted for 10 each Although these metrics were being continuously monitored and measured by companies a sector-wide analysis shows that significant growth in some water-intensive sectors has put pressure on the demand for industrial water The electric utilities sector for example reported an increased water demand of 771174 megalitres in 2020 which was the highest amongst all sectors Adani Power Ltd highlighted new aqusitions and increased power generation as major reasons for rise in water demand this year The chemicals sector showed the second highest rise in water demand this year -- 195832 megalitres this year
Some companies have shouldered the responsibility of having audits conducted on their reported water metrics for greater
86 httpsb8f65cb373b1b7b15feb-c70d8ead6ced550b4d987d7c03fcdd1dsslcf3rackcdncomcmsreportsdocuments000000893originalCDP-india-business-case-for-water-disclosurepdf1472051621
87 https6fefcbb86e61af1b2fc4-c70d8ead6ced550b4d987d7c03fcdd1dsslcf3rackcdncomcmsreportsdocuments000005312originalAnalysis_of_CA100__Data_for_CDP_Investor_Signatories_v5pdf1596046258
88 https6fefcbb86e61af1b2fc4-c70d8ead6ced550b4d987d7c03fcdd1dsslcf3rackcdncomcmsreportsdocuments000005312originalAnalysis_of_CA100__Data_for_CDP_Investor_Signatories_v5pdf1596046258
89 https6fefcbb86e61af1b2fc4-c70d8ead6ced550b4d987d7c03fcdd1dsslcf3rackcdncomcmsreportsdocuments000005312originalAnalysis_of_CA100__Data_for_CDP_
transparency and credibility Amongst the verification standards that were employed 26 of the responding organisations used ISAE 3000 with Tata Chemicals being the sole company to apply both ISAE 3000 and AA1000AS to meet assurance standards
In 2020 25 responding companies withdrew consumed and discharged 7933064 megalitres 1403171 megalitres and 6625032 megalitres of water respectively However in 2019 these figures stood at 217736 megalitres 860517 megalitres and 67686 megalitres respectively for 15 responding companies
WATER ASPECTSWater Consumptionndash the amount of water a company has drawn into its boundaries and has permanently removed from the local water cycle90
Of the 28 respondents three did not disclose water consumption data or were in their first year of measurement 9 increased their water consumption over the previous reporting year 12 decreased it and 4 reported no change
Water Withdrawalsndash the amount of water the company has temporarily removed from the local water cycle and returned as discharge water91
Of the 28 respondents three did not disclose water withdrawal data or were in their first year of measurement 7 reported an increase over the previous year 14 had lowered their withdrawal and 4 reported no change
Water Discharges ndash the amount of water that leaves a companys facility and if left untreated could be a source of pollution92
Of the 28 respondents three did not disclose water discharge data or were in their first year of measurement 9 reported an increase in water discharge over the previous year 6 lowered it and 10 reported no change CDPrsquos data highlights new acquisitions increased production activities and project expansions as the primary reasons for increased water demand amongst the companies
of companies measured all water aspects (withdrawals discharge and consumption) across 100 of facilities
64
of companies believe that availbility of good quality freshwater is vital for the success of their business39
2910
4110
10
Water withdrawalsWater recycledreused
Water discharge
Water consumption
Others
Measured and monitored water aspects
39
A N N U A L R E P O R T 2 0 2 0
Data further shows that brackish surface water and seawater were the primary water sources for industries followed by fresh surface water source The electric utilities sector was the most reliant on brackish surface water and seawater accounting for 72 of the sectorrsquos total water withdrawals At 59 fresh surface water was the primary source of withdrawal for the chemicals sector Of the 28 companies 13 had implemented water conservation measures to reduce water withdrawals from groundwater sources this year Water withdrawals from groundwater - renewable accounted for less than 05 of total withdrawals
In terms of water discharge most (81) was released into brackish surface water and seawater environments Discharges into fresh surface water accounted for the remaining 19 of the total discharges Our data suggests more companies are installing zero liquid discharge units and water harvesting techniques across their facilities leading to less groundwater discharge
Fresh surface water accounted for 29 of total water withdrawals by source in 2020 Indiarsquos major river basins - Ganges Brahmaputra Godavari Indus and Cauvery are the primary source of freshwater for the industries Around 15 of total freshwater demand from CDP responding companies was supplied by the
Investor_Signatories_v5pdf159604625890 Worldrsquos 18 Most Water-Stressed Rivers | World Resources Institute (wriorg)
Ganges and Brahmaputra river basins another 15 came from the Godavari basin followed by Cauvery Indus Banas and Sabarmati river basins The demand for water has increased over the years causing these basins to rank among the most water-stressed catchments in the world90 Of the 83 facilities in India 53 were in water-stressed regions Our data shows that around 60 of total responding companies withdrew water from water-stressed regions Of these nine were from the materials industry and two were from the food beverage amp agriculture industry
Governance and Business Strategy
For a long time corporate sustainability strategies have focused on measurable and manageable challenges such as product footprint efficiency in supply chain water conservation and others Businesses have begun to take stock of water security by innovating for improved efficiency measuring direct withdrawals assessing risk to neighbours and considering leakages
CDPrsquos data shows that corporate leaders across India are responding to this crisis by focusing on their water policy to monitor risks and opportunities and integrate it in their strategies Around 71 companies report having a documented water policy that is accessible to the public Up to 93 companies indicated that they have a board-level oversight of water related issues within the organisation observed either by the Chief Executive Officer (CEO) or the director on board followed by the board-level committee
Around 43 of the responding companies report on water-related issues quarterly and 33 more frequently This shows the increasing self-awareness among companies on water-related issues Further 63 of these companies offer some form of
facilities out of a total of 83 from the responding companies were in areas with water-stress53
Water discharge by destination
Brackish surface
water and Seawater
Fresh surface water
Groundwater
Third party
532
225
2
975
156
93
Water discharge (megalitersyear)
125
013
1
Brackish surface
water and Seawater
Groundwater ndash non
renewable
Groundwater ndash renewable
ProducedEntrained
water
Third party
Fresh surface water
231
800
261
04
405
21
489
Water withdrawals (megalitersyear)
Water withdrawals by destination
7564
662
6
No
of c
ampa
nies
Industry
1
Appa
rel
1
Biot
ech
hea
lth
care
amp p
harm
a
1
Man
ufac
turin
g
2Fo
od b
ever
age
amp ag
ricul
ture
1
Pow
er
gene
ratio
n
1
Tran
spor
tatio
n se
rvic
es
1
Serv
ices
9
Mat
eria
ls
Industry-wise water withdrawals from water-stressed areas
40
A N N U A L R E P O R T 2 0 2 0
incentive to their employees ndash monetary or otherwise -- for the management of water related issues
Businesses are stepping up and playing a vital role in developing water initiatives that can ease the stress on crucial watersheds Companies are also looking into water security related long-term business objectives and financial planning as a part of their overall business plans Almost 70 companies prefer short to mid-term (5-10 years) over long-term (11-30 years) planning This does not come as a surprise as water effects are felt locally and require more immediate strategic planning Of the 28 reporting companies 12 use climate-related scenario analysis to inform its water-related business strategy and eight anticipate doing so in the next two years A majority of these companies belong to the chemicals and the electric utilities sector
In 2019 about 13 companies were pricing their water this increased in 2020 to 18 and 50 are now exploring the its possibilities Companies such as Ambuja Cement (US$110 `7800
91 marico-sustainability-report-18pdf
Marico Ltd Establishing a strategy to improve water-security across operations and value chain
With a host of agro-based products water availability is a crucial parameter for Marico Ltd92 Under the risk management framework it has identified adverse impact of water scarcity as an environmental risk to the company To mitigate this environmental risk the company has initiated watershed management programs and a reduced-reuse-recycle model of water management across its operations Through a water stewardship program the company aims to address water security challenges in low rain-fed areas around its workplace and factories
In the reporting period FY 19-20 the company withdrew 202886 cubic meters of water and reported a reduction of 9 from previous year The company had reported a reduction of 31 in water intensity from the 2014 level through the company-wide introduction of water efficiency measures improvements in water recycling water-efficient taps and rainwater harvesting systems For improving water management practices across water stress areas Marico utilised the WRI aqueduct tool to evaluate water risk across all manufacturing facilities in India This tool helped the company identify the number of facilities that fall under the water stress area -- according to it five out of eight plants are in such zones The implementation of water conservation initiatives had helped three water-stressed sites reduce water consumption over the previous year Among three water-stressed sites Jalgaon reported 15 reduction in water consumption Baddi reported 16 and Paonta 28
Establishing a strategy to reduce and minimise water use was one of the companys key commitments Marico foresees its future water withdrawal levels reducing given its move towards improving water efficiency and incorporating recycling throughout the production cycle
Frequency of reporting on water-related issues
633
43
Annually
More frequently than quarterly
Quarterly
6
10 2Half-yearly
As important matters arise
Less frequently than annually
41
A N N U A L R E P O R T 2 0 2 0
to US$8240 `579800 per megalitre) Dr Reddyrsquos Laboratories (US$088`67 to US$591`449 per KL) Piramal Glass and Tata Steel use an internal price on water
Risks amp opportunities
Dwindling water supply is a major cause of concern for businesses since it poses significant direct and indirect impacts Visible risks such as droughts have a more explicit impact as they ruin vegetation and severely undermine the agriculture sector But subtle impacts present challenges to other sectors Water shortages also threaten the long-term viability of businesses by leading to higher costs eventually borne by the consumers Without proper management the economic repercussions of water scarcity will be felt in myriad ways92
In 2020 companies that experienced detrimental water-related impacts have incurred financial losses worth `1580 million Physical risks such as inadequate infrastructure and increased water stress account for more than half of these commercial losses followed by reputational-cum-market like subpar access to water sanitation and hygiene services and regulatory risks eg- failure to set mandatory water efficiency conservation and recycling standards Corporations should thus strategically prioritise dealing with these risks to safeguard their financial bottom lines For this organisations have looked to secure alternate sources of water supply adopt water efficiency and conservation practices as well as reuse and recycling of water
A 2018 report from NITI Aayog93 highlighted the fact that the country faced its worst water crisis that year Rising water challenges have put strong regulatory pressure on businesses in India with significant operational risks The private sector is a big contributor towards deepening water security issues but is also crucial in addressing it
Given the current situation with water resources it is perhaps unsurprising that many of the companies responding to CDP find themselves exposed to a plethora of physical and transition risks ndash that is risks from regulatory or consumer reforms aimed at addressing the water crisis These risks threaten their reputation and license to operate their supply chains security financial stability and their ability to grow As per CDPrsquos Global Water
92 httpsglobalriskinsightscom201612economic-cost-global-water-scarcity93 httpsnitigovinsitesdefaultfiles2019-06Final20Report20of20the20Research20Study20on2020Composite20Water20Resources20Management20Index20
for20Indian20States20conducted20by20Dalberg20Global20Development20Advisors20Pvt20Ltd_New20Delhipdf94 https6fefcbb86e61af1b2fc4-c70d8ead6ced550b4d987d7c03fcdd1dsslcf3rackcdncomcmsreportsdocuments000005165originalCDP_Global_Water_Report_2019
pdf159110644595 The term WASH refers to the provision of water sanitation and hygiene Universal affordable and sustainable access to WASH is a key public health issue within international
development and is the focus of the first two targets of Sustainable Development Goal 6 (SDG 6)96 httpswwwworldbankorgentopicwaterbriefwash-water-sanitation-hygiene-and-covid-19
Report 201994 the combined business value at risk reported in 2019 topped out at US$425 billion with about 40 of the risks anticipated to hit within the next 1-3 years Whether it was the blockading of a Newmont Goldcorp mine in Mexico or poor water quality threatening the production of Unileverrsquos Hellmannrsquos mayonnaise in the Mississippi River Basin the impacts of the global water crisis are already being felt
Water risks and risk assessment
As per the 2020 data 71 of the responding companies consider current or future water-related regulations as a risk to business followed by 57 companies that consider access to WASH95 services for employees as very relevant and always included in their water-risk assessments This shows that companies are vigilant about providing safe access to drinking water sanitation arrangements and proper hygiene at workplace The COVID-19 pandemic has highlighted the importance of WASH to human health and well-being Safely managed WASH services along with good hygiene practices can help prevent infectious diseases that kill millions each year96 In addition 50 companies reported that water used for their key commoditiesraw materials is relevant enough to be considered for their risk-assessment This was the most pertinent for chemical sector companies
of the 28 Indian responding companies undertake water-related risk assessment25
Total financial loss by reporting companies as per risk type
38
53
9
Reputation and Market Risk
Physical Risk
Regulatory Risk
1580 MILLION
In 2020 companies that experienced detrimental water-related impacts have incurred financial losses worth
1580 million
42
A N N U A L R E P O R T 2 0 2 0
It is crucial to consider stakeholders in risk assessment procedures for a comprehensive understanding of water-related risks Of the 25 companies that undertake water-related risk
97 httpswwwweforumorgreportsthe-global-risks-report-2020
assessments 68 always include employees in their internal assessment procedures by conducting training and awareness programs on water conversation initiatives communicating water-related policies etc This is followed by regulators and local communities who are relevant in water-risk assessment procedures at 61 and 54 respectively for the responding companies It is a positive sign that Indian companies are engaging with their employees and local communities and ensuring that the latter are not negatively impacted in terms of habitation health and water availability
According to The World Economic Forumrsquos Global Risk Report 202097 water crises are among the top five risks in terms of impact for the past ten consecutive years Water-related risks are substantive in the risk assessment processes and identified as a threat to companiesrsquo bottom line putting at risk a combined business value of US$425 billion according to CDP 2019 data
RegulatoryPhysical
Reputational
Risk due to company
Risk due to context
Expectedunexpected change or uncertainty in law or regulation
Water scarcity too much water water
unfit for use
Litigation product risks due to changes in
consumer behavior
Caused by inefficient operations produces and services resulting in water pollution over exploitation etc
Caused by changing environmental and social conditions like droughts
flooding etc
Relevancy of water-related risks
7157 57 50 46 46 43
11
Water-related
regulatory frameworks
Access to fully-
functioning safely
managed WASH
services for all employees
Water availability at a basincatchment
level
Implications of water on
your key commoditiesraw materials
Stakeholder conflicts
concerning water
resources at a basincatchment
level
Water quality at a basin
catchment level
Status of ecosystems and habitats
Other contextual
issues please specify
Empl
oyee
s
Regu
lato
rs
Loca
l com
mun
ities
Rive
r bas
in m
anag
emen
t au
thor
ities
Wat
er u
tiliti
es a
t a lo
cal l
evel
Stat
utor
y sp
ecia
l int
eres
t gr
oups
at a
loca
l lev
el
Inve
stor
s
Supp
liers
Oth
er w
ater
use
rs a
t a
basi
nca
tchm
ent l
evel
Oth
er
NG
Os
Cust
omer
s
No of Companies age of Companies
Relevancy of stakeholders in water-risk assessment
6861 54 50 50 46 46 39 36 32 2918
43
A N N U A L R E P O R T 2 0 2 0
Water risk event
Impacting business
Increased Operational amp maintenance Costs Increased Compliance amp
Administration Costs
Closure of Operations
Supply chain distributions
Brand Damage and LitigationsShareholder
Distributions
Risk transferRisk avoidance and mitigation
Technological Risks
Repurational amp Market Risks
Regulatory Risks
Physical Risks
Financial ImpactsResidual Water RiskInherent Water Risks
Increased water stress
143721Increased water scarcity
41105Drought
17604Inadequate infrastructure
820
Physical Risks
Ecosystem vulnerability
300Severe weather events
69Declining water quality
63Flooding
13
Regulatory Risks
Technology Risks
Higher water prices Transition to
water intensive low carbon energy sources
Tighter regulatory standards
2333
120
All the figures reported are in million rupees
44
A N N U A L R E P O R T 2 0 2 0
CDPrsquos data shows that physical risks seem to have the highest magnitude of impact on the Indian responding companies Drought is seen to be the primary driver of potential substantive impact
Where there is risk there is opportunity
Where therersquos risk therersquos reward Industrial wastewater for example is a vast untapped resource It is a potential source of heat power process water and high-value materials And there has never been a better time for this transformation to take place -- technologies are better the regulatory climate is favourable and the business case is clear Meanwhile the market demand for pollution-free products is growing For companies to thrive they will need to be aligned to changing consumer demands If
98 httpswwwmarketsandmarketscomMarket-Reportssmart-water-management-market-1265html
they respond to these opportunities then market differentiation resilience and profitability are on the table
Globally corporate leaders have started realising the untapped potential of smart water technology and the market for smart water management is anticipated to grow from US$846 billion in 2016 to US$2010 billion in 202198 Industrial wastewater has for a long time been reused for cooling towers steel works oil refineries textile manufacturing and paper production It was found that 15 of the 23 companies valued improved water efficiency in operations as their primary opportunity having a substantive financial or strategic impact on business
of the 28 responding companies (approx 93) identified water-related opportunities in their business26
Improved water efficiency in operations
Increased resilience to impacts of climate change
Reduced impact of product use on water resources
Improved community relations
Water recovery from sewage management
Resilience to future regulatory changes
Sales of new productsservices Increased brand value
3000million
`4000
million18752
million
opportunities were identified by 21 respondents
opportunities were identified by 11 respondents
opportunities were identified
by 9 respondents
opportunities were identified
by 4 respondents
Efficiency Resilience Products and services
Markets
22
14
10
4
`329
million
`
`
45
A N N U A L R E P O R T 2 0 2 0
26
17
14
17
2
Others
Recyclingreuse
Consumption
Product water intensity
Discharge
14
10Withdrawals
Water use efficiency
Categories of water targets monitored at the corporate level
of companies set company-wide water targets
of companies set company-wide water goals
5556
Businesses have identified transparency in water management issues as a fundamental activity and disclosure through CDPrsquos annual water questionnaire produces a standard comparable dataset McGill University and Millani found that companies disclosed through CDP ranked 19 percentiles better than the average business in their ability to access capital99 The research showed that a comprehensive voluntary disclosure produces a quality management team with enhanced awareness of threats and opportunities linked to climate and environmental change
Targets and Goals100
In response to declining water resources many companies have started engaging in water stewardship and setting water targets aligned with SDG Goal 6 to ensure availability and sustainable management of water sanitation and hygiene facilities for all101 Developing water-related targets helps companies make meaningful change from informed actions at the local level102 In 2020 four companies did not set water-related targets within their operations Whereas 24 companies had water-related targets 26 of them had set targets for product water intensity 17 set recyclingreuse targets and 14 focused on water use efficiency
Companies can set goals and targets on a range of operational issues to drive performance andor manage risks and opportunities CDPrsquos data shows that a majority had set targets at the company-wide level -- 55 of responding companies reported setting water targets across the company This was followed by 26 who set water targets at the business level and 19 at the site or facility level While setting water goals around 56 of companies monitored their goals at the company level 24 at the sitefacility level and the remaining at the basin business or country-level
99 Craig M Coulombe E Nostrat A 2019 The Role of CDP Disclosure to Improve Access to Capital Research Note httpsf01c8ee6-cac3-40ff-a0e4-8bfb54f2b88bfilesusrcomugd66e92b_30b06fd11b9c43d88428f768676e9a8bpdf
100 Targets ndash quantitative Goals - qualitative101 httpsunstatsunorgsdgsreport2020goal-06102 httpsceowatermandateorgsite-targets-guide
A company has various drivers for setting goals and targets and it tries to align these with increased stakeholder concerns and environmental legislation Data shows that most organisations considered reducing environmental impact and risk mitigation as the primary motivation for monitoring water goals and targets Organisations also considered brand value protection as one of the important factor while setting goals
24
4
Target Set No Target
No
of C
ompa
nies
Water targets monitored at the corporate level
46
A N N U A L R E P O R T 2 0 2 0
Drivers behind setting water targets and goals at the corporate level
Reduced environmental impact
Water stewardship
Risk mitigation
Recommended sector best practice
Corporate social responsibility
Brand value protection
Cost savings
Shared value
Climate change adaptation amp mitigation strategiess
Commitment to the UN SDG
Increase freshwater availability for users
Other drivers
45
14
14
2
2
2
5
14
16
12
161212
12
4
4
4
44
GoalsTargets
age of Companies
47
A N N U A L R E P O R T 2 0 2 0
PROTECTING OUR FOREST WEALTH
The world lost an estimated 10 million hectares of forest annually between 2015 and 2020104 Protecting and restoring forests and other natural ecosystems could provide up to 30 of climate change mitigation action needed to limit global warming to below 20C by 2030105
Global demand for agricultural commodities is the primary driver of deforestation and ecosystem conversion -- timber is extracted unsustainably and land is cleared for agricultural production This represents major risks to businesses as commodities associated with deforestation such as palm oil soy cattle and timber products are the building blocks of millions of products traded globally and therefore feature in the supply chains of numerous organisations
103 httpswwwipccchsrccl104 The State of the Worldrsquos Forests 2020 Forests biodiversity and people105 httpswwwpnasorgcontent1144411645106 httpsappsfasusdagovnewgainapiapiReportDownloadReportByFileNamefileName=Oilseeds20and20
Products20Annual_New20Delhi_India_04-01-2020
The unsustainable production and supply of these commodities and activities not only poses a significant business risk but also has a severe negative impact on the environment especially the climate crisis
Deforestation is fundamentally linked to climate change According to the IPCC Special Report on Climate Change and Land (2019)103 11 of global GHG emissions are from deforestation and from the conversion of natural ecosystems for human use
At an 8 annual growth rate edible oil consumption in India is growing faster than the 3 growth rate in production Imports and imports are rising to fill the gap As a result India still is the largest importer of edible oils followed by China European Union and the United States Indiarsquos edible oil imports in MY 202021 are predicted to rise 6 to 15 MMT of this 85 MMT will be palm oil 35 MMT soybean 28 MMT sunflower seed oil and 02 MMT rapeseed (canola) oil
-United States Department of Agriculture106
In 2020 three Indian companies responded to CDPrsquos forests questionnaire -- one responded to the request for disclosure from investors while two responded to their customers Globally 687 companies responded to CDPrsquos forests questionnaire and 57 of them evaluated deforestation-related risks at US$5312 billion
13The mitigation potential of reduced deforestation is
13 of the global emissions
We cant address climate change without protecting our forests
They are vital carbon stores that help reduce global warming
48
A N N U A L R E P O R T 2 0 2 0
Disclosure on deforestation management through CDP could be a significant opportunity for companies operating in India one of the largest importers of palm oil in the world This can help Indian companies tap into lucrative opportunities by scaling sustainable trends CDPrsquos forests questionnaire allows companies that produce source or use palm oil soy timber cattle cocoa coffee and rubber to disclose Moreover new biodiversity-focused metals amp mining and coal sector questionnaires were introduced in 2019
Palm oil is the most commonly used processed oil in industrial food production with its production being responsible for 5 of global tropical deforestation107 Indiarsquos palm oil imports account for nearly 23rd of its total imports of edible oil This demand was shaken in 2020 when the pandemic hit with a 40 fall in the consumption of palm oil during the lockdown108 Indiarsquos imports which account for nearly 20 of the global trade in palm oil will have a major effect on efforts to make its production and processing sustainable The primary barrier for sustainable palm oil consumption in
India stems from it belonging to a more price-sensitive and volume driven market making environmental impacts a low or non- existent priority in the minds of consumers
Climate change can reduce palm oil production and with demand outstripping supply prices could rise The Roundtable on Sustainable Palm Oil (RSPO) has developed a set of environmental and social criteria which companies must comply with in order to produce Certified Sustainable Palm Oil (CSPO) When properly applied these criteria can help in minimising the negative impacts of palm oil cultivation
107 Deforestation amp Palm Oil 108 As worldrsquos largest importer of palm oil India has a duty to push for ethical production practices109 httpsseaofindiacominterim-data-on-import-of-edible-oils-march-2020-down-by-32-percent-nov19-to-mar20-down-by-10-percent110 httpsappsfasusdagovnewgainapiapiReportDownloadReportByFileNamefileName=Oilseeds20and20Products20Annual_New20Delhi_India_04-01-2020111 httpsresourcetradeearthyear=2018ampexporter=76ampimporter=699ampcategory=87ampunits=value112 httpswwwrvonlsitesdefaultfiles201705poultry-sector-in-india-2017pdf113 httpsresourcetradeearthpublicationscocoa-trade-climate-change-and-deforestation
The Sustainable Palm Oil Coalition for India (I-SPOC) was formed to promote the uptake of sustainable palm oil and its derivatives in India CDP amongst others has joined it as a member
Soy cultivation is the second largest soft commodity driver of tropical deforestation after cattle products Various aspects of soy production generate GHGs that contribute to climate change India imports around 33 lakh tons of soybean oil109 According to data from the US Department of Agriculture India
is set to import 35 lakh metric ton of soybean oil in 20202021110 In addition India is also responsible for clearing huge spaces of forest land in Brazil that contributed to 23 of soybean imports to India in 2018111 Soy is also used as fodder for livestock and a growing local demand for poultry products will further affect Indiarsquos position on deforestation The country ranks amongst the top four producers of egg and chicken in the world and it is increasingly exporting to the Middle East and Europe112
Cocoa has been a notable agent of deforestation since the last century The global production of cocoa has increased from 34 million to 45 million tonnes between 2000 and 2014 while the land use footprint of its plantations rose by 37 to 257 million acres113 About 90 of
cocoa is produced by 7 countries -- Ivory Coast Ghana Indonesia Ecuador Cameroon Brazil and Nigeria The dearth of incentives for improving the plantations combine with high investment costs to make cocoa a low yield crop forcing farmers to resort to clearing untouched forest lands in order to meet the growing demand and
lsquoPalm oil consumption dropped by
in 2020 in India due to COVID-19rsquo
40
Climate-Water-Forest nexus
Water is an essential component of mitigation and adaptation strategies
Rising temperatures and changing weather patterns increase stress on water availability
Tropical forests provide substantial emission reductions by acting as carbon sinks
Droughts resulting from rising temperatures and changes in weather patterns increase the risk of forests fires
A major portion of gobal freshwater depends on forests
49
A N N U A L R E P O R T 2 0 2 0
for cutting down production costs114 In Southern India Cocoa is mainly grown as an intercrop in conjunction with coconut areca nut oil and rubber plantations Indiarsquos consumption in 2015-16 was 30000 tonnes of which 57 was imported while the domestic production rose at an annual rate of 37 in the same period115 Failure to protect forests in the event of a sharp cocoa price increase will lead to unsustainable levels of deforestation116
The US$10 billion coffee industry too leaves a gargantuan ecological footprint It is estimated that every cup of coffee consumed results in the loss of one square inch of forest cover117 Each year around 250000 acres of land is cleared for coffee which is unsustainable The Kodagu district
in the Western Ghats of India is a major biodiversity hotspot which produces about one-third of the countryrsquos coffee This region has more than 270 tree species which are all under significant ecological stress due to the coffee farms that threaten land use and land cover while potentially leading to the felling of about 21000 trees118
An estimated 8-10 of global production of low-cost timber products comes from illegal logging in forests To meet the burgeoning demand of timber produce about 25 million acres of land is converted to fast-
wood forests (timber plantations) across the world annually and this hampers the ecosystem services that nature provides us119 With the World Bank forecasting that the global market for wood is set to quadruple by 2050120 reducing timberrsquos environmental footprint is vital for the industryrsquos success In India there is no provision of a central data pool that maintains records of production and consumption of timber There is a need to address this inconsistency in reporting and data collection by forging a comprehensive strategic policy and providing institutional support121 This would ensure effective collaboration among all stakeholders that would result not only in the production of quality forest products but also a sustainable timber sector
114 httpsresourcetradeearthpublicationscocoa-trade-climate-change-and-deforestation~text=As20cocoa20tends20to20beforest20loss20over20this20time115 httpseconomictimesindiatimescomindustrycons-productsfoodalthough-indias-consumption-of-chocolate-is-steadily-growing-but-we-still-depend-on-imports-for-116 httpsnationalzoosieduscbimigratorybirdsresearchcacaorufcfm117 httpsohiostatepressbookspubsciencebiteschaptera-bitter-brew-coffee-production-deforestation-soil-erosion-and-water-contamination~text=For20every20cup20of20
coffeeinch20of20rainforest20was20destroyedamptext=Chemical20buildup20in20soils20andsoil20eroding2C20and20land20degradation118 httpswebcachegoogleusercontentcomsearchq=cacheYhaeYHVPWasJhttpswwwmdpicom1999-4907114480pdf+ampcd=6amphl=enampct=clnkampgl=in119 httpsresourcetradeearthyear=2018ampexporter=76ampimporter=699ampcategory=87ampunits=value120 httpdocuments1worldbankorgcurateden240231467291388831pdf106467-REVISED-v1-PUBLICpdf121 httpsonlinelibrarywileycomdoifull1011111477-894712094122 httpsglobalforestatlasyaleeduamazonland-usecattle-ranching123 httpsresourcetradeearthyear=2018ampimporter=699ampcategory=779ampunits=value124 httpsresourcetradeearthyear=2018ampimporter=699ampcategory=779ampunits=value125 httplargestanfordeducourses2018ph240halper1~text=Every20half20hour2C20a20cowmore20potent20than20carbon20dioxideamptext=There20is20
rampant20deforestation2C20especiallyto20make20room20for20cattle126 httpswwwinvestopediacomarticlesinvesting0929155-countries-produce-most-carbon-dioxide-co2asp127 httpwwwcwejournalorgvol9no3do-extensive-rubber-plantation-influences-local-environment-a-case-study-from-tripura-northeast-india128 httpswwwibeforgdownloadRubber_Plastics_220708pdf
Beef production remains by far the largest driver of deforestation in the worldrsquos tropical forests as forest land cleared for cattle is more than twice the combined area required for producing soy palm oil and wooden products The problem of cattle ranching
is particularly profound in the Amazon region the largest forest reserve in the world leading to 80 of present deforestation rates122 Clearing land for grazing causes irreversible habitat loss soil degradation and conflict between humans and wild animals India imports 15 and 12 of bovine leather from Turkey and Brazil respectively which poses a great threat to the forest areas of these countries123 It also jeopardises the earnings of the Indian companies manufacturing such products for its European consumers who have a high degree of sensitivity and awareness around deforestation124 In a larger context the impact of cattle stretches far beyond the realm of forests and is one of the key reasons for rising global emissions and climate change There are more than 15 billion cows on Earth with each of them capable of expelling 17 times more GHG emissions than cars in the form of methane burps a gas several times more potent than CO2 in terms of trapping heat It is therefore not surprising that cattle accounts for a colossal 18 in atmospheric carbon emissions125 To put this in perspective this surpasses emissions of the third largest CO2 emitter India which accounts for a 7 share in worldwide emissions126
Another commodity whose production has significant impact on the environment is rubber Environmentalists have warned for years that the rapid expansion of rubber plantations would come at the expense of natural forests Rubber has
not been subjected to extensive publicity in a way that palm oil soy and paper have been over the years given their impact on the environmentmdashpublicity that has led to adoption of robust sustainability criteria for these commodities Indiarsquos natural rubber plantation spans across an area of 183 million acres as of 2012 with the raw material being used as an input for making 35000 finished products of industrial importance127 Currently the impact assessment of large-scale rubber plantations on the environment is non-existent in the country a worrying sign considering Indiarsquos position as the 4th largest consumer in the world128
50
A N N U A L R E P O R T 2 0 2 0
Fossil-fuel and mineral mining accounts for 7 of global deforestation Moreover it not only presents a threat to forest cover and resource extraction but also leads to long-term impacts such as soil and water pollution infrastructure development and
increased anthropogenic activity129 While the effects of large-scale mining are easier to quantify as they are well regulated and undertake environmental impact assessments it is the scope and impact of artisanal and small-scale mining (ASM) that goes under the radar due to lack of data and a high degree of informality in the sector In India this problem warrants special attention since over 12 million people are engaged in the ASM business with women and girls from backward communities and those living below the poverty line being its primary employees130 A landscape-level approach is critical not only to identify and monitor the environmental and social impacts of individual mining projects but also to consider its interactions with other land uses as well given the crucial role forests play in balancing the ecosystem131 Indiarsquos investor requested company Hindustan Zinc Ltd was the first to disclose this year under the mining sector
129 httpsglobalforestatlasyaleeduland-usemining-extraction130 httpswwwpactworldorgstate20of20asm131 httpswwwresearchgatenetpublication38084575_Landscape_approach_for_quantifying_land_use_land_cover_change_1972-2006_and_habitat_diversity_in_a_mining_area_in_
Central_India_Bokaro_Jharkhand
Hindustan Zinc Pioneering forest and biodiversity conservation in the mining sectorHindustan Zinc Limited is the first investor-requested company in India to respond to CDPrsquos Forests questionnaire It demonstrated that a dedicated Biodiversity Policy and Management Standard is its compass in reducing flora and fauna disruption and in minimising or compensating its impact of operation through project scoping site closure and beyond
Companies in India currently lag behind their regional peers in terms of disclosure on deforestation management with only 3 companies disclosing on this topic in 2020
40
65
22
3China Japan IndiaSEA
(Indonesia Malaysia
Phillipines Singapore Vietnam)
Total no of companies disclosing through CDPs Forests questionnaire in 2020 by HQ countryregion
51
A N N U A L R E P O R T 2 0 2 0
Nagpur
Udaipur
Panaji
Kochi
Rajkot
Vadodara
Delhi
Dehradun
Ahmedabad
Thane
Chennai
Tiruchirappalli Coimbatore
Bangalore
Kolkata
Gangtok
Siliguri
India Snapshot
CITIES STATES AND REGIONS
Cities
In 2020 over 800 cities disclosed their environmental information through CDP including 16 Indian cities The number of cities in India disclosing through the CDP-ICLEI Unified Reporting System increased from 13 in 2019 to 17 This was largely due to citiesrsquo ongoing commitments to climate leadership initiatives such as the C40 Cities Climate Leadership Group (C40) the Global Covenant of Mayors for Climate and Energy (GCoM) and our partnership with ICLEI whose South Asia Regional Office also acts as the GCoM South Asia Helpdesk
88 global cities reached CDPrsquos A list which include Bristol (UK) Miami (USA) Cape Town (South Africa) Buenos Aires (Argentina) and Auckland (New Zealand)
despite the COVID-19 pandemic The USA accounts for the highest number
(25) of cities on the A List making up 28 despite the US pulling out of
the Paris Agreement In India more than half the cities in disclosed
that
they either have sustainability targets incorporated into the master planning of the city or it is in progress while only 43 of the cities have a published plan that addresses climate change adaptation Approximately half of the disclosing Indian cities have identified opportunities as a result of addressing climate change and one-third of them have a GHG emission reduction target which is a strong indication towards a low carbon development pathway
States and Regions
In 2020 the Union Territories of Delhi and Jammu amp Kashmir along with over 120 states and regions from across the world disclosed their environmental impacts through CDP Globally 90 of states and regions reporting a 2030 target have one in line with the IPCCrsquos goal to reduce global greenhouse gas emissions by 40-50 from 2010 levels by 2030 and 55 of states and regions with a 2030 emissions reduction
target are showing greater ambition than their national
counterparts
Indian cities and 16
Indian states disclosed to CDP
2
52
A N N U A L R E P O R T 2 0 2 0
ANNEXURESAppendix I Table of emissions scores and sector by company
Sector Company Name 2020 permission Status
Final score 2020
Scope 1 Scope 2 Scope 3 Number of categories reported in Scope 3
Bars hotels amp restaurants
Indian Hotels Co Ltd
public C 50610 239568 23824 3
Biotech amp pharma Biocon public C 41948 133110 Not Provided
Dr Reddyrsquos Laboratories
public B 247317 154836 1272548 8
ZCL Chemicals public D- Not Provided Not Provided Not Provided
Cement amp concrete ACC public B 16966585 643870 648068 3
Ambuja Cements public B 14523738 551219 1973622 7
Dalmia Bharat Ltd
public B 11280051 537968 1320736048 9
JK Cement non public D Private Private Private Private
JSW Cement Limited
public B- 1398609 647870 572488 4
Shree Cement non public C Private Private Private Private
Ultratech Cement
public B 47954830 1327185 5376354 4
Chemicals Aarav Frances amp Flavors Private
Limited
public Not Scored
GHCL LIMITED public D 109470536 496707 Not Provided
Godrej Industries public B 32311 44361 6735893 3
Gujarat Fluorochemicals
non public C Private Private Private Private
Jubilant Life Sciences Ltd
non public C Private Private Private Private
Kansai Nerolac Paints Limited
non public Not Scored Private Private Private Private
Tata Chemicals public B 444988061 4505956 12162395 5
UPL Limited non public Private Private Private Private Private
Godrej Consumer
Products Limited
public A- 33980 30848 26433 2
Note Due to increase in sample size more samples were considered for this report These samples include companies from the BSE Top 200 list CDPrsquos Fixed Income sample FAIRR sample Emerging markets sample Environmental sample and Continuity climate change sampleFor further details visit https6fefcbb86e61af1b2fc4-c70d8ead6ced550b4d987d7c03fcdd1dsslcf3rackcdncomcomfycmsfilesfiles000003423originalCDP_Climate_Change_Sample_Investor_Request_2020pdfNot Scored- Companies who have submitted the minimum version questionnaire
53
A N N U A L R E P O R T 2 0 2 0
Sector Company Name 2020 permission Status
Final score 2020
Scope 1 Scope 2 Scope 3 Number of categories reported in Scope 3
Energy utility networks
Adani Transmission
Ltd
public D 31870076 21155 9379637 3
GAIL public C 4925087 387358 1071 1
Financial services Axis Bank public B 6250 168043 4414712 3
HDFC Bank Ltd public B 764919 390176 1642453 3
Indusind Bank public A 88316 6278567 1277912 3
Kotak Mahindra Bank
public C 9078 69780 4290177 3
LampT Finance Holdings Limited
non public Private Private Private Private Private
State Bank of India
public B- 390 1066386 257902 5
YES BANK Limited
public A- 344515 3099369 4859625 3
Agricultural commodities
Tata Consumer Products Ltd
public A- 11731 34238 3348672939 10
Marico public A- 1380 12140 499568 9
Intermodal transport amp logistics
Adani Ports amp Special
Economic Zone
public B- 95905791 176946845 202567171 3
IT amp software development
HCL Technologies
non public Private Private Private Private Private
Infosys Limited public A- 15344 124063 371602 6
Larsen amp Toubro Infotech Ltd
public B 39485 2521874 1908034 2
Mindtree Ltd non public A- Private Private Private Private
Tata Consultancy
Services
public A- 26714 811815 702615 7
Tech Mahindra public A 1803807 105736586 39285212 5
Wipro public A- 13366 124564 421527 7
Land amp property ownership amp development
Godrej Properties Limited
public Not Scored 4400 2429 422
Mahindra Lifespace
Developers Limited
public B 397 2675 589525 8
Light manufacturing APOLLO TYRES LTD
public Not Scored 24207 60717 Not Provided
JK Tyres amp Industries
public C 158568 88424 Not Provided
54
A N N U A L R E P O R T 2 0 2 0
Sector Company Name 2020 permission Status
Final score 2020
Scope 1 Scope 2 Scope 3 Number of categories reported in Scope 3
Media telecommunications amp data center services
Bharti Airtel non public D Private Private Private Private
Reliance Jio Infocomm
Limited
public B 105018 1826762 243195034 3
Tata Communications
public A- 6376 108482 6938 3
Metal smelting refining amp forming
Hindustan Zinc public A 4480887 253756 4182181 10
Vedanta Ltd public B- 57482869 1864711 Not Provided
JSW Steel Ltd public A- 40045307 476901 4168823 8
Tata Steel public A- 60116322 5687999 14970000 12
Metallic mineral mining
NMDC public D 29004 63671 1957 1
Oil amp gas processing Bharat Petroleum
Corporation
public B 5023580 366230 729820 2
Indian Oil Corporation
public D 18690000 54700 Not Provided
Renewable power generation
Adani Green Energy
public D 841 13313 1174 1
Azure Power public Private 323 2767
Specialized professional services
Mahindra amp Mahindra Financial Services
public B 3370 18847 22922 3
Piramal Enterprises
public C 4430568 8692844 Not Provided
Vakrangee Softwares Ltd
public B 2053355 35409 Not Provided
Textiles amp fabric goods
ARVIND Ltd public B- 3514561 238894 Not Provided
Thermal power generation
Adani Power Ltd public D 58970705 14607 6910800 1
JSW Energy public B 17200521 36117 61151 2
NTPC Ltd public D 252495018 15845 978052 3
Tata Power Co public C 34952981 22051 1226 1
Tobacco ITC Limited public B- 1241718 230192 206064 5
Transportation equipment
Hero Motocorp Ltd
non public D Private Private Private Private
Mahindra amp Mahindra
public A 40654 414552 58425531 11
Tata Motors public A- 60533 266200 3140861 8
55
A N N U A L R E P O R T 2 0 2 0
Climate Change ndash Investor requested companies132
CDP Activity Group Company name Response Status
Air transport InterGlobe Aviation Ltd Not submitted
Jet Airways (India) Ltd Not submitted
Apparel design Page Industries Ltd Not submitted
Bars hotels amp restaurants
Indian Hotels Co Ltd Submitted
Jubilant Foodworks Ltd Not submitted
Biotech amp pharma Abbott India Ltd See Another
Ajanta Pharma Ltd Not submitted
Alkem Laboratories Ltd Not submitted
Aurobindo Pharma Not submitted
Biocon Submitted
Cadila Healthcare Not submitted
Cipla Not submitted
Divirsquos Laboratories Not submitted
Dr Reddyrsquos Laboratories
Submitted
Glenmark Pharmaceuticals
Not submitted
Lupin Not submitted
Natco Pharma Ltd Not submitted
Pfizer Ltd See Another
Sun Pharma Advanced Research Company Ltd
Not submitted
Sun Pharmaceutical Industries
Not submitted
Torrent Pharmaceuticals
Not submitted
Cement amp concrete ACC Submitted
Ambuja Cements Submitted
Dalmia Bharat Ltd Submitted
India Cements Not submitted
JK Cement Ltd Submitted
Orient Cement Limited Not submitted
Shree Cement Submitted
The Ramco Cements Ltd
Not submitted
Ultratech Cement Submitted
132 These include companies from the BSE Top 200 list CDPrsquos Fixed Income sample FAIRR sample Emerging markets sample Environmental sample and Continuity climate change sample For further details visit https6fefcbb86e61af1b2fc4-c70d8ead6ced550b4d987d7c03fcdd1dsslcf3rackcdncomcomfycmsfilesfiles000003423originalCDP_Climate_Change_Sample_Investor_Request_2020pdf
See Another -The response is covered by another CDP reporting company usually the parent company
CDP Activity Group Company name Response Status
Chemicals Asian Paints Not submitted
Berger Paints India Ltd Not submitted
Castrol India Not submitted
Colgate Palmolive India See Another
Coromandel International
Not submitted
Dabur India Not submitted
Emami Ltd Not submitted
Godrej Consumer Products Limited
Submitted
Godrej Industries Submitted
GRAPHITE INDIA LTD Not submitted
HEG LTD Not submitted
Jubilant Life Sciences Ltd
Submitted
Kansai Nerolac Paints Limited
Submitted
PI Industries Ltd Not submitted
Pidilite Industries Ltd Not submitted
Procter amp Gamble Hygiene amp Health Care Ltd
See Another
SRF Ltd Not submitted
Supreme Industries Ltd Not submitted
Tata Chemicals Submitted
UPL Limited Submitted
Coal mining Adani Enterprises Not submitted
Coal India Not submitted
Gujarat Mineral Devp Corpn
Not submitted
Commercial amp consumer services
Quess Corp Ltd Not submitted
Construction Bharti Infratel Limited Not submitted
GVK Power amp Infrastructure
Not submitted
Honeywell Automation India Ltd
See Another
Larsen amp Toubro Not submitted
Voltas Not submitted
Appendix II List of companies invited to respond to CDP
56
A N N U A L R E P O R T 2 0 2 0
CDP Activity Group Company name Response Status
Financial services Gruh Finance Ltd Not submitted
HDFC Asset Management
Not submitted
HDFC Bank Ltd Submitted
HDFC Life Insurance Company Ltd
Not submitted
Housing Development Finance Corporation
Not submitted
ICICI Bank Limited Not submitted
ICICI Lombard General Insurance Company Ltd
Not submitted
ICICI Prudential Life Insurance Company Ltd
Not submitted
IDBI Bank Ltd Not submitted
IDFC First Bank Ltd Not submitted
Indiabulls Housing Finance Ltd
Not submitted
Indiabulls Ventures Ltd Not submitted
Indian Bank Not submitted
Indusind Bank Submitted
Kotak Mahindra Bank Submitted
LampT Finance Holdings Limited
Submitted
LIC Housing Finance Not submitted
Max Financial Services Not submitted
Motilal Oswal Financial Services Ltd
Not submitted
Muthoot Finance Limited
Not submitted
PNB Housing Finance Ltd
Not submitted
Power Finance Corporation
Not submitted
Punjab National Bank Not submitted
RBL Bank Ltd Not submitted
REC Ltd Not submitted
Reliance Nippon Life Asset Management Ltd
Not submitted
SBI Life Insurance Company Ltd
Not submitted
Shriram Transport Finance Co
Not submitted
State Bank of India Submitted
Union Bank of India Not submitted
YES BANK Limited Submitted
CDP Activity Group Company name Response Status
Convenience retail Avenue Supermarts Ltd Not submitted
Discretionary retail Aditya Birla Fashion and Retail Ltd
Not submitted
Future Retail Ltd Not submitted
Electrical amp electronic equipment
Amara Raja Batteries Ltd
Not submitted
Bharat Electronics Not submitted
Crompton Greaves Consumer Electricals Ltd
Not submitted
Exide Industries Not submitted
Havells India Not submitted
Motherson Sumi Systems
Not submitted
Whirlpool of India Ltd See Another
Energy utility networks
Adani Gas Ltd Not submitted
Adani Transmission Ltd Submitted
CESC Ltd Not submitted
GAIL Submitted
Indraprastha Gas Ltd Not submitted
Power Grid Corpn of India
Not submitted
Reliance Infrastructure Not submitted
Torrent Power Not submitted
Financial services AU Small Finance Bank Ltd
Not submitted
Axis Bank Submitted
Bajaj Finance Limited Not submitted
Bajaj Finserv Not submitted
Bajaj Holdings amp Invst (BHIL)
Not submitted
Bandhan Bank Not submitted
Bank of Baroda Not submitted
Bank of India Not submitted
Canara Bank Not submitted
Cholamandalam Investment and Finance Co Ltd
Not submitted
Cholamandalam Investment and Finance Company Ltd
Not submitted
City Union Bank Ltd Not submitted
Edelweiss Financial Services Ltd
Not submitted
Federal Bank Not submitted
General Insurance Corporation of India
Not submitted
57
A N N U A L R E P O R T 2 0 2 0
CDP Activity Group Company name Response Status
Food amp beverage processing
Britannia Industries Not submitted
Marico Submitted
Tata Consumer Products
Submitted
United Breweries Not submitted
United Spirits Not submitted
Varun Beverages Ltd Not submitted
Venkys India Ltd Not submitted
Health care provision Apollo Hospitals Enterprises
Not submitted
Industrial support services
GMR Infrastructure Limited
Not submitted
Intermodal transport amp logistics
Adani Ports amp Special Economic Zone
Submitted
Container Corporation of India
Not submitted
IT amp software development
HCL Technologies Submitted
Infosys Limited Submitted
Larsen amp Toubro Infotech Ltd
Submitted
Mindtree Ltd Submitted
MphasiS Not submitted
Oracle Financial Services
See Another
Tata Consultancy Services
Submitted
Tech Mahindra Submitted
Wipro Submitted
WNS Holdings ADR Not submitted
Land amp property ownership amp development
DLF Not submitted
Godrej Properties Limited
Submitted
Housing Development amp Infrastructure
Not submitted
Oberoi Realty Not submitted
Leisure amp home manufacturing
Rajesh Exports Ltd Not submitted
Titan Company Limited Not submitted
Light manufacturing 3M India Ltd Not submitted
APOLLO TYRES LTD Submitted
Balkrishna Industries Ltd
Not submitted
Ceat Ltd Not submitted
MRF LTD Not submitted
CDP Activity Group Company name Response Status
Media telecommunications amp data center services
Bharti Airtel Submitted
Reliance Communications
Not submitted
Sun TV Network Not submitted
Tata Communications Submitted
Vodafone Idea Ltd Not submitted
Zee Entertainment Enterprises
Not submitted
Metal products manufacturing
AIA Engineering Ltd Not submitted
Bosch Ltd See Another
Endurance Technologies Ltd
Not submitted
Gillette India Not submitted
Metal smelting refining amp forming
Bharat Forge Ltd Not submitted
Essar Steel Limited Not submitted
Hindalco Industries Not submitted
Hindustan Zinc Submitted
Jindal Stainless Ltd Not submitted
Jindal Steel amp Power Not submitted
JSW Steel Ltd Submitted
Steel Authority of India Not submitted
Tata Metaliks Ltd Not submitted
Tata Steel Submitted
Vedanta Ltd Submitted
Metallic mineral mining
National Aluminium Co Not submitted
NMDC Submitted
Oil amp gas extraction amp production
Oil India Ltd Not submitted
Petronet LNG Not submitted
Oil amp gas processing Bharat Petroleum Corporation
Submitted
Hindustan Petroleum Corporation
Not submitted
Indian Oil Corporation Submitted
Mangalore Refinery and Petrochemicals
Not submitted
Nayara Energy Limited Not submitted
Oil amp Natural Gas Corporation
Not submitted
Reliance Industries Not submitted
Oil amp gas storage amp transportation
Gujarat State Petronet Not submitted
Other materials Astral Poly Technik Ltd Not submitted
Powered machinery Bharat Heavy Electricals
Not submitted
Cummins India See Another
58
A N N U A L R E P O R T 2 0 2 0
CDP Activity Group Company name Response Status
Renewable power generation
Adani Green Energy Submitted
Azure Power Submitted
National Hydroelectric Power Corporation Ltd (NHPC)
Not submitted
ReNew Power Private Limited
Not submitted
SJVN Ltd Not submitted
Specialized professional services
LampT Technology Services Ltd
Not submitted
Mahindra amp Mahindra Financial Services
Submitted
NBCC Ltd Not submitted
Piramal Enterprises Submitted
Vakrangee Softwares Ltd
Submitted
Textiles amp fabric goods
ARVIND Ltd Submitted
Birla CelluloseGrasim Industries
Not submitted
Chennai Petroleum Corporation
Not submitted
Thermal power generation
Adani Power Ltd Submitted
Aditya Birla Capital Not submitted
JSW Energy Submitted
KSK Energy Ventures Limited
Not submitted
NLC India Ltd Not submitted
NTPC Ltd Submitted
Reliance Power Not submitted
Tata Power Co Submitted
Tobacco ITC Limited Submitted
Transportation equipment
Ashok Leyland Not submitted
Bajaj Auto Not submitted
Eicher Motors Ltd Not submitted
Hero Motocorp Ltd Submitted
Mahindra amp Mahindra Submitted
Maruti Suzuki India Not submitted
Tata Motors Submitted
TVS Motor Company Ltd
Not submitted
Web amp marketing services
Info Edge (India) Ltd Not submitted
Wood amp paper materials
Century Textiles amp Industries
Not submitted
59
A N N U A L R E P O R T 2 0 2 0
Climate Change ndash Self Selected companies
CDP Activity Group Company name Response Status
Chemicals AARAV FRANCES amp FLAVORS PRIVATE LIMITED Submitted
GHCL LIMITED Submitted
Gujarat Fluorochemicals Submitted
Light manufacturing JK Tyres amp Industries Submitted
Cement amp concrete JSW Cement Limited Submitted
Land amp property ownership amp development Mahindra Lifespace Developers Limited Submitted
Media telecommunications amp data center services
Reliance Jio Infocomm Limited Submitted
Biotech amp pharma ZCL Chemicals Submitted
Water Security ndash Investor requested companies133
CDP Activity Group Name Response Status
Bars hotels amp restaurants Indian Hotels Co Ltd Submitted
Biotech amp pharma Ajanta Pharma Ltd Not submitted
Alkem Laboratories Ltd Not submitted
Aurobindo Pharma Not submitted
Biocon Not submitted
Cadila Healthcare Not submitted
Cipla Not submitted
Divirsquos Laboratories Not submitted
Dr Reddyrsquos Laboratories Submitted
Glenmark Pharmaceuticals Not submitted
Lupin Not submitted
Natco Pharma Ltd Not submitted
Sun Pharmaceutical Industries Not submitted
Torrent Pharmaceuticals Not submitted
ZCL Chemicals Submitted
Cement amp concrete ACC Not submitted
Ambuja Cements Submitted
Dalmia Bharat Ltd Not submitted
Shree Cement Not submitted
The Ramco Cements Ltd Not submitted
Ultratech Cement Submitted
Chemicals Asian Paints Not submitted
Berger Paints India Ltd Not submitted
Castrol India Not submitted
Coromandel International Not submitted
Dabur India Submitted
Emami Ltd Not submitted
Godrej Consumer Products Limited Submitted
Godrej Industries Submitted
Jubilant Life Sciences Ltd Submitted
Kansai Nerolac Paints Limited Submitted
Pidilite Industries Ltd Not submitted
Procter amp Gamble Hygiene amp Health Care Ltd Not submitted
SRF Ltd Not submitted
Supreme Industries Ltd Not submitted
Tata Chemicals Submitted
133 These include companies from the Water Global sample and Continuity water security sample For further details visit https6fefcbb86e61af1b2fc4-c70d8ead6ced550b4d987d7c03fcdd1dsslcf3rackcdncomcomfycmsfilesfiles000003422originalCDP_Water_Security_Sample_Investor_Request_2020pdf
60
A N N U A L R E P O R T 2 0 2 0
CDP Activity Group Name Response Status
UPL Limited Submitted
VVF Ltd Not submitted
Coal mining Adani Enterprises Not submitted
Coal India Not submitted
Construction Larsen amp Toubro Not submitted
Discretionary retail Aditya Birla Fashion and Retail Ltd Not submitted
Electrical amp electronic equipment Amara Raja Batteries Ltd Not submitted
Exide Industries Not submitted
Havells India Not submitted
Energy utility networks GAIL Not submitted
Power Grid Corpn of India Not submitted
Food amp beverage processing Marico Submitted
Tata Consumer Products Ltd Submitted
IT amp software development Tech Mahindra Submitted
Light manufacturing APOLLO TYRES LTD Not submitted
JK Tyres amp Industries Submitted
MRF LTD Not submitted
Media telecommunications amp data center services
Tata Communications Not submitted
Metal smelting refining amp forming Bharat Forge Ltd Not submitted
Hindalco Industries Not submitted
Hindustan Zinc Submitted
Jindal Steel amp Power Not submitted
JSW Steel Ltd Not submitted
Tata Steel Submitted
Metallic mineral mining National Aluminium Co Not submitted
NMDC Not submitted
Oil amp gas extraction amp production Oil India Ltd Not submitted
Petronet LNG Not submitted
Oil amp gas processing Bharat Petroleum Corporation Not submitted
Hindustan Petroleum Corporation Not submitted
Indian Oil Corporation Not submitted
Oil amp Natural Gas Corporation Not submitted
Reliance Industries Not submitted
Oil amp gas storage amp transportation Gujarat State Petronet Not submitted
Specialized professional services Piramal Enterprises Submitted
Textiles amp fabric goods ARVIND Ltd Submitted
Birla CelluloseGrasim Industries Not submitted
Thermal power generation Adani Power Ltd Submitted
JSW Energy Not submitted
NTPC Ltd Submitted
Tata Power Co Submitted
Tobacco ITC Limited Submitted
Transportation equipment Ashok Leyland Not submitted
Bajaj Auto Not submitted
Hero Motocorp Ltd Not submitted
Mahindra amp Mahindra Submitted
Maruti Suzuki India Not submitted
Tata Motors Not submitted
61
A N N U A L R E P O R T 2 0 2 0
Water Security ndash Self Selected companies
CDP Activity Group Name Response Status
Chemicals AARAV FRANCES amp FLAVORS PRIVATE LIMITED Submitted
Transportation services Adani Ports amp Special Economic Zones Submitted
Other materials Piramal Glass Submitted
62
A N N U A L R E P O R T 2 0 2 0
Appendix III - Indian Companies Committed to ActionScience-based Target initiative (SBTi)Approved 15degC
Mahindra Heavy Engines Ltd Mahindra EPC Irrigation Limited White House
Dr Reddys Laboratories Ltd Swaraj Engines Limited Gromax Agri Equipment Limited
Mahindra Accelo Mahindra Holidays and Resorts India Limited Mahindra Lifespaces Developers Limited
Mahindra Lifespaces Developers Limited Mahindra World City (Jaipur) Ltd Mahindra World City Developers Ltd
Polygenta Technologies Limited
Approved well-below 2degC
Tata Chemicals Limited Mahindra amp Mahindra Limited Wipro
Mahindra First Choice Services Ltd Mahindra Electric Mobility Ltd
Approved 2degC
Hindustan Zinc Limited Mahindra Sanyo Special Steel Shree Cement Ltd
Tech Mahindra
SBTi Committed
Infosys Limited UPL Limited JSW Energy Limited
Godrej Agrovet Limited Godrej Consumer Products Limited Godrej Industries
Godrej Properties Limited Godrej amp Boyce Mfg Co Ltd Ultratech Cement Limited
Vakrangee Limited ACC Limited Adani Ports and Special Economic Zone Limited
SCM Garments PVT Limited Nahar Industrial Enterprises Limited Ambuja Cement Ltd
Adani Green Energy Ltd Reliance Jio Infocomm Limited Bharti Airtel Limited
Gujarat Fluorochemicals Ltd (GFL) Dalmia Bharat Limited HCL Technologies
Havells India Limited Mahindra Susten Eastman Exports Global Clothing Pvt Ltd
JK Tyre amp Industries Ltd Marico Limited Tata Global Beverages Ltd
EPC Industries Limited Mahindra amp Mahindra Financial Services Limited YES BankSBTi companies not in CDP Sample
RE100Dalmia Bharat Ltd Infosys Ltd Mahindra Holidays amp Resorts India Ltd
Tata Motors Ltd
RE100 companies not in CDP Sample
Internal Carbon Pricing (ICP)Pricing carbon in 2020
ACC Ambuja Cements Dalmia Bharat Ltd
Dr Reddyrsquos Laboratories Godrej Consumer Products Godrej Industries
Gujarat Fluorochemicals Hero Motocorp Ltd Hindustan Zinc
63
A N N U A L R E P O R T 2 0 2 0
Infosys Limited JSW Cement Limited JSW Steel Ltd
Mahindra amp Mahindra Mindtree Ltd Shree Cement
Tata Chemicals Tata Consultancy Services Tata Consumer Products
Tata Motors Tata Steel Tech Mahindra
Ultratech Cement Wipro
Planning to price in the next two years
Adani Ports amp Special Economic Zone ARVIND Ltd GAIL
GHCL LIMITED Indian Hotels Co Ltd JK Tyres amp Industries
JSW Energy Jubilant Life Sciences Ltd Larsen amp Toubro Infotech Ltd
Mahindra amp Mahindra Financial Services Mahindra Lifespace Developers Limited Marico
NTPC Ltd Piramal Enterprises Reliance Jio Infocomm Limited
Tata Communications Tata Power Co UPL Limited
Vakrangee Softwares Ltd Vedanta Ltd YES BANK Limited
64
A N N U A L R E P O R T 2 0 2 0
About CDPCDP is a not-for-profit charity that runs the global disclosure system or investors companies cities states and regions to manage their environmental impacts by running a global environmental disclosure system Each year CDP supports thousands of companies cities states and regions to measure and manage their risks and opportunities on climate change water security and deforestation We do so at the request of their investors purchasers and city stakeholders
Over the last two decades we have created a system that has resulted in unparalleled engagement on environmental issues worldwide In 2020 Over 9600 companies reported through CDP on climate change water security and forests and over 800 cities and more than 120 states and regions disclosed their environmental impacts through CDP
CDP IndiaCDP began working in India in 2008 and was formally registered in 2012 working on disclosure and driving climate action It serves as a source of knowledge for hundreds of Indian corporations from those that are just beginning on the road to corporate environmental disclosure through to those looking to improve sustainability and make commitments to reduce environmental impact
It is the only NGO to be named in Indiarsquos INDC submission to the UNFCCC owing to its corporate environmental data repository and tracking of emissions and mitigation data from the Indian Industry CDP India also actively participated in Government of Indiarsquos Ministry of Environment Forests amp Climate Change (MoEFCC) work on future carbon market mechanisms In addition to our work on disclosure CDP India is actively engaged in other initiatives including Internal Carbon Pricing (ICP) Science-based targets (SBT) and RE100
65
A N N U A L R E P O R T 2 0 2 0
CDP ContactsFor more info contact Damandeep Singh Director CDP India damandeepsinghcdpnet infoindiacdpnet
CDP Board of Directors
Bharati Chaturvedi Founder amp Director Chintan Environmental Research and Action Group
Ramakrishnan Mukundan Managing Director amp CEO Tata Chemicals Limited
Damandeep Singh Director CDP India
Important Notice
The contents of this report may be used by anyone providing acknowledgement is given to CDP Worldwide (CDP) This does not represent a license to repackage or resell any of the data reported to CDP or the contributing authors and presented in this report If you intend to repackage or resell any of the contents of this report you need to obtain express permission from CDP before doing so
CDP India has prepared the data and analysis in this report based on responses to the CDP 2020 information request No representation or warranty (express or implied) is given by CDP India as to the accuracy or completeness of the information and opinions contained in this report You should not act upon the information contained in this publication without obtaining specific professional advice To the extent permitted by law CDP India do not accept or assume any liability responsibility or duty of care for any consequences of you or anyone else acting or refraining to act in reliance on the information contained in this report or for any decision based on it All information and views expressed herein by CDP India is based on their judgment at the time of this report and are subject to change without notice due to economic political industry and firm-specific factors Guest commentaries where included in this report reflect the views of their respective authors their inclusion is not an endorsement of them
CDP India their affiliated member firms or companies or their respective shareholders members partners principals directors officers andor employees may have a position in the securities of the companies discussed herein The securities of the companies mentioned in this document may not be eligible for sale in some states or countries nor suitable for all types of investors their value and the income they produce may fluctuate andor be adversely affected by exchange rates
lsquoCDP Worldwidersquo and lsquoCDPrsquo refer to CDP Worldwide a registered charity number 1122330 and a company limited by guarantee registered in England number 05013650
copy 2020 CDP Worldwide All rights reserved
This report is printed on recycled paper
This report is printed on CyclusPrint based on 100 recycled fibres
This report is printed on CyclusPrint based on 100 recycled fibres
Supported by Scoring partner
5
A N N U A L R E P O R T 2 0 2 0
trillion business opportunity Incidentally an IFC report released in 2018 highlights that the potential of climate finance in India is US$31 trillion
The Indian railway has also reiterated its commitment to achieving complete electrification of its network by 2023 targeting an ambitious net zero emissions by 203019
While governments have poured close to US$13 tn of public stimulus into economies so far the recovery packages are expected to have a net positive environmental impact in only seven of the 25 major world economies analysed stated the updated Greenness of Stimulus Index (GSI) report from Vivid Economics and Finance for Biodiversity20 A nature-based stimulus investment scenario outperforms a business-as-usual stimulus investment scenario globally by delivering more jobs more economic activity more carbon sequestration better nature outcomes and stronger resilience to extreme weather events including flood control says report co-author Jeffrey Beyer from Vivid Economics21
At the recently held Climate Ambition Summit on December 12 2020 UN Chief Antonio Guterres called on world leaders to declare a State of Climate Emergency in their countries until carbon neutrality is achieved22 To recover better from the COVID19 pandemic he urged countries to adhere to a green and resilient pathway by calling for investments in green jobs refusing bail-outs to polluting industries ending fossil-fuel subsidies and factoring climate risks into all financial and policy decisions
In this light this year has witnessed unprecedented calls for commitment action and investments not only from states but also from businesses and civil society groups The global momentum on climate action has been building with several European countries committing to net-zero emissions According to Blackrock23 88 of sustainable funds outperformed their non-sustainable counterparts from JanuaryndashApril 2020 highlighting the fact that ESGsustainable investing can future-proof investments while shaping a better future
Interestingly this year CDP also witnessed record-breaking disclosures mdash 10000+ companies cities states and regions disclosed through its platform Of these 9600+ companies with a combined worth of over 50 in global market capitalisation disclosed through CDP resulting in a 70 rise in corporate disclosures compared to 2015 the year the Paris agreement was signed24 CDP also launched its temperature ratings25 in collaboration with Europersquos largest asset manager Amundi enabling investors to access a temperature pathway for over 2850 global companies based on company emission reduction targets
19 httpspibgovinPressReleasePageaspxPRID=163826920 httpsenvironment-analystcomglobal106352recovery-stimulus-packages-are-causing-harm-to-nature21 httpsenvironment-analystcomglobal106352recovery-stimulus-packages-are-causing-harm-to-nature22 httpswwwindiatodayinworldstorydeclare-climate-emergency-un-chief-guterres-urges-leaders-of-every-country-1749078-2020-12-1323 httpswwwblackrockcomcorporateliteratureinvestor-educationsustainable-investing-resiliencepdf24 httpswwwcdpnetenarticlesclimate2020-lessons-from-an-extraordinary-year25 httpswwwcdpneteninvestortemperature-ratings
In India CDP witnessed a nearly 17 increase in corporate disclosure compared to 2019 with 220 Indian companies disclosing to investors and customers Climate change disclosure to investors recorded a rise of 14 Remarkably water security disclosure to investors also witnessed a significant increase of 87 Moreover for the first time a company responded to the forests request from investors through CDP India
With an ever-increasing number of companies choosing to disclose through CDP it is imperative to leverage the opportunity provided by the pandemic to transition from a grey to a green economy and join a growing league of climate leaders like Hindustan Zinc Limited IndusInd Bank Mahindra amp Mahindra and Tech Mahindra that deserve a special mention for being among the first Indian companies to make it to the prestigious CDP A List
Today Indian businesses realise that the risks posed by climate change are here to stay Therefore business leaders like Reliance Industries (a large conglomerate with businesses across oil amp gas telecom and retail amongst others) and JSW Energy (a thermal power company) have taken voluntary commitments to go net-zero (by 2035) and carbon-neutral (by 2050) respectively
Indian companies in highlight this year
Hindustan Zinc AIndusind Bank AMahindra amp Mahindra ATech Mahindra AGodrej Consumer Products Limited A-Infosys Ltd A-JSW Steel Ltd A-Marico A-Mindtree Ltd A-Tata Communications A-Tata Consultancy Services A-Tata Consumer Products A-Tata Motors A-Tata Steel A-Wipro A-YES BANK Limited A-
6
A N N U A L R E P O R T 2 0 2 0
Further the attempt to integrate climate action into business is also reflected in the disclosure responses received by CDP in the 2020 cycle
The business community is uniquely positioned to innovate and execute solutions with greater rigour and efficiency by integrating sustainability in the core business decision making with or without changes to the regulatory landscape Corporates can drive the desired change towards clean energy transitions by joining initiatives such as environmental disclosure the Science-Based Targets initiative RE100 and by incorporating an internal carbon price to deliver faster emission cuts in key areas However corporations need to be supported by governments through clearer long-term policies on energy and climate to instil the confidence needed to invest in technologies and innovation towards a zero-carbon future26
26 httpswwwwemeanbusinesscoalitionorgblogparis-agreement-the-power-of-ingenuity-with-collaboration-is-insurmountable
India is endowed with high social and environmental diversity and cannot expect to formulate a one- size- fits- all solution for its climate concerns What it requires is the coming together of all stakeholders to showcase the power of the collective especially its 13 billion people without whom no solution would be truly impactful
As disclosure and transparency are vital in lsquobuilding back betterrsquo CDP is poised to play a pivotal role as a global environmental disclosure platform helping companies cities states and regions measure and manage their environmental risks through disclosure The COP26 in Glasgow will be an important milestone in this direction and will enable countries to assess progress on their Paris Agreement goals and commit to more ambitious targets
As we work towards a low carbon future we must also pledge to build a more equitable world where vulnerable sections are no longer left to bear the brunt of tragedies triggered by climate change
17
Investor requested corporate disclosures for climate
change from Indian companies grew by
increase in investor requested corporate disclosures for Water Security Disclosures
87growth has been witnessed
over last year
` 7138Billion
worth of climate related risks calculated
by companies
3752
Indian companies have committed to the
SBTi by 2020
companies58
are pricing carbon or are planning to do so in the
next two years
7
A N N U A L R E P O R T 2 0 2 0
Business leaders are almost unanimously deliberating on climate issues and an overwhelming majority of companies now incentivise their managements to undertake climate action About three-fourths of these incentives are in the form of a financial compensation GAIL has a portal where staff members can give their suggestions on how to manage climate risks and employees whose suggestions are accepted are given a financial reward of `100000 Among the various types of non-monetary rewards BPCL recognises employees for undertaking initiatives in Health Safety Security and Environment (HSSE) through an annual performance award Mahindra amp Mahindra provide acknowledgement certificates to employees for energy efficiency projects as well as to those contributing to the annual sustainability reporting
The most commonly appointed positions that companies have chosen to place the responsibility of overseeing climate-related issues are board-level committee members the CEO the director the board chair and the CSO These individuals are also at the top of the corporate ladder which denotes the growing importance of climate change not just as a sustainability issue but as a broader global risk that threatens to undermine financial bottom lines erode shareholder value and tarnish brands
More than 75 companies provide an update to their respective boards on climate change-related issues at least
27 httpcbsteriinorgindiaghgphp~text=The20total20inventory20managed20bypercent20of20Indias20total20emissions
every quarter highlighting the growing importance of environmental sustainability as a core business value
Sustainability is deeply entrenched in the financial structure of companies today influencing access to capital capital expenditure direct and indirect costs and capital allocation Hence it comes as no surprise that 66 out of 67 companies stated that climate-related risks and opportunities have had an impact on their organisationrsquos strategy for financial planning Of these 66 companies 46 have also developed a low-carbon transition plan to minimise the losses to their bottom lines
SUSTAINABILITY ndash HEART OF GOOD GOVERNANCE
Businesses that currently account for 76 of the total energy consumption are vital for the country to tread the path of sustainable development As engines that will drive economic growth in the aftermath of the pandemic corporates present an immense opportunity for India to meet its climate commitments (NDCs) under the Paris Agreement through large-scale emissions reduction29
Frequency of reporting of climate-related issues
Oversight amp Incentive
Board- level oversight Incentive to management
99 8845
34
8
53
More frequency than quarterly
Quarterly
Half-yearly
4Annually
As important
matters arise
Not reported to the board
a
ge o
f com
pani
es
8
A N N U A L R E P O R T 2 0 2 0
Climate-related scenario analysis allows businesses to not only project future operational emissions but also mobilise necessary resources to offset the carbon footprint in their sustainability measurement approach It is especially important that the application of scenario analysis incorporates dynamic and unstable conditions under which companies are operating such as the COVID-19 pandemic that has resulted in mass layoffs economic recession and lockdowns across the world This would enable corporations to explore a broader range of uncertainties and be more resilient to external drivers of change28
The rigorous computational analysis would provide direction to enterprises on how to set emission reduction targets in line with the 20C scenario About 63 of the reporting companies use climate analysis tools such as models or scenarios enumerated
28 httpswwwfsborgwp-contentuploadsP291020-3pdf
under the Nationally Determined Contributions and International Energy Agencyrsquos 2 Degree Scenario (2DS) to inform their business strategy
Climate-based risks and opportunities have also influenced the strategy of companies in the sphere of investment in RampD Products amp Services Operations and Supply ChainValue chain Among these areas 87 companies claimed that Operations were affected and 84 reported changes in planning for Products and Services
Investmentin RampD
343
657
No
of C
ompa
nies
No Yes
Product amp Services 164
836
No Yes
No
of C
ompa
nies
Supply chain Value chain
701
298
No Yes
No
of C
ompa
nies
Operations
866
134No
of C
ompa
nies
No Yes
9
A N N U A L R E P O R T 2 0 2 0
CLIMATE-RELATED RISKS amp OPPORTUNITIESMore often than not the financial impacts of climate-related issues are not quantified and identifying them in the first place could be challenging These issues necessitate actions Increasingly investors lenders and other financial regulators are becoming more focused on ensuring that the private sector is ready to address climate risks and grab opportunities brought by changing climate
29 httpthoughtleadershipaoncomDocuments20200122-if-natcat2020pdfutm_source=cerosamputm_medium=storypageamputm_campaign=natcat20
30 httpswwwbankofenglandcouk-mediaboefilesspeech2019avoiding-the-storm-climate-change-and-the-financial-system-speech-by-sarah-breedenpdf
31 httpsreadoecd-ilibraryorgviewref=136_136201-ctwt8p7qs5amptitle=Making-the-Green-Recovery-Work-for-Jobs-Income-and-Growth_
32 https6fefcbb86e61af1b2fc4-c70d8ead6ced550b4d987d7c03fcdd1dsslcf3rackcdncomcmsreportsdocuments000005312originalAnalysis_of_CA100__Data_for_CDP_Investor_Signatories_v5pdf1596046258
33 Climate Action 100+ is an investor initiative to ensure the worldrsquos largest corporate GHG emitters take necessary action on climate change The companies include 100 lsquosystemically important emittersrsquo accounting for 23rd of annual global industrial emissions alongside more than 60 others with significant opportunity to drive the clean energy transition Read more at httpwwwclimateaction100org
Climate change has already shown substantial impacts on businesses all around the world and this is expected to continue As per a 2019 report 29 the total direct economic losses incurred due to climate-related natural disasters in 2019 were estimated at US$232 billion In India the monsoon floods in June-October 2019 caused an economic loss of US$10 billion and claimed 1750 lives Additionally the Bank of England has estimated asset losses worth US$20 trillion due to climate change if no action is taken now 30
COVID-19 has taught the world how the pandemic can actually be used as an
opportunity to better understand and mitigate climate-related
risks Investors are now more than ever more focussed on risk exposure Post-COVID-19 civil society groups governments and business are all have aligned in trying to reduce the risks to our economy and world going forward
As per an OECD report despite widespread socio-
economic suffering suffering there is an increase in public
consciousness about the risks to the natural system from anthropogenic activities31
CDP recently released a report32 on the analysis of CA100+ companies for CDP Investor Signatories Up to 118 of 122 CA100+33 companies report being exposed to substantive climate-related risks and opportunities 93 companies identified climate-related risks and 91 identified climate-related opportunities as having the potential to have a substantive financial or strategic impact on their businesses
As per CDP Indiarsquos 2020 data companies have a varied definition of what short medium and long-term means for them -- a rough average across the sample would be three years for short term five years for medium term and 15-20 years for the long term although the latter also ranges up to 100 years These time frames are important in planning risk management processes -- contextualisation of risks in terms of potential market changes and evolving technological scenarios around risk management at enterprise level
Responding companies
67Companies identified
climate related substantive risks
62Companies
identified risk typesdrivers
60Companies
identified potential financial impact
driver
60
Companies provided potential financial
impact figures
42
10
A N N U A L R E P O R T 2 0 2 0
THE RISKS OF CLIMATE CHANGE
In terms of risk types current regulation was deemed to be most relevant and always included in 97 of the organisationsrsquo climate-related risk assessments This was followed by emerging regulation and technology Interestingly findings from responses submitted by global companies corroborate this trend analysis as almost all CA100+ respondents reported policy and legal risks as potential drivers for substantive impact when it comes to transition risk34 With regular compliance checks increased stakeholder concern and sustainably evolving consumer demands climate-related risk assessment procedures can help companies become better equipped to handle longer-term uncertainties and liabilities
The number of companies that identified inherent climate-related risks with potential substantive financial or strategic impact on businesses rose to 94 from 88 in 2019 Up to 63 of reporting companies were able to get to the last mile of providing a financial impact figure to the risks identified Disclosing Indian companies put the total inherent financial impact of climate risks at `7138 billion with an average risk per company being `92 billion
Companies have also identified climate-related risks across their value chain with direct operations being the most severely affected and exposed most to acute physical risks followed by emerging regulation current regulations and chronic physical risks Companiesrsquo lsquodownstreamrsquo value chain is affected the most by market risks followed by acute physical risks Downstream value chain refers to the third parties benefiting from the outputs products and services of business activities This may be a companyrsquos customers and clients or the organisations and projects the business invests in This could possibly mean that changing customer behaviour could gravely affect a business operation if there is a shift in the demand for a comparatively low-carbon intensive product as well as greater demand for product efficiency regulations and standards providing clear evidence that there is a continuous shift towards sustainable products
CLIMATE RISKS AN OPPORTUNITY TO RESTRATEGISE
Up to 94 of reporting companies have identified climate-related opportunities as having the potential to make a substantive financial or strategic impact on businesses And 63 have provided a potential financial impact figure to the opportunities related to climate change Disclosing companies put the cost of climate-related opportunities at a total of `2787 billion The figure is a testament to the evolution of the climate change mitigation program and how organisations see this
34 https6fefcbb86e61af1b2fc4-c70d8ead6ced550b4d987d7c03fcdd1dsslcf3rackcdncomcmsreportsdocuments000005312originalAnalysis_of_CA100__Data_for_CDP_Investor_Signatories_v5pdf1596046258
No of Companies
Opp
ortu
nity
typ
es
Opportunity identified in value chain
Direct operations
Downstream
Upstream
Resource efficiency
Product and services
Energy source
Markets
Resilience
41
25 18
34 7
7
9 3
3
2
3
396
6
Risks relevant to Indian companies
Current regulation97Emerging regulations90Reputation90Market85Technology85Legal
Acute physical
Chronic physical
827973
No of Companies
Risk occuring in value chain
No of Companies
Risk
type
s
Reputation
Legal
Emerging regulation
Chronic physical
Technology
Market
Current regulation
Acute physical
Direct operations
Downstream
Upstream
5115
2
2923 4 8
17
8 14 7122 4
40 5 8
2
31
11
A N N U A L R E P O R T 2 0 2 0
Similarly most companies saw resource efficiency as a major climate-related opportunity followed by energy source and products and services in their lsquodirect operationsrsquo The main drivers behind these opportunities were use of more efficient production and distribution processes use of lower-emission sources of energy and development andor expansion of low-emission goods and services In the lsquodownstreamrsquo value chain products and services was majorly witnessed as an opportunity as there is growing consumer awareness and concern around sustainability related issues As a result companies are constantly diversifying their portfolios to address these consumer needs
Prod
uct a
nd s
ervi
ces
Ener
gy S
ourc
e
Resi
lienc
e
Resi
lienc
e
Ener
gy S
ourc
e
Reso
urce
effi
cien
cyM
arke
ts
2787identified to be the financial impact of reported climate-
related opportunities (in rupee billion)
Billion
`452
328
270
18
1719
Responding companies
67Companies
identified climate related
substantive opportunities
63Companies identified
opportunitiy typesdrivers
61
Companies identified
potential financial impact driver
60
Companies provided potential financial impact
figures
42
2041
4715
136
119
42413842
Acut
e ph
ysic
alCu
rren
t reg
ulat
ion
Emer
ging
regu
latio
n
Chro
nic
phys
ical
Repu
tatio
nO
ther
s
Lega
l
Tech
nolo
gyM
arke
t
7138identified to be the financial impact of reported climate-
related risks (in rupee billion)
Billion
`Financial impact of reported climate-related risks (in rupees billion)
Financial impact of reported climate-related opportunities (in rupees billion)
12
A N N U A L R E P O R T 2 0 2 0
Tech Mahindra Tapping into climate-related opportunities
Tech Mahindrarsquos approach towards climate change mitigation strategies is a testament to the efficacy of tapping into and realising climate-related opportunities The company has adopted Science-Based Targets to reduce its emissions and is a signatory to Business Ambition of 15 degree Celsius Tech Mahindra is committed to responsibly managing its operations through continuous improvement in sustainability practices across its value chain The company focuses on carbon emission reductions energy consumption reduction self-generation of energy from renewable energy sources and encouragement for green projects through Power Purchase Agreements The company has taken a target to increase Renewable Energy (RE) to 50 by 2025 Their sustainability report is aligned with CDSB amp Task Force on Climate-related Financial Disclosures (TCFD) frameworks
A constant focus on green energy and sustainable operations has provided a significant saving of US$27 million brought about by increasing renewable energy capacity to 1383MW leading to a saving of 28 million units of electricity adopting energy efficient practices across their facilities
Tech Mahindra has harnessed the power of disruptive next-generation technologies such as Artificial Intelligence (AI) analytics and blockchain to create solutions that ensure both its own and its customersrsquo carbon footprint reduction The company has contextualised opportunities for its customers as well by creating smart city offerings such as SMART Grid Micro-Grid-As-A-Service Intelligent Electric Vehicle Charging System (IEVCS) smart energy management smart traffic management smart lightening management smart waste management systems and command amp control centres These smart city offerings will help reduce carbon footprints across multiple smart cities globally thereby reducing carbon emissions and contributing to green and sustainable solutions It is claimed that the market size for this is expected to reach US$4639 billion by 2027
At present the risks identified by the responding companies significantly outweigh the opportunities Opportunities are slow to emerge and companies need to focus on the use of lower-emission sources of energy development andor expansion of low-emissions goods and services development of climate adaptation resilience and insurance risk solutions and use of more efficient production and distribution processes
In 2015 at the request of the G20 Finance Ministers and Central Bank Governors the Financial Stability Board (FSB) and its chair Mark Carney established the industry-led TCFD This was set up in response to increasing demands from investors lenders insurers regulators policy makers and other stakeholders in the financial markets for decision-useful climate-related information CDP has aligned its information requests with the TCFD alongside introducing a sectoral focus and adopting a forward-looking approach to climate-risk disclosure We are already going in the direction of mandatory disclosure of climate risks how they are present in a companyrsquos activities how they manage it and how resilient they are to it The UK will be the first country in the world to make TCFD-aligned disclosures fully mandatory across the economy by 2025 going beyond the lsquocomply or explain approachrsquo35
35 httpswwwgovukgovernmentnewschancellor-sets-out-ambition-for-future-of-uk-financial-services
13
A N N U A L R E P O R T 2 0 2 0
Under current policies Indiarsquos projected emissions for 2030 can achieve a rating of ldquo15degC Paris Agreement compatiblerdquo if domestic emissions peak and start reducing with international support36 This shows that India has the potential to become a world leader with enhanced 15-degree compatible targets through a swift transition from coal to renewable energy Although India was already on track to meet its NDCs pre-COVID19 it has seen an even more significant drop in emissions since the onset of the pandemic During the peak of lockdown Indiarsquos energy demand reduced by almost 30 in April 202037 ie each additional week of lockdown the annual energy demand fell by 0638 This is mostly due to the significant reduction in energy consumption and power generation via fossil fuel However the impact of the pandemic on emissions is expected to be temporary and emissions are likely to rebound in 202139 as per estimations
In comparison to the NDCs which set an overall emissions target sectoral indicators can be more reliable in making informed decisions on mapping emissions reduction targeting Paris-compatible goals40 The
36 Climate Action Tracker- Fair Share37 Carbon Brief Analysis Indiarsquos CO2 emissions fall for first time in four decades amid coronavirus38 httpswwwieaorgreportsindia-202039 Carbon Brief Global Carbon Project Coronavirus causes lsquorecord fallrsquo in fossil-fuel emissions in 2020 Dec 202040 httpswwwoecd-ilibraryorgdocserver9789264273528-4-en
pdfexpires=1607881602ampid=idampaccname=guestampchecksum=891034D10FA31A953F7924772F23966D41 httpssciencebasedtargetsorgresourceslegacy201505Sectoral-Decarbonization-Approach-Reportpdf42 IPCC Mitigation Pathways Compatible with 15degC in the Context of Sustainable Development
major challenge is how to translate global temperature goals into individual actions However various strategies can be adopted to meet the long-term goals
The Science-Based Targets Initiativersquos (SBTi) Sectoral Decarbonisation Approach (SDA) allocates the well below 2degC carbon budget to different sectors taking into account inherent differences among sectors such as how fast each sector can grow relative to economic and population growth along with its mitigation potential41 According to the Intergovernmental Panel on Climate Change (IPCC) the highest global carbon budget allocation (for the period of 2011-2050) is for the power sector (25) followed by agriculture (24) and industry [including steel aluminium chemical and paper] (14)42
EMISSIONS TRENDS AND VERIFICATION
13increase in number of
organisations reporting
27increase in emissions
reporting (Scope 1+Scope 2)
90increase in scope 3 emissions reporting
India under its NDCs pledged to reduce its emissions intensity by 33-35 by 2030 compared to the 2005 levels The Climate Action Tracker38 rates Indiarsquos NDC target as ldquo2009 Copenhagen 2degC goal compatiblerdquo indicating that its commitment is a ldquofair sharerdquo of the global effort
Scope 1 and Scope 2 Emissions reported via CDP over the years
(In Million tCO2e)
2018 2019 2020
2997
55717037
14
A N N U A L R E P O R T 2 0 2 0
In order to allocate sector-specific questions to companies CDP has developed an Activity Classification System (ACS)43 It is a framework used to classify companies under the most relevant sectors It focuses on the diverse activities from which companies derive revenue associating them with the impacts to their business from climate change water security and deforestation This approach allows a better understanding of company actions based on their environmental risk opportunity and impact CDPrsquos Climate Change questionnaire requests companies to disclose their direct and indirect emissions under different emissions categories Although India saw an overall decrease in emission in 2020 there was an increase in CDP reporting companies and hence an overall increase in emissions reporting For the year
43 https6fefcbb86e61af1b2fc4-c70d8ead6ced550b4d987d7c03fcdd1dsslcf3rackcdncomcmsguidance_docspdfs000001540originalCDP-ACS-full-list-of-classificationspdf1520244912
44 The location-based method reveals what the company is physically putting into the air and the market-based method shows emissions the company is responsible for through its purchasing decisions
2020 the companies reported 70374 MtCO2e of total [Scope 1+Scope 2 (location-based)] emissions which is a 27 increase in reported emissions from 2019 This is mostly because of the significant increase in emissions reporting from several sectors mdash electric utilities cement and other heavy sectors
Only four companies chose a Scope 2 market-based approach and 43 companies selected a scope 2 location-based approach44 The total scope 2 emissions for location-based approach amounted to 181 MtCO2e and market-based approach amounted to 414 MtCO2e It is clear from this breakdown that a range of sectors and processes contribute to global emissions Focusing on any single sector alone would be insufficient However as can be seen in the
Emissions reported in Scope 3 Categories
4949
1414
1111
1010
88
55
33
Use of sold products
Purchased goods and services
Upstream transportation and
distribution
Downstream transportation and
distribution
Fuel and energy related activities (not included
in scope 1 and 2)
End of life treatment of sold products
Others
In 2020 companies have reported MtCO2e of total (Scope 1+2 [location-based]) emissions704
Gross Emissions Data 2020 (in MtCO2e)
682
126418
Gross Scope 1 Emissions
Gross Scope 3 EmissionsGross Scope 2 Emissions (Market and
Location based)
Scope 2 Location based emissions Scope 2 Market based emissions
Metal smelting refining and forming
Financial services
Cement amp concrete
Media telecommunications amp data center services
IT amp software development
Energy utility network
Chemicals
Textiles amp fabric goods
Oil amp gas processing
Biotech and pharma
Thermal power generation
Intermodule transport amp Logistics
Bar Hotels and Restaurants
Transportation equipment
Metallic mineral mining
Others
2911712
703
688536
165 292207
144118113
093087
071063
020057
024045044
157
Scope 2 Market-based emissions Scope 2 location-based emissions
Scope 2 market-based and location-based emissions reported as per CDPrsquos Primary Activity Group classification (in MtCO2e)
15
A N N U A L R E P O R T 2 0 2 0
graph for Gross Scope 2 emissions metal smelting refining and forming sectors contribute to the maximum emissions (1712 MtCO2e) followed by financial services and cement and concrete sectors
Companies reported 1259 MtCO2e of Scope 3 emissions in 2020 a 90 increase from 2019 figures due to higher disclosure as well as more companies disclosing their Scope 3 GHG inventories Almost half of the Scope 3 emissions were reported in the following categories use of sold products (49) followed by purchased goods and services (14) upstream transportation and distribution (11) and downstream transportation and distribution (10)
The ACS sectoral analysis shows that the transportation equipment activity group has the maximum reported scope 3 emissions at 615 MtCO2e followed by metal smelting refining and forming activity group at 2332 MtCO2e and cement and concrete activity group at 989 MtCO2e
Of the responding companies 33 have reported an approximately 11 of reduction in their gross global emissions (Scope 1 and 2 combined) from 2019 and 26 companies reported an approximate 57 increase in their gross global emissions from 2019 Responding companies have identified change in boundary45 as a major reason for a 62 increase in emissions from 2019 followed by acquisitions which led to a to 30 increase Amongst all sectors the electric utilities sector accounts for 83 of total increased emission values and up to 73 of these were due to change in boundary
Amongst all sectors reduction in emissions values since 2019 were mostly caused by emissions reduction initiatives (43) followed by change in output (30) and change in emission estimation methodology (23)
45 This refers to changes in the boundary used for inventory calculation ie changing from financial control to operational control This option could also apply if organisation has incorporated facilities into its inventory that were excluded in previous years
Amongst all sectors steel saw the highest reduction (around 48) in emission values and approximately half of this was achieved only from change in emission estimation methodology through recalibrating the GHG emissions for the reporting period This is followed by cement which reported a 29 reduction in emission values from implementing emissions reduction initiatives It is also noted that more than 30 of responding companies have adopted a change in renewable energy consumption but this accounts for only 35 of total reduction in emission values
Scope 3 emissions reported as per CDPrsquos Primary Activity Group classification (in MtCO2e)
of increased emissions in 2020 attributed to Change in boundary62
32 attributed to acquisitions
Metal smelting refining and forming
Cement amp concrete
Media telecommunications amp data center services
Chemicals
IT amp software development
Food amp beverage processing
Oil amp gas processing
Biotech and pharma
Thermal power generation
Land amp property ownership amp development
Financial services
Transportation equipment
Others
6157
2332
989
796
790
632
385
158
127
073
059
039
055
Third-party verification or assurance in place for Scope 12 amp 3 emissions
3571
Scope 1
3643
Scope 2 (location-based
or market based)
2786
Scope 3
a
ge o
f com
pani
es
16
A N N U A L R E P O R T 2 0 2 0
Third-party verification is one of the significant components of emission reporting An independent verification of self-reported data provides credibility and assurance It helps companies improve their internal processes identify risks and opportunities increase the reliability of their data reduce operational costs and building a strong reputation46 When an organisation monitors and verifies its emissions it can accurately identify and understand the true proportions of emissions from its sources and this can help it realise the major opportunities for emission reduction along with cost benefits
In 2020 50 companies reported third-party verification or assurance for Scope 1 emissions 51 companies for Scope 2 emissions and 39 companies for Scope 3 emissions Compared to 2019 there is an 18 increase in companies that have verified Scope 3 GHG emissions This indicates that Indian companies are becoming increasingly aware of their emission managementaccounting Amongst all sectoral companies which opt for third-party verification of their reported emissions around 25 are from IT amp software development and financial services Cement and concrete sectors rank the lowest on the list CDP encourages companies to have verified data submitted
46 The business benefits of third party verification of climate data A CDP Guide
Building a stronger reputation via third party verification
bull Increase confidence in data for internal and external use
bull Develop and demonstrate an effective carbon reduction strategy Improve business processes
bull Reduce operational costsbull Full-fill one of the mandatory criteria for entry
to the CDP A-list by gaining full points on CDPrsquos Scope 1 and 2 verification questions
bull Provide credibility for products services and internal processes
bull Counteract claims of greenwashing
17
A N N U A L R E P O R T 2 0 2 0
DECARBONISING ACROSS VALUE CHAIN Scope 3 emissions typically arise from the supply chain and the consumers using the product It has been found that the emissions from the supply chain are 5-6 times more than the carbon footprint of a companyrsquos direct operations and hence account for lionrsquos share of an organisationrsquos overall emissions47
47 httpswwwcdpnetenarticlessupply-chainsupplier-engagement-leaderboard-201948 httpswwwbcgcomen-inpublications2020supply-chain-needs-sustainability-strategy
Walking the extra mile in terms of engaging with stakeholders especially suppliers and customers on climate issues allows an organisation to consider the whole gamut of emissions and have better control over their emissions inventory For example metal companies can improve their supply chainrsquos environmental performance through adoption of a circular economy model which leads to an increased use of recycled materials in products reduces the emissions by lowering the overall burden on the manufacturing plant to produce from scratch and creates a closed-loop system with consumers48 This yearrsquos data indicates that 88 of companies engaged with their value chain partners on climate-
related issues an improvement of 5 over 2019 There was also an increase in absolute numbers -- 59 business entities collaborated with value chain partners against 49 last year
The main forms of engagement with suppliers are compliance and onboarding followed by incentivisation and information collection Educationinformation sharing collaboration and innovation are the most common customer engagement processes
Types of engagement with suppliers
No of Companies engaging with value chain on climate-related issues
2121
22
331212
1313
44
44
Other partners in the value chain customers suppliers
Other partners in the value chain suppliers
Customers
Customers Suppliers
Suppliers
Other partners in the value chain
Other partners in the value chain customers
of companies engage with their value chain partners on climate related issues an improvement of 5 from 2019
88
26
Compliance amp onboarding
16
Engagement amp incentivisation
(changing supplier behavior)
9
Information collection
(understanding supplier behavior)
7
Innovation amp collaboration
(changing markets)
No
of C
ompa
nies
18
A N N U A L R E P O R T 2 0 2 0
Organisations are mindful of the fact that climate issues need to be dealt using a participatory approach that encompasses all partners in the value chain as well as engages other external stakeholders Companies are thus getting serious about engaging in a comprehensive dialogue on climate change as this will allow them to have inputs in shaping public policy In their attempt to influence climate policies organisations are establishing communication channels with stakeholders like policymakers trade associations and research funding organisations A positive sign emerging is that majority of the businesses are agreeing to comply with environmental legislations unconditionally Energy efficiency and clean energy generation have garnered the support of 71 and 68 of responding companies respectively Mandatory carbon reporting and increased climate resilience have also found acceptance
With the COVID-19 pandemic wreaking havoc across the world and leading to the first-ever recorded recession in India it is important that companies view this as an opportunity to build a more resilient economy one in harmony with nature and encouraging of a more inclusive environment for supplier engagement that would expedite decarbonising Engaging with the value chain offer a strategic advantage as it allows companies to take a lead on corporate sustainability and puts them in a position to set the blueprint for other businesses to follow
19
A N N U A L R E P O R T 2 0 2 0
Emission reduction targets and initiatives
Targets
In recent years accelerated climate change has forced businesses to set more ambitious climate goals and commit to advocating for a low-carbon economy Today it is considered a standard practice for businesses to report their annual emissions and undertake efforts to reduce their carbon footprint Of the 67 Indian companies responding to investor requests 57 have undertaken a total of 95 emissions reduction targets including absolute targets intensity targets and both absolute and intensity targets 24 of these were approved SBTs
The global pandemic has reinforced the need for business resilience in operations and corporate leaders have started recognising that science-based climate action goes hand-in-hand with building business success49 Companies are looking science-based targets as guiding lights with a defined pathway to future-proof growth and with impending climate change hazards more companies have doubled down on their commitments towards a low-carbon transition50 The momentum for SBTs has reached across a range of industries including cement
49 The new normal 1000 companies are now setting science-based climate targets - Science Based Targets50 httpswwwcdpnetenarticlesclimate2020-lessons-from-an-extraordinary-year
automobiles pharmaceuticals metals amp mining real estate and information technology
As more companies are striving toward commitments this year witnessed an increase in the number of approved SBTs from seven targets last year to 24 targets this year
Leading companies are moving forward by setting long-term emissions reduction targets to mitigate climate-related risks Compared to 2019 this year more targets
were set under a long-term time frame till 2030 and a lesser focus had been given on short-term targets ie till 2020 Most of the companies selected a base year of 2018 and had gone for the intensity targets Hence in upcoming years long-term targets can play a major role for companies to support their sustainability visions and their journey towards low-carbon transition Apart from these companies also reported 83 other targets which included 38 energy consumption targets 13 energy productivity targets and 11 waste management targets amongst others
TARGETS amp PERFORMANCE
More than
three times increase in the number of approved science-based targets
of the responding companies set long-term targets (ie till 2030)
50
15
Absolute target
5Both absolute and intensity
targets
37
Intensity target
10
No target
No of Companies
GHG Emission Reduction Target Types
Absolute emission targets count
Intensity emission targets count
Types of targets based on time-frame of target year
820
Till 2020
1929
Till 2021 - 2030
136
2031 and beyond
20
A N N U A L R E P O R T 2 0 2 0
Emission reduction initiatives
While the number of companies taking up Emission Reduction Initiatives (ERI) has grown from 53 to 58 the number of initiatives has declined from 293 to 287 resulting in a 13 decrease in the estimated annual CO2e savings this year
Energy efficiency in production processes and in buildings continue to account for most ERIs non-energy industrial process emission reductions have been outweighed in their CO2e saving potential
Other emission reduction initiatives such as upgrading equipment with high-efficiency alternatives and digitisation initiatives undertaken by banks accounted for the highest estimated CO2e savings In terms of the highest monetary savings energy efficiency in production processes contributed to 76 of monetary savings followed by energy-efficiency in building services
The steel sector had the highest number of initiatives for energy efficiency in production process and accounted for
of total estimated annual CO2e savings
88Monetary Savings from Emission Reduction Initiatives
Annual monetary savings (Million `) No of Initiatives
20611 1918 576 237 148Energy
efficiency in production processes
Non-energy industrial process
emissions reductions
Other initiative
Waste reduction
and material circularity
Energy efficiency in
buildings
150
63 1210
2
Emission Reduction Initiatives
6340 2772 2574 2016 1278
6310
150
122
Other initiatives
Non-energy industrial process
emissions reductions
Energy efficiency in production processes
Waste reduction
and material circularity
Energy efficiency in
buildings
No of InitiativesEstimated annual CO2e savings (MtCO2e)
21
A N N U A L R E P O R T 2 0 2 0
The rise in climate consciousness among Indian companies is evident from the growing number of those committed to the Science Based Target Initiative (SBTi) By 2020 52 companies have committed to it with a significant growth of more than 37 over last year India is now the leader from emerging economies for having the maximum number of companies committing to SBTi and globally it stands at the sixth position
Of the 52 committed companies 22 have further approved SBTs in 2020 compared to 10 in 2019 The initiative champions SBT setting as a powerful way of future-proofing companiesrsquo growth in the transition towards a low-carbon economy51 The initiativersquos overall aim is for SBT setting to become a standard business practice and for companies to play a major role in driving down global GHG emissions Embedding SBTs as a fundamental component of sustainability management practices is crucial for achieving this
The Sectoral analysis of the Indian SBTi companies highlights the number of companies that are committed to the initiative and the number of those with approved set targets across each sector
51 httpssciencebasedtargetsorgresourcesfilesSBTi-manualpdf52 httpssciencebasedtargetsorgresourceslegacy201805SBT-transport-guidance-Finalpdf
Compared to last year the automobiles and components sector is still leading with the highest commitment and targets set The automobile sector is one of the fastest growing sectors which represents 23 of all energy-related global emissions52 Decarbonisng the automobile sector is possible through disruptive technological innovation land-use planning and transport demand management modal shift and
shifting to electric mobility Companies that set ambitious SBTs can send a strong signal for local regional and national policies to increase the level of ambition and steer the transition
In 2020 28 SBTi committed companies responded to CDPrsquos Investor request to disclose to the Climate Change questionnaire The emissions profile shows that the overall Scope 1+ Scope 2 emissions of SBTi companies responding to CDP represent almost 20 of the total Scope 1+ Scope 2 emissions and 71 of the total Scope 3 emissions in the overall CDP India Investor sample
A greater share of Scope 3 emissions reported by SBTi companies indicate that there is now a greater focus on the Scope 3 GHG Inventory as the companies are planning to set SBTs in coming years As per the SBTi a complete Scope 3 screening or inventory is required for the validation of the SBTs and it is not acceptable to exclude any relevant categories
What is a lsquoScience-Based Targetrsquo
Science Based Targets are the GHG emissions reduction targets consistent with the level of decarbonisation that according to climate science is required to limit global temperature increase to 15- 2ordmC compared to pre-industrial temperature levels
Science Based Target ensures that the company is taking shorter-term action to reduce emissions at a pace that is consistent with keeping warming below 15ordm well-below 2ordm C
SCIENCE-BASED TARGETS AMBITIOUS CORPORATE CLIMATE ACTION
200
128107
74 57 52
United States of America
(USA)
United Kingdom
(UK)
Japan Sweden IndiaFrance
No of Companies
Top 5 countries with SBTi companies
22 28 303
No
of C
ompa
nies 10
22Status of SBTi Companies in India
Committed Target Set
22
A N N U A L R E P O R T 2 0 2 0
CDP India data shows that 33 companies have reported reduction in their gross global emissions (Scope 1 and 2 combined) from the previous reporting year whereas 26 companies have their gross global emissions increased for this reporting year
CDPrsquos data shows that there are 32 companies that are considering setting a SBT in the next two years compared to 29 companies in the previous reporting year There are 11 intensity and eight absolute targets that companies consider to be SBT but this has not been approved by SBTi yet
The increase in these target number highlights that there are more companies which seek to commit to SBTi and get their targets validated in the coming years
Growth in ambition
CDPrsquos five-year data shows a rise in the number of Indian companies committing to the SBTi Their reported emissions increased by 144 due to increased commitment from energy intensive companies this year which includes companies from cement and metal and mining sectors
CDP India investor responding companies
SBTi companies (28 companies respond to CDP)
Emissions Profile (MtCO2e)
6815
134
Scope 1 Scope 2
22282
Scope 3
1259896
NO of Companies
Water Transportation
Professional Services
Textiles Apparel Luxury Goods
Software and Services
Pharmaceuticals and Biotech
Mining - Metals (Iron Aluminium Other Metals)
Food Production - Agricultural Production
Electrical Equipment and Machinery
Electric Utilities and Energy Related
Commercial services and supplies
Air Freight Transportation and Logistics
Food and Beverage Processing
Electric Utilities and IPPs and Energy Traders
Construction Materials
Automobiles and Components
Consumer Products and Durables
Banks Diverse Financials and Insurance
Chemicals
Hospitality
Real Estate
Telecommunications
1
1
3
2
2
2
1
1
1
1
1
1
1
1
2
3
3
2
1
1
6
2
4
1
1
2
3
3
Sectoral Analysis of Indian SBTi companies
Committed Companies Target Set Companies
33
14
Decreased
26
12
Increased
62
Reporting for the first time
1No Change
CDP India investor responding companies
SBTi companies (28 companies respond to CDP)
Comparison of change in gross Scope 1+2 emissions from previous year for SBTi companies vis-agrave-vis CDP reporting
companies
Emission Reduction Targets Reported by Companies in 2020
3
Not SBT not anticipating setting in 2
years
24
8
Not SBT but anticipating setting
in 2 years
4 5
Yes this is SBT approved by SBTi
11 8
Yes this is SBT not approved by
SBTi
Intensity emissions reduction target
Absolute emissions reduction target
No
of c
ompa
nies
23
A N N U A L R E P O R T 2 0 2 0
We witnessed the highest number of SBTi companies responding to CDP India this year which is a 40 growth from last year This further proves that companies are becoming more responsible towards disclosing their GHG Inventory with greater transparency
The graph for the estimated annual carbon savings shows the top three emission reduction initiatives undertaken by SBTi companies reporting to CDP It is evident that over the years low carbon energy purchase and energy efficiency process have gained momentum in reducing GHG emission with an increase in the number of SBTi committed companies implementing these initiatives Maximum carbon savings of 791 MtCO2e have been reported from the cement and concrete sector The metal smelting refining amp forming sector has reported 59237 tons CO2e savings this year with a significant decrease from 70422 tons CO2e savings in the last year There has been a reduction of 443 MtCO2e of estimated annual carbon savings reported by SBTi companies in 2020 as compared to the last year
Data shared by three reporting companies that have also committed to the SBTi (Ambuja Cement Ltd ACC Limited and Ultratech Cement Limited) shows that improving energy efficiency in their production processes has led to cement being the leading sector in reducing GHG emissions
About SBTi
The Science Based Targets initiative champions science-based target setting as a powerful way of boosting companiesrsquo competitive advantage in the transition to the low-carbon economy
It is a collaboration between CDP the United Nations Global Compact (UNGC) World Resources Institute (WRI) and the World-Wide Fund for Nature (WWF) and one of the We Mean Business Coalition commitments
The initiative
bull Showcases companies that set science-based targets through case studies events and media to highlight the increased innovation reduced regulatory uncertainty strengthened investor confidence and improved profitability and competitiveness generated by science-based target setting
bull Defines and promotes best practice in science-based target setting with the support of a Technical Advisory Group
bull Offers resources workshops and guidance to reduce barriers to adoption
bull Independently assesses and approves companiesrsquo targets
Indian SBTi companies responded to CDP Climate Change Investor Program 2020
54
Increase in SBTi companies responding to CDP via 2020 climate Change Investor Disclosure Program compared to previous year
40
Increase in Scope 1+2 Emissions and
Indian SBTi Companies responding to investor request reported reduction in Gross Global emissions compared to previous year
Increase in Scope 3 Emissions covered by SBTi Companies this year as compared to 2019
14450
185
Comparison of Absolute Scope 1+2 emissions (MtCO2e) for SBTi companies reporting to CDP
Emission reported in MtCO2e SBTi companies reporting to CDP
15 16 15 18 20 28
2015 2016 2017 2018 2019 2020
Abso
lute
Sco
pe 1
+2 E
mis
sion
(MtC
O2 e
)
364
8
380
4
479
4
605
5
583
4
142
26
24
A N N U A L R E P O R T 2 0 2 0
Advantages 53
1 Reducing regulatory risks and uncertainties As the government continues to work on implementing the Paris Agreement and meeting the ambition of the country-level pledges Science Based Targets initiative can prove out to be a resilience against the upcoming regulations
2 Strengthening Investor Confidence SBTi can help in strengthening the investor confidence as the investors are highly taking interest in businessesrsquo environmental policies
53 httpssciencebasedtargetsorgblogsix-business-benefits-of-setting-science-based-targets
3 Competitive Edge Companies are getting ahead of their peers by succeeding in the low-carbon transition with increased innovation reduced uncertainty strengthened investor confidence and improved profitability
4 Brand Reputation SBT is a global Initiative which shows robustness confidence and credibility which further helps in building up the brand reputation
Estimated annual CO2e savings of SBTi companies (in lsquo000 tCO2e)
2
Develop Target
3
Submit target for validation
4
Announce Target
1
Commit
Joining Call to Action
We look forward to companies taking action by committing to develop Science-based Targets
68
Energy efficiency Processes
Low carbon energy purchase
Energy efficiency Building services
Estim
ated
ann
ual C
O2e
sav
ings
(in
000
tCO
2e)
60126
2018 2019 2020
124
5184
346
43
7911168
25
A N N U A L R E P O R T 2 0 2 0
Science Based Targets Incubator is a unique project of CDP that was launched in April 2020 with support from MacArthur Foundation amp Shakti Sustainable Energy Foundation in partnership with WWF India to provide technical support with the main objective of handholding and catapulting organisations from commitment stage to target development stage of Science Based Targets Initiative Value Proposition
1 There will be no financial implication on the company
2 Case studies of businesses with validated targets will be shared with the participating companies for peer-to-peer learning
3 Capacity Building workshops and webinars based on recent developments and various other nitty-gritty of SBTi
4 In house trainings and one-on-one meetings with companies where CDP India will explain all stages of the SBTi and provide answers to all the technical queries
26
A N N U A L R E P O R T 2 0 2 0
BUSINESS AMBITION FOR 15degC
lsquoBusiness Ambition for 15degCrsquo is an urgent call to action from a global coalition of UN agencies business and industry leaders Businesses can make a critical contribution to limit the worst impacts of climate change by setting a net-zero target in line with 15degC future57
So far over 300 companies representing more than $36 trillion in market cap have responded to the open letter from global leaders and signed the Business Ambition for 15degC commitment
bull In India 13 companies55 have already aligned and set their target with the most ambitious aim of the Paris Agreement to level global temperature rise to 15degC above preindustrial levels
bull Automobiles and Components and Real Estate are the top sectors that have approved targets aligning with 15degC Ambition
bull In India 13 companies are further committed to Business Ambition for 15degC
bull All the companies in the Real Estate sector from India have approved targets aligning with 15degC Scenario
54 httpssciencebasedtargetsorgbusiness-ambition-for-1-5c55 Mahindra Logistics Ltd Mahindra Heavy Engines Ltd White House Dr Reddys Laboratories Ltd Mahindra EPC Irrigation Limited Swaraj Engines Limited Gromax Agri Equipment
Limited Mahindra Accelo Mahindra Holidays and Resorts India Limited Mahindra Lifespaces Developers Limited Mahindra World City (Jaipur) Ltd Mahindra World City Developers Ltd and Polygenta Technologies Limited
56 httpssciencebasedtargetsorgnet-zero
Net zero a north star for climate action
According to the latest report by the IPCC to limit global warming to 15degC above pre-industrial levels and to avoid the most disastrous impacts of climate change the world must halve CO2 emissions by around 2030 and reach net-zero CO2 emissions by 2050
Companies are increasingly adopting the net-zero climate targets by recognising the importance of keeping global warming to 15degC Between July 2019 and June 2020 over 230 companies committed to reach net-zero emissions as part of the Business Ambition for 15degC campaign an urgent call-to-action for companies to set emissions reduction targets in line with a 15degC future The campaign is led by the SBTi and supported by a global coalition of UN leaders business organisations and NGOs56
27
A N N U A L R E P O R T 2 0 2 0
A carbon price is a cost applied to carbon pollution to discourage polluters Economists agree a carbon price is the single most effective tool for countries to reduce their emissions57 Corporations have been using internal carbon pricing (ICP) as a strategy to manage climate-related business risks and prepare for the transition to a low-carbon economy Carbon pricing policies create strong transparent incentives for firms to internalise the social costs of carbon emissions58 Major investors and financial regulators are calling for businesses to disclose their climate risks and their policies to mitigate emissions59 The most sought-after benefits are that a company can use ICP both as a risk management tool and as a part of its decarbonisation strategy
To see how fast carbon pricing is spreading consider Paragraph 136 of the decision text of the Paris Agreement ldquoproviding incentives for emission reduction activities including tools such as domestic policies and carbon pricingrdquo The final agreement recognised carbon pricingrsquos importance as a powerful incentive to cut emissions by companies and regional state and local governments
The IPCC special report on the impacts of global warming of 15 degC above pre-industrial levels states that an explicit carbon pricing mechanism can theoretically achieve cost-effective emission reductions Along with best practice policies a moderate carbon pricing can help reduce global CO2 emissions significantly60 Parties are encouraged to set prices consistent with Carbon Pricing Leadership Coalitionrsquos
57 What is a carbon price and why do we need one58 Energy the Environment and Technological Change59 Firms ignoring climate crisis will go bankrupt says Mark Carney60 An I P C C Special Report on the impacts of global warming of 15 C above pre-industrial levels and related global
greenhouse gas emission pathways in the context of strengthening the global response to the threat of climate change sustainable development and efforts to eradicate poverty Intergovernmental Panel on Climate Change (2018)
61 Carbon Pricing WBCSD policy paper 2019httpsdocswbcsdorg201909Carbon-Pricing-WBCSD-Policy-Paper-2019pdf WBCSD 2019
62 SHOULD EVERY COUNTRY ON EARTH COPY SWEDENrsquoS CARBON TAX63 httpswwwedienetregistrationregwall
(CPLC) high-level commission on carbon pricing which states that an explicit-price range of US$50ndash100tCO2 by 2030 will be consistent with delivering the Paris Agreement61
Carbon prices have varied widely across existing schemes Success stories such as that of Sweden which currently has the highest carbon price in the world at US$123tCO2 demonstrate that it is indeed possible to make carbon pricing work while the Swedish economy grew by 78 since the introduction of the Swedish carbon tax in 1991 carbon emissions have decreased by 2662 Other countries like The UK
(US$4229) Netherlands (US$3638tCO2) have also committed to increasing their carbon prices in the coming decade63 The worldrsquos top three emitters -- US China and India -- however have put negligible prices on carbon
As part of the lsquoBuild Back Betterrsquo strategy carbon pricing can be a valuable tool
US$123tCO2
Sweden
US$4229tCO2
UK
US$3638tCO2
Netherlands
INTERNAL CARBON PRICEndash ROBUST CLIMATE STRATEGY
28
A N N U A L R E P O R T 2 0 2 0
to guide investment decisions It can help focus on a green stimulus package to recover from the old economy which promotes a carbon-intensive future Different stimulus measures can help clean energy technologies compete with carbon-intensive alternatives and encourage more efficient energy use India is witnessing this momentum ndash a Declaration on Climate Change was signed by 24 key industry captains and Ministry of Environment Forest and Climate Change (MoEFCC) at the virtual India CEO forum on Climate Change on 5th December 2020 Shri Javadekar further said that this declaration by private sector companies voluntarily is a historic step
To guide companies in the implementation of climate-related financial disclosures the TCFD65 developed four recommendations mimicking an organisational structure Governance Strategy Risk Management and Metrics and Targets An ICP is a proposed metric through which entities can safeguard their businesses by internalising market signals The TCFD specifically lists ICP as a key metric to assess climate-related risks and opportunities in line with its strategy and risk management process By attributing a financial cost to risks associated with carbon emissions and translating them into a uniform metric financial decision-makers can integrate transition risks into their business decisions and fill the analysis gap for assets of various time horizons
64 httpnbrienvisnicinViewGeneralLatestNewsaspxId=9829ampYear=202065 httpnbrienvisnicinViewGeneralLatestNewsaspxId=9829ampYear=202066 Implementing the Recommendations of the Task Force on Climate-related Financial Disclosures The Taskforce on Climate-related Financial Disclosures June 2017
Mr Ravi S Prasad Additional Secretary spoke about a coordinating structure for implementation of Paris Agreement which will incorporate internal carbon pricing67
The MoEFCC also constituted a high-level inter-ministerial Apex Committee for Implementation of Paris Agreement (AIPA) in December 2020 under the chairmanship of the Secretary MoEFCCThe purpose of AIPA is to generate a coordinated response on climate change matters that ensures India is on track towards meeting its obligations under the Paris Agreement including its NDC
Senior officials from 14 ministries will serve as Members to AIPA who will oversee the progress in implementation of Indiarsquos NDC and receive periodic information updates to monitor review and revisit climate goals to fulfil the requirements of the Paris Agreement Another key function of AIPA would be to operate as a National Authority to regulate carbon markets in India under Article 6 of the Paris Agreement formulate guidelines for consideration of projects or activities under the article issue guidelines on carbon pricing market mechanism and other similar instruments that have a bearing on climate change and NDCs
It will take note of the contributions of the private sector as well as multi-bi-lateral agencies in the field of climate change and provide guidance for aligning their climate actions with national priorities
ICP will be a useful preparatory tool for future government climate policies
Investors are increasingly demanding comprehensive climate disclosures
It will stay and will be instituted more commonly
A robust carbon pricing system plays an important role in driving
GHG reductions
It complements climate policies for sustained and successful
emissions reductions
It helps make informed decisions and incentivies
low-cost abatement options
Business case for pricing carbon
29
A N N U A L R E P O R T 2 0 2 0
When disclosing on ICP the TCFD recommends that companies should disclose on the followingbull what assumptions are made about how carbon price(s)
would develop over time (within tax andor emissions trading frameworks)
bull geographic scope of implementationbull whether the carbon price would apply only at the mar-
gin or as a base costbull whether the price is applied to specific economic sec-
tors or across the whole economy and in what regionsbull whether a common carbon price is used (at multiple
points in time) or differentiated prices bull assumptions about scope and modality of a CO2 price
via tax or trading scheme
67 httpswwwgreentechmediacomarticlesreadeuropean-oil-majors-ready-to-scale-up-energy-transition-investment68 httpswwwgreenbizcomarticlebp-walks-away-three-us-trade-groups-over-carbon-pricing69 Convention on Biological Diversity ndash Markets for Carbon Offsets Accessible at httpswwwcbdintfinancialoffsetsg-offsetclimatecarbonpdf page 8
Earlier this year BP one of Europersquos oil supermajors announced a carbon price of US$100tonne of CO2 a giant increase from their previous price of US$4067 and walked away from three US-based oil and gas trade organisations - American Fuel and Petrochemical Manufacturers (AFPM) the Western States Petroleum Association (WSPA) and the Western Energy Alliance (WEA) over differences regarding policy positions on carbon pricing68
CDP has been asking companies to disclose their practice of using ICP since 2013 In 2020 23 of the investor responding companies have reported putting a price on carbon as compared to last yearrsquos 19 while the number of companies planning to price in the next two years reduced to 21 from 23 in 2019 After adding Supply Chain responding companies a total of 58 companies are pricing or are planning to price carbon in the next two years in 2020 a 12 increase from 2019 It was further seen that of the 23 companies that are pricing carbon in 2020 52 use a shadow price followed by implicit price
The Task Force defines an internal carbon price as ldquoan internally developed estimated cost of carbon emissionsrdquo which can be used as a planning tool to help identify revenue opportunities and risks as an incentive to drive energy efficiencies to reduce costs and to guide capital investment decisions69
52
26
4
9
44
Shadow price
Implicit price
Implicit price Internal fee
Internal fee
Offsets
Implicit price Shadow price
Types of ICP used by Indian companies
Pricing Planning to price in the next 2 years
2
25
2015
8
36
2016 2017
26
14
2018
14
32
2019
20
31
2020
2533
No
of C
ompa
nies
ICP trend in India
30
A N N U A L R E P O R T 2 0 2 0
Type of ICP Shadow price Carbon fee Implicit price Internal trading
Description Hypothetical cost of carbon emissions
A per-unit fee based on the amount of GHG the company emits (eg `700 per tCO2e)
Helps quantify the capital investments required to meet climate-related targets
Allows business units within a company to trade their allocated carbon credits based on respective emissions
Objectivesusage
The most common form of ICP is a shadow price helps organisations better understand the impacts of climate-related risks such as technological shifts or future regulations It can help a company with both risk management as well as internal strategic planning
It allows companies to model or test how a range of carbon prices affect their divisions capital investments and other planned projects It is similar to forecasting with a range of energy prices
Putting a fee on carbon helps create an actual pool of funds generating a revenue stream to help pave the way for greener projects and further RampD This prepares a company for a carbon-resilient world This tool has the ability to encourage a business to transform into an environmental leader It allows for the creation of internal funds to invest into energy efficiency or renewable energy projects in order to cut energy costs
It also builds awareness of the importance of emission reductions within different business units
An implicit price helps companies understand their initial carbon footprint and is also used as a benchmark to implement a more strategic internal price
Internal trading helps create awareness It allows companies to prepare for stringent forms such as shadow prices or internal fees
Method An additional criterion is introduced in investment analysis during the calculation of the internal rate of return (IRR)
The additional criterion is the carbon value which is incorporated into each investment decision and applied to resulting GHG emissions This carbon price is assumed the same way assumptions are made about exchange rates or commodity prices
It is implemented by voluntarily adding a cost to GHG emissions in relation to operational costs
It increases the operating expenses (OPEX)
There are short-term emissions reductions Transfers of actual funds within the company are done through two mechanisms First by offsetting GHG emissions by purchasing offset credits externally Second by providing internal financing for emission reduction projects low- carbon products amp services and RampD
The carbon fee also provides monetary incentives for pro-environment initiativesactivities
Some companies with emissions reduction or renewable energy targets calculate their lsquoimplicit carbon pricersquo by dividing the cost of abatement procurement by the tonnes of CO2e abated
Trading is driven by the allocation of a fixed number of carbon dioxide emission lsquoallowancesrsquo for individual business units with each allowance equivalent to 1 metric tCO2 If business units exceed their cap they must purchase additional allowances to offset their excess emissions
Where business units under-emit they may sell allowances Business units may also choose to invest in carbon offsets outside their own units in order to sell on the internal trading scheme72
A sectoral analysis of the data finds two high emissions intensive sectors cement and concrete followed by IT and software development An increasing number of companies from cement and IT sectors are now committing to the SBTi and moving towards aligning emissions in line with 15-degree an ICP in such cases can be effectively used as a tool for mitigating climate risks and achieving the greater goal of a SBT or a net-zero target It helps companies build their internal capacity and measure their progress
1313
2626
2222
1313
44 44
1818
Metal smelting refining amp forming
Cement amp concrete
IT amp software development
Biotech amp pharmaFood amp beverage
processing
Chemicals
Transportation equipment
31
A N N U A L R E P O R T 2 0 2 0
Below are the ICP disclosed by Indian companies in 2020
Company Price in INR (`) Price in USD ($) Type of ICP used
ACC 2541 3394 Implicit price Shadow price
Ambuja Cements 21639 3074 Implicit price
Dalmia Bharat Ltd 77334 11 Shadow price
Dr Reddyrsquos Laboratories 937 1332 Implicit price
Godrej Consumer Products Limited 750 10 Shadow price
Godrej Industries 740 10 Shadow price
Hero Motocorp Ltd private private private
Hindustan Zinc 111846 159 Implicit price
Infosys Limited 100182 1425 Implicit price
JSW Cement Limited 1566 21 Shadow price
JSW Steel Ltd 1400 20 Shadow price
Mahindra amp Mahindra 98242 1397 Internal fee
Mindtree Ltd private private private
Shree Cement private private private
Tata Chemicals 140607 20 Shadow price
Tata Consultancy Services 1131 1608 Implicit price Shadow price
Tata Consumer Products Ltd 315 448 Offsets
Tata Motors 980 14 Shadow price
Tata Steel 975 - 2720 15 -3868 Implicit price Shadow Price
Tech Mahindra 70303 10 Implicit price Internal fee
Ultratech Cement 750 1066 Shadow price
Wipro 352291 5011 Shadow price
Since these companies did not provide a conversion rate the average conversion rate for the 2019 calendar year was taken (1` = 0014224USD)
Managing climate risk with Internal Carbon Price and Science Based Targets
By integrating ICP into ambitions targets set by SBT companies can achieve greater emissions reduction SBTs empower companies to engage internal teams with a common data-driven goal and integrate their carbon reduction strategies with other business objectives70 A step that organisations can take to implement TCFD recommendations as well as achieve their SBTs is putting an internal price on carbon It is observed that having an internal carbon price can enhance an organisationrsquos competitiveness71 Several companies are already using ICP to highlight their progress towards targets and inform a business case for low-carbon investments Of the 25 companies that have disclosed to CDP in 2020 13 that committed to SBTi also have an ICP
Setting a carbon price can be a strong commitment towards driving change and action Clear goals for the ICP enable
70 Science-Based Targets How Aligning Carbon Reduction Targets With Climate Science Can Drive Business Growth SampP Dow Jones Indices 201771 httpswwwgreenbizcomarticlemanaging-climate-risk-carbon-pricing-and-science-based-targets72 CDP Handbook on Carbon Pricing73 httpswwwcdpnetenreportsdownloads491874 httpsb8f65cb373b1b7b15feb-c70d8ead6ced550b4d987d7c03fcdd1dsslcf3rackcdncomcmsreportsdocuments000002771originalCDP-Carbon-Pricing-Handbook
pdf1508927220
companies to make better decisions regarding the type and price of carbon72 A high-level commitment can provide a companyrsquos perspective and insight on how other companies have been able to adopt innovative financing practices such as ICP and carbon taxes which are spurred by setting ambitious targets in line with the SBT initiative
In January 2020 in partnership with TERI CDP India released a second handbook in ICP - Putting a Price on Carbon A Handbook for Indian Companies 20 73 a second edition to the handbook released in October 17 74The first handbook was prepared to lay out the landscape of carbon pricing and help companies understand about external and ICP along with guidance on how to approach an internal carbon price The aim of the second handbook was to further mobilise the adoption of internal carbon price by companies The handbook discusses steps to arrive at a price and use it in an organisation including details on indicative pricing levels
32
A N N U A L R E P O R T 2 0 2 0
ACC Ltd are using internal carbon price as a tool to drive and incentivise low-carbon initiatives and emissionenergy reduction projects We have observed that ICP helps ROI to look attractive and helps us make informed decisions
ACC Ltd has already committed and published their 2030 targets for specific CO2 emission reduction and use of waste derived resources (as a part of SD 2030 plan) We have also committed to SBTi and are working on setting stricter targets aligning with below 2 DS To achieve these commitments and relevant targets we believe that ICP may play an important role in prioritising our future actions and investments Going forward we also plan to use the ICP for managing risk and leveraging opportunities
mdash ACC Ltd
Steps to Setting an
internal carbon price
Make a commitment
Communicate your progress
Set the scope of the internal carbon price
Decide price level and variance
Monitoring and reporting
Define the type of ICP
01
02
03
0405
06
07
08
Map your objectives
Establish the degree of influence in business application
33
A N N U A L R E P O R T 2 0 2 0
THE RENEWABLE ENERGY THRUST In 2020 the 67 companies headquartered in India have reported a total of 291 Terra Watt hours (TWh) electricity consumption more than double the previous yearrsquos number Notably the significant increase in total electricity consumption is attributed to just one company ndash Vedanta Limited with 151 TWh of electricity consumption for its global operations
The total electricity consumption excluding Vedanta is 140 TWh 48 higher than the previous year The rise in the total reported electricity consumption is primarily due to an increase in the number of responding companies from the energy intensive sectors These 67 companies have consumed about 16 TWh renewable electricity which is 6 of the total electricity consumption reported in 2020 The share of renewable electricity is 11 without counting Vedanta in the sample This is 6 higher than the previous year
The growth in the share of renewable electricity consumption is due to multiple factors such as the increasing number of voluntary corporate GHG emission reduction targets renewable energy targets and compliance targets such as Renewable Energy Purchase Obligations (RPO) In 2020 18 companies from India have reported various types of renewable energy targets Some of these companies have taken more than one renewable energy target type These 18 companies have reported 98 TWh of electricity consumption of which 13 is from renewable energy sources The level
Type of renewable energy targets
Renewable Energy Targets
17
1 1 2Renewable Electricity
Consumption
Renewable Electricity
Production
Renewable Electricity Capacity
Renewable Energy Financing
Target
No
of C
ompa
nies
RE100 is the global corporate renewable energy initiative bringing together hundreds of large and ambitious businesses committed to 100 renewable electricity Led by the Climate Group and in partnership with CDP RE100rsquos mission is to accelerate change towards zero carbon grids at scale There are 4 companies headquartered in India that have committed to the RE100 initiative - Dalmia Bharat Ltd Infosys Ltd Mahindra Holidays amp Resorts India Ltd and Tata Motors Ltd
The RE100 membership continues to grow and diversify - with 42 of new members coming from the Asia-Pacific region in 2020 With 260+ members and gt278 TWh of electricity consumption aggregated electricity demand of RE100 members is higher than Australiarsquos The share of renewable electricity is 42 of total consumption showing strong progress towards 100 goal
Over 70 global RE100 members have operations in India ndash with gt2 TWh of electricity consumption in the country About 39 of electricity consumed in India came from renewable energy sources largely sourced through unbundled energy attribute certificates and power purchase agreements
Visit RE100org and follow RE100 on Twitter
34
A N N U A L R E P O R T 2 0 2 0
Note Some companies have reported renewable electricity consumption total instead of break-down details as per the sourcing method Data for those companies is not included in the above chart
131
17
03
01
Renewable Electricity Sourcing Methods (TWh)
Self-generation
Unbundled Energy Attribute Certificates (EACs)
Power Purchase Agreement (PPA)
Green Electricity Products
of ambition ie a share of renewable energy in the target year for most of the companies varies between 20-100 Showing the leadership in renewable electricity sourcing 3 companies75 have committed to source 100 renewable electricity across their operations and joined RE100 initiative
GHG emission reduction targets are popular among companies in India and 57 companies have reported absolute intensity or both absolute and intensity targets Among these 30 companies have committed to science-based targets Initiative and their targets are in line with climate science Six companies have dedicated scope 2 emission reduction targets Scope 2 emissions are indirect emissions from the generation of purchased energy consumed by the reporting company Companies with GHG emission reduction targets tend to source renewable energy to reduce their emissions primarily scope 2 emissions The Majority of these companies have taken exclusive renewable energy targets to support meeting their GHG emission reduction targets
Renewable energy plays an important role in the corporate value chain due to its zero-carbon intensity and ability to provide long-term energy security About 34 companies have identified opportunities related to shifting energy usage towards low-carbon energy sources across the value chain Of these 32 have identified opportunities in the direct operations followed by 6 companies in the upstream and 2 in the downstream of the value chain These companies have estimated energy related opportunities worth `317 billion mainly in the direct operations Half of these companies anticipate short time frame (1-5 years) to tap these
75 4 India headquartered companies are committed to the RE100 initiative 3 of them report to CDPrsquos climate questionnaire
opportunities Companies have not just identified energy related opportunities but implemented energy related initiatives in the reporting year across their operations About 31 companies have implemented low-carbon energy consumption or production related initiatives in the reporting year that resulted in an estimated annual carbon savings of 18 million tCO2 and `27 billion of annual monetary savings
Companies from the manufacturing and materials sectors have reported the highest volume -14 TWh of renewable electricity consumption Manufacturing sector companies are relatively performing better than companies from the materials sector in terms of the share of renewable energy in total electricity consumption There are 25 companies from these two sectors mainly energy intensive business such as cement metals and mining steel and transport original equipment manufacturers (OEMs) The aggregate electricity consumption of these companies is over 100 TWh The companies from the fossil fuel-based energy generation are not included in the following charts
A detailed breakdown shows that self-generation of renewable electricity is the most preferred sourcing option among companies followed by purchase of renewable electricity through unbundled Energy Attribute Certificates (EACs) and Power Purchase Agreement (PPA) with an onsiteoffsite generator Up to 10 companies have reported 03 TWh of total renewable electricity consumption via PPA (on-grid and off-grid) which has declined from 11 TWh of consumption reported in the previous year
35
A N N U A L R E P O R T 2 0 2 0
Materials Manufacturing Food beverage amp agriculture
Biotech health care amp pharma
OtherInfrastructureServices
3
17
6
35
3
20
12
Total Electricity Consumption (TWh) Total RE Consumption (TWh) RE
Electricity consumption by sector with Vedanta Limited included in the analysis
Electricity consumption by sector excluding Vedanta Limited
Materials Manufacturing Food beverage amp agriculture
Biotech health care amp pharma
OtherInfrastructureServices
7
17
35
20
1236
Total Electricity Consumption (TWh) Total RE Consumption (TWh) RE
TWh
TWh
36
A N N U A L R E P O R T 2 0 2 0
2737worth opportunities
identified
Billion
`
16of Renewable Electricity Consumption Reported
TWh
704of total [ Scope
1+2location-based] emissions reported
MtCO2e
7138Inherent financial
risk identified
Billion
`
25have Internal Carbon
Pricing
Companies 52Companies in India
SBTi
37
A N N U A L R E P O R T 2 0 2 0
WATER SECURITY The way out of water crisis
Five of the worldrsquos largest cities under water stress are in India with Delhi ranked second on the list76 The water crisis is more alarming than imagined ndash 600 million people in India face high-to-extreme water stress77 Indiarsquos water demand is projected to increase by two times the available supply by 2030 putting hundreds of million people at the risk of water scarcity and ultimately losing the country 6 of its GDP78 In 2019 the country witnessed the worst droughts in recorded history Over 500 million people were affected across the country and major cities such as Chennai experienced lsquozero dayrsquo scenarios wherein water literally ran out Since improvements in water security are essential for Indiarsquos development investing in water merits a sound business case
Though 80 of Indian states have legislations on water conservation and prevention of encroachment of water bodies79 poor data management absence of water pricing inefficient irrigation techniques and the lack of adequate sewage treatment curb the countryrsquos ability to manage water sustainably80 In recent times companies have become more aware of the risks of increased water consumption pollution and unstable precipitation aggravated by climate change81 A 2019 World Bank Report (Quality Unknown)82 warned of the economic health and environmental damage caused by contaminated water highlighting water quality as an ldquoinvisible crisisrdquo that is under-appreciated and underestimated It warned that poor water quality driven by industrial agricultural and urban pollution could lead to a reduction by 13rd of economic growth in some places
76 httpsocialnitigovinuploadssamplewater_index_report2pdf77 httpsnitigovinsitesdefaultfiles2019-06Final20Report20of20the20Research20Study20on2020
Composite20Water20Resources20Management20Index20for20Indian20States20conducted20by20Dalberg20Global20Development20Advisors20Pvt20Ltd_New20Delhipdf
78 httpsnitigovinsitesdefaultfiles2019-06Final20Report20of20the20Research20Study20on2020Composite20Water20Resources20Management20Index20for20Indian20States20conducted20by20Dalberg20Global20Development20Advisors20Pvt20Ltd_New20Delhipdf
79 httpsocialnitigovinuploadssamplewater_index_report2pdf80 httpswwwcdpnetenarticlescompaniesindias-looming-water-crisis-a-call-to-action-for-companies81 Think globally act locally new guidance for companies on sustainable water use - CDP82 httpsopenknowledgeworldbankorghandle109863224583 httpswwwwriorgaqueduct84 Aqueduct Country Ranking (wriorg)85 The objective of the campaign is to drive further corporate transparency around climate change deforestation and water
security by encouraging companies to respond to CDPrsquos disclosure request
Water stress in India remains a key challenge Aqueduct83 ranked India 13th in the world on high water stress score -- 412 out of 584 The private sector is vital to delivering a water secure future Companies in the food textile retail energy industrial chemicals pharmaceuticals and mining sectors account for and wield influence over 70 of the worldrsquos water use and pollution The decisions one takes about how to grow and expand can make or break onersquos ability to tackle the global water crisis
CDPs Water Security program requests companies to disclose critical information on water parameters which are crucial to the business It helps companies monitor and benchmark their performance on these critical parameters to ensure adequate water availability for their businesses Investors and customers are increasingly keen to know how companies respond and adapt to water-related risks The Non-Disclosure Campaign (NDC) is an annual CDP initiative where investors can target companies that have been requested to respond but failed to do so85 Globally for water security Indian companies achieved the highest response rate to the NDC campaign with 50 of engaged companies submitting a response on this critical issue ndash 28 times higher than their control group Responding through CDPrsquos Water Security questionnaire will help businesses understand the risks and opportunities associated with water-related issues
Reduction in Economic Growth caused by power water in some countries
13rd
Water stress by 2030-ratio of withdrawals to renewable supply
People will live in water stress area by 2030
Increase in water demand in last 100 years
WRI 2020
UNEP
UN World Waterdevelopment Report 2020
increase in Water Security investor responding companies in India
8756
1in 2
x6
38
A N N U A L R E P O R T 2 0 2 0
helping them capitalise on actions to safeguard water resources86 The number of disclosing companies increased from 15 last year to 28 companies this year an increase of approximately 87
Measuring Monitoring and Verification
Regular measuring and monitoring of water-related parameters across all operations and the entire value-chain is the first step in laying the path for efficient water management In 2020 28 companies measured a total of 268 water related parameters It was found that amongst volumetric water metrics water discharge was the most monitored accounting for 41 of all measurements Water withdrawals accounted for 29 of all measurements water consumption for 10 and water recycling and reuse accounted for 10 each Although these metrics were being continuously monitored and measured by companies a sector-wide analysis shows that significant growth in some water-intensive sectors has put pressure on the demand for industrial water The electric utilities sector for example reported an increased water demand of 771174 megalitres in 2020 which was the highest amongst all sectors Adani Power Ltd highlighted new aqusitions and increased power generation as major reasons for rise in water demand this year The chemicals sector showed the second highest rise in water demand this year -- 195832 megalitres this year
Some companies have shouldered the responsibility of having audits conducted on their reported water metrics for greater
86 httpsb8f65cb373b1b7b15feb-c70d8ead6ced550b4d987d7c03fcdd1dsslcf3rackcdncomcmsreportsdocuments000000893originalCDP-india-business-case-for-water-disclosurepdf1472051621
87 https6fefcbb86e61af1b2fc4-c70d8ead6ced550b4d987d7c03fcdd1dsslcf3rackcdncomcmsreportsdocuments000005312originalAnalysis_of_CA100__Data_for_CDP_Investor_Signatories_v5pdf1596046258
88 https6fefcbb86e61af1b2fc4-c70d8ead6ced550b4d987d7c03fcdd1dsslcf3rackcdncomcmsreportsdocuments000005312originalAnalysis_of_CA100__Data_for_CDP_Investor_Signatories_v5pdf1596046258
89 https6fefcbb86e61af1b2fc4-c70d8ead6ced550b4d987d7c03fcdd1dsslcf3rackcdncomcmsreportsdocuments000005312originalAnalysis_of_CA100__Data_for_CDP_
transparency and credibility Amongst the verification standards that were employed 26 of the responding organisations used ISAE 3000 with Tata Chemicals being the sole company to apply both ISAE 3000 and AA1000AS to meet assurance standards
In 2020 25 responding companies withdrew consumed and discharged 7933064 megalitres 1403171 megalitres and 6625032 megalitres of water respectively However in 2019 these figures stood at 217736 megalitres 860517 megalitres and 67686 megalitres respectively for 15 responding companies
WATER ASPECTSWater Consumptionndash the amount of water a company has drawn into its boundaries and has permanently removed from the local water cycle90
Of the 28 respondents three did not disclose water consumption data or were in their first year of measurement 9 increased their water consumption over the previous reporting year 12 decreased it and 4 reported no change
Water Withdrawalsndash the amount of water the company has temporarily removed from the local water cycle and returned as discharge water91
Of the 28 respondents three did not disclose water withdrawal data or were in their first year of measurement 7 reported an increase over the previous year 14 had lowered their withdrawal and 4 reported no change
Water Discharges ndash the amount of water that leaves a companys facility and if left untreated could be a source of pollution92
Of the 28 respondents three did not disclose water discharge data or were in their first year of measurement 9 reported an increase in water discharge over the previous year 6 lowered it and 10 reported no change CDPrsquos data highlights new acquisitions increased production activities and project expansions as the primary reasons for increased water demand amongst the companies
of companies measured all water aspects (withdrawals discharge and consumption) across 100 of facilities
64
of companies believe that availbility of good quality freshwater is vital for the success of their business39
2910
4110
10
Water withdrawalsWater recycledreused
Water discharge
Water consumption
Others
Measured and monitored water aspects
39
A N N U A L R E P O R T 2 0 2 0
Data further shows that brackish surface water and seawater were the primary water sources for industries followed by fresh surface water source The electric utilities sector was the most reliant on brackish surface water and seawater accounting for 72 of the sectorrsquos total water withdrawals At 59 fresh surface water was the primary source of withdrawal for the chemicals sector Of the 28 companies 13 had implemented water conservation measures to reduce water withdrawals from groundwater sources this year Water withdrawals from groundwater - renewable accounted for less than 05 of total withdrawals
In terms of water discharge most (81) was released into brackish surface water and seawater environments Discharges into fresh surface water accounted for the remaining 19 of the total discharges Our data suggests more companies are installing zero liquid discharge units and water harvesting techniques across their facilities leading to less groundwater discharge
Fresh surface water accounted for 29 of total water withdrawals by source in 2020 Indiarsquos major river basins - Ganges Brahmaputra Godavari Indus and Cauvery are the primary source of freshwater for the industries Around 15 of total freshwater demand from CDP responding companies was supplied by the
Investor_Signatories_v5pdf159604625890 Worldrsquos 18 Most Water-Stressed Rivers | World Resources Institute (wriorg)
Ganges and Brahmaputra river basins another 15 came from the Godavari basin followed by Cauvery Indus Banas and Sabarmati river basins The demand for water has increased over the years causing these basins to rank among the most water-stressed catchments in the world90 Of the 83 facilities in India 53 were in water-stressed regions Our data shows that around 60 of total responding companies withdrew water from water-stressed regions Of these nine were from the materials industry and two were from the food beverage amp agriculture industry
Governance and Business Strategy
For a long time corporate sustainability strategies have focused on measurable and manageable challenges such as product footprint efficiency in supply chain water conservation and others Businesses have begun to take stock of water security by innovating for improved efficiency measuring direct withdrawals assessing risk to neighbours and considering leakages
CDPrsquos data shows that corporate leaders across India are responding to this crisis by focusing on their water policy to monitor risks and opportunities and integrate it in their strategies Around 71 companies report having a documented water policy that is accessible to the public Up to 93 companies indicated that they have a board-level oversight of water related issues within the organisation observed either by the Chief Executive Officer (CEO) or the director on board followed by the board-level committee
Around 43 of the responding companies report on water-related issues quarterly and 33 more frequently This shows the increasing self-awareness among companies on water-related issues Further 63 of these companies offer some form of
facilities out of a total of 83 from the responding companies were in areas with water-stress53
Water discharge by destination
Brackish surface
water and Seawater
Fresh surface water
Groundwater
Third party
532
225
2
975
156
93
Water discharge (megalitersyear)
125
013
1
Brackish surface
water and Seawater
Groundwater ndash non
renewable
Groundwater ndash renewable
ProducedEntrained
water
Third party
Fresh surface water
231
800
261
04
405
21
489
Water withdrawals (megalitersyear)
Water withdrawals by destination
7564
662
6
No
of c
ampa
nies
Industry
1
Appa
rel
1
Biot
ech
hea
lth
care
amp p
harm
a
1
Man
ufac
turin
g
2Fo
od b
ever
age
amp ag
ricul
ture
1
Pow
er
gene
ratio
n
1
Tran
spor
tatio
n se
rvic
es
1
Serv
ices
9
Mat
eria
ls
Industry-wise water withdrawals from water-stressed areas
40
A N N U A L R E P O R T 2 0 2 0
incentive to their employees ndash monetary or otherwise -- for the management of water related issues
Businesses are stepping up and playing a vital role in developing water initiatives that can ease the stress on crucial watersheds Companies are also looking into water security related long-term business objectives and financial planning as a part of their overall business plans Almost 70 companies prefer short to mid-term (5-10 years) over long-term (11-30 years) planning This does not come as a surprise as water effects are felt locally and require more immediate strategic planning Of the 28 reporting companies 12 use climate-related scenario analysis to inform its water-related business strategy and eight anticipate doing so in the next two years A majority of these companies belong to the chemicals and the electric utilities sector
In 2019 about 13 companies were pricing their water this increased in 2020 to 18 and 50 are now exploring the its possibilities Companies such as Ambuja Cement (US$110 `7800
91 marico-sustainability-report-18pdf
Marico Ltd Establishing a strategy to improve water-security across operations and value chain
With a host of agro-based products water availability is a crucial parameter for Marico Ltd92 Under the risk management framework it has identified adverse impact of water scarcity as an environmental risk to the company To mitigate this environmental risk the company has initiated watershed management programs and a reduced-reuse-recycle model of water management across its operations Through a water stewardship program the company aims to address water security challenges in low rain-fed areas around its workplace and factories
In the reporting period FY 19-20 the company withdrew 202886 cubic meters of water and reported a reduction of 9 from previous year The company had reported a reduction of 31 in water intensity from the 2014 level through the company-wide introduction of water efficiency measures improvements in water recycling water-efficient taps and rainwater harvesting systems For improving water management practices across water stress areas Marico utilised the WRI aqueduct tool to evaluate water risk across all manufacturing facilities in India This tool helped the company identify the number of facilities that fall under the water stress area -- according to it five out of eight plants are in such zones The implementation of water conservation initiatives had helped three water-stressed sites reduce water consumption over the previous year Among three water-stressed sites Jalgaon reported 15 reduction in water consumption Baddi reported 16 and Paonta 28
Establishing a strategy to reduce and minimise water use was one of the companys key commitments Marico foresees its future water withdrawal levels reducing given its move towards improving water efficiency and incorporating recycling throughout the production cycle
Frequency of reporting on water-related issues
633
43
Annually
More frequently than quarterly
Quarterly
6
10 2Half-yearly
As important matters arise
Less frequently than annually
41
A N N U A L R E P O R T 2 0 2 0
to US$8240 `579800 per megalitre) Dr Reddyrsquos Laboratories (US$088`67 to US$591`449 per KL) Piramal Glass and Tata Steel use an internal price on water
Risks amp opportunities
Dwindling water supply is a major cause of concern for businesses since it poses significant direct and indirect impacts Visible risks such as droughts have a more explicit impact as they ruin vegetation and severely undermine the agriculture sector But subtle impacts present challenges to other sectors Water shortages also threaten the long-term viability of businesses by leading to higher costs eventually borne by the consumers Without proper management the economic repercussions of water scarcity will be felt in myriad ways92
In 2020 companies that experienced detrimental water-related impacts have incurred financial losses worth `1580 million Physical risks such as inadequate infrastructure and increased water stress account for more than half of these commercial losses followed by reputational-cum-market like subpar access to water sanitation and hygiene services and regulatory risks eg- failure to set mandatory water efficiency conservation and recycling standards Corporations should thus strategically prioritise dealing with these risks to safeguard their financial bottom lines For this organisations have looked to secure alternate sources of water supply adopt water efficiency and conservation practices as well as reuse and recycling of water
A 2018 report from NITI Aayog93 highlighted the fact that the country faced its worst water crisis that year Rising water challenges have put strong regulatory pressure on businesses in India with significant operational risks The private sector is a big contributor towards deepening water security issues but is also crucial in addressing it
Given the current situation with water resources it is perhaps unsurprising that many of the companies responding to CDP find themselves exposed to a plethora of physical and transition risks ndash that is risks from regulatory or consumer reforms aimed at addressing the water crisis These risks threaten their reputation and license to operate their supply chains security financial stability and their ability to grow As per CDPrsquos Global Water
92 httpsglobalriskinsightscom201612economic-cost-global-water-scarcity93 httpsnitigovinsitesdefaultfiles2019-06Final20Report20of20the20Research20Study20on2020Composite20Water20Resources20Management20Index20
for20Indian20States20conducted20by20Dalberg20Global20Development20Advisors20Pvt20Ltd_New20Delhipdf94 https6fefcbb86e61af1b2fc4-c70d8ead6ced550b4d987d7c03fcdd1dsslcf3rackcdncomcmsreportsdocuments000005165originalCDP_Global_Water_Report_2019
pdf159110644595 The term WASH refers to the provision of water sanitation and hygiene Universal affordable and sustainable access to WASH is a key public health issue within international
development and is the focus of the first two targets of Sustainable Development Goal 6 (SDG 6)96 httpswwwworldbankorgentopicwaterbriefwash-water-sanitation-hygiene-and-covid-19
Report 201994 the combined business value at risk reported in 2019 topped out at US$425 billion with about 40 of the risks anticipated to hit within the next 1-3 years Whether it was the blockading of a Newmont Goldcorp mine in Mexico or poor water quality threatening the production of Unileverrsquos Hellmannrsquos mayonnaise in the Mississippi River Basin the impacts of the global water crisis are already being felt
Water risks and risk assessment
As per the 2020 data 71 of the responding companies consider current or future water-related regulations as a risk to business followed by 57 companies that consider access to WASH95 services for employees as very relevant and always included in their water-risk assessments This shows that companies are vigilant about providing safe access to drinking water sanitation arrangements and proper hygiene at workplace The COVID-19 pandemic has highlighted the importance of WASH to human health and well-being Safely managed WASH services along with good hygiene practices can help prevent infectious diseases that kill millions each year96 In addition 50 companies reported that water used for their key commoditiesraw materials is relevant enough to be considered for their risk-assessment This was the most pertinent for chemical sector companies
of the 28 Indian responding companies undertake water-related risk assessment25
Total financial loss by reporting companies as per risk type
38
53
9
Reputation and Market Risk
Physical Risk
Regulatory Risk
1580 MILLION
In 2020 companies that experienced detrimental water-related impacts have incurred financial losses worth
1580 million
42
A N N U A L R E P O R T 2 0 2 0
It is crucial to consider stakeholders in risk assessment procedures for a comprehensive understanding of water-related risks Of the 25 companies that undertake water-related risk
97 httpswwwweforumorgreportsthe-global-risks-report-2020
assessments 68 always include employees in their internal assessment procedures by conducting training and awareness programs on water conversation initiatives communicating water-related policies etc This is followed by regulators and local communities who are relevant in water-risk assessment procedures at 61 and 54 respectively for the responding companies It is a positive sign that Indian companies are engaging with their employees and local communities and ensuring that the latter are not negatively impacted in terms of habitation health and water availability
According to The World Economic Forumrsquos Global Risk Report 202097 water crises are among the top five risks in terms of impact for the past ten consecutive years Water-related risks are substantive in the risk assessment processes and identified as a threat to companiesrsquo bottom line putting at risk a combined business value of US$425 billion according to CDP 2019 data
RegulatoryPhysical
Reputational
Risk due to company
Risk due to context
Expectedunexpected change or uncertainty in law or regulation
Water scarcity too much water water
unfit for use
Litigation product risks due to changes in
consumer behavior
Caused by inefficient operations produces and services resulting in water pollution over exploitation etc
Caused by changing environmental and social conditions like droughts
flooding etc
Relevancy of water-related risks
7157 57 50 46 46 43
11
Water-related
regulatory frameworks
Access to fully-
functioning safely
managed WASH
services for all employees
Water availability at a basincatchment
level
Implications of water on
your key commoditiesraw materials
Stakeholder conflicts
concerning water
resources at a basincatchment
level
Water quality at a basin
catchment level
Status of ecosystems and habitats
Other contextual
issues please specify
Empl
oyee
s
Regu
lato
rs
Loca
l com
mun
ities
Rive
r bas
in m
anag
emen
t au
thor
ities
Wat
er u
tiliti
es a
t a lo
cal l
evel
Stat
utor
y sp
ecia
l int
eres
t gr
oups
at a
loca
l lev
el
Inve
stor
s
Supp
liers
Oth
er w
ater
use
rs a
t a
basi
nca
tchm
ent l
evel
Oth
er
NG
Os
Cust
omer
s
No of Companies age of Companies
Relevancy of stakeholders in water-risk assessment
6861 54 50 50 46 46 39 36 32 2918
43
A N N U A L R E P O R T 2 0 2 0
Water risk event
Impacting business
Increased Operational amp maintenance Costs Increased Compliance amp
Administration Costs
Closure of Operations
Supply chain distributions
Brand Damage and LitigationsShareholder
Distributions
Risk transferRisk avoidance and mitigation
Technological Risks
Repurational amp Market Risks
Regulatory Risks
Physical Risks
Financial ImpactsResidual Water RiskInherent Water Risks
Increased water stress
143721Increased water scarcity
41105Drought
17604Inadequate infrastructure
820
Physical Risks
Ecosystem vulnerability
300Severe weather events
69Declining water quality
63Flooding
13
Regulatory Risks
Technology Risks
Higher water prices Transition to
water intensive low carbon energy sources
Tighter regulatory standards
2333
120
All the figures reported are in million rupees
44
A N N U A L R E P O R T 2 0 2 0
CDPrsquos data shows that physical risks seem to have the highest magnitude of impact on the Indian responding companies Drought is seen to be the primary driver of potential substantive impact
Where there is risk there is opportunity
Where therersquos risk therersquos reward Industrial wastewater for example is a vast untapped resource It is a potential source of heat power process water and high-value materials And there has never been a better time for this transformation to take place -- technologies are better the regulatory climate is favourable and the business case is clear Meanwhile the market demand for pollution-free products is growing For companies to thrive they will need to be aligned to changing consumer demands If
98 httpswwwmarketsandmarketscomMarket-Reportssmart-water-management-market-1265html
they respond to these opportunities then market differentiation resilience and profitability are on the table
Globally corporate leaders have started realising the untapped potential of smart water technology and the market for smart water management is anticipated to grow from US$846 billion in 2016 to US$2010 billion in 202198 Industrial wastewater has for a long time been reused for cooling towers steel works oil refineries textile manufacturing and paper production It was found that 15 of the 23 companies valued improved water efficiency in operations as their primary opportunity having a substantive financial or strategic impact on business
of the 28 responding companies (approx 93) identified water-related opportunities in their business26
Improved water efficiency in operations
Increased resilience to impacts of climate change
Reduced impact of product use on water resources
Improved community relations
Water recovery from sewage management
Resilience to future regulatory changes
Sales of new productsservices Increased brand value
3000million
`4000
million18752
million
opportunities were identified by 21 respondents
opportunities were identified by 11 respondents
opportunities were identified
by 9 respondents
opportunities were identified
by 4 respondents
Efficiency Resilience Products and services
Markets
22
14
10
4
`329
million
`
`
45
A N N U A L R E P O R T 2 0 2 0
26
17
14
17
2
Others
Recyclingreuse
Consumption
Product water intensity
Discharge
14
10Withdrawals
Water use efficiency
Categories of water targets monitored at the corporate level
of companies set company-wide water targets
of companies set company-wide water goals
5556
Businesses have identified transparency in water management issues as a fundamental activity and disclosure through CDPrsquos annual water questionnaire produces a standard comparable dataset McGill University and Millani found that companies disclosed through CDP ranked 19 percentiles better than the average business in their ability to access capital99 The research showed that a comprehensive voluntary disclosure produces a quality management team with enhanced awareness of threats and opportunities linked to climate and environmental change
Targets and Goals100
In response to declining water resources many companies have started engaging in water stewardship and setting water targets aligned with SDG Goal 6 to ensure availability and sustainable management of water sanitation and hygiene facilities for all101 Developing water-related targets helps companies make meaningful change from informed actions at the local level102 In 2020 four companies did not set water-related targets within their operations Whereas 24 companies had water-related targets 26 of them had set targets for product water intensity 17 set recyclingreuse targets and 14 focused on water use efficiency
Companies can set goals and targets on a range of operational issues to drive performance andor manage risks and opportunities CDPrsquos data shows that a majority had set targets at the company-wide level -- 55 of responding companies reported setting water targets across the company This was followed by 26 who set water targets at the business level and 19 at the site or facility level While setting water goals around 56 of companies monitored their goals at the company level 24 at the sitefacility level and the remaining at the basin business or country-level
99 Craig M Coulombe E Nostrat A 2019 The Role of CDP Disclosure to Improve Access to Capital Research Note httpsf01c8ee6-cac3-40ff-a0e4-8bfb54f2b88bfilesusrcomugd66e92b_30b06fd11b9c43d88428f768676e9a8bpdf
100 Targets ndash quantitative Goals - qualitative101 httpsunstatsunorgsdgsreport2020goal-06102 httpsceowatermandateorgsite-targets-guide
A company has various drivers for setting goals and targets and it tries to align these with increased stakeholder concerns and environmental legislation Data shows that most organisations considered reducing environmental impact and risk mitigation as the primary motivation for monitoring water goals and targets Organisations also considered brand value protection as one of the important factor while setting goals
24
4
Target Set No Target
No
of C
ompa
nies
Water targets monitored at the corporate level
46
A N N U A L R E P O R T 2 0 2 0
Drivers behind setting water targets and goals at the corporate level
Reduced environmental impact
Water stewardship
Risk mitigation
Recommended sector best practice
Corporate social responsibility
Brand value protection
Cost savings
Shared value
Climate change adaptation amp mitigation strategiess
Commitment to the UN SDG
Increase freshwater availability for users
Other drivers
45
14
14
2
2
2
5
14
16
12
161212
12
4
4
4
44
GoalsTargets
age of Companies
47
A N N U A L R E P O R T 2 0 2 0
PROTECTING OUR FOREST WEALTH
The world lost an estimated 10 million hectares of forest annually between 2015 and 2020104 Protecting and restoring forests and other natural ecosystems could provide up to 30 of climate change mitigation action needed to limit global warming to below 20C by 2030105
Global demand for agricultural commodities is the primary driver of deforestation and ecosystem conversion -- timber is extracted unsustainably and land is cleared for agricultural production This represents major risks to businesses as commodities associated with deforestation such as palm oil soy cattle and timber products are the building blocks of millions of products traded globally and therefore feature in the supply chains of numerous organisations
103 httpswwwipccchsrccl104 The State of the Worldrsquos Forests 2020 Forests biodiversity and people105 httpswwwpnasorgcontent1144411645106 httpsappsfasusdagovnewgainapiapiReportDownloadReportByFileNamefileName=Oilseeds20and20
Products20Annual_New20Delhi_India_04-01-2020
The unsustainable production and supply of these commodities and activities not only poses a significant business risk but also has a severe negative impact on the environment especially the climate crisis
Deforestation is fundamentally linked to climate change According to the IPCC Special Report on Climate Change and Land (2019)103 11 of global GHG emissions are from deforestation and from the conversion of natural ecosystems for human use
At an 8 annual growth rate edible oil consumption in India is growing faster than the 3 growth rate in production Imports and imports are rising to fill the gap As a result India still is the largest importer of edible oils followed by China European Union and the United States Indiarsquos edible oil imports in MY 202021 are predicted to rise 6 to 15 MMT of this 85 MMT will be palm oil 35 MMT soybean 28 MMT sunflower seed oil and 02 MMT rapeseed (canola) oil
-United States Department of Agriculture106
In 2020 three Indian companies responded to CDPrsquos forests questionnaire -- one responded to the request for disclosure from investors while two responded to their customers Globally 687 companies responded to CDPrsquos forests questionnaire and 57 of them evaluated deforestation-related risks at US$5312 billion
13The mitigation potential of reduced deforestation is
13 of the global emissions
We cant address climate change without protecting our forests
They are vital carbon stores that help reduce global warming
48
A N N U A L R E P O R T 2 0 2 0
Disclosure on deforestation management through CDP could be a significant opportunity for companies operating in India one of the largest importers of palm oil in the world This can help Indian companies tap into lucrative opportunities by scaling sustainable trends CDPrsquos forests questionnaire allows companies that produce source or use palm oil soy timber cattle cocoa coffee and rubber to disclose Moreover new biodiversity-focused metals amp mining and coal sector questionnaires were introduced in 2019
Palm oil is the most commonly used processed oil in industrial food production with its production being responsible for 5 of global tropical deforestation107 Indiarsquos palm oil imports account for nearly 23rd of its total imports of edible oil This demand was shaken in 2020 when the pandemic hit with a 40 fall in the consumption of palm oil during the lockdown108 Indiarsquos imports which account for nearly 20 of the global trade in palm oil will have a major effect on efforts to make its production and processing sustainable The primary barrier for sustainable palm oil consumption in
India stems from it belonging to a more price-sensitive and volume driven market making environmental impacts a low or non- existent priority in the minds of consumers
Climate change can reduce palm oil production and with demand outstripping supply prices could rise The Roundtable on Sustainable Palm Oil (RSPO) has developed a set of environmental and social criteria which companies must comply with in order to produce Certified Sustainable Palm Oil (CSPO) When properly applied these criteria can help in minimising the negative impacts of palm oil cultivation
107 Deforestation amp Palm Oil 108 As worldrsquos largest importer of palm oil India has a duty to push for ethical production practices109 httpsseaofindiacominterim-data-on-import-of-edible-oils-march-2020-down-by-32-percent-nov19-to-mar20-down-by-10-percent110 httpsappsfasusdagovnewgainapiapiReportDownloadReportByFileNamefileName=Oilseeds20and20Products20Annual_New20Delhi_India_04-01-2020111 httpsresourcetradeearthyear=2018ampexporter=76ampimporter=699ampcategory=87ampunits=value112 httpswwwrvonlsitesdefaultfiles201705poultry-sector-in-india-2017pdf113 httpsresourcetradeearthpublicationscocoa-trade-climate-change-and-deforestation
The Sustainable Palm Oil Coalition for India (I-SPOC) was formed to promote the uptake of sustainable palm oil and its derivatives in India CDP amongst others has joined it as a member
Soy cultivation is the second largest soft commodity driver of tropical deforestation after cattle products Various aspects of soy production generate GHGs that contribute to climate change India imports around 33 lakh tons of soybean oil109 According to data from the US Department of Agriculture India
is set to import 35 lakh metric ton of soybean oil in 20202021110 In addition India is also responsible for clearing huge spaces of forest land in Brazil that contributed to 23 of soybean imports to India in 2018111 Soy is also used as fodder for livestock and a growing local demand for poultry products will further affect Indiarsquos position on deforestation The country ranks amongst the top four producers of egg and chicken in the world and it is increasingly exporting to the Middle East and Europe112
Cocoa has been a notable agent of deforestation since the last century The global production of cocoa has increased from 34 million to 45 million tonnes between 2000 and 2014 while the land use footprint of its plantations rose by 37 to 257 million acres113 About 90 of
cocoa is produced by 7 countries -- Ivory Coast Ghana Indonesia Ecuador Cameroon Brazil and Nigeria The dearth of incentives for improving the plantations combine with high investment costs to make cocoa a low yield crop forcing farmers to resort to clearing untouched forest lands in order to meet the growing demand and
lsquoPalm oil consumption dropped by
in 2020 in India due to COVID-19rsquo
40
Climate-Water-Forest nexus
Water is an essential component of mitigation and adaptation strategies
Rising temperatures and changing weather patterns increase stress on water availability
Tropical forests provide substantial emission reductions by acting as carbon sinks
Droughts resulting from rising temperatures and changes in weather patterns increase the risk of forests fires
A major portion of gobal freshwater depends on forests
49
A N N U A L R E P O R T 2 0 2 0
for cutting down production costs114 In Southern India Cocoa is mainly grown as an intercrop in conjunction with coconut areca nut oil and rubber plantations Indiarsquos consumption in 2015-16 was 30000 tonnes of which 57 was imported while the domestic production rose at an annual rate of 37 in the same period115 Failure to protect forests in the event of a sharp cocoa price increase will lead to unsustainable levels of deforestation116
The US$10 billion coffee industry too leaves a gargantuan ecological footprint It is estimated that every cup of coffee consumed results in the loss of one square inch of forest cover117 Each year around 250000 acres of land is cleared for coffee which is unsustainable The Kodagu district
in the Western Ghats of India is a major biodiversity hotspot which produces about one-third of the countryrsquos coffee This region has more than 270 tree species which are all under significant ecological stress due to the coffee farms that threaten land use and land cover while potentially leading to the felling of about 21000 trees118
An estimated 8-10 of global production of low-cost timber products comes from illegal logging in forests To meet the burgeoning demand of timber produce about 25 million acres of land is converted to fast-
wood forests (timber plantations) across the world annually and this hampers the ecosystem services that nature provides us119 With the World Bank forecasting that the global market for wood is set to quadruple by 2050120 reducing timberrsquos environmental footprint is vital for the industryrsquos success In India there is no provision of a central data pool that maintains records of production and consumption of timber There is a need to address this inconsistency in reporting and data collection by forging a comprehensive strategic policy and providing institutional support121 This would ensure effective collaboration among all stakeholders that would result not only in the production of quality forest products but also a sustainable timber sector
114 httpsresourcetradeearthpublicationscocoa-trade-climate-change-and-deforestation~text=As20cocoa20tends20to20beforest20loss20over20this20time115 httpseconomictimesindiatimescomindustrycons-productsfoodalthough-indias-consumption-of-chocolate-is-steadily-growing-but-we-still-depend-on-imports-for-116 httpsnationalzoosieduscbimigratorybirdsresearchcacaorufcfm117 httpsohiostatepressbookspubsciencebiteschaptera-bitter-brew-coffee-production-deforestation-soil-erosion-and-water-contamination~text=For20every20cup20of20
coffeeinch20of20rainforest20was20destroyedamptext=Chemical20buildup20in20soils20andsoil20eroding2C20and20land20degradation118 httpswebcachegoogleusercontentcomsearchq=cacheYhaeYHVPWasJhttpswwwmdpicom1999-4907114480pdf+ampcd=6amphl=enampct=clnkampgl=in119 httpsresourcetradeearthyear=2018ampexporter=76ampimporter=699ampcategory=87ampunits=value120 httpdocuments1worldbankorgcurateden240231467291388831pdf106467-REVISED-v1-PUBLICpdf121 httpsonlinelibrarywileycomdoifull1011111477-894712094122 httpsglobalforestatlasyaleeduamazonland-usecattle-ranching123 httpsresourcetradeearthyear=2018ampimporter=699ampcategory=779ampunits=value124 httpsresourcetradeearthyear=2018ampimporter=699ampcategory=779ampunits=value125 httplargestanfordeducourses2018ph240halper1~text=Every20half20hour2C20a20cowmore20potent20than20carbon20dioxideamptext=There20is20
rampant20deforestation2C20especiallyto20make20room20for20cattle126 httpswwwinvestopediacomarticlesinvesting0929155-countries-produce-most-carbon-dioxide-co2asp127 httpwwwcwejournalorgvol9no3do-extensive-rubber-plantation-influences-local-environment-a-case-study-from-tripura-northeast-india128 httpswwwibeforgdownloadRubber_Plastics_220708pdf
Beef production remains by far the largest driver of deforestation in the worldrsquos tropical forests as forest land cleared for cattle is more than twice the combined area required for producing soy palm oil and wooden products The problem of cattle ranching
is particularly profound in the Amazon region the largest forest reserve in the world leading to 80 of present deforestation rates122 Clearing land for grazing causes irreversible habitat loss soil degradation and conflict between humans and wild animals India imports 15 and 12 of bovine leather from Turkey and Brazil respectively which poses a great threat to the forest areas of these countries123 It also jeopardises the earnings of the Indian companies manufacturing such products for its European consumers who have a high degree of sensitivity and awareness around deforestation124 In a larger context the impact of cattle stretches far beyond the realm of forests and is one of the key reasons for rising global emissions and climate change There are more than 15 billion cows on Earth with each of them capable of expelling 17 times more GHG emissions than cars in the form of methane burps a gas several times more potent than CO2 in terms of trapping heat It is therefore not surprising that cattle accounts for a colossal 18 in atmospheric carbon emissions125 To put this in perspective this surpasses emissions of the third largest CO2 emitter India which accounts for a 7 share in worldwide emissions126
Another commodity whose production has significant impact on the environment is rubber Environmentalists have warned for years that the rapid expansion of rubber plantations would come at the expense of natural forests Rubber has
not been subjected to extensive publicity in a way that palm oil soy and paper have been over the years given their impact on the environmentmdashpublicity that has led to adoption of robust sustainability criteria for these commodities Indiarsquos natural rubber plantation spans across an area of 183 million acres as of 2012 with the raw material being used as an input for making 35000 finished products of industrial importance127 Currently the impact assessment of large-scale rubber plantations on the environment is non-existent in the country a worrying sign considering Indiarsquos position as the 4th largest consumer in the world128
50
A N N U A L R E P O R T 2 0 2 0
Fossil-fuel and mineral mining accounts for 7 of global deforestation Moreover it not only presents a threat to forest cover and resource extraction but also leads to long-term impacts such as soil and water pollution infrastructure development and
increased anthropogenic activity129 While the effects of large-scale mining are easier to quantify as they are well regulated and undertake environmental impact assessments it is the scope and impact of artisanal and small-scale mining (ASM) that goes under the radar due to lack of data and a high degree of informality in the sector In India this problem warrants special attention since over 12 million people are engaged in the ASM business with women and girls from backward communities and those living below the poverty line being its primary employees130 A landscape-level approach is critical not only to identify and monitor the environmental and social impacts of individual mining projects but also to consider its interactions with other land uses as well given the crucial role forests play in balancing the ecosystem131 Indiarsquos investor requested company Hindustan Zinc Ltd was the first to disclose this year under the mining sector
129 httpsglobalforestatlasyaleeduland-usemining-extraction130 httpswwwpactworldorgstate20of20asm131 httpswwwresearchgatenetpublication38084575_Landscape_approach_for_quantifying_land_use_land_cover_change_1972-2006_and_habitat_diversity_in_a_mining_area_in_
Central_India_Bokaro_Jharkhand
Hindustan Zinc Pioneering forest and biodiversity conservation in the mining sectorHindustan Zinc Limited is the first investor-requested company in India to respond to CDPrsquos Forests questionnaire It demonstrated that a dedicated Biodiversity Policy and Management Standard is its compass in reducing flora and fauna disruption and in minimising or compensating its impact of operation through project scoping site closure and beyond
Companies in India currently lag behind their regional peers in terms of disclosure on deforestation management with only 3 companies disclosing on this topic in 2020
40
65
22
3China Japan IndiaSEA
(Indonesia Malaysia
Phillipines Singapore Vietnam)
Total no of companies disclosing through CDPs Forests questionnaire in 2020 by HQ countryregion
51
A N N U A L R E P O R T 2 0 2 0
Nagpur
Udaipur
Panaji
Kochi
Rajkot
Vadodara
Delhi
Dehradun
Ahmedabad
Thane
Chennai
Tiruchirappalli Coimbatore
Bangalore
Kolkata
Gangtok
Siliguri
India Snapshot
CITIES STATES AND REGIONS
Cities
In 2020 over 800 cities disclosed their environmental information through CDP including 16 Indian cities The number of cities in India disclosing through the CDP-ICLEI Unified Reporting System increased from 13 in 2019 to 17 This was largely due to citiesrsquo ongoing commitments to climate leadership initiatives such as the C40 Cities Climate Leadership Group (C40) the Global Covenant of Mayors for Climate and Energy (GCoM) and our partnership with ICLEI whose South Asia Regional Office also acts as the GCoM South Asia Helpdesk
88 global cities reached CDPrsquos A list which include Bristol (UK) Miami (USA) Cape Town (South Africa) Buenos Aires (Argentina) and Auckland (New Zealand)
despite the COVID-19 pandemic The USA accounts for the highest number
(25) of cities on the A List making up 28 despite the US pulling out of
the Paris Agreement In India more than half the cities in disclosed
that
they either have sustainability targets incorporated into the master planning of the city or it is in progress while only 43 of the cities have a published plan that addresses climate change adaptation Approximately half of the disclosing Indian cities have identified opportunities as a result of addressing climate change and one-third of them have a GHG emission reduction target which is a strong indication towards a low carbon development pathway
States and Regions
In 2020 the Union Territories of Delhi and Jammu amp Kashmir along with over 120 states and regions from across the world disclosed their environmental impacts through CDP Globally 90 of states and regions reporting a 2030 target have one in line with the IPCCrsquos goal to reduce global greenhouse gas emissions by 40-50 from 2010 levels by 2030 and 55 of states and regions with a 2030 emissions reduction
target are showing greater ambition than their national
counterparts
Indian cities and 16
Indian states disclosed to CDP
2
52
A N N U A L R E P O R T 2 0 2 0
ANNEXURESAppendix I Table of emissions scores and sector by company
Sector Company Name 2020 permission Status
Final score 2020
Scope 1 Scope 2 Scope 3 Number of categories reported in Scope 3
Bars hotels amp restaurants
Indian Hotels Co Ltd
public C 50610 239568 23824 3
Biotech amp pharma Biocon public C 41948 133110 Not Provided
Dr Reddyrsquos Laboratories
public B 247317 154836 1272548 8
ZCL Chemicals public D- Not Provided Not Provided Not Provided
Cement amp concrete ACC public B 16966585 643870 648068 3
Ambuja Cements public B 14523738 551219 1973622 7
Dalmia Bharat Ltd
public B 11280051 537968 1320736048 9
JK Cement non public D Private Private Private Private
JSW Cement Limited
public B- 1398609 647870 572488 4
Shree Cement non public C Private Private Private Private
Ultratech Cement
public B 47954830 1327185 5376354 4
Chemicals Aarav Frances amp Flavors Private
Limited
public Not Scored
GHCL LIMITED public D 109470536 496707 Not Provided
Godrej Industries public B 32311 44361 6735893 3
Gujarat Fluorochemicals
non public C Private Private Private Private
Jubilant Life Sciences Ltd
non public C Private Private Private Private
Kansai Nerolac Paints Limited
non public Not Scored Private Private Private Private
Tata Chemicals public B 444988061 4505956 12162395 5
UPL Limited non public Private Private Private Private Private
Godrej Consumer
Products Limited
public A- 33980 30848 26433 2
Note Due to increase in sample size more samples were considered for this report These samples include companies from the BSE Top 200 list CDPrsquos Fixed Income sample FAIRR sample Emerging markets sample Environmental sample and Continuity climate change sampleFor further details visit https6fefcbb86e61af1b2fc4-c70d8ead6ced550b4d987d7c03fcdd1dsslcf3rackcdncomcomfycmsfilesfiles000003423originalCDP_Climate_Change_Sample_Investor_Request_2020pdfNot Scored- Companies who have submitted the minimum version questionnaire
53
A N N U A L R E P O R T 2 0 2 0
Sector Company Name 2020 permission Status
Final score 2020
Scope 1 Scope 2 Scope 3 Number of categories reported in Scope 3
Energy utility networks
Adani Transmission
Ltd
public D 31870076 21155 9379637 3
GAIL public C 4925087 387358 1071 1
Financial services Axis Bank public B 6250 168043 4414712 3
HDFC Bank Ltd public B 764919 390176 1642453 3
Indusind Bank public A 88316 6278567 1277912 3
Kotak Mahindra Bank
public C 9078 69780 4290177 3
LampT Finance Holdings Limited
non public Private Private Private Private Private
State Bank of India
public B- 390 1066386 257902 5
YES BANK Limited
public A- 344515 3099369 4859625 3
Agricultural commodities
Tata Consumer Products Ltd
public A- 11731 34238 3348672939 10
Marico public A- 1380 12140 499568 9
Intermodal transport amp logistics
Adani Ports amp Special
Economic Zone
public B- 95905791 176946845 202567171 3
IT amp software development
HCL Technologies
non public Private Private Private Private Private
Infosys Limited public A- 15344 124063 371602 6
Larsen amp Toubro Infotech Ltd
public B 39485 2521874 1908034 2
Mindtree Ltd non public A- Private Private Private Private
Tata Consultancy
Services
public A- 26714 811815 702615 7
Tech Mahindra public A 1803807 105736586 39285212 5
Wipro public A- 13366 124564 421527 7
Land amp property ownership amp development
Godrej Properties Limited
public Not Scored 4400 2429 422
Mahindra Lifespace
Developers Limited
public B 397 2675 589525 8
Light manufacturing APOLLO TYRES LTD
public Not Scored 24207 60717 Not Provided
JK Tyres amp Industries
public C 158568 88424 Not Provided
54
A N N U A L R E P O R T 2 0 2 0
Sector Company Name 2020 permission Status
Final score 2020
Scope 1 Scope 2 Scope 3 Number of categories reported in Scope 3
Media telecommunications amp data center services
Bharti Airtel non public D Private Private Private Private
Reliance Jio Infocomm
Limited
public B 105018 1826762 243195034 3
Tata Communications
public A- 6376 108482 6938 3
Metal smelting refining amp forming
Hindustan Zinc public A 4480887 253756 4182181 10
Vedanta Ltd public B- 57482869 1864711 Not Provided
JSW Steel Ltd public A- 40045307 476901 4168823 8
Tata Steel public A- 60116322 5687999 14970000 12
Metallic mineral mining
NMDC public D 29004 63671 1957 1
Oil amp gas processing Bharat Petroleum
Corporation
public B 5023580 366230 729820 2
Indian Oil Corporation
public D 18690000 54700 Not Provided
Renewable power generation
Adani Green Energy
public D 841 13313 1174 1
Azure Power public Private 323 2767
Specialized professional services
Mahindra amp Mahindra Financial Services
public B 3370 18847 22922 3
Piramal Enterprises
public C 4430568 8692844 Not Provided
Vakrangee Softwares Ltd
public B 2053355 35409 Not Provided
Textiles amp fabric goods
ARVIND Ltd public B- 3514561 238894 Not Provided
Thermal power generation
Adani Power Ltd public D 58970705 14607 6910800 1
JSW Energy public B 17200521 36117 61151 2
NTPC Ltd public D 252495018 15845 978052 3
Tata Power Co public C 34952981 22051 1226 1
Tobacco ITC Limited public B- 1241718 230192 206064 5
Transportation equipment
Hero Motocorp Ltd
non public D Private Private Private Private
Mahindra amp Mahindra
public A 40654 414552 58425531 11
Tata Motors public A- 60533 266200 3140861 8
55
A N N U A L R E P O R T 2 0 2 0
Climate Change ndash Investor requested companies132
CDP Activity Group Company name Response Status
Air transport InterGlobe Aviation Ltd Not submitted
Jet Airways (India) Ltd Not submitted
Apparel design Page Industries Ltd Not submitted
Bars hotels amp restaurants
Indian Hotels Co Ltd Submitted
Jubilant Foodworks Ltd Not submitted
Biotech amp pharma Abbott India Ltd See Another
Ajanta Pharma Ltd Not submitted
Alkem Laboratories Ltd Not submitted
Aurobindo Pharma Not submitted
Biocon Submitted
Cadila Healthcare Not submitted
Cipla Not submitted
Divirsquos Laboratories Not submitted
Dr Reddyrsquos Laboratories
Submitted
Glenmark Pharmaceuticals
Not submitted
Lupin Not submitted
Natco Pharma Ltd Not submitted
Pfizer Ltd See Another
Sun Pharma Advanced Research Company Ltd
Not submitted
Sun Pharmaceutical Industries
Not submitted
Torrent Pharmaceuticals
Not submitted
Cement amp concrete ACC Submitted
Ambuja Cements Submitted
Dalmia Bharat Ltd Submitted
India Cements Not submitted
JK Cement Ltd Submitted
Orient Cement Limited Not submitted
Shree Cement Submitted
The Ramco Cements Ltd
Not submitted
Ultratech Cement Submitted
132 These include companies from the BSE Top 200 list CDPrsquos Fixed Income sample FAIRR sample Emerging markets sample Environmental sample and Continuity climate change sample For further details visit https6fefcbb86e61af1b2fc4-c70d8ead6ced550b4d987d7c03fcdd1dsslcf3rackcdncomcomfycmsfilesfiles000003423originalCDP_Climate_Change_Sample_Investor_Request_2020pdf
See Another -The response is covered by another CDP reporting company usually the parent company
CDP Activity Group Company name Response Status
Chemicals Asian Paints Not submitted
Berger Paints India Ltd Not submitted
Castrol India Not submitted
Colgate Palmolive India See Another
Coromandel International
Not submitted
Dabur India Not submitted
Emami Ltd Not submitted
Godrej Consumer Products Limited
Submitted
Godrej Industries Submitted
GRAPHITE INDIA LTD Not submitted
HEG LTD Not submitted
Jubilant Life Sciences Ltd
Submitted
Kansai Nerolac Paints Limited
Submitted
PI Industries Ltd Not submitted
Pidilite Industries Ltd Not submitted
Procter amp Gamble Hygiene amp Health Care Ltd
See Another
SRF Ltd Not submitted
Supreme Industries Ltd Not submitted
Tata Chemicals Submitted
UPL Limited Submitted
Coal mining Adani Enterprises Not submitted
Coal India Not submitted
Gujarat Mineral Devp Corpn
Not submitted
Commercial amp consumer services
Quess Corp Ltd Not submitted
Construction Bharti Infratel Limited Not submitted
GVK Power amp Infrastructure
Not submitted
Honeywell Automation India Ltd
See Another
Larsen amp Toubro Not submitted
Voltas Not submitted
Appendix II List of companies invited to respond to CDP
56
A N N U A L R E P O R T 2 0 2 0
CDP Activity Group Company name Response Status
Financial services Gruh Finance Ltd Not submitted
HDFC Asset Management
Not submitted
HDFC Bank Ltd Submitted
HDFC Life Insurance Company Ltd
Not submitted
Housing Development Finance Corporation
Not submitted
ICICI Bank Limited Not submitted
ICICI Lombard General Insurance Company Ltd
Not submitted
ICICI Prudential Life Insurance Company Ltd
Not submitted
IDBI Bank Ltd Not submitted
IDFC First Bank Ltd Not submitted
Indiabulls Housing Finance Ltd
Not submitted
Indiabulls Ventures Ltd Not submitted
Indian Bank Not submitted
Indusind Bank Submitted
Kotak Mahindra Bank Submitted
LampT Finance Holdings Limited
Submitted
LIC Housing Finance Not submitted
Max Financial Services Not submitted
Motilal Oswal Financial Services Ltd
Not submitted
Muthoot Finance Limited
Not submitted
PNB Housing Finance Ltd
Not submitted
Power Finance Corporation
Not submitted
Punjab National Bank Not submitted
RBL Bank Ltd Not submitted
REC Ltd Not submitted
Reliance Nippon Life Asset Management Ltd
Not submitted
SBI Life Insurance Company Ltd
Not submitted
Shriram Transport Finance Co
Not submitted
State Bank of India Submitted
Union Bank of India Not submitted
YES BANK Limited Submitted
CDP Activity Group Company name Response Status
Convenience retail Avenue Supermarts Ltd Not submitted
Discretionary retail Aditya Birla Fashion and Retail Ltd
Not submitted
Future Retail Ltd Not submitted
Electrical amp electronic equipment
Amara Raja Batteries Ltd
Not submitted
Bharat Electronics Not submitted
Crompton Greaves Consumer Electricals Ltd
Not submitted
Exide Industries Not submitted
Havells India Not submitted
Motherson Sumi Systems
Not submitted
Whirlpool of India Ltd See Another
Energy utility networks
Adani Gas Ltd Not submitted
Adani Transmission Ltd Submitted
CESC Ltd Not submitted
GAIL Submitted
Indraprastha Gas Ltd Not submitted
Power Grid Corpn of India
Not submitted
Reliance Infrastructure Not submitted
Torrent Power Not submitted
Financial services AU Small Finance Bank Ltd
Not submitted
Axis Bank Submitted
Bajaj Finance Limited Not submitted
Bajaj Finserv Not submitted
Bajaj Holdings amp Invst (BHIL)
Not submitted
Bandhan Bank Not submitted
Bank of Baroda Not submitted
Bank of India Not submitted
Canara Bank Not submitted
Cholamandalam Investment and Finance Co Ltd
Not submitted
Cholamandalam Investment and Finance Company Ltd
Not submitted
City Union Bank Ltd Not submitted
Edelweiss Financial Services Ltd
Not submitted
Federal Bank Not submitted
General Insurance Corporation of India
Not submitted
57
A N N U A L R E P O R T 2 0 2 0
CDP Activity Group Company name Response Status
Food amp beverage processing
Britannia Industries Not submitted
Marico Submitted
Tata Consumer Products
Submitted
United Breweries Not submitted
United Spirits Not submitted
Varun Beverages Ltd Not submitted
Venkys India Ltd Not submitted
Health care provision Apollo Hospitals Enterprises
Not submitted
Industrial support services
GMR Infrastructure Limited
Not submitted
Intermodal transport amp logistics
Adani Ports amp Special Economic Zone
Submitted
Container Corporation of India
Not submitted
IT amp software development
HCL Technologies Submitted
Infosys Limited Submitted
Larsen amp Toubro Infotech Ltd
Submitted
Mindtree Ltd Submitted
MphasiS Not submitted
Oracle Financial Services
See Another
Tata Consultancy Services
Submitted
Tech Mahindra Submitted
Wipro Submitted
WNS Holdings ADR Not submitted
Land amp property ownership amp development
DLF Not submitted
Godrej Properties Limited
Submitted
Housing Development amp Infrastructure
Not submitted
Oberoi Realty Not submitted
Leisure amp home manufacturing
Rajesh Exports Ltd Not submitted
Titan Company Limited Not submitted
Light manufacturing 3M India Ltd Not submitted
APOLLO TYRES LTD Submitted
Balkrishna Industries Ltd
Not submitted
Ceat Ltd Not submitted
MRF LTD Not submitted
CDP Activity Group Company name Response Status
Media telecommunications amp data center services
Bharti Airtel Submitted
Reliance Communications
Not submitted
Sun TV Network Not submitted
Tata Communications Submitted
Vodafone Idea Ltd Not submitted
Zee Entertainment Enterprises
Not submitted
Metal products manufacturing
AIA Engineering Ltd Not submitted
Bosch Ltd See Another
Endurance Technologies Ltd
Not submitted
Gillette India Not submitted
Metal smelting refining amp forming
Bharat Forge Ltd Not submitted
Essar Steel Limited Not submitted
Hindalco Industries Not submitted
Hindustan Zinc Submitted
Jindal Stainless Ltd Not submitted
Jindal Steel amp Power Not submitted
JSW Steel Ltd Submitted
Steel Authority of India Not submitted
Tata Metaliks Ltd Not submitted
Tata Steel Submitted
Vedanta Ltd Submitted
Metallic mineral mining
National Aluminium Co Not submitted
NMDC Submitted
Oil amp gas extraction amp production
Oil India Ltd Not submitted
Petronet LNG Not submitted
Oil amp gas processing Bharat Petroleum Corporation
Submitted
Hindustan Petroleum Corporation
Not submitted
Indian Oil Corporation Submitted
Mangalore Refinery and Petrochemicals
Not submitted
Nayara Energy Limited Not submitted
Oil amp Natural Gas Corporation
Not submitted
Reliance Industries Not submitted
Oil amp gas storage amp transportation
Gujarat State Petronet Not submitted
Other materials Astral Poly Technik Ltd Not submitted
Powered machinery Bharat Heavy Electricals
Not submitted
Cummins India See Another
58
A N N U A L R E P O R T 2 0 2 0
CDP Activity Group Company name Response Status
Renewable power generation
Adani Green Energy Submitted
Azure Power Submitted
National Hydroelectric Power Corporation Ltd (NHPC)
Not submitted
ReNew Power Private Limited
Not submitted
SJVN Ltd Not submitted
Specialized professional services
LampT Technology Services Ltd
Not submitted
Mahindra amp Mahindra Financial Services
Submitted
NBCC Ltd Not submitted
Piramal Enterprises Submitted
Vakrangee Softwares Ltd
Submitted
Textiles amp fabric goods
ARVIND Ltd Submitted
Birla CelluloseGrasim Industries
Not submitted
Chennai Petroleum Corporation
Not submitted
Thermal power generation
Adani Power Ltd Submitted
Aditya Birla Capital Not submitted
JSW Energy Submitted
KSK Energy Ventures Limited
Not submitted
NLC India Ltd Not submitted
NTPC Ltd Submitted
Reliance Power Not submitted
Tata Power Co Submitted
Tobacco ITC Limited Submitted
Transportation equipment
Ashok Leyland Not submitted
Bajaj Auto Not submitted
Eicher Motors Ltd Not submitted
Hero Motocorp Ltd Submitted
Mahindra amp Mahindra Submitted
Maruti Suzuki India Not submitted
Tata Motors Submitted
TVS Motor Company Ltd
Not submitted
Web amp marketing services
Info Edge (India) Ltd Not submitted
Wood amp paper materials
Century Textiles amp Industries
Not submitted
59
A N N U A L R E P O R T 2 0 2 0
Climate Change ndash Self Selected companies
CDP Activity Group Company name Response Status
Chemicals AARAV FRANCES amp FLAVORS PRIVATE LIMITED Submitted
GHCL LIMITED Submitted
Gujarat Fluorochemicals Submitted
Light manufacturing JK Tyres amp Industries Submitted
Cement amp concrete JSW Cement Limited Submitted
Land amp property ownership amp development Mahindra Lifespace Developers Limited Submitted
Media telecommunications amp data center services
Reliance Jio Infocomm Limited Submitted
Biotech amp pharma ZCL Chemicals Submitted
Water Security ndash Investor requested companies133
CDP Activity Group Name Response Status
Bars hotels amp restaurants Indian Hotels Co Ltd Submitted
Biotech amp pharma Ajanta Pharma Ltd Not submitted
Alkem Laboratories Ltd Not submitted
Aurobindo Pharma Not submitted
Biocon Not submitted
Cadila Healthcare Not submitted
Cipla Not submitted
Divirsquos Laboratories Not submitted
Dr Reddyrsquos Laboratories Submitted
Glenmark Pharmaceuticals Not submitted
Lupin Not submitted
Natco Pharma Ltd Not submitted
Sun Pharmaceutical Industries Not submitted
Torrent Pharmaceuticals Not submitted
ZCL Chemicals Submitted
Cement amp concrete ACC Not submitted
Ambuja Cements Submitted
Dalmia Bharat Ltd Not submitted
Shree Cement Not submitted
The Ramco Cements Ltd Not submitted
Ultratech Cement Submitted
Chemicals Asian Paints Not submitted
Berger Paints India Ltd Not submitted
Castrol India Not submitted
Coromandel International Not submitted
Dabur India Submitted
Emami Ltd Not submitted
Godrej Consumer Products Limited Submitted
Godrej Industries Submitted
Jubilant Life Sciences Ltd Submitted
Kansai Nerolac Paints Limited Submitted
Pidilite Industries Ltd Not submitted
Procter amp Gamble Hygiene amp Health Care Ltd Not submitted
SRF Ltd Not submitted
Supreme Industries Ltd Not submitted
Tata Chemicals Submitted
133 These include companies from the Water Global sample and Continuity water security sample For further details visit https6fefcbb86e61af1b2fc4-c70d8ead6ced550b4d987d7c03fcdd1dsslcf3rackcdncomcomfycmsfilesfiles000003422originalCDP_Water_Security_Sample_Investor_Request_2020pdf
60
A N N U A L R E P O R T 2 0 2 0
CDP Activity Group Name Response Status
UPL Limited Submitted
VVF Ltd Not submitted
Coal mining Adani Enterprises Not submitted
Coal India Not submitted
Construction Larsen amp Toubro Not submitted
Discretionary retail Aditya Birla Fashion and Retail Ltd Not submitted
Electrical amp electronic equipment Amara Raja Batteries Ltd Not submitted
Exide Industries Not submitted
Havells India Not submitted
Energy utility networks GAIL Not submitted
Power Grid Corpn of India Not submitted
Food amp beverage processing Marico Submitted
Tata Consumer Products Ltd Submitted
IT amp software development Tech Mahindra Submitted
Light manufacturing APOLLO TYRES LTD Not submitted
JK Tyres amp Industries Submitted
MRF LTD Not submitted
Media telecommunications amp data center services
Tata Communications Not submitted
Metal smelting refining amp forming Bharat Forge Ltd Not submitted
Hindalco Industries Not submitted
Hindustan Zinc Submitted
Jindal Steel amp Power Not submitted
JSW Steel Ltd Not submitted
Tata Steel Submitted
Metallic mineral mining National Aluminium Co Not submitted
NMDC Not submitted
Oil amp gas extraction amp production Oil India Ltd Not submitted
Petronet LNG Not submitted
Oil amp gas processing Bharat Petroleum Corporation Not submitted
Hindustan Petroleum Corporation Not submitted
Indian Oil Corporation Not submitted
Oil amp Natural Gas Corporation Not submitted
Reliance Industries Not submitted
Oil amp gas storage amp transportation Gujarat State Petronet Not submitted
Specialized professional services Piramal Enterprises Submitted
Textiles amp fabric goods ARVIND Ltd Submitted
Birla CelluloseGrasim Industries Not submitted
Thermal power generation Adani Power Ltd Submitted
JSW Energy Not submitted
NTPC Ltd Submitted
Tata Power Co Submitted
Tobacco ITC Limited Submitted
Transportation equipment Ashok Leyland Not submitted
Bajaj Auto Not submitted
Hero Motocorp Ltd Not submitted
Mahindra amp Mahindra Submitted
Maruti Suzuki India Not submitted
Tata Motors Not submitted
61
A N N U A L R E P O R T 2 0 2 0
Water Security ndash Self Selected companies
CDP Activity Group Name Response Status
Chemicals AARAV FRANCES amp FLAVORS PRIVATE LIMITED Submitted
Transportation services Adani Ports amp Special Economic Zones Submitted
Other materials Piramal Glass Submitted
62
A N N U A L R E P O R T 2 0 2 0
Appendix III - Indian Companies Committed to ActionScience-based Target initiative (SBTi)Approved 15degC
Mahindra Heavy Engines Ltd Mahindra EPC Irrigation Limited White House
Dr Reddys Laboratories Ltd Swaraj Engines Limited Gromax Agri Equipment Limited
Mahindra Accelo Mahindra Holidays and Resorts India Limited Mahindra Lifespaces Developers Limited
Mahindra Lifespaces Developers Limited Mahindra World City (Jaipur) Ltd Mahindra World City Developers Ltd
Polygenta Technologies Limited
Approved well-below 2degC
Tata Chemicals Limited Mahindra amp Mahindra Limited Wipro
Mahindra First Choice Services Ltd Mahindra Electric Mobility Ltd
Approved 2degC
Hindustan Zinc Limited Mahindra Sanyo Special Steel Shree Cement Ltd
Tech Mahindra
SBTi Committed
Infosys Limited UPL Limited JSW Energy Limited
Godrej Agrovet Limited Godrej Consumer Products Limited Godrej Industries
Godrej Properties Limited Godrej amp Boyce Mfg Co Ltd Ultratech Cement Limited
Vakrangee Limited ACC Limited Adani Ports and Special Economic Zone Limited
SCM Garments PVT Limited Nahar Industrial Enterprises Limited Ambuja Cement Ltd
Adani Green Energy Ltd Reliance Jio Infocomm Limited Bharti Airtel Limited
Gujarat Fluorochemicals Ltd (GFL) Dalmia Bharat Limited HCL Technologies
Havells India Limited Mahindra Susten Eastman Exports Global Clothing Pvt Ltd
JK Tyre amp Industries Ltd Marico Limited Tata Global Beverages Ltd
EPC Industries Limited Mahindra amp Mahindra Financial Services Limited YES BankSBTi companies not in CDP Sample
RE100Dalmia Bharat Ltd Infosys Ltd Mahindra Holidays amp Resorts India Ltd
Tata Motors Ltd
RE100 companies not in CDP Sample
Internal Carbon Pricing (ICP)Pricing carbon in 2020
ACC Ambuja Cements Dalmia Bharat Ltd
Dr Reddyrsquos Laboratories Godrej Consumer Products Godrej Industries
Gujarat Fluorochemicals Hero Motocorp Ltd Hindustan Zinc
63
A N N U A L R E P O R T 2 0 2 0
Infosys Limited JSW Cement Limited JSW Steel Ltd
Mahindra amp Mahindra Mindtree Ltd Shree Cement
Tata Chemicals Tata Consultancy Services Tata Consumer Products
Tata Motors Tata Steel Tech Mahindra
Ultratech Cement Wipro
Planning to price in the next two years
Adani Ports amp Special Economic Zone ARVIND Ltd GAIL
GHCL LIMITED Indian Hotels Co Ltd JK Tyres amp Industries
JSW Energy Jubilant Life Sciences Ltd Larsen amp Toubro Infotech Ltd
Mahindra amp Mahindra Financial Services Mahindra Lifespace Developers Limited Marico
NTPC Ltd Piramal Enterprises Reliance Jio Infocomm Limited
Tata Communications Tata Power Co UPL Limited
Vakrangee Softwares Ltd Vedanta Ltd YES BANK Limited
64
A N N U A L R E P O R T 2 0 2 0
About CDPCDP is a not-for-profit charity that runs the global disclosure system or investors companies cities states and regions to manage their environmental impacts by running a global environmental disclosure system Each year CDP supports thousands of companies cities states and regions to measure and manage their risks and opportunities on climate change water security and deforestation We do so at the request of their investors purchasers and city stakeholders
Over the last two decades we have created a system that has resulted in unparalleled engagement on environmental issues worldwide In 2020 Over 9600 companies reported through CDP on climate change water security and forests and over 800 cities and more than 120 states and regions disclosed their environmental impacts through CDP
CDP IndiaCDP began working in India in 2008 and was formally registered in 2012 working on disclosure and driving climate action It serves as a source of knowledge for hundreds of Indian corporations from those that are just beginning on the road to corporate environmental disclosure through to those looking to improve sustainability and make commitments to reduce environmental impact
It is the only NGO to be named in Indiarsquos INDC submission to the UNFCCC owing to its corporate environmental data repository and tracking of emissions and mitigation data from the Indian Industry CDP India also actively participated in Government of Indiarsquos Ministry of Environment Forests amp Climate Change (MoEFCC) work on future carbon market mechanisms In addition to our work on disclosure CDP India is actively engaged in other initiatives including Internal Carbon Pricing (ICP) Science-based targets (SBT) and RE100
65
A N N U A L R E P O R T 2 0 2 0
CDP ContactsFor more info contact Damandeep Singh Director CDP India damandeepsinghcdpnet infoindiacdpnet
CDP Board of Directors
Bharati Chaturvedi Founder amp Director Chintan Environmental Research and Action Group
Ramakrishnan Mukundan Managing Director amp CEO Tata Chemicals Limited
Damandeep Singh Director CDP India
Important Notice
The contents of this report may be used by anyone providing acknowledgement is given to CDP Worldwide (CDP) This does not represent a license to repackage or resell any of the data reported to CDP or the contributing authors and presented in this report If you intend to repackage or resell any of the contents of this report you need to obtain express permission from CDP before doing so
CDP India has prepared the data and analysis in this report based on responses to the CDP 2020 information request No representation or warranty (express or implied) is given by CDP India as to the accuracy or completeness of the information and opinions contained in this report You should not act upon the information contained in this publication without obtaining specific professional advice To the extent permitted by law CDP India do not accept or assume any liability responsibility or duty of care for any consequences of you or anyone else acting or refraining to act in reliance on the information contained in this report or for any decision based on it All information and views expressed herein by CDP India is based on their judgment at the time of this report and are subject to change without notice due to economic political industry and firm-specific factors Guest commentaries where included in this report reflect the views of their respective authors their inclusion is not an endorsement of them
CDP India their affiliated member firms or companies or their respective shareholders members partners principals directors officers andor employees may have a position in the securities of the companies discussed herein The securities of the companies mentioned in this document may not be eligible for sale in some states or countries nor suitable for all types of investors their value and the income they produce may fluctuate andor be adversely affected by exchange rates
lsquoCDP Worldwidersquo and lsquoCDPrsquo refer to CDP Worldwide a registered charity number 1122330 and a company limited by guarantee registered in England number 05013650
copy 2020 CDP Worldwide All rights reserved
This report is printed on recycled paper
This report is printed on CyclusPrint based on 100 recycled fibres
This report is printed on CyclusPrint based on 100 recycled fibres
Supported by Scoring partner
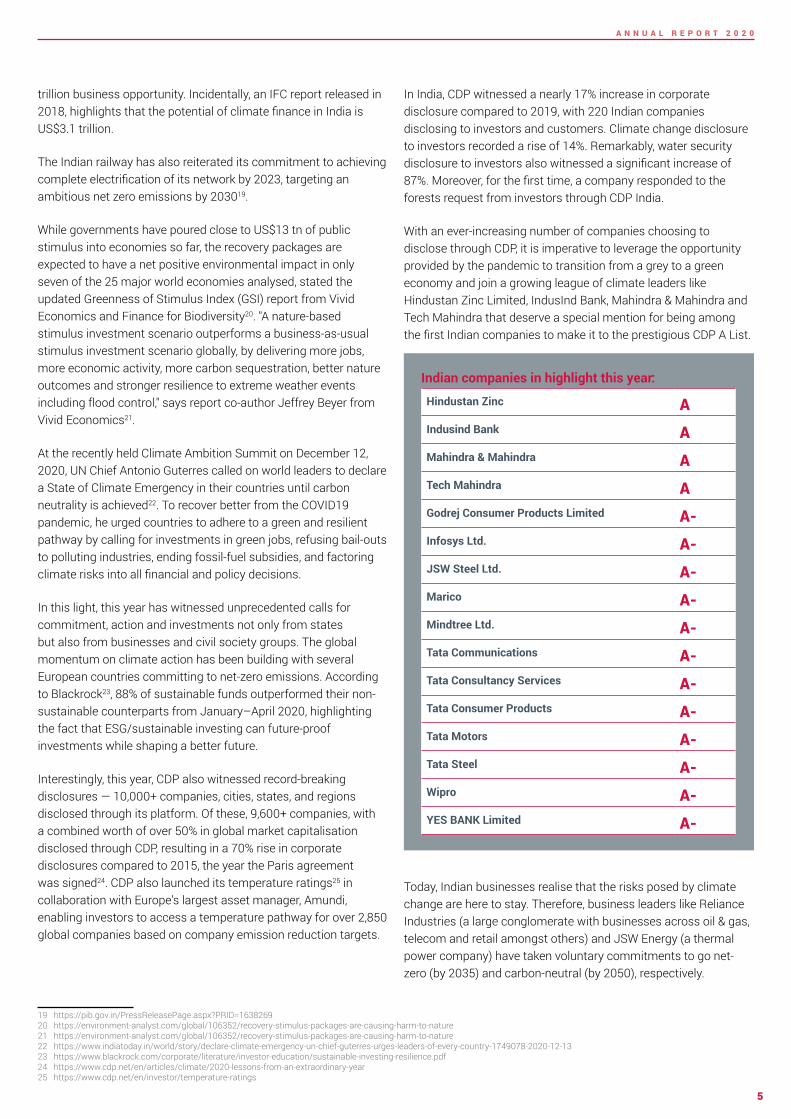
6
A N N U A L R E P O R T 2 0 2 0
Further the attempt to integrate climate action into business is also reflected in the disclosure responses received by CDP in the 2020 cycle
The business community is uniquely positioned to innovate and execute solutions with greater rigour and efficiency by integrating sustainability in the core business decision making with or without changes to the regulatory landscape Corporates can drive the desired change towards clean energy transitions by joining initiatives such as environmental disclosure the Science-Based Targets initiative RE100 and by incorporating an internal carbon price to deliver faster emission cuts in key areas However corporations need to be supported by governments through clearer long-term policies on energy and climate to instil the confidence needed to invest in technologies and innovation towards a zero-carbon future26
26 httpswwwwemeanbusinesscoalitionorgblogparis-agreement-the-power-of-ingenuity-with-collaboration-is-insurmountable
India is endowed with high social and environmental diversity and cannot expect to formulate a one- size- fits- all solution for its climate concerns What it requires is the coming together of all stakeholders to showcase the power of the collective especially its 13 billion people without whom no solution would be truly impactful
As disclosure and transparency are vital in lsquobuilding back betterrsquo CDP is poised to play a pivotal role as a global environmental disclosure platform helping companies cities states and regions measure and manage their environmental risks through disclosure The COP26 in Glasgow will be an important milestone in this direction and will enable countries to assess progress on their Paris Agreement goals and commit to more ambitious targets
As we work towards a low carbon future we must also pledge to build a more equitable world where vulnerable sections are no longer left to bear the brunt of tragedies triggered by climate change
17
Investor requested corporate disclosures for climate
change from Indian companies grew by
increase in investor requested corporate disclosures for Water Security Disclosures
87growth has been witnessed
over last year
` 7138Billion
worth of climate related risks calculated
by companies
3752
Indian companies have committed to the
SBTi by 2020
companies58
are pricing carbon or are planning to do so in the
next two years
7
A N N U A L R E P O R T 2 0 2 0
Business leaders are almost unanimously deliberating on climate issues and an overwhelming majority of companies now incentivise their managements to undertake climate action About three-fourths of these incentives are in the form of a financial compensation GAIL has a portal where staff members can give their suggestions on how to manage climate risks and employees whose suggestions are accepted are given a financial reward of `100000 Among the various types of non-monetary rewards BPCL recognises employees for undertaking initiatives in Health Safety Security and Environment (HSSE) through an annual performance award Mahindra amp Mahindra provide acknowledgement certificates to employees for energy efficiency projects as well as to those contributing to the annual sustainability reporting
The most commonly appointed positions that companies have chosen to place the responsibility of overseeing climate-related issues are board-level committee members the CEO the director the board chair and the CSO These individuals are also at the top of the corporate ladder which denotes the growing importance of climate change not just as a sustainability issue but as a broader global risk that threatens to undermine financial bottom lines erode shareholder value and tarnish brands
More than 75 companies provide an update to their respective boards on climate change-related issues at least
27 httpcbsteriinorgindiaghgphp~text=The20total20inventory20managed20bypercent20of20Indias20total20emissions
every quarter highlighting the growing importance of environmental sustainability as a core business value
Sustainability is deeply entrenched in the financial structure of companies today influencing access to capital capital expenditure direct and indirect costs and capital allocation Hence it comes as no surprise that 66 out of 67 companies stated that climate-related risks and opportunities have had an impact on their organisationrsquos strategy for financial planning Of these 66 companies 46 have also developed a low-carbon transition plan to minimise the losses to their bottom lines
SUSTAINABILITY ndash HEART OF GOOD GOVERNANCE
Businesses that currently account for 76 of the total energy consumption are vital for the country to tread the path of sustainable development As engines that will drive economic growth in the aftermath of the pandemic corporates present an immense opportunity for India to meet its climate commitments (NDCs) under the Paris Agreement through large-scale emissions reduction29
Frequency of reporting of climate-related issues
Oversight amp Incentive
Board- level oversight Incentive to management
99 8845
34
8
53
More frequency than quarterly
Quarterly
Half-yearly
4Annually
As important
matters arise
Not reported to the board
a
ge o
f com
pani
es
8
A N N U A L R E P O R T 2 0 2 0
Climate-related scenario analysis allows businesses to not only project future operational emissions but also mobilise necessary resources to offset the carbon footprint in their sustainability measurement approach It is especially important that the application of scenario analysis incorporates dynamic and unstable conditions under which companies are operating such as the COVID-19 pandemic that has resulted in mass layoffs economic recession and lockdowns across the world This would enable corporations to explore a broader range of uncertainties and be more resilient to external drivers of change28
The rigorous computational analysis would provide direction to enterprises on how to set emission reduction targets in line with the 20C scenario About 63 of the reporting companies use climate analysis tools such as models or scenarios enumerated
28 httpswwwfsborgwp-contentuploadsP291020-3pdf
under the Nationally Determined Contributions and International Energy Agencyrsquos 2 Degree Scenario (2DS) to inform their business strategy
Climate-based risks and opportunities have also influenced the strategy of companies in the sphere of investment in RampD Products amp Services Operations and Supply ChainValue chain Among these areas 87 companies claimed that Operations were affected and 84 reported changes in planning for Products and Services
Investmentin RampD
343
657
No
of C
ompa
nies
No Yes
Product amp Services 164
836
No Yes
No
of C
ompa
nies
Supply chain Value chain
701
298
No Yes
No
of C
ompa
nies
Operations
866
134No
of C
ompa
nies
No Yes
9
A N N U A L R E P O R T 2 0 2 0
CLIMATE-RELATED RISKS amp OPPORTUNITIESMore often than not the financial impacts of climate-related issues are not quantified and identifying them in the first place could be challenging These issues necessitate actions Increasingly investors lenders and other financial regulators are becoming more focused on ensuring that the private sector is ready to address climate risks and grab opportunities brought by changing climate
29 httpthoughtleadershipaoncomDocuments20200122-if-natcat2020pdfutm_source=cerosamputm_medium=storypageamputm_campaign=natcat20
30 httpswwwbankofenglandcouk-mediaboefilesspeech2019avoiding-the-storm-climate-change-and-the-financial-system-speech-by-sarah-breedenpdf
31 httpsreadoecd-ilibraryorgviewref=136_136201-ctwt8p7qs5amptitle=Making-the-Green-Recovery-Work-for-Jobs-Income-and-Growth_
32 https6fefcbb86e61af1b2fc4-c70d8ead6ced550b4d987d7c03fcdd1dsslcf3rackcdncomcmsreportsdocuments000005312originalAnalysis_of_CA100__Data_for_CDP_Investor_Signatories_v5pdf1596046258
33 Climate Action 100+ is an investor initiative to ensure the worldrsquos largest corporate GHG emitters take necessary action on climate change The companies include 100 lsquosystemically important emittersrsquo accounting for 23rd of annual global industrial emissions alongside more than 60 others with significant opportunity to drive the clean energy transition Read more at httpwwwclimateaction100org
Climate change has already shown substantial impacts on businesses all around the world and this is expected to continue As per a 2019 report 29 the total direct economic losses incurred due to climate-related natural disasters in 2019 were estimated at US$232 billion In India the monsoon floods in June-October 2019 caused an economic loss of US$10 billion and claimed 1750 lives Additionally the Bank of England has estimated asset losses worth US$20 trillion due to climate change if no action is taken now 30
COVID-19 has taught the world how the pandemic can actually be used as an
opportunity to better understand and mitigate climate-related
risks Investors are now more than ever more focussed on risk exposure Post-COVID-19 civil society groups governments and business are all have aligned in trying to reduce the risks to our economy and world going forward
As per an OECD report despite widespread socio-
economic suffering suffering there is an increase in public
consciousness about the risks to the natural system from anthropogenic activities31
CDP recently released a report32 on the analysis of CA100+ companies for CDP Investor Signatories Up to 118 of 122 CA100+33 companies report being exposed to substantive climate-related risks and opportunities 93 companies identified climate-related risks and 91 identified climate-related opportunities as having the potential to have a substantive financial or strategic impact on their businesses
As per CDP Indiarsquos 2020 data companies have a varied definition of what short medium and long-term means for them -- a rough average across the sample would be three years for short term five years for medium term and 15-20 years for the long term although the latter also ranges up to 100 years These time frames are important in planning risk management processes -- contextualisation of risks in terms of potential market changes and evolving technological scenarios around risk management at enterprise level
Responding companies
67Companies identified
climate related substantive risks
62Companies
identified risk typesdrivers
60Companies
identified potential financial impact
driver
60
Companies provided potential financial
impact figures
42
10
A N N U A L R E P O R T 2 0 2 0
THE RISKS OF CLIMATE CHANGE
In terms of risk types current regulation was deemed to be most relevant and always included in 97 of the organisationsrsquo climate-related risk assessments This was followed by emerging regulation and technology Interestingly findings from responses submitted by global companies corroborate this trend analysis as almost all CA100+ respondents reported policy and legal risks as potential drivers for substantive impact when it comes to transition risk34 With regular compliance checks increased stakeholder concern and sustainably evolving consumer demands climate-related risk assessment procedures can help companies become better equipped to handle longer-term uncertainties and liabilities
The number of companies that identified inherent climate-related risks with potential substantive financial or strategic impact on businesses rose to 94 from 88 in 2019 Up to 63 of reporting companies were able to get to the last mile of providing a financial impact figure to the risks identified Disclosing Indian companies put the total inherent financial impact of climate risks at `7138 billion with an average risk per company being `92 billion
Companies have also identified climate-related risks across their value chain with direct operations being the most severely affected and exposed most to acute physical risks followed by emerging regulation current regulations and chronic physical risks Companiesrsquo lsquodownstreamrsquo value chain is affected the most by market risks followed by acute physical risks Downstream value chain refers to the third parties benefiting from the outputs products and services of business activities This may be a companyrsquos customers and clients or the organisations and projects the business invests in This could possibly mean that changing customer behaviour could gravely affect a business operation if there is a shift in the demand for a comparatively low-carbon intensive product as well as greater demand for product efficiency regulations and standards providing clear evidence that there is a continuous shift towards sustainable products
CLIMATE RISKS AN OPPORTUNITY TO RESTRATEGISE
Up to 94 of reporting companies have identified climate-related opportunities as having the potential to make a substantive financial or strategic impact on businesses And 63 have provided a potential financial impact figure to the opportunities related to climate change Disclosing companies put the cost of climate-related opportunities at a total of `2787 billion The figure is a testament to the evolution of the climate change mitigation program and how organisations see this
34 https6fefcbb86e61af1b2fc4-c70d8ead6ced550b4d987d7c03fcdd1dsslcf3rackcdncomcmsreportsdocuments000005312originalAnalysis_of_CA100__Data_for_CDP_Investor_Signatories_v5pdf1596046258
No of Companies
Opp
ortu
nity
typ
es
Opportunity identified in value chain
Direct operations
Downstream
Upstream
Resource efficiency
Product and services
Energy source
Markets
Resilience
41
25 18
34 7
7
9 3
3
2
3
396
6
Risks relevant to Indian companies
Current regulation97Emerging regulations90Reputation90Market85Technology85Legal
Acute physical
Chronic physical
827973
No of Companies
Risk occuring in value chain
No of Companies
Risk
type
s
Reputation
Legal
Emerging regulation
Chronic physical
Technology
Market
Current regulation
Acute physical
Direct operations
Downstream
Upstream
5115
2
2923 4 8
17
8 14 7122 4
40 5 8
2
31
11
A N N U A L R E P O R T 2 0 2 0
Similarly most companies saw resource efficiency as a major climate-related opportunity followed by energy source and products and services in their lsquodirect operationsrsquo The main drivers behind these opportunities were use of more efficient production and distribution processes use of lower-emission sources of energy and development andor expansion of low-emission goods and services In the lsquodownstreamrsquo value chain products and services was majorly witnessed as an opportunity as there is growing consumer awareness and concern around sustainability related issues As a result companies are constantly diversifying their portfolios to address these consumer needs
Prod
uct a
nd s
ervi
ces
Ener
gy S
ourc
e
Resi
lienc
e
Resi
lienc
e
Ener
gy S
ourc
e
Reso
urce
effi
cien
cyM
arke
ts
2787identified to be the financial impact of reported climate-
related opportunities (in rupee billion)
Billion
`452
328
270
18
1719
Responding companies
67Companies
identified climate related
substantive opportunities
63Companies identified
opportunitiy typesdrivers
61
Companies identified
potential financial impact driver
60
Companies provided potential financial impact
figures
42
2041
4715
136
119
42413842
Acut
e ph
ysic
alCu
rren
t reg
ulat
ion
Emer
ging
regu
latio
n
Chro
nic
phys
ical
Repu
tatio
nO
ther
s
Lega
l
Tech
nolo
gyM
arke
t
7138identified to be the financial impact of reported climate-
related risks (in rupee billion)
Billion
`Financial impact of reported climate-related risks (in rupees billion)
Financial impact of reported climate-related opportunities (in rupees billion)
12
A N N U A L R E P O R T 2 0 2 0
Tech Mahindra Tapping into climate-related opportunities
Tech Mahindrarsquos approach towards climate change mitigation strategies is a testament to the efficacy of tapping into and realising climate-related opportunities The company has adopted Science-Based Targets to reduce its emissions and is a signatory to Business Ambition of 15 degree Celsius Tech Mahindra is committed to responsibly managing its operations through continuous improvement in sustainability practices across its value chain The company focuses on carbon emission reductions energy consumption reduction self-generation of energy from renewable energy sources and encouragement for green projects through Power Purchase Agreements The company has taken a target to increase Renewable Energy (RE) to 50 by 2025 Their sustainability report is aligned with CDSB amp Task Force on Climate-related Financial Disclosures (TCFD) frameworks
A constant focus on green energy and sustainable operations has provided a significant saving of US$27 million brought about by increasing renewable energy capacity to 1383MW leading to a saving of 28 million units of electricity adopting energy efficient practices across their facilities
Tech Mahindra has harnessed the power of disruptive next-generation technologies such as Artificial Intelligence (AI) analytics and blockchain to create solutions that ensure both its own and its customersrsquo carbon footprint reduction The company has contextualised opportunities for its customers as well by creating smart city offerings such as SMART Grid Micro-Grid-As-A-Service Intelligent Electric Vehicle Charging System (IEVCS) smart energy management smart traffic management smart lightening management smart waste management systems and command amp control centres These smart city offerings will help reduce carbon footprints across multiple smart cities globally thereby reducing carbon emissions and contributing to green and sustainable solutions It is claimed that the market size for this is expected to reach US$4639 billion by 2027
At present the risks identified by the responding companies significantly outweigh the opportunities Opportunities are slow to emerge and companies need to focus on the use of lower-emission sources of energy development andor expansion of low-emissions goods and services development of climate adaptation resilience and insurance risk solutions and use of more efficient production and distribution processes
In 2015 at the request of the G20 Finance Ministers and Central Bank Governors the Financial Stability Board (FSB) and its chair Mark Carney established the industry-led TCFD This was set up in response to increasing demands from investors lenders insurers regulators policy makers and other stakeholders in the financial markets for decision-useful climate-related information CDP has aligned its information requests with the TCFD alongside introducing a sectoral focus and adopting a forward-looking approach to climate-risk disclosure We are already going in the direction of mandatory disclosure of climate risks how they are present in a companyrsquos activities how they manage it and how resilient they are to it The UK will be the first country in the world to make TCFD-aligned disclosures fully mandatory across the economy by 2025 going beyond the lsquocomply or explain approachrsquo35
35 httpswwwgovukgovernmentnewschancellor-sets-out-ambition-for-future-of-uk-financial-services
13
A N N U A L R E P O R T 2 0 2 0
Under current policies Indiarsquos projected emissions for 2030 can achieve a rating of ldquo15degC Paris Agreement compatiblerdquo if domestic emissions peak and start reducing with international support36 This shows that India has the potential to become a world leader with enhanced 15-degree compatible targets through a swift transition from coal to renewable energy Although India was already on track to meet its NDCs pre-COVID19 it has seen an even more significant drop in emissions since the onset of the pandemic During the peak of lockdown Indiarsquos energy demand reduced by almost 30 in April 202037 ie each additional week of lockdown the annual energy demand fell by 0638 This is mostly due to the significant reduction in energy consumption and power generation via fossil fuel However the impact of the pandemic on emissions is expected to be temporary and emissions are likely to rebound in 202139 as per estimations
In comparison to the NDCs which set an overall emissions target sectoral indicators can be more reliable in making informed decisions on mapping emissions reduction targeting Paris-compatible goals40 The
36 Climate Action Tracker- Fair Share37 Carbon Brief Analysis Indiarsquos CO2 emissions fall for first time in four decades amid coronavirus38 httpswwwieaorgreportsindia-202039 Carbon Brief Global Carbon Project Coronavirus causes lsquorecord fallrsquo in fossil-fuel emissions in 2020 Dec 202040 httpswwwoecd-ilibraryorgdocserver9789264273528-4-en
pdfexpires=1607881602ampid=idampaccname=guestampchecksum=891034D10FA31A953F7924772F23966D41 httpssciencebasedtargetsorgresourceslegacy201505Sectoral-Decarbonization-Approach-Reportpdf42 IPCC Mitigation Pathways Compatible with 15degC in the Context of Sustainable Development
major challenge is how to translate global temperature goals into individual actions However various strategies can be adopted to meet the long-term goals
The Science-Based Targets Initiativersquos (SBTi) Sectoral Decarbonisation Approach (SDA) allocates the well below 2degC carbon budget to different sectors taking into account inherent differences among sectors such as how fast each sector can grow relative to economic and population growth along with its mitigation potential41 According to the Intergovernmental Panel on Climate Change (IPCC) the highest global carbon budget allocation (for the period of 2011-2050) is for the power sector (25) followed by agriculture (24) and industry [including steel aluminium chemical and paper] (14)42
EMISSIONS TRENDS AND VERIFICATION
13increase in number of
organisations reporting
27increase in emissions
reporting (Scope 1+Scope 2)
90increase in scope 3 emissions reporting
India under its NDCs pledged to reduce its emissions intensity by 33-35 by 2030 compared to the 2005 levels The Climate Action Tracker38 rates Indiarsquos NDC target as ldquo2009 Copenhagen 2degC goal compatiblerdquo indicating that its commitment is a ldquofair sharerdquo of the global effort
Scope 1 and Scope 2 Emissions reported via CDP over the years
(In Million tCO2e)
2018 2019 2020
2997
55717037
14
A N N U A L R E P O R T 2 0 2 0
In order to allocate sector-specific questions to companies CDP has developed an Activity Classification System (ACS)43 It is a framework used to classify companies under the most relevant sectors It focuses on the diverse activities from which companies derive revenue associating them with the impacts to their business from climate change water security and deforestation This approach allows a better understanding of company actions based on their environmental risk opportunity and impact CDPrsquos Climate Change questionnaire requests companies to disclose their direct and indirect emissions under different emissions categories Although India saw an overall decrease in emission in 2020 there was an increase in CDP reporting companies and hence an overall increase in emissions reporting For the year
43 https6fefcbb86e61af1b2fc4-c70d8ead6ced550b4d987d7c03fcdd1dsslcf3rackcdncomcmsguidance_docspdfs000001540originalCDP-ACS-full-list-of-classificationspdf1520244912
44 The location-based method reveals what the company is physically putting into the air and the market-based method shows emissions the company is responsible for through its purchasing decisions
2020 the companies reported 70374 MtCO2e of total [Scope 1+Scope 2 (location-based)] emissions which is a 27 increase in reported emissions from 2019 This is mostly because of the significant increase in emissions reporting from several sectors mdash electric utilities cement and other heavy sectors
Only four companies chose a Scope 2 market-based approach and 43 companies selected a scope 2 location-based approach44 The total scope 2 emissions for location-based approach amounted to 181 MtCO2e and market-based approach amounted to 414 MtCO2e It is clear from this breakdown that a range of sectors and processes contribute to global emissions Focusing on any single sector alone would be insufficient However as can be seen in the
Emissions reported in Scope 3 Categories
4949
1414
1111
1010
88
55
33
Use of sold products
Purchased goods and services
Upstream transportation and
distribution
Downstream transportation and
distribution
Fuel and energy related activities (not included
in scope 1 and 2)
End of life treatment of sold products
Others
In 2020 companies have reported MtCO2e of total (Scope 1+2 [location-based]) emissions704
Gross Emissions Data 2020 (in MtCO2e)
682
126418
Gross Scope 1 Emissions
Gross Scope 3 EmissionsGross Scope 2 Emissions (Market and
Location based)
Scope 2 Location based emissions Scope 2 Market based emissions
Metal smelting refining and forming
Financial services
Cement amp concrete
Media telecommunications amp data center services
IT amp software development
Energy utility network
Chemicals
Textiles amp fabric goods
Oil amp gas processing
Biotech and pharma
Thermal power generation
Intermodule transport amp Logistics
Bar Hotels and Restaurants
Transportation equipment
Metallic mineral mining
Others
2911712
703
688536
165 292207
144118113
093087
071063
020057
024045044
157
Scope 2 Market-based emissions Scope 2 location-based emissions
Scope 2 market-based and location-based emissions reported as per CDPrsquos Primary Activity Group classification (in MtCO2e)
15
A N N U A L R E P O R T 2 0 2 0
graph for Gross Scope 2 emissions metal smelting refining and forming sectors contribute to the maximum emissions (1712 MtCO2e) followed by financial services and cement and concrete sectors
Companies reported 1259 MtCO2e of Scope 3 emissions in 2020 a 90 increase from 2019 figures due to higher disclosure as well as more companies disclosing their Scope 3 GHG inventories Almost half of the Scope 3 emissions were reported in the following categories use of sold products (49) followed by purchased goods and services (14) upstream transportation and distribution (11) and downstream transportation and distribution (10)
The ACS sectoral analysis shows that the transportation equipment activity group has the maximum reported scope 3 emissions at 615 MtCO2e followed by metal smelting refining and forming activity group at 2332 MtCO2e and cement and concrete activity group at 989 MtCO2e
Of the responding companies 33 have reported an approximately 11 of reduction in their gross global emissions (Scope 1 and 2 combined) from 2019 and 26 companies reported an approximate 57 increase in their gross global emissions from 2019 Responding companies have identified change in boundary45 as a major reason for a 62 increase in emissions from 2019 followed by acquisitions which led to a to 30 increase Amongst all sectors the electric utilities sector accounts for 83 of total increased emission values and up to 73 of these were due to change in boundary
Amongst all sectors reduction in emissions values since 2019 were mostly caused by emissions reduction initiatives (43) followed by change in output (30) and change in emission estimation methodology (23)
45 This refers to changes in the boundary used for inventory calculation ie changing from financial control to operational control This option could also apply if organisation has incorporated facilities into its inventory that were excluded in previous years
Amongst all sectors steel saw the highest reduction (around 48) in emission values and approximately half of this was achieved only from change in emission estimation methodology through recalibrating the GHG emissions for the reporting period This is followed by cement which reported a 29 reduction in emission values from implementing emissions reduction initiatives It is also noted that more than 30 of responding companies have adopted a change in renewable energy consumption but this accounts for only 35 of total reduction in emission values
Scope 3 emissions reported as per CDPrsquos Primary Activity Group classification (in MtCO2e)
of increased emissions in 2020 attributed to Change in boundary62
32 attributed to acquisitions
Metal smelting refining and forming
Cement amp concrete
Media telecommunications amp data center services
Chemicals
IT amp software development
Food amp beverage processing
Oil amp gas processing
Biotech and pharma
Thermal power generation
Land amp property ownership amp development
Financial services
Transportation equipment
Others
6157
2332
989
796
790
632
385
158
127
073
059
039
055
Third-party verification or assurance in place for Scope 12 amp 3 emissions
3571
Scope 1
3643
Scope 2 (location-based
or market based)
2786
Scope 3
a
ge o
f com
pani
es
16
A N N U A L R E P O R T 2 0 2 0
Third-party verification is one of the significant components of emission reporting An independent verification of self-reported data provides credibility and assurance It helps companies improve their internal processes identify risks and opportunities increase the reliability of their data reduce operational costs and building a strong reputation46 When an organisation monitors and verifies its emissions it can accurately identify and understand the true proportions of emissions from its sources and this can help it realise the major opportunities for emission reduction along with cost benefits
In 2020 50 companies reported third-party verification or assurance for Scope 1 emissions 51 companies for Scope 2 emissions and 39 companies for Scope 3 emissions Compared to 2019 there is an 18 increase in companies that have verified Scope 3 GHG emissions This indicates that Indian companies are becoming increasingly aware of their emission managementaccounting Amongst all sectoral companies which opt for third-party verification of their reported emissions around 25 are from IT amp software development and financial services Cement and concrete sectors rank the lowest on the list CDP encourages companies to have verified data submitted
46 The business benefits of third party verification of climate data A CDP Guide
Building a stronger reputation via third party verification
bull Increase confidence in data for internal and external use
bull Develop and demonstrate an effective carbon reduction strategy Improve business processes
bull Reduce operational costsbull Full-fill one of the mandatory criteria for entry
to the CDP A-list by gaining full points on CDPrsquos Scope 1 and 2 verification questions
bull Provide credibility for products services and internal processes
bull Counteract claims of greenwashing
17
A N N U A L R E P O R T 2 0 2 0
DECARBONISING ACROSS VALUE CHAIN Scope 3 emissions typically arise from the supply chain and the consumers using the product It has been found that the emissions from the supply chain are 5-6 times more than the carbon footprint of a companyrsquos direct operations and hence account for lionrsquos share of an organisationrsquos overall emissions47
47 httpswwwcdpnetenarticlessupply-chainsupplier-engagement-leaderboard-201948 httpswwwbcgcomen-inpublications2020supply-chain-needs-sustainability-strategy
Walking the extra mile in terms of engaging with stakeholders especially suppliers and customers on climate issues allows an organisation to consider the whole gamut of emissions and have better control over their emissions inventory For example metal companies can improve their supply chainrsquos environmental performance through adoption of a circular economy model which leads to an increased use of recycled materials in products reduces the emissions by lowering the overall burden on the manufacturing plant to produce from scratch and creates a closed-loop system with consumers48 This yearrsquos data indicates that 88 of companies engaged with their value chain partners on climate-
related issues an improvement of 5 over 2019 There was also an increase in absolute numbers -- 59 business entities collaborated with value chain partners against 49 last year
The main forms of engagement with suppliers are compliance and onboarding followed by incentivisation and information collection Educationinformation sharing collaboration and innovation are the most common customer engagement processes
Types of engagement with suppliers
No of Companies engaging with value chain on climate-related issues
2121
22
331212
1313
44
44
Other partners in the value chain customers suppliers
Other partners in the value chain suppliers
Customers
Customers Suppliers
Suppliers
Other partners in the value chain
Other partners in the value chain customers
of companies engage with their value chain partners on climate related issues an improvement of 5 from 2019
88
26
Compliance amp onboarding
16
Engagement amp incentivisation
(changing supplier behavior)
9
Information collection
(understanding supplier behavior)
7
Innovation amp collaboration
(changing markets)
No
of C
ompa
nies
18
A N N U A L R E P O R T 2 0 2 0
Organisations are mindful of the fact that climate issues need to be dealt using a participatory approach that encompasses all partners in the value chain as well as engages other external stakeholders Companies are thus getting serious about engaging in a comprehensive dialogue on climate change as this will allow them to have inputs in shaping public policy In their attempt to influence climate policies organisations are establishing communication channels with stakeholders like policymakers trade associations and research funding organisations A positive sign emerging is that majority of the businesses are agreeing to comply with environmental legislations unconditionally Energy efficiency and clean energy generation have garnered the support of 71 and 68 of responding companies respectively Mandatory carbon reporting and increased climate resilience have also found acceptance
With the COVID-19 pandemic wreaking havoc across the world and leading to the first-ever recorded recession in India it is important that companies view this as an opportunity to build a more resilient economy one in harmony with nature and encouraging of a more inclusive environment for supplier engagement that would expedite decarbonising Engaging with the value chain offer a strategic advantage as it allows companies to take a lead on corporate sustainability and puts them in a position to set the blueprint for other businesses to follow
19
A N N U A L R E P O R T 2 0 2 0
Emission reduction targets and initiatives
Targets
In recent years accelerated climate change has forced businesses to set more ambitious climate goals and commit to advocating for a low-carbon economy Today it is considered a standard practice for businesses to report their annual emissions and undertake efforts to reduce their carbon footprint Of the 67 Indian companies responding to investor requests 57 have undertaken a total of 95 emissions reduction targets including absolute targets intensity targets and both absolute and intensity targets 24 of these were approved SBTs
The global pandemic has reinforced the need for business resilience in operations and corporate leaders have started recognising that science-based climate action goes hand-in-hand with building business success49 Companies are looking science-based targets as guiding lights with a defined pathway to future-proof growth and with impending climate change hazards more companies have doubled down on their commitments towards a low-carbon transition50 The momentum for SBTs has reached across a range of industries including cement
49 The new normal 1000 companies are now setting science-based climate targets - Science Based Targets50 httpswwwcdpnetenarticlesclimate2020-lessons-from-an-extraordinary-year
automobiles pharmaceuticals metals amp mining real estate and information technology
As more companies are striving toward commitments this year witnessed an increase in the number of approved SBTs from seven targets last year to 24 targets this year
Leading companies are moving forward by setting long-term emissions reduction targets to mitigate climate-related risks Compared to 2019 this year more targets
were set under a long-term time frame till 2030 and a lesser focus had been given on short-term targets ie till 2020 Most of the companies selected a base year of 2018 and had gone for the intensity targets Hence in upcoming years long-term targets can play a major role for companies to support their sustainability visions and their journey towards low-carbon transition Apart from these companies also reported 83 other targets which included 38 energy consumption targets 13 energy productivity targets and 11 waste management targets amongst others
TARGETS amp PERFORMANCE
More than
three times increase in the number of approved science-based targets
of the responding companies set long-term targets (ie till 2030)
50
15
Absolute target
5Both absolute and intensity
targets
37
Intensity target
10
No target
No of Companies
GHG Emission Reduction Target Types
Absolute emission targets count
Intensity emission targets count
Types of targets based on time-frame of target year
820
Till 2020
1929
Till 2021 - 2030
136
2031 and beyond
20
A N N U A L R E P O R T 2 0 2 0
Emission reduction initiatives
While the number of companies taking up Emission Reduction Initiatives (ERI) has grown from 53 to 58 the number of initiatives has declined from 293 to 287 resulting in a 13 decrease in the estimated annual CO2e savings this year
Energy efficiency in production processes and in buildings continue to account for most ERIs non-energy industrial process emission reductions have been outweighed in their CO2e saving potential
Other emission reduction initiatives such as upgrading equipment with high-efficiency alternatives and digitisation initiatives undertaken by banks accounted for the highest estimated CO2e savings In terms of the highest monetary savings energy efficiency in production processes contributed to 76 of monetary savings followed by energy-efficiency in building services
The steel sector had the highest number of initiatives for energy efficiency in production process and accounted for
of total estimated annual CO2e savings
88Monetary Savings from Emission Reduction Initiatives
Annual monetary savings (Million `) No of Initiatives
20611 1918 576 237 148Energy
efficiency in production processes
Non-energy industrial process
emissions reductions
Other initiative
Waste reduction
and material circularity
Energy efficiency in
buildings
150
63 1210
2
Emission Reduction Initiatives
6340 2772 2574 2016 1278
6310
150
122
Other initiatives
Non-energy industrial process
emissions reductions
Energy efficiency in production processes
Waste reduction
and material circularity
Energy efficiency in
buildings
No of InitiativesEstimated annual CO2e savings (MtCO2e)
21
A N N U A L R E P O R T 2 0 2 0
The rise in climate consciousness among Indian companies is evident from the growing number of those committed to the Science Based Target Initiative (SBTi) By 2020 52 companies have committed to it with a significant growth of more than 37 over last year India is now the leader from emerging economies for having the maximum number of companies committing to SBTi and globally it stands at the sixth position
Of the 52 committed companies 22 have further approved SBTs in 2020 compared to 10 in 2019 The initiative champions SBT setting as a powerful way of future-proofing companiesrsquo growth in the transition towards a low-carbon economy51 The initiativersquos overall aim is for SBT setting to become a standard business practice and for companies to play a major role in driving down global GHG emissions Embedding SBTs as a fundamental component of sustainability management practices is crucial for achieving this
The Sectoral analysis of the Indian SBTi companies highlights the number of companies that are committed to the initiative and the number of those with approved set targets across each sector
51 httpssciencebasedtargetsorgresourcesfilesSBTi-manualpdf52 httpssciencebasedtargetsorgresourceslegacy201805SBT-transport-guidance-Finalpdf
Compared to last year the automobiles and components sector is still leading with the highest commitment and targets set The automobile sector is one of the fastest growing sectors which represents 23 of all energy-related global emissions52 Decarbonisng the automobile sector is possible through disruptive technological innovation land-use planning and transport demand management modal shift and
shifting to electric mobility Companies that set ambitious SBTs can send a strong signal for local regional and national policies to increase the level of ambition and steer the transition
In 2020 28 SBTi committed companies responded to CDPrsquos Investor request to disclose to the Climate Change questionnaire The emissions profile shows that the overall Scope 1+ Scope 2 emissions of SBTi companies responding to CDP represent almost 20 of the total Scope 1+ Scope 2 emissions and 71 of the total Scope 3 emissions in the overall CDP India Investor sample
A greater share of Scope 3 emissions reported by SBTi companies indicate that there is now a greater focus on the Scope 3 GHG Inventory as the companies are planning to set SBTs in coming years As per the SBTi a complete Scope 3 screening or inventory is required for the validation of the SBTs and it is not acceptable to exclude any relevant categories
What is a lsquoScience-Based Targetrsquo
Science Based Targets are the GHG emissions reduction targets consistent with the level of decarbonisation that according to climate science is required to limit global temperature increase to 15- 2ordmC compared to pre-industrial temperature levels
Science Based Target ensures that the company is taking shorter-term action to reduce emissions at a pace that is consistent with keeping warming below 15ordm well-below 2ordm C
SCIENCE-BASED TARGETS AMBITIOUS CORPORATE CLIMATE ACTION
200
128107
74 57 52
United States of America
(USA)
United Kingdom
(UK)
Japan Sweden IndiaFrance
No of Companies
Top 5 countries with SBTi companies
22 28 303
No
of C
ompa
nies 10
22Status of SBTi Companies in India
Committed Target Set
22
A N N U A L R E P O R T 2 0 2 0
CDP India data shows that 33 companies have reported reduction in their gross global emissions (Scope 1 and 2 combined) from the previous reporting year whereas 26 companies have their gross global emissions increased for this reporting year
CDPrsquos data shows that there are 32 companies that are considering setting a SBT in the next two years compared to 29 companies in the previous reporting year There are 11 intensity and eight absolute targets that companies consider to be SBT but this has not been approved by SBTi yet
The increase in these target number highlights that there are more companies which seek to commit to SBTi and get their targets validated in the coming years
Growth in ambition
CDPrsquos five-year data shows a rise in the number of Indian companies committing to the SBTi Their reported emissions increased by 144 due to increased commitment from energy intensive companies this year which includes companies from cement and metal and mining sectors
CDP India investor responding companies
SBTi companies (28 companies respond to CDP)
Emissions Profile (MtCO2e)
6815
134
Scope 1 Scope 2
22282
Scope 3
1259896
NO of Companies
Water Transportation
Professional Services
Textiles Apparel Luxury Goods
Software and Services
Pharmaceuticals and Biotech
Mining - Metals (Iron Aluminium Other Metals)
Food Production - Agricultural Production
Electrical Equipment and Machinery
Electric Utilities and Energy Related
Commercial services and supplies
Air Freight Transportation and Logistics
Food and Beverage Processing
Electric Utilities and IPPs and Energy Traders
Construction Materials
Automobiles and Components
Consumer Products and Durables
Banks Diverse Financials and Insurance
Chemicals
Hospitality
Real Estate
Telecommunications
1
1
3
2
2
2
1
1
1
1
1
1
1
1
2
3
3
2
1
1
6
2
4
1
1
2
3
3
Sectoral Analysis of Indian SBTi companies
Committed Companies Target Set Companies
33
14
Decreased
26
12
Increased
62
Reporting for the first time
1No Change
CDP India investor responding companies
SBTi companies (28 companies respond to CDP)
Comparison of change in gross Scope 1+2 emissions from previous year for SBTi companies vis-agrave-vis CDP reporting
companies
Emission Reduction Targets Reported by Companies in 2020
3
Not SBT not anticipating setting in 2
years
24
8
Not SBT but anticipating setting
in 2 years
4 5
Yes this is SBT approved by SBTi
11 8
Yes this is SBT not approved by
SBTi
Intensity emissions reduction target
Absolute emissions reduction target
No
of c
ompa
nies
23
A N N U A L R E P O R T 2 0 2 0
We witnessed the highest number of SBTi companies responding to CDP India this year which is a 40 growth from last year This further proves that companies are becoming more responsible towards disclosing their GHG Inventory with greater transparency
The graph for the estimated annual carbon savings shows the top three emission reduction initiatives undertaken by SBTi companies reporting to CDP It is evident that over the years low carbon energy purchase and energy efficiency process have gained momentum in reducing GHG emission with an increase in the number of SBTi committed companies implementing these initiatives Maximum carbon savings of 791 MtCO2e have been reported from the cement and concrete sector The metal smelting refining amp forming sector has reported 59237 tons CO2e savings this year with a significant decrease from 70422 tons CO2e savings in the last year There has been a reduction of 443 MtCO2e of estimated annual carbon savings reported by SBTi companies in 2020 as compared to the last year
Data shared by three reporting companies that have also committed to the SBTi (Ambuja Cement Ltd ACC Limited and Ultratech Cement Limited) shows that improving energy efficiency in their production processes has led to cement being the leading sector in reducing GHG emissions
About SBTi
The Science Based Targets initiative champions science-based target setting as a powerful way of boosting companiesrsquo competitive advantage in the transition to the low-carbon economy
It is a collaboration between CDP the United Nations Global Compact (UNGC) World Resources Institute (WRI) and the World-Wide Fund for Nature (WWF) and one of the We Mean Business Coalition commitments
The initiative
bull Showcases companies that set science-based targets through case studies events and media to highlight the increased innovation reduced regulatory uncertainty strengthened investor confidence and improved profitability and competitiveness generated by science-based target setting
bull Defines and promotes best practice in science-based target setting with the support of a Technical Advisory Group
bull Offers resources workshops and guidance to reduce barriers to adoption
bull Independently assesses and approves companiesrsquo targets
Indian SBTi companies responded to CDP Climate Change Investor Program 2020
54
Increase in SBTi companies responding to CDP via 2020 climate Change Investor Disclosure Program compared to previous year
40
Increase in Scope 1+2 Emissions and
Indian SBTi Companies responding to investor request reported reduction in Gross Global emissions compared to previous year
Increase in Scope 3 Emissions covered by SBTi Companies this year as compared to 2019
14450
185
Comparison of Absolute Scope 1+2 emissions (MtCO2e) for SBTi companies reporting to CDP
Emission reported in MtCO2e SBTi companies reporting to CDP
15 16 15 18 20 28
2015 2016 2017 2018 2019 2020
Abso
lute
Sco
pe 1
+2 E
mis
sion
(MtC
O2 e
)
364
8
380
4
479
4
605
5
583
4
142
26
24
A N N U A L R E P O R T 2 0 2 0
Advantages 53
1 Reducing regulatory risks and uncertainties As the government continues to work on implementing the Paris Agreement and meeting the ambition of the country-level pledges Science Based Targets initiative can prove out to be a resilience against the upcoming regulations
2 Strengthening Investor Confidence SBTi can help in strengthening the investor confidence as the investors are highly taking interest in businessesrsquo environmental policies
53 httpssciencebasedtargetsorgblogsix-business-benefits-of-setting-science-based-targets
3 Competitive Edge Companies are getting ahead of their peers by succeeding in the low-carbon transition with increased innovation reduced uncertainty strengthened investor confidence and improved profitability
4 Brand Reputation SBT is a global Initiative which shows robustness confidence and credibility which further helps in building up the brand reputation
Estimated annual CO2e savings of SBTi companies (in lsquo000 tCO2e)
2
Develop Target
3
Submit target for validation
4
Announce Target
1
Commit
Joining Call to Action
We look forward to companies taking action by committing to develop Science-based Targets
68
Energy efficiency Processes
Low carbon energy purchase
Energy efficiency Building services
Estim
ated
ann
ual C
O2e
sav
ings
(in
000
tCO
2e)
60126
2018 2019 2020
124
5184
346
43
7911168
25
A N N U A L R E P O R T 2 0 2 0
Science Based Targets Incubator is a unique project of CDP that was launched in April 2020 with support from MacArthur Foundation amp Shakti Sustainable Energy Foundation in partnership with WWF India to provide technical support with the main objective of handholding and catapulting organisations from commitment stage to target development stage of Science Based Targets Initiative Value Proposition
1 There will be no financial implication on the company
2 Case studies of businesses with validated targets will be shared with the participating companies for peer-to-peer learning
3 Capacity Building workshops and webinars based on recent developments and various other nitty-gritty of SBTi
4 In house trainings and one-on-one meetings with companies where CDP India will explain all stages of the SBTi and provide answers to all the technical queries
26
A N N U A L R E P O R T 2 0 2 0
BUSINESS AMBITION FOR 15degC
lsquoBusiness Ambition for 15degCrsquo is an urgent call to action from a global coalition of UN agencies business and industry leaders Businesses can make a critical contribution to limit the worst impacts of climate change by setting a net-zero target in line with 15degC future57
So far over 300 companies representing more than $36 trillion in market cap have responded to the open letter from global leaders and signed the Business Ambition for 15degC commitment
bull In India 13 companies55 have already aligned and set their target with the most ambitious aim of the Paris Agreement to level global temperature rise to 15degC above preindustrial levels
bull Automobiles and Components and Real Estate are the top sectors that have approved targets aligning with 15degC Ambition
bull In India 13 companies are further committed to Business Ambition for 15degC
bull All the companies in the Real Estate sector from India have approved targets aligning with 15degC Scenario
54 httpssciencebasedtargetsorgbusiness-ambition-for-1-5c55 Mahindra Logistics Ltd Mahindra Heavy Engines Ltd White House Dr Reddys Laboratories Ltd Mahindra EPC Irrigation Limited Swaraj Engines Limited Gromax Agri Equipment
Limited Mahindra Accelo Mahindra Holidays and Resorts India Limited Mahindra Lifespaces Developers Limited Mahindra World City (Jaipur) Ltd Mahindra World City Developers Ltd and Polygenta Technologies Limited
56 httpssciencebasedtargetsorgnet-zero
Net zero a north star for climate action
According to the latest report by the IPCC to limit global warming to 15degC above pre-industrial levels and to avoid the most disastrous impacts of climate change the world must halve CO2 emissions by around 2030 and reach net-zero CO2 emissions by 2050
Companies are increasingly adopting the net-zero climate targets by recognising the importance of keeping global warming to 15degC Between July 2019 and June 2020 over 230 companies committed to reach net-zero emissions as part of the Business Ambition for 15degC campaign an urgent call-to-action for companies to set emissions reduction targets in line with a 15degC future The campaign is led by the SBTi and supported by a global coalition of UN leaders business organisations and NGOs56
27
A N N U A L R E P O R T 2 0 2 0
A carbon price is a cost applied to carbon pollution to discourage polluters Economists agree a carbon price is the single most effective tool for countries to reduce their emissions57 Corporations have been using internal carbon pricing (ICP) as a strategy to manage climate-related business risks and prepare for the transition to a low-carbon economy Carbon pricing policies create strong transparent incentives for firms to internalise the social costs of carbon emissions58 Major investors and financial regulators are calling for businesses to disclose their climate risks and their policies to mitigate emissions59 The most sought-after benefits are that a company can use ICP both as a risk management tool and as a part of its decarbonisation strategy
To see how fast carbon pricing is spreading consider Paragraph 136 of the decision text of the Paris Agreement ldquoproviding incentives for emission reduction activities including tools such as domestic policies and carbon pricingrdquo The final agreement recognised carbon pricingrsquos importance as a powerful incentive to cut emissions by companies and regional state and local governments
The IPCC special report on the impacts of global warming of 15 degC above pre-industrial levels states that an explicit carbon pricing mechanism can theoretically achieve cost-effective emission reductions Along with best practice policies a moderate carbon pricing can help reduce global CO2 emissions significantly60 Parties are encouraged to set prices consistent with Carbon Pricing Leadership Coalitionrsquos
57 What is a carbon price and why do we need one58 Energy the Environment and Technological Change59 Firms ignoring climate crisis will go bankrupt says Mark Carney60 An I P C C Special Report on the impacts of global warming of 15 C above pre-industrial levels and related global
greenhouse gas emission pathways in the context of strengthening the global response to the threat of climate change sustainable development and efforts to eradicate poverty Intergovernmental Panel on Climate Change (2018)
61 Carbon Pricing WBCSD policy paper 2019httpsdocswbcsdorg201909Carbon-Pricing-WBCSD-Policy-Paper-2019pdf WBCSD 2019
62 SHOULD EVERY COUNTRY ON EARTH COPY SWEDENrsquoS CARBON TAX63 httpswwwedienetregistrationregwall
(CPLC) high-level commission on carbon pricing which states that an explicit-price range of US$50ndash100tCO2 by 2030 will be consistent with delivering the Paris Agreement61
Carbon prices have varied widely across existing schemes Success stories such as that of Sweden which currently has the highest carbon price in the world at US$123tCO2 demonstrate that it is indeed possible to make carbon pricing work while the Swedish economy grew by 78 since the introduction of the Swedish carbon tax in 1991 carbon emissions have decreased by 2662 Other countries like The UK
(US$4229) Netherlands (US$3638tCO2) have also committed to increasing their carbon prices in the coming decade63 The worldrsquos top three emitters -- US China and India -- however have put negligible prices on carbon
As part of the lsquoBuild Back Betterrsquo strategy carbon pricing can be a valuable tool
US$123tCO2
Sweden
US$4229tCO2
UK
US$3638tCO2
Netherlands
INTERNAL CARBON PRICEndash ROBUST CLIMATE STRATEGY
28
A N N U A L R E P O R T 2 0 2 0
to guide investment decisions It can help focus on a green stimulus package to recover from the old economy which promotes a carbon-intensive future Different stimulus measures can help clean energy technologies compete with carbon-intensive alternatives and encourage more efficient energy use India is witnessing this momentum ndash a Declaration on Climate Change was signed by 24 key industry captains and Ministry of Environment Forest and Climate Change (MoEFCC) at the virtual India CEO forum on Climate Change on 5th December 2020 Shri Javadekar further said that this declaration by private sector companies voluntarily is a historic step
To guide companies in the implementation of climate-related financial disclosures the TCFD65 developed four recommendations mimicking an organisational structure Governance Strategy Risk Management and Metrics and Targets An ICP is a proposed metric through which entities can safeguard their businesses by internalising market signals The TCFD specifically lists ICP as a key metric to assess climate-related risks and opportunities in line with its strategy and risk management process By attributing a financial cost to risks associated with carbon emissions and translating them into a uniform metric financial decision-makers can integrate transition risks into their business decisions and fill the analysis gap for assets of various time horizons
64 httpnbrienvisnicinViewGeneralLatestNewsaspxId=9829ampYear=202065 httpnbrienvisnicinViewGeneralLatestNewsaspxId=9829ampYear=202066 Implementing the Recommendations of the Task Force on Climate-related Financial Disclosures The Taskforce on Climate-related Financial Disclosures June 2017
Mr Ravi S Prasad Additional Secretary spoke about a coordinating structure for implementation of Paris Agreement which will incorporate internal carbon pricing67
The MoEFCC also constituted a high-level inter-ministerial Apex Committee for Implementation of Paris Agreement (AIPA) in December 2020 under the chairmanship of the Secretary MoEFCCThe purpose of AIPA is to generate a coordinated response on climate change matters that ensures India is on track towards meeting its obligations under the Paris Agreement including its NDC
Senior officials from 14 ministries will serve as Members to AIPA who will oversee the progress in implementation of Indiarsquos NDC and receive periodic information updates to monitor review and revisit climate goals to fulfil the requirements of the Paris Agreement Another key function of AIPA would be to operate as a National Authority to regulate carbon markets in India under Article 6 of the Paris Agreement formulate guidelines for consideration of projects or activities under the article issue guidelines on carbon pricing market mechanism and other similar instruments that have a bearing on climate change and NDCs
It will take note of the contributions of the private sector as well as multi-bi-lateral agencies in the field of climate change and provide guidance for aligning their climate actions with national priorities
ICP will be a useful preparatory tool for future government climate policies
Investors are increasingly demanding comprehensive climate disclosures
It will stay and will be instituted more commonly
A robust carbon pricing system plays an important role in driving
GHG reductions
It complements climate policies for sustained and successful
emissions reductions
It helps make informed decisions and incentivies
low-cost abatement options
Business case for pricing carbon
29
A N N U A L R E P O R T 2 0 2 0
When disclosing on ICP the TCFD recommends that companies should disclose on the followingbull what assumptions are made about how carbon price(s)
would develop over time (within tax andor emissions trading frameworks)
bull geographic scope of implementationbull whether the carbon price would apply only at the mar-
gin or as a base costbull whether the price is applied to specific economic sec-
tors or across the whole economy and in what regionsbull whether a common carbon price is used (at multiple
points in time) or differentiated prices bull assumptions about scope and modality of a CO2 price
via tax or trading scheme
67 httpswwwgreentechmediacomarticlesreadeuropean-oil-majors-ready-to-scale-up-energy-transition-investment68 httpswwwgreenbizcomarticlebp-walks-away-three-us-trade-groups-over-carbon-pricing69 Convention on Biological Diversity ndash Markets for Carbon Offsets Accessible at httpswwwcbdintfinancialoffsetsg-offsetclimatecarbonpdf page 8
Earlier this year BP one of Europersquos oil supermajors announced a carbon price of US$100tonne of CO2 a giant increase from their previous price of US$4067 and walked away from three US-based oil and gas trade organisations - American Fuel and Petrochemical Manufacturers (AFPM) the Western States Petroleum Association (WSPA) and the Western Energy Alliance (WEA) over differences regarding policy positions on carbon pricing68
CDP has been asking companies to disclose their practice of using ICP since 2013 In 2020 23 of the investor responding companies have reported putting a price on carbon as compared to last yearrsquos 19 while the number of companies planning to price in the next two years reduced to 21 from 23 in 2019 After adding Supply Chain responding companies a total of 58 companies are pricing or are planning to price carbon in the next two years in 2020 a 12 increase from 2019 It was further seen that of the 23 companies that are pricing carbon in 2020 52 use a shadow price followed by implicit price
The Task Force defines an internal carbon price as ldquoan internally developed estimated cost of carbon emissionsrdquo which can be used as a planning tool to help identify revenue opportunities and risks as an incentive to drive energy efficiencies to reduce costs and to guide capital investment decisions69
52
26
4
9
44
Shadow price
Implicit price
Implicit price Internal fee
Internal fee
Offsets
Implicit price Shadow price
Types of ICP used by Indian companies
Pricing Planning to price in the next 2 years
2
25
2015
8
36
2016 2017
26
14
2018
14
32
2019
20
31
2020
2533
No
of C
ompa
nies
ICP trend in India
30
A N N U A L R E P O R T 2 0 2 0
Type of ICP Shadow price Carbon fee Implicit price Internal trading
Description Hypothetical cost of carbon emissions
A per-unit fee based on the amount of GHG the company emits (eg `700 per tCO2e)
Helps quantify the capital investments required to meet climate-related targets
Allows business units within a company to trade their allocated carbon credits based on respective emissions
Objectivesusage
The most common form of ICP is a shadow price helps organisations better understand the impacts of climate-related risks such as technological shifts or future regulations It can help a company with both risk management as well as internal strategic planning
It allows companies to model or test how a range of carbon prices affect their divisions capital investments and other planned projects It is similar to forecasting with a range of energy prices
Putting a fee on carbon helps create an actual pool of funds generating a revenue stream to help pave the way for greener projects and further RampD This prepares a company for a carbon-resilient world This tool has the ability to encourage a business to transform into an environmental leader It allows for the creation of internal funds to invest into energy efficiency or renewable energy projects in order to cut energy costs
It also builds awareness of the importance of emission reductions within different business units
An implicit price helps companies understand their initial carbon footprint and is also used as a benchmark to implement a more strategic internal price
Internal trading helps create awareness It allows companies to prepare for stringent forms such as shadow prices or internal fees
Method An additional criterion is introduced in investment analysis during the calculation of the internal rate of return (IRR)
The additional criterion is the carbon value which is incorporated into each investment decision and applied to resulting GHG emissions This carbon price is assumed the same way assumptions are made about exchange rates or commodity prices
It is implemented by voluntarily adding a cost to GHG emissions in relation to operational costs
It increases the operating expenses (OPEX)
There are short-term emissions reductions Transfers of actual funds within the company are done through two mechanisms First by offsetting GHG emissions by purchasing offset credits externally Second by providing internal financing for emission reduction projects low- carbon products amp services and RampD
The carbon fee also provides monetary incentives for pro-environment initiativesactivities
Some companies with emissions reduction or renewable energy targets calculate their lsquoimplicit carbon pricersquo by dividing the cost of abatement procurement by the tonnes of CO2e abated
Trading is driven by the allocation of a fixed number of carbon dioxide emission lsquoallowancesrsquo for individual business units with each allowance equivalent to 1 metric tCO2 If business units exceed their cap they must purchase additional allowances to offset their excess emissions
Where business units under-emit they may sell allowances Business units may also choose to invest in carbon offsets outside their own units in order to sell on the internal trading scheme72
A sectoral analysis of the data finds two high emissions intensive sectors cement and concrete followed by IT and software development An increasing number of companies from cement and IT sectors are now committing to the SBTi and moving towards aligning emissions in line with 15-degree an ICP in such cases can be effectively used as a tool for mitigating climate risks and achieving the greater goal of a SBT or a net-zero target It helps companies build their internal capacity and measure their progress
1313
2626
2222
1313
44 44
1818
Metal smelting refining amp forming
Cement amp concrete
IT amp software development
Biotech amp pharmaFood amp beverage
processing
Chemicals
Transportation equipment
31
A N N U A L R E P O R T 2 0 2 0
Below are the ICP disclosed by Indian companies in 2020
Company Price in INR (`) Price in USD ($) Type of ICP used
ACC 2541 3394 Implicit price Shadow price
Ambuja Cements 21639 3074 Implicit price
Dalmia Bharat Ltd 77334 11 Shadow price
Dr Reddyrsquos Laboratories 937 1332 Implicit price
Godrej Consumer Products Limited 750 10 Shadow price
Godrej Industries 740 10 Shadow price
Hero Motocorp Ltd private private private
Hindustan Zinc 111846 159 Implicit price
Infosys Limited 100182 1425 Implicit price
JSW Cement Limited 1566 21 Shadow price
JSW Steel Ltd 1400 20 Shadow price
Mahindra amp Mahindra 98242 1397 Internal fee
Mindtree Ltd private private private
Shree Cement private private private
Tata Chemicals 140607 20 Shadow price
Tata Consultancy Services 1131 1608 Implicit price Shadow price
Tata Consumer Products Ltd 315 448 Offsets
Tata Motors 980 14 Shadow price
Tata Steel 975 - 2720 15 -3868 Implicit price Shadow Price
Tech Mahindra 70303 10 Implicit price Internal fee
Ultratech Cement 750 1066 Shadow price
Wipro 352291 5011 Shadow price
Since these companies did not provide a conversion rate the average conversion rate for the 2019 calendar year was taken (1` = 0014224USD)
Managing climate risk with Internal Carbon Price and Science Based Targets
By integrating ICP into ambitions targets set by SBT companies can achieve greater emissions reduction SBTs empower companies to engage internal teams with a common data-driven goal and integrate their carbon reduction strategies with other business objectives70 A step that organisations can take to implement TCFD recommendations as well as achieve their SBTs is putting an internal price on carbon It is observed that having an internal carbon price can enhance an organisationrsquos competitiveness71 Several companies are already using ICP to highlight their progress towards targets and inform a business case for low-carbon investments Of the 25 companies that have disclosed to CDP in 2020 13 that committed to SBTi also have an ICP
Setting a carbon price can be a strong commitment towards driving change and action Clear goals for the ICP enable
70 Science-Based Targets How Aligning Carbon Reduction Targets With Climate Science Can Drive Business Growth SampP Dow Jones Indices 201771 httpswwwgreenbizcomarticlemanaging-climate-risk-carbon-pricing-and-science-based-targets72 CDP Handbook on Carbon Pricing73 httpswwwcdpnetenreportsdownloads491874 httpsb8f65cb373b1b7b15feb-c70d8ead6ced550b4d987d7c03fcdd1dsslcf3rackcdncomcmsreportsdocuments000002771originalCDP-Carbon-Pricing-Handbook
pdf1508927220
companies to make better decisions regarding the type and price of carbon72 A high-level commitment can provide a companyrsquos perspective and insight on how other companies have been able to adopt innovative financing practices such as ICP and carbon taxes which are spurred by setting ambitious targets in line with the SBT initiative
In January 2020 in partnership with TERI CDP India released a second handbook in ICP - Putting a Price on Carbon A Handbook for Indian Companies 20 73 a second edition to the handbook released in October 17 74The first handbook was prepared to lay out the landscape of carbon pricing and help companies understand about external and ICP along with guidance on how to approach an internal carbon price The aim of the second handbook was to further mobilise the adoption of internal carbon price by companies The handbook discusses steps to arrive at a price and use it in an organisation including details on indicative pricing levels
32
A N N U A L R E P O R T 2 0 2 0
ACC Ltd are using internal carbon price as a tool to drive and incentivise low-carbon initiatives and emissionenergy reduction projects We have observed that ICP helps ROI to look attractive and helps us make informed decisions
ACC Ltd has already committed and published their 2030 targets for specific CO2 emission reduction and use of waste derived resources (as a part of SD 2030 plan) We have also committed to SBTi and are working on setting stricter targets aligning with below 2 DS To achieve these commitments and relevant targets we believe that ICP may play an important role in prioritising our future actions and investments Going forward we also plan to use the ICP for managing risk and leveraging opportunities
mdash ACC Ltd
Steps to Setting an
internal carbon price
Make a commitment
Communicate your progress
Set the scope of the internal carbon price
Decide price level and variance
Monitoring and reporting
Define the type of ICP
01
02
03
0405
06
07
08
Map your objectives
Establish the degree of influence in business application
33
A N N U A L R E P O R T 2 0 2 0
THE RENEWABLE ENERGY THRUST In 2020 the 67 companies headquartered in India have reported a total of 291 Terra Watt hours (TWh) electricity consumption more than double the previous yearrsquos number Notably the significant increase in total electricity consumption is attributed to just one company ndash Vedanta Limited with 151 TWh of electricity consumption for its global operations
The total electricity consumption excluding Vedanta is 140 TWh 48 higher than the previous year The rise in the total reported electricity consumption is primarily due to an increase in the number of responding companies from the energy intensive sectors These 67 companies have consumed about 16 TWh renewable electricity which is 6 of the total electricity consumption reported in 2020 The share of renewable electricity is 11 without counting Vedanta in the sample This is 6 higher than the previous year
The growth in the share of renewable electricity consumption is due to multiple factors such as the increasing number of voluntary corporate GHG emission reduction targets renewable energy targets and compliance targets such as Renewable Energy Purchase Obligations (RPO) In 2020 18 companies from India have reported various types of renewable energy targets Some of these companies have taken more than one renewable energy target type These 18 companies have reported 98 TWh of electricity consumption of which 13 is from renewable energy sources The level
Type of renewable energy targets
Renewable Energy Targets
17
1 1 2Renewable Electricity
Consumption
Renewable Electricity
Production
Renewable Electricity Capacity
Renewable Energy Financing
Target
No
of C
ompa
nies
RE100 is the global corporate renewable energy initiative bringing together hundreds of large and ambitious businesses committed to 100 renewable electricity Led by the Climate Group and in partnership with CDP RE100rsquos mission is to accelerate change towards zero carbon grids at scale There are 4 companies headquartered in India that have committed to the RE100 initiative - Dalmia Bharat Ltd Infosys Ltd Mahindra Holidays amp Resorts India Ltd and Tata Motors Ltd
The RE100 membership continues to grow and diversify - with 42 of new members coming from the Asia-Pacific region in 2020 With 260+ members and gt278 TWh of electricity consumption aggregated electricity demand of RE100 members is higher than Australiarsquos The share of renewable electricity is 42 of total consumption showing strong progress towards 100 goal
Over 70 global RE100 members have operations in India ndash with gt2 TWh of electricity consumption in the country About 39 of electricity consumed in India came from renewable energy sources largely sourced through unbundled energy attribute certificates and power purchase agreements
Visit RE100org and follow RE100 on Twitter
34
A N N U A L R E P O R T 2 0 2 0
Note Some companies have reported renewable electricity consumption total instead of break-down details as per the sourcing method Data for those companies is not included in the above chart
131
17
03
01
Renewable Electricity Sourcing Methods (TWh)
Self-generation
Unbundled Energy Attribute Certificates (EACs)
Power Purchase Agreement (PPA)
Green Electricity Products
of ambition ie a share of renewable energy in the target year for most of the companies varies between 20-100 Showing the leadership in renewable electricity sourcing 3 companies75 have committed to source 100 renewable electricity across their operations and joined RE100 initiative
GHG emission reduction targets are popular among companies in India and 57 companies have reported absolute intensity or both absolute and intensity targets Among these 30 companies have committed to science-based targets Initiative and their targets are in line with climate science Six companies have dedicated scope 2 emission reduction targets Scope 2 emissions are indirect emissions from the generation of purchased energy consumed by the reporting company Companies with GHG emission reduction targets tend to source renewable energy to reduce their emissions primarily scope 2 emissions The Majority of these companies have taken exclusive renewable energy targets to support meeting their GHG emission reduction targets
Renewable energy plays an important role in the corporate value chain due to its zero-carbon intensity and ability to provide long-term energy security About 34 companies have identified opportunities related to shifting energy usage towards low-carbon energy sources across the value chain Of these 32 have identified opportunities in the direct operations followed by 6 companies in the upstream and 2 in the downstream of the value chain These companies have estimated energy related opportunities worth `317 billion mainly in the direct operations Half of these companies anticipate short time frame (1-5 years) to tap these
75 4 India headquartered companies are committed to the RE100 initiative 3 of them report to CDPrsquos climate questionnaire
opportunities Companies have not just identified energy related opportunities but implemented energy related initiatives in the reporting year across their operations About 31 companies have implemented low-carbon energy consumption or production related initiatives in the reporting year that resulted in an estimated annual carbon savings of 18 million tCO2 and `27 billion of annual monetary savings
Companies from the manufacturing and materials sectors have reported the highest volume -14 TWh of renewable electricity consumption Manufacturing sector companies are relatively performing better than companies from the materials sector in terms of the share of renewable energy in total electricity consumption There are 25 companies from these two sectors mainly energy intensive business such as cement metals and mining steel and transport original equipment manufacturers (OEMs) The aggregate electricity consumption of these companies is over 100 TWh The companies from the fossil fuel-based energy generation are not included in the following charts
A detailed breakdown shows that self-generation of renewable electricity is the most preferred sourcing option among companies followed by purchase of renewable electricity through unbundled Energy Attribute Certificates (EACs) and Power Purchase Agreement (PPA) with an onsiteoffsite generator Up to 10 companies have reported 03 TWh of total renewable electricity consumption via PPA (on-grid and off-grid) which has declined from 11 TWh of consumption reported in the previous year
35
A N N U A L R E P O R T 2 0 2 0
Materials Manufacturing Food beverage amp agriculture
Biotech health care amp pharma
OtherInfrastructureServices
3
17
6
35
3
20
12
Total Electricity Consumption (TWh) Total RE Consumption (TWh) RE
Electricity consumption by sector with Vedanta Limited included in the analysis
Electricity consumption by sector excluding Vedanta Limited
Materials Manufacturing Food beverage amp agriculture
Biotech health care amp pharma
OtherInfrastructureServices
7
17
35
20
1236
Total Electricity Consumption (TWh) Total RE Consumption (TWh) RE
TWh
TWh
36
A N N U A L R E P O R T 2 0 2 0
2737worth opportunities
identified
Billion
`
16of Renewable Electricity Consumption Reported
TWh
704of total [ Scope
1+2location-based] emissions reported
MtCO2e
7138Inherent financial
risk identified
Billion
`
25have Internal Carbon
Pricing
Companies 52Companies in India
SBTi
37
A N N U A L R E P O R T 2 0 2 0
WATER SECURITY The way out of water crisis
Five of the worldrsquos largest cities under water stress are in India with Delhi ranked second on the list76 The water crisis is more alarming than imagined ndash 600 million people in India face high-to-extreme water stress77 Indiarsquos water demand is projected to increase by two times the available supply by 2030 putting hundreds of million people at the risk of water scarcity and ultimately losing the country 6 of its GDP78 In 2019 the country witnessed the worst droughts in recorded history Over 500 million people were affected across the country and major cities such as Chennai experienced lsquozero dayrsquo scenarios wherein water literally ran out Since improvements in water security are essential for Indiarsquos development investing in water merits a sound business case
Though 80 of Indian states have legislations on water conservation and prevention of encroachment of water bodies79 poor data management absence of water pricing inefficient irrigation techniques and the lack of adequate sewage treatment curb the countryrsquos ability to manage water sustainably80 In recent times companies have become more aware of the risks of increased water consumption pollution and unstable precipitation aggravated by climate change81 A 2019 World Bank Report (Quality Unknown)82 warned of the economic health and environmental damage caused by contaminated water highlighting water quality as an ldquoinvisible crisisrdquo that is under-appreciated and underestimated It warned that poor water quality driven by industrial agricultural and urban pollution could lead to a reduction by 13rd of economic growth in some places
76 httpsocialnitigovinuploadssamplewater_index_report2pdf77 httpsnitigovinsitesdefaultfiles2019-06Final20Report20of20the20Research20Study20on2020
Composite20Water20Resources20Management20Index20for20Indian20States20conducted20by20Dalberg20Global20Development20Advisors20Pvt20Ltd_New20Delhipdf
78 httpsnitigovinsitesdefaultfiles2019-06Final20Report20of20the20Research20Study20on2020Composite20Water20Resources20Management20Index20for20Indian20States20conducted20by20Dalberg20Global20Development20Advisors20Pvt20Ltd_New20Delhipdf
79 httpsocialnitigovinuploadssamplewater_index_report2pdf80 httpswwwcdpnetenarticlescompaniesindias-looming-water-crisis-a-call-to-action-for-companies81 Think globally act locally new guidance for companies on sustainable water use - CDP82 httpsopenknowledgeworldbankorghandle109863224583 httpswwwwriorgaqueduct84 Aqueduct Country Ranking (wriorg)85 The objective of the campaign is to drive further corporate transparency around climate change deforestation and water
security by encouraging companies to respond to CDPrsquos disclosure request
Water stress in India remains a key challenge Aqueduct83 ranked India 13th in the world on high water stress score -- 412 out of 584 The private sector is vital to delivering a water secure future Companies in the food textile retail energy industrial chemicals pharmaceuticals and mining sectors account for and wield influence over 70 of the worldrsquos water use and pollution The decisions one takes about how to grow and expand can make or break onersquos ability to tackle the global water crisis
CDPs Water Security program requests companies to disclose critical information on water parameters which are crucial to the business It helps companies monitor and benchmark their performance on these critical parameters to ensure adequate water availability for their businesses Investors and customers are increasingly keen to know how companies respond and adapt to water-related risks The Non-Disclosure Campaign (NDC) is an annual CDP initiative where investors can target companies that have been requested to respond but failed to do so85 Globally for water security Indian companies achieved the highest response rate to the NDC campaign with 50 of engaged companies submitting a response on this critical issue ndash 28 times higher than their control group Responding through CDPrsquos Water Security questionnaire will help businesses understand the risks and opportunities associated with water-related issues
Reduction in Economic Growth caused by power water in some countries
13rd
Water stress by 2030-ratio of withdrawals to renewable supply
People will live in water stress area by 2030
Increase in water demand in last 100 years
WRI 2020
UNEP
UN World Waterdevelopment Report 2020
increase in Water Security investor responding companies in India
8756
1in 2
x6
38
A N N U A L R E P O R T 2 0 2 0
helping them capitalise on actions to safeguard water resources86 The number of disclosing companies increased from 15 last year to 28 companies this year an increase of approximately 87
Measuring Monitoring and Verification
Regular measuring and monitoring of water-related parameters across all operations and the entire value-chain is the first step in laying the path for efficient water management In 2020 28 companies measured a total of 268 water related parameters It was found that amongst volumetric water metrics water discharge was the most monitored accounting for 41 of all measurements Water withdrawals accounted for 29 of all measurements water consumption for 10 and water recycling and reuse accounted for 10 each Although these metrics were being continuously monitored and measured by companies a sector-wide analysis shows that significant growth in some water-intensive sectors has put pressure on the demand for industrial water The electric utilities sector for example reported an increased water demand of 771174 megalitres in 2020 which was the highest amongst all sectors Adani Power Ltd highlighted new aqusitions and increased power generation as major reasons for rise in water demand this year The chemicals sector showed the second highest rise in water demand this year -- 195832 megalitres this year
Some companies have shouldered the responsibility of having audits conducted on their reported water metrics for greater
86 httpsb8f65cb373b1b7b15feb-c70d8ead6ced550b4d987d7c03fcdd1dsslcf3rackcdncomcmsreportsdocuments000000893originalCDP-india-business-case-for-water-disclosurepdf1472051621
87 https6fefcbb86e61af1b2fc4-c70d8ead6ced550b4d987d7c03fcdd1dsslcf3rackcdncomcmsreportsdocuments000005312originalAnalysis_of_CA100__Data_for_CDP_Investor_Signatories_v5pdf1596046258
88 https6fefcbb86e61af1b2fc4-c70d8ead6ced550b4d987d7c03fcdd1dsslcf3rackcdncomcmsreportsdocuments000005312originalAnalysis_of_CA100__Data_for_CDP_Investor_Signatories_v5pdf1596046258
89 https6fefcbb86e61af1b2fc4-c70d8ead6ced550b4d987d7c03fcdd1dsslcf3rackcdncomcmsreportsdocuments000005312originalAnalysis_of_CA100__Data_for_CDP_
transparency and credibility Amongst the verification standards that were employed 26 of the responding organisations used ISAE 3000 with Tata Chemicals being the sole company to apply both ISAE 3000 and AA1000AS to meet assurance standards
In 2020 25 responding companies withdrew consumed and discharged 7933064 megalitres 1403171 megalitres and 6625032 megalitres of water respectively However in 2019 these figures stood at 217736 megalitres 860517 megalitres and 67686 megalitres respectively for 15 responding companies
WATER ASPECTSWater Consumptionndash the amount of water a company has drawn into its boundaries and has permanently removed from the local water cycle90
Of the 28 respondents three did not disclose water consumption data or were in their first year of measurement 9 increased their water consumption over the previous reporting year 12 decreased it and 4 reported no change
Water Withdrawalsndash the amount of water the company has temporarily removed from the local water cycle and returned as discharge water91
Of the 28 respondents three did not disclose water withdrawal data or were in their first year of measurement 7 reported an increase over the previous year 14 had lowered their withdrawal and 4 reported no change
Water Discharges ndash the amount of water that leaves a companys facility and if left untreated could be a source of pollution92
Of the 28 respondents three did not disclose water discharge data or were in their first year of measurement 9 reported an increase in water discharge over the previous year 6 lowered it and 10 reported no change CDPrsquos data highlights new acquisitions increased production activities and project expansions as the primary reasons for increased water demand amongst the companies
of companies measured all water aspects (withdrawals discharge and consumption) across 100 of facilities
64
of companies believe that availbility of good quality freshwater is vital for the success of their business39
2910
4110
10
Water withdrawalsWater recycledreused
Water discharge
Water consumption
Others
Measured and monitored water aspects
39
A N N U A L R E P O R T 2 0 2 0
Data further shows that brackish surface water and seawater were the primary water sources for industries followed by fresh surface water source The electric utilities sector was the most reliant on brackish surface water and seawater accounting for 72 of the sectorrsquos total water withdrawals At 59 fresh surface water was the primary source of withdrawal for the chemicals sector Of the 28 companies 13 had implemented water conservation measures to reduce water withdrawals from groundwater sources this year Water withdrawals from groundwater - renewable accounted for less than 05 of total withdrawals
In terms of water discharge most (81) was released into brackish surface water and seawater environments Discharges into fresh surface water accounted for the remaining 19 of the total discharges Our data suggests more companies are installing zero liquid discharge units and water harvesting techniques across their facilities leading to less groundwater discharge
Fresh surface water accounted for 29 of total water withdrawals by source in 2020 Indiarsquos major river basins - Ganges Brahmaputra Godavari Indus and Cauvery are the primary source of freshwater for the industries Around 15 of total freshwater demand from CDP responding companies was supplied by the
Investor_Signatories_v5pdf159604625890 Worldrsquos 18 Most Water-Stressed Rivers | World Resources Institute (wriorg)
Ganges and Brahmaputra river basins another 15 came from the Godavari basin followed by Cauvery Indus Banas and Sabarmati river basins The demand for water has increased over the years causing these basins to rank among the most water-stressed catchments in the world90 Of the 83 facilities in India 53 were in water-stressed regions Our data shows that around 60 of total responding companies withdrew water from water-stressed regions Of these nine were from the materials industry and two were from the food beverage amp agriculture industry
Governance and Business Strategy
For a long time corporate sustainability strategies have focused on measurable and manageable challenges such as product footprint efficiency in supply chain water conservation and others Businesses have begun to take stock of water security by innovating for improved efficiency measuring direct withdrawals assessing risk to neighbours and considering leakages
CDPrsquos data shows that corporate leaders across India are responding to this crisis by focusing on their water policy to monitor risks and opportunities and integrate it in their strategies Around 71 companies report having a documented water policy that is accessible to the public Up to 93 companies indicated that they have a board-level oversight of water related issues within the organisation observed either by the Chief Executive Officer (CEO) or the director on board followed by the board-level committee
Around 43 of the responding companies report on water-related issues quarterly and 33 more frequently This shows the increasing self-awareness among companies on water-related issues Further 63 of these companies offer some form of
facilities out of a total of 83 from the responding companies were in areas with water-stress53
Water discharge by destination
Brackish surface
water and Seawater
Fresh surface water
Groundwater
Third party
532
225
2
975
156
93
Water discharge (megalitersyear)
125
013
1
Brackish surface
water and Seawater
Groundwater ndash non
renewable
Groundwater ndash renewable
ProducedEntrained
water
Third party
Fresh surface water
231
800
261
04
405
21
489
Water withdrawals (megalitersyear)
Water withdrawals by destination
7564
662
6
No
of c
ampa
nies
Industry
1
Appa
rel
1
Biot
ech
hea
lth
care
amp p
harm
a
1
Man
ufac
turin
g
2Fo
od b
ever
age
amp ag
ricul
ture
1
Pow
er
gene
ratio
n
1
Tran
spor
tatio
n se
rvic
es
1
Serv
ices
9
Mat
eria
ls
Industry-wise water withdrawals from water-stressed areas
40
A N N U A L R E P O R T 2 0 2 0
incentive to their employees ndash monetary or otherwise -- for the management of water related issues
Businesses are stepping up and playing a vital role in developing water initiatives that can ease the stress on crucial watersheds Companies are also looking into water security related long-term business objectives and financial planning as a part of their overall business plans Almost 70 companies prefer short to mid-term (5-10 years) over long-term (11-30 years) planning This does not come as a surprise as water effects are felt locally and require more immediate strategic planning Of the 28 reporting companies 12 use climate-related scenario analysis to inform its water-related business strategy and eight anticipate doing so in the next two years A majority of these companies belong to the chemicals and the electric utilities sector
In 2019 about 13 companies were pricing their water this increased in 2020 to 18 and 50 are now exploring the its possibilities Companies such as Ambuja Cement (US$110 `7800
91 marico-sustainability-report-18pdf
Marico Ltd Establishing a strategy to improve water-security across operations and value chain
With a host of agro-based products water availability is a crucial parameter for Marico Ltd92 Under the risk management framework it has identified adverse impact of water scarcity as an environmental risk to the company To mitigate this environmental risk the company has initiated watershed management programs and a reduced-reuse-recycle model of water management across its operations Through a water stewardship program the company aims to address water security challenges in low rain-fed areas around its workplace and factories
In the reporting period FY 19-20 the company withdrew 202886 cubic meters of water and reported a reduction of 9 from previous year The company had reported a reduction of 31 in water intensity from the 2014 level through the company-wide introduction of water efficiency measures improvements in water recycling water-efficient taps and rainwater harvesting systems For improving water management practices across water stress areas Marico utilised the WRI aqueduct tool to evaluate water risk across all manufacturing facilities in India This tool helped the company identify the number of facilities that fall under the water stress area -- according to it five out of eight plants are in such zones The implementation of water conservation initiatives had helped three water-stressed sites reduce water consumption over the previous year Among three water-stressed sites Jalgaon reported 15 reduction in water consumption Baddi reported 16 and Paonta 28
Establishing a strategy to reduce and minimise water use was one of the companys key commitments Marico foresees its future water withdrawal levels reducing given its move towards improving water efficiency and incorporating recycling throughout the production cycle
Frequency of reporting on water-related issues
633
43
Annually
More frequently than quarterly
Quarterly
6
10 2Half-yearly
As important matters arise
Less frequently than annually
41
A N N U A L R E P O R T 2 0 2 0
to US$8240 `579800 per megalitre) Dr Reddyrsquos Laboratories (US$088`67 to US$591`449 per KL) Piramal Glass and Tata Steel use an internal price on water
Risks amp opportunities
Dwindling water supply is a major cause of concern for businesses since it poses significant direct and indirect impacts Visible risks such as droughts have a more explicit impact as they ruin vegetation and severely undermine the agriculture sector But subtle impacts present challenges to other sectors Water shortages also threaten the long-term viability of businesses by leading to higher costs eventually borne by the consumers Without proper management the economic repercussions of water scarcity will be felt in myriad ways92
In 2020 companies that experienced detrimental water-related impacts have incurred financial losses worth `1580 million Physical risks such as inadequate infrastructure and increased water stress account for more than half of these commercial losses followed by reputational-cum-market like subpar access to water sanitation and hygiene services and regulatory risks eg- failure to set mandatory water efficiency conservation and recycling standards Corporations should thus strategically prioritise dealing with these risks to safeguard their financial bottom lines For this organisations have looked to secure alternate sources of water supply adopt water efficiency and conservation practices as well as reuse and recycling of water
A 2018 report from NITI Aayog93 highlighted the fact that the country faced its worst water crisis that year Rising water challenges have put strong regulatory pressure on businesses in India with significant operational risks The private sector is a big contributor towards deepening water security issues but is also crucial in addressing it
Given the current situation with water resources it is perhaps unsurprising that many of the companies responding to CDP find themselves exposed to a plethora of physical and transition risks ndash that is risks from regulatory or consumer reforms aimed at addressing the water crisis These risks threaten their reputation and license to operate their supply chains security financial stability and their ability to grow As per CDPrsquos Global Water
92 httpsglobalriskinsightscom201612economic-cost-global-water-scarcity93 httpsnitigovinsitesdefaultfiles2019-06Final20Report20of20the20Research20Study20on2020Composite20Water20Resources20Management20Index20
for20Indian20States20conducted20by20Dalberg20Global20Development20Advisors20Pvt20Ltd_New20Delhipdf94 https6fefcbb86e61af1b2fc4-c70d8ead6ced550b4d987d7c03fcdd1dsslcf3rackcdncomcmsreportsdocuments000005165originalCDP_Global_Water_Report_2019
pdf159110644595 The term WASH refers to the provision of water sanitation and hygiene Universal affordable and sustainable access to WASH is a key public health issue within international
development and is the focus of the first two targets of Sustainable Development Goal 6 (SDG 6)96 httpswwwworldbankorgentopicwaterbriefwash-water-sanitation-hygiene-and-covid-19
Report 201994 the combined business value at risk reported in 2019 topped out at US$425 billion with about 40 of the risks anticipated to hit within the next 1-3 years Whether it was the blockading of a Newmont Goldcorp mine in Mexico or poor water quality threatening the production of Unileverrsquos Hellmannrsquos mayonnaise in the Mississippi River Basin the impacts of the global water crisis are already being felt
Water risks and risk assessment
As per the 2020 data 71 of the responding companies consider current or future water-related regulations as a risk to business followed by 57 companies that consider access to WASH95 services for employees as very relevant and always included in their water-risk assessments This shows that companies are vigilant about providing safe access to drinking water sanitation arrangements and proper hygiene at workplace The COVID-19 pandemic has highlighted the importance of WASH to human health and well-being Safely managed WASH services along with good hygiene practices can help prevent infectious diseases that kill millions each year96 In addition 50 companies reported that water used for their key commoditiesraw materials is relevant enough to be considered for their risk-assessment This was the most pertinent for chemical sector companies
of the 28 Indian responding companies undertake water-related risk assessment25
Total financial loss by reporting companies as per risk type
38
53
9
Reputation and Market Risk
Physical Risk
Regulatory Risk
1580 MILLION
In 2020 companies that experienced detrimental water-related impacts have incurred financial losses worth
1580 million
42
A N N U A L R E P O R T 2 0 2 0
It is crucial to consider stakeholders in risk assessment procedures for a comprehensive understanding of water-related risks Of the 25 companies that undertake water-related risk
97 httpswwwweforumorgreportsthe-global-risks-report-2020
assessments 68 always include employees in their internal assessment procedures by conducting training and awareness programs on water conversation initiatives communicating water-related policies etc This is followed by regulators and local communities who are relevant in water-risk assessment procedures at 61 and 54 respectively for the responding companies It is a positive sign that Indian companies are engaging with their employees and local communities and ensuring that the latter are not negatively impacted in terms of habitation health and water availability
According to The World Economic Forumrsquos Global Risk Report 202097 water crises are among the top five risks in terms of impact for the past ten consecutive years Water-related risks are substantive in the risk assessment processes and identified as a threat to companiesrsquo bottom line putting at risk a combined business value of US$425 billion according to CDP 2019 data
RegulatoryPhysical
Reputational
Risk due to company
Risk due to context
Expectedunexpected change or uncertainty in law or regulation
Water scarcity too much water water
unfit for use
Litigation product risks due to changes in
consumer behavior
Caused by inefficient operations produces and services resulting in water pollution over exploitation etc
Caused by changing environmental and social conditions like droughts
flooding etc
Relevancy of water-related risks
7157 57 50 46 46 43
11
Water-related
regulatory frameworks
Access to fully-
functioning safely
managed WASH
services for all employees
Water availability at a basincatchment
level
Implications of water on
your key commoditiesraw materials
Stakeholder conflicts
concerning water
resources at a basincatchment
level
Water quality at a basin
catchment level
Status of ecosystems and habitats
Other contextual
issues please specify
Empl
oyee
s
Regu
lato
rs
Loca
l com
mun
ities
Rive
r bas
in m
anag
emen
t au
thor
ities
Wat
er u
tiliti
es a
t a lo
cal l
evel
Stat
utor
y sp
ecia
l int
eres
t gr
oups
at a
loca
l lev
el
Inve
stor
s
Supp
liers
Oth
er w
ater
use
rs a
t a
basi
nca
tchm
ent l
evel
Oth
er
NG
Os
Cust
omer
s
No of Companies age of Companies
Relevancy of stakeholders in water-risk assessment
6861 54 50 50 46 46 39 36 32 2918
43
A N N U A L R E P O R T 2 0 2 0
Water risk event
Impacting business
Increased Operational amp maintenance Costs Increased Compliance amp
Administration Costs
Closure of Operations
Supply chain distributions
Brand Damage and LitigationsShareholder
Distributions
Risk transferRisk avoidance and mitigation
Technological Risks
Repurational amp Market Risks
Regulatory Risks
Physical Risks
Financial ImpactsResidual Water RiskInherent Water Risks
Increased water stress
143721Increased water scarcity
41105Drought
17604Inadequate infrastructure
820
Physical Risks
Ecosystem vulnerability
300Severe weather events
69Declining water quality
63Flooding
13
Regulatory Risks
Technology Risks
Higher water prices Transition to
water intensive low carbon energy sources
Tighter regulatory standards
2333
120
All the figures reported are in million rupees
44
A N N U A L R E P O R T 2 0 2 0
CDPrsquos data shows that physical risks seem to have the highest magnitude of impact on the Indian responding companies Drought is seen to be the primary driver of potential substantive impact
Where there is risk there is opportunity
Where therersquos risk therersquos reward Industrial wastewater for example is a vast untapped resource It is a potential source of heat power process water and high-value materials And there has never been a better time for this transformation to take place -- technologies are better the regulatory climate is favourable and the business case is clear Meanwhile the market demand for pollution-free products is growing For companies to thrive they will need to be aligned to changing consumer demands If
98 httpswwwmarketsandmarketscomMarket-Reportssmart-water-management-market-1265html
they respond to these opportunities then market differentiation resilience and profitability are on the table
Globally corporate leaders have started realising the untapped potential of smart water technology and the market for smart water management is anticipated to grow from US$846 billion in 2016 to US$2010 billion in 202198 Industrial wastewater has for a long time been reused for cooling towers steel works oil refineries textile manufacturing and paper production It was found that 15 of the 23 companies valued improved water efficiency in operations as their primary opportunity having a substantive financial or strategic impact on business
of the 28 responding companies (approx 93) identified water-related opportunities in their business26
Improved water efficiency in operations
Increased resilience to impacts of climate change
Reduced impact of product use on water resources
Improved community relations
Water recovery from sewage management
Resilience to future regulatory changes
Sales of new productsservices Increased brand value
3000million
`4000
million18752
million
opportunities were identified by 21 respondents
opportunities were identified by 11 respondents
opportunities were identified
by 9 respondents
opportunities were identified
by 4 respondents
Efficiency Resilience Products and services
Markets
22
14
10
4
`329
million
`
`
45
A N N U A L R E P O R T 2 0 2 0
26
17
14
17
2
Others
Recyclingreuse
Consumption
Product water intensity
Discharge
14
10Withdrawals
Water use efficiency
Categories of water targets monitored at the corporate level
of companies set company-wide water targets
of companies set company-wide water goals
5556
Businesses have identified transparency in water management issues as a fundamental activity and disclosure through CDPrsquos annual water questionnaire produces a standard comparable dataset McGill University and Millani found that companies disclosed through CDP ranked 19 percentiles better than the average business in their ability to access capital99 The research showed that a comprehensive voluntary disclosure produces a quality management team with enhanced awareness of threats and opportunities linked to climate and environmental change
Targets and Goals100
In response to declining water resources many companies have started engaging in water stewardship and setting water targets aligned with SDG Goal 6 to ensure availability and sustainable management of water sanitation and hygiene facilities for all101 Developing water-related targets helps companies make meaningful change from informed actions at the local level102 In 2020 four companies did not set water-related targets within their operations Whereas 24 companies had water-related targets 26 of them had set targets for product water intensity 17 set recyclingreuse targets and 14 focused on water use efficiency
Companies can set goals and targets on a range of operational issues to drive performance andor manage risks and opportunities CDPrsquos data shows that a majority had set targets at the company-wide level -- 55 of responding companies reported setting water targets across the company This was followed by 26 who set water targets at the business level and 19 at the site or facility level While setting water goals around 56 of companies monitored their goals at the company level 24 at the sitefacility level and the remaining at the basin business or country-level
99 Craig M Coulombe E Nostrat A 2019 The Role of CDP Disclosure to Improve Access to Capital Research Note httpsf01c8ee6-cac3-40ff-a0e4-8bfb54f2b88bfilesusrcomugd66e92b_30b06fd11b9c43d88428f768676e9a8bpdf
100 Targets ndash quantitative Goals - qualitative101 httpsunstatsunorgsdgsreport2020goal-06102 httpsceowatermandateorgsite-targets-guide
A company has various drivers for setting goals and targets and it tries to align these with increased stakeholder concerns and environmental legislation Data shows that most organisations considered reducing environmental impact and risk mitigation as the primary motivation for monitoring water goals and targets Organisations also considered brand value protection as one of the important factor while setting goals
24
4
Target Set No Target
No
of C
ompa
nies
Water targets monitored at the corporate level
46
A N N U A L R E P O R T 2 0 2 0
Drivers behind setting water targets and goals at the corporate level
Reduced environmental impact
Water stewardship
Risk mitigation
Recommended sector best practice
Corporate social responsibility
Brand value protection
Cost savings
Shared value
Climate change adaptation amp mitigation strategiess
Commitment to the UN SDG
Increase freshwater availability for users
Other drivers
45
14
14
2
2
2
5
14
16
12
161212
12
4
4
4
44
GoalsTargets
age of Companies
47
A N N U A L R E P O R T 2 0 2 0
PROTECTING OUR FOREST WEALTH
The world lost an estimated 10 million hectares of forest annually between 2015 and 2020104 Protecting and restoring forests and other natural ecosystems could provide up to 30 of climate change mitigation action needed to limit global warming to below 20C by 2030105
Global demand for agricultural commodities is the primary driver of deforestation and ecosystem conversion -- timber is extracted unsustainably and land is cleared for agricultural production This represents major risks to businesses as commodities associated with deforestation such as palm oil soy cattle and timber products are the building blocks of millions of products traded globally and therefore feature in the supply chains of numerous organisations
103 httpswwwipccchsrccl104 The State of the Worldrsquos Forests 2020 Forests biodiversity and people105 httpswwwpnasorgcontent1144411645106 httpsappsfasusdagovnewgainapiapiReportDownloadReportByFileNamefileName=Oilseeds20and20
Products20Annual_New20Delhi_India_04-01-2020
The unsustainable production and supply of these commodities and activities not only poses a significant business risk but also has a severe negative impact on the environment especially the climate crisis
Deforestation is fundamentally linked to climate change According to the IPCC Special Report on Climate Change and Land (2019)103 11 of global GHG emissions are from deforestation and from the conversion of natural ecosystems for human use
At an 8 annual growth rate edible oil consumption in India is growing faster than the 3 growth rate in production Imports and imports are rising to fill the gap As a result India still is the largest importer of edible oils followed by China European Union and the United States Indiarsquos edible oil imports in MY 202021 are predicted to rise 6 to 15 MMT of this 85 MMT will be palm oil 35 MMT soybean 28 MMT sunflower seed oil and 02 MMT rapeseed (canola) oil
-United States Department of Agriculture106
In 2020 three Indian companies responded to CDPrsquos forests questionnaire -- one responded to the request for disclosure from investors while two responded to their customers Globally 687 companies responded to CDPrsquos forests questionnaire and 57 of them evaluated deforestation-related risks at US$5312 billion
13The mitigation potential of reduced deforestation is
13 of the global emissions
We cant address climate change without protecting our forests
They are vital carbon stores that help reduce global warming
48
A N N U A L R E P O R T 2 0 2 0
Disclosure on deforestation management through CDP could be a significant opportunity for companies operating in India one of the largest importers of palm oil in the world This can help Indian companies tap into lucrative opportunities by scaling sustainable trends CDPrsquos forests questionnaire allows companies that produce source or use palm oil soy timber cattle cocoa coffee and rubber to disclose Moreover new biodiversity-focused metals amp mining and coal sector questionnaires were introduced in 2019
Palm oil is the most commonly used processed oil in industrial food production with its production being responsible for 5 of global tropical deforestation107 Indiarsquos palm oil imports account for nearly 23rd of its total imports of edible oil This demand was shaken in 2020 when the pandemic hit with a 40 fall in the consumption of palm oil during the lockdown108 Indiarsquos imports which account for nearly 20 of the global trade in palm oil will have a major effect on efforts to make its production and processing sustainable The primary barrier for sustainable palm oil consumption in
India stems from it belonging to a more price-sensitive and volume driven market making environmental impacts a low or non- existent priority in the minds of consumers
Climate change can reduce palm oil production and with demand outstripping supply prices could rise The Roundtable on Sustainable Palm Oil (RSPO) has developed a set of environmental and social criteria which companies must comply with in order to produce Certified Sustainable Palm Oil (CSPO) When properly applied these criteria can help in minimising the negative impacts of palm oil cultivation
107 Deforestation amp Palm Oil 108 As worldrsquos largest importer of palm oil India has a duty to push for ethical production practices109 httpsseaofindiacominterim-data-on-import-of-edible-oils-march-2020-down-by-32-percent-nov19-to-mar20-down-by-10-percent110 httpsappsfasusdagovnewgainapiapiReportDownloadReportByFileNamefileName=Oilseeds20and20Products20Annual_New20Delhi_India_04-01-2020111 httpsresourcetradeearthyear=2018ampexporter=76ampimporter=699ampcategory=87ampunits=value112 httpswwwrvonlsitesdefaultfiles201705poultry-sector-in-india-2017pdf113 httpsresourcetradeearthpublicationscocoa-trade-climate-change-and-deforestation
The Sustainable Palm Oil Coalition for India (I-SPOC) was formed to promote the uptake of sustainable palm oil and its derivatives in India CDP amongst others has joined it as a member
Soy cultivation is the second largest soft commodity driver of tropical deforestation after cattle products Various aspects of soy production generate GHGs that contribute to climate change India imports around 33 lakh tons of soybean oil109 According to data from the US Department of Agriculture India
is set to import 35 lakh metric ton of soybean oil in 20202021110 In addition India is also responsible for clearing huge spaces of forest land in Brazil that contributed to 23 of soybean imports to India in 2018111 Soy is also used as fodder for livestock and a growing local demand for poultry products will further affect Indiarsquos position on deforestation The country ranks amongst the top four producers of egg and chicken in the world and it is increasingly exporting to the Middle East and Europe112
Cocoa has been a notable agent of deforestation since the last century The global production of cocoa has increased from 34 million to 45 million tonnes between 2000 and 2014 while the land use footprint of its plantations rose by 37 to 257 million acres113 About 90 of
cocoa is produced by 7 countries -- Ivory Coast Ghana Indonesia Ecuador Cameroon Brazil and Nigeria The dearth of incentives for improving the plantations combine with high investment costs to make cocoa a low yield crop forcing farmers to resort to clearing untouched forest lands in order to meet the growing demand and
lsquoPalm oil consumption dropped by
in 2020 in India due to COVID-19rsquo
40
Climate-Water-Forest nexus
Water is an essential component of mitigation and adaptation strategies
Rising temperatures and changing weather patterns increase stress on water availability
Tropical forests provide substantial emission reductions by acting as carbon sinks
Droughts resulting from rising temperatures and changes in weather patterns increase the risk of forests fires
A major portion of gobal freshwater depends on forests
49
A N N U A L R E P O R T 2 0 2 0
for cutting down production costs114 In Southern India Cocoa is mainly grown as an intercrop in conjunction with coconut areca nut oil and rubber plantations Indiarsquos consumption in 2015-16 was 30000 tonnes of which 57 was imported while the domestic production rose at an annual rate of 37 in the same period115 Failure to protect forests in the event of a sharp cocoa price increase will lead to unsustainable levels of deforestation116
The US$10 billion coffee industry too leaves a gargantuan ecological footprint It is estimated that every cup of coffee consumed results in the loss of one square inch of forest cover117 Each year around 250000 acres of land is cleared for coffee which is unsustainable The Kodagu district
in the Western Ghats of India is a major biodiversity hotspot which produces about one-third of the countryrsquos coffee This region has more than 270 tree species which are all under significant ecological stress due to the coffee farms that threaten land use and land cover while potentially leading to the felling of about 21000 trees118
An estimated 8-10 of global production of low-cost timber products comes from illegal logging in forests To meet the burgeoning demand of timber produce about 25 million acres of land is converted to fast-
wood forests (timber plantations) across the world annually and this hampers the ecosystem services that nature provides us119 With the World Bank forecasting that the global market for wood is set to quadruple by 2050120 reducing timberrsquos environmental footprint is vital for the industryrsquos success In India there is no provision of a central data pool that maintains records of production and consumption of timber There is a need to address this inconsistency in reporting and data collection by forging a comprehensive strategic policy and providing institutional support121 This would ensure effective collaboration among all stakeholders that would result not only in the production of quality forest products but also a sustainable timber sector
114 httpsresourcetradeearthpublicationscocoa-trade-climate-change-and-deforestation~text=As20cocoa20tends20to20beforest20loss20over20this20time115 httpseconomictimesindiatimescomindustrycons-productsfoodalthough-indias-consumption-of-chocolate-is-steadily-growing-but-we-still-depend-on-imports-for-116 httpsnationalzoosieduscbimigratorybirdsresearchcacaorufcfm117 httpsohiostatepressbookspubsciencebiteschaptera-bitter-brew-coffee-production-deforestation-soil-erosion-and-water-contamination~text=For20every20cup20of20
coffeeinch20of20rainforest20was20destroyedamptext=Chemical20buildup20in20soils20andsoil20eroding2C20and20land20degradation118 httpswebcachegoogleusercontentcomsearchq=cacheYhaeYHVPWasJhttpswwwmdpicom1999-4907114480pdf+ampcd=6amphl=enampct=clnkampgl=in119 httpsresourcetradeearthyear=2018ampexporter=76ampimporter=699ampcategory=87ampunits=value120 httpdocuments1worldbankorgcurateden240231467291388831pdf106467-REVISED-v1-PUBLICpdf121 httpsonlinelibrarywileycomdoifull1011111477-894712094122 httpsglobalforestatlasyaleeduamazonland-usecattle-ranching123 httpsresourcetradeearthyear=2018ampimporter=699ampcategory=779ampunits=value124 httpsresourcetradeearthyear=2018ampimporter=699ampcategory=779ampunits=value125 httplargestanfordeducourses2018ph240halper1~text=Every20half20hour2C20a20cowmore20potent20than20carbon20dioxideamptext=There20is20
rampant20deforestation2C20especiallyto20make20room20for20cattle126 httpswwwinvestopediacomarticlesinvesting0929155-countries-produce-most-carbon-dioxide-co2asp127 httpwwwcwejournalorgvol9no3do-extensive-rubber-plantation-influences-local-environment-a-case-study-from-tripura-northeast-india128 httpswwwibeforgdownloadRubber_Plastics_220708pdf
Beef production remains by far the largest driver of deforestation in the worldrsquos tropical forests as forest land cleared for cattle is more than twice the combined area required for producing soy palm oil and wooden products The problem of cattle ranching
is particularly profound in the Amazon region the largest forest reserve in the world leading to 80 of present deforestation rates122 Clearing land for grazing causes irreversible habitat loss soil degradation and conflict between humans and wild animals India imports 15 and 12 of bovine leather from Turkey and Brazil respectively which poses a great threat to the forest areas of these countries123 It also jeopardises the earnings of the Indian companies manufacturing such products for its European consumers who have a high degree of sensitivity and awareness around deforestation124 In a larger context the impact of cattle stretches far beyond the realm of forests and is one of the key reasons for rising global emissions and climate change There are more than 15 billion cows on Earth with each of them capable of expelling 17 times more GHG emissions than cars in the form of methane burps a gas several times more potent than CO2 in terms of trapping heat It is therefore not surprising that cattle accounts for a colossal 18 in atmospheric carbon emissions125 To put this in perspective this surpasses emissions of the third largest CO2 emitter India which accounts for a 7 share in worldwide emissions126
Another commodity whose production has significant impact on the environment is rubber Environmentalists have warned for years that the rapid expansion of rubber plantations would come at the expense of natural forests Rubber has
not been subjected to extensive publicity in a way that palm oil soy and paper have been over the years given their impact on the environmentmdashpublicity that has led to adoption of robust sustainability criteria for these commodities Indiarsquos natural rubber plantation spans across an area of 183 million acres as of 2012 with the raw material being used as an input for making 35000 finished products of industrial importance127 Currently the impact assessment of large-scale rubber plantations on the environment is non-existent in the country a worrying sign considering Indiarsquos position as the 4th largest consumer in the world128
50
A N N U A L R E P O R T 2 0 2 0
Fossil-fuel and mineral mining accounts for 7 of global deforestation Moreover it not only presents a threat to forest cover and resource extraction but also leads to long-term impacts such as soil and water pollution infrastructure development and
increased anthropogenic activity129 While the effects of large-scale mining are easier to quantify as they are well regulated and undertake environmental impact assessments it is the scope and impact of artisanal and small-scale mining (ASM) that goes under the radar due to lack of data and a high degree of informality in the sector In India this problem warrants special attention since over 12 million people are engaged in the ASM business with women and girls from backward communities and those living below the poverty line being its primary employees130 A landscape-level approach is critical not only to identify and monitor the environmental and social impacts of individual mining projects but also to consider its interactions with other land uses as well given the crucial role forests play in balancing the ecosystem131 Indiarsquos investor requested company Hindustan Zinc Ltd was the first to disclose this year under the mining sector
129 httpsglobalforestatlasyaleeduland-usemining-extraction130 httpswwwpactworldorgstate20of20asm131 httpswwwresearchgatenetpublication38084575_Landscape_approach_for_quantifying_land_use_land_cover_change_1972-2006_and_habitat_diversity_in_a_mining_area_in_
Central_India_Bokaro_Jharkhand
Hindustan Zinc Pioneering forest and biodiversity conservation in the mining sectorHindustan Zinc Limited is the first investor-requested company in India to respond to CDPrsquos Forests questionnaire It demonstrated that a dedicated Biodiversity Policy and Management Standard is its compass in reducing flora and fauna disruption and in minimising or compensating its impact of operation through project scoping site closure and beyond
Companies in India currently lag behind their regional peers in terms of disclosure on deforestation management with only 3 companies disclosing on this topic in 2020
40
65
22
3China Japan IndiaSEA
(Indonesia Malaysia
Phillipines Singapore Vietnam)
Total no of companies disclosing through CDPs Forests questionnaire in 2020 by HQ countryregion
51
A N N U A L R E P O R T 2 0 2 0
Nagpur
Udaipur
Panaji
Kochi
Rajkot
Vadodara
Delhi
Dehradun
Ahmedabad
Thane
Chennai
Tiruchirappalli Coimbatore
Bangalore
Kolkata
Gangtok
Siliguri
India Snapshot
CITIES STATES AND REGIONS
Cities
In 2020 over 800 cities disclosed their environmental information through CDP including 16 Indian cities The number of cities in India disclosing through the CDP-ICLEI Unified Reporting System increased from 13 in 2019 to 17 This was largely due to citiesrsquo ongoing commitments to climate leadership initiatives such as the C40 Cities Climate Leadership Group (C40) the Global Covenant of Mayors for Climate and Energy (GCoM) and our partnership with ICLEI whose South Asia Regional Office also acts as the GCoM South Asia Helpdesk
88 global cities reached CDPrsquos A list which include Bristol (UK) Miami (USA) Cape Town (South Africa) Buenos Aires (Argentina) and Auckland (New Zealand)
despite the COVID-19 pandemic The USA accounts for the highest number
(25) of cities on the A List making up 28 despite the US pulling out of
the Paris Agreement In India more than half the cities in disclosed
that
they either have sustainability targets incorporated into the master planning of the city or it is in progress while only 43 of the cities have a published plan that addresses climate change adaptation Approximately half of the disclosing Indian cities have identified opportunities as a result of addressing climate change and one-third of them have a GHG emission reduction target which is a strong indication towards a low carbon development pathway
States and Regions
In 2020 the Union Territories of Delhi and Jammu amp Kashmir along with over 120 states and regions from across the world disclosed their environmental impacts through CDP Globally 90 of states and regions reporting a 2030 target have one in line with the IPCCrsquos goal to reduce global greenhouse gas emissions by 40-50 from 2010 levels by 2030 and 55 of states and regions with a 2030 emissions reduction
target are showing greater ambition than their national
counterparts
Indian cities and 16
Indian states disclosed to CDP
2
52
A N N U A L R E P O R T 2 0 2 0
ANNEXURESAppendix I Table of emissions scores and sector by company
Sector Company Name 2020 permission Status
Final score 2020
Scope 1 Scope 2 Scope 3 Number of categories reported in Scope 3
Bars hotels amp restaurants
Indian Hotels Co Ltd
public C 50610 239568 23824 3
Biotech amp pharma Biocon public C 41948 133110 Not Provided
Dr Reddyrsquos Laboratories
public B 247317 154836 1272548 8
ZCL Chemicals public D- Not Provided Not Provided Not Provided
Cement amp concrete ACC public B 16966585 643870 648068 3
Ambuja Cements public B 14523738 551219 1973622 7
Dalmia Bharat Ltd
public B 11280051 537968 1320736048 9
JK Cement non public D Private Private Private Private
JSW Cement Limited
public B- 1398609 647870 572488 4
Shree Cement non public C Private Private Private Private
Ultratech Cement
public B 47954830 1327185 5376354 4
Chemicals Aarav Frances amp Flavors Private
Limited
public Not Scored
GHCL LIMITED public D 109470536 496707 Not Provided
Godrej Industries public B 32311 44361 6735893 3
Gujarat Fluorochemicals
non public C Private Private Private Private
Jubilant Life Sciences Ltd
non public C Private Private Private Private
Kansai Nerolac Paints Limited
non public Not Scored Private Private Private Private
Tata Chemicals public B 444988061 4505956 12162395 5
UPL Limited non public Private Private Private Private Private
Godrej Consumer
Products Limited
public A- 33980 30848 26433 2
Note Due to increase in sample size more samples were considered for this report These samples include companies from the BSE Top 200 list CDPrsquos Fixed Income sample FAIRR sample Emerging markets sample Environmental sample and Continuity climate change sampleFor further details visit https6fefcbb86e61af1b2fc4-c70d8ead6ced550b4d987d7c03fcdd1dsslcf3rackcdncomcomfycmsfilesfiles000003423originalCDP_Climate_Change_Sample_Investor_Request_2020pdfNot Scored- Companies who have submitted the minimum version questionnaire
53
A N N U A L R E P O R T 2 0 2 0
Sector Company Name 2020 permission Status
Final score 2020
Scope 1 Scope 2 Scope 3 Number of categories reported in Scope 3
Energy utility networks
Adani Transmission
Ltd
public D 31870076 21155 9379637 3
GAIL public C 4925087 387358 1071 1
Financial services Axis Bank public B 6250 168043 4414712 3
HDFC Bank Ltd public B 764919 390176 1642453 3
Indusind Bank public A 88316 6278567 1277912 3
Kotak Mahindra Bank
public C 9078 69780 4290177 3
LampT Finance Holdings Limited
non public Private Private Private Private Private
State Bank of India
public B- 390 1066386 257902 5
YES BANK Limited
public A- 344515 3099369 4859625 3
Agricultural commodities
Tata Consumer Products Ltd
public A- 11731 34238 3348672939 10
Marico public A- 1380 12140 499568 9
Intermodal transport amp logistics
Adani Ports amp Special
Economic Zone
public B- 95905791 176946845 202567171 3
IT amp software development
HCL Technologies
non public Private Private Private Private Private
Infosys Limited public A- 15344 124063 371602 6
Larsen amp Toubro Infotech Ltd
public B 39485 2521874 1908034 2
Mindtree Ltd non public A- Private Private Private Private
Tata Consultancy
Services
public A- 26714 811815 702615 7
Tech Mahindra public A 1803807 105736586 39285212 5
Wipro public A- 13366 124564 421527 7
Land amp property ownership amp development
Godrej Properties Limited
public Not Scored 4400 2429 422
Mahindra Lifespace
Developers Limited
public B 397 2675 589525 8
Light manufacturing APOLLO TYRES LTD
public Not Scored 24207 60717 Not Provided
JK Tyres amp Industries
public C 158568 88424 Not Provided
54
A N N U A L R E P O R T 2 0 2 0
Sector Company Name 2020 permission Status
Final score 2020
Scope 1 Scope 2 Scope 3 Number of categories reported in Scope 3
Media telecommunications amp data center services
Bharti Airtel non public D Private Private Private Private
Reliance Jio Infocomm
Limited
public B 105018 1826762 243195034 3
Tata Communications
public A- 6376 108482 6938 3
Metal smelting refining amp forming
Hindustan Zinc public A 4480887 253756 4182181 10
Vedanta Ltd public B- 57482869 1864711 Not Provided
JSW Steel Ltd public A- 40045307 476901 4168823 8
Tata Steel public A- 60116322 5687999 14970000 12
Metallic mineral mining
NMDC public D 29004 63671 1957 1
Oil amp gas processing Bharat Petroleum
Corporation
public B 5023580 366230 729820 2
Indian Oil Corporation
public D 18690000 54700 Not Provided
Renewable power generation
Adani Green Energy
public D 841 13313 1174 1
Azure Power public Private 323 2767
Specialized professional services
Mahindra amp Mahindra Financial Services
public B 3370 18847 22922 3
Piramal Enterprises
public C 4430568 8692844 Not Provided
Vakrangee Softwares Ltd
public B 2053355 35409 Not Provided
Textiles amp fabric goods
ARVIND Ltd public B- 3514561 238894 Not Provided
Thermal power generation
Adani Power Ltd public D 58970705 14607 6910800 1
JSW Energy public B 17200521 36117 61151 2
NTPC Ltd public D 252495018 15845 978052 3
Tata Power Co public C 34952981 22051 1226 1
Tobacco ITC Limited public B- 1241718 230192 206064 5
Transportation equipment
Hero Motocorp Ltd
non public D Private Private Private Private
Mahindra amp Mahindra
public A 40654 414552 58425531 11
Tata Motors public A- 60533 266200 3140861 8
55
A N N U A L R E P O R T 2 0 2 0
Climate Change ndash Investor requested companies132
CDP Activity Group Company name Response Status
Air transport InterGlobe Aviation Ltd Not submitted
Jet Airways (India) Ltd Not submitted
Apparel design Page Industries Ltd Not submitted
Bars hotels amp restaurants
Indian Hotels Co Ltd Submitted
Jubilant Foodworks Ltd Not submitted
Biotech amp pharma Abbott India Ltd See Another
Ajanta Pharma Ltd Not submitted
Alkem Laboratories Ltd Not submitted
Aurobindo Pharma Not submitted
Biocon Submitted
Cadila Healthcare Not submitted
Cipla Not submitted
Divirsquos Laboratories Not submitted
Dr Reddyrsquos Laboratories
Submitted
Glenmark Pharmaceuticals
Not submitted
Lupin Not submitted
Natco Pharma Ltd Not submitted
Pfizer Ltd See Another
Sun Pharma Advanced Research Company Ltd
Not submitted
Sun Pharmaceutical Industries
Not submitted
Torrent Pharmaceuticals
Not submitted
Cement amp concrete ACC Submitted
Ambuja Cements Submitted
Dalmia Bharat Ltd Submitted
India Cements Not submitted
JK Cement Ltd Submitted
Orient Cement Limited Not submitted
Shree Cement Submitted
The Ramco Cements Ltd
Not submitted
Ultratech Cement Submitted
132 These include companies from the BSE Top 200 list CDPrsquos Fixed Income sample FAIRR sample Emerging markets sample Environmental sample and Continuity climate change sample For further details visit https6fefcbb86e61af1b2fc4-c70d8ead6ced550b4d987d7c03fcdd1dsslcf3rackcdncomcomfycmsfilesfiles000003423originalCDP_Climate_Change_Sample_Investor_Request_2020pdf
See Another -The response is covered by another CDP reporting company usually the parent company
CDP Activity Group Company name Response Status
Chemicals Asian Paints Not submitted
Berger Paints India Ltd Not submitted
Castrol India Not submitted
Colgate Palmolive India See Another
Coromandel International
Not submitted
Dabur India Not submitted
Emami Ltd Not submitted
Godrej Consumer Products Limited
Submitted
Godrej Industries Submitted
GRAPHITE INDIA LTD Not submitted
HEG LTD Not submitted
Jubilant Life Sciences Ltd
Submitted
Kansai Nerolac Paints Limited
Submitted
PI Industries Ltd Not submitted
Pidilite Industries Ltd Not submitted
Procter amp Gamble Hygiene amp Health Care Ltd
See Another
SRF Ltd Not submitted
Supreme Industries Ltd Not submitted
Tata Chemicals Submitted
UPL Limited Submitted
Coal mining Adani Enterprises Not submitted
Coal India Not submitted
Gujarat Mineral Devp Corpn
Not submitted
Commercial amp consumer services
Quess Corp Ltd Not submitted
Construction Bharti Infratel Limited Not submitted
GVK Power amp Infrastructure
Not submitted
Honeywell Automation India Ltd
See Another
Larsen amp Toubro Not submitted
Voltas Not submitted
Appendix II List of companies invited to respond to CDP
56
A N N U A L R E P O R T 2 0 2 0
CDP Activity Group Company name Response Status
Financial services Gruh Finance Ltd Not submitted
HDFC Asset Management
Not submitted
HDFC Bank Ltd Submitted
HDFC Life Insurance Company Ltd
Not submitted
Housing Development Finance Corporation
Not submitted
ICICI Bank Limited Not submitted
ICICI Lombard General Insurance Company Ltd
Not submitted
ICICI Prudential Life Insurance Company Ltd
Not submitted
IDBI Bank Ltd Not submitted
IDFC First Bank Ltd Not submitted
Indiabulls Housing Finance Ltd
Not submitted
Indiabulls Ventures Ltd Not submitted
Indian Bank Not submitted
Indusind Bank Submitted
Kotak Mahindra Bank Submitted
LampT Finance Holdings Limited
Submitted
LIC Housing Finance Not submitted
Max Financial Services Not submitted
Motilal Oswal Financial Services Ltd
Not submitted
Muthoot Finance Limited
Not submitted
PNB Housing Finance Ltd
Not submitted
Power Finance Corporation
Not submitted
Punjab National Bank Not submitted
RBL Bank Ltd Not submitted
REC Ltd Not submitted
Reliance Nippon Life Asset Management Ltd
Not submitted
SBI Life Insurance Company Ltd
Not submitted
Shriram Transport Finance Co
Not submitted
State Bank of India Submitted
Union Bank of India Not submitted
YES BANK Limited Submitted
CDP Activity Group Company name Response Status
Convenience retail Avenue Supermarts Ltd Not submitted
Discretionary retail Aditya Birla Fashion and Retail Ltd
Not submitted
Future Retail Ltd Not submitted
Electrical amp electronic equipment
Amara Raja Batteries Ltd
Not submitted
Bharat Electronics Not submitted
Crompton Greaves Consumer Electricals Ltd
Not submitted
Exide Industries Not submitted
Havells India Not submitted
Motherson Sumi Systems
Not submitted
Whirlpool of India Ltd See Another
Energy utility networks
Adani Gas Ltd Not submitted
Adani Transmission Ltd Submitted
CESC Ltd Not submitted
GAIL Submitted
Indraprastha Gas Ltd Not submitted
Power Grid Corpn of India
Not submitted
Reliance Infrastructure Not submitted
Torrent Power Not submitted
Financial services AU Small Finance Bank Ltd
Not submitted
Axis Bank Submitted
Bajaj Finance Limited Not submitted
Bajaj Finserv Not submitted
Bajaj Holdings amp Invst (BHIL)
Not submitted
Bandhan Bank Not submitted
Bank of Baroda Not submitted
Bank of India Not submitted
Canara Bank Not submitted
Cholamandalam Investment and Finance Co Ltd
Not submitted
Cholamandalam Investment and Finance Company Ltd
Not submitted
City Union Bank Ltd Not submitted
Edelweiss Financial Services Ltd
Not submitted
Federal Bank Not submitted
General Insurance Corporation of India
Not submitted
57
A N N U A L R E P O R T 2 0 2 0
CDP Activity Group Company name Response Status
Food amp beverage processing
Britannia Industries Not submitted
Marico Submitted
Tata Consumer Products
Submitted
United Breweries Not submitted
United Spirits Not submitted
Varun Beverages Ltd Not submitted
Venkys India Ltd Not submitted
Health care provision Apollo Hospitals Enterprises
Not submitted
Industrial support services
GMR Infrastructure Limited
Not submitted
Intermodal transport amp logistics
Adani Ports amp Special Economic Zone
Submitted
Container Corporation of India
Not submitted
IT amp software development
HCL Technologies Submitted
Infosys Limited Submitted
Larsen amp Toubro Infotech Ltd
Submitted
Mindtree Ltd Submitted
MphasiS Not submitted
Oracle Financial Services
See Another
Tata Consultancy Services
Submitted
Tech Mahindra Submitted
Wipro Submitted
WNS Holdings ADR Not submitted
Land amp property ownership amp development
DLF Not submitted
Godrej Properties Limited
Submitted
Housing Development amp Infrastructure
Not submitted
Oberoi Realty Not submitted
Leisure amp home manufacturing
Rajesh Exports Ltd Not submitted
Titan Company Limited Not submitted
Light manufacturing 3M India Ltd Not submitted
APOLLO TYRES LTD Submitted
Balkrishna Industries Ltd
Not submitted
Ceat Ltd Not submitted
MRF LTD Not submitted
CDP Activity Group Company name Response Status
Media telecommunications amp data center services
Bharti Airtel Submitted
Reliance Communications
Not submitted
Sun TV Network Not submitted
Tata Communications Submitted
Vodafone Idea Ltd Not submitted
Zee Entertainment Enterprises
Not submitted
Metal products manufacturing
AIA Engineering Ltd Not submitted
Bosch Ltd See Another
Endurance Technologies Ltd
Not submitted
Gillette India Not submitted
Metal smelting refining amp forming
Bharat Forge Ltd Not submitted
Essar Steel Limited Not submitted
Hindalco Industries Not submitted
Hindustan Zinc Submitted
Jindal Stainless Ltd Not submitted
Jindal Steel amp Power Not submitted
JSW Steel Ltd Submitted
Steel Authority of India Not submitted
Tata Metaliks Ltd Not submitted
Tata Steel Submitted
Vedanta Ltd Submitted
Metallic mineral mining
National Aluminium Co Not submitted
NMDC Submitted
Oil amp gas extraction amp production
Oil India Ltd Not submitted
Petronet LNG Not submitted
Oil amp gas processing Bharat Petroleum Corporation
Submitted
Hindustan Petroleum Corporation
Not submitted
Indian Oil Corporation Submitted
Mangalore Refinery and Petrochemicals
Not submitted
Nayara Energy Limited Not submitted
Oil amp Natural Gas Corporation
Not submitted
Reliance Industries Not submitted
Oil amp gas storage amp transportation
Gujarat State Petronet Not submitted
Other materials Astral Poly Technik Ltd Not submitted
Powered machinery Bharat Heavy Electricals
Not submitted
Cummins India See Another
58
A N N U A L R E P O R T 2 0 2 0
CDP Activity Group Company name Response Status
Renewable power generation
Adani Green Energy Submitted
Azure Power Submitted
National Hydroelectric Power Corporation Ltd (NHPC)
Not submitted
ReNew Power Private Limited
Not submitted
SJVN Ltd Not submitted
Specialized professional services
LampT Technology Services Ltd
Not submitted
Mahindra amp Mahindra Financial Services
Submitted
NBCC Ltd Not submitted
Piramal Enterprises Submitted
Vakrangee Softwares Ltd
Submitted
Textiles amp fabric goods
ARVIND Ltd Submitted
Birla CelluloseGrasim Industries
Not submitted
Chennai Petroleum Corporation
Not submitted
Thermal power generation
Adani Power Ltd Submitted
Aditya Birla Capital Not submitted
JSW Energy Submitted
KSK Energy Ventures Limited
Not submitted
NLC India Ltd Not submitted
NTPC Ltd Submitted
Reliance Power Not submitted
Tata Power Co Submitted
Tobacco ITC Limited Submitted
Transportation equipment
Ashok Leyland Not submitted
Bajaj Auto Not submitted
Eicher Motors Ltd Not submitted
Hero Motocorp Ltd Submitted
Mahindra amp Mahindra Submitted
Maruti Suzuki India Not submitted
Tata Motors Submitted
TVS Motor Company Ltd
Not submitted
Web amp marketing services
Info Edge (India) Ltd Not submitted
Wood amp paper materials
Century Textiles amp Industries
Not submitted
59
A N N U A L R E P O R T 2 0 2 0
Climate Change ndash Self Selected companies
CDP Activity Group Company name Response Status
Chemicals AARAV FRANCES amp FLAVORS PRIVATE LIMITED Submitted
GHCL LIMITED Submitted
Gujarat Fluorochemicals Submitted
Light manufacturing JK Tyres amp Industries Submitted
Cement amp concrete JSW Cement Limited Submitted
Land amp property ownership amp development Mahindra Lifespace Developers Limited Submitted
Media telecommunications amp data center services
Reliance Jio Infocomm Limited Submitted
Biotech amp pharma ZCL Chemicals Submitted
Water Security ndash Investor requested companies133
CDP Activity Group Name Response Status
Bars hotels amp restaurants Indian Hotels Co Ltd Submitted
Biotech amp pharma Ajanta Pharma Ltd Not submitted
Alkem Laboratories Ltd Not submitted
Aurobindo Pharma Not submitted
Biocon Not submitted
Cadila Healthcare Not submitted
Cipla Not submitted
Divirsquos Laboratories Not submitted
Dr Reddyrsquos Laboratories Submitted
Glenmark Pharmaceuticals Not submitted
Lupin Not submitted
Natco Pharma Ltd Not submitted
Sun Pharmaceutical Industries Not submitted
Torrent Pharmaceuticals Not submitted
ZCL Chemicals Submitted
Cement amp concrete ACC Not submitted
Ambuja Cements Submitted
Dalmia Bharat Ltd Not submitted
Shree Cement Not submitted
The Ramco Cements Ltd Not submitted
Ultratech Cement Submitted
Chemicals Asian Paints Not submitted
Berger Paints India Ltd Not submitted
Castrol India Not submitted
Coromandel International Not submitted
Dabur India Submitted
Emami Ltd Not submitted
Godrej Consumer Products Limited Submitted
Godrej Industries Submitted
Jubilant Life Sciences Ltd Submitted
Kansai Nerolac Paints Limited Submitted
Pidilite Industries Ltd Not submitted
Procter amp Gamble Hygiene amp Health Care Ltd Not submitted
SRF Ltd Not submitted
Supreme Industries Ltd Not submitted
Tata Chemicals Submitted
133 These include companies from the Water Global sample and Continuity water security sample For further details visit https6fefcbb86e61af1b2fc4-c70d8ead6ced550b4d987d7c03fcdd1dsslcf3rackcdncomcomfycmsfilesfiles000003422originalCDP_Water_Security_Sample_Investor_Request_2020pdf
60
A N N U A L R E P O R T 2 0 2 0
CDP Activity Group Name Response Status
UPL Limited Submitted
VVF Ltd Not submitted
Coal mining Adani Enterprises Not submitted
Coal India Not submitted
Construction Larsen amp Toubro Not submitted
Discretionary retail Aditya Birla Fashion and Retail Ltd Not submitted
Electrical amp electronic equipment Amara Raja Batteries Ltd Not submitted
Exide Industries Not submitted
Havells India Not submitted
Energy utility networks GAIL Not submitted
Power Grid Corpn of India Not submitted
Food amp beverage processing Marico Submitted
Tata Consumer Products Ltd Submitted
IT amp software development Tech Mahindra Submitted
Light manufacturing APOLLO TYRES LTD Not submitted
JK Tyres amp Industries Submitted
MRF LTD Not submitted
Media telecommunications amp data center services
Tata Communications Not submitted
Metal smelting refining amp forming Bharat Forge Ltd Not submitted
Hindalco Industries Not submitted
Hindustan Zinc Submitted
Jindal Steel amp Power Not submitted
JSW Steel Ltd Not submitted
Tata Steel Submitted
Metallic mineral mining National Aluminium Co Not submitted
NMDC Not submitted
Oil amp gas extraction amp production Oil India Ltd Not submitted
Petronet LNG Not submitted
Oil amp gas processing Bharat Petroleum Corporation Not submitted
Hindustan Petroleum Corporation Not submitted
Indian Oil Corporation Not submitted
Oil amp Natural Gas Corporation Not submitted
Reliance Industries Not submitted
Oil amp gas storage amp transportation Gujarat State Petronet Not submitted
Specialized professional services Piramal Enterprises Submitted
Textiles amp fabric goods ARVIND Ltd Submitted
Birla CelluloseGrasim Industries Not submitted
Thermal power generation Adani Power Ltd Submitted
JSW Energy Not submitted
NTPC Ltd Submitted
Tata Power Co Submitted
Tobacco ITC Limited Submitted
Transportation equipment Ashok Leyland Not submitted
Bajaj Auto Not submitted
Hero Motocorp Ltd Not submitted
Mahindra amp Mahindra Submitted
Maruti Suzuki India Not submitted
Tata Motors Not submitted
61
A N N U A L R E P O R T 2 0 2 0
Water Security ndash Self Selected companies
CDP Activity Group Name Response Status
Chemicals AARAV FRANCES amp FLAVORS PRIVATE LIMITED Submitted
Transportation services Adani Ports amp Special Economic Zones Submitted
Other materials Piramal Glass Submitted
62
A N N U A L R E P O R T 2 0 2 0
Appendix III - Indian Companies Committed to ActionScience-based Target initiative (SBTi)Approved 15degC
Mahindra Heavy Engines Ltd Mahindra EPC Irrigation Limited White House
Dr Reddys Laboratories Ltd Swaraj Engines Limited Gromax Agri Equipment Limited
Mahindra Accelo Mahindra Holidays and Resorts India Limited Mahindra Lifespaces Developers Limited
Mahindra Lifespaces Developers Limited Mahindra World City (Jaipur) Ltd Mahindra World City Developers Ltd
Polygenta Technologies Limited
Approved well-below 2degC
Tata Chemicals Limited Mahindra amp Mahindra Limited Wipro
Mahindra First Choice Services Ltd Mahindra Electric Mobility Ltd
Approved 2degC
Hindustan Zinc Limited Mahindra Sanyo Special Steel Shree Cement Ltd
Tech Mahindra
SBTi Committed
Infosys Limited UPL Limited JSW Energy Limited
Godrej Agrovet Limited Godrej Consumer Products Limited Godrej Industries
Godrej Properties Limited Godrej amp Boyce Mfg Co Ltd Ultratech Cement Limited
Vakrangee Limited ACC Limited Adani Ports and Special Economic Zone Limited
SCM Garments PVT Limited Nahar Industrial Enterprises Limited Ambuja Cement Ltd
Adani Green Energy Ltd Reliance Jio Infocomm Limited Bharti Airtel Limited
Gujarat Fluorochemicals Ltd (GFL) Dalmia Bharat Limited HCL Technologies
Havells India Limited Mahindra Susten Eastman Exports Global Clothing Pvt Ltd
JK Tyre amp Industries Ltd Marico Limited Tata Global Beverages Ltd
EPC Industries Limited Mahindra amp Mahindra Financial Services Limited YES BankSBTi companies not in CDP Sample
RE100Dalmia Bharat Ltd Infosys Ltd Mahindra Holidays amp Resorts India Ltd
Tata Motors Ltd
RE100 companies not in CDP Sample
Internal Carbon Pricing (ICP)Pricing carbon in 2020
ACC Ambuja Cements Dalmia Bharat Ltd
Dr Reddyrsquos Laboratories Godrej Consumer Products Godrej Industries
Gujarat Fluorochemicals Hero Motocorp Ltd Hindustan Zinc
63
A N N U A L R E P O R T 2 0 2 0
Infosys Limited JSW Cement Limited JSW Steel Ltd
Mahindra amp Mahindra Mindtree Ltd Shree Cement
Tata Chemicals Tata Consultancy Services Tata Consumer Products
Tata Motors Tata Steel Tech Mahindra
Ultratech Cement Wipro
Planning to price in the next two years
Adani Ports amp Special Economic Zone ARVIND Ltd GAIL
GHCL LIMITED Indian Hotels Co Ltd JK Tyres amp Industries
JSW Energy Jubilant Life Sciences Ltd Larsen amp Toubro Infotech Ltd
Mahindra amp Mahindra Financial Services Mahindra Lifespace Developers Limited Marico
NTPC Ltd Piramal Enterprises Reliance Jio Infocomm Limited
Tata Communications Tata Power Co UPL Limited
Vakrangee Softwares Ltd Vedanta Ltd YES BANK Limited
64
A N N U A L R E P O R T 2 0 2 0
About CDPCDP is a not-for-profit charity that runs the global disclosure system or investors companies cities states and regions to manage their environmental impacts by running a global environmental disclosure system Each year CDP supports thousands of companies cities states and regions to measure and manage their risks and opportunities on climate change water security and deforestation We do so at the request of their investors purchasers and city stakeholders
Over the last two decades we have created a system that has resulted in unparalleled engagement on environmental issues worldwide In 2020 Over 9600 companies reported through CDP on climate change water security and forests and over 800 cities and more than 120 states and regions disclosed their environmental impacts through CDP
CDP IndiaCDP began working in India in 2008 and was formally registered in 2012 working on disclosure and driving climate action It serves as a source of knowledge for hundreds of Indian corporations from those that are just beginning on the road to corporate environmental disclosure through to those looking to improve sustainability and make commitments to reduce environmental impact
It is the only NGO to be named in Indiarsquos INDC submission to the UNFCCC owing to its corporate environmental data repository and tracking of emissions and mitigation data from the Indian Industry CDP India also actively participated in Government of Indiarsquos Ministry of Environment Forests amp Climate Change (MoEFCC) work on future carbon market mechanisms In addition to our work on disclosure CDP India is actively engaged in other initiatives including Internal Carbon Pricing (ICP) Science-based targets (SBT) and RE100
65
A N N U A L R E P O R T 2 0 2 0
CDP ContactsFor more info contact Damandeep Singh Director CDP India damandeepsinghcdpnet infoindiacdpnet
CDP Board of Directors
Bharati Chaturvedi Founder amp Director Chintan Environmental Research and Action Group
Ramakrishnan Mukundan Managing Director amp CEO Tata Chemicals Limited
Damandeep Singh Director CDP India
Important Notice
The contents of this report may be used by anyone providing acknowledgement is given to CDP Worldwide (CDP) This does not represent a license to repackage or resell any of the data reported to CDP or the contributing authors and presented in this report If you intend to repackage or resell any of the contents of this report you need to obtain express permission from CDP before doing so
CDP India has prepared the data and analysis in this report based on responses to the CDP 2020 information request No representation or warranty (express or implied) is given by CDP India as to the accuracy or completeness of the information and opinions contained in this report You should not act upon the information contained in this publication without obtaining specific professional advice To the extent permitted by law CDP India do not accept or assume any liability responsibility or duty of care for any consequences of you or anyone else acting or refraining to act in reliance on the information contained in this report or for any decision based on it All information and views expressed herein by CDP India is based on their judgment at the time of this report and are subject to change without notice due to economic political industry and firm-specific factors Guest commentaries where included in this report reflect the views of their respective authors their inclusion is not an endorsement of them
CDP India their affiliated member firms or companies or their respective shareholders members partners principals directors officers andor employees may have a position in the securities of the companies discussed herein The securities of the companies mentioned in this document may not be eligible for sale in some states or countries nor suitable for all types of investors their value and the income they produce may fluctuate andor be adversely affected by exchange rates
lsquoCDP Worldwidersquo and lsquoCDPrsquo refer to CDP Worldwide a registered charity number 1122330 and a company limited by guarantee registered in England number 05013650
copy 2020 CDP Worldwide All rights reserved
This report is printed on recycled paper
This report is printed on CyclusPrint based on 100 recycled fibres
This report is printed on CyclusPrint based on 100 recycled fibres
Supported by Scoring partner
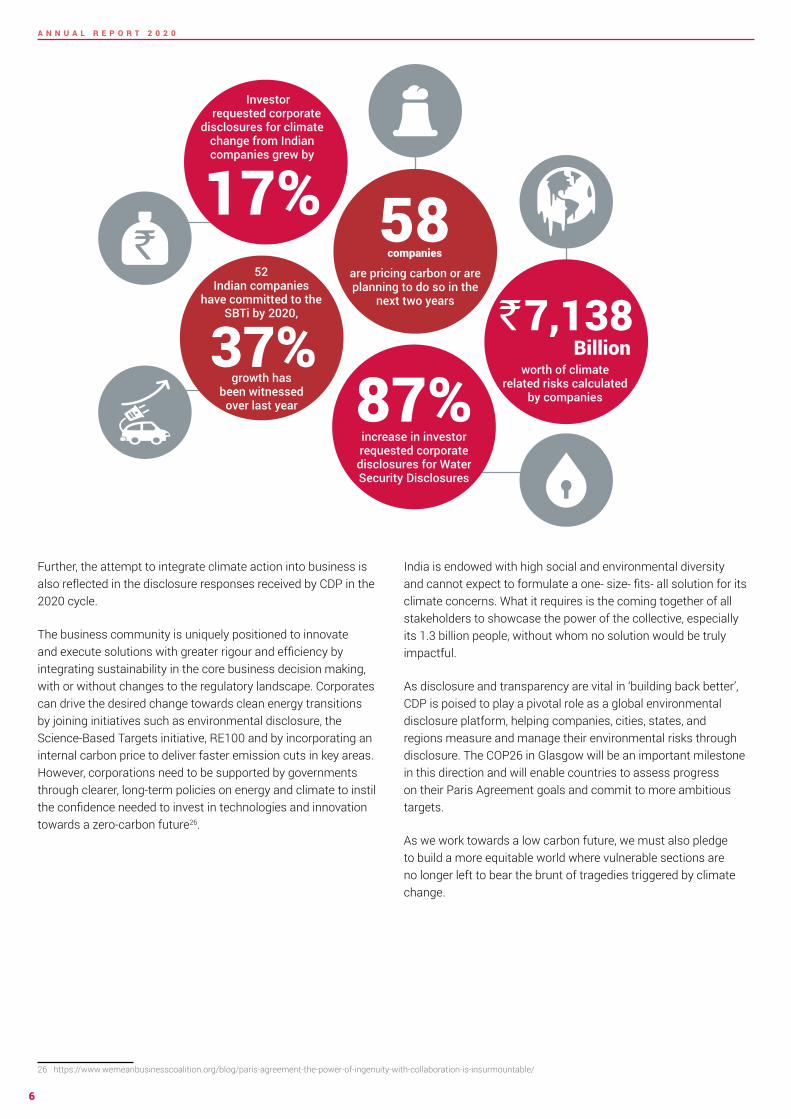
7
A N N U A L R E P O R T 2 0 2 0
Business leaders are almost unanimously deliberating on climate issues and an overwhelming majority of companies now incentivise their managements to undertake climate action About three-fourths of these incentives are in the form of a financial compensation GAIL has a portal where staff members can give their suggestions on how to manage climate risks and employees whose suggestions are accepted are given a financial reward of `100000 Among the various types of non-monetary rewards BPCL recognises employees for undertaking initiatives in Health Safety Security and Environment (HSSE) through an annual performance award Mahindra amp Mahindra provide acknowledgement certificates to employees for energy efficiency projects as well as to those contributing to the annual sustainability reporting
The most commonly appointed positions that companies have chosen to place the responsibility of overseeing climate-related issues are board-level committee members the CEO the director the board chair and the CSO These individuals are also at the top of the corporate ladder which denotes the growing importance of climate change not just as a sustainability issue but as a broader global risk that threatens to undermine financial bottom lines erode shareholder value and tarnish brands
More than 75 companies provide an update to their respective boards on climate change-related issues at least
27 httpcbsteriinorgindiaghgphp~text=The20total20inventory20managed20bypercent20of20Indias20total20emissions
every quarter highlighting the growing importance of environmental sustainability as a core business value
Sustainability is deeply entrenched in the financial structure of companies today influencing access to capital capital expenditure direct and indirect costs and capital allocation Hence it comes as no surprise that 66 out of 67 companies stated that climate-related risks and opportunities have had an impact on their organisationrsquos strategy for financial planning Of these 66 companies 46 have also developed a low-carbon transition plan to minimise the losses to their bottom lines
SUSTAINABILITY ndash HEART OF GOOD GOVERNANCE
Businesses that currently account for 76 of the total energy consumption are vital for the country to tread the path of sustainable development As engines that will drive economic growth in the aftermath of the pandemic corporates present an immense opportunity for India to meet its climate commitments (NDCs) under the Paris Agreement through large-scale emissions reduction29
Frequency of reporting of climate-related issues
Oversight amp Incentive
Board- level oversight Incentive to management
99 8845
34
8
53
More frequency than quarterly
Quarterly
Half-yearly
4Annually
As important
matters arise
Not reported to the board
a
ge o
f com
pani
es
8
A N N U A L R E P O R T 2 0 2 0
Climate-related scenario analysis allows businesses to not only project future operational emissions but also mobilise necessary resources to offset the carbon footprint in their sustainability measurement approach It is especially important that the application of scenario analysis incorporates dynamic and unstable conditions under which companies are operating such as the COVID-19 pandemic that has resulted in mass layoffs economic recession and lockdowns across the world This would enable corporations to explore a broader range of uncertainties and be more resilient to external drivers of change28
The rigorous computational analysis would provide direction to enterprises on how to set emission reduction targets in line with the 20C scenario About 63 of the reporting companies use climate analysis tools such as models or scenarios enumerated
28 httpswwwfsborgwp-contentuploadsP291020-3pdf
under the Nationally Determined Contributions and International Energy Agencyrsquos 2 Degree Scenario (2DS) to inform their business strategy
Climate-based risks and opportunities have also influenced the strategy of companies in the sphere of investment in RampD Products amp Services Operations and Supply ChainValue chain Among these areas 87 companies claimed that Operations were affected and 84 reported changes in planning for Products and Services
Investmentin RampD
343
657
No
of C
ompa
nies
No Yes
Product amp Services 164
836
No Yes
No
of C
ompa
nies
Supply chain Value chain
701
298
No Yes
No
of C
ompa
nies
Operations
866
134No
of C
ompa
nies
No Yes
9
A N N U A L R E P O R T 2 0 2 0
CLIMATE-RELATED RISKS amp OPPORTUNITIESMore often than not the financial impacts of climate-related issues are not quantified and identifying them in the first place could be challenging These issues necessitate actions Increasingly investors lenders and other financial regulators are becoming more focused on ensuring that the private sector is ready to address climate risks and grab opportunities brought by changing climate
29 httpthoughtleadershipaoncomDocuments20200122-if-natcat2020pdfutm_source=cerosamputm_medium=storypageamputm_campaign=natcat20
30 httpswwwbankofenglandcouk-mediaboefilesspeech2019avoiding-the-storm-climate-change-and-the-financial-system-speech-by-sarah-breedenpdf
31 httpsreadoecd-ilibraryorgviewref=136_136201-ctwt8p7qs5amptitle=Making-the-Green-Recovery-Work-for-Jobs-Income-and-Growth_
32 https6fefcbb86e61af1b2fc4-c70d8ead6ced550b4d987d7c03fcdd1dsslcf3rackcdncomcmsreportsdocuments000005312originalAnalysis_of_CA100__Data_for_CDP_Investor_Signatories_v5pdf1596046258
33 Climate Action 100+ is an investor initiative to ensure the worldrsquos largest corporate GHG emitters take necessary action on climate change The companies include 100 lsquosystemically important emittersrsquo accounting for 23rd of annual global industrial emissions alongside more than 60 others with significant opportunity to drive the clean energy transition Read more at httpwwwclimateaction100org
Climate change has already shown substantial impacts on businesses all around the world and this is expected to continue As per a 2019 report 29 the total direct economic losses incurred due to climate-related natural disasters in 2019 were estimated at US$232 billion In India the monsoon floods in June-October 2019 caused an economic loss of US$10 billion and claimed 1750 lives Additionally the Bank of England has estimated asset losses worth US$20 trillion due to climate change if no action is taken now 30
COVID-19 has taught the world how the pandemic can actually be used as an
opportunity to better understand and mitigate climate-related
risks Investors are now more than ever more focussed on risk exposure Post-COVID-19 civil society groups governments and business are all have aligned in trying to reduce the risks to our economy and world going forward
As per an OECD report despite widespread socio-
economic suffering suffering there is an increase in public
consciousness about the risks to the natural system from anthropogenic activities31
CDP recently released a report32 on the analysis of CA100+ companies for CDP Investor Signatories Up to 118 of 122 CA100+33 companies report being exposed to substantive climate-related risks and opportunities 93 companies identified climate-related risks and 91 identified climate-related opportunities as having the potential to have a substantive financial or strategic impact on their businesses
As per CDP Indiarsquos 2020 data companies have a varied definition of what short medium and long-term means for them -- a rough average across the sample would be three years for short term five years for medium term and 15-20 years for the long term although the latter also ranges up to 100 years These time frames are important in planning risk management processes -- contextualisation of risks in terms of potential market changes and evolving technological scenarios around risk management at enterprise level
Responding companies
67Companies identified
climate related substantive risks
62Companies
identified risk typesdrivers
60Companies
identified potential financial impact
driver
60
Companies provided potential financial
impact figures
42
10
A N N U A L R E P O R T 2 0 2 0
THE RISKS OF CLIMATE CHANGE
In terms of risk types current regulation was deemed to be most relevant and always included in 97 of the organisationsrsquo climate-related risk assessments This was followed by emerging regulation and technology Interestingly findings from responses submitted by global companies corroborate this trend analysis as almost all CA100+ respondents reported policy and legal risks as potential drivers for substantive impact when it comes to transition risk34 With regular compliance checks increased stakeholder concern and sustainably evolving consumer demands climate-related risk assessment procedures can help companies become better equipped to handle longer-term uncertainties and liabilities
The number of companies that identified inherent climate-related risks with potential substantive financial or strategic impact on businesses rose to 94 from 88 in 2019 Up to 63 of reporting companies were able to get to the last mile of providing a financial impact figure to the risks identified Disclosing Indian companies put the total inherent financial impact of climate risks at `7138 billion with an average risk per company being `92 billion
Companies have also identified climate-related risks across their value chain with direct operations being the most severely affected and exposed most to acute physical risks followed by emerging regulation current regulations and chronic physical risks Companiesrsquo lsquodownstreamrsquo value chain is affected the most by market risks followed by acute physical risks Downstream value chain refers to the third parties benefiting from the outputs products and services of business activities This may be a companyrsquos customers and clients or the organisations and projects the business invests in This could possibly mean that changing customer behaviour could gravely affect a business operation if there is a shift in the demand for a comparatively low-carbon intensive product as well as greater demand for product efficiency regulations and standards providing clear evidence that there is a continuous shift towards sustainable products
CLIMATE RISKS AN OPPORTUNITY TO RESTRATEGISE
Up to 94 of reporting companies have identified climate-related opportunities as having the potential to make a substantive financial or strategic impact on businesses And 63 have provided a potential financial impact figure to the opportunities related to climate change Disclosing companies put the cost of climate-related opportunities at a total of `2787 billion The figure is a testament to the evolution of the climate change mitigation program and how organisations see this
34 https6fefcbb86e61af1b2fc4-c70d8ead6ced550b4d987d7c03fcdd1dsslcf3rackcdncomcmsreportsdocuments000005312originalAnalysis_of_CA100__Data_for_CDP_Investor_Signatories_v5pdf1596046258
No of Companies
Opp
ortu
nity
typ
es
Opportunity identified in value chain
Direct operations
Downstream
Upstream
Resource efficiency
Product and services
Energy source
Markets
Resilience
41
25 18
34 7
7
9 3
3
2
3
396
6
Risks relevant to Indian companies
Current regulation97Emerging regulations90Reputation90Market85Technology85Legal
Acute physical
Chronic physical
827973
No of Companies
Risk occuring in value chain
No of Companies
Risk
type
s
Reputation
Legal
Emerging regulation
Chronic physical
Technology
Market
Current regulation
Acute physical
Direct operations
Downstream
Upstream
5115
2
2923 4 8
17
8 14 7122 4
40 5 8
2
31
11
A N N U A L R E P O R T 2 0 2 0
Similarly most companies saw resource efficiency as a major climate-related opportunity followed by energy source and products and services in their lsquodirect operationsrsquo The main drivers behind these opportunities were use of more efficient production and distribution processes use of lower-emission sources of energy and development andor expansion of low-emission goods and services In the lsquodownstreamrsquo value chain products and services was majorly witnessed as an opportunity as there is growing consumer awareness and concern around sustainability related issues As a result companies are constantly diversifying their portfolios to address these consumer needs
Prod
uct a
nd s
ervi
ces
Ener
gy S
ourc
e
Resi
lienc
e
Resi
lienc
e
Ener
gy S
ourc
e
Reso
urce
effi
cien
cyM
arke
ts
2787identified to be the financial impact of reported climate-
related opportunities (in rupee billion)
Billion
`452
328
270
18
1719
Responding companies
67Companies
identified climate related
substantive opportunities
63Companies identified
opportunitiy typesdrivers
61
Companies identified
potential financial impact driver
60
Companies provided potential financial impact
figures
42
2041
4715
136
119
42413842
Acut
e ph
ysic
alCu
rren
t reg
ulat
ion
Emer
ging
regu
latio
n
Chro
nic
phys
ical
Repu
tatio
nO
ther
s
Lega
l
Tech
nolo
gyM
arke
t
7138identified to be the financial impact of reported climate-
related risks (in rupee billion)
Billion
`Financial impact of reported climate-related risks (in rupees billion)
Financial impact of reported climate-related opportunities (in rupees billion)
12
A N N U A L R E P O R T 2 0 2 0
Tech Mahindra Tapping into climate-related opportunities
Tech Mahindrarsquos approach towards climate change mitigation strategies is a testament to the efficacy of tapping into and realising climate-related opportunities The company has adopted Science-Based Targets to reduce its emissions and is a signatory to Business Ambition of 15 degree Celsius Tech Mahindra is committed to responsibly managing its operations through continuous improvement in sustainability practices across its value chain The company focuses on carbon emission reductions energy consumption reduction self-generation of energy from renewable energy sources and encouragement for green projects through Power Purchase Agreements The company has taken a target to increase Renewable Energy (RE) to 50 by 2025 Their sustainability report is aligned with CDSB amp Task Force on Climate-related Financial Disclosures (TCFD) frameworks
A constant focus on green energy and sustainable operations has provided a significant saving of US$27 million brought about by increasing renewable energy capacity to 1383MW leading to a saving of 28 million units of electricity adopting energy efficient practices across their facilities
Tech Mahindra has harnessed the power of disruptive next-generation technologies such as Artificial Intelligence (AI) analytics and blockchain to create solutions that ensure both its own and its customersrsquo carbon footprint reduction The company has contextualised opportunities for its customers as well by creating smart city offerings such as SMART Grid Micro-Grid-As-A-Service Intelligent Electric Vehicle Charging System (IEVCS) smart energy management smart traffic management smart lightening management smart waste management systems and command amp control centres These smart city offerings will help reduce carbon footprints across multiple smart cities globally thereby reducing carbon emissions and contributing to green and sustainable solutions It is claimed that the market size for this is expected to reach US$4639 billion by 2027
At present the risks identified by the responding companies significantly outweigh the opportunities Opportunities are slow to emerge and companies need to focus on the use of lower-emission sources of energy development andor expansion of low-emissions goods and services development of climate adaptation resilience and insurance risk solutions and use of more efficient production and distribution processes
In 2015 at the request of the G20 Finance Ministers and Central Bank Governors the Financial Stability Board (FSB) and its chair Mark Carney established the industry-led TCFD This was set up in response to increasing demands from investors lenders insurers regulators policy makers and other stakeholders in the financial markets for decision-useful climate-related information CDP has aligned its information requests with the TCFD alongside introducing a sectoral focus and adopting a forward-looking approach to climate-risk disclosure We are already going in the direction of mandatory disclosure of climate risks how they are present in a companyrsquos activities how they manage it and how resilient they are to it The UK will be the first country in the world to make TCFD-aligned disclosures fully mandatory across the economy by 2025 going beyond the lsquocomply or explain approachrsquo35
35 httpswwwgovukgovernmentnewschancellor-sets-out-ambition-for-future-of-uk-financial-services
13
A N N U A L R E P O R T 2 0 2 0
Under current policies Indiarsquos projected emissions for 2030 can achieve a rating of ldquo15degC Paris Agreement compatiblerdquo if domestic emissions peak and start reducing with international support36 This shows that India has the potential to become a world leader with enhanced 15-degree compatible targets through a swift transition from coal to renewable energy Although India was already on track to meet its NDCs pre-COVID19 it has seen an even more significant drop in emissions since the onset of the pandemic During the peak of lockdown Indiarsquos energy demand reduced by almost 30 in April 202037 ie each additional week of lockdown the annual energy demand fell by 0638 This is mostly due to the significant reduction in energy consumption and power generation via fossil fuel However the impact of the pandemic on emissions is expected to be temporary and emissions are likely to rebound in 202139 as per estimations
In comparison to the NDCs which set an overall emissions target sectoral indicators can be more reliable in making informed decisions on mapping emissions reduction targeting Paris-compatible goals40 The
36 Climate Action Tracker- Fair Share37 Carbon Brief Analysis Indiarsquos CO2 emissions fall for first time in four decades amid coronavirus38 httpswwwieaorgreportsindia-202039 Carbon Brief Global Carbon Project Coronavirus causes lsquorecord fallrsquo in fossil-fuel emissions in 2020 Dec 202040 httpswwwoecd-ilibraryorgdocserver9789264273528-4-en
pdfexpires=1607881602ampid=idampaccname=guestampchecksum=891034D10FA31A953F7924772F23966D41 httpssciencebasedtargetsorgresourceslegacy201505Sectoral-Decarbonization-Approach-Reportpdf42 IPCC Mitigation Pathways Compatible with 15degC in the Context of Sustainable Development
major challenge is how to translate global temperature goals into individual actions However various strategies can be adopted to meet the long-term goals
The Science-Based Targets Initiativersquos (SBTi) Sectoral Decarbonisation Approach (SDA) allocates the well below 2degC carbon budget to different sectors taking into account inherent differences among sectors such as how fast each sector can grow relative to economic and population growth along with its mitigation potential41 According to the Intergovernmental Panel on Climate Change (IPCC) the highest global carbon budget allocation (for the period of 2011-2050) is for the power sector (25) followed by agriculture (24) and industry [including steel aluminium chemical and paper] (14)42
EMISSIONS TRENDS AND VERIFICATION
13increase in number of
organisations reporting
27increase in emissions
reporting (Scope 1+Scope 2)
90increase in scope 3 emissions reporting
India under its NDCs pledged to reduce its emissions intensity by 33-35 by 2030 compared to the 2005 levels The Climate Action Tracker38 rates Indiarsquos NDC target as ldquo2009 Copenhagen 2degC goal compatiblerdquo indicating that its commitment is a ldquofair sharerdquo of the global effort
Scope 1 and Scope 2 Emissions reported via CDP over the years
(In Million tCO2e)
2018 2019 2020
2997
55717037
14
A N N U A L R E P O R T 2 0 2 0
In order to allocate sector-specific questions to companies CDP has developed an Activity Classification System (ACS)43 It is a framework used to classify companies under the most relevant sectors It focuses on the diverse activities from which companies derive revenue associating them with the impacts to their business from climate change water security and deforestation This approach allows a better understanding of company actions based on their environmental risk opportunity and impact CDPrsquos Climate Change questionnaire requests companies to disclose their direct and indirect emissions under different emissions categories Although India saw an overall decrease in emission in 2020 there was an increase in CDP reporting companies and hence an overall increase in emissions reporting For the year
43 https6fefcbb86e61af1b2fc4-c70d8ead6ced550b4d987d7c03fcdd1dsslcf3rackcdncomcmsguidance_docspdfs000001540originalCDP-ACS-full-list-of-classificationspdf1520244912
44 The location-based method reveals what the company is physically putting into the air and the market-based method shows emissions the company is responsible for through its purchasing decisions
2020 the companies reported 70374 MtCO2e of total [Scope 1+Scope 2 (location-based)] emissions which is a 27 increase in reported emissions from 2019 This is mostly because of the significant increase in emissions reporting from several sectors mdash electric utilities cement and other heavy sectors
Only four companies chose a Scope 2 market-based approach and 43 companies selected a scope 2 location-based approach44 The total scope 2 emissions for location-based approach amounted to 181 MtCO2e and market-based approach amounted to 414 MtCO2e It is clear from this breakdown that a range of sectors and processes contribute to global emissions Focusing on any single sector alone would be insufficient However as can be seen in the
Emissions reported in Scope 3 Categories
4949
1414
1111
1010
88
55
33
Use of sold products
Purchased goods and services
Upstream transportation and
distribution
Downstream transportation and
distribution
Fuel and energy related activities (not included
in scope 1 and 2)
End of life treatment of sold products
Others
In 2020 companies have reported MtCO2e of total (Scope 1+2 [location-based]) emissions704
Gross Emissions Data 2020 (in MtCO2e)
682
126418
Gross Scope 1 Emissions
Gross Scope 3 EmissionsGross Scope 2 Emissions (Market and
Location based)
Scope 2 Location based emissions Scope 2 Market based emissions
Metal smelting refining and forming
Financial services
Cement amp concrete
Media telecommunications amp data center services
IT amp software development
Energy utility network
Chemicals
Textiles amp fabric goods
Oil amp gas processing
Biotech and pharma
Thermal power generation
Intermodule transport amp Logistics
Bar Hotels and Restaurants
Transportation equipment
Metallic mineral mining
Others
2911712
703
688536
165 292207
144118113
093087
071063
020057
024045044
157
Scope 2 Market-based emissions Scope 2 location-based emissions
Scope 2 market-based and location-based emissions reported as per CDPrsquos Primary Activity Group classification (in MtCO2e)
15
A N N U A L R E P O R T 2 0 2 0
graph for Gross Scope 2 emissions metal smelting refining and forming sectors contribute to the maximum emissions (1712 MtCO2e) followed by financial services and cement and concrete sectors
Companies reported 1259 MtCO2e of Scope 3 emissions in 2020 a 90 increase from 2019 figures due to higher disclosure as well as more companies disclosing their Scope 3 GHG inventories Almost half of the Scope 3 emissions were reported in the following categories use of sold products (49) followed by purchased goods and services (14) upstream transportation and distribution (11) and downstream transportation and distribution (10)
The ACS sectoral analysis shows that the transportation equipment activity group has the maximum reported scope 3 emissions at 615 MtCO2e followed by metal smelting refining and forming activity group at 2332 MtCO2e and cement and concrete activity group at 989 MtCO2e
Of the responding companies 33 have reported an approximately 11 of reduction in their gross global emissions (Scope 1 and 2 combined) from 2019 and 26 companies reported an approximate 57 increase in their gross global emissions from 2019 Responding companies have identified change in boundary45 as a major reason for a 62 increase in emissions from 2019 followed by acquisitions which led to a to 30 increase Amongst all sectors the electric utilities sector accounts for 83 of total increased emission values and up to 73 of these were due to change in boundary
Amongst all sectors reduction in emissions values since 2019 were mostly caused by emissions reduction initiatives (43) followed by change in output (30) and change in emission estimation methodology (23)
45 This refers to changes in the boundary used for inventory calculation ie changing from financial control to operational control This option could also apply if organisation has incorporated facilities into its inventory that were excluded in previous years
Amongst all sectors steel saw the highest reduction (around 48) in emission values and approximately half of this was achieved only from change in emission estimation methodology through recalibrating the GHG emissions for the reporting period This is followed by cement which reported a 29 reduction in emission values from implementing emissions reduction initiatives It is also noted that more than 30 of responding companies have adopted a change in renewable energy consumption but this accounts for only 35 of total reduction in emission values
Scope 3 emissions reported as per CDPrsquos Primary Activity Group classification (in MtCO2e)
of increased emissions in 2020 attributed to Change in boundary62
32 attributed to acquisitions
Metal smelting refining and forming
Cement amp concrete
Media telecommunications amp data center services
Chemicals
IT amp software development
Food amp beverage processing
Oil amp gas processing
Biotech and pharma
Thermal power generation
Land amp property ownership amp development
Financial services
Transportation equipment
Others
6157
2332
989
796
790
632
385
158
127
073
059
039
055
Third-party verification or assurance in place for Scope 12 amp 3 emissions
3571
Scope 1
3643
Scope 2 (location-based
or market based)
2786
Scope 3
a
ge o
f com
pani
es
16
A N N U A L R E P O R T 2 0 2 0
Third-party verification is one of the significant components of emission reporting An independent verification of self-reported data provides credibility and assurance It helps companies improve their internal processes identify risks and opportunities increase the reliability of their data reduce operational costs and building a strong reputation46 When an organisation monitors and verifies its emissions it can accurately identify and understand the true proportions of emissions from its sources and this can help it realise the major opportunities for emission reduction along with cost benefits
In 2020 50 companies reported third-party verification or assurance for Scope 1 emissions 51 companies for Scope 2 emissions and 39 companies for Scope 3 emissions Compared to 2019 there is an 18 increase in companies that have verified Scope 3 GHG emissions This indicates that Indian companies are becoming increasingly aware of their emission managementaccounting Amongst all sectoral companies which opt for third-party verification of their reported emissions around 25 are from IT amp software development and financial services Cement and concrete sectors rank the lowest on the list CDP encourages companies to have verified data submitted
46 The business benefits of third party verification of climate data A CDP Guide
Building a stronger reputation via third party verification
bull Increase confidence in data for internal and external use
bull Develop and demonstrate an effective carbon reduction strategy Improve business processes
bull Reduce operational costsbull Full-fill one of the mandatory criteria for entry
to the CDP A-list by gaining full points on CDPrsquos Scope 1 and 2 verification questions
bull Provide credibility for products services and internal processes
bull Counteract claims of greenwashing
17
A N N U A L R E P O R T 2 0 2 0
DECARBONISING ACROSS VALUE CHAIN Scope 3 emissions typically arise from the supply chain and the consumers using the product It has been found that the emissions from the supply chain are 5-6 times more than the carbon footprint of a companyrsquos direct operations and hence account for lionrsquos share of an organisationrsquos overall emissions47
47 httpswwwcdpnetenarticlessupply-chainsupplier-engagement-leaderboard-201948 httpswwwbcgcomen-inpublications2020supply-chain-needs-sustainability-strategy
Walking the extra mile in terms of engaging with stakeholders especially suppliers and customers on climate issues allows an organisation to consider the whole gamut of emissions and have better control over their emissions inventory For example metal companies can improve their supply chainrsquos environmental performance through adoption of a circular economy model which leads to an increased use of recycled materials in products reduces the emissions by lowering the overall burden on the manufacturing plant to produce from scratch and creates a closed-loop system with consumers48 This yearrsquos data indicates that 88 of companies engaged with their value chain partners on climate-
related issues an improvement of 5 over 2019 There was also an increase in absolute numbers -- 59 business entities collaborated with value chain partners against 49 last year
The main forms of engagement with suppliers are compliance and onboarding followed by incentivisation and information collection Educationinformation sharing collaboration and innovation are the most common customer engagement processes
Types of engagement with suppliers
No of Companies engaging with value chain on climate-related issues
2121
22
331212
1313
44
44
Other partners in the value chain customers suppliers
Other partners in the value chain suppliers
Customers
Customers Suppliers
Suppliers
Other partners in the value chain
Other partners in the value chain customers
of companies engage with their value chain partners on climate related issues an improvement of 5 from 2019
88
26
Compliance amp onboarding
16
Engagement amp incentivisation
(changing supplier behavior)
9
Information collection
(understanding supplier behavior)
7
Innovation amp collaboration
(changing markets)
No
of C
ompa
nies
18
A N N U A L R E P O R T 2 0 2 0
Organisations are mindful of the fact that climate issues need to be dealt using a participatory approach that encompasses all partners in the value chain as well as engages other external stakeholders Companies are thus getting serious about engaging in a comprehensive dialogue on climate change as this will allow them to have inputs in shaping public policy In their attempt to influence climate policies organisations are establishing communication channels with stakeholders like policymakers trade associations and research funding organisations A positive sign emerging is that majority of the businesses are agreeing to comply with environmental legislations unconditionally Energy efficiency and clean energy generation have garnered the support of 71 and 68 of responding companies respectively Mandatory carbon reporting and increased climate resilience have also found acceptance
With the COVID-19 pandemic wreaking havoc across the world and leading to the first-ever recorded recession in India it is important that companies view this as an opportunity to build a more resilient economy one in harmony with nature and encouraging of a more inclusive environment for supplier engagement that would expedite decarbonising Engaging with the value chain offer a strategic advantage as it allows companies to take a lead on corporate sustainability and puts them in a position to set the blueprint for other businesses to follow
19
A N N U A L R E P O R T 2 0 2 0
Emission reduction targets and initiatives
Targets
In recent years accelerated climate change has forced businesses to set more ambitious climate goals and commit to advocating for a low-carbon economy Today it is considered a standard practice for businesses to report their annual emissions and undertake efforts to reduce their carbon footprint Of the 67 Indian companies responding to investor requests 57 have undertaken a total of 95 emissions reduction targets including absolute targets intensity targets and both absolute and intensity targets 24 of these were approved SBTs
The global pandemic has reinforced the need for business resilience in operations and corporate leaders have started recognising that science-based climate action goes hand-in-hand with building business success49 Companies are looking science-based targets as guiding lights with a defined pathway to future-proof growth and with impending climate change hazards more companies have doubled down on their commitments towards a low-carbon transition50 The momentum for SBTs has reached across a range of industries including cement
49 The new normal 1000 companies are now setting science-based climate targets - Science Based Targets50 httpswwwcdpnetenarticlesclimate2020-lessons-from-an-extraordinary-year
automobiles pharmaceuticals metals amp mining real estate and information technology
As more companies are striving toward commitments this year witnessed an increase in the number of approved SBTs from seven targets last year to 24 targets this year
Leading companies are moving forward by setting long-term emissions reduction targets to mitigate climate-related risks Compared to 2019 this year more targets
were set under a long-term time frame till 2030 and a lesser focus had been given on short-term targets ie till 2020 Most of the companies selected a base year of 2018 and had gone for the intensity targets Hence in upcoming years long-term targets can play a major role for companies to support their sustainability visions and their journey towards low-carbon transition Apart from these companies also reported 83 other targets which included 38 energy consumption targets 13 energy productivity targets and 11 waste management targets amongst others
TARGETS amp PERFORMANCE
More than
three times increase in the number of approved science-based targets
of the responding companies set long-term targets (ie till 2030)
50
15
Absolute target
5Both absolute and intensity
targets
37
Intensity target
10
No target
No of Companies
GHG Emission Reduction Target Types
Absolute emission targets count
Intensity emission targets count
Types of targets based on time-frame of target year
820
Till 2020
1929
Till 2021 - 2030
136
2031 and beyond
20
A N N U A L R E P O R T 2 0 2 0
Emission reduction initiatives
While the number of companies taking up Emission Reduction Initiatives (ERI) has grown from 53 to 58 the number of initiatives has declined from 293 to 287 resulting in a 13 decrease in the estimated annual CO2e savings this year
Energy efficiency in production processes and in buildings continue to account for most ERIs non-energy industrial process emission reductions have been outweighed in their CO2e saving potential
Other emission reduction initiatives such as upgrading equipment with high-efficiency alternatives and digitisation initiatives undertaken by banks accounted for the highest estimated CO2e savings In terms of the highest monetary savings energy efficiency in production processes contributed to 76 of monetary savings followed by energy-efficiency in building services
The steel sector had the highest number of initiatives for energy efficiency in production process and accounted for
of total estimated annual CO2e savings
88Monetary Savings from Emission Reduction Initiatives
Annual monetary savings (Million `) No of Initiatives
20611 1918 576 237 148Energy
efficiency in production processes
Non-energy industrial process
emissions reductions
Other initiative
Waste reduction
and material circularity
Energy efficiency in
buildings
150
63 1210
2
Emission Reduction Initiatives
6340 2772 2574 2016 1278
6310
150
122
Other initiatives
Non-energy industrial process
emissions reductions
Energy efficiency in production processes
Waste reduction
and material circularity
Energy efficiency in
buildings
No of InitiativesEstimated annual CO2e savings (MtCO2e)
21
A N N U A L R E P O R T 2 0 2 0
The rise in climate consciousness among Indian companies is evident from the growing number of those committed to the Science Based Target Initiative (SBTi) By 2020 52 companies have committed to it with a significant growth of more than 37 over last year India is now the leader from emerging economies for having the maximum number of companies committing to SBTi and globally it stands at the sixth position
Of the 52 committed companies 22 have further approved SBTs in 2020 compared to 10 in 2019 The initiative champions SBT setting as a powerful way of future-proofing companiesrsquo growth in the transition towards a low-carbon economy51 The initiativersquos overall aim is for SBT setting to become a standard business practice and for companies to play a major role in driving down global GHG emissions Embedding SBTs as a fundamental component of sustainability management practices is crucial for achieving this
The Sectoral analysis of the Indian SBTi companies highlights the number of companies that are committed to the initiative and the number of those with approved set targets across each sector
51 httpssciencebasedtargetsorgresourcesfilesSBTi-manualpdf52 httpssciencebasedtargetsorgresourceslegacy201805SBT-transport-guidance-Finalpdf
Compared to last year the automobiles and components sector is still leading with the highest commitment and targets set The automobile sector is one of the fastest growing sectors which represents 23 of all energy-related global emissions52 Decarbonisng the automobile sector is possible through disruptive technological innovation land-use planning and transport demand management modal shift and
shifting to electric mobility Companies that set ambitious SBTs can send a strong signal for local regional and national policies to increase the level of ambition and steer the transition
In 2020 28 SBTi committed companies responded to CDPrsquos Investor request to disclose to the Climate Change questionnaire The emissions profile shows that the overall Scope 1+ Scope 2 emissions of SBTi companies responding to CDP represent almost 20 of the total Scope 1+ Scope 2 emissions and 71 of the total Scope 3 emissions in the overall CDP India Investor sample
A greater share of Scope 3 emissions reported by SBTi companies indicate that there is now a greater focus on the Scope 3 GHG Inventory as the companies are planning to set SBTs in coming years As per the SBTi a complete Scope 3 screening or inventory is required for the validation of the SBTs and it is not acceptable to exclude any relevant categories
What is a lsquoScience-Based Targetrsquo
Science Based Targets are the GHG emissions reduction targets consistent with the level of decarbonisation that according to climate science is required to limit global temperature increase to 15- 2ordmC compared to pre-industrial temperature levels
Science Based Target ensures that the company is taking shorter-term action to reduce emissions at a pace that is consistent with keeping warming below 15ordm well-below 2ordm C
SCIENCE-BASED TARGETS AMBITIOUS CORPORATE CLIMATE ACTION
200
128107
74 57 52
United States of America
(USA)
United Kingdom
(UK)
Japan Sweden IndiaFrance
No of Companies
Top 5 countries with SBTi companies
22 28 303
No
of C
ompa
nies 10
22Status of SBTi Companies in India
Committed Target Set
22
A N N U A L R E P O R T 2 0 2 0
CDP India data shows that 33 companies have reported reduction in their gross global emissions (Scope 1 and 2 combined) from the previous reporting year whereas 26 companies have their gross global emissions increased for this reporting year
CDPrsquos data shows that there are 32 companies that are considering setting a SBT in the next two years compared to 29 companies in the previous reporting year There are 11 intensity and eight absolute targets that companies consider to be SBT but this has not been approved by SBTi yet
The increase in these target number highlights that there are more companies which seek to commit to SBTi and get their targets validated in the coming years
Growth in ambition
CDPrsquos five-year data shows a rise in the number of Indian companies committing to the SBTi Their reported emissions increased by 144 due to increased commitment from energy intensive companies this year which includes companies from cement and metal and mining sectors
CDP India investor responding companies
SBTi companies (28 companies respond to CDP)
Emissions Profile (MtCO2e)
6815
134
Scope 1 Scope 2
22282
Scope 3
1259896
NO of Companies
Water Transportation
Professional Services
Textiles Apparel Luxury Goods
Software and Services
Pharmaceuticals and Biotech
Mining - Metals (Iron Aluminium Other Metals)
Food Production - Agricultural Production
Electrical Equipment and Machinery
Electric Utilities and Energy Related
Commercial services and supplies
Air Freight Transportation and Logistics
Food and Beverage Processing
Electric Utilities and IPPs and Energy Traders
Construction Materials
Automobiles and Components
Consumer Products and Durables
Banks Diverse Financials and Insurance
Chemicals
Hospitality
Real Estate
Telecommunications
1
1
3
2
2
2
1
1
1
1
1
1
1
1
2
3
3
2
1
1
6
2
4
1
1
2
3
3
Sectoral Analysis of Indian SBTi companies
Committed Companies Target Set Companies
33
14
Decreased
26
12
Increased
62
Reporting for the first time
1No Change
CDP India investor responding companies
SBTi companies (28 companies respond to CDP)
Comparison of change in gross Scope 1+2 emissions from previous year for SBTi companies vis-agrave-vis CDP reporting
companies
Emission Reduction Targets Reported by Companies in 2020
3
Not SBT not anticipating setting in 2
years
24
8
Not SBT but anticipating setting
in 2 years
4 5
Yes this is SBT approved by SBTi
11 8
Yes this is SBT not approved by
SBTi
Intensity emissions reduction target
Absolute emissions reduction target
No
of c
ompa
nies
23
A N N U A L R E P O R T 2 0 2 0
We witnessed the highest number of SBTi companies responding to CDP India this year which is a 40 growth from last year This further proves that companies are becoming more responsible towards disclosing their GHG Inventory with greater transparency
The graph for the estimated annual carbon savings shows the top three emission reduction initiatives undertaken by SBTi companies reporting to CDP It is evident that over the years low carbon energy purchase and energy efficiency process have gained momentum in reducing GHG emission with an increase in the number of SBTi committed companies implementing these initiatives Maximum carbon savings of 791 MtCO2e have been reported from the cement and concrete sector The metal smelting refining amp forming sector has reported 59237 tons CO2e savings this year with a significant decrease from 70422 tons CO2e savings in the last year There has been a reduction of 443 MtCO2e of estimated annual carbon savings reported by SBTi companies in 2020 as compared to the last year
Data shared by three reporting companies that have also committed to the SBTi (Ambuja Cement Ltd ACC Limited and Ultratech Cement Limited) shows that improving energy efficiency in their production processes has led to cement being the leading sector in reducing GHG emissions
About SBTi
The Science Based Targets initiative champions science-based target setting as a powerful way of boosting companiesrsquo competitive advantage in the transition to the low-carbon economy
It is a collaboration between CDP the United Nations Global Compact (UNGC) World Resources Institute (WRI) and the World-Wide Fund for Nature (WWF) and one of the We Mean Business Coalition commitments
The initiative
bull Showcases companies that set science-based targets through case studies events and media to highlight the increased innovation reduced regulatory uncertainty strengthened investor confidence and improved profitability and competitiveness generated by science-based target setting
bull Defines and promotes best practice in science-based target setting with the support of a Technical Advisory Group
bull Offers resources workshops and guidance to reduce barriers to adoption
bull Independently assesses and approves companiesrsquo targets
Indian SBTi companies responded to CDP Climate Change Investor Program 2020
54
Increase in SBTi companies responding to CDP via 2020 climate Change Investor Disclosure Program compared to previous year
40
Increase in Scope 1+2 Emissions and
Indian SBTi Companies responding to investor request reported reduction in Gross Global emissions compared to previous year
Increase in Scope 3 Emissions covered by SBTi Companies this year as compared to 2019
14450
185
Comparison of Absolute Scope 1+2 emissions (MtCO2e) for SBTi companies reporting to CDP
Emission reported in MtCO2e SBTi companies reporting to CDP
15 16 15 18 20 28
2015 2016 2017 2018 2019 2020
Abso
lute
Sco
pe 1
+2 E
mis
sion
(MtC
O2 e
)
364
8
380
4
479
4
605
5
583
4
142
26
24
A N N U A L R E P O R T 2 0 2 0
Advantages 53
1 Reducing regulatory risks and uncertainties As the government continues to work on implementing the Paris Agreement and meeting the ambition of the country-level pledges Science Based Targets initiative can prove out to be a resilience against the upcoming regulations
2 Strengthening Investor Confidence SBTi can help in strengthening the investor confidence as the investors are highly taking interest in businessesrsquo environmental policies
53 httpssciencebasedtargetsorgblogsix-business-benefits-of-setting-science-based-targets
3 Competitive Edge Companies are getting ahead of their peers by succeeding in the low-carbon transition with increased innovation reduced uncertainty strengthened investor confidence and improved profitability
4 Brand Reputation SBT is a global Initiative which shows robustness confidence and credibility which further helps in building up the brand reputation
Estimated annual CO2e savings of SBTi companies (in lsquo000 tCO2e)
2
Develop Target
3
Submit target for validation
4
Announce Target
1
Commit
Joining Call to Action
We look forward to companies taking action by committing to develop Science-based Targets
68
Energy efficiency Processes
Low carbon energy purchase
Energy efficiency Building services
Estim
ated
ann
ual C
O2e
sav
ings
(in
000
tCO
2e)
60126
2018 2019 2020
124
5184
346
43
7911168
25
A N N U A L R E P O R T 2 0 2 0
Science Based Targets Incubator is a unique project of CDP that was launched in April 2020 with support from MacArthur Foundation amp Shakti Sustainable Energy Foundation in partnership with WWF India to provide technical support with the main objective of handholding and catapulting organisations from commitment stage to target development stage of Science Based Targets Initiative Value Proposition
1 There will be no financial implication on the company
2 Case studies of businesses with validated targets will be shared with the participating companies for peer-to-peer learning
3 Capacity Building workshops and webinars based on recent developments and various other nitty-gritty of SBTi
4 In house trainings and one-on-one meetings with companies where CDP India will explain all stages of the SBTi and provide answers to all the technical queries
26
A N N U A L R E P O R T 2 0 2 0
BUSINESS AMBITION FOR 15degC
lsquoBusiness Ambition for 15degCrsquo is an urgent call to action from a global coalition of UN agencies business and industry leaders Businesses can make a critical contribution to limit the worst impacts of climate change by setting a net-zero target in line with 15degC future57
So far over 300 companies representing more than $36 trillion in market cap have responded to the open letter from global leaders and signed the Business Ambition for 15degC commitment
bull In India 13 companies55 have already aligned and set their target with the most ambitious aim of the Paris Agreement to level global temperature rise to 15degC above preindustrial levels
bull Automobiles and Components and Real Estate are the top sectors that have approved targets aligning with 15degC Ambition
bull In India 13 companies are further committed to Business Ambition for 15degC
bull All the companies in the Real Estate sector from India have approved targets aligning with 15degC Scenario
54 httpssciencebasedtargetsorgbusiness-ambition-for-1-5c55 Mahindra Logistics Ltd Mahindra Heavy Engines Ltd White House Dr Reddys Laboratories Ltd Mahindra EPC Irrigation Limited Swaraj Engines Limited Gromax Agri Equipment
Limited Mahindra Accelo Mahindra Holidays and Resorts India Limited Mahindra Lifespaces Developers Limited Mahindra World City (Jaipur) Ltd Mahindra World City Developers Ltd and Polygenta Technologies Limited
56 httpssciencebasedtargetsorgnet-zero
Net zero a north star for climate action
According to the latest report by the IPCC to limit global warming to 15degC above pre-industrial levels and to avoid the most disastrous impacts of climate change the world must halve CO2 emissions by around 2030 and reach net-zero CO2 emissions by 2050
Companies are increasingly adopting the net-zero climate targets by recognising the importance of keeping global warming to 15degC Between July 2019 and June 2020 over 230 companies committed to reach net-zero emissions as part of the Business Ambition for 15degC campaign an urgent call-to-action for companies to set emissions reduction targets in line with a 15degC future The campaign is led by the SBTi and supported by a global coalition of UN leaders business organisations and NGOs56
27
A N N U A L R E P O R T 2 0 2 0
A carbon price is a cost applied to carbon pollution to discourage polluters Economists agree a carbon price is the single most effective tool for countries to reduce their emissions57 Corporations have been using internal carbon pricing (ICP) as a strategy to manage climate-related business risks and prepare for the transition to a low-carbon economy Carbon pricing policies create strong transparent incentives for firms to internalise the social costs of carbon emissions58 Major investors and financial regulators are calling for businesses to disclose their climate risks and their policies to mitigate emissions59 The most sought-after benefits are that a company can use ICP both as a risk management tool and as a part of its decarbonisation strategy
To see how fast carbon pricing is spreading consider Paragraph 136 of the decision text of the Paris Agreement ldquoproviding incentives for emission reduction activities including tools such as domestic policies and carbon pricingrdquo The final agreement recognised carbon pricingrsquos importance as a powerful incentive to cut emissions by companies and regional state and local governments
The IPCC special report on the impacts of global warming of 15 degC above pre-industrial levels states that an explicit carbon pricing mechanism can theoretically achieve cost-effective emission reductions Along with best practice policies a moderate carbon pricing can help reduce global CO2 emissions significantly60 Parties are encouraged to set prices consistent with Carbon Pricing Leadership Coalitionrsquos
57 What is a carbon price and why do we need one58 Energy the Environment and Technological Change59 Firms ignoring climate crisis will go bankrupt says Mark Carney60 An I P C C Special Report on the impacts of global warming of 15 C above pre-industrial levels and related global
greenhouse gas emission pathways in the context of strengthening the global response to the threat of climate change sustainable development and efforts to eradicate poverty Intergovernmental Panel on Climate Change (2018)
61 Carbon Pricing WBCSD policy paper 2019httpsdocswbcsdorg201909Carbon-Pricing-WBCSD-Policy-Paper-2019pdf WBCSD 2019
62 SHOULD EVERY COUNTRY ON EARTH COPY SWEDENrsquoS CARBON TAX63 httpswwwedienetregistrationregwall
(CPLC) high-level commission on carbon pricing which states that an explicit-price range of US$50ndash100tCO2 by 2030 will be consistent with delivering the Paris Agreement61
Carbon prices have varied widely across existing schemes Success stories such as that of Sweden which currently has the highest carbon price in the world at US$123tCO2 demonstrate that it is indeed possible to make carbon pricing work while the Swedish economy grew by 78 since the introduction of the Swedish carbon tax in 1991 carbon emissions have decreased by 2662 Other countries like The UK
(US$4229) Netherlands (US$3638tCO2) have also committed to increasing their carbon prices in the coming decade63 The worldrsquos top three emitters -- US China and India -- however have put negligible prices on carbon
As part of the lsquoBuild Back Betterrsquo strategy carbon pricing can be a valuable tool
US$123tCO2
Sweden
US$4229tCO2
UK
US$3638tCO2
Netherlands
INTERNAL CARBON PRICEndash ROBUST CLIMATE STRATEGY
28
A N N U A L R E P O R T 2 0 2 0
to guide investment decisions It can help focus on a green stimulus package to recover from the old economy which promotes a carbon-intensive future Different stimulus measures can help clean energy technologies compete with carbon-intensive alternatives and encourage more efficient energy use India is witnessing this momentum ndash a Declaration on Climate Change was signed by 24 key industry captains and Ministry of Environment Forest and Climate Change (MoEFCC) at the virtual India CEO forum on Climate Change on 5th December 2020 Shri Javadekar further said that this declaration by private sector companies voluntarily is a historic step
To guide companies in the implementation of climate-related financial disclosures the TCFD65 developed four recommendations mimicking an organisational structure Governance Strategy Risk Management and Metrics and Targets An ICP is a proposed metric through which entities can safeguard their businesses by internalising market signals The TCFD specifically lists ICP as a key metric to assess climate-related risks and opportunities in line with its strategy and risk management process By attributing a financial cost to risks associated with carbon emissions and translating them into a uniform metric financial decision-makers can integrate transition risks into their business decisions and fill the analysis gap for assets of various time horizons
64 httpnbrienvisnicinViewGeneralLatestNewsaspxId=9829ampYear=202065 httpnbrienvisnicinViewGeneralLatestNewsaspxId=9829ampYear=202066 Implementing the Recommendations of the Task Force on Climate-related Financial Disclosures The Taskforce on Climate-related Financial Disclosures June 2017
Mr Ravi S Prasad Additional Secretary spoke about a coordinating structure for implementation of Paris Agreement which will incorporate internal carbon pricing67
The MoEFCC also constituted a high-level inter-ministerial Apex Committee for Implementation of Paris Agreement (AIPA) in December 2020 under the chairmanship of the Secretary MoEFCCThe purpose of AIPA is to generate a coordinated response on climate change matters that ensures India is on track towards meeting its obligations under the Paris Agreement including its NDC
Senior officials from 14 ministries will serve as Members to AIPA who will oversee the progress in implementation of Indiarsquos NDC and receive periodic information updates to monitor review and revisit climate goals to fulfil the requirements of the Paris Agreement Another key function of AIPA would be to operate as a National Authority to regulate carbon markets in India under Article 6 of the Paris Agreement formulate guidelines for consideration of projects or activities under the article issue guidelines on carbon pricing market mechanism and other similar instruments that have a bearing on climate change and NDCs
It will take note of the contributions of the private sector as well as multi-bi-lateral agencies in the field of climate change and provide guidance for aligning their climate actions with national priorities
ICP will be a useful preparatory tool for future government climate policies
Investors are increasingly demanding comprehensive climate disclosures
It will stay and will be instituted more commonly
A robust carbon pricing system plays an important role in driving
GHG reductions
It complements climate policies for sustained and successful
emissions reductions
It helps make informed decisions and incentivies
low-cost abatement options
Business case for pricing carbon
29
A N N U A L R E P O R T 2 0 2 0
When disclosing on ICP the TCFD recommends that companies should disclose on the followingbull what assumptions are made about how carbon price(s)
would develop over time (within tax andor emissions trading frameworks)
bull geographic scope of implementationbull whether the carbon price would apply only at the mar-
gin or as a base costbull whether the price is applied to specific economic sec-
tors or across the whole economy and in what regionsbull whether a common carbon price is used (at multiple
points in time) or differentiated prices bull assumptions about scope and modality of a CO2 price
via tax or trading scheme
67 httpswwwgreentechmediacomarticlesreadeuropean-oil-majors-ready-to-scale-up-energy-transition-investment68 httpswwwgreenbizcomarticlebp-walks-away-three-us-trade-groups-over-carbon-pricing69 Convention on Biological Diversity ndash Markets for Carbon Offsets Accessible at httpswwwcbdintfinancialoffsetsg-offsetclimatecarbonpdf page 8
Earlier this year BP one of Europersquos oil supermajors announced a carbon price of US$100tonne of CO2 a giant increase from their previous price of US$4067 and walked away from three US-based oil and gas trade organisations - American Fuel and Petrochemical Manufacturers (AFPM) the Western States Petroleum Association (WSPA) and the Western Energy Alliance (WEA) over differences regarding policy positions on carbon pricing68
CDP has been asking companies to disclose their practice of using ICP since 2013 In 2020 23 of the investor responding companies have reported putting a price on carbon as compared to last yearrsquos 19 while the number of companies planning to price in the next two years reduced to 21 from 23 in 2019 After adding Supply Chain responding companies a total of 58 companies are pricing or are planning to price carbon in the next two years in 2020 a 12 increase from 2019 It was further seen that of the 23 companies that are pricing carbon in 2020 52 use a shadow price followed by implicit price
The Task Force defines an internal carbon price as ldquoan internally developed estimated cost of carbon emissionsrdquo which can be used as a planning tool to help identify revenue opportunities and risks as an incentive to drive energy efficiencies to reduce costs and to guide capital investment decisions69
52
26
4
9
44
Shadow price
Implicit price
Implicit price Internal fee
Internal fee
Offsets
Implicit price Shadow price
Types of ICP used by Indian companies
Pricing Planning to price in the next 2 years
2
25
2015
8
36
2016 2017
26
14
2018
14
32
2019
20
31
2020
2533
No
of C
ompa
nies
ICP trend in India
30
A N N U A L R E P O R T 2 0 2 0
Type of ICP Shadow price Carbon fee Implicit price Internal trading
Description Hypothetical cost of carbon emissions
A per-unit fee based on the amount of GHG the company emits (eg `700 per tCO2e)
Helps quantify the capital investments required to meet climate-related targets
Allows business units within a company to trade their allocated carbon credits based on respective emissions
Objectivesusage
The most common form of ICP is a shadow price helps organisations better understand the impacts of climate-related risks such as technological shifts or future regulations It can help a company with both risk management as well as internal strategic planning
It allows companies to model or test how a range of carbon prices affect their divisions capital investments and other planned projects It is similar to forecasting with a range of energy prices
Putting a fee on carbon helps create an actual pool of funds generating a revenue stream to help pave the way for greener projects and further RampD This prepares a company for a carbon-resilient world This tool has the ability to encourage a business to transform into an environmental leader It allows for the creation of internal funds to invest into energy efficiency or renewable energy projects in order to cut energy costs
It also builds awareness of the importance of emission reductions within different business units
An implicit price helps companies understand their initial carbon footprint and is also used as a benchmark to implement a more strategic internal price
Internal trading helps create awareness It allows companies to prepare for stringent forms such as shadow prices or internal fees
Method An additional criterion is introduced in investment analysis during the calculation of the internal rate of return (IRR)
The additional criterion is the carbon value which is incorporated into each investment decision and applied to resulting GHG emissions This carbon price is assumed the same way assumptions are made about exchange rates or commodity prices
It is implemented by voluntarily adding a cost to GHG emissions in relation to operational costs
It increases the operating expenses (OPEX)
There are short-term emissions reductions Transfers of actual funds within the company are done through two mechanisms First by offsetting GHG emissions by purchasing offset credits externally Second by providing internal financing for emission reduction projects low- carbon products amp services and RampD
The carbon fee also provides monetary incentives for pro-environment initiativesactivities
Some companies with emissions reduction or renewable energy targets calculate their lsquoimplicit carbon pricersquo by dividing the cost of abatement procurement by the tonnes of CO2e abated
Trading is driven by the allocation of a fixed number of carbon dioxide emission lsquoallowancesrsquo for individual business units with each allowance equivalent to 1 metric tCO2 If business units exceed their cap they must purchase additional allowances to offset their excess emissions
Where business units under-emit they may sell allowances Business units may also choose to invest in carbon offsets outside their own units in order to sell on the internal trading scheme72
A sectoral analysis of the data finds two high emissions intensive sectors cement and concrete followed by IT and software development An increasing number of companies from cement and IT sectors are now committing to the SBTi and moving towards aligning emissions in line with 15-degree an ICP in such cases can be effectively used as a tool for mitigating climate risks and achieving the greater goal of a SBT or a net-zero target It helps companies build their internal capacity and measure their progress
1313
2626
2222
1313
44 44
1818
Metal smelting refining amp forming
Cement amp concrete
IT amp software development
Biotech amp pharmaFood amp beverage
processing
Chemicals
Transportation equipment
31
A N N U A L R E P O R T 2 0 2 0
Below are the ICP disclosed by Indian companies in 2020
Company Price in INR (`) Price in USD ($) Type of ICP used
ACC 2541 3394 Implicit price Shadow price
Ambuja Cements 21639 3074 Implicit price
Dalmia Bharat Ltd 77334 11 Shadow price
Dr Reddyrsquos Laboratories 937 1332 Implicit price
Godrej Consumer Products Limited 750 10 Shadow price
Godrej Industries 740 10 Shadow price
Hero Motocorp Ltd private private private
Hindustan Zinc 111846 159 Implicit price
Infosys Limited 100182 1425 Implicit price
JSW Cement Limited 1566 21 Shadow price
JSW Steel Ltd 1400 20 Shadow price
Mahindra amp Mahindra 98242 1397 Internal fee
Mindtree Ltd private private private
Shree Cement private private private
Tata Chemicals 140607 20 Shadow price
Tata Consultancy Services 1131 1608 Implicit price Shadow price
Tata Consumer Products Ltd 315 448 Offsets
Tata Motors 980 14 Shadow price
Tata Steel 975 - 2720 15 -3868 Implicit price Shadow Price
Tech Mahindra 70303 10 Implicit price Internal fee
Ultratech Cement 750 1066 Shadow price
Wipro 352291 5011 Shadow price
Since these companies did not provide a conversion rate the average conversion rate for the 2019 calendar year was taken (1` = 0014224USD)
Managing climate risk with Internal Carbon Price and Science Based Targets
By integrating ICP into ambitions targets set by SBT companies can achieve greater emissions reduction SBTs empower companies to engage internal teams with a common data-driven goal and integrate their carbon reduction strategies with other business objectives70 A step that organisations can take to implement TCFD recommendations as well as achieve their SBTs is putting an internal price on carbon It is observed that having an internal carbon price can enhance an organisationrsquos competitiveness71 Several companies are already using ICP to highlight their progress towards targets and inform a business case for low-carbon investments Of the 25 companies that have disclosed to CDP in 2020 13 that committed to SBTi also have an ICP
Setting a carbon price can be a strong commitment towards driving change and action Clear goals for the ICP enable
70 Science-Based Targets How Aligning Carbon Reduction Targets With Climate Science Can Drive Business Growth SampP Dow Jones Indices 201771 httpswwwgreenbizcomarticlemanaging-climate-risk-carbon-pricing-and-science-based-targets72 CDP Handbook on Carbon Pricing73 httpswwwcdpnetenreportsdownloads491874 httpsb8f65cb373b1b7b15feb-c70d8ead6ced550b4d987d7c03fcdd1dsslcf3rackcdncomcmsreportsdocuments000002771originalCDP-Carbon-Pricing-Handbook
pdf1508927220
companies to make better decisions regarding the type and price of carbon72 A high-level commitment can provide a companyrsquos perspective and insight on how other companies have been able to adopt innovative financing practices such as ICP and carbon taxes which are spurred by setting ambitious targets in line with the SBT initiative
In January 2020 in partnership with TERI CDP India released a second handbook in ICP - Putting a Price on Carbon A Handbook for Indian Companies 20 73 a second edition to the handbook released in October 17 74The first handbook was prepared to lay out the landscape of carbon pricing and help companies understand about external and ICP along with guidance on how to approach an internal carbon price The aim of the second handbook was to further mobilise the adoption of internal carbon price by companies The handbook discusses steps to arrive at a price and use it in an organisation including details on indicative pricing levels
32
A N N U A L R E P O R T 2 0 2 0
ACC Ltd are using internal carbon price as a tool to drive and incentivise low-carbon initiatives and emissionenergy reduction projects We have observed that ICP helps ROI to look attractive and helps us make informed decisions
ACC Ltd has already committed and published their 2030 targets for specific CO2 emission reduction and use of waste derived resources (as a part of SD 2030 plan) We have also committed to SBTi and are working on setting stricter targets aligning with below 2 DS To achieve these commitments and relevant targets we believe that ICP may play an important role in prioritising our future actions and investments Going forward we also plan to use the ICP for managing risk and leveraging opportunities
mdash ACC Ltd
Steps to Setting an
internal carbon price
Make a commitment
Communicate your progress
Set the scope of the internal carbon price
Decide price level and variance
Monitoring and reporting
Define the type of ICP
01
02
03
0405
06
07
08
Map your objectives
Establish the degree of influence in business application
33
A N N U A L R E P O R T 2 0 2 0
THE RENEWABLE ENERGY THRUST In 2020 the 67 companies headquartered in India have reported a total of 291 Terra Watt hours (TWh) electricity consumption more than double the previous yearrsquos number Notably the significant increase in total electricity consumption is attributed to just one company ndash Vedanta Limited with 151 TWh of electricity consumption for its global operations
The total electricity consumption excluding Vedanta is 140 TWh 48 higher than the previous year The rise in the total reported electricity consumption is primarily due to an increase in the number of responding companies from the energy intensive sectors These 67 companies have consumed about 16 TWh renewable electricity which is 6 of the total electricity consumption reported in 2020 The share of renewable electricity is 11 without counting Vedanta in the sample This is 6 higher than the previous year
The growth in the share of renewable electricity consumption is due to multiple factors such as the increasing number of voluntary corporate GHG emission reduction targets renewable energy targets and compliance targets such as Renewable Energy Purchase Obligations (RPO) In 2020 18 companies from India have reported various types of renewable energy targets Some of these companies have taken more than one renewable energy target type These 18 companies have reported 98 TWh of electricity consumption of which 13 is from renewable energy sources The level
Type of renewable energy targets
Renewable Energy Targets
17
1 1 2Renewable Electricity
Consumption
Renewable Electricity
Production
Renewable Electricity Capacity
Renewable Energy Financing
Target
No
of C
ompa
nies
RE100 is the global corporate renewable energy initiative bringing together hundreds of large and ambitious businesses committed to 100 renewable electricity Led by the Climate Group and in partnership with CDP RE100rsquos mission is to accelerate change towards zero carbon grids at scale There are 4 companies headquartered in India that have committed to the RE100 initiative - Dalmia Bharat Ltd Infosys Ltd Mahindra Holidays amp Resorts India Ltd and Tata Motors Ltd
The RE100 membership continues to grow and diversify - with 42 of new members coming from the Asia-Pacific region in 2020 With 260+ members and gt278 TWh of electricity consumption aggregated electricity demand of RE100 members is higher than Australiarsquos The share of renewable electricity is 42 of total consumption showing strong progress towards 100 goal
Over 70 global RE100 members have operations in India ndash with gt2 TWh of electricity consumption in the country About 39 of electricity consumed in India came from renewable energy sources largely sourced through unbundled energy attribute certificates and power purchase agreements
Visit RE100org and follow RE100 on Twitter
34
A N N U A L R E P O R T 2 0 2 0
Note Some companies have reported renewable electricity consumption total instead of break-down details as per the sourcing method Data for those companies is not included in the above chart
131
17
03
01
Renewable Electricity Sourcing Methods (TWh)
Self-generation
Unbundled Energy Attribute Certificates (EACs)
Power Purchase Agreement (PPA)
Green Electricity Products
of ambition ie a share of renewable energy in the target year for most of the companies varies between 20-100 Showing the leadership in renewable electricity sourcing 3 companies75 have committed to source 100 renewable electricity across their operations and joined RE100 initiative
GHG emission reduction targets are popular among companies in India and 57 companies have reported absolute intensity or both absolute and intensity targets Among these 30 companies have committed to science-based targets Initiative and their targets are in line with climate science Six companies have dedicated scope 2 emission reduction targets Scope 2 emissions are indirect emissions from the generation of purchased energy consumed by the reporting company Companies with GHG emission reduction targets tend to source renewable energy to reduce their emissions primarily scope 2 emissions The Majority of these companies have taken exclusive renewable energy targets to support meeting their GHG emission reduction targets
Renewable energy plays an important role in the corporate value chain due to its zero-carbon intensity and ability to provide long-term energy security About 34 companies have identified opportunities related to shifting energy usage towards low-carbon energy sources across the value chain Of these 32 have identified opportunities in the direct operations followed by 6 companies in the upstream and 2 in the downstream of the value chain These companies have estimated energy related opportunities worth `317 billion mainly in the direct operations Half of these companies anticipate short time frame (1-5 years) to tap these
75 4 India headquartered companies are committed to the RE100 initiative 3 of them report to CDPrsquos climate questionnaire
opportunities Companies have not just identified energy related opportunities but implemented energy related initiatives in the reporting year across their operations About 31 companies have implemented low-carbon energy consumption or production related initiatives in the reporting year that resulted in an estimated annual carbon savings of 18 million tCO2 and `27 billion of annual monetary savings
Companies from the manufacturing and materials sectors have reported the highest volume -14 TWh of renewable electricity consumption Manufacturing sector companies are relatively performing better than companies from the materials sector in terms of the share of renewable energy in total electricity consumption There are 25 companies from these two sectors mainly energy intensive business such as cement metals and mining steel and transport original equipment manufacturers (OEMs) The aggregate electricity consumption of these companies is over 100 TWh The companies from the fossil fuel-based energy generation are not included in the following charts
A detailed breakdown shows that self-generation of renewable electricity is the most preferred sourcing option among companies followed by purchase of renewable electricity through unbundled Energy Attribute Certificates (EACs) and Power Purchase Agreement (PPA) with an onsiteoffsite generator Up to 10 companies have reported 03 TWh of total renewable electricity consumption via PPA (on-grid and off-grid) which has declined from 11 TWh of consumption reported in the previous year
35
A N N U A L R E P O R T 2 0 2 0
Materials Manufacturing Food beverage amp agriculture
Biotech health care amp pharma
OtherInfrastructureServices
3
17
6
35
3
20
12
Total Electricity Consumption (TWh) Total RE Consumption (TWh) RE
Electricity consumption by sector with Vedanta Limited included in the analysis
Electricity consumption by sector excluding Vedanta Limited
Materials Manufacturing Food beverage amp agriculture
Biotech health care amp pharma
OtherInfrastructureServices
7
17
35
20
1236
Total Electricity Consumption (TWh) Total RE Consumption (TWh) RE
TWh
TWh
36
A N N U A L R E P O R T 2 0 2 0
2737worth opportunities
identified
Billion
`
16of Renewable Electricity Consumption Reported
TWh
704of total [ Scope
1+2location-based] emissions reported
MtCO2e
7138Inherent financial
risk identified
Billion
`
25have Internal Carbon
Pricing
Companies 52Companies in India
SBTi
37
A N N U A L R E P O R T 2 0 2 0
WATER SECURITY The way out of water crisis
Five of the worldrsquos largest cities under water stress are in India with Delhi ranked second on the list76 The water crisis is more alarming than imagined ndash 600 million people in India face high-to-extreme water stress77 Indiarsquos water demand is projected to increase by two times the available supply by 2030 putting hundreds of million people at the risk of water scarcity and ultimately losing the country 6 of its GDP78 In 2019 the country witnessed the worst droughts in recorded history Over 500 million people were affected across the country and major cities such as Chennai experienced lsquozero dayrsquo scenarios wherein water literally ran out Since improvements in water security are essential for Indiarsquos development investing in water merits a sound business case
Though 80 of Indian states have legislations on water conservation and prevention of encroachment of water bodies79 poor data management absence of water pricing inefficient irrigation techniques and the lack of adequate sewage treatment curb the countryrsquos ability to manage water sustainably80 In recent times companies have become more aware of the risks of increased water consumption pollution and unstable precipitation aggravated by climate change81 A 2019 World Bank Report (Quality Unknown)82 warned of the economic health and environmental damage caused by contaminated water highlighting water quality as an ldquoinvisible crisisrdquo that is under-appreciated and underestimated It warned that poor water quality driven by industrial agricultural and urban pollution could lead to a reduction by 13rd of economic growth in some places
76 httpsocialnitigovinuploadssamplewater_index_report2pdf77 httpsnitigovinsitesdefaultfiles2019-06Final20Report20of20the20Research20Study20on2020
Composite20Water20Resources20Management20Index20for20Indian20States20conducted20by20Dalberg20Global20Development20Advisors20Pvt20Ltd_New20Delhipdf
78 httpsnitigovinsitesdefaultfiles2019-06Final20Report20of20the20Research20Study20on2020Composite20Water20Resources20Management20Index20for20Indian20States20conducted20by20Dalberg20Global20Development20Advisors20Pvt20Ltd_New20Delhipdf
79 httpsocialnitigovinuploadssamplewater_index_report2pdf80 httpswwwcdpnetenarticlescompaniesindias-looming-water-crisis-a-call-to-action-for-companies81 Think globally act locally new guidance for companies on sustainable water use - CDP82 httpsopenknowledgeworldbankorghandle109863224583 httpswwwwriorgaqueduct84 Aqueduct Country Ranking (wriorg)85 The objective of the campaign is to drive further corporate transparency around climate change deforestation and water
security by encouraging companies to respond to CDPrsquos disclosure request
Water stress in India remains a key challenge Aqueduct83 ranked India 13th in the world on high water stress score -- 412 out of 584 The private sector is vital to delivering a water secure future Companies in the food textile retail energy industrial chemicals pharmaceuticals and mining sectors account for and wield influence over 70 of the worldrsquos water use and pollution The decisions one takes about how to grow and expand can make or break onersquos ability to tackle the global water crisis
CDPs Water Security program requests companies to disclose critical information on water parameters which are crucial to the business It helps companies monitor and benchmark their performance on these critical parameters to ensure adequate water availability for their businesses Investors and customers are increasingly keen to know how companies respond and adapt to water-related risks The Non-Disclosure Campaign (NDC) is an annual CDP initiative where investors can target companies that have been requested to respond but failed to do so85 Globally for water security Indian companies achieved the highest response rate to the NDC campaign with 50 of engaged companies submitting a response on this critical issue ndash 28 times higher than their control group Responding through CDPrsquos Water Security questionnaire will help businesses understand the risks and opportunities associated with water-related issues
Reduction in Economic Growth caused by power water in some countries
13rd
Water stress by 2030-ratio of withdrawals to renewable supply
People will live in water stress area by 2030
Increase in water demand in last 100 years
WRI 2020
UNEP
UN World Waterdevelopment Report 2020
increase in Water Security investor responding companies in India
8756
1in 2
x6
38
A N N U A L R E P O R T 2 0 2 0
helping them capitalise on actions to safeguard water resources86 The number of disclosing companies increased from 15 last year to 28 companies this year an increase of approximately 87
Measuring Monitoring and Verification
Regular measuring and monitoring of water-related parameters across all operations and the entire value-chain is the first step in laying the path for efficient water management In 2020 28 companies measured a total of 268 water related parameters It was found that amongst volumetric water metrics water discharge was the most monitored accounting for 41 of all measurements Water withdrawals accounted for 29 of all measurements water consumption for 10 and water recycling and reuse accounted for 10 each Although these metrics were being continuously monitored and measured by companies a sector-wide analysis shows that significant growth in some water-intensive sectors has put pressure on the demand for industrial water The electric utilities sector for example reported an increased water demand of 771174 megalitres in 2020 which was the highest amongst all sectors Adani Power Ltd highlighted new aqusitions and increased power generation as major reasons for rise in water demand this year The chemicals sector showed the second highest rise in water demand this year -- 195832 megalitres this year
Some companies have shouldered the responsibility of having audits conducted on their reported water metrics for greater
86 httpsb8f65cb373b1b7b15feb-c70d8ead6ced550b4d987d7c03fcdd1dsslcf3rackcdncomcmsreportsdocuments000000893originalCDP-india-business-case-for-water-disclosurepdf1472051621
87 https6fefcbb86e61af1b2fc4-c70d8ead6ced550b4d987d7c03fcdd1dsslcf3rackcdncomcmsreportsdocuments000005312originalAnalysis_of_CA100__Data_for_CDP_Investor_Signatories_v5pdf1596046258
88 https6fefcbb86e61af1b2fc4-c70d8ead6ced550b4d987d7c03fcdd1dsslcf3rackcdncomcmsreportsdocuments000005312originalAnalysis_of_CA100__Data_for_CDP_Investor_Signatories_v5pdf1596046258
89 https6fefcbb86e61af1b2fc4-c70d8ead6ced550b4d987d7c03fcdd1dsslcf3rackcdncomcmsreportsdocuments000005312originalAnalysis_of_CA100__Data_for_CDP_
transparency and credibility Amongst the verification standards that were employed 26 of the responding organisations used ISAE 3000 with Tata Chemicals being the sole company to apply both ISAE 3000 and AA1000AS to meet assurance standards
In 2020 25 responding companies withdrew consumed and discharged 7933064 megalitres 1403171 megalitres and 6625032 megalitres of water respectively However in 2019 these figures stood at 217736 megalitres 860517 megalitres and 67686 megalitres respectively for 15 responding companies
WATER ASPECTSWater Consumptionndash the amount of water a company has drawn into its boundaries and has permanently removed from the local water cycle90
Of the 28 respondents three did not disclose water consumption data or were in their first year of measurement 9 increased their water consumption over the previous reporting year 12 decreased it and 4 reported no change
Water Withdrawalsndash the amount of water the company has temporarily removed from the local water cycle and returned as discharge water91
Of the 28 respondents three did not disclose water withdrawal data or were in their first year of measurement 7 reported an increase over the previous year 14 had lowered their withdrawal and 4 reported no change
Water Discharges ndash the amount of water that leaves a companys facility and if left untreated could be a source of pollution92
Of the 28 respondents three did not disclose water discharge data or were in their first year of measurement 9 reported an increase in water discharge over the previous year 6 lowered it and 10 reported no change CDPrsquos data highlights new acquisitions increased production activities and project expansions as the primary reasons for increased water demand amongst the companies
of companies measured all water aspects (withdrawals discharge and consumption) across 100 of facilities
64
of companies believe that availbility of good quality freshwater is vital for the success of their business39
2910
4110
10
Water withdrawalsWater recycledreused
Water discharge
Water consumption
Others
Measured and monitored water aspects
39
A N N U A L R E P O R T 2 0 2 0
Data further shows that brackish surface water and seawater were the primary water sources for industries followed by fresh surface water source The electric utilities sector was the most reliant on brackish surface water and seawater accounting for 72 of the sectorrsquos total water withdrawals At 59 fresh surface water was the primary source of withdrawal for the chemicals sector Of the 28 companies 13 had implemented water conservation measures to reduce water withdrawals from groundwater sources this year Water withdrawals from groundwater - renewable accounted for less than 05 of total withdrawals
In terms of water discharge most (81) was released into brackish surface water and seawater environments Discharges into fresh surface water accounted for the remaining 19 of the total discharges Our data suggests more companies are installing zero liquid discharge units and water harvesting techniques across their facilities leading to less groundwater discharge
Fresh surface water accounted for 29 of total water withdrawals by source in 2020 Indiarsquos major river basins - Ganges Brahmaputra Godavari Indus and Cauvery are the primary source of freshwater for the industries Around 15 of total freshwater demand from CDP responding companies was supplied by the
Investor_Signatories_v5pdf159604625890 Worldrsquos 18 Most Water-Stressed Rivers | World Resources Institute (wriorg)
Ganges and Brahmaputra river basins another 15 came from the Godavari basin followed by Cauvery Indus Banas and Sabarmati river basins The demand for water has increased over the years causing these basins to rank among the most water-stressed catchments in the world90 Of the 83 facilities in India 53 were in water-stressed regions Our data shows that around 60 of total responding companies withdrew water from water-stressed regions Of these nine were from the materials industry and two were from the food beverage amp agriculture industry
Governance and Business Strategy
For a long time corporate sustainability strategies have focused on measurable and manageable challenges such as product footprint efficiency in supply chain water conservation and others Businesses have begun to take stock of water security by innovating for improved efficiency measuring direct withdrawals assessing risk to neighbours and considering leakages
CDPrsquos data shows that corporate leaders across India are responding to this crisis by focusing on their water policy to monitor risks and opportunities and integrate it in their strategies Around 71 companies report having a documented water policy that is accessible to the public Up to 93 companies indicated that they have a board-level oversight of water related issues within the organisation observed either by the Chief Executive Officer (CEO) or the director on board followed by the board-level committee
Around 43 of the responding companies report on water-related issues quarterly and 33 more frequently This shows the increasing self-awareness among companies on water-related issues Further 63 of these companies offer some form of
facilities out of a total of 83 from the responding companies were in areas with water-stress53
Water discharge by destination
Brackish surface
water and Seawater
Fresh surface water
Groundwater
Third party
532
225
2
975
156
93
Water discharge (megalitersyear)
125
013
1
Brackish surface
water and Seawater
Groundwater ndash non
renewable
Groundwater ndash renewable
ProducedEntrained
water
Third party
Fresh surface water
231
800
261
04
405
21
489
Water withdrawals (megalitersyear)
Water withdrawals by destination
7564
662
6
No
of c
ampa
nies
Industry
1
Appa
rel
1
Biot
ech
hea
lth
care
amp p
harm
a
1
Man
ufac
turin
g
2Fo
od b
ever
age
amp ag
ricul
ture
1
Pow
er
gene
ratio
n
1
Tran
spor
tatio
n se
rvic
es
1
Serv
ices
9
Mat
eria
ls
Industry-wise water withdrawals from water-stressed areas
40
A N N U A L R E P O R T 2 0 2 0
incentive to their employees ndash monetary or otherwise -- for the management of water related issues
Businesses are stepping up and playing a vital role in developing water initiatives that can ease the stress on crucial watersheds Companies are also looking into water security related long-term business objectives and financial planning as a part of their overall business plans Almost 70 companies prefer short to mid-term (5-10 years) over long-term (11-30 years) planning This does not come as a surprise as water effects are felt locally and require more immediate strategic planning Of the 28 reporting companies 12 use climate-related scenario analysis to inform its water-related business strategy and eight anticipate doing so in the next two years A majority of these companies belong to the chemicals and the electric utilities sector
In 2019 about 13 companies were pricing their water this increased in 2020 to 18 and 50 are now exploring the its possibilities Companies such as Ambuja Cement (US$110 `7800
91 marico-sustainability-report-18pdf
Marico Ltd Establishing a strategy to improve water-security across operations and value chain
With a host of agro-based products water availability is a crucial parameter for Marico Ltd92 Under the risk management framework it has identified adverse impact of water scarcity as an environmental risk to the company To mitigate this environmental risk the company has initiated watershed management programs and a reduced-reuse-recycle model of water management across its operations Through a water stewardship program the company aims to address water security challenges in low rain-fed areas around its workplace and factories
In the reporting period FY 19-20 the company withdrew 202886 cubic meters of water and reported a reduction of 9 from previous year The company had reported a reduction of 31 in water intensity from the 2014 level through the company-wide introduction of water efficiency measures improvements in water recycling water-efficient taps and rainwater harvesting systems For improving water management practices across water stress areas Marico utilised the WRI aqueduct tool to evaluate water risk across all manufacturing facilities in India This tool helped the company identify the number of facilities that fall under the water stress area -- according to it five out of eight plants are in such zones The implementation of water conservation initiatives had helped three water-stressed sites reduce water consumption over the previous year Among three water-stressed sites Jalgaon reported 15 reduction in water consumption Baddi reported 16 and Paonta 28
Establishing a strategy to reduce and minimise water use was one of the companys key commitments Marico foresees its future water withdrawal levels reducing given its move towards improving water efficiency and incorporating recycling throughout the production cycle
Frequency of reporting on water-related issues
633
43
Annually
More frequently than quarterly
Quarterly
6
10 2Half-yearly
As important matters arise
Less frequently than annually
41
A N N U A L R E P O R T 2 0 2 0
to US$8240 `579800 per megalitre) Dr Reddyrsquos Laboratories (US$088`67 to US$591`449 per KL) Piramal Glass and Tata Steel use an internal price on water
Risks amp opportunities
Dwindling water supply is a major cause of concern for businesses since it poses significant direct and indirect impacts Visible risks such as droughts have a more explicit impact as they ruin vegetation and severely undermine the agriculture sector But subtle impacts present challenges to other sectors Water shortages also threaten the long-term viability of businesses by leading to higher costs eventually borne by the consumers Without proper management the economic repercussions of water scarcity will be felt in myriad ways92
In 2020 companies that experienced detrimental water-related impacts have incurred financial losses worth `1580 million Physical risks such as inadequate infrastructure and increased water stress account for more than half of these commercial losses followed by reputational-cum-market like subpar access to water sanitation and hygiene services and regulatory risks eg- failure to set mandatory water efficiency conservation and recycling standards Corporations should thus strategically prioritise dealing with these risks to safeguard their financial bottom lines For this organisations have looked to secure alternate sources of water supply adopt water efficiency and conservation practices as well as reuse and recycling of water
A 2018 report from NITI Aayog93 highlighted the fact that the country faced its worst water crisis that year Rising water challenges have put strong regulatory pressure on businesses in India with significant operational risks The private sector is a big contributor towards deepening water security issues but is also crucial in addressing it
Given the current situation with water resources it is perhaps unsurprising that many of the companies responding to CDP find themselves exposed to a plethora of physical and transition risks ndash that is risks from regulatory or consumer reforms aimed at addressing the water crisis These risks threaten their reputation and license to operate their supply chains security financial stability and their ability to grow As per CDPrsquos Global Water
92 httpsglobalriskinsightscom201612economic-cost-global-water-scarcity93 httpsnitigovinsitesdefaultfiles2019-06Final20Report20of20the20Research20Study20on2020Composite20Water20Resources20Management20Index20
for20Indian20States20conducted20by20Dalberg20Global20Development20Advisors20Pvt20Ltd_New20Delhipdf94 https6fefcbb86e61af1b2fc4-c70d8ead6ced550b4d987d7c03fcdd1dsslcf3rackcdncomcmsreportsdocuments000005165originalCDP_Global_Water_Report_2019
pdf159110644595 The term WASH refers to the provision of water sanitation and hygiene Universal affordable and sustainable access to WASH is a key public health issue within international
development and is the focus of the first two targets of Sustainable Development Goal 6 (SDG 6)96 httpswwwworldbankorgentopicwaterbriefwash-water-sanitation-hygiene-and-covid-19
Report 201994 the combined business value at risk reported in 2019 topped out at US$425 billion with about 40 of the risks anticipated to hit within the next 1-3 years Whether it was the blockading of a Newmont Goldcorp mine in Mexico or poor water quality threatening the production of Unileverrsquos Hellmannrsquos mayonnaise in the Mississippi River Basin the impacts of the global water crisis are already being felt
Water risks and risk assessment
As per the 2020 data 71 of the responding companies consider current or future water-related regulations as a risk to business followed by 57 companies that consider access to WASH95 services for employees as very relevant and always included in their water-risk assessments This shows that companies are vigilant about providing safe access to drinking water sanitation arrangements and proper hygiene at workplace The COVID-19 pandemic has highlighted the importance of WASH to human health and well-being Safely managed WASH services along with good hygiene practices can help prevent infectious diseases that kill millions each year96 In addition 50 companies reported that water used for their key commoditiesraw materials is relevant enough to be considered for their risk-assessment This was the most pertinent for chemical sector companies
of the 28 Indian responding companies undertake water-related risk assessment25
Total financial loss by reporting companies as per risk type
38
53
9
Reputation and Market Risk
Physical Risk
Regulatory Risk
1580 MILLION
In 2020 companies that experienced detrimental water-related impacts have incurred financial losses worth
1580 million
42
A N N U A L R E P O R T 2 0 2 0
It is crucial to consider stakeholders in risk assessment procedures for a comprehensive understanding of water-related risks Of the 25 companies that undertake water-related risk
97 httpswwwweforumorgreportsthe-global-risks-report-2020
assessments 68 always include employees in their internal assessment procedures by conducting training and awareness programs on water conversation initiatives communicating water-related policies etc This is followed by regulators and local communities who are relevant in water-risk assessment procedures at 61 and 54 respectively for the responding companies It is a positive sign that Indian companies are engaging with their employees and local communities and ensuring that the latter are not negatively impacted in terms of habitation health and water availability
According to The World Economic Forumrsquos Global Risk Report 202097 water crises are among the top five risks in terms of impact for the past ten consecutive years Water-related risks are substantive in the risk assessment processes and identified as a threat to companiesrsquo bottom line putting at risk a combined business value of US$425 billion according to CDP 2019 data
RegulatoryPhysical
Reputational
Risk due to company
Risk due to context
Expectedunexpected change or uncertainty in law or regulation
Water scarcity too much water water
unfit for use
Litigation product risks due to changes in
consumer behavior
Caused by inefficient operations produces and services resulting in water pollution over exploitation etc
Caused by changing environmental and social conditions like droughts
flooding etc
Relevancy of water-related risks
7157 57 50 46 46 43
11
Water-related
regulatory frameworks
Access to fully-
functioning safely
managed WASH
services for all employees
Water availability at a basincatchment
level
Implications of water on
your key commoditiesraw materials
Stakeholder conflicts
concerning water
resources at a basincatchment
level
Water quality at a basin
catchment level
Status of ecosystems and habitats
Other contextual
issues please specify
Empl
oyee
s
Regu
lato
rs
Loca
l com
mun
ities
Rive
r bas
in m
anag
emen
t au
thor
ities
Wat
er u
tiliti
es a
t a lo
cal l
evel
Stat
utor
y sp
ecia
l int
eres
t gr
oups
at a
loca
l lev
el
Inve
stor
s
Supp
liers
Oth
er w
ater
use
rs a
t a
basi
nca
tchm
ent l
evel
Oth
er
NG
Os
Cust
omer
s
No of Companies age of Companies
Relevancy of stakeholders in water-risk assessment
6861 54 50 50 46 46 39 36 32 2918
43
A N N U A L R E P O R T 2 0 2 0
Water risk event
Impacting business
Increased Operational amp maintenance Costs Increased Compliance amp
Administration Costs
Closure of Operations
Supply chain distributions
Brand Damage and LitigationsShareholder
Distributions
Risk transferRisk avoidance and mitigation
Technological Risks
Repurational amp Market Risks
Regulatory Risks
Physical Risks
Financial ImpactsResidual Water RiskInherent Water Risks
Increased water stress
143721Increased water scarcity
41105Drought
17604Inadequate infrastructure
820
Physical Risks
Ecosystem vulnerability
300Severe weather events
69Declining water quality
63Flooding
13
Regulatory Risks
Technology Risks
Higher water prices Transition to
water intensive low carbon energy sources
Tighter regulatory standards
2333
120
All the figures reported are in million rupees
44
A N N U A L R E P O R T 2 0 2 0
CDPrsquos data shows that physical risks seem to have the highest magnitude of impact on the Indian responding companies Drought is seen to be the primary driver of potential substantive impact
Where there is risk there is opportunity
Where therersquos risk therersquos reward Industrial wastewater for example is a vast untapped resource It is a potential source of heat power process water and high-value materials And there has never been a better time for this transformation to take place -- technologies are better the regulatory climate is favourable and the business case is clear Meanwhile the market demand for pollution-free products is growing For companies to thrive they will need to be aligned to changing consumer demands If
98 httpswwwmarketsandmarketscomMarket-Reportssmart-water-management-market-1265html
they respond to these opportunities then market differentiation resilience and profitability are on the table
Globally corporate leaders have started realising the untapped potential of smart water technology and the market for smart water management is anticipated to grow from US$846 billion in 2016 to US$2010 billion in 202198 Industrial wastewater has for a long time been reused for cooling towers steel works oil refineries textile manufacturing and paper production It was found that 15 of the 23 companies valued improved water efficiency in operations as their primary opportunity having a substantive financial or strategic impact on business
of the 28 responding companies (approx 93) identified water-related opportunities in their business26
Improved water efficiency in operations
Increased resilience to impacts of climate change
Reduced impact of product use on water resources
Improved community relations
Water recovery from sewage management
Resilience to future regulatory changes
Sales of new productsservices Increased brand value
3000million
`4000
million18752
million
opportunities were identified by 21 respondents
opportunities were identified by 11 respondents
opportunities were identified
by 9 respondents
opportunities were identified
by 4 respondents
Efficiency Resilience Products and services
Markets
22
14
10
4
`329
million
`
`
45
A N N U A L R E P O R T 2 0 2 0
26
17
14
17
2
Others
Recyclingreuse
Consumption
Product water intensity
Discharge
14
10Withdrawals
Water use efficiency
Categories of water targets monitored at the corporate level
of companies set company-wide water targets
of companies set company-wide water goals
5556
Businesses have identified transparency in water management issues as a fundamental activity and disclosure through CDPrsquos annual water questionnaire produces a standard comparable dataset McGill University and Millani found that companies disclosed through CDP ranked 19 percentiles better than the average business in their ability to access capital99 The research showed that a comprehensive voluntary disclosure produces a quality management team with enhanced awareness of threats and opportunities linked to climate and environmental change
Targets and Goals100
In response to declining water resources many companies have started engaging in water stewardship and setting water targets aligned with SDG Goal 6 to ensure availability and sustainable management of water sanitation and hygiene facilities for all101 Developing water-related targets helps companies make meaningful change from informed actions at the local level102 In 2020 four companies did not set water-related targets within their operations Whereas 24 companies had water-related targets 26 of them had set targets for product water intensity 17 set recyclingreuse targets and 14 focused on water use efficiency
Companies can set goals and targets on a range of operational issues to drive performance andor manage risks and opportunities CDPrsquos data shows that a majority had set targets at the company-wide level -- 55 of responding companies reported setting water targets across the company This was followed by 26 who set water targets at the business level and 19 at the site or facility level While setting water goals around 56 of companies monitored their goals at the company level 24 at the sitefacility level and the remaining at the basin business or country-level
99 Craig M Coulombe E Nostrat A 2019 The Role of CDP Disclosure to Improve Access to Capital Research Note httpsf01c8ee6-cac3-40ff-a0e4-8bfb54f2b88bfilesusrcomugd66e92b_30b06fd11b9c43d88428f768676e9a8bpdf
100 Targets ndash quantitative Goals - qualitative101 httpsunstatsunorgsdgsreport2020goal-06102 httpsceowatermandateorgsite-targets-guide
A company has various drivers for setting goals and targets and it tries to align these with increased stakeholder concerns and environmental legislation Data shows that most organisations considered reducing environmental impact and risk mitigation as the primary motivation for monitoring water goals and targets Organisations also considered brand value protection as one of the important factor while setting goals
24
4
Target Set No Target
No
of C
ompa
nies
Water targets monitored at the corporate level
46
A N N U A L R E P O R T 2 0 2 0
Drivers behind setting water targets and goals at the corporate level
Reduced environmental impact
Water stewardship
Risk mitigation
Recommended sector best practice
Corporate social responsibility
Brand value protection
Cost savings
Shared value
Climate change adaptation amp mitigation strategiess
Commitment to the UN SDG
Increase freshwater availability for users
Other drivers
45
14
14
2
2
2
5
14
16
12
161212
12
4
4
4
44
GoalsTargets
age of Companies
47
A N N U A L R E P O R T 2 0 2 0
PROTECTING OUR FOREST WEALTH
The world lost an estimated 10 million hectares of forest annually between 2015 and 2020104 Protecting and restoring forests and other natural ecosystems could provide up to 30 of climate change mitigation action needed to limit global warming to below 20C by 2030105
Global demand for agricultural commodities is the primary driver of deforestation and ecosystem conversion -- timber is extracted unsustainably and land is cleared for agricultural production This represents major risks to businesses as commodities associated with deforestation such as palm oil soy cattle and timber products are the building blocks of millions of products traded globally and therefore feature in the supply chains of numerous organisations
103 httpswwwipccchsrccl104 The State of the Worldrsquos Forests 2020 Forests biodiversity and people105 httpswwwpnasorgcontent1144411645106 httpsappsfasusdagovnewgainapiapiReportDownloadReportByFileNamefileName=Oilseeds20and20
Products20Annual_New20Delhi_India_04-01-2020
The unsustainable production and supply of these commodities and activities not only poses a significant business risk but also has a severe negative impact on the environment especially the climate crisis
Deforestation is fundamentally linked to climate change According to the IPCC Special Report on Climate Change and Land (2019)103 11 of global GHG emissions are from deforestation and from the conversion of natural ecosystems for human use
At an 8 annual growth rate edible oil consumption in India is growing faster than the 3 growth rate in production Imports and imports are rising to fill the gap As a result India still is the largest importer of edible oils followed by China European Union and the United States Indiarsquos edible oil imports in MY 202021 are predicted to rise 6 to 15 MMT of this 85 MMT will be palm oil 35 MMT soybean 28 MMT sunflower seed oil and 02 MMT rapeseed (canola) oil
-United States Department of Agriculture106
In 2020 three Indian companies responded to CDPrsquos forests questionnaire -- one responded to the request for disclosure from investors while two responded to their customers Globally 687 companies responded to CDPrsquos forests questionnaire and 57 of them evaluated deforestation-related risks at US$5312 billion
13The mitigation potential of reduced deforestation is
13 of the global emissions
We cant address climate change without protecting our forests
They are vital carbon stores that help reduce global warming
48
A N N U A L R E P O R T 2 0 2 0
Disclosure on deforestation management through CDP could be a significant opportunity for companies operating in India one of the largest importers of palm oil in the world This can help Indian companies tap into lucrative opportunities by scaling sustainable trends CDPrsquos forests questionnaire allows companies that produce source or use palm oil soy timber cattle cocoa coffee and rubber to disclose Moreover new biodiversity-focused metals amp mining and coal sector questionnaires were introduced in 2019
Palm oil is the most commonly used processed oil in industrial food production with its production being responsible for 5 of global tropical deforestation107 Indiarsquos palm oil imports account for nearly 23rd of its total imports of edible oil This demand was shaken in 2020 when the pandemic hit with a 40 fall in the consumption of palm oil during the lockdown108 Indiarsquos imports which account for nearly 20 of the global trade in palm oil will have a major effect on efforts to make its production and processing sustainable The primary barrier for sustainable palm oil consumption in
India stems from it belonging to a more price-sensitive and volume driven market making environmental impacts a low or non- existent priority in the minds of consumers
Climate change can reduce palm oil production and with demand outstripping supply prices could rise The Roundtable on Sustainable Palm Oil (RSPO) has developed a set of environmental and social criteria which companies must comply with in order to produce Certified Sustainable Palm Oil (CSPO) When properly applied these criteria can help in minimising the negative impacts of palm oil cultivation
107 Deforestation amp Palm Oil 108 As worldrsquos largest importer of palm oil India has a duty to push for ethical production practices109 httpsseaofindiacominterim-data-on-import-of-edible-oils-march-2020-down-by-32-percent-nov19-to-mar20-down-by-10-percent110 httpsappsfasusdagovnewgainapiapiReportDownloadReportByFileNamefileName=Oilseeds20and20Products20Annual_New20Delhi_India_04-01-2020111 httpsresourcetradeearthyear=2018ampexporter=76ampimporter=699ampcategory=87ampunits=value112 httpswwwrvonlsitesdefaultfiles201705poultry-sector-in-india-2017pdf113 httpsresourcetradeearthpublicationscocoa-trade-climate-change-and-deforestation
The Sustainable Palm Oil Coalition for India (I-SPOC) was formed to promote the uptake of sustainable palm oil and its derivatives in India CDP amongst others has joined it as a member
Soy cultivation is the second largest soft commodity driver of tropical deforestation after cattle products Various aspects of soy production generate GHGs that contribute to climate change India imports around 33 lakh tons of soybean oil109 According to data from the US Department of Agriculture India
is set to import 35 lakh metric ton of soybean oil in 20202021110 In addition India is also responsible for clearing huge spaces of forest land in Brazil that contributed to 23 of soybean imports to India in 2018111 Soy is also used as fodder for livestock and a growing local demand for poultry products will further affect Indiarsquos position on deforestation The country ranks amongst the top four producers of egg and chicken in the world and it is increasingly exporting to the Middle East and Europe112
Cocoa has been a notable agent of deforestation since the last century The global production of cocoa has increased from 34 million to 45 million tonnes between 2000 and 2014 while the land use footprint of its plantations rose by 37 to 257 million acres113 About 90 of
cocoa is produced by 7 countries -- Ivory Coast Ghana Indonesia Ecuador Cameroon Brazil and Nigeria The dearth of incentives for improving the plantations combine with high investment costs to make cocoa a low yield crop forcing farmers to resort to clearing untouched forest lands in order to meet the growing demand and
lsquoPalm oil consumption dropped by
in 2020 in India due to COVID-19rsquo
40
Climate-Water-Forest nexus
Water is an essential component of mitigation and adaptation strategies
Rising temperatures and changing weather patterns increase stress on water availability
Tropical forests provide substantial emission reductions by acting as carbon sinks
Droughts resulting from rising temperatures and changes in weather patterns increase the risk of forests fires
A major portion of gobal freshwater depends on forests
49
A N N U A L R E P O R T 2 0 2 0
for cutting down production costs114 In Southern India Cocoa is mainly grown as an intercrop in conjunction with coconut areca nut oil and rubber plantations Indiarsquos consumption in 2015-16 was 30000 tonnes of which 57 was imported while the domestic production rose at an annual rate of 37 in the same period115 Failure to protect forests in the event of a sharp cocoa price increase will lead to unsustainable levels of deforestation116
The US$10 billion coffee industry too leaves a gargantuan ecological footprint It is estimated that every cup of coffee consumed results in the loss of one square inch of forest cover117 Each year around 250000 acres of land is cleared for coffee which is unsustainable The Kodagu district
in the Western Ghats of India is a major biodiversity hotspot which produces about one-third of the countryrsquos coffee This region has more than 270 tree species which are all under significant ecological stress due to the coffee farms that threaten land use and land cover while potentially leading to the felling of about 21000 trees118
An estimated 8-10 of global production of low-cost timber products comes from illegal logging in forests To meet the burgeoning demand of timber produce about 25 million acres of land is converted to fast-
wood forests (timber plantations) across the world annually and this hampers the ecosystem services that nature provides us119 With the World Bank forecasting that the global market for wood is set to quadruple by 2050120 reducing timberrsquos environmental footprint is vital for the industryrsquos success In India there is no provision of a central data pool that maintains records of production and consumption of timber There is a need to address this inconsistency in reporting and data collection by forging a comprehensive strategic policy and providing institutional support121 This would ensure effective collaboration among all stakeholders that would result not only in the production of quality forest products but also a sustainable timber sector
114 httpsresourcetradeearthpublicationscocoa-trade-climate-change-and-deforestation~text=As20cocoa20tends20to20beforest20loss20over20this20time115 httpseconomictimesindiatimescomindustrycons-productsfoodalthough-indias-consumption-of-chocolate-is-steadily-growing-but-we-still-depend-on-imports-for-116 httpsnationalzoosieduscbimigratorybirdsresearchcacaorufcfm117 httpsohiostatepressbookspubsciencebiteschaptera-bitter-brew-coffee-production-deforestation-soil-erosion-and-water-contamination~text=For20every20cup20of20
coffeeinch20of20rainforest20was20destroyedamptext=Chemical20buildup20in20soils20andsoil20eroding2C20and20land20degradation118 httpswebcachegoogleusercontentcomsearchq=cacheYhaeYHVPWasJhttpswwwmdpicom1999-4907114480pdf+ampcd=6amphl=enampct=clnkampgl=in119 httpsresourcetradeearthyear=2018ampexporter=76ampimporter=699ampcategory=87ampunits=value120 httpdocuments1worldbankorgcurateden240231467291388831pdf106467-REVISED-v1-PUBLICpdf121 httpsonlinelibrarywileycomdoifull1011111477-894712094122 httpsglobalforestatlasyaleeduamazonland-usecattle-ranching123 httpsresourcetradeearthyear=2018ampimporter=699ampcategory=779ampunits=value124 httpsresourcetradeearthyear=2018ampimporter=699ampcategory=779ampunits=value125 httplargestanfordeducourses2018ph240halper1~text=Every20half20hour2C20a20cowmore20potent20than20carbon20dioxideamptext=There20is20
rampant20deforestation2C20especiallyto20make20room20for20cattle126 httpswwwinvestopediacomarticlesinvesting0929155-countries-produce-most-carbon-dioxide-co2asp127 httpwwwcwejournalorgvol9no3do-extensive-rubber-plantation-influences-local-environment-a-case-study-from-tripura-northeast-india128 httpswwwibeforgdownloadRubber_Plastics_220708pdf
Beef production remains by far the largest driver of deforestation in the worldrsquos tropical forests as forest land cleared for cattle is more than twice the combined area required for producing soy palm oil and wooden products The problem of cattle ranching
is particularly profound in the Amazon region the largest forest reserve in the world leading to 80 of present deforestation rates122 Clearing land for grazing causes irreversible habitat loss soil degradation and conflict between humans and wild animals India imports 15 and 12 of bovine leather from Turkey and Brazil respectively which poses a great threat to the forest areas of these countries123 It also jeopardises the earnings of the Indian companies manufacturing such products for its European consumers who have a high degree of sensitivity and awareness around deforestation124 In a larger context the impact of cattle stretches far beyond the realm of forests and is one of the key reasons for rising global emissions and climate change There are more than 15 billion cows on Earth with each of them capable of expelling 17 times more GHG emissions than cars in the form of methane burps a gas several times more potent than CO2 in terms of trapping heat It is therefore not surprising that cattle accounts for a colossal 18 in atmospheric carbon emissions125 To put this in perspective this surpasses emissions of the third largest CO2 emitter India which accounts for a 7 share in worldwide emissions126
Another commodity whose production has significant impact on the environment is rubber Environmentalists have warned for years that the rapid expansion of rubber plantations would come at the expense of natural forests Rubber has
not been subjected to extensive publicity in a way that palm oil soy and paper have been over the years given their impact on the environmentmdashpublicity that has led to adoption of robust sustainability criteria for these commodities Indiarsquos natural rubber plantation spans across an area of 183 million acres as of 2012 with the raw material being used as an input for making 35000 finished products of industrial importance127 Currently the impact assessment of large-scale rubber plantations on the environment is non-existent in the country a worrying sign considering Indiarsquos position as the 4th largest consumer in the world128
50
A N N U A L R E P O R T 2 0 2 0
Fossil-fuel and mineral mining accounts for 7 of global deforestation Moreover it not only presents a threat to forest cover and resource extraction but also leads to long-term impacts such as soil and water pollution infrastructure development and
increased anthropogenic activity129 While the effects of large-scale mining are easier to quantify as they are well regulated and undertake environmental impact assessments it is the scope and impact of artisanal and small-scale mining (ASM) that goes under the radar due to lack of data and a high degree of informality in the sector In India this problem warrants special attention since over 12 million people are engaged in the ASM business with women and girls from backward communities and those living below the poverty line being its primary employees130 A landscape-level approach is critical not only to identify and monitor the environmental and social impacts of individual mining projects but also to consider its interactions with other land uses as well given the crucial role forests play in balancing the ecosystem131 Indiarsquos investor requested company Hindustan Zinc Ltd was the first to disclose this year under the mining sector
129 httpsglobalforestatlasyaleeduland-usemining-extraction130 httpswwwpactworldorgstate20of20asm131 httpswwwresearchgatenetpublication38084575_Landscape_approach_for_quantifying_land_use_land_cover_change_1972-2006_and_habitat_diversity_in_a_mining_area_in_
Central_India_Bokaro_Jharkhand
Hindustan Zinc Pioneering forest and biodiversity conservation in the mining sectorHindustan Zinc Limited is the first investor-requested company in India to respond to CDPrsquos Forests questionnaire It demonstrated that a dedicated Biodiversity Policy and Management Standard is its compass in reducing flora and fauna disruption and in minimising or compensating its impact of operation through project scoping site closure and beyond
Companies in India currently lag behind their regional peers in terms of disclosure on deforestation management with only 3 companies disclosing on this topic in 2020
40
65
22
3China Japan IndiaSEA
(Indonesia Malaysia
Phillipines Singapore Vietnam)
Total no of companies disclosing through CDPs Forests questionnaire in 2020 by HQ countryregion
51
A N N U A L R E P O R T 2 0 2 0
Nagpur
Udaipur
Panaji
Kochi
Rajkot
Vadodara
Delhi
Dehradun
Ahmedabad
Thane
Chennai
Tiruchirappalli Coimbatore
Bangalore
Kolkata
Gangtok
Siliguri
India Snapshot
CITIES STATES AND REGIONS
Cities
In 2020 over 800 cities disclosed their environmental information through CDP including 16 Indian cities The number of cities in India disclosing through the CDP-ICLEI Unified Reporting System increased from 13 in 2019 to 17 This was largely due to citiesrsquo ongoing commitments to climate leadership initiatives such as the C40 Cities Climate Leadership Group (C40) the Global Covenant of Mayors for Climate and Energy (GCoM) and our partnership with ICLEI whose South Asia Regional Office also acts as the GCoM South Asia Helpdesk
88 global cities reached CDPrsquos A list which include Bristol (UK) Miami (USA) Cape Town (South Africa) Buenos Aires (Argentina) and Auckland (New Zealand)
despite the COVID-19 pandemic The USA accounts for the highest number
(25) of cities on the A List making up 28 despite the US pulling out of
the Paris Agreement In India more than half the cities in disclosed
that
they either have sustainability targets incorporated into the master planning of the city or it is in progress while only 43 of the cities have a published plan that addresses climate change adaptation Approximately half of the disclosing Indian cities have identified opportunities as a result of addressing climate change and one-third of them have a GHG emission reduction target which is a strong indication towards a low carbon development pathway
States and Regions
In 2020 the Union Territories of Delhi and Jammu amp Kashmir along with over 120 states and regions from across the world disclosed their environmental impacts through CDP Globally 90 of states and regions reporting a 2030 target have one in line with the IPCCrsquos goal to reduce global greenhouse gas emissions by 40-50 from 2010 levels by 2030 and 55 of states and regions with a 2030 emissions reduction
target are showing greater ambition than their national
counterparts
Indian cities and 16
Indian states disclosed to CDP
2
52
A N N U A L R E P O R T 2 0 2 0
ANNEXURESAppendix I Table of emissions scores and sector by company
Sector Company Name 2020 permission Status
Final score 2020
Scope 1 Scope 2 Scope 3 Number of categories reported in Scope 3
Bars hotels amp restaurants
Indian Hotels Co Ltd
public C 50610 239568 23824 3
Biotech amp pharma Biocon public C 41948 133110 Not Provided
Dr Reddyrsquos Laboratories
public B 247317 154836 1272548 8
ZCL Chemicals public D- Not Provided Not Provided Not Provided
Cement amp concrete ACC public B 16966585 643870 648068 3
Ambuja Cements public B 14523738 551219 1973622 7
Dalmia Bharat Ltd
public B 11280051 537968 1320736048 9
JK Cement non public D Private Private Private Private
JSW Cement Limited
public B- 1398609 647870 572488 4
Shree Cement non public C Private Private Private Private
Ultratech Cement
public B 47954830 1327185 5376354 4
Chemicals Aarav Frances amp Flavors Private
Limited
public Not Scored
GHCL LIMITED public D 109470536 496707 Not Provided
Godrej Industries public B 32311 44361 6735893 3
Gujarat Fluorochemicals
non public C Private Private Private Private
Jubilant Life Sciences Ltd
non public C Private Private Private Private
Kansai Nerolac Paints Limited
non public Not Scored Private Private Private Private
Tata Chemicals public B 444988061 4505956 12162395 5
UPL Limited non public Private Private Private Private Private
Godrej Consumer
Products Limited
public A- 33980 30848 26433 2
Note Due to increase in sample size more samples were considered for this report These samples include companies from the BSE Top 200 list CDPrsquos Fixed Income sample FAIRR sample Emerging markets sample Environmental sample and Continuity climate change sampleFor further details visit https6fefcbb86e61af1b2fc4-c70d8ead6ced550b4d987d7c03fcdd1dsslcf3rackcdncomcomfycmsfilesfiles000003423originalCDP_Climate_Change_Sample_Investor_Request_2020pdfNot Scored- Companies who have submitted the minimum version questionnaire
53
A N N U A L R E P O R T 2 0 2 0
Sector Company Name 2020 permission Status
Final score 2020
Scope 1 Scope 2 Scope 3 Number of categories reported in Scope 3
Energy utility networks
Adani Transmission
Ltd
public D 31870076 21155 9379637 3
GAIL public C 4925087 387358 1071 1
Financial services Axis Bank public B 6250 168043 4414712 3
HDFC Bank Ltd public B 764919 390176 1642453 3
Indusind Bank public A 88316 6278567 1277912 3
Kotak Mahindra Bank
public C 9078 69780 4290177 3
LampT Finance Holdings Limited
non public Private Private Private Private Private
State Bank of India
public B- 390 1066386 257902 5
YES BANK Limited
public A- 344515 3099369 4859625 3
Agricultural commodities
Tata Consumer Products Ltd
public A- 11731 34238 3348672939 10
Marico public A- 1380 12140 499568 9
Intermodal transport amp logistics
Adani Ports amp Special
Economic Zone
public B- 95905791 176946845 202567171 3
IT amp software development
HCL Technologies
non public Private Private Private Private Private
Infosys Limited public A- 15344 124063 371602 6
Larsen amp Toubro Infotech Ltd
public B 39485 2521874 1908034 2
Mindtree Ltd non public A- Private Private Private Private
Tata Consultancy
Services
public A- 26714 811815 702615 7
Tech Mahindra public A 1803807 105736586 39285212 5
Wipro public A- 13366 124564 421527 7
Land amp property ownership amp development
Godrej Properties Limited
public Not Scored 4400 2429 422
Mahindra Lifespace
Developers Limited
public B 397 2675 589525 8
Light manufacturing APOLLO TYRES LTD
public Not Scored 24207 60717 Not Provided
JK Tyres amp Industries
public C 158568 88424 Not Provided
54
A N N U A L R E P O R T 2 0 2 0
Sector Company Name 2020 permission Status
Final score 2020
Scope 1 Scope 2 Scope 3 Number of categories reported in Scope 3
Media telecommunications amp data center services
Bharti Airtel non public D Private Private Private Private
Reliance Jio Infocomm
Limited
public B 105018 1826762 243195034 3
Tata Communications
public A- 6376 108482 6938 3
Metal smelting refining amp forming
Hindustan Zinc public A 4480887 253756 4182181 10
Vedanta Ltd public B- 57482869 1864711 Not Provided
JSW Steel Ltd public A- 40045307 476901 4168823 8
Tata Steel public A- 60116322 5687999 14970000 12
Metallic mineral mining
NMDC public D 29004 63671 1957 1
Oil amp gas processing Bharat Petroleum
Corporation
public B 5023580 366230 729820 2
Indian Oil Corporation
public D 18690000 54700 Not Provided
Renewable power generation
Adani Green Energy
public D 841 13313 1174 1
Azure Power public Private 323 2767
Specialized professional services
Mahindra amp Mahindra Financial Services
public B 3370 18847 22922 3
Piramal Enterprises
public C 4430568 8692844 Not Provided
Vakrangee Softwares Ltd
public B 2053355 35409 Not Provided
Textiles amp fabric goods
ARVIND Ltd public B- 3514561 238894 Not Provided
Thermal power generation
Adani Power Ltd public D 58970705 14607 6910800 1
JSW Energy public B 17200521 36117 61151 2
NTPC Ltd public D 252495018 15845 978052 3
Tata Power Co public C 34952981 22051 1226 1
Tobacco ITC Limited public B- 1241718 230192 206064 5
Transportation equipment
Hero Motocorp Ltd
non public D Private Private Private Private
Mahindra amp Mahindra
public A 40654 414552 58425531 11
Tata Motors public A- 60533 266200 3140861 8
55
A N N U A L R E P O R T 2 0 2 0
Climate Change ndash Investor requested companies132
CDP Activity Group Company name Response Status
Air transport InterGlobe Aviation Ltd Not submitted
Jet Airways (India) Ltd Not submitted
Apparel design Page Industries Ltd Not submitted
Bars hotels amp restaurants
Indian Hotels Co Ltd Submitted
Jubilant Foodworks Ltd Not submitted
Biotech amp pharma Abbott India Ltd See Another
Ajanta Pharma Ltd Not submitted
Alkem Laboratories Ltd Not submitted
Aurobindo Pharma Not submitted
Biocon Submitted
Cadila Healthcare Not submitted
Cipla Not submitted
Divirsquos Laboratories Not submitted
Dr Reddyrsquos Laboratories
Submitted
Glenmark Pharmaceuticals
Not submitted
Lupin Not submitted
Natco Pharma Ltd Not submitted
Pfizer Ltd See Another
Sun Pharma Advanced Research Company Ltd
Not submitted
Sun Pharmaceutical Industries
Not submitted
Torrent Pharmaceuticals
Not submitted
Cement amp concrete ACC Submitted
Ambuja Cements Submitted
Dalmia Bharat Ltd Submitted
India Cements Not submitted
JK Cement Ltd Submitted
Orient Cement Limited Not submitted
Shree Cement Submitted
The Ramco Cements Ltd
Not submitted
Ultratech Cement Submitted
132 These include companies from the BSE Top 200 list CDPrsquos Fixed Income sample FAIRR sample Emerging markets sample Environmental sample and Continuity climate change sample For further details visit https6fefcbb86e61af1b2fc4-c70d8ead6ced550b4d987d7c03fcdd1dsslcf3rackcdncomcomfycmsfilesfiles000003423originalCDP_Climate_Change_Sample_Investor_Request_2020pdf
See Another -The response is covered by another CDP reporting company usually the parent company
CDP Activity Group Company name Response Status
Chemicals Asian Paints Not submitted
Berger Paints India Ltd Not submitted
Castrol India Not submitted
Colgate Palmolive India See Another
Coromandel International
Not submitted
Dabur India Not submitted
Emami Ltd Not submitted
Godrej Consumer Products Limited
Submitted
Godrej Industries Submitted
GRAPHITE INDIA LTD Not submitted
HEG LTD Not submitted
Jubilant Life Sciences Ltd
Submitted
Kansai Nerolac Paints Limited
Submitted
PI Industries Ltd Not submitted
Pidilite Industries Ltd Not submitted
Procter amp Gamble Hygiene amp Health Care Ltd
See Another
SRF Ltd Not submitted
Supreme Industries Ltd Not submitted
Tata Chemicals Submitted
UPL Limited Submitted
Coal mining Adani Enterprises Not submitted
Coal India Not submitted
Gujarat Mineral Devp Corpn
Not submitted
Commercial amp consumer services
Quess Corp Ltd Not submitted
Construction Bharti Infratel Limited Not submitted
GVK Power amp Infrastructure
Not submitted
Honeywell Automation India Ltd
See Another
Larsen amp Toubro Not submitted
Voltas Not submitted
Appendix II List of companies invited to respond to CDP
56
A N N U A L R E P O R T 2 0 2 0
CDP Activity Group Company name Response Status
Financial services Gruh Finance Ltd Not submitted
HDFC Asset Management
Not submitted
HDFC Bank Ltd Submitted
HDFC Life Insurance Company Ltd
Not submitted
Housing Development Finance Corporation
Not submitted
ICICI Bank Limited Not submitted
ICICI Lombard General Insurance Company Ltd
Not submitted
ICICI Prudential Life Insurance Company Ltd
Not submitted
IDBI Bank Ltd Not submitted
IDFC First Bank Ltd Not submitted
Indiabulls Housing Finance Ltd
Not submitted
Indiabulls Ventures Ltd Not submitted
Indian Bank Not submitted
Indusind Bank Submitted
Kotak Mahindra Bank Submitted
LampT Finance Holdings Limited
Submitted
LIC Housing Finance Not submitted
Max Financial Services Not submitted
Motilal Oswal Financial Services Ltd
Not submitted
Muthoot Finance Limited
Not submitted
PNB Housing Finance Ltd
Not submitted
Power Finance Corporation
Not submitted
Punjab National Bank Not submitted
RBL Bank Ltd Not submitted
REC Ltd Not submitted
Reliance Nippon Life Asset Management Ltd
Not submitted
SBI Life Insurance Company Ltd
Not submitted
Shriram Transport Finance Co
Not submitted
State Bank of India Submitted
Union Bank of India Not submitted
YES BANK Limited Submitted
CDP Activity Group Company name Response Status
Convenience retail Avenue Supermarts Ltd Not submitted
Discretionary retail Aditya Birla Fashion and Retail Ltd
Not submitted
Future Retail Ltd Not submitted
Electrical amp electronic equipment
Amara Raja Batteries Ltd
Not submitted
Bharat Electronics Not submitted
Crompton Greaves Consumer Electricals Ltd
Not submitted
Exide Industries Not submitted
Havells India Not submitted
Motherson Sumi Systems
Not submitted
Whirlpool of India Ltd See Another
Energy utility networks
Adani Gas Ltd Not submitted
Adani Transmission Ltd Submitted
CESC Ltd Not submitted
GAIL Submitted
Indraprastha Gas Ltd Not submitted
Power Grid Corpn of India
Not submitted
Reliance Infrastructure Not submitted
Torrent Power Not submitted
Financial services AU Small Finance Bank Ltd
Not submitted
Axis Bank Submitted
Bajaj Finance Limited Not submitted
Bajaj Finserv Not submitted
Bajaj Holdings amp Invst (BHIL)
Not submitted
Bandhan Bank Not submitted
Bank of Baroda Not submitted
Bank of India Not submitted
Canara Bank Not submitted
Cholamandalam Investment and Finance Co Ltd
Not submitted
Cholamandalam Investment and Finance Company Ltd
Not submitted
City Union Bank Ltd Not submitted
Edelweiss Financial Services Ltd
Not submitted
Federal Bank Not submitted
General Insurance Corporation of India
Not submitted
57
A N N U A L R E P O R T 2 0 2 0
CDP Activity Group Company name Response Status
Food amp beverage processing
Britannia Industries Not submitted
Marico Submitted
Tata Consumer Products
Submitted
United Breweries Not submitted
United Spirits Not submitted
Varun Beverages Ltd Not submitted
Venkys India Ltd Not submitted
Health care provision Apollo Hospitals Enterprises
Not submitted
Industrial support services
GMR Infrastructure Limited
Not submitted
Intermodal transport amp logistics
Adani Ports amp Special Economic Zone
Submitted
Container Corporation of India
Not submitted
IT amp software development
HCL Technologies Submitted
Infosys Limited Submitted
Larsen amp Toubro Infotech Ltd
Submitted
Mindtree Ltd Submitted
MphasiS Not submitted
Oracle Financial Services
See Another
Tata Consultancy Services
Submitted
Tech Mahindra Submitted
Wipro Submitted
WNS Holdings ADR Not submitted
Land amp property ownership amp development
DLF Not submitted
Godrej Properties Limited
Submitted
Housing Development amp Infrastructure
Not submitted
Oberoi Realty Not submitted
Leisure amp home manufacturing
Rajesh Exports Ltd Not submitted
Titan Company Limited Not submitted
Light manufacturing 3M India Ltd Not submitted
APOLLO TYRES LTD Submitted
Balkrishna Industries Ltd
Not submitted
Ceat Ltd Not submitted
MRF LTD Not submitted
CDP Activity Group Company name Response Status
Media telecommunications amp data center services
Bharti Airtel Submitted
Reliance Communications
Not submitted
Sun TV Network Not submitted
Tata Communications Submitted
Vodafone Idea Ltd Not submitted
Zee Entertainment Enterprises
Not submitted
Metal products manufacturing
AIA Engineering Ltd Not submitted
Bosch Ltd See Another
Endurance Technologies Ltd
Not submitted
Gillette India Not submitted
Metal smelting refining amp forming
Bharat Forge Ltd Not submitted
Essar Steel Limited Not submitted
Hindalco Industries Not submitted
Hindustan Zinc Submitted
Jindal Stainless Ltd Not submitted
Jindal Steel amp Power Not submitted
JSW Steel Ltd Submitted
Steel Authority of India Not submitted
Tata Metaliks Ltd Not submitted
Tata Steel Submitted
Vedanta Ltd Submitted
Metallic mineral mining
National Aluminium Co Not submitted
NMDC Submitted
Oil amp gas extraction amp production
Oil India Ltd Not submitted
Petronet LNG Not submitted
Oil amp gas processing Bharat Petroleum Corporation
Submitted
Hindustan Petroleum Corporation
Not submitted
Indian Oil Corporation Submitted
Mangalore Refinery and Petrochemicals
Not submitted
Nayara Energy Limited Not submitted
Oil amp Natural Gas Corporation
Not submitted
Reliance Industries Not submitted
Oil amp gas storage amp transportation
Gujarat State Petronet Not submitted
Other materials Astral Poly Technik Ltd Not submitted
Powered machinery Bharat Heavy Electricals
Not submitted
Cummins India See Another
58
A N N U A L R E P O R T 2 0 2 0
CDP Activity Group Company name Response Status
Renewable power generation
Adani Green Energy Submitted
Azure Power Submitted
National Hydroelectric Power Corporation Ltd (NHPC)
Not submitted
ReNew Power Private Limited
Not submitted
SJVN Ltd Not submitted
Specialized professional services
LampT Technology Services Ltd
Not submitted
Mahindra amp Mahindra Financial Services
Submitted
NBCC Ltd Not submitted
Piramal Enterprises Submitted
Vakrangee Softwares Ltd
Submitted
Textiles amp fabric goods
ARVIND Ltd Submitted
Birla CelluloseGrasim Industries
Not submitted
Chennai Petroleum Corporation
Not submitted
Thermal power generation
Adani Power Ltd Submitted
Aditya Birla Capital Not submitted
JSW Energy Submitted
KSK Energy Ventures Limited
Not submitted
NLC India Ltd Not submitted
NTPC Ltd Submitted
Reliance Power Not submitted
Tata Power Co Submitted
Tobacco ITC Limited Submitted
Transportation equipment
Ashok Leyland Not submitted
Bajaj Auto Not submitted
Eicher Motors Ltd Not submitted
Hero Motocorp Ltd Submitted
Mahindra amp Mahindra Submitted
Maruti Suzuki India Not submitted
Tata Motors Submitted
TVS Motor Company Ltd
Not submitted
Web amp marketing services
Info Edge (India) Ltd Not submitted
Wood amp paper materials
Century Textiles amp Industries
Not submitted
59
A N N U A L R E P O R T 2 0 2 0
Climate Change ndash Self Selected companies
CDP Activity Group Company name Response Status
Chemicals AARAV FRANCES amp FLAVORS PRIVATE LIMITED Submitted
GHCL LIMITED Submitted
Gujarat Fluorochemicals Submitted
Light manufacturing JK Tyres amp Industries Submitted
Cement amp concrete JSW Cement Limited Submitted
Land amp property ownership amp development Mahindra Lifespace Developers Limited Submitted
Media telecommunications amp data center services
Reliance Jio Infocomm Limited Submitted
Biotech amp pharma ZCL Chemicals Submitted
Water Security ndash Investor requested companies133
CDP Activity Group Name Response Status
Bars hotels amp restaurants Indian Hotels Co Ltd Submitted
Biotech amp pharma Ajanta Pharma Ltd Not submitted
Alkem Laboratories Ltd Not submitted
Aurobindo Pharma Not submitted
Biocon Not submitted
Cadila Healthcare Not submitted
Cipla Not submitted
Divirsquos Laboratories Not submitted
Dr Reddyrsquos Laboratories Submitted
Glenmark Pharmaceuticals Not submitted
Lupin Not submitted
Natco Pharma Ltd Not submitted
Sun Pharmaceutical Industries Not submitted
Torrent Pharmaceuticals Not submitted
ZCL Chemicals Submitted
Cement amp concrete ACC Not submitted
Ambuja Cements Submitted
Dalmia Bharat Ltd Not submitted
Shree Cement Not submitted
The Ramco Cements Ltd Not submitted
Ultratech Cement Submitted
Chemicals Asian Paints Not submitted
Berger Paints India Ltd Not submitted
Castrol India Not submitted
Coromandel International Not submitted
Dabur India Submitted
Emami Ltd Not submitted
Godrej Consumer Products Limited Submitted
Godrej Industries Submitted
Jubilant Life Sciences Ltd Submitted
Kansai Nerolac Paints Limited Submitted
Pidilite Industries Ltd Not submitted
Procter amp Gamble Hygiene amp Health Care Ltd Not submitted
SRF Ltd Not submitted
Supreme Industries Ltd Not submitted
Tata Chemicals Submitted
133 These include companies from the Water Global sample and Continuity water security sample For further details visit https6fefcbb86e61af1b2fc4-c70d8ead6ced550b4d987d7c03fcdd1dsslcf3rackcdncomcomfycmsfilesfiles000003422originalCDP_Water_Security_Sample_Investor_Request_2020pdf
60
A N N U A L R E P O R T 2 0 2 0
CDP Activity Group Name Response Status
UPL Limited Submitted
VVF Ltd Not submitted
Coal mining Adani Enterprises Not submitted
Coal India Not submitted
Construction Larsen amp Toubro Not submitted
Discretionary retail Aditya Birla Fashion and Retail Ltd Not submitted
Electrical amp electronic equipment Amara Raja Batteries Ltd Not submitted
Exide Industries Not submitted
Havells India Not submitted
Energy utility networks GAIL Not submitted
Power Grid Corpn of India Not submitted
Food amp beverage processing Marico Submitted
Tata Consumer Products Ltd Submitted
IT amp software development Tech Mahindra Submitted
Light manufacturing APOLLO TYRES LTD Not submitted
JK Tyres amp Industries Submitted
MRF LTD Not submitted
Media telecommunications amp data center services
Tata Communications Not submitted
Metal smelting refining amp forming Bharat Forge Ltd Not submitted
Hindalco Industries Not submitted
Hindustan Zinc Submitted
Jindal Steel amp Power Not submitted
JSW Steel Ltd Not submitted
Tata Steel Submitted
Metallic mineral mining National Aluminium Co Not submitted
NMDC Not submitted
Oil amp gas extraction amp production Oil India Ltd Not submitted
Petronet LNG Not submitted
Oil amp gas processing Bharat Petroleum Corporation Not submitted
Hindustan Petroleum Corporation Not submitted
Indian Oil Corporation Not submitted
Oil amp Natural Gas Corporation Not submitted
Reliance Industries Not submitted
Oil amp gas storage amp transportation Gujarat State Petronet Not submitted
Specialized professional services Piramal Enterprises Submitted
Textiles amp fabric goods ARVIND Ltd Submitted
Birla CelluloseGrasim Industries Not submitted
Thermal power generation Adani Power Ltd Submitted
JSW Energy Not submitted
NTPC Ltd Submitted
Tata Power Co Submitted
Tobacco ITC Limited Submitted
Transportation equipment Ashok Leyland Not submitted
Bajaj Auto Not submitted
Hero Motocorp Ltd Not submitted
Mahindra amp Mahindra Submitted
Maruti Suzuki India Not submitted
Tata Motors Not submitted
61
A N N U A L R E P O R T 2 0 2 0
Water Security ndash Self Selected companies
CDP Activity Group Name Response Status
Chemicals AARAV FRANCES amp FLAVORS PRIVATE LIMITED Submitted
Transportation services Adani Ports amp Special Economic Zones Submitted
Other materials Piramal Glass Submitted
62
A N N U A L R E P O R T 2 0 2 0
Appendix III - Indian Companies Committed to ActionScience-based Target initiative (SBTi)Approved 15degC
Mahindra Heavy Engines Ltd Mahindra EPC Irrigation Limited White House
Dr Reddys Laboratories Ltd Swaraj Engines Limited Gromax Agri Equipment Limited
Mahindra Accelo Mahindra Holidays and Resorts India Limited Mahindra Lifespaces Developers Limited
Mahindra Lifespaces Developers Limited Mahindra World City (Jaipur) Ltd Mahindra World City Developers Ltd
Polygenta Technologies Limited
Approved well-below 2degC
Tata Chemicals Limited Mahindra amp Mahindra Limited Wipro
Mahindra First Choice Services Ltd Mahindra Electric Mobility Ltd
Approved 2degC
Hindustan Zinc Limited Mahindra Sanyo Special Steel Shree Cement Ltd
Tech Mahindra
SBTi Committed
Infosys Limited UPL Limited JSW Energy Limited
Godrej Agrovet Limited Godrej Consumer Products Limited Godrej Industries
Godrej Properties Limited Godrej amp Boyce Mfg Co Ltd Ultratech Cement Limited
Vakrangee Limited ACC Limited Adani Ports and Special Economic Zone Limited
SCM Garments PVT Limited Nahar Industrial Enterprises Limited Ambuja Cement Ltd
Adani Green Energy Ltd Reliance Jio Infocomm Limited Bharti Airtel Limited
Gujarat Fluorochemicals Ltd (GFL) Dalmia Bharat Limited HCL Technologies
Havells India Limited Mahindra Susten Eastman Exports Global Clothing Pvt Ltd
JK Tyre amp Industries Ltd Marico Limited Tata Global Beverages Ltd
EPC Industries Limited Mahindra amp Mahindra Financial Services Limited YES BankSBTi companies not in CDP Sample
RE100Dalmia Bharat Ltd Infosys Ltd Mahindra Holidays amp Resorts India Ltd
Tata Motors Ltd
RE100 companies not in CDP Sample
Internal Carbon Pricing (ICP)Pricing carbon in 2020
ACC Ambuja Cements Dalmia Bharat Ltd
Dr Reddyrsquos Laboratories Godrej Consumer Products Godrej Industries
Gujarat Fluorochemicals Hero Motocorp Ltd Hindustan Zinc
63
A N N U A L R E P O R T 2 0 2 0
Infosys Limited JSW Cement Limited JSW Steel Ltd
Mahindra amp Mahindra Mindtree Ltd Shree Cement
Tata Chemicals Tata Consultancy Services Tata Consumer Products
Tata Motors Tata Steel Tech Mahindra
Ultratech Cement Wipro
Planning to price in the next two years
Adani Ports amp Special Economic Zone ARVIND Ltd GAIL
GHCL LIMITED Indian Hotels Co Ltd JK Tyres amp Industries
JSW Energy Jubilant Life Sciences Ltd Larsen amp Toubro Infotech Ltd
Mahindra amp Mahindra Financial Services Mahindra Lifespace Developers Limited Marico
NTPC Ltd Piramal Enterprises Reliance Jio Infocomm Limited
Tata Communications Tata Power Co UPL Limited
Vakrangee Softwares Ltd Vedanta Ltd YES BANK Limited
64
A N N U A L R E P O R T 2 0 2 0
About CDPCDP is a not-for-profit charity that runs the global disclosure system or investors companies cities states and regions to manage their environmental impacts by running a global environmental disclosure system Each year CDP supports thousands of companies cities states and regions to measure and manage their risks and opportunities on climate change water security and deforestation We do so at the request of their investors purchasers and city stakeholders
Over the last two decades we have created a system that has resulted in unparalleled engagement on environmental issues worldwide In 2020 Over 9600 companies reported through CDP on climate change water security and forests and over 800 cities and more than 120 states and regions disclosed their environmental impacts through CDP
CDP IndiaCDP began working in India in 2008 and was formally registered in 2012 working on disclosure and driving climate action It serves as a source of knowledge for hundreds of Indian corporations from those that are just beginning on the road to corporate environmental disclosure through to those looking to improve sustainability and make commitments to reduce environmental impact
It is the only NGO to be named in Indiarsquos INDC submission to the UNFCCC owing to its corporate environmental data repository and tracking of emissions and mitigation data from the Indian Industry CDP India also actively participated in Government of Indiarsquos Ministry of Environment Forests amp Climate Change (MoEFCC) work on future carbon market mechanisms In addition to our work on disclosure CDP India is actively engaged in other initiatives including Internal Carbon Pricing (ICP) Science-based targets (SBT) and RE100
65
A N N U A L R E P O R T 2 0 2 0
CDP ContactsFor more info contact Damandeep Singh Director CDP India damandeepsinghcdpnet infoindiacdpnet
CDP Board of Directors
Bharati Chaturvedi Founder amp Director Chintan Environmental Research and Action Group
Ramakrishnan Mukundan Managing Director amp CEO Tata Chemicals Limited
Damandeep Singh Director CDP India
Important Notice
The contents of this report may be used by anyone providing acknowledgement is given to CDP Worldwide (CDP) This does not represent a license to repackage or resell any of the data reported to CDP or the contributing authors and presented in this report If you intend to repackage or resell any of the contents of this report you need to obtain express permission from CDP before doing so
CDP India has prepared the data and analysis in this report based on responses to the CDP 2020 information request No representation or warranty (express or implied) is given by CDP India as to the accuracy or completeness of the information and opinions contained in this report You should not act upon the information contained in this publication without obtaining specific professional advice To the extent permitted by law CDP India do not accept or assume any liability responsibility or duty of care for any consequences of you or anyone else acting or refraining to act in reliance on the information contained in this report or for any decision based on it All information and views expressed herein by CDP India is based on their judgment at the time of this report and are subject to change without notice due to economic political industry and firm-specific factors Guest commentaries where included in this report reflect the views of their respective authors their inclusion is not an endorsement of them
CDP India their affiliated member firms or companies or their respective shareholders members partners principals directors officers andor employees may have a position in the securities of the companies discussed herein The securities of the companies mentioned in this document may not be eligible for sale in some states or countries nor suitable for all types of investors their value and the income they produce may fluctuate andor be adversely affected by exchange rates
lsquoCDP Worldwidersquo and lsquoCDPrsquo refer to CDP Worldwide a registered charity number 1122330 and a company limited by guarantee registered in England number 05013650
copy 2020 CDP Worldwide All rights reserved
This report is printed on recycled paper
This report is printed on CyclusPrint based on 100 recycled fibres
This report is printed on CyclusPrint based on 100 recycled fibres
Supported by Scoring partner
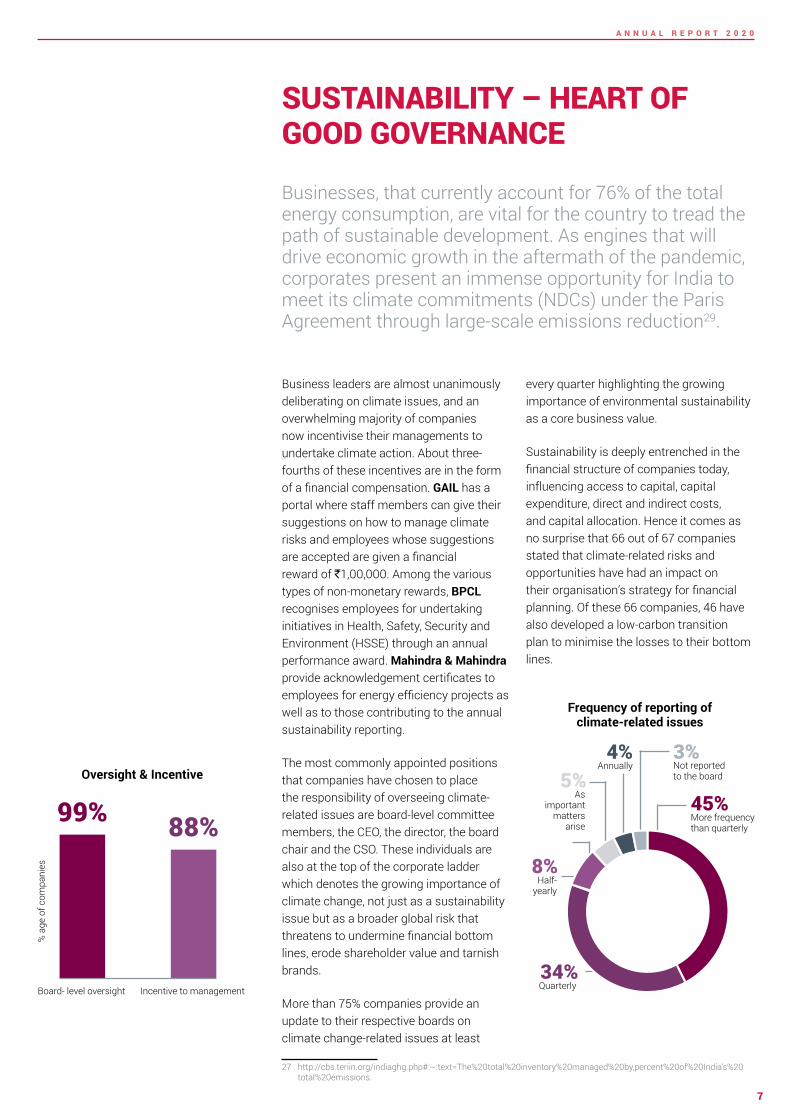
8
A N N U A L R E P O R T 2 0 2 0
Climate-related scenario analysis allows businesses to not only project future operational emissions but also mobilise necessary resources to offset the carbon footprint in their sustainability measurement approach It is especially important that the application of scenario analysis incorporates dynamic and unstable conditions under which companies are operating such as the COVID-19 pandemic that has resulted in mass layoffs economic recession and lockdowns across the world This would enable corporations to explore a broader range of uncertainties and be more resilient to external drivers of change28
The rigorous computational analysis would provide direction to enterprises on how to set emission reduction targets in line with the 20C scenario About 63 of the reporting companies use climate analysis tools such as models or scenarios enumerated
28 httpswwwfsborgwp-contentuploadsP291020-3pdf
under the Nationally Determined Contributions and International Energy Agencyrsquos 2 Degree Scenario (2DS) to inform their business strategy
Climate-based risks and opportunities have also influenced the strategy of companies in the sphere of investment in RampD Products amp Services Operations and Supply ChainValue chain Among these areas 87 companies claimed that Operations were affected and 84 reported changes in planning for Products and Services
Investmentin RampD
343
657
No
of C
ompa
nies
No Yes
Product amp Services 164
836
No Yes
No
of C
ompa
nies
Supply chain Value chain
701
298
No Yes
No
of C
ompa
nies
Operations
866
134No
of C
ompa
nies
No Yes
9
A N N U A L R E P O R T 2 0 2 0
CLIMATE-RELATED RISKS amp OPPORTUNITIESMore often than not the financial impacts of climate-related issues are not quantified and identifying them in the first place could be challenging These issues necessitate actions Increasingly investors lenders and other financial regulators are becoming more focused on ensuring that the private sector is ready to address climate risks and grab opportunities brought by changing climate
29 httpthoughtleadershipaoncomDocuments20200122-if-natcat2020pdfutm_source=cerosamputm_medium=storypageamputm_campaign=natcat20
30 httpswwwbankofenglandcouk-mediaboefilesspeech2019avoiding-the-storm-climate-change-and-the-financial-system-speech-by-sarah-breedenpdf
31 httpsreadoecd-ilibraryorgviewref=136_136201-ctwt8p7qs5amptitle=Making-the-Green-Recovery-Work-for-Jobs-Income-and-Growth_
32 https6fefcbb86e61af1b2fc4-c70d8ead6ced550b4d987d7c03fcdd1dsslcf3rackcdncomcmsreportsdocuments000005312originalAnalysis_of_CA100__Data_for_CDP_Investor_Signatories_v5pdf1596046258
33 Climate Action 100+ is an investor initiative to ensure the worldrsquos largest corporate GHG emitters take necessary action on climate change The companies include 100 lsquosystemically important emittersrsquo accounting for 23rd of annual global industrial emissions alongside more than 60 others with significant opportunity to drive the clean energy transition Read more at httpwwwclimateaction100org
Climate change has already shown substantial impacts on businesses all around the world and this is expected to continue As per a 2019 report 29 the total direct economic losses incurred due to climate-related natural disasters in 2019 were estimated at US$232 billion In India the monsoon floods in June-October 2019 caused an economic loss of US$10 billion and claimed 1750 lives Additionally the Bank of England has estimated asset losses worth US$20 trillion due to climate change if no action is taken now 30
COVID-19 has taught the world how the pandemic can actually be used as an
opportunity to better understand and mitigate climate-related
risks Investors are now more than ever more focussed on risk exposure Post-COVID-19 civil society groups governments and business are all have aligned in trying to reduce the risks to our economy and world going forward
As per an OECD report despite widespread socio-
economic suffering suffering there is an increase in public
consciousness about the risks to the natural system from anthropogenic activities31
CDP recently released a report32 on the analysis of CA100+ companies for CDP Investor Signatories Up to 118 of 122 CA100+33 companies report being exposed to substantive climate-related risks and opportunities 93 companies identified climate-related risks and 91 identified climate-related opportunities as having the potential to have a substantive financial or strategic impact on their businesses
As per CDP Indiarsquos 2020 data companies have a varied definition of what short medium and long-term means for them -- a rough average across the sample would be three years for short term five years for medium term and 15-20 years for the long term although the latter also ranges up to 100 years These time frames are important in planning risk management processes -- contextualisation of risks in terms of potential market changes and evolving technological scenarios around risk management at enterprise level
Responding companies
67Companies identified
climate related substantive risks
62Companies
identified risk typesdrivers
60Companies
identified potential financial impact
driver
60
Companies provided potential financial
impact figures
42
10
A N N U A L R E P O R T 2 0 2 0
THE RISKS OF CLIMATE CHANGE
In terms of risk types current regulation was deemed to be most relevant and always included in 97 of the organisationsrsquo climate-related risk assessments This was followed by emerging regulation and technology Interestingly findings from responses submitted by global companies corroborate this trend analysis as almost all CA100+ respondents reported policy and legal risks as potential drivers for substantive impact when it comes to transition risk34 With regular compliance checks increased stakeholder concern and sustainably evolving consumer demands climate-related risk assessment procedures can help companies become better equipped to handle longer-term uncertainties and liabilities
The number of companies that identified inherent climate-related risks with potential substantive financial or strategic impact on businesses rose to 94 from 88 in 2019 Up to 63 of reporting companies were able to get to the last mile of providing a financial impact figure to the risks identified Disclosing Indian companies put the total inherent financial impact of climate risks at `7138 billion with an average risk per company being `92 billion
Companies have also identified climate-related risks across their value chain with direct operations being the most severely affected and exposed most to acute physical risks followed by emerging regulation current regulations and chronic physical risks Companiesrsquo lsquodownstreamrsquo value chain is affected the most by market risks followed by acute physical risks Downstream value chain refers to the third parties benefiting from the outputs products and services of business activities This may be a companyrsquos customers and clients or the organisations and projects the business invests in This could possibly mean that changing customer behaviour could gravely affect a business operation if there is a shift in the demand for a comparatively low-carbon intensive product as well as greater demand for product efficiency regulations and standards providing clear evidence that there is a continuous shift towards sustainable products
CLIMATE RISKS AN OPPORTUNITY TO RESTRATEGISE
Up to 94 of reporting companies have identified climate-related opportunities as having the potential to make a substantive financial or strategic impact on businesses And 63 have provided a potential financial impact figure to the opportunities related to climate change Disclosing companies put the cost of climate-related opportunities at a total of `2787 billion The figure is a testament to the evolution of the climate change mitigation program and how organisations see this
34 https6fefcbb86e61af1b2fc4-c70d8ead6ced550b4d987d7c03fcdd1dsslcf3rackcdncomcmsreportsdocuments000005312originalAnalysis_of_CA100__Data_for_CDP_Investor_Signatories_v5pdf1596046258
No of Companies
Opp
ortu
nity
typ
es
Opportunity identified in value chain
Direct operations
Downstream
Upstream
Resource efficiency
Product and services
Energy source
Markets
Resilience
41
25 18
34 7
7
9 3
3
2
3
396
6
Risks relevant to Indian companies
Current regulation97Emerging regulations90Reputation90Market85Technology85Legal
Acute physical
Chronic physical
827973
No of Companies
Risk occuring in value chain
No of Companies
Risk
type
s
Reputation
Legal
Emerging regulation
Chronic physical
Technology
Market
Current regulation
Acute physical
Direct operations
Downstream
Upstream
5115
2
2923 4 8
17
8 14 7122 4
40 5 8
2
31
11
A N N U A L R E P O R T 2 0 2 0
Similarly most companies saw resource efficiency as a major climate-related opportunity followed by energy source and products and services in their lsquodirect operationsrsquo The main drivers behind these opportunities were use of more efficient production and distribution processes use of lower-emission sources of energy and development andor expansion of low-emission goods and services In the lsquodownstreamrsquo value chain products and services was majorly witnessed as an opportunity as there is growing consumer awareness and concern around sustainability related issues As a result companies are constantly diversifying their portfolios to address these consumer needs
Prod
uct a
nd s
ervi
ces
Ener
gy S
ourc
e
Resi
lienc
e
Resi
lienc
e
Ener
gy S
ourc
e
Reso
urce
effi
cien
cyM
arke
ts
2787identified to be the financial impact of reported climate-
related opportunities (in rupee billion)
Billion
`452
328
270
18
1719
Responding companies
67Companies
identified climate related
substantive opportunities
63Companies identified
opportunitiy typesdrivers
61
Companies identified
potential financial impact driver
60
Companies provided potential financial impact
figures
42
2041
4715
136
119
42413842
Acut
e ph
ysic
alCu
rren
t reg
ulat
ion
Emer
ging
regu
latio
n
Chro
nic
phys
ical
Repu
tatio
nO
ther
s
Lega
l
Tech
nolo
gyM
arke
t
7138identified to be the financial impact of reported climate-
related risks (in rupee billion)
Billion
`Financial impact of reported climate-related risks (in rupees billion)
Financial impact of reported climate-related opportunities (in rupees billion)
12
A N N U A L R E P O R T 2 0 2 0
Tech Mahindra Tapping into climate-related opportunities
Tech Mahindrarsquos approach towards climate change mitigation strategies is a testament to the efficacy of tapping into and realising climate-related opportunities The company has adopted Science-Based Targets to reduce its emissions and is a signatory to Business Ambition of 15 degree Celsius Tech Mahindra is committed to responsibly managing its operations through continuous improvement in sustainability practices across its value chain The company focuses on carbon emission reductions energy consumption reduction self-generation of energy from renewable energy sources and encouragement for green projects through Power Purchase Agreements The company has taken a target to increase Renewable Energy (RE) to 50 by 2025 Their sustainability report is aligned with CDSB amp Task Force on Climate-related Financial Disclosures (TCFD) frameworks
A constant focus on green energy and sustainable operations has provided a significant saving of US$27 million brought about by increasing renewable energy capacity to 1383MW leading to a saving of 28 million units of electricity adopting energy efficient practices across their facilities
Tech Mahindra has harnessed the power of disruptive next-generation technologies such as Artificial Intelligence (AI) analytics and blockchain to create solutions that ensure both its own and its customersrsquo carbon footprint reduction The company has contextualised opportunities for its customers as well by creating smart city offerings such as SMART Grid Micro-Grid-As-A-Service Intelligent Electric Vehicle Charging System (IEVCS) smart energy management smart traffic management smart lightening management smart waste management systems and command amp control centres These smart city offerings will help reduce carbon footprints across multiple smart cities globally thereby reducing carbon emissions and contributing to green and sustainable solutions It is claimed that the market size for this is expected to reach US$4639 billion by 2027
At present the risks identified by the responding companies significantly outweigh the opportunities Opportunities are slow to emerge and companies need to focus on the use of lower-emission sources of energy development andor expansion of low-emissions goods and services development of climate adaptation resilience and insurance risk solutions and use of more efficient production and distribution processes
In 2015 at the request of the G20 Finance Ministers and Central Bank Governors the Financial Stability Board (FSB) and its chair Mark Carney established the industry-led TCFD This was set up in response to increasing demands from investors lenders insurers regulators policy makers and other stakeholders in the financial markets for decision-useful climate-related information CDP has aligned its information requests with the TCFD alongside introducing a sectoral focus and adopting a forward-looking approach to climate-risk disclosure We are already going in the direction of mandatory disclosure of climate risks how they are present in a companyrsquos activities how they manage it and how resilient they are to it The UK will be the first country in the world to make TCFD-aligned disclosures fully mandatory across the economy by 2025 going beyond the lsquocomply or explain approachrsquo35
35 httpswwwgovukgovernmentnewschancellor-sets-out-ambition-for-future-of-uk-financial-services
13
A N N U A L R E P O R T 2 0 2 0
Under current policies Indiarsquos projected emissions for 2030 can achieve a rating of ldquo15degC Paris Agreement compatiblerdquo if domestic emissions peak and start reducing with international support36 This shows that India has the potential to become a world leader with enhanced 15-degree compatible targets through a swift transition from coal to renewable energy Although India was already on track to meet its NDCs pre-COVID19 it has seen an even more significant drop in emissions since the onset of the pandemic During the peak of lockdown Indiarsquos energy demand reduced by almost 30 in April 202037 ie each additional week of lockdown the annual energy demand fell by 0638 This is mostly due to the significant reduction in energy consumption and power generation via fossil fuel However the impact of the pandemic on emissions is expected to be temporary and emissions are likely to rebound in 202139 as per estimations
In comparison to the NDCs which set an overall emissions target sectoral indicators can be more reliable in making informed decisions on mapping emissions reduction targeting Paris-compatible goals40 The
36 Climate Action Tracker- Fair Share37 Carbon Brief Analysis Indiarsquos CO2 emissions fall for first time in four decades amid coronavirus38 httpswwwieaorgreportsindia-202039 Carbon Brief Global Carbon Project Coronavirus causes lsquorecord fallrsquo in fossil-fuel emissions in 2020 Dec 202040 httpswwwoecd-ilibraryorgdocserver9789264273528-4-en
pdfexpires=1607881602ampid=idampaccname=guestampchecksum=891034D10FA31A953F7924772F23966D41 httpssciencebasedtargetsorgresourceslegacy201505Sectoral-Decarbonization-Approach-Reportpdf42 IPCC Mitigation Pathways Compatible with 15degC in the Context of Sustainable Development
major challenge is how to translate global temperature goals into individual actions However various strategies can be adopted to meet the long-term goals
The Science-Based Targets Initiativersquos (SBTi) Sectoral Decarbonisation Approach (SDA) allocates the well below 2degC carbon budget to different sectors taking into account inherent differences among sectors such as how fast each sector can grow relative to economic and population growth along with its mitigation potential41 According to the Intergovernmental Panel on Climate Change (IPCC) the highest global carbon budget allocation (for the period of 2011-2050) is for the power sector (25) followed by agriculture (24) and industry [including steel aluminium chemical and paper] (14)42
EMISSIONS TRENDS AND VERIFICATION
13increase in number of
organisations reporting
27increase in emissions
reporting (Scope 1+Scope 2)
90increase in scope 3 emissions reporting
India under its NDCs pledged to reduce its emissions intensity by 33-35 by 2030 compared to the 2005 levels The Climate Action Tracker38 rates Indiarsquos NDC target as ldquo2009 Copenhagen 2degC goal compatiblerdquo indicating that its commitment is a ldquofair sharerdquo of the global effort
Scope 1 and Scope 2 Emissions reported via CDP over the years
(In Million tCO2e)
2018 2019 2020
2997
55717037
14
A N N U A L R E P O R T 2 0 2 0
In order to allocate sector-specific questions to companies CDP has developed an Activity Classification System (ACS)43 It is a framework used to classify companies under the most relevant sectors It focuses on the diverse activities from which companies derive revenue associating them with the impacts to their business from climate change water security and deforestation This approach allows a better understanding of company actions based on their environmental risk opportunity and impact CDPrsquos Climate Change questionnaire requests companies to disclose their direct and indirect emissions under different emissions categories Although India saw an overall decrease in emission in 2020 there was an increase in CDP reporting companies and hence an overall increase in emissions reporting For the year
43 https6fefcbb86e61af1b2fc4-c70d8ead6ced550b4d987d7c03fcdd1dsslcf3rackcdncomcmsguidance_docspdfs000001540originalCDP-ACS-full-list-of-classificationspdf1520244912
44 The location-based method reveals what the company is physically putting into the air and the market-based method shows emissions the company is responsible for through its purchasing decisions
2020 the companies reported 70374 MtCO2e of total [Scope 1+Scope 2 (location-based)] emissions which is a 27 increase in reported emissions from 2019 This is mostly because of the significant increase in emissions reporting from several sectors mdash electric utilities cement and other heavy sectors
Only four companies chose a Scope 2 market-based approach and 43 companies selected a scope 2 location-based approach44 The total scope 2 emissions for location-based approach amounted to 181 MtCO2e and market-based approach amounted to 414 MtCO2e It is clear from this breakdown that a range of sectors and processes contribute to global emissions Focusing on any single sector alone would be insufficient However as can be seen in the
Emissions reported in Scope 3 Categories
4949
1414
1111
1010
88
55
33
Use of sold products
Purchased goods and services
Upstream transportation and
distribution
Downstream transportation and
distribution
Fuel and energy related activities (not included
in scope 1 and 2)
End of life treatment of sold products
Others
In 2020 companies have reported MtCO2e of total (Scope 1+2 [location-based]) emissions704
Gross Emissions Data 2020 (in MtCO2e)
682
126418
Gross Scope 1 Emissions
Gross Scope 3 EmissionsGross Scope 2 Emissions (Market and
Location based)
Scope 2 Location based emissions Scope 2 Market based emissions
Metal smelting refining and forming
Financial services
Cement amp concrete
Media telecommunications amp data center services
IT amp software development
Energy utility network
Chemicals
Textiles amp fabric goods
Oil amp gas processing
Biotech and pharma
Thermal power generation
Intermodule transport amp Logistics
Bar Hotels and Restaurants
Transportation equipment
Metallic mineral mining
Others
2911712
703
688536
165 292207
144118113
093087
071063
020057
024045044
157
Scope 2 Market-based emissions Scope 2 location-based emissions
Scope 2 market-based and location-based emissions reported as per CDPrsquos Primary Activity Group classification (in MtCO2e)
15
A N N U A L R E P O R T 2 0 2 0
graph for Gross Scope 2 emissions metal smelting refining and forming sectors contribute to the maximum emissions (1712 MtCO2e) followed by financial services and cement and concrete sectors
Companies reported 1259 MtCO2e of Scope 3 emissions in 2020 a 90 increase from 2019 figures due to higher disclosure as well as more companies disclosing their Scope 3 GHG inventories Almost half of the Scope 3 emissions were reported in the following categories use of sold products (49) followed by purchased goods and services (14) upstream transportation and distribution (11) and downstream transportation and distribution (10)
The ACS sectoral analysis shows that the transportation equipment activity group has the maximum reported scope 3 emissions at 615 MtCO2e followed by metal smelting refining and forming activity group at 2332 MtCO2e and cement and concrete activity group at 989 MtCO2e
Of the responding companies 33 have reported an approximately 11 of reduction in their gross global emissions (Scope 1 and 2 combined) from 2019 and 26 companies reported an approximate 57 increase in their gross global emissions from 2019 Responding companies have identified change in boundary45 as a major reason for a 62 increase in emissions from 2019 followed by acquisitions which led to a to 30 increase Amongst all sectors the electric utilities sector accounts for 83 of total increased emission values and up to 73 of these were due to change in boundary
Amongst all sectors reduction in emissions values since 2019 were mostly caused by emissions reduction initiatives (43) followed by change in output (30) and change in emission estimation methodology (23)
45 This refers to changes in the boundary used for inventory calculation ie changing from financial control to operational control This option could also apply if organisation has incorporated facilities into its inventory that were excluded in previous years
Amongst all sectors steel saw the highest reduction (around 48) in emission values and approximately half of this was achieved only from change in emission estimation methodology through recalibrating the GHG emissions for the reporting period This is followed by cement which reported a 29 reduction in emission values from implementing emissions reduction initiatives It is also noted that more than 30 of responding companies have adopted a change in renewable energy consumption but this accounts for only 35 of total reduction in emission values
Scope 3 emissions reported as per CDPrsquos Primary Activity Group classification (in MtCO2e)
of increased emissions in 2020 attributed to Change in boundary62
32 attributed to acquisitions
Metal smelting refining and forming
Cement amp concrete
Media telecommunications amp data center services
Chemicals
IT amp software development
Food amp beverage processing
Oil amp gas processing
Biotech and pharma
Thermal power generation
Land amp property ownership amp development
Financial services
Transportation equipment
Others
6157
2332
989
796
790
632
385
158
127
073
059
039
055
Third-party verification or assurance in place for Scope 12 amp 3 emissions
3571
Scope 1
3643
Scope 2 (location-based
or market based)
2786
Scope 3
a
ge o
f com
pani
es
16
A N N U A L R E P O R T 2 0 2 0
Third-party verification is one of the significant components of emission reporting An independent verification of self-reported data provides credibility and assurance It helps companies improve their internal processes identify risks and opportunities increase the reliability of their data reduce operational costs and building a strong reputation46 When an organisation monitors and verifies its emissions it can accurately identify and understand the true proportions of emissions from its sources and this can help it realise the major opportunities for emission reduction along with cost benefits
In 2020 50 companies reported third-party verification or assurance for Scope 1 emissions 51 companies for Scope 2 emissions and 39 companies for Scope 3 emissions Compared to 2019 there is an 18 increase in companies that have verified Scope 3 GHG emissions This indicates that Indian companies are becoming increasingly aware of their emission managementaccounting Amongst all sectoral companies which opt for third-party verification of their reported emissions around 25 are from IT amp software development and financial services Cement and concrete sectors rank the lowest on the list CDP encourages companies to have verified data submitted
46 The business benefits of third party verification of climate data A CDP Guide
Building a stronger reputation via third party verification
bull Increase confidence in data for internal and external use
bull Develop and demonstrate an effective carbon reduction strategy Improve business processes
bull Reduce operational costsbull Full-fill one of the mandatory criteria for entry
to the CDP A-list by gaining full points on CDPrsquos Scope 1 and 2 verification questions
bull Provide credibility for products services and internal processes
bull Counteract claims of greenwashing
17
A N N U A L R E P O R T 2 0 2 0
DECARBONISING ACROSS VALUE CHAIN Scope 3 emissions typically arise from the supply chain and the consumers using the product It has been found that the emissions from the supply chain are 5-6 times more than the carbon footprint of a companyrsquos direct operations and hence account for lionrsquos share of an organisationrsquos overall emissions47
47 httpswwwcdpnetenarticlessupply-chainsupplier-engagement-leaderboard-201948 httpswwwbcgcomen-inpublications2020supply-chain-needs-sustainability-strategy
Walking the extra mile in terms of engaging with stakeholders especially suppliers and customers on climate issues allows an organisation to consider the whole gamut of emissions and have better control over their emissions inventory For example metal companies can improve their supply chainrsquos environmental performance through adoption of a circular economy model which leads to an increased use of recycled materials in products reduces the emissions by lowering the overall burden on the manufacturing plant to produce from scratch and creates a closed-loop system with consumers48 This yearrsquos data indicates that 88 of companies engaged with their value chain partners on climate-
related issues an improvement of 5 over 2019 There was also an increase in absolute numbers -- 59 business entities collaborated with value chain partners against 49 last year
The main forms of engagement with suppliers are compliance and onboarding followed by incentivisation and information collection Educationinformation sharing collaboration and innovation are the most common customer engagement processes
Types of engagement with suppliers
No of Companies engaging with value chain on climate-related issues
2121
22
331212
1313
44
44
Other partners in the value chain customers suppliers
Other partners in the value chain suppliers
Customers
Customers Suppliers
Suppliers
Other partners in the value chain
Other partners in the value chain customers
of companies engage with their value chain partners on climate related issues an improvement of 5 from 2019
88
26
Compliance amp onboarding
16
Engagement amp incentivisation
(changing supplier behavior)
9
Information collection
(understanding supplier behavior)
7
Innovation amp collaboration
(changing markets)
No
of C
ompa
nies
18
A N N U A L R E P O R T 2 0 2 0
Organisations are mindful of the fact that climate issues need to be dealt using a participatory approach that encompasses all partners in the value chain as well as engages other external stakeholders Companies are thus getting serious about engaging in a comprehensive dialogue on climate change as this will allow them to have inputs in shaping public policy In their attempt to influence climate policies organisations are establishing communication channels with stakeholders like policymakers trade associations and research funding organisations A positive sign emerging is that majority of the businesses are agreeing to comply with environmental legislations unconditionally Energy efficiency and clean energy generation have garnered the support of 71 and 68 of responding companies respectively Mandatory carbon reporting and increased climate resilience have also found acceptance
With the COVID-19 pandemic wreaking havoc across the world and leading to the first-ever recorded recession in India it is important that companies view this as an opportunity to build a more resilient economy one in harmony with nature and encouraging of a more inclusive environment for supplier engagement that would expedite decarbonising Engaging with the value chain offer a strategic advantage as it allows companies to take a lead on corporate sustainability and puts them in a position to set the blueprint for other businesses to follow
19
A N N U A L R E P O R T 2 0 2 0
Emission reduction targets and initiatives
Targets
In recent years accelerated climate change has forced businesses to set more ambitious climate goals and commit to advocating for a low-carbon economy Today it is considered a standard practice for businesses to report their annual emissions and undertake efforts to reduce their carbon footprint Of the 67 Indian companies responding to investor requests 57 have undertaken a total of 95 emissions reduction targets including absolute targets intensity targets and both absolute and intensity targets 24 of these were approved SBTs
The global pandemic has reinforced the need for business resilience in operations and corporate leaders have started recognising that science-based climate action goes hand-in-hand with building business success49 Companies are looking science-based targets as guiding lights with a defined pathway to future-proof growth and with impending climate change hazards more companies have doubled down on their commitments towards a low-carbon transition50 The momentum for SBTs has reached across a range of industries including cement
49 The new normal 1000 companies are now setting science-based climate targets - Science Based Targets50 httpswwwcdpnetenarticlesclimate2020-lessons-from-an-extraordinary-year
automobiles pharmaceuticals metals amp mining real estate and information technology
As more companies are striving toward commitments this year witnessed an increase in the number of approved SBTs from seven targets last year to 24 targets this year
Leading companies are moving forward by setting long-term emissions reduction targets to mitigate climate-related risks Compared to 2019 this year more targets
were set under a long-term time frame till 2030 and a lesser focus had been given on short-term targets ie till 2020 Most of the companies selected a base year of 2018 and had gone for the intensity targets Hence in upcoming years long-term targets can play a major role for companies to support their sustainability visions and their journey towards low-carbon transition Apart from these companies also reported 83 other targets which included 38 energy consumption targets 13 energy productivity targets and 11 waste management targets amongst others
TARGETS amp PERFORMANCE
More than
three times increase in the number of approved science-based targets
of the responding companies set long-term targets (ie till 2030)
50
15
Absolute target
5Both absolute and intensity
targets
37
Intensity target
10
No target
No of Companies
GHG Emission Reduction Target Types
Absolute emission targets count
Intensity emission targets count
Types of targets based on time-frame of target year
820
Till 2020
1929
Till 2021 - 2030
136
2031 and beyond
20
A N N U A L R E P O R T 2 0 2 0
Emission reduction initiatives
While the number of companies taking up Emission Reduction Initiatives (ERI) has grown from 53 to 58 the number of initiatives has declined from 293 to 287 resulting in a 13 decrease in the estimated annual CO2e savings this year
Energy efficiency in production processes and in buildings continue to account for most ERIs non-energy industrial process emission reductions have been outweighed in their CO2e saving potential
Other emission reduction initiatives such as upgrading equipment with high-efficiency alternatives and digitisation initiatives undertaken by banks accounted for the highest estimated CO2e savings In terms of the highest monetary savings energy efficiency in production processes contributed to 76 of monetary savings followed by energy-efficiency in building services
The steel sector had the highest number of initiatives for energy efficiency in production process and accounted for
of total estimated annual CO2e savings
88Monetary Savings from Emission Reduction Initiatives
Annual monetary savings (Million `) No of Initiatives
20611 1918 576 237 148Energy
efficiency in production processes
Non-energy industrial process
emissions reductions
Other initiative
Waste reduction
and material circularity
Energy efficiency in
buildings
150
63 1210
2
Emission Reduction Initiatives
6340 2772 2574 2016 1278
6310
150
122
Other initiatives
Non-energy industrial process
emissions reductions
Energy efficiency in production processes
Waste reduction
and material circularity
Energy efficiency in
buildings
No of InitiativesEstimated annual CO2e savings (MtCO2e)
21
A N N U A L R E P O R T 2 0 2 0
The rise in climate consciousness among Indian companies is evident from the growing number of those committed to the Science Based Target Initiative (SBTi) By 2020 52 companies have committed to it with a significant growth of more than 37 over last year India is now the leader from emerging economies for having the maximum number of companies committing to SBTi and globally it stands at the sixth position
Of the 52 committed companies 22 have further approved SBTs in 2020 compared to 10 in 2019 The initiative champions SBT setting as a powerful way of future-proofing companiesrsquo growth in the transition towards a low-carbon economy51 The initiativersquos overall aim is for SBT setting to become a standard business practice and for companies to play a major role in driving down global GHG emissions Embedding SBTs as a fundamental component of sustainability management practices is crucial for achieving this
The Sectoral analysis of the Indian SBTi companies highlights the number of companies that are committed to the initiative and the number of those with approved set targets across each sector
51 httpssciencebasedtargetsorgresourcesfilesSBTi-manualpdf52 httpssciencebasedtargetsorgresourceslegacy201805SBT-transport-guidance-Finalpdf
Compared to last year the automobiles and components sector is still leading with the highest commitment and targets set The automobile sector is one of the fastest growing sectors which represents 23 of all energy-related global emissions52 Decarbonisng the automobile sector is possible through disruptive technological innovation land-use planning and transport demand management modal shift and
shifting to electric mobility Companies that set ambitious SBTs can send a strong signal for local regional and national policies to increase the level of ambition and steer the transition
In 2020 28 SBTi committed companies responded to CDPrsquos Investor request to disclose to the Climate Change questionnaire The emissions profile shows that the overall Scope 1+ Scope 2 emissions of SBTi companies responding to CDP represent almost 20 of the total Scope 1+ Scope 2 emissions and 71 of the total Scope 3 emissions in the overall CDP India Investor sample
A greater share of Scope 3 emissions reported by SBTi companies indicate that there is now a greater focus on the Scope 3 GHG Inventory as the companies are planning to set SBTs in coming years As per the SBTi a complete Scope 3 screening or inventory is required for the validation of the SBTs and it is not acceptable to exclude any relevant categories
What is a lsquoScience-Based Targetrsquo
Science Based Targets are the GHG emissions reduction targets consistent with the level of decarbonisation that according to climate science is required to limit global temperature increase to 15- 2ordmC compared to pre-industrial temperature levels
Science Based Target ensures that the company is taking shorter-term action to reduce emissions at a pace that is consistent with keeping warming below 15ordm well-below 2ordm C
SCIENCE-BASED TARGETS AMBITIOUS CORPORATE CLIMATE ACTION
200
128107
74 57 52
United States of America
(USA)
United Kingdom
(UK)
Japan Sweden IndiaFrance
No of Companies
Top 5 countries with SBTi companies
22 28 303
No
of C
ompa
nies 10
22Status of SBTi Companies in India
Committed Target Set
22
A N N U A L R E P O R T 2 0 2 0
CDP India data shows that 33 companies have reported reduction in their gross global emissions (Scope 1 and 2 combined) from the previous reporting year whereas 26 companies have their gross global emissions increased for this reporting year
CDPrsquos data shows that there are 32 companies that are considering setting a SBT in the next two years compared to 29 companies in the previous reporting year There are 11 intensity and eight absolute targets that companies consider to be SBT but this has not been approved by SBTi yet
The increase in these target number highlights that there are more companies which seek to commit to SBTi and get their targets validated in the coming years
Growth in ambition
CDPrsquos five-year data shows a rise in the number of Indian companies committing to the SBTi Their reported emissions increased by 144 due to increased commitment from energy intensive companies this year which includes companies from cement and metal and mining sectors
CDP India investor responding companies
SBTi companies (28 companies respond to CDP)
Emissions Profile (MtCO2e)
6815
134
Scope 1 Scope 2
22282
Scope 3
1259896
NO of Companies
Water Transportation
Professional Services
Textiles Apparel Luxury Goods
Software and Services
Pharmaceuticals and Biotech
Mining - Metals (Iron Aluminium Other Metals)
Food Production - Agricultural Production
Electrical Equipment and Machinery
Electric Utilities and Energy Related
Commercial services and supplies
Air Freight Transportation and Logistics
Food and Beverage Processing
Electric Utilities and IPPs and Energy Traders
Construction Materials
Automobiles and Components
Consumer Products and Durables
Banks Diverse Financials and Insurance
Chemicals
Hospitality
Real Estate
Telecommunications
1
1
3
2
2
2
1
1
1
1
1
1
1
1
2
3
3
2
1
1
6
2
4
1
1
2
3
3
Sectoral Analysis of Indian SBTi companies
Committed Companies Target Set Companies
33
14
Decreased
26
12
Increased
62
Reporting for the first time
1No Change
CDP India investor responding companies
SBTi companies (28 companies respond to CDP)
Comparison of change in gross Scope 1+2 emissions from previous year for SBTi companies vis-agrave-vis CDP reporting
companies
Emission Reduction Targets Reported by Companies in 2020
3
Not SBT not anticipating setting in 2
years
24
8
Not SBT but anticipating setting
in 2 years
4 5
Yes this is SBT approved by SBTi
11 8
Yes this is SBT not approved by
SBTi
Intensity emissions reduction target
Absolute emissions reduction target
No
of c
ompa
nies
23
A N N U A L R E P O R T 2 0 2 0
We witnessed the highest number of SBTi companies responding to CDP India this year which is a 40 growth from last year This further proves that companies are becoming more responsible towards disclosing their GHG Inventory with greater transparency
The graph for the estimated annual carbon savings shows the top three emission reduction initiatives undertaken by SBTi companies reporting to CDP It is evident that over the years low carbon energy purchase and energy efficiency process have gained momentum in reducing GHG emission with an increase in the number of SBTi committed companies implementing these initiatives Maximum carbon savings of 791 MtCO2e have been reported from the cement and concrete sector The metal smelting refining amp forming sector has reported 59237 tons CO2e savings this year with a significant decrease from 70422 tons CO2e savings in the last year There has been a reduction of 443 MtCO2e of estimated annual carbon savings reported by SBTi companies in 2020 as compared to the last year
Data shared by three reporting companies that have also committed to the SBTi (Ambuja Cement Ltd ACC Limited and Ultratech Cement Limited) shows that improving energy efficiency in their production processes has led to cement being the leading sector in reducing GHG emissions
About SBTi
The Science Based Targets initiative champions science-based target setting as a powerful way of boosting companiesrsquo competitive advantage in the transition to the low-carbon economy
It is a collaboration between CDP the United Nations Global Compact (UNGC) World Resources Institute (WRI) and the World-Wide Fund for Nature (WWF) and one of the We Mean Business Coalition commitments
The initiative
bull Showcases companies that set science-based targets through case studies events and media to highlight the increased innovation reduced regulatory uncertainty strengthened investor confidence and improved profitability and competitiveness generated by science-based target setting
bull Defines and promotes best practice in science-based target setting with the support of a Technical Advisory Group
bull Offers resources workshops and guidance to reduce barriers to adoption
bull Independently assesses and approves companiesrsquo targets
Indian SBTi companies responded to CDP Climate Change Investor Program 2020
54
Increase in SBTi companies responding to CDP via 2020 climate Change Investor Disclosure Program compared to previous year
40
Increase in Scope 1+2 Emissions and
Indian SBTi Companies responding to investor request reported reduction in Gross Global emissions compared to previous year
Increase in Scope 3 Emissions covered by SBTi Companies this year as compared to 2019
14450
185
Comparison of Absolute Scope 1+2 emissions (MtCO2e) for SBTi companies reporting to CDP
Emission reported in MtCO2e SBTi companies reporting to CDP
15 16 15 18 20 28
2015 2016 2017 2018 2019 2020
Abso
lute
Sco
pe 1
+2 E
mis
sion
(MtC
O2 e
)
364
8
380
4
479
4
605
5
583
4
142
26
24
A N N U A L R E P O R T 2 0 2 0
Advantages 53
1 Reducing regulatory risks and uncertainties As the government continues to work on implementing the Paris Agreement and meeting the ambition of the country-level pledges Science Based Targets initiative can prove out to be a resilience against the upcoming regulations
2 Strengthening Investor Confidence SBTi can help in strengthening the investor confidence as the investors are highly taking interest in businessesrsquo environmental policies
53 httpssciencebasedtargetsorgblogsix-business-benefits-of-setting-science-based-targets
3 Competitive Edge Companies are getting ahead of their peers by succeeding in the low-carbon transition with increased innovation reduced uncertainty strengthened investor confidence and improved profitability
4 Brand Reputation SBT is a global Initiative which shows robustness confidence and credibility which further helps in building up the brand reputation
Estimated annual CO2e savings of SBTi companies (in lsquo000 tCO2e)
2
Develop Target
3
Submit target for validation
4
Announce Target
1
Commit
Joining Call to Action
We look forward to companies taking action by committing to develop Science-based Targets
68
Energy efficiency Processes
Low carbon energy purchase
Energy efficiency Building services
Estim
ated
ann
ual C
O2e
sav
ings
(in
000
tCO
2e)
60126
2018 2019 2020
124
5184
346
43
7911168
25
A N N U A L R E P O R T 2 0 2 0
Science Based Targets Incubator is a unique project of CDP that was launched in April 2020 with support from MacArthur Foundation amp Shakti Sustainable Energy Foundation in partnership with WWF India to provide technical support with the main objective of handholding and catapulting organisations from commitment stage to target development stage of Science Based Targets Initiative Value Proposition
1 There will be no financial implication on the company
2 Case studies of businesses with validated targets will be shared with the participating companies for peer-to-peer learning
3 Capacity Building workshops and webinars based on recent developments and various other nitty-gritty of SBTi
4 In house trainings and one-on-one meetings with companies where CDP India will explain all stages of the SBTi and provide answers to all the technical queries
26
A N N U A L R E P O R T 2 0 2 0
BUSINESS AMBITION FOR 15degC
lsquoBusiness Ambition for 15degCrsquo is an urgent call to action from a global coalition of UN agencies business and industry leaders Businesses can make a critical contribution to limit the worst impacts of climate change by setting a net-zero target in line with 15degC future57
So far over 300 companies representing more than $36 trillion in market cap have responded to the open letter from global leaders and signed the Business Ambition for 15degC commitment
bull In India 13 companies55 have already aligned and set their target with the most ambitious aim of the Paris Agreement to level global temperature rise to 15degC above preindustrial levels
bull Automobiles and Components and Real Estate are the top sectors that have approved targets aligning with 15degC Ambition
bull In India 13 companies are further committed to Business Ambition for 15degC
bull All the companies in the Real Estate sector from India have approved targets aligning with 15degC Scenario
54 httpssciencebasedtargetsorgbusiness-ambition-for-1-5c55 Mahindra Logistics Ltd Mahindra Heavy Engines Ltd White House Dr Reddys Laboratories Ltd Mahindra EPC Irrigation Limited Swaraj Engines Limited Gromax Agri Equipment
Limited Mahindra Accelo Mahindra Holidays and Resorts India Limited Mahindra Lifespaces Developers Limited Mahindra World City (Jaipur) Ltd Mahindra World City Developers Ltd and Polygenta Technologies Limited
56 httpssciencebasedtargetsorgnet-zero
Net zero a north star for climate action
According to the latest report by the IPCC to limit global warming to 15degC above pre-industrial levels and to avoid the most disastrous impacts of climate change the world must halve CO2 emissions by around 2030 and reach net-zero CO2 emissions by 2050
Companies are increasingly adopting the net-zero climate targets by recognising the importance of keeping global warming to 15degC Between July 2019 and June 2020 over 230 companies committed to reach net-zero emissions as part of the Business Ambition for 15degC campaign an urgent call-to-action for companies to set emissions reduction targets in line with a 15degC future The campaign is led by the SBTi and supported by a global coalition of UN leaders business organisations and NGOs56
27
A N N U A L R E P O R T 2 0 2 0
A carbon price is a cost applied to carbon pollution to discourage polluters Economists agree a carbon price is the single most effective tool for countries to reduce their emissions57 Corporations have been using internal carbon pricing (ICP) as a strategy to manage climate-related business risks and prepare for the transition to a low-carbon economy Carbon pricing policies create strong transparent incentives for firms to internalise the social costs of carbon emissions58 Major investors and financial regulators are calling for businesses to disclose their climate risks and their policies to mitigate emissions59 The most sought-after benefits are that a company can use ICP both as a risk management tool and as a part of its decarbonisation strategy
To see how fast carbon pricing is spreading consider Paragraph 136 of the decision text of the Paris Agreement ldquoproviding incentives for emission reduction activities including tools such as domestic policies and carbon pricingrdquo The final agreement recognised carbon pricingrsquos importance as a powerful incentive to cut emissions by companies and regional state and local governments
The IPCC special report on the impacts of global warming of 15 degC above pre-industrial levels states that an explicit carbon pricing mechanism can theoretically achieve cost-effective emission reductions Along with best practice policies a moderate carbon pricing can help reduce global CO2 emissions significantly60 Parties are encouraged to set prices consistent with Carbon Pricing Leadership Coalitionrsquos
57 What is a carbon price and why do we need one58 Energy the Environment and Technological Change59 Firms ignoring climate crisis will go bankrupt says Mark Carney60 An I P C C Special Report on the impacts of global warming of 15 C above pre-industrial levels and related global
greenhouse gas emission pathways in the context of strengthening the global response to the threat of climate change sustainable development and efforts to eradicate poverty Intergovernmental Panel on Climate Change (2018)
61 Carbon Pricing WBCSD policy paper 2019httpsdocswbcsdorg201909Carbon-Pricing-WBCSD-Policy-Paper-2019pdf WBCSD 2019
62 SHOULD EVERY COUNTRY ON EARTH COPY SWEDENrsquoS CARBON TAX63 httpswwwedienetregistrationregwall
(CPLC) high-level commission on carbon pricing which states that an explicit-price range of US$50ndash100tCO2 by 2030 will be consistent with delivering the Paris Agreement61
Carbon prices have varied widely across existing schemes Success stories such as that of Sweden which currently has the highest carbon price in the world at US$123tCO2 demonstrate that it is indeed possible to make carbon pricing work while the Swedish economy grew by 78 since the introduction of the Swedish carbon tax in 1991 carbon emissions have decreased by 2662 Other countries like The UK
(US$4229) Netherlands (US$3638tCO2) have also committed to increasing their carbon prices in the coming decade63 The worldrsquos top three emitters -- US China and India -- however have put negligible prices on carbon
As part of the lsquoBuild Back Betterrsquo strategy carbon pricing can be a valuable tool
US$123tCO2
Sweden
US$4229tCO2
UK
US$3638tCO2
Netherlands
INTERNAL CARBON PRICEndash ROBUST CLIMATE STRATEGY
28
A N N U A L R E P O R T 2 0 2 0
to guide investment decisions It can help focus on a green stimulus package to recover from the old economy which promotes a carbon-intensive future Different stimulus measures can help clean energy technologies compete with carbon-intensive alternatives and encourage more efficient energy use India is witnessing this momentum ndash a Declaration on Climate Change was signed by 24 key industry captains and Ministry of Environment Forest and Climate Change (MoEFCC) at the virtual India CEO forum on Climate Change on 5th December 2020 Shri Javadekar further said that this declaration by private sector companies voluntarily is a historic step
To guide companies in the implementation of climate-related financial disclosures the TCFD65 developed four recommendations mimicking an organisational structure Governance Strategy Risk Management and Metrics and Targets An ICP is a proposed metric through which entities can safeguard their businesses by internalising market signals The TCFD specifically lists ICP as a key metric to assess climate-related risks and opportunities in line with its strategy and risk management process By attributing a financial cost to risks associated with carbon emissions and translating them into a uniform metric financial decision-makers can integrate transition risks into their business decisions and fill the analysis gap for assets of various time horizons
64 httpnbrienvisnicinViewGeneralLatestNewsaspxId=9829ampYear=202065 httpnbrienvisnicinViewGeneralLatestNewsaspxId=9829ampYear=202066 Implementing the Recommendations of the Task Force on Climate-related Financial Disclosures The Taskforce on Climate-related Financial Disclosures June 2017
Mr Ravi S Prasad Additional Secretary spoke about a coordinating structure for implementation of Paris Agreement which will incorporate internal carbon pricing67
The MoEFCC also constituted a high-level inter-ministerial Apex Committee for Implementation of Paris Agreement (AIPA) in December 2020 under the chairmanship of the Secretary MoEFCCThe purpose of AIPA is to generate a coordinated response on climate change matters that ensures India is on track towards meeting its obligations under the Paris Agreement including its NDC
Senior officials from 14 ministries will serve as Members to AIPA who will oversee the progress in implementation of Indiarsquos NDC and receive periodic information updates to monitor review and revisit climate goals to fulfil the requirements of the Paris Agreement Another key function of AIPA would be to operate as a National Authority to regulate carbon markets in India under Article 6 of the Paris Agreement formulate guidelines for consideration of projects or activities under the article issue guidelines on carbon pricing market mechanism and other similar instruments that have a bearing on climate change and NDCs
It will take note of the contributions of the private sector as well as multi-bi-lateral agencies in the field of climate change and provide guidance for aligning their climate actions with national priorities
ICP will be a useful preparatory tool for future government climate policies
Investors are increasingly demanding comprehensive climate disclosures
It will stay and will be instituted more commonly
A robust carbon pricing system plays an important role in driving
GHG reductions
It complements climate policies for sustained and successful
emissions reductions
It helps make informed decisions and incentivies
low-cost abatement options
Business case for pricing carbon
29
A N N U A L R E P O R T 2 0 2 0
When disclosing on ICP the TCFD recommends that companies should disclose on the followingbull what assumptions are made about how carbon price(s)
would develop over time (within tax andor emissions trading frameworks)
bull geographic scope of implementationbull whether the carbon price would apply only at the mar-
gin or as a base costbull whether the price is applied to specific economic sec-
tors or across the whole economy and in what regionsbull whether a common carbon price is used (at multiple
points in time) or differentiated prices bull assumptions about scope and modality of a CO2 price
via tax or trading scheme
67 httpswwwgreentechmediacomarticlesreadeuropean-oil-majors-ready-to-scale-up-energy-transition-investment68 httpswwwgreenbizcomarticlebp-walks-away-three-us-trade-groups-over-carbon-pricing69 Convention on Biological Diversity ndash Markets for Carbon Offsets Accessible at httpswwwcbdintfinancialoffsetsg-offsetclimatecarbonpdf page 8
Earlier this year BP one of Europersquos oil supermajors announced a carbon price of US$100tonne of CO2 a giant increase from their previous price of US$4067 and walked away from three US-based oil and gas trade organisations - American Fuel and Petrochemical Manufacturers (AFPM) the Western States Petroleum Association (WSPA) and the Western Energy Alliance (WEA) over differences regarding policy positions on carbon pricing68
CDP has been asking companies to disclose their practice of using ICP since 2013 In 2020 23 of the investor responding companies have reported putting a price on carbon as compared to last yearrsquos 19 while the number of companies planning to price in the next two years reduced to 21 from 23 in 2019 After adding Supply Chain responding companies a total of 58 companies are pricing or are planning to price carbon in the next two years in 2020 a 12 increase from 2019 It was further seen that of the 23 companies that are pricing carbon in 2020 52 use a shadow price followed by implicit price
The Task Force defines an internal carbon price as ldquoan internally developed estimated cost of carbon emissionsrdquo which can be used as a planning tool to help identify revenue opportunities and risks as an incentive to drive energy efficiencies to reduce costs and to guide capital investment decisions69
52
26
4
9
44
Shadow price
Implicit price
Implicit price Internal fee
Internal fee
Offsets
Implicit price Shadow price
Types of ICP used by Indian companies
Pricing Planning to price in the next 2 years
2
25
2015
8
36
2016 2017
26
14
2018
14
32
2019
20
31
2020
2533
No
of C
ompa
nies
ICP trend in India
30
A N N U A L R E P O R T 2 0 2 0
Type of ICP Shadow price Carbon fee Implicit price Internal trading
Description Hypothetical cost of carbon emissions
A per-unit fee based on the amount of GHG the company emits (eg `700 per tCO2e)
Helps quantify the capital investments required to meet climate-related targets
Allows business units within a company to trade their allocated carbon credits based on respective emissions
Objectivesusage
The most common form of ICP is a shadow price helps organisations better understand the impacts of climate-related risks such as technological shifts or future regulations It can help a company with both risk management as well as internal strategic planning
It allows companies to model or test how a range of carbon prices affect their divisions capital investments and other planned projects It is similar to forecasting with a range of energy prices
Putting a fee on carbon helps create an actual pool of funds generating a revenue stream to help pave the way for greener projects and further RampD This prepares a company for a carbon-resilient world This tool has the ability to encourage a business to transform into an environmental leader It allows for the creation of internal funds to invest into energy efficiency or renewable energy projects in order to cut energy costs
It also builds awareness of the importance of emission reductions within different business units
An implicit price helps companies understand their initial carbon footprint and is also used as a benchmark to implement a more strategic internal price
Internal trading helps create awareness It allows companies to prepare for stringent forms such as shadow prices or internal fees
Method An additional criterion is introduced in investment analysis during the calculation of the internal rate of return (IRR)
The additional criterion is the carbon value which is incorporated into each investment decision and applied to resulting GHG emissions This carbon price is assumed the same way assumptions are made about exchange rates or commodity prices
It is implemented by voluntarily adding a cost to GHG emissions in relation to operational costs
It increases the operating expenses (OPEX)
There are short-term emissions reductions Transfers of actual funds within the company are done through two mechanisms First by offsetting GHG emissions by purchasing offset credits externally Second by providing internal financing for emission reduction projects low- carbon products amp services and RampD
The carbon fee also provides monetary incentives for pro-environment initiativesactivities
Some companies with emissions reduction or renewable energy targets calculate their lsquoimplicit carbon pricersquo by dividing the cost of abatement procurement by the tonnes of CO2e abated
Trading is driven by the allocation of a fixed number of carbon dioxide emission lsquoallowancesrsquo for individual business units with each allowance equivalent to 1 metric tCO2 If business units exceed their cap they must purchase additional allowances to offset their excess emissions
Where business units under-emit they may sell allowances Business units may also choose to invest in carbon offsets outside their own units in order to sell on the internal trading scheme72
A sectoral analysis of the data finds two high emissions intensive sectors cement and concrete followed by IT and software development An increasing number of companies from cement and IT sectors are now committing to the SBTi and moving towards aligning emissions in line with 15-degree an ICP in such cases can be effectively used as a tool for mitigating climate risks and achieving the greater goal of a SBT or a net-zero target It helps companies build their internal capacity and measure their progress
1313
2626
2222
1313
44 44
1818
Metal smelting refining amp forming
Cement amp concrete
IT amp software development
Biotech amp pharmaFood amp beverage
processing
Chemicals
Transportation equipment
31
A N N U A L R E P O R T 2 0 2 0
Below are the ICP disclosed by Indian companies in 2020
Company Price in INR (`) Price in USD ($) Type of ICP used
ACC 2541 3394 Implicit price Shadow price
Ambuja Cements 21639 3074 Implicit price
Dalmia Bharat Ltd 77334 11 Shadow price
Dr Reddyrsquos Laboratories 937 1332 Implicit price
Godrej Consumer Products Limited 750 10 Shadow price
Godrej Industries 740 10 Shadow price
Hero Motocorp Ltd private private private
Hindustan Zinc 111846 159 Implicit price
Infosys Limited 100182 1425 Implicit price
JSW Cement Limited 1566 21 Shadow price
JSW Steel Ltd 1400 20 Shadow price
Mahindra amp Mahindra 98242 1397 Internal fee
Mindtree Ltd private private private
Shree Cement private private private
Tata Chemicals 140607 20 Shadow price
Tata Consultancy Services 1131 1608 Implicit price Shadow price
Tata Consumer Products Ltd 315 448 Offsets
Tata Motors 980 14 Shadow price
Tata Steel 975 - 2720 15 -3868 Implicit price Shadow Price
Tech Mahindra 70303 10 Implicit price Internal fee
Ultratech Cement 750 1066 Shadow price
Wipro 352291 5011 Shadow price
Since these companies did not provide a conversion rate the average conversion rate for the 2019 calendar year was taken (1` = 0014224USD)
Managing climate risk with Internal Carbon Price and Science Based Targets
By integrating ICP into ambitions targets set by SBT companies can achieve greater emissions reduction SBTs empower companies to engage internal teams with a common data-driven goal and integrate their carbon reduction strategies with other business objectives70 A step that organisations can take to implement TCFD recommendations as well as achieve their SBTs is putting an internal price on carbon It is observed that having an internal carbon price can enhance an organisationrsquos competitiveness71 Several companies are already using ICP to highlight their progress towards targets and inform a business case for low-carbon investments Of the 25 companies that have disclosed to CDP in 2020 13 that committed to SBTi also have an ICP
Setting a carbon price can be a strong commitment towards driving change and action Clear goals for the ICP enable
70 Science-Based Targets How Aligning Carbon Reduction Targets With Climate Science Can Drive Business Growth SampP Dow Jones Indices 201771 httpswwwgreenbizcomarticlemanaging-climate-risk-carbon-pricing-and-science-based-targets72 CDP Handbook on Carbon Pricing73 httpswwwcdpnetenreportsdownloads491874 httpsb8f65cb373b1b7b15feb-c70d8ead6ced550b4d987d7c03fcdd1dsslcf3rackcdncomcmsreportsdocuments000002771originalCDP-Carbon-Pricing-Handbook
pdf1508927220
companies to make better decisions regarding the type and price of carbon72 A high-level commitment can provide a companyrsquos perspective and insight on how other companies have been able to adopt innovative financing practices such as ICP and carbon taxes which are spurred by setting ambitious targets in line with the SBT initiative
In January 2020 in partnership with TERI CDP India released a second handbook in ICP - Putting a Price on Carbon A Handbook for Indian Companies 20 73 a second edition to the handbook released in October 17 74The first handbook was prepared to lay out the landscape of carbon pricing and help companies understand about external and ICP along with guidance on how to approach an internal carbon price The aim of the second handbook was to further mobilise the adoption of internal carbon price by companies The handbook discusses steps to arrive at a price and use it in an organisation including details on indicative pricing levels
32
A N N U A L R E P O R T 2 0 2 0
ACC Ltd are using internal carbon price as a tool to drive and incentivise low-carbon initiatives and emissionenergy reduction projects We have observed that ICP helps ROI to look attractive and helps us make informed decisions
ACC Ltd has already committed and published their 2030 targets for specific CO2 emission reduction and use of waste derived resources (as a part of SD 2030 plan) We have also committed to SBTi and are working on setting stricter targets aligning with below 2 DS To achieve these commitments and relevant targets we believe that ICP may play an important role in prioritising our future actions and investments Going forward we also plan to use the ICP for managing risk and leveraging opportunities
mdash ACC Ltd
Steps to Setting an
internal carbon price
Make a commitment
Communicate your progress
Set the scope of the internal carbon price
Decide price level and variance
Monitoring and reporting
Define the type of ICP
01
02
03
0405
06
07
08
Map your objectives
Establish the degree of influence in business application
33
A N N U A L R E P O R T 2 0 2 0
THE RENEWABLE ENERGY THRUST In 2020 the 67 companies headquartered in India have reported a total of 291 Terra Watt hours (TWh) electricity consumption more than double the previous yearrsquos number Notably the significant increase in total electricity consumption is attributed to just one company ndash Vedanta Limited with 151 TWh of electricity consumption for its global operations
The total electricity consumption excluding Vedanta is 140 TWh 48 higher than the previous year The rise in the total reported electricity consumption is primarily due to an increase in the number of responding companies from the energy intensive sectors These 67 companies have consumed about 16 TWh renewable electricity which is 6 of the total electricity consumption reported in 2020 The share of renewable electricity is 11 without counting Vedanta in the sample This is 6 higher than the previous year
The growth in the share of renewable electricity consumption is due to multiple factors such as the increasing number of voluntary corporate GHG emission reduction targets renewable energy targets and compliance targets such as Renewable Energy Purchase Obligations (RPO) In 2020 18 companies from India have reported various types of renewable energy targets Some of these companies have taken more than one renewable energy target type These 18 companies have reported 98 TWh of electricity consumption of which 13 is from renewable energy sources The level
Type of renewable energy targets
Renewable Energy Targets
17
1 1 2Renewable Electricity
Consumption
Renewable Electricity
Production
Renewable Electricity Capacity
Renewable Energy Financing
Target
No
of C
ompa
nies
RE100 is the global corporate renewable energy initiative bringing together hundreds of large and ambitious businesses committed to 100 renewable electricity Led by the Climate Group and in partnership with CDP RE100rsquos mission is to accelerate change towards zero carbon grids at scale There are 4 companies headquartered in India that have committed to the RE100 initiative - Dalmia Bharat Ltd Infosys Ltd Mahindra Holidays amp Resorts India Ltd and Tata Motors Ltd
The RE100 membership continues to grow and diversify - with 42 of new members coming from the Asia-Pacific region in 2020 With 260+ members and gt278 TWh of electricity consumption aggregated electricity demand of RE100 members is higher than Australiarsquos The share of renewable electricity is 42 of total consumption showing strong progress towards 100 goal
Over 70 global RE100 members have operations in India ndash with gt2 TWh of electricity consumption in the country About 39 of electricity consumed in India came from renewable energy sources largely sourced through unbundled energy attribute certificates and power purchase agreements
Visit RE100org and follow RE100 on Twitter
34
A N N U A L R E P O R T 2 0 2 0
Note Some companies have reported renewable electricity consumption total instead of break-down details as per the sourcing method Data for those companies is not included in the above chart
131
17
03
01
Renewable Electricity Sourcing Methods (TWh)
Self-generation
Unbundled Energy Attribute Certificates (EACs)
Power Purchase Agreement (PPA)
Green Electricity Products
of ambition ie a share of renewable energy in the target year for most of the companies varies between 20-100 Showing the leadership in renewable electricity sourcing 3 companies75 have committed to source 100 renewable electricity across their operations and joined RE100 initiative
GHG emission reduction targets are popular among companies in India and 57 companies have reported absolute intensity or both absolute and intensity targets Among these 30 companies have committed to science-based targets Initiative and their targets are in line with climate science Six companies have dedicated scope 2 emission reduction targets Scope 2 emissions are indirect emissions from the generation of purchased energy consumed by the reporting company Companies with GHG emission reduction targets tend to source renewable energy to reduce their emissions primarily scope 2 emissions The Majority of these companies have taken exclusive renewable energy targets to support meeting their GHG emission reduction targets
Renewable energy plays an important role in the corporate value chain due to its zero-carbon intensity and ability to provide long-term energy security About 34 companies have identified opportunities related to shifting energy usage towards low-carbon energy sources across the value chain Of these 32 have identified opportunities in the direct operations followed by 6 companies in the upstream and 2 in the downstream of the value chain These companies have estimated energy related opportunities worth `317 billion mainly in the direct operations Half of these companies anticipate short time frame (1-5 years) to tap these
75 4 India headquartered companies are committed to the RE100 initiative 3 of them report to CDPrsquos climate questionnaire
opportunities Companies have not just identified energy related opportunities but implemented energy related initiatives in the reporting year across their operations About 31 companies have implemented low-carbon energy consumption or production related initiatives in the reporting year that resulted in an estimated annual carbon savings of 18 million tCO2 and `27 billion of annual monetary savings
Companies from the manufacturing and materials sectors have reported the highest volume -14 TWh of renewable electricity consumption Manufacturing sector companies are relatively performing better than companies from the materials sector in terms of the share of renewable energy in total electricity consumption There are 25 companies from these two sectors mainly energy intensive business such as cement metals and mining steel and transport original equipment manufacturers (OEMs) The aggregate electricity consumption of these companies is over 100 TWh The companies from the fossil fuel-based energy generation are not included in the following charts
A detailed breakdown shows that self-generation of renewable electricity is the most preferred sourcing option among companies followed by purchase of renewable electricity through unbundled Energy Attribute Certificates (EACs) and Power Purchase Agreement (PPA) with an onsiteoffsite generator Up to 10 companies have reported 03 TWh of total renewable electricity consumption via PPA (on-grid and off-grid) which has declined from 11 TWh of consumption reported in the previous year
35
A N N U A L R E P O R T 2 0 2 0
Materials Manufacturing Food beverage amp agriculture
Biotech health care amp pharma
OtherInfrastructureServices
3
17
6
35
3
20
12
Total Electricity Consumption (TWh) Total RE Consumption (TWh) RE
Electricity consumption by sector with Vedanta Limited included in the analysis
Electricity consumption by sector excluding Vedanta Limited
Materials Manufacturing Food beverage amp agriculture
Biotech health care amp pharma
OtherInfrastructureServices
7
17
35
20
1236
Total Electricity Consumption (TWh) Total RE Consumption (TWh) RE
TWh
TWh
36
A N N U A L R E P O R T 2 0 2 0
2737worth opportunities
identified
Billion
`
16of Renewable Electricity Consumption Reported
TWh
704of total [ Scope
1+2location-based] emissions reported
MtCO2e
7138Inherent financial
risk identified
Billion
`
25have Internal Carbon
Pricing
Companies 52Companies in India
SBTi
37
A N N U A L R E P O R T 2 0 2 0
WATER SECURITY The way out of water crisis
Five of the worldrsquos largest cities under water stress are in India with Delhi ranked second on the list76 The water crisis is more alarming than imagined ndash 600 million people in India face high-to-extreme water stress77 Indiarsquos water demand is projected to increase by two times the available supply by 2030 putting hundreds of million people at the risk of water scarcity and ultimately losing the country 6 of its GDP78 In 2019 the country witnessed the worst droughts in recorded history Over 500 million people were affected across the country and major cities such as Chennai experienced lsquozero dayrsquo scenarios wherein water literally ran out Since improvements in water security are essential for Indiarsquos development investing in water merits a sound business case
Though 80 of Indian states have legislations on water conservation and prevention of encroachment of water bodies79 poor data management absence of water pricing inefficient irrigation techniques and the lack of adequate sewage treatment curb the countryrsquos ability to manage water sustainably80 In recent times companies have become more aware of the risks of increased water consumption pollution and unstable precipitation aggravated by climate change81 A 2019 World Bank Report (Quality Unknown)82 warned of the economic health and environmental damage caused by contaminated water highlighting water quality as an ldquoinvisible crisisrdquo that is under-appreciated and underestimated It warned that poor water quality driven by industrial agricultural and urban pollution could lead to a reduction by 13rd of economic growth in some places
76 httpsocialnitigovinuploadssamplewater_index_report2pdf77 httpsnitigovinsitesdefaultfiles2019-06Final20Report20of20the20Research20Study20on2020
Composite20Water20Resources20Management20Index20for20Indian20States20conducted20by20Dalberg20Global20Development20Advisors20Pvt20Ltd_New20Delhipdf
78 httpsnitigovinsitesdefaultfiles2019-06Final20Report20of20the20Research20Study20on2020Composite20Water20Resources20Management20Index20for20Indian20States20conducted20by20Dalberg20Global20Development20Advisors20Pvt20Ltd_New20Delhipdf
79 httpsocialnitigovinuploadssamplewater_index_report2pdf80 httpswwwcdpnetenarticlescompaniesindias-looming-water-crisis-a-call-to-action-for-companies81 Think globally act locally new guidance for companies on sustainable water use - CDP82 httpsopenknowledgeworldbankorghandle109863224583 httpswwwwriorgaqueduct84 Aqueduct Country Ranking (wriorg)85 The objective of the campaign is to drive further corporate transparency around climate change deforestation and water
security by encouraging companies to respond to CDPrsquos disclosure request
Water stress in India remains a key challenge Aqueduct83 ranked India 13th in the world on high water stress score -- 412 out of 584 The private sector is vital to delivering a water secure future Companies in the food textile retail energy industrial chemicals pharmaceuticals and mining sectors account for and wield influence over 70 of the worldrsquos water use and pollution The decisions one takes about how to grow and expand can make or break onersquos ability to tackle the global water crisis
CDPs Water Security program requests companies to disclose critical information on water parameters which are crucial to the business It helps companies monitor and benchmark their performance on these critical parameters to ensure adequate water availability for their businesses Investors and customers are increasingly keen to know how companies respond and adapt to water-related risks The Non-Disclosure Campaign (NDC) is an annual CDP initiative where investors can target companies that have been requested to respond but failed to do so85 Globally for water security Indian companies achieved the highest response rate to the NDC campaign with 50 of engaged companies submitting a response on this critical issue ndash 28 times higher than their control group Responding through CDPrsquos Water Security questionnaire will help businesses understand the risks and opportunities associated with water-related issues
Reduction in Economic Growth caused by power water in some countries
13rd
Water stress by 2030-ratio of withdrawals to renewable supply
People will live in water stress area by 2030
Increase in water demand in last 100 years
WRI 2020
UNEP
UN World Waterdevelopment Report 2020
increase in Water Security investor responding companies in India
8756
1in 2
x6
38
A N N U A L R E P O R T 2 0 2 0
helping them capitalise on actions to safeguard water resources86 The number of disclosing companies increased from 15 last year to 28 companies this year an increase of approximately 87
Measuring Monitoring and Verification
Regular measuring and monitoring of water-related parameters across all operations and the entire value-chain is the first step in laying the path for efficient water management In 2020 28 companies measured a total of 268 water related parameters It was found that amongst volumetric water metrics water discharge was the most monitored accounting for 41 of all measurements Water withdrawals accounted for 29 of all measurements water consumption for 10 and water recycling and reuse accounted for 10 each Although these metrics were being continuously monitored and measured by companies a sector-wide analysis shows that significant growth in some water-intensive sectors has put pressure on the demand for industrial water The electric utilities sector for example reported an increased water demand of 771174 megalitres in 2020 which was the highest amongst all sectors Adani Power Ltd highlighted new aqusitions and increased power generation as major reasons for rise in water demand this year The chemicals sector showed the second highest rise in water demand this year -- 195832 megalitres this year
Some companies have shouldered the responsibility of having audits conducted on their reported water metrics for greater
86 httpsb8f65cb373b1b7b15feb-c70d8ead6ced550b4d987d7c03fcdd1dsslcf3rackcdncomcmsreportsdocuments000000893originalCDP-india-business-case-for-water-disclosurepdf1472051621
87 https6fefcbb86e61af1b2fc4-c70d8ead6ced550b4d987d7c03fcdd1dsslcf3rackcdncomcmsreportsdocuments000005312originalAnalysis_of_CA100__Data_for_CDP_Investor_Signatories_v5pdf1596046258
88 https6fefcbb86e61af1b2fc4-c70d8ead6ced550b4d987d7c03fcdd1dsslcf3rackcdncomcmsreportsdocuments000005312originalAnalysis_of_CA100__Data_for_CDP_Investor_Signatories_v5pdf1596046258
89 https6fefcbb86e61af1b2fc4-c70d8ead6ced550b4d987d7c03fcdd1dsslcf3rackcdncomcmsreportsdocuments000005312originalAnalysis_of_CA100__Data_for_CDP_
transparency and credibility Amongst the verification standards that were employed 26 of the responding organisations used ISAE 3000 with Tata Chemicals being the sole company to apply both ISAE 3000 and AA1000AS to meet assurance standards
In 2020 25 responding companies withdrew consumed and discharged 7933064 megalitres 1403171 megalitres and 6625032 megalitres of water respectively However in 2019 these figures stood at 217736 megalitres 860517 megalitres and 67686 megalitres respectively for 15 responding companies
WATER ASPECTSWater Consumptionndash the amount of water a company has drawn into its boundaries and has permanently removed from the local water cycle90
Of the 28 respondents three did not disclose water consumption data or were in their first year of measurement 9 increased their water consumption over the previous reporting year 12 decreased it and 4 reported no change
Water Withdrawalsndash the amount of water the company has temporarily removed from the local water cycle and returned as discharge water91
Of the 28 respondents three did not disclose water withdrawal data or were in their first year of measurement 7 reported an increase over the previous year 14 had lowered their withdrawal and 4 reported no change
Water Discharges ndash the amount of water that leaves a companys facility and if left untreated could be a source of pollution92
Of the 28 respondents three did not disclose water discharge data or were in their first year of measurement 9 reported an increase in water discharge over the previous year 6 lowered it and 10 reported no change CDPrsquos data highlights new acquisitions increased production activities and project expansions as the primary reasons for increased water demand amongst the companies
of companies measured all water aspects (withdrawals discharge and consumption) across 100 of facilities
64
of companies believe that availbility of good quality freshwater is vital for the success of their business39
2910
4110
10
Water withdrawalsWater recycledreused
Water discharge
Water consumption
Others
Measured and monitored water aspects
39
A N N U A L R E P O R T 2 0 2 0
Data further shows that brackish surface water and seawater were the primary water sources for industries followed by fresh surface water source The electric utilities sector was the most reliant on brackish surface water and seawater accounting for 72 of the sectorrsquos total water withdrawals At 59 fresh surface water was the primary source of withdrawal for the chemicals sector Of the 28 companies 13 had implemented water conservation measures to reduce water withdrawals from groundwater sources this year Water withdrawals from groundwater - renewable accounted for less than 05 of total withdrawals
In terms of water discharge most (81) was released into brackish surface water and seawater environments Discharges into fresh surface water accounted for the remaining 19 of the total discharges Our data suggests more companies are installing zero liquid discharge units and water harvesting techniques across their facilities leading to less groundwater discharge
Fresh surface water accounted for 29 of total water withdrawals by source in 2020 Indiarsquos major river basins - Ganges Brahmaputra Godavari Indus and Cauvery are the primary source of freshwater for the industries Around 15 of total freshwater demand from CDP responding companies was supplied by the
Investor_Signatories_v5pdf159604625890 Worldrsquos 18 Most Water-Stressed Rivers | World Resources Institute (wriorg)
Ganges and Brahmaputra river basins another 15 came from the Godavari basin followed by Cauvery Indus Banas and Sabarmati river basins The demand for water has increased over the years causing these basins to rank among the most water-stressed catchments in the world90 Of the 83 facilities in India 53 were in water-stressed regions Our data shows that around 60 of total responding companies withdrew water from water-stressed regions Of these nine were from the materials industry and two were from the food beverage amp agriculture industry
Governance and Business Strategy
For a long time corporate sustainability strategies have focused on measurable and manageable challenges such as product footprint efficiency in supply chain water conservation and others Businesses have begun to take stock of water security by innovating for improved efficiency measuring direct withdrawals assessing risk to neighbours and considering leakages
CDPrsquos data shows that corporate leaders across India are responding to this crisis by focusing on their water policy to monitor risks and opportunities and integrate it in their strategies Around 71 companies report having a documented water policy that is accessible to the public Up to 93 companies indicated that they have a board-level oversight of water related issues within the organisation observed either by the Chief Executive Officer (CEO) or the director on board followed by the board-level committee
Around 43 of the responding companies report on water-related issues quarterly and 33 more frequently This shows the increasing self-awareness among companies on water-related issues Further 63 of these companies offer some form of
facilities out of a total of 83 from the responding companies were in areas with water-stress53
Water discharge by destination
Brackish surface
water and Seawater
Fresh surface water
Groundwater
Third party
532
225
2
975
156
93
Water discharge (megalitersyear)
125
013
1
Brackish surface
water and Seawater
Groundwater ndash non
renewable
Groundwater ndash renewable
ProducedEntrained
water
Third party
Fresh surface water
231
800
261
04
405
21
489
Water withdrawals (megalitersyear)
Water withdrawals by destination
7564
662
6
No
of c
ampa
nies
Industry
1
Appa
rel
1
Biot
ech
hea
lth
care
amp p
harm
a
1
Man
ufac
turin
g
2Fo
od b
ever
age
amp ag
ricul
ture
1
Pow
er
gene
ratio
n
1
Tran
spor
tatio
n se
rvic
es
1
Serv
ices
9
Mat
eria
ls
Industry-wise water withdrawals from water-stressed areas
40
A N N U A L R E P O R T 2 0 2 0
incentive to their employees ndash monetary or otherwise -- for the management of water related issues
Businesses are stepping up and playing a vital role in developing water initiatives that can ease the stress on crucial watersheds Companies are also looking into water security related long-term business objectives and financial planning as a part of their overall business plans Almost 70 companies prefer short to mid-term (5-10 years) over long-term (11-30 years) planning This does not come as a surprise as water effects are felt locally and require more immediate strategic planning Of the 28 reporting companies 12 use climate-related scenario analysis to inform its water-related business strategy and eight anticipate doing so in the next two years A majority of these companies belong to the chemicals and the electric utilities sector
In 2019 about 13 companies were pricing their water this increased in 2020 to 18 and 50 are now exploring the its possibilities Companies such as Ambuja Cement (US$110 `7800
91 marico-sustainability-report-18pdf
Marico Ltd Establishing a strategy to improve water-security across operations and value chain
With a host of agro-based products water availability is a crucial parameter for Marico Ltd92 Under the risk management framework it has identified adverse impact of water scarcity as an environmental risk to the company To mitigate this environmental risk the company has initiated watershed management programs and a reduced-reuse-recycle model of water management across its operations Through a water stewardship program the company aims to address water security challenges in low rain-fed areas around its workplace and factories
In the reporting period FY 19-20 the company withdrew 202886 cubic meters of water and reported a reduction of 9 from previous year The company had reported a reduction of 31 in water intensity from the 2014 level through the company-wide introduction of water efficiency measures improvements in water recycling water-efficient taps and rainwater harvesting systems For improving water management practices across water stress areas Marico utilised the WRI aqueduct tool to evaluate water risk across all manufacturing facilities in India This tool helped the company identify the number of facilities that fall under the water stress area -- according to it five out of eight plants are in such zones The implementation of water conservation initiatives had helped three water-stressed sites reduce water consumption over the previous year Among three water-stressed sites Jalgaon reported 15 reduction in water consumption Baddi reported 16 and Paonta 28
Establishing a strategy to reduce and minimise water use was one of the companys key commitments Marico foresees its future water withdrawal levels reducing given its move towards improving water efficiency and incorporating recycling throughout the production cycle
Frequency of reporting on water-related issues
633
43
Annually
More frequently than quarterly
Quarterly
6
10 2Half-yearly
As important matters arise
Less frequently than annually
41
A N N U A L R E P O R T 2 0 2 0
to US$8240 `579800 per megalitre) Dr Reddyrsquos Laboratories (US$088`67 to US$591`449 per KL) Piramal Glass and Tata Steel use an internal price on water
Risks amp opportunities
Dwindling water supply is a major cause of concern for businesses since it poses significant direct and indirect impacts Visible risks such as droughts have a more explicit impact as they ruin vegetation and severely undermine the agriculture sector But subtle impacts present challenges to other sectors Water shortages also threaten the long-term viability of businesses by leading to higher costs eventually borne by the consumers Without proper management the economic repercussions of water scarcity will be felt in myriad ways92
In 2020 companies that experienced detrimental water-related impacts have incurred financial losses worth `1580 million Physical risks such as inadequate infrastructure and increased water stress account for more than half of these commercial losses followed by reputational-cum-market like subpar access to water sanitation and hygiene services and regulatory risks eg- failure to set mandatory water efficiency conservation and recycling standards Corporations should thus strategically prioritise dealing with these risks to safeguard their financial bottom lines For this organisations have looked to secure alternate sources of water supply adopt water efficiency and conservation practices as well as reuse and recycling of water
A 2018 report from NITI Aayog93 highlighted the fact that the country faced its worst water crisis that year Rising water challenges have put strong regulatory pressure on businesses in India with significant operational risks The private sector is a big contributor towards deepening water security issues but is also crucial in addressing it
Given the current situation with water resources it is perhaps unsurprising that many of the companies responding to CDP find themselves exposed to a plethora of physical and transition risks ndash that is risks from regulatory or consumer reforms aimed at addressing the water crisis These risks threaten their reputation and license to operate their supply chains security financial stability and their ability to grow As per CDPrsquos Global Water
92 httpsglobalriskinsightscom201612economic-cost-global-water-scarcity93 httpsnitigovinsitesdefaultfiles2019-06Final20Report20of20the20Research20Study20on2020Composite20Water20Resources20Management20Index20
for20Indian20States20conducted20by20Dalberg20Global20Development20Advisors20Pvt20Ltd_New20Delhipdf94 https6fefcbb86e61af1b2fc4-c70d8ead6ced550b4d987d7c03fcdd1dsslcf3rackcdncomcmsreportsdocuments000005165originalCDP_Global_Water_Report_2019
pdf159110644595 The term WASH refers to the provision of water sanitation and hygiene Universal affordable and sustainable access to WASH is a key public health issue within international
development and is the focus of the first two targets of Sustainable Development Goal 6 (SDG 6)96 httpswwwworldbankorgentopicwaterbriefwash-water-sanitation-hygiene-and-covid-19
Report 201994 the combined business value at risk reported in 2019 topped out at US$425 billion with about 40 of the risks anticipated to hit within the next 1-3 years Whether it was the blockading of a Newmont Goldcorp mine in Mexico or poor water quality threatening the production of Unileverrsquos Hellmannrsquos mayonnaise in the Mississippi River Basin the impacts of the global water crisis are already being felt
Water risks and risk assessment
As per the 2020 data 71 of the responding companies consider current or future water-related regulations as a risk to business followed by 57 companies that consider access to WASH95 services for employees as very relevant and always included in their water-risk assessments This shows that companies are vigilant about providing safe access to drinking water sanitation arrangements and proper hygiene at workplace The COVID-19 pandemic has highlighted the importance of WASH to human health and well-being Safely managed WASH services along with good hygiene practices can help prevent infectious diseases that kill millions each year96 In addition 50 companies reported that water used for their key commoditiesraw materials is relevant enough to be considered for their risk-assessment This was the most pertinent for chemical sector companies
of the 28 Indian responding companies undertake water-related risk assessment25
Total financial loss by reporting companies as per risk type
38
53
9
Reputation and Market Risk
Physical Risk
Regulatory Risk
1580 MILLION
In 2020 companies that experienced detrimental water-related impacts have incurred financial losses worth
1580 million
42
A N N U A L R E P O R T 2 0 2 0
It is crucial to consider stakeholders in risk assessment procedures for a comprehensive understanding of water-related risks Of the 25 companies that undertake water-related risk
97 httpswwwweforumorgreportsthe-global-risks-report-2020
assessments 68 always include employees in their internal assessment procedures by conducting training and awareness programs on water conversation initiatives communicating water-related policies etc This is followed by regulators and local communities who are relevant in water-risk assessment procedures at 61 and 54 respectively for the responding companies It is a positive sign that Indian companies are engaging with their employees and local communities and ensuring that the latter are not negatively impacted in terms of habitation health and water availability
According to The World Economic Forumrsquos Global Risk Report 202097 water crises are among the top five risks in terms of impact for the past ten consecutive years Water-related risks are substantive in the risk assessment processes and identified as a threat to companiesrsquo bottom line putting at risk a combined business value of US$425 billion according to CDP 2019 data
RegulatoryPhysical
Reputational
Risk due to company
Risk due to context
Expectedunexpected change or uncertainty in law or regulation
Water scarcity too much water water
unfit for use
Litigation product risks due to changes in
consumer behavior
Caused by inefficient operations produces and services resulting in water pollution over exploitation etc
Caused by changing environmental and social conditions like droughts
flooding etc
Relevancy of water-related risks
7157 57 50 46 46 43
11
Water-related
regulatory frameworks
Access to fully-
functioning safely
managed WASH
services for all employees
Water availability at a basincatchment
level
Implications of water on
your key commoditiesraw materials
Stakeholder conflicts
concerning water
resources at a basincatchment
level
Water quality at a basin
catchment level
Status of ecosystems and habitats
Other contextual
issues please specify
Empl
oyee
s
Regu
lato
rs
Loca
l com
mun
ities
Rive
r bas
in m
anag
emen
t au
thor
ities
Wat
er u
tiliti
es a
t a lo
cal l
evel
Stat
utor
y sp
ecia
l int
eres
t gr
oups
at a
loca
l lev
el
Inve
stor
s
Supp
liers
Oth
er w
ater
use
rs a
t a
basi
nca
tchm
ent l
evel
Oth
er
NG
Os
Cust
omer
s
No of Companies age of Companies
Relevancy of stakeholders in water-risk assessment
6861 54 50 50 46 46 39 36 32 2918
43
A N N U A L R E P O R T 2 0 2 0
Water risk event
Impacting business
Increased Operational amp maintenance Costs Increased Compliance amp
Administration Costs
Closure of Operations
Supply chain distributions
Brand Damage and LitigationsShareholder
Distributions
Risk transferRisk avoidance and mitigation
Technological Risks
Repurational amp Market Risks
Regulatory Risks
Physical Risks
Financial ImpactsResidual Water RiskInherent Water Risks
Increased water stress
143721Increased water scarcity
41105Drought
17604Inadequate infrastructure
820
Physical Risks
Ecosystem vulnerability
300Severe weather events
69Declining water quality
63Flooding
13
Regulatory Risks
Technology Risks
Higher water prices Transition to
water intensive low carbon energy sources
Tighter regulatory standards
2333
120
All the figures reported are in million rupees
44
A N N U A L R E P O R T 2 0 2 0
CDPrsquos data shows that physical risks seem to have the highest magnitude of impact on the Indian responding companies Drought is seen to be the primary driver of potential substantive impact
Where there is risk there is opportunity
Where therersquos risk therersquos reward Industrial wastewater for example is a vast untapped resource It is a potential source of heat power process water and high-value materials And there has never been a better time for this transformation to take place -- technologies are better the regulatory climate is favourable and the business case is clear Meanwhile the market demand for pollution-free products is growing For companies to thrive they will need to be aligned to changing consumer demands If
98 httpswwwmarketsandmarketscomMarket-Reportssmart-water-management-market-1265html
they respond to these opportunities then market differentiation resilience and profitability are on the table
Globally corporate leaders have started realising the untapped potential of smart water technology and the market for smart water management is anticipated to grow from US$846 billion in 2016 to US$2010 billion in 202198 Industrial wastewater has for a long time been reused for cooling towers steel works oil refineries textile manufacturing and paper production It was found that 15 of the 23 companies valued improved water efficiency in operations as their primary opportunity having a substantive financial or strategic impact on business
of the 28 responding companies (approx 93) identified water-related opportunities in their business26
Improved water efficiency in operations
Increased resilience to impacts of climate change
Reduced impact of product use on water resources
Improved community relations
Water recovery from sewage management
Resilience to future regulatory changes
Sales of new productsservices Increased brand value
3000million
`4000
million18752
million
opportunities were identified by 21 respondents
opportunities were identified by 11 respondents
opportunities were identified
by 9 respondents
opportunities were identified
by 4 respondents
Efficiency Resilience Products and services
Markets
22
14
10
4
`329
million
`
`
45
A N N U A L R E P O R T 2 0 2 0
26
17
14
17
2
Others
Recyclingreuse
Consumption
Product water intensity
Discharge
14
10Withdrawals
Water use efficiency
Categories of water targets monitored at the corporate level
of companies set company-wide water targets
of companies set company-wide water goals
5556
Businesses have identified transparency in water management issues as a fundamental activity and disclosure through CDPrsquos annual water questionnaire produces a standard comparable dataset McGill University and Millani found that companies disclosed through CDP ranked 19 percentiles better than the average business in their ability to access capital99 The research showed that a comprehensive voluntary disclosure produces a quality management team with enhanced awareness of threats and opportunities linked to climate and environmental change
Targets and Goals100
In response to declining water resources many companies have started engaging in water stewardship and setting water targets aligned with SDG Goal 6 to ensure availability and sustainable management of water sanitation and hygiene facilities for all101 Developing water-related targets helps companies make meaningful change from informed actions at the local level102 In 2020 four companies did not set water-related targets within their operations Whereas 24 companies had water-related targets 26 of them had set targets for product water intensity 17 set recyclingreuse targets and 14 focused on water use efficiency
Companies can set goals and targets on a range of operational issues to drive performance andor manage risks and opportunities CDPrsquos data shows that a majority had set targets at the company-wide level -- 55 of responding companies reported setting water targets across the company This was followed by 26 who set water targets at the business level and 19 at the site or facility level While setting water goals around 56 of companies monitored their goals at the company level 24 at the sitefacility level and the remaining at the basin business or country-level
99 Craig M Coulombe E Nostrat A 2019 The Role of CDP Disclosure to Improve Access to Capital Research Note httpsf01c8ee6-cac3-40ff-a0e4-8bfb54f2b88bfilesusrcomugd66e92b_30b06fd11b9c43d88428f768676e9a8bpdf
100 Targets ndash quantitative Goals - qualitative101 httpsunstatsunorgsdgsreport2020goal-06102 httpsceowatermandateorgsite-targets-guide
A company has various drivers for setting goals and targets and it tries to align these with increased stakeholder concerns and environmental legislation Data shows that most organisations considered reducing environmental impact and risk mitigation as the primary motivation for monitoring water goals and targets Organisations also considered brand value protection as one of the important factor while setting goals
24
4
Target Set No Target
No
of C
ompa
nies
Water targets monitored at the corporate level
46
A N N U A L R E P O R T 2 0 2 0
Drivers behind setting water targets and goals at the corporate level
Reduced environmental impact
Water stewardship
Risk mitigation
Recommended sector best practice
Corporate social responsibility
Brand value protection
Cost savings
Shared value
Climate change adaptation amp mitigation strategiess
Commitment to the UN SDG
Increase freshwater availability for users
Other drivers
45
14
14
2
2
2
5
14
16
12
161212
12
4
4
4
44
GoalsTargets
age of Companies
47
A N N U A L R E P O R T 2 0 2 0
PROTECTING OUR FOREST WEALTH
The world lost an estimated 10 million hectares of forest annually between 2015 and 2020104 Protecting and restoring forests and other natural ecosystems could provide up to 30 of climate change mitigation action needed to limit global warming to below 20C by 2030105
Global demand for agricultural commodities is the primary driver of deforestation and ecosystem conversion -- timber is extracted unsustainably and land is cleared for agricultural production This represents major risks to businesses as commodities associated with deforestation such as palm oil soy cattle and timber products are the building blocks of millions of products traded globally and therefore feature in the supply chains of numerous organisations
103 httpswwwipccchsrccl104 The State of the Worldrsquos Forests 2020 Forests biodiversity and people105 httpswwwpnasorgcontent1144411645106 httpsappsfasusdagovnewgainapiapiReportDownloadReportByFileNamefileName=Oilseeds20and20
Products20Annual_New20Delhi_India_04-01-2020
The unsustainable production and supply of these commodities and activities not only poses a significant business risk but also has a severe negative impact on the environment especially the climate crisis
Deforestation is fundamentally linked to climate change According to the IPCC Special Report on Climate Change and Land (2019)103 11 of global GHG emissions are from deforestation and from the conversion of natural ecosystems for human use
At an 8 annual growth rate edible oil consumption in India is growing faster than the 3 growth rate in production Imports and imports are rising to fill the gap As a result India still is the largest importer of edible oils followed by China European Union and the United States Indiarsquos edible oil imports in MY 202021 are predicted to rise 6 to 15 MMT of this 85 MMT will be palm oil 35 MMT soybean 28 MMT sunflower seed oil and 02 MMT rapeseed (canola) oil
-United States Department of Agriculture106
In 2020 three Indian companies responded to CDPrsquos forests questionnaire -- one responded to the request for disclosure from investors while two responded to their customers Globally 687 companies responded to CDPrsquos forests questionnaire and 57 of them evaluated deforestation-related risks at US$5312 billion
13The mitigation potential of reduced deforestation is
13 of the global emissions
We cant address climate change without protecting our forests
They are vital carbon stores that help reduce global warming
48
A N N U A L R E P O R T 2 0 2 0
Disclosure on deforestation management through CDP could be a significant opportunity for companies operating in India one of the largest importers of palm oil in the world This can help Indian companies tap into lucrative opportunities by scaling sustainable trends CDPrsquos forests questionnaire allows companies that produce source or use palm oil soy timber cattle cocoa coffee and rubber to disclose Moreover new biodiversity-focused metals amp mining and coal sector questionnaires were introduced in 2019
Palm oil is the most commonly used processed oil in industrial food production with its production being responsible for 5 of global tropical deforestation107 Indiarsquos palm oil imports account for nearly 23rd of its total imports of edible oil This demand was shaken in 2020 when the pandemic hit with a 40 fall in the consumption of palm oil during the lockdown108 Indiarsquos imports which account for nearly 20 of the global trade in palm oil will have a major effect on efforts to make its production and processing sustainable The primary barrier for sustainable palm oil consumption in
India stems from it belonging to a more price-sensitive and volume driven market making environmental impacts a low or non- existent priority in the minds of consumers
Climate change can reduce palm oil production and with demand outstripping supply prices could rise The Roundtable on Sustainable Palm Oil (RSPO) has developed a set of environmental and social criteria which companies must comply with in order to produce Certified Sustainable Palm Oil (CSPO) When properly applied these criteria can help in minimising the negative impacts of palm oil cultivation
107 Deforestation amp Palm Oil 108 As worldrsquos largest importer of palm oil India has a duty to push for ethical production practices109 httpsseaofindiacominterim-data-on-import-of-edible-oils-march-2020-down-by-32-percent-nov19-to-mar20-down-by-10-percent110 httpsappsfasusdagovnewgainapiapiReportDownloadReportByFileNamefileName=Oilseeds20and20Products20Annual_New20Delhi_India_04-01-2020111 httpsresourcetradeearthyear=2018ampexporter=76ampimporter=699ampcategory=87ampunits=value112 httpswwwrvonlsitesdefaultfiles201705poultry-sector-in-india-2017pdf113 httpsresourcetradeearthpublicationscocoa-trade-climate-change-and-deforestation
The Sustainable Palm Oil Coalition for India (I-SPOC) was formed to promote the uptake of sustainable palm oil and its derivatives in India CDP amongst others has joined it as a member
Soy cultivation is the second largest soft commodity driver of tropical deforestation after cattle products Various aspects of soy production generate GHGs that contribute to climate change India imports around 33 lakh tons of soybean oil109 According to data from the US Department of Agriculture India
is set to import 35 lakh metric ton of soybean oil in 20202021110 In addition India is also responsible for clearing huge spaces of forest land in Brazil that contributed to 23 of soybean imports to India in 2018111 Soy is also used as fodder for livestock and a growing local demand for poultry products will further affect Indiarsquos position on deforestation The country ranks amongst the top four producers of egg and chicken in the world and it is increasingly exporting to the Middle East and Europe112
Cocoa has been a notable agent of deforestation since the last century The global production of cocoa has increased from 34 million to 45 million tonnes between 2000 and 2014 while the land use footprint of its plantations rose by 37 to 257 million acres113 About 90 of
cocoa is produced by 7 countries -- Ivory Coast Ghana Indonesia Ecuador Cameroon Brazil and Nigeria The dearth of incentives for improving the plantations combine with high investment costs to make cocoa a low yield crop forcing farmers to resort to clearing untouched forest lands in order to meet the growing demand and
lsquoPalm oil consumption dropped by
in 2020 in India due to COVID-19rsquo
40
Climate-Water-Forest nexus
Water is an essential component of mitigation and adaptation strategies
Rising temperatures and changing weather patterns increase stress on water availability
Tropical forests provide substantial emission reductions by acting as carbon sinks
Droughts resulting from rising temperatures and changes in weather patterns increase the risk of forests fires
A major portion of gobal freshwater depends on forests
49
A N N U A L R E P O R T 2 0 2 0
for cutting down production costs114 In Southern India Cocoa is mainly grown as an intercrop in conjunction with coconut areca nut oil and rubber plantations Indiarsquos consumption in 2015-16 was 30000 tonnes of which 57 was imported while the domestic production rose at an annual rate of 37 in the same period115 Failure to protect forests in the event of a sharp cocoa price increase will lead to unsustainable levels of deforestation116
The US$10 billion coffee industry too leaves a gargantuan ecological footprint It is estimated that every cup of coffee consumed results in the loss of one square inch of forest cover117 Each year around 250000 acres of land is cleared for coffee which is unsustainable The Kodagu district
in the Western Ghats of India is a major biodiversity hotspot which produces about one-third of the countryrsquos coffee This region has more than 270 tree species which are all under significant ecological stress due to the coffee farms that threaten land use and land cover while potentially leading to the felling of about 21000 trees118
An estimated 8-10 of global production of low-cost timber products comes from illegal logging in forests To meet the burgeoning demand of timber produce about 25 million acres of land is converted to fast-
wood forests (timber plantations) across the world annually and this hampers the ecosystem services that nature provides us119 With the World Bank forecasting that the global market for wood is set to quadruple by 2050120 reducing timberrsquos environmental footprint is vital for the industryrsquos success In India there is no provision of a central data pool that maintains records of production and consumption of timber There is a need to address this inconsistency in reporting and data collection by forging a comprehensive strategic policy and providing institutional support121 This would ensure effective collaboration among all stakeholders that would result not only in the production of quality forest products but also a sustainable timber sector
114 httpsresourcetradeearthpublicationscocoa-trade-climate-change-and-deforestation~text=As20cocoa20tends20to20beforest20loss20over20this20time115 httpseconomictimesindiatimescomindustrycons-productsfoodalthough-indias-consumption-of-chocolate-is-steadily-growing-but-we-still-depend-on-imports-for-116 httpsnationalzoosieduscbimigratorybirdsresearchcacaorufcfm117 httpsohiostatepressbookspubsciencebiteschaptera-bitter-brew-coffee-production-deforestation-soil-erosion-and-water-contamination~text=For20every20cup20of20
coffeeinch20of20rainforest20was20destroyedamptext=Chemical20buildup20in20soils20andsoil20eroding2C20and20land20degradation118 httpswebcachegoogleusercontentcomsearchq=cacheYhaeYHVPWasJhttpswwwmdpicom1999-4907114480pdf+ampcd=6amphl=enampct=clnkampgl=in119 httpsresourcetradeearthyear=2018ampexporter=76ampimporter=699ampcategory=87ampunits=value120 httpdocuments1worldbankorgcurateden240231467291388831pdf106467-REVISED-v1-PUBLICpdf121 httpsonlinelibrarywileycomdoifull1011111477-894712094122 httpsglobalforestatlasyaleeduamazonland-usecattle-ranching123 httpsresourcetradeearthyear=2018ampimporter=699ampcategory=779ampunits=value124 httpsresourcetradeearthyear=2018ampimporter=699ampcategory=779ampunits=value125 httplargestanfordeducourses2018ph240halper1~text=Every20half20hour2C20a20cowmore20potent20than20carbon20dioxideamptext=There20is20
rampant20deforestation2C20especiallyto20make20room20for20cattle126 httpswwwinvestopediacomarticlesinvesting0929155-countries-produce-most-carbon-dioxide-co2asp127 httpwwwcwejournalorgvol9no3do-extensive-rubber-plantation-influences-local-environment-a-case-study-from-tripura-northeast-india128 httpswwwibeforgdownloadRubber_Plastics_220708pdf
Beef production remains by far the largest driver of deforestation in the worldrsquos tropical forests as forest land cleared for cattle is more than twice the combined area required for producing soy palm oil and wooden products The problem of cattle ranching
is particularly profound in the Amazon region the largest forest reserve in the world leading to 80 of present deforestation rates122 Clearing land for grazing causes irreversible habitat loss soil degradation and conflict between humans and wild animals India imports 15 and 12 of bovine leather from Turkey and Brazil respectively which poses a great threat to the forest areas of these countries123 It also jeopardises the earnings of the Indian companies manufacturing such products for its European consumers who have a high degree of sensitivity and awareness around deforestation124 In a larger context the impact of cattle stretches far beyond the realm of forests and is one of the key reasons for rising global emissions and climate change There are more than 15 billion cows on Earth with each of them capable of expelling 17 times more GHG emissions than cars in the form of methane burps a gas several times more potent than CO2 in terms of trapping heat It is therefore not surprising that cattle accounts for a colossal 18 in atmospheric carbon emissions125 To put this in perspective this surpasses emissions of the third largest CO2 emitter India which accounts for a 7 share in worldwide emissions126
Another commodity whose production has significant impact on the environment is rubber Environmentalists have warned for years that the rapid expansion of rubber plantations would come at the expense of natural forests Rubber has
not been subjected to extensive publicity in a way that palm oil soy and paper have been over the years given their impact on the environmentmdashpublicity that has led to adoption of robust sustainability criteria for these commodities Indiarsquos natural rubber plantation spans across an area of 183 million acres as of 2012 with the raw material being used as an input for making 35000 finished products of industrial importance127 Currently the impact assessment of large-scale rubber plantations on the environment is non-existent in the country a worrying sign considering Indiarsquos position as the 4th largest consumer in the world128
50
A N N U A L R E P O R T 2 0 2 0
Fossil-fuel and mineral mining accounts for 7 of global deforestation Moreover it not only presents a threat to forest cover and resource extraction but also leads to long-term impacts such as soil and water pollution infrastructure development and
increased anthropogenic activity129 While the effects of large-scale mining are easier to quantify as they are well regulated and undertake environmental impact assessments it is the scope and impact of artisanal and small-scale mining (ASM) that goes under the radar due to lack of data and a high degree of informality in the sector In India this problem warrants special attention since over 12 million people are engaged in the ASM business with women and girls from backward communities and those living below the poverty line being its primary employees130 A landscape-level approach is critical not only to identify and monitor the environmental and social impacts of individual mining projects but also to consider its interactions with other land uses as well given the crucial role forests play in balancing the ecosystem131 Indiarsquos investor requested company Hindustan Zinc Ltd was the first to disclose this year under the mining sector
129 httpsglobalforestatlasyaleeduland-usemining-extraction130 httpswwwpactworldorgstate20of20asm131 httpswwwresearchgatenetpublication38084575_Landscape_approach_for_quantifying_land_use_land_cover_change_1972-2006_and_habitat_diversity_in_a_mining_area_in_
Central_India_Bokaro_Jharkhand
Hindustan Zinc Pioneering forest and biodiversity conservation in the mining sectorHindustan Zinc Limited is the first investor-requested company in India to respond to CDPrsquos Forests questionnaire It demonstrated that a dedicated Biodiversity Policy and Management Standard is its compass in reducing flora and fauna disruption and in minimising or compensating its impact of operation through project scoping site closure and beyond
Companies in India currently lag behind their regional peers in terms of disclosure on deforestation management with only 3 companies disclosing on this topic in 2020
40
65
22
3China Japan IndiaSEA
(Indonesia Malaysia
Phillipines Singapore Vietnam)
Total no of companies disclosing through CDPs Forests questionnaire in 2020 by HQ countryregion
51
A N N U A L R E P O R T 2 0 2 0
Nagpur
Udaipur
Panaji
Kochi
Rajkot
Vadodara
Delhi
Dehradun
Ahmedabad
Thane
Chennai
Tiruchirappalli Coimbatore
Bangalore
Kolkata
Gangtok
Siliguri
India Snapshot
CITIES STATES AND REGIONS
Cities
In 2020 over 800 cities disclosed their environmental information through CDP including 16 Indian cities The number of cities in India disclosing through the CDP-ICLEI Unified Reporting System increased from 13 in 2019 to 17 This was largely due to citiesrsquo ongoing commitments to climate leadership initiatives such as the C40 Cities Climate Leadership Group (C40) the Global Covenant of Mayors for Climate and Energy (GCoM) and our partnership with ICLEI whose South Asia Regional Office also acts as the GCoM South Asia Helpdesk
88 global cities reached CDPrsquos A list which include Bristol (UK) Miami (USA) Cape Town (South Africa) Buenos Aires (Argentina) and Auckland (New Zealand)
despite the COVID-19 pandemic The USA accounts for the highest number
(25) of cities on the A List making up 28 despite the US pulling out of
the Paris Agreement In India more than half the cities in disclosed
that
they either have sustainability targets incorporated into the master planning of the city or it is in progress while only 43 of the cities have a published plan that addresses climate change adaptation Approximately half of the disclosing Indian cities have identified opportunities as a result of addressing climate change and one-third of them have a GHG emission reduction target which is a strong indication towards a low carbon development pathway
States and Regions
In 2020 the Union Territories of Delhi and Jammu amp Kashmir along with over 120 states and regions from across the world disclosed their environmental impacts through CDP Globally 90 of states and regions reporting a 2030 target have one in line with the IPCCrsquos goal to reduce global greenhouse gas emissions by 40-50 from 2010 levels by 2030 and 55 of states and regions with a 2030 emissions reduction
target are showing greater ambition than their national
counterparts
Indian cities and 16
Indian states disclosed to CDP
2
52
A N N U A L R E P O R T 2 0 2 0
ANNEXURESAppendix I Table of emissions scores and sector by company
Sector Company Name 2020 permission Status
Final score 2020
Scope 1 Scope 2 Scope 3 Number of categories reported in Scope 3
Bars hotels amp restaurants
Indian Hotels Co Ltd
public C 50610 239568 23824 3
Biotech amp pharma Biocon public C 41948 133110 Not Provided
Dr Reddyrsquos Laboratories
public B 247317 154836 1272548 8
ZCL Chemicals public D- Not Provided Not Provided Not Provided
Cement amp concrete ACC public B 16966585 643870 648068 3
Ambuja Cements public B 14523738 551219 1973622 7
Dalmia Bharat Ltd
public B 11280051 537968 1320736048 9
JK Cement non public D Private Private Private Private
JSW Cement Limited
public B- 1398609 647870 572488 4
Shree Cement non public C Private Private Private Private
Ultratech Cement
public B 47954830 1327185 5376354 4
Chemicals Aarav Frances amp Flavors Private
Limited
public Not Scored
GHCL LIMITED public D 109470536 496707 Not Provided
Godrej Industries public B 32311 44361 6735893 3
Gujarat Fluorochemicals
non public C Private Private Private Private
Jubilant Life Sciences Ltd
non public C Private Private Private Private
Kansai Nerolac Paints Limited
non public Not Scored Private Private Private Private
Tata Chemicals public B 444988061 4505956 12162395 5
UPL Limited non public Private Private Private Private Private
Godrej Consumer
Products Limited
public A- 33980 30848 26433 2
Note Due to increase in sample size more samples were considered for this report These samples include companies from the BSE Top 200 list CDPrsquos Fixed Income sample FAIRR sample Emerging markets sample Environmental sample and Continuity climate change sampleFor further details visit https6fefcbb86e61af1b2fc4-c70d8ead6ced550b4d987d7c03fcdd1dsslcf3rackcdncomcomfycmsfilesfiles000003423originalCDP_Climate_Change_Sample_Investor_Request_2020pdfNot Scored- Companies who have submitted the minimum version questionnaire
53
A N N U A L R E P O R T 2 0 2 0
Sector Company Name 2020 permission Status
Final score 2020
Scope 1 Scope 2 Scope 3 Number of categories reported in Scope 3
Energy utility networks
Adani Transmission
Ltd
public D 31870076 21155 9379637 3
GAIL public C 4925087 387358 1071 1
Financial services Axis Bank public B 6250 168043 4414712 3
HDFC Bank Ltd public B 764919 390176 1642453 3
Indusind Bank public A 88316 6278567 1277912 3
Kotak Mahindra Bank
public C 9078 69780 4290177 3
LampT Finance Holdings Limited
non public Private Private Private Private Private
State Bank of India
public B- 390 1066386 257902 5
YES BANK Limited
public A- 344515 3099369 4859625 3
Agricultural commodities
Tata Consumer Products Ltd
public A- 11731 34238 3348672939 10
Marico public A- 1380 12140 499568 9
Intermodal transport amp logistics
Adani Ports amp Special
Economic Zone
public B- 95905791 176946845 202567171 3
IT amp software development
HCL Technologies
non public Private Private Private Private Private
Infosys Limited public A- 15344 124063 371602 6
Larsen amp Toubro Infotech Ltd
public B 39485 2521874 1908034 2
Mindtree Ltd non public A- Private Private Private Private
Tata Consultancy
Services
public A- 26714 811815 702615 7
Tech Mahindra public A 1803807 105736586 39285212 5
Wipro public A- 13366 124564 421527 7
Land amp property ownership amp development
Godrej Properties Limited
public Not Scored 4400 2429 422
Mahindra Lifespace
Developers Limited
public B 397 2675 589525 8
Light manufacturing APOLLO TYRES LTD
public Not Scored 24207 60717 Not Provided
JK Tyres amp Industries
public C 158568 88424 Not Provided
54
A N N U A L R E P O R T 2 0 2 0
Sector Company Name 2020 permission Status
Final score 2020
Scope 1 Scope 2 Scope 3 Number of categories reported in Scope 3
Media telecommunications amp data center services
Bharti Airtel non public D Private Private Private Private
Reliance Jio Infocomm
Limited
public B 105018 1826762 243195034 3
Tata Communications
public A- 6376 108482 6938 3
Metal smelting refining amp forming
Hindustan Zinc public A 4480887 253756 4182181 10
Vedanta Ltd public B- 57482869 1864711 Not Provided
JSW Steel Ltd public A- 40045307 476901 4168823 8
Tata Steel public A- 60116322 5687999 14970000 12
Metallic mineral mining
NMDC public D 29004 63671 1957 1
Oil amp gas processing Bharat Petroleum
Corporation
public B 5023580 366230 729820 2
Indian Oil Corporation
public D 18690000 54700 Not Provided
Renewable power generation
Adani Green Energy
public D 841 13313 1174 1
Azure Power public Private 323 2767
Specialized professional services
Mahindra amp Mahindra Financial Services
public B 3370 18847 22922 3
Piramal Enterprises
public C 4430568 8692844 Not Provided
Vakrangee Softwares Ltd
public B 2053355 35409 Not Provided
Textiles amp fabric goods
ARVIND Ltd public B- 3514561 238894 Not Provided
Thermal power generation
Adani Power Ltd public D 58970705 14607 6910800 1
JSW Energy public B 17200521 36117 61151 2
NTPC Ltd public D 252495018 15845 978052 3
Tata Power Co public C 34952981 22051 1226 1
Tobacco ITC Limited public B- 1241718 230192 206064 5
Transportation equipment
Hero Motocorp Ltd
non public D Private Private Private Private
Mahindra amp Mahindra
public A 40654 414552 58425531 11
Tata Motors public A- 60533 266200 3140861 8
55
A N N U A L R E P O R T 2 0 2 0
Climate Change ndash Investor requested companies132
CDP Activity Group Company name Response Status
Air transport InterGlobe Aviation Ltd Not submitted
Jet Airways (India) Ltd Not submitted
Apparel design Page Industries Ltd Not submitted
Bars hotels amp restaurants
Indian Hotels Co Ltd Submitted
Jubilant Foodworks Ltd Not submitted
Biotech amp pharma Abbott India Ltd See Another
Ajanta Pharma Ltd Not submitted
Alkem Laboratories Ltd Not submitted
Aurobindo Pharma Not submitted
Biocon Submitted
Cadila Healthcare Not submitted
Cipla Not submitted
Divirsquos Laboratories Not submitted
Dr Reddyrsquos Laboratories
Submitted
Glenmark Pharmaceuticals
Not submitted
Lupin Not submitted
Natco Pharma Ltd Not submitted
Pfizer Ltd See Another
Sun Pharma Advanced Research Company Ltd
Not submitted
Sun Pharmaceutical Industries
Not submitted
Torrent Pharmaceuticals
Not submitted
Cement amp concrete ACC Submitted
Ambuja Cements Submitted
Dalmia Bharat Ltd Submitted
India Cements Not submitted
JK Cement Ltd Submitted
Orient Cement Limited Not submitted
Shree Cement Submitted
The Ramco Cements Ltd
Not submitted
Ultratech Cement Submitted
132 These include companies from the BSE Top 200 list CDPrsquos Fixed Income sample FAIRR sample Emerging markets sample Environmental sample and Continuity climate change sample For further details visit https6fefcbb86e61af1b2fc4-c70d8ead6ced550b4d987d7c03fcdd1dsslcf3rackcdncomcomfycmsfilesfiles000003423originalCDP_Climate_Change_Sample_Investor_Request_2020pdf
See Another -The response is covered by another CDP reporting company usually the parent company
CDP Activity Group Company name Response Status
Chemicals Asian Paints Not submitted
Berger Paints India Ltd Not submitted
Castrol India Not submitted
Colgate Palmolive India See Another
Coromandel International
Not submitted
Dabur India Not submitted
Emami Ltd Not submitted
Godrej Consumer Products Limited
Submitted
Godrej Industries Submitted
GRAPHITE INDIA LTD Not submitted
HEG LTD Not submitted
Jubilant Life Sciences Ltd
Submitted
Kansai Nerolac Paints Limited
Submitted
PI Industries Ltd Not submitted
Pidilite Industries Ltd Not submitted
Procter amp Gamble Hygiene amp Health Care Ltd
See Another
SRF Ltd Not submitted
Supreme Industries Ltd Not submitted
Tata Chemicals Submitted
UPL Limited Submitted
Coal mining Adani Enterprises Not submitted
Coal India Not submitted
Gujarat Mineral Devp Corpn
Not submitted
Commercial amp consumer services
Quess Corp Ltd Not submitted
Construction Bharti Infratel Limited Not submitted
GVK Power amp Infrastructure
Not submitted
Honeywell Automation India Ltd
See Another
Larsen amp Toubro Not submitted
Voltas Not submitted
Appendix II List of companies invited to respond to CDP
56
A N N U A L R E P O R T 2 0 2 0
CDP Activity Group Company name Response Status
Financial services Gruh Finance Ltd Not submitted
HDFC Asset Management
Not submitted
HDFC Bank Ltd Submitted
HDFC Life Insurance Company Ltd
Not submitted
Housing Development Finance Corporation
Not submitted
ICICI Bank Limited Not submitted
ICICI Lombard General Insurance Company Ltd
Not submitted
ICICI Prudential Life Insurance Company Ltd
Not submitted
IDBI Bank Ltd Not submitted
IDFC First Bank Ltd Not submitted
Indiabulls Housing Finance Ltd
Not submitted
Indiabulls Ventures Ltd Not submitted
Indian Bank Not submitted
Indusind Bank Submitted
Kotak Mahindra Bank Submitted
LampT Finance Holdings Limited
Submitted
LIC Housing Finance Not submitted
Max Financial Services Not submitted
Motilal Oswal Financial Services Ltd
Not submitted
Muthoot Finance Limited
Not submitted
PNB Housing Finance Ltd
Not submitted
Power Finance Corporation
Not submitted
Punjab National Bank Not submitted
RBL Bank Ltd Not submitted
REC Ltd Not submitted
Reliance Nippon Life Asset Management Ltd
Not submitted
SBI Life Insurance Company Ltd
Not submitted
Shriram Transport Finance Co
Not submitted
State Bank of India Submitted
Union Bank of India Not submitted
YES BANK Limited Submitted
CDP Activity Group Company name Response Status
Convenience retail Avenue Supermarts Ltd Not submitted
Discretionary retail Aditya Birla Fashion and Retail Ltd
Not submitted
Future Retail Ltd Not submitted
Electrical amp electronic equipment
Amara Raja Batteries Ltd
Not submitted
Bharat Electronics Not submitted
Crompton Greaves Consumer Electricals Ltd
Not submitted
Exide Industries Not submitted
Havells India Not submitted
Motherson Sumi Systems
Not submitted
Whirlpool of India Ltd See Another
Energy utility networks
Adani Gas Ltd Not submitted
Adani Transmission Ltd Submitted
CESC Ltd Not submitted
GAIL Submitted
Indraprastha Gas Ltd Not submitted
Power Grid Corpn of India
Not submitted
Reliance Infrastructure Not submitted
Torrent Power Not submitted
Financial services AU Small Finance Bank Ltd
Not submitted
Axis Bank Submitted
Bajaj Finance Limited Not submitted
Bajaj Finserv Not submitted
Bajaj Holdings amp Invst (BHIL)
Not submitted
Bandhan Bank Not submitted
Bank of Baroda Not submitted
Bank of India Not submitted
Canara Bank Not submitted
Cholamandalam Investment and Finance Co Ltd
Not submitted
Cholamandalam Investment and Finance Company Ltd
Not submitted
City Union Bank Ltd Not submitted
Edelweiss Financial Services Ltd
Not submitted
Federal Bank Not submitted
General Insurance Corporation of India
Not submitted
57
A N N U A L R E P O R T 2 0 2 0
CDP Activity Group Company name Response Status
Food amp beverage processing
Britannia Industries Not submitted
Marico Submitted
Tata Consumer Products
Submitted
United Breweries Not submitted
United Spirits Not submitted
Varun Beverages Ltd Not submitted
Venkys India Ltd Not submitted
Health care provision Apollo Hospitals Enterprises
Not submitted
Industrial support services
GMR Infrastructure Limited
Not submitted
Intermodal transport amp logistics
Adani Ports amp Special Economic Zone
Submitted
Container Corporation of India
Not submitted
IT amp software development
HCL Technologies Submitted
Infosys Limited Submitted
Larsen amp Toubro Infotech Ltd
Submitted
Mindtree Ltd Submitted
MphasiS Not submitted
Oracle Financial Services
See Another
Tata Consultancy Services
Submitted
Tech Mahindra Submitted
Wipro Submitted
WNS Holdings ADR Not submitted
Land amp property ownership amp development
DLF Not submitted
Godrej Properties Limited
Submitted
Housing Development amp Infrastructure
Not submitted
Oberoi Realty Not submitted
Leisure amp home manufacturing
Rajesh Exports Ltd Not submitted
Titan Company Limited Not submitted
Light manufacturing 3M India Ltd Not submitted
APOLLO TYRES LTD Submitted
Balkrishna Industries Ltd
Not submitted
Ceat Ltd Not submitted
MRF LTD Not submitted
CDP Activity Group Company name Response Status
Media telecommunications amp data center services
Bharti Airtel Submitted
Reliance Communications
Not submitted
Sun TV Network Not submitted
Tata Communications Submitted
Vodafone Idea Ltd Not submitted
Zee Entertainment Enterprises
Not submitted
Metal products manufacturing
AIA Engineering Ltd Not submitted
Bosch Ltd See Another
Endurance Technologies Ltd
Not submitted
Gillette India Not submitted
Metal smelting refining amp forming
Bharat Forge Ltd Not submitted
Essar Steel Limited Not submitted
Hindalco Industries Not submitted
Hindustan Zinc Submitted
Jindal Stainless Ltd Not submitted
Jindal Steel amp Power Not submitted
JSW Steel Ltd Submitted
Steel Authority of India Not submitted
Tata Metaliks Ltd Not submitted
Tata Steel Submitted
Vedanta Ltd Submitted
Metallic mineral mining
National Aluminium Co Not submitted
NMDC Submitted
Oil amp gas extraction amp production
Oil India Ltd Not submitted
Petronet LNG Not submitted
Oil amp gas processing Bharat Petroleum Corporation
Submitted
Hindustan Petroleum Corporation
Not submitted
Indian Oil Corporation Submitted
Mangalore Refinery and Petrochemicals
Not submitted
Nayara Energy Limited Not submitted
Oil amp Natural Gas Corporation
Not submitted
Reliance Industries Not submitted
Oil amp gas storage amp transportation
Gujarat State Petronet Not submitted
Other materials Astral Poly Technik Ltd Not submitted
Powered machinery Bharat Heavy Electricals
Not submitted
Cummins India See Another
58
A N N U A L R E P O R T 2 0 2 0
CDP Activity Group Company name Response Status
Renewable power generation
Adani Green Energy Submitted
Azure Power Submitted
National Hydroelectric Power Corporation Ltd (NHPC)
Not submitted
ReNew Power Private Limited
Not submitted
SJVN Ltd Not submitted
Specialized professional services
LampT Technology Services Ltd
Not submitted
Mahindra amp Mahindra Financial Services
Submitted
NBCC Ltd Not submitted
Piramal Enterprises Submitted
Vakrangee Softwares Ltd
Submitted
Textiles amp fabric goods
ARVIND Ltd Submitted
Birla CelluloseGrasim Industries
Not submitted
Chennai Petroleum Corporation
Not submitted
Thermal power generation
Adani Power Ltd Submitted
Aditya Birla Capital Not submitted
JSW Energy Submitted
KSK Energy Ventures Limited
Not submitted
NLC India Ltd Not submitted
NTPC Ltd Submitted
Reliance Power Not submitted
Tata Power Co Submitted
Tobacco ITC Limited Submitted
Transportation equipment
Ashok Leyland Not submitted
Bajaj Auto Not submitted
Eicher Motors Ltd Not submitted
Hero Motocorp Ltd Submitted
Mahindra amp Mahindra Submitted
Maruti Suzuki India Not submitted
Tata Motors Submitted
TVS Motor Company Ltd
Not submitted
Web amp marketing services
Info Edge (India) Ltd Not submitted
Wood amp paper materials
Century Textiles amp Industries
Not submitted
59
A N N U A L R E P O R T 2 0 2 0
Climate Change ndash Self Selected companies
CDP Activity Group Company name Response Status
Chemicals AARAV FRANCES amp FLAVORS PRIVATE LIMITED Submitted
GHCL LIMITED Submitted
Gujarat Fluorochemicals Submitted
Light manufacturing JK Tyres amp Industries Submitted
Cement amp concrete JSW Cement Limited Submitted
Land amp property ownership amp development Mahindra Lifespace Developers Limited Submitted
Media telecommunications amp data center services
Reliance Jio Infocomm Limited Submitted
Biotech amp pharma ZCL Chemicals Submitted
Water Security ndash Investor requested companies133
CDP Activity Group Name Response Status
Bars hotels amp restaurants Indian Hotels Co Ltd Submitted
Biotech amp pharma Ajanta Pharma Ltd Not submitted
Alkem Laboratories Ltd Not submitted
Aurobindo Pharma Not submitted
Biocon Not submitted
Cadila Healthcare Not submitted
Cipla Not submitted
Divirsquos Laboratories Not submitted
Dr Reddyrsquos Laboratories Submitted
Glenmark Pharmaceuticals Not submitted
Lupin Not submitted
Natco Pharma Ltd Not submitted
Sun Pharmaceutical Industries Not submitted
Torrent Pharmaceuticals Not submitted
ZCL Chemicals Submitted
Cement amp concrete ACC Not submitted
Ambuja Cements Submitted
Dalmia Bharat Ltd Not submitted
Shree Cement Not submitted
The Ramco Cements Ltd Not submitted
Ultratech Cement Submitted
Chemicals Asian Paints Not submitted
Berger Paints India Ltd Not submitted
Castrol India Not submitted
Coromandel International Not submitted
Dabur India Submitted
Emami Ltd Not submitted
Godrej Consumer Products Limited Submitted
Godrej Industries Submitted
Jubilant Life Sciences Ltd Submitted
Kansai Nerolac Paints Limited Submitted
Pidilite Industries Ltd Not submitted
Procter amp Gamble Hygiene amp Health Care Ltd Not submitted
SRF Ltd Not submitted
Supreme Industries Ltd Not submitted
Tata Chemicals Submitted
133 These include companies from the Water Global sample and Continuity water security sample For further details visit https6fefcbb86e61af1b2fc4-c70d8ead6ced550b4d987d7c03fcdd1dsslcf3rackcdncomcomfycmsfilesfiles000003422originalCDP_Water_Security_Sample_Investor_Request_2020pdf
60
A N N U A L R E P O R T 2 0 2 0
CDP Activity Group Name Response Status
UPL Limited Submitted
VVF Ltd Not submitted
Coal mining Adani Enterprises Not submitted
Coal India Not submitted
Construction Larsen amp Toubro Not submitted
Discretionary retail Aditya Birla Fashion and Retail Ltd Not submitted
Electrical amp electronic equipment Amara Raja Batteries Ltd Not submitted
Exide Industries Not submitted
Havells India Not submitted
Energy utility networks GAIL Not submitted
Power Grid Corpn of India Not submitted
Food amp beverage processing Marico Submitted
Tata Consumer Products Ltd Submitted
IT amp software development Tech Mahindra Submitted
Light manufacturing APOLLO TYRES LTD Not submitted
JK Tyres amp Industries Submitted
MRF LTD Not submitted
Media telecommunications amp data center services
Tata Communications Not submitted
Metal smelting refining amp forming Bharat Forge Ltd Not submitted
Hindalco Industries Not submitted
Hindustan Zinc Submitted
Jindal Steel amp Power Not submitted
JSW Steel Ltd Not submitted
Tata Steel Submitted
Metallic mineral mining National Aluminium Co Not submitted
NMDC Not submitted
Oil amp gas extraction amp production Oil India Ltd Not submitted
Petronet LNG Not submitted
Oil amp gas processing Bharat Petroleum Corporation Not submitted
Hindustan Petroleum Corporation Not submitted
Indian Oil Corporation Not submitted
Oil amp Natural Gas Corporation Not submitted
Reliance Industries Not submitted
Oil amp gas storage amp transportation Gujarat State Petronet Not submitted
Specialized professional services Piramal Enterprises Submitted
Textiles amp fabric goods ARVIND Ltd Submitted
Birla CelluloseGrasim Industries Not submitted
Thermal power generation Adani Power Ltd Submitted
JSW Energy Not submitted
NTPC Ltd Submitted
Tata Power Co Submitted
Tobacco ITC Limited Submitted
Transportation equipment Ashok Leyland Not submitted
Bajaj Auto Not submitted
Hero Motocorp Ltd Not submitted
Mahindra amp Mahindra Submitted
Maruti Suzuki India Not submitted
Tata Motors Not submitted
61
A N N U A L R E P O R T 2 0 2 0
Water Security ndash Self Selected companies
CDP Activity Group Name Response Status
Chemicals AARAV FRANCES amp FLAVORS PRIVATE LIMITED Submitted
Transportation services Adani Ports amp Special Economic Zones Submitted
Other materials Piramal Glass Submitted
62
A N N U A L R E P O R T 2 0 2 0
Appendix III - Indian Companies Committed to ActionScience-based Target initiative (SBTi)Approved 15degC
Mahindra Heavy Engines Ltd Mahindra EPC Irrigation Limited White House
Dr Reddys Laboratories Ltd Swaraj Engines Limited Gromax Agri Equipment Limited
Mahindra Accelo Mahindra Holidays and Resorts India Limited Mahindra Lifespaces Developers Limited
Mahindra Lifespaces Developers Limited Mahindra World City (Jaipur) Ltd Mahindra World City Developers Ltd
Polygenta Technologies Limited
Approved well-below 2degC
Tata Chemicals Limited Mahindra amp Mahindra Limited Wipro
Mahindra First Choice Services Ltd Mahindra Electric Mobility Ltd
Approved 2degC
Hindustan Zinc Limited Mahindra Sanyo Special Steel Shree Cement Ltd
Tech Mahindra
SBTi Committed
Infosys Limited UPL Limited JSW Energy Limited
Godrej Agrovet Limited Godrej Consumer Products Limited Godrej Industries
Godrej Properties Limited Godrej amp Boyce Mfg Co Ltd Ultratech Cement Limited
Vakrangee Limited ACC Limited Adani Ports and Special Economic Zone Limited
SCM Garments PVT Limited Nahar Industrial Enterprises Limited Ambuja Cement Ltd
Adani Green Energy Ltd Reliance Jio Infocomm Limited Bharti Airtel Limited
Gujarat Fluorochemicals Ltd (GFL) Dalmia Bharat Limited HCL Technologies
Havells India Limited Mahindra Susten Eastman Exports Global Clothing Pvt Ltd
JK Tyre amp Industries Ltd Marico Limited Tata Global Beverages Ltd
EPC Industries Limited Mahindra amp Mahindra Financial Services Limited YES BankSBTi companies not in CDP Sample
RE100Dalmia Bharat Ltd Infosys Ltd Mahindra Holidays amp Resorts India Ltd
Tata Motors Ltd
RE100 companies not in CDP Sample
Internal Carbon Pricing (ICP)Pricing carbon in 2020
ACC Ambuja Cements Dalmia Bharat Ltd
Dr Reddyrsquos Laboratories Godrej Consumer Products Godrej Industries
Gujarat Fluorochemicals Hero Motocorp Ltd Hindustan Zinc
63
A N N U A L R E P O R T 2 0 2 0
Infosys Limited JSW Cement Limited JSW Steel Ltd
Mahindra amp Mahindra Mindtree Ltd Shree Cement
Tata Chemicals Tata Consultancy Services Tata Consumer Products
Tata Motors Tata Steel Tech Mahindra
Ultratech Cement Wipro
Planning to price in the next two years
Adani Ports amp Special Economic Zone ARVIND Ltd GAIL
GHCL LIMITED Indian Hotels Co Ltd JK Tyres amp Industries
JSW Energy Jubilant Life Sciences Ltd Larsen amp Toubro Infotech Ltd
Mahindra amp Mahindra Financial Services Mahindra Lifespace Developers Limited Marico
NTPC Ltd Piramal Enterprises Reliance Jio Infocomm Limited
Tata Communications Tata Power Co UPL Limited
Vakrangee Softwares Ltd Vedanta Ltd YES BANK Limited
64
A N N U A L R E P O R T 2 0 2 0
About CDPCDP is a not-for-profit charity that runs the global disclosure system or investors companies cities states and regions to manage their environmental impacts by running a global environmental disclosure system Each year CDP supports thousands of companies cities states and regions to measure and manage their risks and opportunities on climate change water security and deforestation We do so at the request of their investors purchasers and city stakeholders
Over the last two decades we have created a system that has resulted in unparalleled engagement on environmental issues worldwide In 2020 Over 9600 companies reported through CDP on climate change water security and forests and over 800 cities and more than 120 states and regions disclosed their environmental impacts through CDP
CDP IndiaCDP began working in India in 2008 and was formally registered in 2012 working on disclosure and driving climate action It serves as a source of knowledge for hundreds of Indian corporations from those that are just beginning on the road to corporate environmental disclosure through to those looking to improve sustainability and make commitments to reduce environmental impact
It is the only NGO to be named in Indiarsquos INDC submission to the UNFCCC owing to its corporate environmental data repository and tracking of emissions and mitigation data from the Indian Industry CDP India also actively participated in Government of Indiarsquos Ministry of Environment Forests amp Climate Change (MoEFCC) work on future carbon market mechanisms In addition to our work on disclosure CDP India is actively engaged in other initiatives including Internal Carbon Pricing (ICP) Science-based targets (SBT) and RE100
65
A N N U A L R E P O R T 2 0 2 0
CDP ContactsFor more info contact Damandeep Singh Director CDP India damandeepsinghcdpnet infoindiacdpnet
CDP Board of Directors
Bharati Chaturvedi Founder amp Director Chintan Environmental Research and Action Group
Ramakrishnan Mukundan Managing Director amp CEO Tata Chemicals Limited
Damandeep Singh Director CDP India
Important Notice
The contents of this report may be used by anyone providing acknowledgement is given to CDP Worldwide (CDP) This does not represent a license to repackage or resell any of the data reported to CDP or the contributing authors and presented in this report If you intend to repackage or resell any of the contents of this report you need to obtain express permission from CDP before doing so
CDP India has prepared the data and analysis in this report based on responses to the CDP 2020 information request No representation or warranty (express or implied) is given by CDP India as to the accuracy or completeness of the information and opinions contained in this report You should not act upon the information contained in this publication without obtaining specific professional advice To the extent permitted by law CDP India do not accept or assume any liability responsibility or duty of care for any consequences of you or anyone else acting or refraining to act in reliance on the information contained in this report or for any decision based on it All information and views expressed herein by CDP India is based on their judgment at the time of this report and are subject to change without notice due to economic political industry and firm-specific factors Guest commentaries where included in this report reflect the views of their respective authors their inclusion is not an endorsement of them
CDP India their affiliated member firms or companies or their respective shareholders members partners principals directors officers andor employees may have a position in the securities of the companies discussed herein The securities of the companies mentioned in this document may not be eligible for sale in some states or countries nor suitable for all types of investors their value and the income they produce may fluctuate andor be adversely affected by exchange rates
lsquoCDP Worldwidersquo and lsquoCDPrsquo refer to CDP Worldwide a registered charity number 1122330 and a company limited by guarantee registered in England number 05013650
copy 2020 CDP Worldwide All rights reserved
This report is printed on recycled paper
This report is printed on CyclusPrint based on 100 recycled fibres
This report is printed on CyclusPrint based on 100 recycled fibres
Supported by Scoring partner
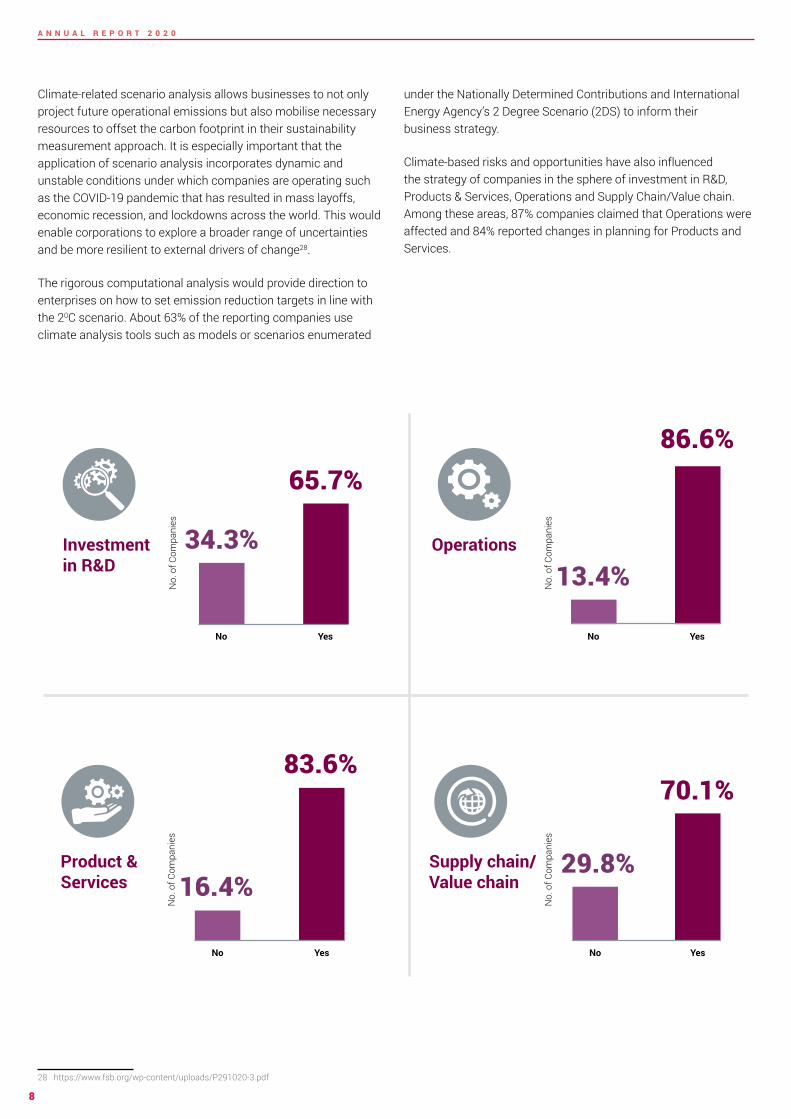
9
A N N U A L R E P O R T 2 0 2 0
CLIMATE-RELATED RISKS amp OPPORTUNITIESMore often than not the financial impacts of climate-related issues are not quantified and identifying them in the first place could be challenging These issues necessitate actions Increasingly investors lenders and other financial regulators are becoming more focused on ensuring that the private sector is ready to address climate risks and grab opportunities brought by changing climate
29 httpthoughtleadershipaoncomDocuments20200122-if-natcat2020pdfutm_source=cerosamputm_medium=storypageamputm_campaign=natcat20
30 httpswwwbankofenglandcouk-mediaboefilesspeech2019avoiding-the-storm-climate-change-and-the-financial-system-speech-by-sarah-breedenpdf
31 httpsreadoecd-ilibraryorgviewref=136_136201-ctwt8p7qs5amptitle=Making-the-Green-Recovery-Work-for-Jobs-Income-and-Growth_
32 https6fefcbb86e61af1b2fc4-c70d8ead6ced550b4d987d7c03fcdd1dsslcf3rackcdncomcmsreportsdocuments000005312originalAnalysis_of_CA100__Data_for_CDP_Investor_Signatories_v5pdf1596046258
33 Climate Action 100+ is an investor initiative to ensure the worldrsquos largest corporate GHG emitters take necessary action on climate change The companies include 100 lsquosystemically important emittersrsquo accounting for 23rd of annual global industrial emissions alongside more than 60 others with significant opportunity to drive the clean energy transition Read more at httpwwwclimateaction100org
Climate change has already shown substantial impacts on businesses all around the world and this is expected to continue As per a 2019 report 29 the total direct economic losses incurred due to climate-related natural disasters in 2019 were estimated at US$232 billion In India the monsoon floods in June-October 2019 caused an economic loss of US$10 billion and claimed 1750 lives Additionally the Bank of England has estimated asset losses worth US$20 trillion due to climate change if no action is taken now 30
COVID-19 has taught the world how the pandemic can actually be used as an
opportunity to better understand and mitigate climate-related
risks Investors are now more than ever more focussed on risk exposure Post-COVID-19 civil society groups governments and business are all have aligned in trying to reduce the risks to our economy and world going forward
As per an OECD report despite widespread socio-
economic suffering suffering there is an increase in public
consciousness about the risks to the natural system from anthropogenic activities31
CDP recently released a report32 on the analysis of CA100+ companies for CDP Investor Signatories Up to 118 of 122 CA100+33 companies report being exposed to substantive climate-related risks and opportunities 93 companies identified climate-related risks and 91 identified climate-related opportunities as having the potential to have a substantive financial or strategic impact on their businesses
As per CDP Indiarsquos 2020 data companies have a varied definition of what short medium and long-term means for them -- a rough average across the sample would be three years for short term five years for medium term and 15-20 years for the long term although the latter also ranges up to 100 years These time frames are important in planning risk management processes -- contextualisation of risks in terms of potential market changes and evolving technological scenarios around risk management at enterprise level
Responding companies
67Companies identified
climate related substantive risks
62Companies
identified risk typesdrivers
60Companies
identified potential financial impact
driver
60
Companies provided potential financial
impact figures
42
10
A N N U A L R E P O R T 2 0 2 0
THE RISKS OF CLIMATE CHANGE
In terms of risk types current regulation was deemed to be most relevant and always included in 97 of the organisationsrsquo climate-related risk assessments This was followed by emerging regulation and technology Interestingly findings from responses submitted by global companies corroborate this trend analysis as almost all CA100+ respondents reported policy and legal risks as potential drivers for substantive impact when it comes to transition risk34 With regular compliance checks increased stakeholder concern and sustainably evolving consumer demands climate-related risk assessment procedures can help companies become better equipped to handle longer-term uncertainties and liabilities
The number of companies that identified inherent climate-related risks with potential substantive financial or strategic impact on businesses rose to 94 from 88 in 2019 Up to 63 of reporting companies were able to get to the last mile of providing a financial impact figure to the risks identified Disclosing Indian companies put the total inherent financial impact of climate risks at `7138 billion with an average risk per company being `92 billion
Companies have also identified climate-related risks across their value chain with direct operations being the most severely affected and exposed most to acute physical risks followed by emerging regulation current regulations and chronic physical risks Companiesrsquo lsquodownstreamrsquo value chain is affected the most by market risks followed by acute physical risks Downstream value chain refers to the third parties benefiting from the outputs products and services of business activities This may be a companyrsquos customers and clients or the organisations and projects the business invests in This could possibly mean that changing customer behaviour could gravely affect a business operation if there is a shift in the demand for a comparatively low-carbon intensive product as well as greater demand for product efficiency regulations and standards providing clear evidence that there is a continuous shift towards sustainable products
CLIMATE RISKS AN OPPORTUNITY TO RESTRATEGISE
Up to 94 of reporting companies have identified climate-related opportunities as having the potential to make a substantive financial or strategic impact on businesses And 63 have provided a potential financial impact figure to the opportunities related to climate change Disclosing companies put the cost of climate-related opportunities at a total of `2787 billion The figure is a testament to the evolution of the climate change mitigation program and how organisations see this
34 https6fefcbb86e61af1b2fc4-c70d8ead6ced550b4d987d7c03fcdd1dsslcf3rackcdncomcmsreportsdocuments000005312originalAnalysis_of_CA100__Data_for_CDP_Investor_Signatories_v5pdf1596046258
No of Companies
Opp
ortu
nity
typ
es
Opportunity identified in value chain
Direct operations
Downstream
Upstream
Resource efficiency
Product and services
Energy source
Markets
Resilience
41
25 18
34 7
7
9 3
3
2
3
396
6
Risks relevant to Indian companies
Current regulation97Emerging regulations90Reputation90Market85Technology85Legal
Acute physical
Chronic physical
827973
No of Companies
Risk occuring in value chain
No of Companies
Risk
type
s
Reputation
Legal
Emerging regulation
Chronic physical
Technology
Market
Current regulation
Acute physical
Direct operations
Downstream
Upstream
5115
2
2923 4 8
17
8 14 7122 4
40 5 8
2
31
11
A N N U A L R E P O R T 2 0 2 0
Similarly most companies saw resource efficiency as a major climate-related opportunity followed by energy source and products and services in their lsquodirect operationsrsquo The main drivers behind these opportunities were use of more efficient production and distribution processes use of lower-emission sources of energy and development andor expansion of low-emission goods and services In the lsquodownstreamrsquo value chain products and services was majorly witnessed as an opportunity as there is growing consumer awareness and concern around sustainability related issues As a result companies are constantly diversifying their portfolios to address these consumer needs
Prod
uct a
nd s
ervi
ces
Ener
gy S
ourc
e
Resi
lienc
e
Resi
lienc
e
Ener
gy S
ourc
e
Reso
urce
effi
cien
cyM
arke
ts
2787identified to be the financial impact of reported climate-
related opportunities (in rupee billion)
Billion
`452
328
270
18
1719
Responding companies
67Companies
identified climate related
substantive opportunities
63Companies identified
opportunitiy typesdrivers
61
Companies identified
potential financial impact driver
60
Companies provided potential financial impact
figures
42
2041
4715
136
119
42413842
Acut
e ph
ysic
alCu
rren
t reg
ulat
ion
Emer
ging
regu
latio
n
Chro
nic
phys
ical
Repu
tatio
nO
ther
s
Lega
l
Tech
nolo
gyM
arke
t
7138identified to be the financial impact of reported climate-
related risks (in rupee billion)
Billion
`Financial impact of reported climate-related risks (in rupees billion)
Financial impact of reported climate-related opportunities (in rupees billion)
12
A N N U A L R E P O R T 2 0 2 0
Tech Mahindra Tapping into climate-related opportunities
Tech Mahindrarsquos approach towards climate change mitigation strategies is a testament to the efficacy of tapping into and realising climate-related opportunities The company has adopted Science-Based Targets to reduce its emissions and is a signatory to Business Ambition of 15 degree Celsius Tech Mahindra is committed to responsibly managing its operations through continuous improvement in sustainability practices across its value chain The company focuses on carbon emission reductions energy consumption reduction self-generation of energy from renewable energy sources and encouragement for green projects through Power Purchase Agreements The company has taken a target to increase Renewable Energy (RE) to 50 by 2025 Their sustainability report is aligned with CDSB amp Task Force on Climate-related Financial Disclosures (TCFD) frameworks
A constant focus on green energy and sustainable operations has provided a significant saving of US$27 million brought about by increasing renewable energy capacity to 1383MW leading to a saving of 28 million units of electricity adopting energy efficient practices across their facilities
Tech Mahindra has harnessed the power of disruptive next-generation technologies such as Artificial Intelligence (AI) analytics and blockchain to create solutions that ensure both its own and its customersrsquo carbon footprint reduction The company has contextualised opportunities for its customers as well by creating smart city offerings such as SMART Grid Micro-Grid-As-A-Service Intelligent Electric Vehicle Charging System (IEVCS) smart energy management smart traffic management smart lightening management smart waste management systems and command amp control centres These smart city offerings will help reduce carbon footprints across multiple smart cities globally thereby reducing carbon emissions and contributing to green and sustainable solutions It is claimed that the market size for this is expected to reach US$4639 billion by 2027
At present the risks identified by the responding companies significantly outweigh the opportunities Opportunities are slow to emerge and companies need to focus on the use of lower-emission sources of energy development andor expansion of low-emissions goods and services development of climate adaptation resilience and insurance risk solutions and use of more efficient production and distribution processes
In 2015 at the request of the G20 Finance Ministers and Central Bank Governors the Financial Stability Board (FSB) and its chair Mark Carney established the industry-led TCFD This was set up in response to increasing demands from investors lenders insurers regulators policy makers and other stakeholders in the financial markets for decision-useful climate-related information CDP has aligned its information requests with the TCFD alongside introducing a sectoral focus and adopting a forward-looking approach to climate-risk disclosure We are already going in the direction of mandatory disclosure of climate risks how they are present in a companyrsquos activities how they manage it and how resilient they are to it The UK will be the first country in the world to make TCFD-aligned disclosures fully mandatory across the economy by 2025 going beyond the lsquocomply or explain approachrsquo35
35 httpswwwgovukgovernmentnewschancellor-sets-out-ambition-for-future-of-uk-financial-services
13
A N N U A L R E P O R T 2 0 2 0
Under current policies Indiarsquos projected emissions for 2030 can achieve a rating of ldquo15degC Paris Agreement compatiblerdquo if domestic emissions peak and start reducing with international support36 This shows that India has the potential to become a world leader with enhanced 15-degree compatible targets through a swift transition from coal to renewable energy Although India was already on track to meet its NDCs pre-COVID19 it has seen an even more significant drop in emissions since the onset of the pandemic During the peak of lockdown Indiarsquos energy demand reduced by almost 30 in April 202037 ie each additional week of lockdown the annual energy demand fell by 0638 This is mostly due to the significant reduction in energy consumption and power generation via fossil fuel However the impact of the pandemic on emissions is expected to be temporary and emissions are likely to rebound in 202139 as per estimations
In comparison to the NDCs which set an overall emissions target sectoral indicators can be more reliable in making informed decisions on mapping emissions reduction targeting Paris-compatible goals40 The
36 Climate Action Tracker- Fair Share37 Carbon Brief Analysis Indiarsquos CO2 emissions fall for first time in four decades amid coronavirus38 httpswwwieaorgreportsindia-202039 Carbon Brief Global Carbon Project Coronavirus causes lsquorecord fallrsquo in fossil-fuel emissions in 2020 Dec 202040 httpswwwoecd-ilibraryorgdocserver9789264273528-4-en
pdfexpires=1607881602ampid=idampaccname=guestampchecksum=891034D10FA31A953F7924772F23966D41 httpssciencebasedtargetsorgresourceslegacy201505Sectoral-Decarbonization-Approach-Reportpdf42 IPCC Mitigation Pathways Compatible with 15degC in the Context of Sustainable Development
major challenge is how to translate global temperature goals into individual actions However various strategies can be adopted to meet the long-term goals
The Science-Based Targets Initiativersquos (SBTi) Sectoral Decarbonisation Approach (SDA) allocates the well below 2degC carbon budget to different sectors taking into account inherent differences among sectors such as how fast each sector can grow relative to economic and population growth along with its mitigation potential41 According to the Intergovernmental Panel on Climate Change (IPCC) the highest global carbon budget allocation (for the period of 2011-2050) is for the power sector (25) followed by agriculture (24) and industry [including steel aluminium chemical and paper] (14)42
EMISSIONS TRENDS AND VERIFICATION
13increase in number of
organisations reporting
27increase in emissions
reporting (Scope 1+Scope 2)
90increase in scope 3 emissions reporting
India under its NDCs pledged to reduce its emissions intensity by 33-35 by 2030 compared to the 2005 levels The Climate Action Tracker38 rates Indiarsquos NDC target as ldquo2009 Copenhagen 2degC goal compatiblerdquo indicating that its commitment is a ldquofair sharerdquo of the global effort
Scope 1 and Scope 2 Emissions reported via CDP over the years
(In Million tCO2e)
2018 2019 2020
2997
55717037
14
A N N U A L R E P O R T 2 0 2 0
In order to allocate sector-specific questions to companies CDP has developed an Activity Classification System (ACS)43 It is a framework used to classify companies under the most relevant sectors It focuses on the diverse activities from which companies derive revenue associating them with the impacts to their business from climate change water security and deforestation This approach allows a better understanding of company actions based on their environmental risk opportunity and impact CDPrsquos Climate Change questionnaire requests companies to disclose their direct and indirect emissions under different emissions categories Although India saw an overall decrease in emission in 2020 there was an increase in CDP reporting companies and hence an overall increase in emissions reporting For the year
43 https6fefcbb86e61af1b2fc4-c70d8ead6ced550b4d987d7c03fcdd1dsslcf3rackcdncomcmsguidance_docspdfs000001540originalCDP-ACS-full-list-of-classificationspdf1520244912
44 The location-based method reveals what the company is physically putting into the air and the market-based method shows emissions the company is responsible for through its purchasing decisions
2020 the companies reported 70374 MtCO2e of total [Scope 1+Scope 2 (location-based)] emissions which is a 27 increase in reported emissions from 2019 This is mostly because of the significant increase in emissions reporting from several sectors mdash electric utilities cement and other heavy sectors
Only four companies chose a Scope 2 market-based approach and 43 companies selected a scope 2 location-based approach44 The total scope 2 emissions for location-based approach amounted to 181 MtCO2e and market-based approach amounted to 414 MtCO2e It is clear from this breakdown that a range of sectors and processes contribute to global emissions Focusing on any single sector alone would be insufficient However as can be seen in the
Emissions reported in Scope 3 Categories
4949
1414
1111
1010
88
55
33
Use of sold products
Purchased goods and services
Upstream transportation and
distribution
Downstream transportation and
distribution
Fuel and energy related activities (not included
in scope 1 and 2)
End of life treatment of sold products
Others
In 2020 companies have reported MtCO2e of total (Scope 1+2 [location-based]) emissions704
Gross Emissions Data 2020 (in MtCO2e)
682
126418
Gross Scope 1 Emissions
Gross Scope 3 EmissionsGross Scope 2 Emissions (Market and
Location based)
Scope 2 Location based emissions Scope 2 Market based emissions
Metal smelting refining and forming
Financial services
Cement amp concrete
Media telecommunications amp data center services
IT amp software development
Energy utility network
Chemicals
Textiles amp fabric goods
Oil amp gas processing
Biotech and pharma
Thermal power generation
Intermodule transport amp Logistics
Bar Hotels and Restaurants
Transportation equipment
Metallic mineral mining
Others
2911712
703
688536
165 292207
144118113
093087
071063
020057
024045044
157
Scope 2 Market-based emissions Scope 2 location-based emissions
Scope 2 market-based and location-based emissions reported as per CDPrsquos Primary Activity Group classification (in MtCO2e)
15
A N N U A L R E P O R T 2 0 2 0
graph for Gross Scope 2 emissions metal smelting refining and forming sectors contribute to the maximum emissions (1712 MtCO2e) followed by financial services and cement and concrete sectors
Companies reported 1259 MtCO2e of Scope 3 emissions in 2020 a 90 increase from 2019 figures due to higher disclosure as well as more companies disclosing their Scope 3 GHG inventories Almost half of the Scope 3 emissions were reported in the following categories use of sold products (49) followed by purchased goods and services (14) upstream transportation and distribution (11) and downstream transportation and distribution (10)
The ACS sectoral analysis shows that the transportation equipment activity group has the maximum reported scope 3 emissions at 615 MtCO2e followed by metal smelting refining and forming activity group at 2332 MtCO2e and cement and concrete activity group at 989 MtCO2e
Of the responding companies 33 have reported an approximately 11 of reduction in their gross global emissions (Scope 1 and 2 combined) from 2019 and 26 companies reported an approximate 57 increase in their gross global emissions from 2019 Responding companies have identified change in boundary45 as a major reason for a 62 increase in emissions from 2019 followed by acquisitions which led to a to 30 increase Amongst all sectors the electric utilities sector accounts for 83 of total increased emission values and up to 73 of these were due to change in boundary
Amongst all sectors reduction in emissions values since 2019 were mostly caused by emissions reduction initiatives (43) followed by change in output (30) and change in emission estimation methodology (23)
45 This refers to changes in the boundary used for inventory calculation ie changing from financial control to operational control This option could also apply if organisation has incorporated facilities into its inventory that were excluded in previous years
Amongst all sectors steel saw the highest reduction (around 48) in emission values and approximately half of this was achieved only from change in emission estimation methodology through recalibrating the GHG emissions for the reporting period This is followed by cement which reported a 29 reduction in emission values from implementing emissions reduction initiatives It is also noted that more than 30 of responding companies have adopted a change in renewable energy consumption but this accounts for only 35 of total reduction in emission values
Scope 3 emissions reported as per CDPrsquos Primary Activity Group classification (in MtCO2e)
of increased emissions in 2020 attributed to Change in boundary62
32 attributed to acquisitions
Metal smelting refining and forming
Cement amp concrete
Media telecommunications amp data center services
Chemicals
IT amp software development
Food amp beverage processing
Oil amp gas processing
Biotech and pharma
Thermal power generation
Land amp property ownership amp development
Financial services
Transportation equipment
Others
6157
2332
989
796
790
632
385
158
127
073
059
039
055
Third-party verification or assurance in place for Scope 12 amp 3 emissions
3571
Scope 1
3643
Scope 2 (location-based
or market based)
2786
Scope 3
a
ge o
f com
pani
es
16
A N N U A L R E P O R T 2 0 2 0
Third-party verification is one of the significant components of emission reporting An independent verification of self-reported data provides credibility and assurance It helps companies improve their internal processes identify risks and opportunities increase the reliability of their data reduce operational costs and building a strong reputation46 When an organisation monitors and verifies its emissions it can accurately identify and understand the true proportions of emissions from its sources and this can help it realise the major opportunities for emission reduction along with cost benefits
In 2020 50 companies reported third-party verification or assurance for Scope 1 emissions 51 companies for Scope 2 emissions and 39 companies for Scope 3 emissions Compared to 2019 there is an 18 increase in companies that have verified Scope 3 GHG emissions This indicates that Indian companies are becoming increasingly aware of their emission managementaccounting Amongst all sectoral companies which opt for third-party verification of their reported emissions around 25 are from IT amp software development and financial services Cement and concrete sectors rank the lowest on the list CDP encourages companies to have verified data submitted
46 The business benefits of third party verification of climate data A CDP Guide
Building a stronger reputation via third party verification
bull Increase confidence in data for internal and external use
bull Develop and demonstrate an effective carbon reduction strategy Improve business processes
bull Reduce operational costsbull Full-fill one of the mandatory criteria for entry
to the CDP A-list by gaining full points on CDPrsquos Scope 1 and 2 verification questions
bull Provide credibility for products services and internal processes
bull Counteract claims of greenwashing
17
A N N U A L R E P O R T 2 0 2 0
DECARBONISING ACROSS VALUE CHAIN Scope 3 emissions typically arise from the supply chain and the consumers using the product It has been found that the emissions from the supply chain are 5-6 times more than the carbon footprint of a companyrsquos direct operations and hence account for lionrsquos share of an organisationrsquos overall emissions47
47 httpswwwcdpnetenarticlessupply-chainsupplier-engagement-leaderboard-201948 httpswwwbcgcomen-inpublications2020supply-chain-needs-sustainability-strategy
Walking the extra mile in terms of engaging with stakeholders especially suppliers and customers on climate issues allows an organisation to consider the whole gamut of emissions and have better control over their emissions inventory For example metal companies can improve their supply chainrsquos environmental performance through adoption of a circular economy model which leads to an increased use of recycled materials in products reduces the emissions by lowering the overall burden on the manufacturing plant to produce from scratch and creates a closed-loop system with consumers48 This yearrsquos data indicates that 88 of companies engaged with their value chain partners on climate-
related issues an improvement of 5 over 2019 There was also an increase in absolute numbers -- 59 business entities collaborated with value chain partners against 49 last year
The main forms of engagement with suppliers are compliance and onboarding followed by incentivisation and information collection Educationinformation sharing collaboration and innovation are the most common customer engagement processes
Types of engagement with suppliers
No of Companies engaging with value chain on climate-related issues
2121
22
331212
1313
44
44
Other partners in the value chain customers suppliers
Other partners in the value chain suppliers
Customers
Customers Suppliers
Suppliers
Other partners in the value chain
Other partners in the value chain customers
of companies engage with their value chain partners on climate related issues an improvement of 5 from 2019
88
26
Compliance amp onboarding
16
Engagement amp incentivisation
(changing supplier behavior)
9
Information collection
(understanding supplier behavior)
7
Innovation amp collaboration
(changing markets)
No
of C
ompa
nies
18
A N N U A L R E P O R T 2 0 2 0
Organisations are mindful of the fact that climate issues need to be dealt using a participatory approach that encompasses all partners in the value chain as well as engages other external stakeholders Companies are thus getting serious about engaging in a comprehensive dialogue on climate change as this will allow them to have inputs in shaping public policy In their attempt to influence climate policies organisations are establishing communication channels with stakeholders like policymakers trade associations and research funding organisations A positive sign emerging is that majority of the businesses are agreeing to comply with environmental legislations unconditionally Energy efficiency and clean energy generation have garnered the support of 71 and 68 of responding companies respectively Mandatory carbon reporting and increased climate resilience have also found acceptance
With the COVID-19 pandemic wreaking havoc across the world and leading to the first-ever recorded recession in India it is important that companies view this as an opportunity to build a more resilient economy one in harmony with nature and encouraging of a more inclusive environment for supplier engagement that would expedite decarbonising Engaging with the value chain offer a strategic advantage as it allows companies to take a lead on corporate sustainability and puts them in a position to set the blueprint for other businesses to follow
19
A N N U A L R E P O R T 2 0 2 0
Emission reduction targets and initiatives
Targets
In recent years accelerated climate change has forced businesses to set more ambitious climate goals and commit to advocating for a low-carbon economy Today it is considered a standard practice for businesses to report their annual emissions and undertake efforts to reduce their carbon footprint Of the 67 Indian companies responding to investor requests 57 have undertaken a total of 95 emissions reduction targets including absolute targets intensity targets and both absolute and intensity targets 24 of these were approved SBTs
The global pandemic has reinforced the need for business resilience in operations and corporate leaders have started recognising that science-based climate action goes hand-in-hand with building business success49 Companies are looking science-based targets as guiding lights with a defined pathway to future-proof growth and with impending climate change hazards more companies have doubled down on their commitments towards a low-carbon transition50 The momentum for SBTs has reached across a range of industries including cement
49 The new normal 1000 companies are now setting science-based climate targets - Science Based Targets50 httpswwwcdpnetenarticlesclimate2020-lessons-from-an-extraordinary-year
automobiles pharmaceuticals metals amp mining real estate and information technology
As more companies are striving toward commitments this year witnessed an increase in the number of approved SBTs from seven targets last year to 24 targets this year
Leading companies are moving forward by setting long-term emissions reduction targets to mitigate climate-related risks Compared to 2019 this year more targets
were set under a long-term time frame till 2030 and a lesser focus had been given on short-term targets ie till 2020 Most of the companies selected a base year of 2018 and had gone for the intensity targets Hence in upcoming years long-term targets can play a major role for companies to support their sustainability visions and their journey towards low-carbon transition Apart from these companies also reported 83 other targets which included 38 energy consumption targets 13 energy productivity targets and 11 waste management targets amongst others
TARGETS amp PERFORMANCE
More than
three times increase in the number of approved science-based targets
of the responding companies set long-term targets (ie till 2030)
50
15
Absolute target
5Both absolute and intensity
targets
37
Intensity target
10
No target
No of Companies
GHG Emission Reduction Target Types
Absolute emission targets count
Intensity emission targets count
Types of targets based on time-frame of target year
820
Till 2020
1929
Till 2021 - 2030
136
2031 and beyond
20
A N N U A L R E P O R T 2 0 2 0
Emission reduction initiatives
While the number of companies taking up Emission Reduction Initiatives (ERI) has grown from 53 to 58 the number of initiatives has declined from 293 to 287 resulting in a 13 decrease in the estimated annual CO2e savings this year
Energy efficiency in production processes and in buildings continue to account for most ERIs non-energy industrial process emission reductions have been outweighed in their CO2e saving potential
Other emission reduction initiatives such as upgrading equipment with high-efficiency alternatives and digitisation initiatives undertaken by banks accounted for the highest estimated CO2e savings In terms of the highest monetary savings energy efficiency in production processes contributed to 76 of monetary savings followed by energy-efficiency in building services
The steel sector had the highest number of initiatives for energy efficiency in production process and accounted for
of total estimated annual CO2e savings
88Monetary Savings from Emission Reduction Initiatives
Annual monetary savings (Million `) No of Initiatives
20611 1918 576 237 148Energy
efficiency in production processes
Non-energy industrial process
emissions reductions
Other initiative
Waste reduction
and material circularity
Energy efficiency in
buildings
150
63 1210
2
Emission Reduction Initiatives
6340 2772 2574 2016 1278
6310
150
122
Other initiatives
Non-energy industrial process
emissions reductions
Energy efficiency in production processes
Waste reduction
and material circularity
Energy efficiency in
buildings
No of InitiativesEstimated annual CO2e savings (MtCO2e)
21
A N N U A L R E P O R T 2 0 2 0
The rise in climate consciousness among Indian companies is evident from the growing number of those committed to the Science Based Target Initiative (SBTi) By 2020 52 companies have committed to it with a significant growth of more than 37 over last year India is now the leader from emerging economies for having the maximum number of companies committing to SBTi and globally it stands at the sixth position
Of the 52 committed companies 22 have further approved SBTs in 2020 compared to 10 in 2019 The initiative champions SBT setting as a powerful way of future-proofing companiesrsquo growth in the transition towards a low-carbon economy51 The initiativersquos overall aim is for SBT setting to become a standard business practice and for companies to play a major role in driving down global GHG emissions Embedding SBTs as a fundamental component of sustainability management practices is crucial for achieving this
The Sectoral analysis of the Indian SBTi companies highlights the number of companies that are committed to the initiative and the number of those with approved set targets across each sector
51 httpssciencebasedtargetsorgresourcesfilesSBTi-manualpdf52 httpssciencebasedtargetsorgresourceslegacy201805SBT-transport-guidance-Finalpdf
Compared to last year the automobiles and components sector is still leading with the highest commitment and targets set The automobile sector is one of the fastest growing sectors which represents 23 of all energy-related global emissions52 Decarbonisng the automobile sector is possible through disruptive technological innovation land-use planning and transport demand management modal shift and
shifting to electric mobility Companies that set ambitious SBTs can send a strong signal for local regional and national policies to increase the level of ambition and steer the transition
In 2020 28 SBTi committed companies responded to CDPrsquos Investor request to disclose to the Climate Change questionnaire The emissions profile shows that the overall Scope 1+ Scope 2 emissions of SBTi companies responding to CDP represent almost 20 of the total Scope 1+ Scope 2 emissions and 71 of the total Scope 3 emissions in the overall CDP India Investor sample
A greater share of Scope 3 emissions reported by SBTi companies indicate that there is now a greater focus on the Scope 3 GHG Inventory as the companies are planning to set SBTs in coming years As per the SBTi a complete Scope 3 screening or inventory is required for the validation of the SBTs and it is not acceptable to exclude any relevant categories
What is a lsquoScience-Based Targetrsquo
Science Based Targets are the GHG emissions reduction targets consistent with the level of decarbonisation that according to climate science is required to limit global temperature increase to 15- 2ordmC compared to pre-industrial temperature levels
Science Based Target ensures that the company is taking shorter-term action to reduce emissions at a pace that is consistent with keeping warming below 15ordm well-below 2ordm C
SCIENCE-BASED TARGETS AMBITIOUS CORPORATE CLIMATE ACTION
200
128107
74 57 52
United States of America
(USA)
United Kingdom
(UK)
Japan Sweden IndiaFrance
No of Companies
Top 5 countries with SBTi companies
22 28 303
No
of C
ompa
nies 10
22Status of SBTi Companies in India
Committed Target Set
22
A N N U A L R E P O R T 2 0 2 0
CDP India data shows that 33 companies have reported reduction in their gross global emissions (Scope 1 and 2 combined) from the previous reporting year whereas 26 companies have their gross global emissions increased for this reporting year
CDPrsquos data shows that there are 32 companies that are considering setting a SBT in the next two years compared to 29 companies in the previous reporting year There are 11 intensity and eight absolute targets that companies consider to be SBT but this has not been approved by SBTi yet
The increase in these target number highlights that there are more companies which seek to commit to SBTi and get their targets validated in the coming years
Growth in ambition
CDPrsquos five-year data shows a rise in the number of Indian companies committing to the SBTi Their reported emissions increased by 144 due to increased commitment from energy intensive companies this year which includes companies from cement and metal and mining sectors
CDP India investor responding companies
SBTi companies (28 companies respond to CDP)
Emissions Profile (MtCO2e)
6815
134
Scope 1 Scope 2
22282
Scope 3
1259896
NO of Companies
Water Transportation
Professional Services
Textiles Apparel Luxury Goods
Software and Services
Pharmaceuticals and Biotech
Mining - Metals (Iron Aluminium Other Metals)
Food Production - Agricultural Production
Electrical Equipment and Machinery
Electric Utilities and Energy Related
Commercial services and supplies
Air Freight Transportation and Logistics
Food and Beverage Processing
Electric Utilities and IPPs and Energy Traders
Construction Materials
Automobiles and Components
Consumer Products and Durables
Banks Diverse Financials and Insurance
Chemicals
Hospitality
Real Estate
Telecommunications
1
1
3
2
2
2
1
1
1
1
1
1
1
1
2
3
3
2
1
1
6
2
4
1
1
2
3
3
Sectoral Analysis of Indian SBTi companies
Committed Companies Target Set Companies
33
14
Decreased
26
12
Increased
62
Reporting for the first time
1No Change
CDP India investor responding companies
SBTi companies (28 companies respond to CDP)
Comparison of change in gross Scope 1+2 emissions from previous year for SBTi companies vis-agrave-vis CDP reporting
companies
Emission Reduction Targets Reported by Companies in 2020
3
Not SBT not anticipating setting in 2
years
24
8
Not SBT but anticipating setting
in 2 years
4 5
Yes this is SBT approved by SBTi
11 8
Yes this is SBT not approved by
SBTi
Intensity emissions reduction target
Absolute emissions reduction target
No
of c
ompa
nies
23
A N N U A L R E P O R T 2 0 2 0
We witnessed the highest number of SBTi companies responding to CDP India this year which is a 40 growth from last year This further proves that companies are becoming more responsible towards disclosing their GHG Inventory with greater transparency
The graph for the estimated annual carbon savings shows the top three emission reduction initiatives undertaken by SBTi companies reporting to CDP It is evident that over the years low carbon energy purchase and energy efficiency process have gained momentum in reducing GHG emission with an increase in the number of SBTi committed companies implementing these initiatives Maximum carbon savings of 791 MtCO2e have been reported from the cement and concrete sector The metal smelting refining amp forming sector has reported 59237 tons CO2e savings this year with a significant decrease from 70422 tons CO2e savings in the last year There has been a reduction of 443 MtCO2e of estimated annual carbon savings reported by SBTi companies in 2020 as compared to the last year
Data shared by three reporting companies that have also committed to the SBTi (Ambuja Cement Ltd ACC Limited and Ultratech Cement Limited) shows that improving energy efficiency in their production processes has led to cement being the leading sector in reducing GHG emissions
About SBTi
The Science Based Targets initiative champions science-based target setting as a powerful way of boosting companiesrsquo competitive advantage in the transition to the low-carbon economy
It is a collaboration between CDP the United Nations Global Compact (UNGC) World Resources Institute (WRI) and the World-Wide Fund for Nature (WWF) and one of the We Mean Business Coalition commitments
The initiative
bull Showcases companies that set science-based targets through case studies events and media to highlight the increased innovation reduced regulatory uncertainty strengthened investor confidence and improved profitability and competitiveness generated by science-based target setting
bull Defines and promotes best practice in science-based target setting with the support of a Technical Advisory Group
bull Offers resources workshops and guidance to reduce barriers to adoption
bull Independently assesses and approves companiesrsquo targets
Indian SBTi companies responded to CDP Climate Change Investor Program 2020
54
Increase in SBTi companies responding to CDP via 2020 climate Change Investor Disclosure Program compared to previous year
40
Increase in Scope 1+2 Emissions and
Indian SBTi Companies responding to investor request reported reduction in Gross Global emissions compared to previous year
Increase in Scope 3 Emissions covered by SBTi Companies this year as compared to 2019
14450
185
Comparison of Absolute Scope 1+2 emissions (MtCO2e) for SBTi companies reporting to CDP
Emission reported in MtCO2e SBTi companies reporting to CDP
15 16 15 18 20 28
2015 2016 2017 2018 2019 2020
Abso
lute
Sco
pe 1
+2 E
mis
sion
(MtC
O2 e
)
364
8
380
4
479
4
605
5
583
4
142
26
24
A N N U A L R E P O R T 2 0 2 0
Advantages 53
1 Reducing regulatory risks and uncertainties As the government continues to work on implementing the Paris Agreement and meeting the ambition of the country-level pledges Science Based Targets initiative can prove out to be a resilience against the upcoming regulations
2 Strengthening Investor Confidence SBTi can help in strengthening the investor confidence as the investors are highly taking interest in businessesrsquo environmental policies
53 httpssciencebasedtargetsorgblogsix-business-benefits-of-setting-science-based-targets
3 Competitive Edge Companies are getting ahead of their peers by succeeding in the low-carbon transition with increased innovation reduced uncertainty strengthened investor confidence and improved profitability
4 Brand Reputation SBT is a global Initiative which shows robustness confidence and credibility which further helps in building up the brand reputation
Estimated annual CO2e savings of SBTi companies (in lsquo000 tCO2e)
2
Develop Target
3
Submit target for validation
4
Announce Target
1
Commit
Joining Call to Action
We look forward to companies taking action by committing to develop Science-based Targets
68
Energy efficiency Processes
Low carbon energy purchase
Energy efficiency Building services
Estim
ated
ann
ual C
O2e
sav
ings
(in
000
tCO
2e)
60126
2018 2019 2020
124
5184
346
43
7911168
25
A N N U A L R E P O R T 2 0 2 0
Science Based Targets Incubator is a unique project of CDP that was launched in April 2020 with support from MacArthur Foundation amp Shakti Sustainable Energy Foundation in partnership with WWF India to provide technical support with the main objective of handholding and catapulting organisations from commitment stage to target development stage of Science Based Targets Initiative Value Proposition
1 There will be no financial implication on the company
2 Case studies of businesses with validated targets will be shared with the participating companies for peer-to-peer learning
3 Capacity Building workshops and webinars based on recent developments and various other nitty-gritty of SBTi
4 In house trainings and one-on-one meetings with companies where CDP India will explain all stages of the SBTi and provide answers to all the technical queries
26
A N N U A L R E P O R T 2 0 2 0
BUSINESS AMBITION FOR 15degC
lsquoBusiness Ambition for 15degCrsquo is an urgent call to action from a global coalition of UN agencies business and industry leaders Businesses can make a critical contribution to limit the worst impacts of climate change by setting a net-zero target in line with 15degC future57
So far over 300 companies representing more than $36 trillion in market cap have responded to the open letter from global leaders and signed the Business Ambition for 15degC commitment
bull In India 13 companies55 have already aligned and set their target with the most ambitious aim of the Paris Agreement to level global temperature rise to 15degC above preindustrial levels
bull Automobiles and Components and Real Estate are the top sectors that have approved targets aligning with 15degC Ambition
bull In India 13 companies are further committed to Business Ambition for 15degC
bull All the companies in the Real Estate sector from India have approved targets aligning with 15degC Scenario
54 httpssciencebasedtargetsorgbusiness-ambition-for-1-5c55 Mahindra Logistics Ltd Mahindra Heavy Engines Ltd White House Dr Reddys Laboratories Ltd Mahindra EPC Irrigation Limited Swaraj Engines Limited Gromax Agri Equipment
Limited Mahindra Accelo Mahindra Holidays and Resorts India Limited Mahindra Lifespaces Developers Limited Mahindra World City (Jaipur) Ltd Mahindra World City Developers Ltd and Polygenta Technologies Limited
56 httpssciencebasedtargetsorgnet-zero
Net zero a north star for climate action
According to the latest report by the IPCC to limit global warming to 15degC above pre-industrial levels and to avoid the most disastrous impacts of climate change the world must halve CO2 emissions by around 2030 and reach net-zero CO2 emissions by 2050
Companies are increasingly adopting the net-zero climate targets by recognising the importance of keeping global warming to 15degC Between July 2019 and June 2020 over 230 companies committed to reach net-zero emissions as part of the Business Ambition for 15degC campaign an urgent call-to-action for companies to set emissions reduction targets in line with a 15degC future The campaign is led by the SBTi and supported by a global coalition of UN leaders business organisations and NGOs56
27
A N N U A L R E P O R T 2 0 2 0
A carbon price is a cost applied to carbon pollution to discourage polluters Economists agree a carbon price is the single most effective tool for countries to reduce their emissions57 Corporations have been using internal carbon pricing (ICP) as a strategy to manage climate-related business risks and prepare for the transition to a low-carbon economy Carbon pricing policies create strong transparent incentives for firms to internalise the social costs of carbon emissions58 Major investors and financial regulators are calling for businesses to disclose their climate risks and their policies to mitigate emissions59 The most sought-after benefits are that a company can use ICP both as a risk management tool and as a part of its decarbonisation strategy
To see how fast carbon pricing is spreading consider Paragraph 136 of the decision text of the Paris Agreement ldquoproviding incentives for emission reduction activities including tools such as domestic policies and carbon pricingrdquo The final agreement recognised carbon pricingrsquos importance as a powerful incentive to cut emissions by companies and regional state and local governments
The IPCC special report on the impacts of global warming of 15 degC above pre-industrial levels states that an explicit carbon pricing mechanism can theoretically achieve cost-effective emission reductions Along with best practice policies a moderate carbon pricing can help reduce global CO2 emissions significantly60 Parties are encouraged to set prices consistent with Carbon Pricing Leadership Coalitionrsquos
57 What is a carbon price and why do we need one58 Energy the Environment and Technological Change59 Firms ignoring climate crisis will go bankrupt says Mark Carney60 An I P C C Special Report on the impacts of global warming of 15 C above pre-industrial levels and related global
greenhouse gas emission pathways in the context of strengthening the global response to the threat of climate change sustainable development and efforts to eradicate poverty Intergovernmental Panel on Climate Change (2018)
61 Carbon Pricing WBCSD policy paper 2019httpsdocswbcsdorg201909Carbon-Pricing-WBCSD-Policy-Paper-2019pdf WBCSD 2019
62 SHOULD EVERY COUNTRY ON EARTH COPY SWEDENrsquoS CARBON TAX63 httpswwwedienetregistrationregwall
(CPLC) high-level commission on carbon pricing which states that an explicit-price range of US$50ndash100tCO2 by 2030 will be consistent with delivering the Paris Agreement61
Carbon prices have varied widely across existing schemes Success stories such as that of Sweden which currently has the highest carbon price in the world at US$123tCO2 demonstrate that it is indeed possible to make carbon pricing work while the Swedish economy grew by 78 since the introduction of the Swedish carbon tax in 1991 carbon emissions have decreased by 2662 Other countries like The UK
(US$4229) Netherlands (US$3638tCO2) have also committed to increasing their carbon prices in the coming decade63 The worldrsquos top three emitters -- US China and India -- however have put negligible prices on carbon
As part of the lsquoBuild Back Betterrsquo strategy carbon pricing can be a valuable tool
US$123tCO2
Sweden
US$4229tCO2
UK
US$3638tCO2
Netherlands
INTERNAL CARBON PRICEndash ROBUST CLIMATE STRATEGY
28
A N N U A L R E P O R T 2 0 2 0
to guide investment decisions It can help focus on a green stimulus package to recover from the old economy which promotes a carbon-intensive future Different stimulus measures can help clean energy technologies compete with carbon-intensive alternatives and encourage more efficient energy use India is witnessing this momentum ndash a Declaration on Climate Change was signed by 24 key industry captains and Ministry of Environment Forest and Climate Change (MoEFCC) at the virtual India CEO forum on Climate Change on 5th December 2020 Shri Javadekar further said that this declaration by private sector companies voluntarily is a historic step
To guide companies in the implementation of climate-related financial disclosures the TCFD65 developed four recommendations mimicking an organisational structure Governance Strategy Risk Management and Metrics and Targets An ICP is a proposed metric through which entities can safeguard their businesses by internalising market signals The TCFD specifically lists ICP as a key metric to assess climate-related risks and opportunities in line with its strategy and risk management process By attributing a financial cost to risks associated with carbon emissions and translating them into a uniform metric financial decision-makers can integrate transition risks into their business decisions and fill the analysis gap for assets of various time horizons
64 httpnbrienvisnicinViewGeneralLatestNewsaspxId=9829ampYear=202065 httpnbrienvisnicinViewGeneralLatestNewsaspxId=9829ampYear=202066 Implementing the Recommendations of the Task Force on Climate-related Financial Disclosures The Taskforce on Climate-related Financial Disclosures June 2017
Mr Ravi S Prasad Additional Secretary spoke about a coordinating structure for implementation of Paris Agreement which will incorporate internal carbon pricing67
The MoEFCC also constituted a high-level inter-ministerial Apex Committee for Implementation of Paris Agreement (AIPA) in December 2020 under the chairmanship of the Secretary MoEFCCThe purpose of AIPA is to generate a coordinated response on climate change matters that ensures India is on track towards meeting its obligations under the Paris Agreement including its NDC
Senior officials from 14 ministries will serve as Members to AIPA who will oversee the progress in implementation of Indiarsquos NDC and receive periodic information updates to monitor review and revisit climate goals to fulfil the requirements of the Paris Agreement Another key function of AIPA would be to operate as a National Authority to regulate carbon markets in India under Article 6 of the Paris Agreement formulate guidelines for consideration of projects or activities under the article issue guidelines on carbon pricing market mechanism and other similar instruments that have a bearing on climate change and NDCs
It will take note of the contributions of the private sector as well as multi-bi-lateral agencies in the field of climate change and provide guidance for aligning their climate actions with national priorities
ICP will be a useful preparatory tool for future government climate policies
Investors are increasingly demanding comprehensive climate disclosures
It will stay and will be instituted more commonly
A robust carbon pricing system plays an important role in driving
GHG reductions
It complements climate policies for sustained and successful
emissions reductions
It helps make informed decisions and incentivies
low-cost abatement options
Business case for pricing carbon
29
A N N U A L R E P O R T 2 0 2 0
When disclosing on ICP the TCFD recommends that companies should disclose on the followingbull what assumptions are made about how carbon price(s)
would develop over time (within tax andor emissions trading frameworks)
bull geographic scope of implementationbull whether the carbon price would apply only at the mar-
gin or as a base costbull whether the price is applied to specific economic sec-
tors or across the whole economy and in what regionsbull whether a common carbon price is used (at multiple
points in time) or differentiated prices bull assumptions about scope and modality of a CO2 price
via tax or trading scheme
67 httpswwwgreentechmediacomarticlesreadeuropean-oil-majors-ready-to-scale-up-energy-transition-investment68 httpswwwgreenbizcomarticlebp-walks-away-three-us-trade-groups-over-carbon-pricing69 Convention on Biological Diversity ndash Markets for Carbon Offsets Accessible at httpswwwcbdintfinancialoffsetsg-offsetclimatecarbonpdf page 8
Earlier this year BP one of Europersquos oil supermajors announced a carbon price of US$100tonne of CO2 a giant increase from their previous price of US$4067 and walked away from three US-based oil and gas trade organisations - American Fuel and Petrochemical Manufacturers (AFPM) the Western States Petroleum Association (WSPA) and the Western Energy Alliance (WEA) over differences regarding policy positions on carbon pricing68
CDP has been asking companies to disclose their practice of using ICP since 2013 In 2020 23 of the investor responding companies have reported putting a price on carbon as compared to last yearrsquos 19 while the number of companies planning to price in the next two years reduced to 21 from 23 in 2019 After adding Supply Chain responding companies a total of 58 companies are pricing or are planning to price carbon in the next two years in 2020 a 12 increase from 2019 It was further seen that of the 23 companies that are pricing carbon in 2020 52 use a shadow price followed by implicit price
The Task Force defines an internal carbon price as ldquoan internally developed estimated cost of carbon emissionsrdquo which can be used as a planning tool to help identify revenue opportunities and risks as an incentive to drive energy efficiencies to reduce costs and to guide capital investment decisions69
52
26
4
9
44
Shadow price
Implicit price
Implicit price Internal fee
Internal fee
Offsets
Implicit price Shadow price
Types of ICP used by Indian companies
Pricing Planning to price in the next 2 years
2
25
2015
8
36
2016 2017
26
14
2018
14
32
2019
20
31
2020
2533
No
of C
ompa
nies
ICP trend in India
30
A N N U A L R E P O R T 2 0 2 0
Type of ICP Shadow price Carbon fee Implicit price Internal trading
Description Hypothetical cost of carbon emissions
A per-unit fee based on the amount of GHG the company emits (eg `700 per tCO2e)
Helps quantify the capital investments required to meet climate-related targets
Allows business units within a company to trade their allocated carbon credits based on respective emissions
Objectivesusage
The most common form of ICP is a shadow price helps organisations better understand the impacts of climate-related risks such as technological shifts or future regulations It can help a company with both risk management as well as internal strategic planning
It allows companies to model or test how a range of carbon prices affect their divisions capital investments and other planned projects It is similar to forecasting with a range of energy prices
Putting a fee on carbon helps create an actual pool of funds generating a revenue stream to help pave the way for greener projects and further RampD This prepares a company for a carbon-resilient world This tool has the ability to encourage a business to transform into an environmental leader It allows for the creation of internal funds to invest into energy efficiency or renewable energy projects in order to cut energy costs
It also builds awareness of the importance of emission reductions within different business units
An implicit price helps companies understand their initial carbon footprint and is also used as a benchmark to implement a more strategic internal price
Internal trading helps create awareness It allows companies to prepare for stringent forms such as shadow prices or internal fees
Method An additional criterion is introduced in investment analysis during the calculation of the internal rate of return (IRR)
The additional criterion is the carbon value which is incorporated into each investment decision and applied to resulting GHG emissions This carbon price is assumed the same way assumptions are made about exchange rates or commodity prices
It is implemented by voluntarily adding a cost to GHG emissions in relation to operational costs
It increases the operating expenses (OPEX)
There are short-term emissions reductions Transfers of actual funds within the company are done through two mechanisms First by offsetting GHG emissions by purchasing offset credits externally Second by providing internal financing for emission reduction projects low- carbon products amp services and RampD
The carbon fee also provides monetary incentives for pro-environment initiativesactivities
Some companies with emissions reduction or renewable energy targets calculate their lsquoimplicit carbon pricersquo by dividing the cost of abatement procurement by the tonnes of CO2e abated
Trading is driven by the allocation of a fixed number of carbon dioxide emission lsquoallowancesrsquo for individual business units with each allowance equivalent to 1 metric tCO2 If business units exceed their cap they must purchase additional allowances to offset their excess emissions
Where business units under-emit they may sell allowances Business units may also choose to invest in carbon offsets outside their own units in order to sell on the internal trading scheme72
A sectoral analysis of the data finds two high emissions intensive sectors cement and concrete followed by IT and software development An increasing number of companies from cement and IT sectors are now committing to the SBTi and moving towards aligning emissions in line with 15-degree an ICP in such cases can be effectively used as a tool for mitigating climate risks and achieving the greater goal of a SBT or a net-zero target It helps companies build their internal capacity and measure their progress
1313
2626
2222
1313
44 44
1818
Metal smelting refining amp forming
Cement amp concrete
IT amp software development
Biotech amp pharmaFood amp beverage
processing
Chemicals
Transportation equipment
31
A N N U A L R E P O R T 2 0 2 0
Below are the ICP disclosed by Indian companies in 2020
Company Price in INR (`) Price in USD ($) Type of ICP used
ACC 2541 3394 Implicit price Shadow price
Ambuja Cements 21639 3074 Implicit price
Dalmia Bharat Ltd 77334 11 Shadow price
Dr Reddyrsquos Laboratories 937 1332 Implicit price
Godrej Consumer Products Limited 750 10 Shadow price
Godrej Industries 740 10 Shadow price
Hero Motocorp Ltd private private private
Hindustan Zinc 111846 159 Implicit price
Infosys Limited 100182 1425 Implicit price
JSW Cement Limited 1566 21 Shadow price
JSW Steel Ltd 1400 20 Shadow price
Mahindra amp Mahindra 98242 1397 Internal fee
Mindtree Ltd private private private
Shree Cement private private private
Tata Chemicals 140607 20 Shadow price
Tata Consultancy Services 1131 1608 Implicit price Shadow price
Tata Consumer Products Ltd 315 448 Offsets
Tata Motors 980 14 Shadow price
Tata Steel 975 - 2720 15 -3868 Implicit price Shadow Price
Tech Mahindra 70303 10 Implicit price Internal fee
Ultratech Cement 750 1066 Shadow price
Wipro 352291 5011 Shadow price
Since these companies did not provide a conversion rate the average conversion rate for the 2019 calendar year was taken (1` = 0014224USD)
Managing climate risk with Internal Carbon Price and Science Based Targets
By integrating ICP into ambitions targets set by SBT companies can achieve greater emissions reduction SBTs empower companies to engage internal teams with a common data-driven goal and integrate their carbon reduction strategies with other business objectives70 A step that organisations can take to implement TCFD recommendations as well as achieve their SBTs is putting an internal price on carbon It is observed that having an internal carbon price can enhance an organisationrsquos competitiveness71 Several companies are already using ICP to highlight their progress towards targets and inform a business case for low-carbon investments Of the 25 companies that have disclosed to CDP in 2020 13 that committed to SBTi also have an ICP
Setting a carbon price can be a strong commitment towards driving change and action Clear goals for the ICP enable
70 Science-Based Targets How Aligning Carbon Reduction Targets With Climate Science Can Drive Business Growth SampP Dow Jones Indices 201771 httpswwwgreenbizcomarticlemanaging-climate-risk-carbon-pricing-and-science-based-targets72 CDP Handbook on Carbon Pricing73 httpswwwcdpnetenreportsdownloads491874 httpsb8f65cb373b1b7b15feb-c70d8ead6ced550b4d987d7c03fcdd1dsslcf3rackcdncomcmsreportsdocuments000002771originalCDP-Carbon-Pricing-Handbook
pdf1508927220
companies to make better decisions regarding the type and price of carbon72 A high-level commitment can provide a companyrsquos perspective and insight on how other companies have been able to adopt innovative financing practices such as ICP and carbon taxes which are spurred by setting ambitious targets in line with the SBT initiative
In January 2020 in partnership with TERI CDP India released a second handbook in ICP - Putting a Price on Carbon A Handbook for Indian Companies 20 73 a second edition to the handbook released in October 17 74The first handbook was prepared to lay out the landscape of carbon pricing and help companies understand about external and ICP along with guidance on how to approach an internal carbon price The aim of the second handbook was to further mobilise the adoption of internal carbon price by companies The handbook discusses steps to arrive at a price and use it in an organisation including details on indicative pricing levels
32
A N N U A L R E P O R T 2 0 2 0
ACC Ltd are using internal carbon price as a tool to drive and incentivise low-carbon initiatives and emissionenergy reduction projects We have observed that ICP helps ROI to look attractive and helps us make informed decisions
ACC Ltd has already committed and published their 2030 targets for specific CO2 emission reduction and use of waste derived resources (as a part of SD 2030 plan) We have also committed to SBTi and are working on setting stricter targets aligning with below 2 DS To achieve these commitments and relevant targets we believe that ICP may play an important role in prioritising our future actions and investments Going forward we also plan to use the ICP for managing risk and leveraging opportunities
mdash ACC Ltd
Steps to Setting an
internal carbon price
Make a commitment
Communicate your progress
Set the scope of the internal carbon price
Decide price level and variance
Monitoring and reporting
Define the type of ICP
01
02
03
0405
06
07
08
Map your objectives
Establish the degree of influence in business application
33
A N N U A L R E P O R T 2 0 2 0
THE RENEWABLE ENERGY THRUST In 2020 the 67 companies headquartered in India have reported a total of 291 Terra Watt hours (TWh) electricity consumption more than double the previous yearrsquos number Notably the significant increase in total electricity consumption is attributed to just one company ndash Vedanta Limited with 151 TWh of electricity consumption for its global operations
The total electricity consumption excluding Vedanta is 140 TWh 48 higher than the previous year The rise in the total reported electricity consumption is primarily due to an increase in the number of responding companies from the energy intensive sectors These 67 companies have consumed about 16 TWh renewable electricity which is 6 of the total electricity consumption reported in 2020 The share of renewable electricity is 11 without counting Vedanta in the sample This is 6 higher than the previous year
The growth in the share of renewable electricity consumption is due to multiple factors such as the increasing number of voluntary corporate GHG emission reduction targets renewable energy targets and compliance targets such as Renewable Energy Purchase Obligations (RPO) In 2020 18 companies from India have reported various types of renewable energy targets Some of these companies have taken more than one renewable energy target type These 18 companies have reported 98 TWh of electricity consumption of which 13 is from renewable energy sources The level
Type of renewable energy targets
Renewable Energy Targets
17
1 1 2Renewable Electricity
Consumption
Renewable Electricity
Production
Renewable Electricity Capacity
Renewable Energy Financing
Target
No
of C
ompa
nies
RE100 is the global corporate renewable energy initiative bringing together hundreds of large and ambitious businesses committed to 100 renewable electricity Led by the Climate Group and in partnership with CDP RE100rsquos mission is to accelerate change towards zero carbon grids at scale There are 4 companies headquartered in India that have committed to the RE100 initiative - Dalmia Bharat Ltd Infosys Ltd Mahindra Holidays amp Resorts India Ltd and Tata Motors Ltd
The RE100 membership continues to grow and diversify - with 42 of new members coming from the Asia-Pacific region in 2020 With 260+ members and gt278 TWh of electricity consumption aggregated electricity demand of RE100 members is higher than Australiarsquos The share of renewable electricity is 42 of total consumption showing strong progress towards 100 goal
Over 70 global RE100 members have operations in India ndash with gt2 TWh of electricity consumption in the country About 39 of electricity consumed in India came from renewable energy sources largely sourced through unbundled energy attribute certificates and power purchase agreements
Visit RE100org and follow RE100 on Twitter
34
A N N U A L R E P O R T 2 0 2 0
Note Some companies have reported renewable electricity consumption total instead of break-down details as per the sourcing method Data for those companies is not included in the above chart
131
17
03
01
Renewable Electricity Sourcing Methods (TWh)
Self-generation
Unbundled Energy Attribute Certificates (EACs)
Power Purchase Agreement (PPA)
Green Electricity Products
of ambition ie a share of renewable energy in the target year for most of the companies varies between 20-100 Showing the leadership in renewable electricity sourcing 3 companies75 have committed to source 100 renewable electricity across their operations and joined RE100 initiative
GHG emission reduction targets are popular among companies in India and 57 companies have reported absolute intensity or both absolute and intensity targets Among these 30 companies have committed to science-based targets Initiative and their targets are in line with climate science Six companies have dedicated scope 2 emission reduction targets Scope 2 emissions are indirect emissions from the generation of purchased energy consumed by the reporting company Companies with GHG emission reduction targets tend to source renewable energy to reduce their emissions primarily scope 2 emissions The Majority of these companies have taken exclusive renewable energy targets to support meeting their GHG emission reduction targets
Renewable energy plays an important role in the corporate value chain due to its zero-carbon intensity and ability to provide long-term energy security About 34 companies have identified opportunities related to shifting energy usage towards low-carbon energy sources across the value chain Of these 32 have identified opportunities in the direct operations followed by 6 companies in the upstream and 2 in the downstream of the value chain These companies have estimated energy related opportunities worth `317 billion mainly in the direct operations Half of these companies anticipate short time frame (1-5 years) to tap these
75 4 India headquartered companies are committed to the RE100 initiative 3 of them report to CDPrsquos climate questionnaire
opportunities Companies have not just identified energy related opportunities but implemented energy related initiatives in the reporting year across their operations About 31 companies have implemented low-carbon energy consumption or production related initiatives in the reporting year that resulted in an estimated annual carbon savings of 18 million tCO2 and `27 billion of annual monetary savings
Companies from the manufacturing and materials sectors have reported the highest volume -14 TWh of renewable electricity consumption Manufacturing sector companies are relatively performing better than companies from the materials sector in terms of the share of renewable energy in total electricity consumption There are 25 companies from these two sectors mainly energy intensive business such as cement metals and mining steel and transport original equipment manufacturers (OEMs) The aggregate electricity consumption of these companies is over 100 TWh The companies from the fossil fuel-based energy generation are not included in the following charts
A detailed breakdown shows that self-generation of renewable electricity is the most preferred sourcing option among companies followed by purchase of renewable electricity through unbundled Energy Attribute Certificates (EACs) and Power Purchase Agreement (PPA) with an onsiteoffsite generator Up to 10 companies have reported 03 TWh of total renewable electricity consumption via PPA (on-grid and off-grid) which has declined from 11 TWh of consumption reported in the previous year
35
A N N U A L R E P O R T 2 0 2 0
Materials Manufacturing Food beverage amp agriculture
Biotech health care amp pharma
OtherInfrastructureServices
3
17
6
35
3
20
12
Total Electricity Consumption (TWh) Total RE Consumption (TWh) RE
Electricity consumption by sector with Vedanta Limited included in the analysis
Electricity consumption by sector excluding Vedanta Limited
Materials Manufacturing Food beverage amp agriculture
Biotech health care amp pharma
OtherInfrastructureServices
7
17
35
20
1236
Total Electricity Consumption (TWh) Total RE Consumption (TWh) RE
TWh
TWh
36
A N N U A L R E P O R T 2 0 2 0
2737worth opportunities
identified
Billion
`
16of Renewable Electricity Consumption Reported
TWh
704of total [ Scope
1+2location-based] emissions reported
MtCO2e
7138Inherent financial
risk identified
Billion
`
25have Internal Carbon
Pricing
Companies 52Companies in India
SBTi
37
A N N U A L R E P O R T 2 0 2 0
WATER SECURITY The way out of water crisis
Five of the worldrsquos largest cities under water stress are in India with Delhi ranked second on the list76 The water crisis is more alarming than imagined ndash 600 million people in India face high-to-extreme water stress77 Indiarsquos water demand is projected to increase by two times the available supply by 2030 putting hundreds of million people at the risk of water scarcity and ultimately losing the country 6 of its GDP78 In 2019 the country witnessed the worst droughts in recorded history Over 500 million people were affected across the country and major cities such as Chennai experienced lsquozero dayrsquo scenarios wherein water literally ran out Since improvements in water security are essential for Indiarsquos development investing in water merits a sound business case
Though 80 of Indian states have legislations on water conservation and prevention of encroachment of water bodies79 poor data management absence of water pricing inefficient irrigation techniques and the lack of adequate sewage treatment curb the countryrsquos ability to manage water sustainably80 In recent times companies have become more aware of the risks of increased water consumption pollution and unstable precipitation aggravated by climate change81 A 2019 World Bank Report (Quality Unknown)82 warned of the economic health and environmental damage caused by contaminated water highlighting water quality as an ldquoinvisible crisisrdquo that is under-appreciated and underestimated It warned that poor water quality driven by industrial agricultural and urban pollution could lead to a reduction by 13rd of economic growth in some places
76 httpsocialnitigovinuploadssamplewater_index_report2pdf77 httpsnitigovinsitesdefaultfiles2019-06Final20Report20of20the20Research20Study20on2020
Composite20Water20Resources20Management20Index20for20Indian20States20conducted20by20Dalberg20Global20Development20Advisors20Pvt20Ltd_New20Delhipdf
78 httpsnitigovinsitesdefaultfiles2019-06Final20Report20of20the20Research20Study20on2020Composite20Water20Resources20Management20Index20for20Indian20States20conducted20by20Dalberg20Global20Development20Advisors20Pvt20Ltd_New20Delhipdf
79 httpsocialnitigovinuploadssamplewater_index_report2pdf80 httpswwwcdpnetenarticlescompaniesindias-looming-water-crisis-a-call-to-action-for-companies81 Think globally act locally new guidance for companies on sustainable water use - CDP82 httpsopenknowledgeworldbankorghandle109863224583 httpswwwwriorgaqueduct84 Aqueduct Country Ranking (wriorg)85 The objective of the campaign is to drive further corporate transparency around climate change deforestation and water
security by encouraging companies to respond to CDPrsquos disclosure request
Water stress in India remains a key challenge Aqueduct83 ranked India 13th in the world on high water stress score -- 412 out of 584 The private sector is vital to delivering a water secure future Companies in the food textile retail energy industrial chemicals pharmaceuticals and mining sectors account for and wield influence over 70 of the worldrsquos water use and pollution The decisions one takes about how to grow and expand can make or break onersquos ability to tackle the global water crisis
CDPs Water Security program requests companies to disclose critical information on water parameters which are crucial to the business It helps companies monitor and benchmark their performance on these critical parameters to ensure adequate water availability for their businesses Investors and customers are increasingly keen to know how companies respond and adapt to water-related risks The Non-Disclosure Campaign (NDC) is an annual CDP initiative where investors can target companies that have been requested to respond but failed to do so85 Globally for water security Indian companies achieved the highest response rate to the NDC campaign with 50 of engaged companies submitting a response on this critical issue ndash 28 times higher than their control group Responding through CDPrsquos Water Security questionnaire will help businesses understand the risks and opportunities associated with water-related issues
Reduction in Economic Growth caused by power water in some countries
13rd
Water stress by 2030-ratio of withdrawals to renewable supply
People will live in water stress area by 2030
Increase in water demand in last 100 years
WRI 2020
UNEP
UN World Waterdevelopment Report 2020
increase in Water Security investor responding companies in India
8756
1in 2
x6
38
A N N U A L R E P O R T 2 0 2 0
helping them capitalise on actions to safeguard water resources86 The number of disclosing companies increased from 15 last year to 28 companies this year an increase of approximately 87
Measuring Monitoring and Verification
Regular measuring and monitoring of water-related parameters across all operations and the entire value-chain is the first step in laying the path for efficient water management In 2020 28 companies measured a total of 268 water related parameters It was found that amongst volumetric water metrics water discharge was the most monitored accounting for 41 of all measurements Water withdrawals accounted for 29 of all measurements water consumption for 10 and water recycling and reuse accounted for 10 each Although these metrics were being continuously monitored and measured by companies a sector-wide analysis shows that significant growth in some water-intensive sectors has put pressure on the demand for industrial water The electric utilities sector for example reported an increased water demand of 771174 megalitres in 2020 which was the highest amongst all sectors Adani Power Ltd highlighted new aqusitions and increased power generation as major reasons for rise in water demand this year The chemicals sector showed the second highest rise in water demand this year -- 195832 megalitres this year
Some companies have shouldered the responsibility of having audits conducted on their reported water metrics for greater
86 httpsb8f65cb373b1b7b15feb-c70d8ead6ced550b4d987d7c03fcdd1dsslcf3rackcdncomcmsreportsdocuments000000893originalCDP-india-business-case-for-water-disclosurepdf1472051621
87 https6fefcbb86e61af1b2fc4-c70d8ead6ced550b4d987d7c03fcdd1dsslcf3rackcdncomcmsreportsdocuments000005312originalAnalysis_of_CA100__Data_for_CDP_Investor_Signatories_v5pdf1596046258
88 https6fefcbb86e61af1b2fc4-c70d8ead6ced550b4d987d7c03fcdd1dsslcf3rackcdncomcmsreportsdocuments000005312originalAnalysis_of_CA100__Data_for_CDP_Investor_Signatories_v5pdf1596046258
89 https6fefcbb86e61af1b2fc4-c70d8ead6ced550b4d987d7c03fcdd1dsslcf3rackcdncomcmsreportsdocuments000005312originalAnalysis_of_CA100__Data_for_CDP_
transparency and credibility Amongst the verification standards that were employed 26 of the responding organisations used ISAE 3000 with Tata Chemicals being the sole company to apply both ISAE 3000 and AA1000AS to meet assurance standards
In 2020 25 responding companies withdrew consumed and discharged 7933064 megalitres 1403171 megalitres and 6625032 megalitres of water respectively However in 2019 these figures stood at 217736 megalitres 860517 megalitres and 67686 megalitres respectively for 15 responding companies
WATER ASPECTSWater Consumptionndash the amount of water a company has drawn into its boundaries and has permanently removed from the local water cycle90
Of the 28 respondents three did not disclose water consumption data or were in their first year of measurement 9 increased their water consumption over the previous reporting year 12 decreased it and 4 reported no change
Water Withdrawalsndash the amount of water the company has temporarily removed from the local water cycle and returned as discharge water91
Of the 28 respondents three did not disclose water withdrawal data or were in their first year of measurement 7 reported an increase over the previous year 14 had lowered their withdrawal and 4 reported no change
Water Discharges ndash the amount of water that leaves a companys facility and if left untreated could be a source of pollution92
Of the 28 respondents three did not disclose water discharge data or were in their first year of measurement 9 reported an increase in water discharge over the previous year 6 lowered it and 10 reported no change CDPrsquos data highlights new acquisitions increased production activities and project expansions as the primary reasons for increased water demand amongst the companies
of companies measured all water aspects (withdrawals discharge and consumption) across 100 of facilities
64
of companies believe that availbility of good quality freshwater is vital for the success of their business39
2910
4110
10
Water withdrawalsWater recycledreused
Water discharge
Water consumption
Others
Measured and monitored water aspects
39
A N N U A L R E P O R T 2 0 2 0
Data further shows that brackish surface water and seawater were the primary water sources for industries followed by fresh surface water source The electric utilities sector was the most reliant on brackish surface water and seawater accounting for 72 of the sectorrsquos total water withdrawals At 59 fresh surface water was the primary source of withdrawal for the chemicals sector Of the 28 companies 13 had implemented water conservation measures to reduce water withdrawals from groundwater sources this year Water withdrawals from groundwater - renewable accounted for less than 05 of total withdrawals
In terms of water discharge most (81) was released into brackish surface water and seawater environments Discharges into fresh surface water accounted for the remaining 19 of the total discharges Our data suggests more companies are installing zero liquid discharge units and water harvesting techniques across their facilities leading to less groundwater discharge
Fresh surface water accounted for 29 of total water withdrawals by source in 2020 Indiarsquos major river basins - Ganges Brahmaputra Godavari Indus and Cauvery are the primary source of freshwater for the industries Around 15 of total freshwater demand from CDP responding companies was supplied by the
Investor_Signatories_v5pdf159604625890 Worldrsquos 18 Most Water-Stressed Rivers | World Resources Institute (wriorg)
Ganges and Brahmaputra river basins another 15 came from the Godavari basin followed by Cauvery Indus Banas and Sabarmati river basins The demand for water has increased over the years causing these basins to rank among the most water-stressed catchments in the world90 Of the 83 facilities in India 53 were in water-stressed regions Our data shows that around 60 of total responding companies withdrew water from water-stressed regions Of these nine were from the materials industry and two were from the food beverage amp agriculture industry
Governance and Business Strategy
For a long time corporate sustainability strategies have focused on measurable and manageable challenges such as product footprint efficiency in supply chain water conservation and others Businesses have begun to take stock of water security by innovating for improved efficiency measuring direct withdrawals assessing risk to neighbours and considering leakages
CDPrsquos data shows that corporate leaders across India are responding to this crisis by focusing on their water policy to monitor risks and opportunities and integrate it in their strategies Around 71 companies report having a documented water policy that is accessible to the public Up to 93 companies indicated that they have a board-level oversight of water related issues within the organisation observed either by the Chief Executive Officer (CEO) or the director on board followed by the board-level committee
Around 43 of the responding companies report on water-related issues quarterly and 33 more frequently This shows the increasing self-awareness among companies on water-related issues Further 63 of these companies offer some form of
facilities out of a total of 83 from the responding companies were in areas with water-stress53
Water discharge by destination
Brackish surface
water and Seawater
Fresh surface water
Groundwater
Third party
532
225
2
975
156
93
Water discharge (megalitersyear)
125
013
1
Brackish surface
water and Seawater
Groundwater ndash non
renewable
Groundwater ndash renewable
ProducedEntrained
water
Third party
Fresh surface water
231
800
261
04
405
21
489
Water withdrawals (megalitersyear)
Water withdrawals by destination
7564
662
6
No
of c
ampa
nies
Industry
1
Appa
rel
1
Biot
ech
hea
lth
care
amp p
harm
a
1
Man
ufac
turin
g
2Fo
od b
ever
age
amp ag
ricul
ture
1
Pow
er
gene
ratio
n
1
Tran
spor
tatio
n se
rvic
es
1
Serv
ices
9
Mat
eria
ls
Industry-wise water withdrawals from water-stressed areas
40
A N N U A L R E P O R T 2 0 2 0
incentive to their employees ndash monetary or otherwise -- for the management of water related issues
Businesses are stepping up and playing a vital role in developing water initiatives that can ease the stress on crucial watersheds Companies are also looking into water security related long-term business objectives and financial planning as a part of their overall business plans Almost 70 companies prefer short to mid-term (5-10 years) over long-term (11-30 years) planning This does not come as a surprise as water effects are felt locally and require more immediate strategic planning Of the 28 reporting companies 12 use climate-related scenario analysis to inform its water-related business strategy and eight anticipate doing so in the next two years A majority of these companies belong to the chemicals and the electric utilities sector
In 2019 about 13 companies were pricing their water this increased in 2020 to 18 and 50 are now exploring the its possibilities Companies such as Ambuja Cement (US$110 `7800
91 marico-sustainability-report-18pdf
Marico Ltd Establishing a strategy to improve water-security across operations and value chain
With a host of agro-based products water availability is a crucial parameter for Marico Ltd92 Under the risk management framework it has identified adverse impact of water scarcity as an environmental risk to the company To mitigate this environmental risk the company has initiated watershed management programs and a reduced-reuse-recycle model of water management across its operations Through a water stewardship program the company aims to address water security challenges in low rain-fed areas around its workplace and factories
In the reporting period FY 19-20 the company withdrew 202886 cubic meters of water and reported a reduction of 9 from previous year The company had reported a reduction of 31 in water intensity from the 2014 level through the company-wide introduction of water efficiency measures improvements in water recycling water-efficient taps and rainwater harvesting systems For improving water management practices across water stress areas Marico utilised the WRI aqueduct tool to evaluate water risk across all manufacturing facilities in India This tool helped the company identify the number of facilities that fall under the water stress area -- according to it five out of eight plants are in such zones The implementation of water conservation initiatives had helped three water-stressed sites reduce water consumption over the previous year Among three water-stressed sites Jalgaon reported 15 reduction in water consumption Baddi reported 16 and Paonta 28
Establishing a strategy to reduce and minimise water use was one of the companys key commitments Marico foresees its future water withdrawal levels reducing given its move towards improving water efficiency and incorporating recycling throughout the production cycle
Frequency of reporting on water-related issues
633
43
Annually
More frequently than quarterly
Quarterly
6
10 2Half-yearly
As important matters arise
Less frequently than annually
41
A N N U A L R E P O R T 2 0 2 0
to US$8240 `579800 per megalitre) Dr Reddyrsquos Laboratories (US$088`67 to US$591`449 per KL) Piramal Glass and Tata Steel use an internal price on water
Risks amp opportunities
Dwindling water supply is a major cause of concern for businesses since it poses significant direct and indirect impacts Visible risks such as droughts have a more explicit impact as they ruin vegetation and severely undermine the agriculture sector But subtle impacts present challenges to other sectors Water shortages also threaten the long-term viability of businesses by leading to higher costs eventually borne by the consumers Without proper management the economic repercussions of water scarcity will be felt in myriad ways92
In 2020 companies that experienced detrimental water-related impacts have incurred financial losses worth `1580 million Physical risks such as inadequate infrastructure and increased water stress account for more than half of these commercial losses followed by reputational-cum-market like subpar access to water sanitation and hygiene services and regulatory risks eg- failure to set mandatory water efficiency conservation and recycling standards Corporations should thus strategically prioritise dealing with these risks to safeguard their financial bottom lines For this organisations have looked to secure alternate sources of water supply adopt water efficiency and conservation practices as well as reuse and recycling of water
A 2018 report from NITI Aayog93 highlighted the fact that the country faced its worst water crisis that year Rising water challenges have put strong regulatory pressure on businesses in India with significant operational risks The private sector is a big contributor towards deepening water security issues but is also crucial in addressing it
Given the current situation with water resources it is perhaps unsurprising that many of the companies responding to CDP find themselves exposed to a plethora of physical and transition risks ndash that is risks from regulatory or consumer reforms aimed at addressing the water crisis These risks threaten their reputation and license to operate their supply chains security financial stability and their ability to grow As per CDPrsquos Global Water
92 httpsglobalriskinsightscom201612economic-cost-global-water-scarcity93 httpsnitigovinsitesdefaultfiles2019-06Final20Report20of20the20Research20Study20on2020Composite20Water20Resources20Management20Index20
for20Indian20States20conducted20by20Dalberg20Global20Development20Advisors20Pvt20Ltd_New20Delhipdf94 https6fefcbb86e61af1b2fc4-c70d8ead6ced550b4d987d7c03fcdd1dsslcf3rackcdncomcmsreportsdocuments000005165originalCDP_Global_Water_Report_2019
pdf159110644595 The term WASH refers to the provision of water sanitation and hygiene Universal affordable and sustainable access to WASH is a key public health issue within international
development and is the focus of the first two targets of Sustainable Development Goal 6 (SDG 6)96 httpswwwworldbankorgentopicwaterbriefwash-water-sanitation-hygiene-and-covid-19
Report 201994 the combined business value at risk reported in 2019 topped out at US$425 billion with about 40 of the risks anticipated to hit within the next 1-3 years Whether it was the blockading of a Newmont Goldcorp mine in Mexico or poor water quality threatening the production of Unileverrsquos Hellmannrsquos mayonnaise in the Mississippi River Basin the impacts of the global water crisis are already being felt
Water risks and risk assessment
As per the 2020 data 71 of the responding companies consider current or future water-related regulations as a risk to business followed by 57 companies that consider access to WASH95 services for employees as very relevant and always included in their water-risk assessments This shows that companies are vigilant about providing safe access to drinking water sanitation arrangements and proper hygiene at workplace The COVID-19 pandemic has highlighted the importance of WASH to human health and well-being Safely managed WASH services along with good hygiene practices can help prevent infectious diseases that kill millions each year96 In addition 50 companies reported that water used for their key commoditiesraw materials is relevant enough to be considered for their risk-assessment This was the most pertinent for chemical sector companies
of the 28 Indian responding companies undertake water-related risk assessment25
Total financial loss by reporting companies as per risk type
38
53
9
Reputation and Market Risk
Physical Risk
Regulatory Risk
1580 MILLION
In 2020 companies that experienced detrimental water-related impacts have incurred financial losses worth
1580 million
42
A N N U A L R E P O R T 2 0 2 0
It is crucial to consider stakeholders in risk assessment procedures for a comprehensive understanding of water-related risks Of the 25 companies that undertake water-related risk
97 httpswwwweforumorgreportsthe-global-risks-report-2020
assessments 68 always include employees in their internal assessment procedures by conducting training and awareness programs on water conversation initiatives communicating water-related policies etc This is followed by regulators and local communities who are relevant in water-risk assessment procedures at 61 and 54 respectively for the responding companies It is a positive sign that Indian companies are engaging with their employees and local communities and ensuring that the latter are not negatively impacted in terms of habitation health and water availability
According to The World Economic Forumrsquos Global Risk Report 202097 water crises are among the top five risks in terms of impact for the past ten consecutive years Water-related risks are substantive in the risk assessment processes and identified as a threat to companiesrsquo bottom line putting at risk a combined business value of US$425 billion according to CDP 2019 data
RegulatoryPhysical
Reputational
Risk due to company
Risk due to context
Expectedunexpected change or uncertainty in law or regulation
Water scarcity too much water water
unfit for use
Litigation product risks due to changes in
consumer behavior
Caused by inefficient operations produces and services resulting in water pollution over exploitation etc
Caused by changing environmental and social conditions like droughts
flooding etc
Relevancy of water-related risks
7157 57 50 46 46 43
11
Water-related
regulatory frameworks
Access to fully-
functioning safely
managed WASH
services for all employees
Water availability at a basincatchment
level
Implications of water on
your key commoditiesraw materials
Stakeholder conflicts
concerning water
resources at a basincatchment
level
Water quality at a basin
catchment level
Status of ecosystems and habitats
Other contextual
issues please specify
Empl
oyee
s
Regu
lato
rs
Loca
l com
mun
ities
Rive
r bas
in m
anag
emen
t au
thor
ities
Wat
er u
tiliti
es a
t a lo
cal l
evel
Stat
utor
y sp
ecia
l int
eres
t gr
oups
at a
loca
l lev
el
Inve
stor
s
Supp
liers
Oth
er w
ater
use
rs a
t a
basi
nca
tchm
ent l
evel
Oth
er
NG
Os
Cust
omer
s
No of Companies age of Companies
Relevancy of stakeholders in water-risk assessment
6861 54 50 50 46 46 39 36 32 2918
43
A N N U A L R E P O R T 2 0 2 0
Water risk event
Impacting business
Increased Operational amp maintenance Costs Increased Compliance amp
Administration Costs
Closure of Operations
Supply chain distributions
Brand Damage and LitigationsShareholder
Distributions
Risk transferRisk avoidance and mitigation
Technological Risks
Repurational amp Market Risks
Regulatory Risks
Physical Risks
Financial ImpactsResidual Water RiskInherent Water Risks
Increased water stress
143721Increased water scarcity
41105Drought
17604Inadequate infrastructure
820
Physical Risks
Ecosystem vulnerability
300Severe weather events
69Declining water quality
63Flooding
13
Regulatory Risks
Technology Risks
Higher water prices Transition to
water intensive low carbon energy sources
Tighter regulatory standards
2333
120
All the figures reported are in million rupees
44
A N N U A L R E P O R T 2 0 2 0
CDPrsquos data shows that physical risks seem to have the highest magnitude of impact on the Indian responding companies Drought is seen to be the primary driver of potential substantive impact
Where there is risk there is opportunity
Where therersquos risk therersquos reward Industrial wastewater for example is a vast untapped resource It is a potential source of heat power process water and high-value materials And there has never been a better time for this transformation to take place -- technologies are better the regulatory climate is favourable and the business case is clear Meanwhile the market demand for pollution-free products is growing For companies to thrive they will need to be aligned to changing consumer demands If
98 httpswwwmarketsandmarketscomMarket-Reportssmart-water-management-market-1265html
they respond to these opportunities then market differentiation resilience and profitability are on the table
Globally corporate leaders have started realising the untapped potential of smart water technology and the market for smart water management is anticipated to grow from US$846 billion in 2016 to US$2010 billion in 202198 Industrial wastewater has for a long time been reused for cooling towers steel works oil refineries textile manufacturing and paper production It was found that 15 of the 23 companies valued improved water efficiency in operations as their primary opportunity having a substantive financial or strategic impact on business
of the 28 responding companies (approx 93) identified water-related opportunities in their business26
Improved water efficiency in operations
Increased resilience to impacts of climate change
Reduced impact of product use on water resources
Improved community relations
Water recovery from sewage management
Resilience to future regulatory changes
Sales of new productsservices Increased brand value
3000million
`4000
million18752
million
opportunities were identified by 21 respondents
opportunities were identified by 11 respondents
opportunities were identified
by 9 respondents
opportunities were identified
by 4 respondents
Efficiency Resilience Products and services
Markets
22
14
10
4
`329
million
`
`
45
A N N U A L R E P O R T 2 0 2 0
26
17
14
17
2
Others
Recyclingreuse
Consumption
Product water intensity
Discharge
14
10Withdrawals
Water use efficiency
Categories of water targets monitored at the corporate level
of companies set company-wide water targets
of companies set company-wide water goals
5556
Businesses have identified transparency in water management issues as a fundamental activity and disclosure through CDPrsquos annual water questionnaire produces a standard comparable dataset McGill University and Millani found that companies disclosed through CDP ranked 19 percentiles better than the average business in their ability to access capital99 The research showed that a comprehensive voluntary disclosure produces a quality management team with enhanced awareness of threats and opportunities linked to climate and environmental change
Targets and Goals100
In response to declining water resources many companies have started engaging in water stewardship and setting water targets aligned with SDG Goal 6 to ensure availability and sustainable management of water sanitation and hygiene facilities for all101 Developing water-related targets helps companies make meaningful change from informed actions at the local level102 In 2020 four companies did not set water-related targets within their operations Whereas 24 companies had water-related targets 26 of them had set targets for product water intensity 17 set recyclingreuse targets and 14 focused on water use efficiency
Companies can set goals and targets on a range of operational issues to drive performance andor manage risks and opportunities CDPrsquos data shows that a majority had set targets at the company-wide level -- 55 of responding companies reported setting water targets across the company This was followed by 26 who set water targets at the business level and 19 at the site or facility level While setting water goals around 56 of companies monitored their goals at the company level 24 at the sitefacility level and the remaining at the basin business or country-level
99 Craig M Coulombe E Nostrat A 2019 The Role of CDP Disclosure to Improve Access to Capital Research Note httpsf01c8ee6-cac3-40ff-a0e4-8bfb54f2b88bfilesusrcomugd66e92b_30b06fd11b9c43d88428f768676e9a8bpdf
100 Targets ndash quantitative Goals - qualitative101 httpsunstatsunorgsdgsreport2020goal-06102 httpsceowatermandateorgsite-targets-guide
A company has various drivers for setting goals and targets and it tries to align these with increased stakeholder concerns and environmental legislation Data shows that most organisations considered reducing environmental impact and risk mitigation as the primary motivation for monitoring water goals and targets Organisations also considered brand value protection as one of the important factor while setting goals
24
4
Target Set No Target
No
of C
ompa
nies
Water targets monitored at the corporate level
46
A N N U A L R E P O R T 2 0 2 0
Drivers behind setting water targets and goals at the corporate level
Reduced environmental impact
Water stewardship
Risk mitigation
Recommended sector best practice
Corporate social responsibility
Brand value protection
Cost savings
Shared value
Climate change adaptation amp mitigation strategiess
Commitment to the UN SDG
Increase freshwater availability for users
Other drivers
45
14
14
2
2
2
5
14
16
12
161212
12
4
4
4
44
GoalsTargets
age of Companies
47
A N N U A L R E P O R T 2 0 2 0
PROTECTING OUR FOREST WEALTH
The world lost an estimated 10 million hectares of forest annually between 2015 and 2020104 Protecting and restoring forests and other natural ecosystems could provide up to 30 of climate change mitigation action needed to limit global warming to below 20C by 2030105
Global demand for agricultural commodities is the primary driver of deforestation and ecosystem conversion -- timber is extracted unsustainably and land is cleared for agricultural production This represents major risks to businesses as commodities associated with deforestation such as palm oil soy cattle and timber products are the building blocks of millions of products traded globally and therefore feature in the supply chains of numerous organisations
103 httpswwwipccchsrccl104 The State of the Worldrsquos Forests 2020 Forests biodiversity and people105 httpswwwpnasorgcontent1144411645106 httpsappsfasusdagovnewgainapiapiReportDownloadReportByFileNamefileName=Oilseeds20and20
Products20Annual_New20Delhi_India_04-01-2020
The unsustainable production and supply of these commodities and activities not only poses a significant business risk but also has a severe negative impact on the environment especially the climate crisis
Deforestation is fundamentally linked to climate change According to the IPCC Special Report on Climate Change and Land (2019)103 11 of global GHG emissions are from deforestation and from the conversion of natural ecosystems for human use
At an 8 annual growth rate edible oil consumption in India is growing faster than the 3 growth rate in production Imports and imports are rising to fill the gap As a result India still is the largest importer of edible oils followed by China European Union and the United States Indiarsquos edible oil imports in MY 202021 are predicted to rise 6 to 15 MMT of this 85 MMT will be palm oil 35 MMT soybean 28 MMT sunflower seed oil and 02 MMT rapeseed (canola) oil
-United States Department of Agriculture106
In 2020 three Indian companies responded to CDPrsquos forests questionnaire -- one responded to the request for disclosure from investors while two responded to their customers Globally 687 companies responded to CDPrsquos forests questionnaire and 57 of them evaluated deforestation-related risks at US$5312 billion
13The mitigation potential of reduced deforestation is
13 of the global emissions
We cant address climate change without protecting our forests
They are vital carbon stores that help reduce global warming
48
A N N U A L R E P O R T 2 0 2 0
Disclosure on deforestation management through CDP could be a significant opportunity for companies operating in India one of the largest importers of palm oil in the world This can help Indian companies tap into lucrative opportunities by scaling sustainable trends CDPrsquos forests questionnaire allows companies that produce source or use palm oil soy timber cattle cocoa coffee and rubber to disclose Moreover new biodiversity-focused metals amp mining and coal sector questionnaires were introduced in 2019
Palm oil is the most commonly used processed oil in industrial food production with its production being responsible for 5 of global tropical deforestation107 Indiarsquos palm oil imports account for nearly 23rd of its total imports of edible oil This demand was shaken in 2020 when the pandemic hit with a 40 fall in the consumption of palm oil during the lockdown108 Indiarsquos imports which account for nearly 20 of the global trade in palm oil will have a major effect on efforts to make its production and processing sustainable The primary barrier for sustainable palm oil consumption in
India stems from it belonging to a more price-sensitive and volume driven market making environmental impacts a low or non- existent priority in the minds of consumers
Climate change can reduce palm oil production and with demand outstripping supply prices could rise The Roundtable on Sustainable Palm Oil (RSPO) has developed a set of environmental and social criteria which companies must comply with in order to produce Certified Sustainable Palm Oil (CSPO) When properly applied these criteria can help in minimising the negative impacts of palm oil cultivation
107 Deforestation amp Palm Oil 108 As worldrsquos largest importer of palm oil India has a duty to push for ethical production practices109 httpsseaofindiacominterim-data-on-import-of-edible-oils-march-2020-down-by-32-percent-nov19-to-mar20-down-by-10-percent110 httpsappsfasusdagovnewgainapiapiReportDownloadReportByFileNamefileName=Oilseeds20and20Products20Annual_New20Delhi_India_04-01-2020111 httpsresourcetradeearthyear=2018ampexporter=76ampimporter=699ampcategory=87ampunits=value112 httpswwwrvonlsitesdefaultfiles201705poultry-sector-in-india-2017pdf113 httpsresourcetradeearthpublicationscocoa-trade-climate-change-and-deforestation
The Sustainable Palm Oil Coalition for India (I-SPOC) was formed to promote the uptake of sustainable palm oil and its derivatives in India CDP amongst others has joined it as a member
Soy cultivation is the second largest soft commodity driver of tropical deforestation after cattle products Various aspects of soy production generate GHGs that contribute to climate change India imports around 33 lakh tons of soybean oil109 According to data from the US Department of Agriculture India
is set to import 35 lakh metric ton of soybean oil in 20202021110 In addition India is also responsible for clearing huge spaces of forest land in Brazil that contributed to 23 of soybean imports to India in 2018111 Soy is also used as fodder for livestock and a growing local demand for poultry products will further affect Indiarsquos position on deforestation The country ranks amongst the top four producers of egg and chicken in the world and it is increasingly exporting to the Middle East and Europe112
Cocoa has been a notable agent of deforestation since the last century The global production of cocoa has increased from 34 million to 45 million tonnes between 2000 and 2014 while the land use footprint of its plantations rose by 37 to 257 million acres113 About 90 of
cocoa is produced by 7 countries -- Ivory Coast Ghana Indonesia Ecuador Cameroon Brazil and Nigeria The dearth of incentives for improving the plantations combine with high investment costs to make cocoa a low yield crop forcing farmers to resort to clearing untouched forest lands in order to meet the growing demand and
lsquoPalm oil consumption dropped by
in 2020 in India due to COVID-19rsquo
40
Climate-Water-Forest nexus
Water is an essential component of mitigation and adaptation strategies
Rising temperatures and changing weather patterns increase stress on water availability
Tropical forests provide substantial emission reductions by acting as carbon sinks
Droughts resulting from rising temperatures and changes in weather patterns increase the risk of forests fires
A major portion of gobal freshwater depends on forests
49
A N N U A L R E P O R T 2 0 2 0
for cutting down production costs114 In Southern India Cocoa is mainly grown as an intercrop in conjunction with coconut areca nut oil and rubber plantations Indiarsquos consumption in 2015-16 was 30000 tonnes of which 57 was imported while the domestic production rose at an annual rate of 37 in the same period115 Failure to protect forests in the event of a sharp cocoa price increase will lead to unsustainable levels of deforestation116
The US$10 billion coffee industry too leaves a gargantuan ecological footprint It is estimated that every cup of coffee consumed results in the loss of one square inch of forest cover117 Each year around 250000 acres of land is cleared for coffee which is unsustainable The Kodagu district
in the Western Ghats of India is a major biodiversity hotspot which produces about one-third of the countryrsquos coffee This region has more than 270 tree species which are all under significant ecological stress due to the coffee farms that threaten land use and land cover while potentially leading to the felling of about 21000 trees118
An estimated 8-10 of global production of low-cost timber products comes from illegal logging in forests To meet the burgeoning demand of timber produce about 25 million acres of land is converted to fast-
wood forests (timber plantations) across the world annually and this hampers the ecosystem services that nature provides us119 With the World Bank forecasting that the global market for wood is set to quadruple by 2050120 reducing timberrsquos environmental footprint is vital for the industryrsquos success In India there is no provision of a central data pool that maintains records of production and consumption of timber There is a need to address this inconsistency in reporting and data collection by forging a comprehensive strategic policy and providing institutional support121 This would ensure effective collaboration among all stakeholders that would result not only in the production of quality forest products but also a sustainable timber sector
114 httpsresourcetradeearthpublicationscocoa-trade-climate-change-and-deforestation~text=As20cocoa20tends20to20beforest20loss20over20this20time115 httpseconomictimesindiatimescomindustrycons-productsfoodalthough-indias-consumption-of-chocolate-is-steadily-growing-but-we-still-depend-on-imports-for-116 httpsnationalzoosieduscbimigratorybirdsresearchcacaorufcfm117 httpsohiostatepressbookspubsciencebiteschaptera-bitter-brew-coffee-production-deforestation-soil-erosion-and-water-contamination~text=For20every20cup20of20
coffeeinch20of20rainforest20was20destroyedamptext=Chemical20buildup20in20soils20andsoil20eroding2C20and20land20degradation118 httpswebcachegoogleusercontentcomsearchq=cacheYhaeYHVPWasJhttpswwwmdpicom1999-4907114480pdf+ampcd=6amphl=enampct=clnkampgl=in119 httpsresourcetradeearthyear=2018ampexporter=76ampimporter=699ampcategory=87ampunits=value120 httpdocuments1worldbankorgcurateden240231467291388831pdf106467-REVISED-v1-PUBLICpdf121 httpsonlinelibrarywileycomdoifull1011111477-894712094122 httpsglobalforestatlasyaleeduamazonland-usecattle-ranching123 httpsresourcetradeearthyear=2018ampimporter=699ampcategory=779ampunits=value124 httpsresourcetradeearthyear=2018ampimporter=699ampcategory=779ampunits=value125 httplargestanfordeducourses2018ph240halper1~text=Every20half20hour2C20a20cowmore20potent20than20carbon20dioxideamptext=There20is20
rampant20deforestation2C20especiallyto20make20room20for20cattle126 httpswwwinvestopediacomarticlesinvesting0929155-countries-produce-most-carbon-dioxide-co2asp127 httpwwwcwejournalorgvol9no3do-extensive-rubber-plantation-influences-local-environment-a-case-study-from-tripura-northeast-india128 httpswwwibeforgdownloadRubber_Plastics_220708pdf
Beef production remains by far the largest driver of deforestation in the worldrsquos tropical forests as forest land cleared for cattle is more than twice the combined area required for producing soy palm oil and wooden products The problem of cattle ranching
is particularly profound in the Amazon region the largest forest reserve in the world leading to 80 of present deforestation rates122 Clearing land for grazing causes irreversible habitat loss soil degradation and conflict between humans and wild animals India imports 15 and 12 of bovine leather from Turkey and Brazil respectively which poses a great threat to the forest areas of these countries123 It also jeopardises the earnings of the Indian companies manufacturing such products for its European consumers who have a high degree of sensitivity and awareness around deforestation124 In a larger context the impact of cattle stretches far beyond the realm of forests and is one of the key reasons for rising global emissions and climate change There are more than 15 billion cows on Earth with each of them capable of expelling 17 times more GHG emissions than cars in the form of methane burps a gas several times more potent than CO2 in terms of trapping heat It is therefore not surprising that cattle accounts for a colossal 18 in atmospheric carbon emissions125 To put this in perspective this surpasses emissions of the third largest CO2 emitter India which accounts for a 7 share in worldwide emissions126
Another commodity whose production has significant impact on the environment is rubber Environmentalists have warned for years that the rapid expansion of rubber plantations would come at the expense of natural forests Rubber has
not been subjected to extensive publicity in a way that palm oil soy and paper have been over the years given their impact on the environmentmdashpublicity that has led to adoption of robust sustainability criteria for these commodities Indiarsquos natural rubber plantation spans across an area of 183 million acres as of 2012 with the raw material being used as an input for making 35000 finished products of industrial importance127 Currently the impact assessment of large-scale rubber plantations on the environment is non-existent in the country a worrying sign considering Indiarsquos position as the 4th largest consumer in the world128
50
A N N U A L R E P O R T 2 0 2 0
Fossil-fuel and mineral mining accounts for 7 of global deforestation Moreover it not only presents a threat to forest cover and resource extraction but also leads to long-term impacts such as soil and water pollution infrastructure development and
increased anthropogenic activity129 While the effects of large-scale mining are easier to quantify as they are well regulated and undertake environmental impact assessments it is the scope and impact of artisanal and small-scale mining (ASM) that goes under the radar due to lack of data and a high degree of informality in the sector In India this problem warrants special attention since over 12 million people are engaged in the ASM business with women and girls from backward communities and those living below the poverty line being its primary employees130 A landscape-level approach is critical not only to identify and monitor the environmental and social impacts of individual mining projects but also to consider its interactions with other land uses as well given the crucial role forests play in balancing the ecosystem131 Indiarsquos investor requested company Hindustan Zinc Ltd was the first to disclose this year under the mining sector
129 httpsglobalforestatlasyaleeduland-usemining-extraction130 httpswwwpactworldorgstate20of20asm131 httpswwwresearchgatenetpublication38084575_Landscape_approach_for_quantifying_land_use_land_cover_change_1972-2006_and_habitat_diversity_in_a_mining_area_in_
Central_India_Bokaro_Jharkhand
Hindustan Zinc Pioneering forest and biodiversity conservation in the mining sectorHindustan Zinc Limited is the first investor-requested company in India to respond to CDPrsquos Forests questionnaire It demonstrated that a dedicated Biodiversity Policy and Management Standard is its compass in reducing flora and fauna disruption and in minimising or compensating its impact of operation through project scoping site closure and beyond
Companies in India currently lag behind their regional peers in terms of disclosure on deforestation management with only 3 companies disclosing on this topic in 2020
40
65
22
3China Japan IndiaSEA
(Indonesia Malaysia
Phillipines Singapore Vietnam)
Total no of companies disclosing through CDPs Forests questionnaire in 2020 by HQ countryregion
51
A N N U A L R E P O R T 2 0 2 0
Nagpur
Udaipur
Panaji
Kochi
Rajkot
Vadodara
Delhi
Dehradun
Ahmedabad
Thane
Chennai
Tiruchirappalli Coimbatore
Bangalore
Kolkata
Gangtok
Siliguri
India Snapshot
CITIES STATES AND REGIONS
Cities
In 2020 over 800 cities disclosed their environmental information through CDP including 16 Indian cities The number of cities in India disclosing through the CDP-ICLEI Unified Reporting System increased from 13 in 2019 to 17 This was largely due to citiesrsquo ongoing commitments to climate leadership initiatives such as the C40 Cities Climate Leadership Group (C40) the Global Covenant of Mayors for Climate and Energy (GCoM) and our partnership with ICLEI whose South Asia Regional Office also acts as the GCoM South Asia Helpdesk
88 global cities reached CDPrsquos A list which include Bristol (UK) Miami (USA) Cape Town (South Africa) Buenos Aires (Argentina) and Auckland (New Zealand)
despite the COVID-19 pandemic The USA accounts for the highest number
(25) of cities on the A List making up 28 despite the US pulling out of
the Paris Agreement In India more than half the cities in disclosed
that
they either have sustainability targets incorporated into the master planning of the city or it is in progress while only 43 of the cities have a published plan that addresses climate change adaptation Approximately half of the disclosing Indian cities have identified opportunities as a result of addressing climate change and one-third of them have a GHG emission reduction target which is a strong indication towards a low carbon development pathway
States and Regions
In 2020 the Union Territories of Delhi and Jammu amp Kashmir along with over 120 states and regions from across the world disclosed their environmental impacts through CDP Globally 90 of states and regions reporting a 2030 target have one in line with the IPCCrsquos goal to reduce global greenhouse gas emissions by 40-50 from 2010 levels by 2030 and 55 of states and regions with a 2030 emissions reduction
target are showing greater ambition than their national
counterparts
Indian cities and 16
Indian states disclosed to CDP
2
52
A N N U A L R E P O R T 2 0 2 0
ANNEXURESAppendix I Table of emissions scores and sector by company
Sector Company Name 2020 permission Status
Final score 2020
Scope 1 Scope 2 Scope 3 Number of categories reported in Scope 3
Bars hotels amp restaurants
Indian Hotels Co Ltd
public C 50610 239568 23824 3
Biotech amp pharma Biocon public C 41948 133110 Not Provided
Dr Reddyrsquos Laboratories
public B 247317 154836 1272548 8
ZCL Chemicals public D- Not Provided Not Provided Not Provided
Cement amp concrete ACC public B 16966585 643870 648068 3
Ambuja Cements public B 14523738 551219 1973622 7
Dalmia Bharat Ltd
public B 11280051 537968 1320736048 9
JK Cement non public D Private Private Private Private
JSW Cement Limited
public B- 1398609 647870 572488 4
Shree Cement non public C Private Private Private Private
Ultratech Cement
public B 47954830 1327185 5376354 4
Chemicals Aarav Frances amp Flavors Private
Limited
public Not Scored
GHCL LIMITED public D 109470536 496707 Not Provided
Godrej Industries public B 32311 44361 6735893 3
Gujarat Fluorochemicals
non public C Private Private Private Private
Jubilant Life Sciences Ltd
non public C Private Private Private Private
Kansai Nerolac Paints Limited
non public Not Scored Private Private Private Private
Tata Chemicals public B 444988061 4505956 12162395 5
UPL Limited non public Private Private Private Private Private
Godrej Consumer
Products Limited
public A- 33980 30848 26433 2
Note Due to increase in sample size more samples were considered for this report These samples include companies from the BSE Top 200 list CDPrsquos Fixed Income sample FAIRR sample Emerging markets sample Environmental sample and Continuity climate change sampleFor further details visit https6fefcbb86e61af1b2fc4-c70d8ead6ced550b4d987d7c03fcdd1dsslcf3rackcdncomcomfycmsfilesfiles000003423originalCDP_Climate_Change_Sample_Investor_Request_2020pdfNot Scored- Companies who have submitted the minimum version questionnaire
53
A N N U A L R E P O R T 2 0 2 0
Sector Company Name 2020 permission Status
Final score 2020
Scope 1 Scope 2 Scope 3 Number of categories reported in Scope 3
Energy utility networks
Adani Transmission
Ltd
public D 31870076 21155 9379637 3
GAIL public C 4925087 387358 1071 1
Financial services Axis Bank public B 6250 168043 4414712 3
HDFC Bank Ltd public B 764919 390176 1642453 3
Indusind Bank public A 88316 6278567 1277912 3
Kotak Mahindra Bank
public C 9078 69780 4290177 3
LampT Finance Holdings Limited
non public Private Private Private Private Private
State Bank of India
public B- 390 1066386 257902 5
YES BANK Limited
public A- 344515 3099369 4859625 3
Agricultural commodities
Tata Consumer Products Ltd
public A- 11731 34238 3348672939 10
Marico public A- 1380 12140 499568 9
Intermodal transport amp logistics
Adani Ports amp Special
Economic Zone
public B- 95905791 176946845 202567171 3
IT amp software development
HCL Technologies
non public Private Private Private Private Private
Infosys Limited public A- 15344 124063 371602 6
Larsen amp Toubro Infotech Ltd
public B 39485 2521874 1908034 2
Mindtree Ltd non public A- Private Private Private Private
Tata Consultancy
Services
public A- 26714 811815 702615 7
Tech Mahindra public A 1803807 105736586 39285212 5
Wipro public A- 13366 124564 421527 7
Land amp property ownership amp development
Godrej Properties Limited
public Not Scored 4400 2429 422
Mahindra Lifespace
Developers Limited
public B 397 2675 589525 8
Light manufacturing APOLLO TYRES LTD
public Not Scored 24207 60717 Not Provided
JK Tyres amp Industries
public C 158568 88424 Not Provided
54
A N N U A L R E P O R T 2 0 2 0
Sector Company Name 2020 permission Status
Final score 2020
Scope 1 Scope 2 Scope 3 Number of categories reported in Scope 3
Media telecommunications amp data center services
Bharti Airtel non public D Private Private Private Private
Reliance Jio Infocomm
Limited
public B 105018 1826762 243195034 3
Tata Communications
public A- 6376 108482 6938 3
Metal smelting refining amp forming
Hindustan Zinc public A 4480887 253756 4182181 10
Vedanta Ltd public B- 57482869 1864711 Not Provided
JSW Steel Ltd public A- 40045307 476901 4168823 8
Tata Steel public A- 60116322 5687999 14970000 12
Metallic mineral mining
NMDC public D 29004 63671 1957 1
Oil amp gas processing Bharat Petroleum
Corporation
public B 5023580 366230 729820 2
Indian Oil Corporation
public D 18690000 54700 Not Provided
Renewable power generation
Adani Green Energy
public D 841 13313 1174 1
Azure Power public Private 323 2767
Specialized professional services
Mahindra amp Mahindra Financial Services
public B 3370 18847 22922 3
Piramal Enterprises
public C 4430568 8692844 Not Provided
Vakrangee Softwares Ltd
public B 2053355 35409 Not Provided
Textiles amp fabric goods
ARVIND Ltd public B- 3514561 238894 Not Provided
Thermal power generation
Adani Power Ltd public D 58970705 14607 6910800 1
JSW Energy public B 17200521 36117 61151 2
NTPC Ltd public D 252495018 15845 978052 3
Tata Power Co public C 34952981 22051 1226 1
Tobacco ITC Limited public B- 1241718 230192 206064 5
Transportation equipment
Hero Motocorp Ltd
non public D Private Private Private Private
Mahindra amp Mahindra
public A 40654 414552 58425531 11
Tata Motors public A- 60533 266200 3140861 8
55
A N N U A L R E P O R T 2 0 2 0
Climate Change ndash Investor requested companies132
CDP Activity Group Company name Response Status
Air transport InterGlobe Aviation Ltd Not submitted
Jet Airways (India) Ltd Not submitted
Apparel design Page Industries Ltd Not submitted
Bars hotels amp restaurants
Indian Hotels Co Ltd Submitted
Jubilant Foodworks Ltd Not submitted
Biotech amp pharma Abbott India Ltd See Another
Ajanta Pharma Ltd Not submitted
Alkem Laboratories Ltd Not submitted
Aurobindo Pharma Not submitted
Biocon Submitted
Cadila Healthcare Not submitted
Cipla Not submitted
Divirsquos Laboratories Not submitted
Dr Reddyrsquos Laboratories
Submitted
Glenmark Pharmaceuticals
Not submitted
Lupin Not submitted
Natco Pharma Ltd Not submitted
Pfizer Ltd See Another
Sun Pharma Advanced Research Company Ltd
Not submitted
Sun Pharmaceutical Industries
Not submitted
Torrent Pharmaceuticals
Not submitted
Cement amp concrete ACC Submitted
Ambuja Cements Submitted
Dalmia Bharat Ltd Submitted
India Cements Not submitted
JK Cement Ltd Submitted
Orient Cement Limited Not submitted
Shree Cement Submitted
The Ramco Cements Ltd
Not submitted
Ultratech Cement Submitted
132 These include companies from the BSE Top 200 list CDPrsquos Fixed Income sample FAIRR sample Emerging markets sample Environmental sample and Continuity climate change sample For further details visit https6fefcbb86e61af1b2fc4-c70d8ead6ced550b4d987d7c03fcdd1dsslcf3rackcdncomcomfycmsfilesfiles000003423originalCDP_Climate_Change_Sample_Investor_Request_2020pdf
See Another -The response is covered by another CDP reporting company usually the parent company
CDP Activity Group Company name Response Status
Chemicals Asian Paints Not submitted
Berger Paints India Ltd Not submitted
Castrol India Not submitted
Colgate Palmolive India See Another
Coromandel International
Not submitted
Dabur India Not submitted
Emami Ltd Not submitted
Godrej Consumer Products Limited
Submitted
Godrej Industries Submitted
GRAPHITE INDIA LTD Not submitted
HEG LTD Not submitted
Jubilant Life Sciences Ltd
Submitted
Kansai Nerolac Paints Limited
Submitted
PI Industries Ltd Not submitted
Pidilite Industries Ltd Not submitted
Procter amp Gamble Hygiene amp Health Care Ltd
See Another
SRF Ltd Not submitted
Supreme Industries Ltd Not submitted
Tata Chemicals Submitted
UPL Limited Submitted
Coal mining Adani Enterprises Not submitted
Coal India Not submitted
Gujarat Mineral Devp Corpn
Not submitted
Commercial amp consumer services
Quess Corp Ltd Not submitted
Construction Bharti Infratel Limited Not submitted
GVK Power amp Infrastructure
Not submitted
Honeywell Automation India Ltd
See Another
Larsen amp Toubro Not submitted
Voltas Not submitted
Appendix II List of companies invited to respond to CDP
56
A N N U A L R E P O R T 2 0 2 0
CDP Activity Group Company name Response Status
Financial services Gruh Finance Ltd Not submitted
HDFC Asset Management
Not submitted
HDFC Bank Ltd Submitted
HDFC Life Insurance Company Ltd
Not submitted
Housing Development Finance Corporation
Not submitted
ICICI Bank Limited Not submitted
ICICI Lombard General Insurance Company Ltd
Not submitted
ICICI Prudential Life Insurance Company Ltd
Not submitted
IDBI Bank Ltd Not submitted
IDFC First Bank Ltd Not submitted
Indiabulls Housing Finance Ltd
Not submitted
Indiabulls Ventures Ltd Not submitted
Indian Bank Not submitted
Indusind Bank Submitted
Kotak Mahindra Bank Submitted
LampT Finance Holdings Limited
Submitted
LIC Housing Finance Not submitted
Max Financial Services Not submitted
Motilal Oswal Financial Services Ltd
Not submitted
Muthoot Finance Limited
Not submitted
PNB Housing Finance Ltd
Not submitted
Power Finance Corporation
Not submitted
Punjab National Bank Not submitted
RBL Bank Ltd Not submitted
REC Ltd Not submitted
Reliance Nippon Life Asset Management Ltd
Not submitted
SBI Life Insurance Company Ltd
Not submitted
Shriram Transport Finance Co
Not submitted
State Bank of India Submitted
Union Bank of India Not submitted
YES BANK Limited Submitted
CDP Activity Group Company name Response Status
Convenience retail Avenue Supermarts Ltd Not submitted
Discretionary retail Aditya Birla Fashion and Retail Ltd
Not submitted
Future Retail Ltd Not submitted
Electrical amp electronic equipment
Amara Raja Batteries Ltd
Not submitted
Bharat Electronics Not submitted
Crompton Greaves Consumer Electricals Ltd
Not submitted
Exide Industries Not submitted
Havells India Not submitted
Motherson Sumi Systems
Not submitted
Whirlpool of India Ltd See Another
Energy utility networks
Adani Gas Ltd Not submitted
Adani Transmission Ltd Submitted
CESC Ltd Not submitted
GAIL Submitted
Indraprastha Gas Ltd Not submitted
Power Grid Corpn of India
Not submitted
Reliance Infrastructure Not submitted
Torrent Power Not submitted
Financial services AU Small Finance Bank Ltd
Not submitted
Axis Bank Submitted
Bajaj Finance Limited Not submitted
Bajaj Finserv Not submitted
Bajaj Holdings amp Invst (BHIL)
Not submitted
Bandhan Bank Not submitted
Bank of Baroda Not submitted
Bank of India Not submitted
Canara Bank Not submitted
Cholamandalam Investment and Finance Co Ltd
Not submitted
Cholamandalam Investment and Finance Company Ltd
Not submitted
City Union Bank Ltd Not submitted
Edelweiss Financial Services Ltd
Not submitted
Federal Bank Not submitted
General Insurance Corporation of India
Not submitted
57
A N N U A L R E P O R T 2 0 2 0
CDP Activity Group Company name Response Status
Food amp beverage processing
Britannia Industries Not submitted
Marico Submitted
Tata Consumer Products
Submitted
United Breweries Not submitted
United Spirits Not submitted
Varun Beverages Ltd Not submitted
Venkys India Ltd Not submitted
Health care provision Apollo Hospitals Enterprises
Not submitted
Industrial support services
GMR Infrastructure Limited
Not submitted
Intermodal transport amp logistics
Adani Ports amp Special Economic Zone
Submitted
Container Corporation of India
Not submitted
IT amp software development
HCL Technologies Submitted
Infosys Limited Submitted
Larsen amp Toubro Infotech Ltd
Submitted
Mindtree Ltd Submitted
MphasiS Not submitted
Oracle Financial Services
See Another
Tata Consultancy Services
Submitted
Tech Mahindra Submitted
Wipro Submitted
WNS Holdings ADR Not submitted
Land amp property ownership amp development
DLF Not submitted
Godrej Properties Limited
Submitted
Housing Development amp Infrastructure
Not submitted
Oberoi Realty Not submitted
Leisure amp home manufacturing
Rajesh Exports Ltd Not submitted
Titan Company Limited Not submitted
Light manufacturing 3M India Ltd Not submitted
APOLLO TYRES LTD Submitted
Balkrishna Industries Ltd
Not submitted
Ceat Ltd Not submitted
MRF LTD Not submitted
CDP Activity Group Company name Response Status
Media telecommunications amp data center services
Bharti Airtel Submitted
Reliance Communications
Not submitted
Sun TV Network Not submitted
Tata Communications Submitted
Vodafone Idea Ltd Not submitted
Zee Entertainment Enterprises
Not submitted
Metal products manufacturing
AIA Engineering Ltd Not submitted
Bosch Ltd See Another
Endurance Technologies Ltd
Not submitted
Gillette India Not submitted
Metal smelting refining amp forming
Bharat Forge Ltd Not submitted
Essar Steel Limited Not submitted
Hindalco Industries Not submitted
Hindustan Zinc Submitted
Jindal Stainless Ltd Not submitted
Jindal Steel amp Power Not submitted
JSW Steel Ltd Submitted
Steel Authority of India Not submitted
Tata Metaliks Ltd Not submitted
Tata Steel Submitted
Vedanta Ltd Submitted
Metallic mineral mining
National Aluminium Co Not submitted
NMDC Submitted
Oil amp gas extraction amp production
Oil India Ltd Not submitted
Petronet LNG Not submitted
Oil amp gas processing Bharat Petroleum Corporation
Submitted
Hindustan Petroleum Corporation
Not submitted
Indian Oil Corporation Submitted
Mangalore Refinery and Petrochemicals
Not submitted
Nayara Energy Limited Not submitted
Oil amp Natural Gas Corporation
Not submitted
Reliance Industries Not submitted
Oil amp gas storage amp transportation
Gujarat State Petronet Not submitted
Other materials Astral Poly Technik Ltd Not submitted
Powered machinery Bharat Heavy Electricals
Not submitted
Cummins India See Another
58
A N N U A L R E P O R T 2 0 2 0
CDP Activity Group Company name Response Status
Renewable power generation
Adani Green Energy Submitted
Azure Power Submitted
National Hydroelectric Power Corporation Ltd (NHPC)
Not submitted
ReNew Power Private Limited
Not submitted
SJVN Ltd Not submitted
Specialized professional services
LampT Technology Services Ltd
Not submitted
Mahindra amp Mahindra Financial Services
Submitted
NBCC Ltd Not submitted
Piramal Enterprises Submitted
Vakrangee Softwares Ltd
Submitted
Textiles amp fabric goods
ARVIND Ltd Submitted
Birla CelluloseGrasim Industries
Not submitted
Chennai Petroleum Corporation
Not submitted
Thermal power generation
Adani Power Ltd Submitted
Aditya Birla Capital Not submitted
JSW Energy Submitted
KSK Energy Ventures Limited
Not submitted
NLC India Ltd Not submitted
NTPC Ltd Submitted
Reliance Power Not submitted
Tata Power Co Submitted
Tobacco ITC Limited Submitted
Transportation equipment
Ashok Leyland Not submitted
Bajaj Auto Not submitted
Eicher Motors Ltd Not submitted
Hero Motocorp Ltd Submitted
Mahindra amp Mahindra Submitted
Maruti Suzuki India Not submitted
Tata Motors Submitted
TVS Motor Company Ltd
Not submitted
Web amp marketing services
Info Edge (India) Ltd Not submitted
Wood amp paper materials
Century Textiles amp Industries
Not submitted
59
A N N U A L R E P O R T 2 0 2 0
Climate Change ndash Self Selected companies
CDP Activity Group Company name Response Status
Chemicals AARAV FRANCES amp FLAVORS PRIVATE LIMITED Submitted
GHCL LIMITED Submitted
Gujarat Fluorochemicals Submitted
Light manufacturing JK Tyres amp Industries Submitted
Cement amp concrete JSW Cement Limited Submitted
Land amp property ownership amp development Mahindra Lifespace Developers Limited Submitted
Media telecommunications amp data center services
Reliance Jio Infocomm Limited Submitted
Biotech amp pharma ZCL Chemicals Submitted
Water Security ndash Investor requested companies133
CDP Activity Group Name Response Status
Bars hotels amp restaurants Indian Hotels Co Ltd Submitted
Biotech amp pharma Ajanta Pharma Ltd Not submitted
Alkem Laboratories Ltd Not submitted
Aurobindo Pharma Not submitted
Biocon Not submitted
Cadila Healthcare Not submitted
Cipla Not submitted
Divirsquos Laboratories Not submitted
Dr Reddyrsquos Laboratories Submitted
Glenmark Pharmaceuticals Not submitted
Lupin Not submitted
Natco Pharma Ltd Not submitted
Sun Pharmaceutical Industries Not submitted
Torrent Pharmaceuticals Not submitted
ZCL Chemicals Submitted
Cement amp concrete ACC Not submitted
Ambuja Cements Submitted
Dalmia Bharat Ltd Not submitted
Shree Cement Not submitted
The Ramco Cements Ltd Not submitted
Ultratech Cement Submitted
Chemicals Asian Paints Not submitted
Berger Paints India Ltd Not submitted
Castrol India Not submitted
Coromandel International Not submitted
Dabur India Submitted
Emami Ltd Not submitted
Godrej Consumer Products Limited Submitted
Godrej Industries Submitted
Jubilant Life Sciences Ltd Submitted
Kansai Nerolac Paints Limited Submitted
Pidilite Industries Ltd Not submitted
Procter amp Gamble Hygiene amp Health Care Ltd Not submitted
SRF Ltd Not submitted
Supreme Industries Ltd Not submitted
Tata Chemicals Submitted
133 These include companies from the Water Global sample and Continuity water security sample For further details visit https6fefcbb86e61af1b2fc4-c70d8ead6ced550b4d987d7c03fcdd1dsslcf3rackcdncomcomfycmsfilesfiles000003422originalCDP_Water_Security_Sample_Investor_Request_2020pdf
60
A N N U A L R E P O R T 2 0 2 0
CDP Activity Group Name Response Status
UPL Limited Submitted
VVF Ltd Not submitted
Coal mining Adani Enterprises Not submitted
Coal India Not submitted
Construction Larsen amp Toubro Not submitted
Discretionary retail Aditya Birla Fashion and Retail Ltd Not submitted
Electrical amp electronic equipment Amara Raja Batteries Ltd Not submitted
Exide Industries Not submitted
Havells India Not submitted
Energy utility networks GAIL Not submitted
Power Grid Corpn of India Not submitted
Food amp beverage processing Marico Submitted
Tata Consumer Products Ltd Submitted
IT amp software development Tech Mahindra Submitted
Light manufacturing APOLLO TYRES LTD Not submitted
JK Tyres amp Industries Submitted
MRF LTD Not submitted
Media telecommunications amp data center services
Tata Communications Not submitted
Metal smelting refining amp forming Bharat Forge Ltd Not submitted
Hindalco Industries Not submitted
Hindustan Zinc Submitted
Jindal Steel amp Power Not submitted
JSW Steel Ltd Not submitted
Tata Steel Submitted
Metallic mineral mining National Aluminium Co Not submitted
NMDC Not submitted
Oil amp gas extraction amp production Oil India Ltd Not submitted
Petronet LNG Not submitted
Oil amp gas processing Bharat Petroleum Corporation Not submitted
Hindustan Petroleum Corporation Not submitted
Indian Oil Corporation Not submitted
Oil amp Natural Gas Corporation Not submitted
Reliance Industries Not submitted
Oil amp gas storage amp transportation Gujarat State Petronet Not submitted
Specialized professional services Piramal Enterprises Submitted
Textiles amp fabric goods ARVIND Ltd Submitted
Birla CelluloseGrasim Industries Not submitted
Thermal power generation Adani Power Ltd Submitted
JSW Energy Not submitted
NTPC Ltd Submitted
Tata Power Co Submitted
Tobacco ITC Limited Submitted
Transportation equipment Ashok Leyland Not submitted
Bajaj Auto Not submitted
Hero Motocorp Ltd Not submitted
Mahindra amp Mahindra Submitted
Maruti Suzuki India Not submitted
Tata Motors Not submitted
61
A N N U A L R E P O R T 2 0 2 0
Water Security ndash Self Selected companies
CDP Activity Group Name Response Status
Chemicals AARAV FRANCES amp FLAVORS PRIVATE LIMITED Submitted
Transportation services Adani Ports amp Special Economic Zones Submitted
Other materials Piramal Glass Submitted
62
A N N U A L R E P O R T 2 0 2 0
Appendix III - Indian Companies Committed to ActionScience-based Target initiative (SBTi)Approved 15degC
Mahindra Heavy Engines Ltd Mahindra EPC Irrigation Limited White House
Dr Reddys Laboratories Ltd Swaraj Engines Limited Gromax Agri Equipment Limited
Mahindra Accelo Mahindra Holidays and Resorts India Limited Mahindra Lifespaces Developers Limited
Mahindra Lifespaces Developers Limited Mahindra World City (Jaipur) Ltd Mahindra World City Developers Ltd
Polygenta Technologies Limited
Approved well-below 2degC
Tata Chemicals Limited Mahindra amp Mahindra Limited Wipro
Mahindra First Choice Services Ltd Mahindra Electric Mobility Ltd
Approved 2degC
Hindustan Zinc Limited Mahindra Sanyo Special Steel Shree Cement Ltd
Tech Mahindra
SBTi Committed
Infosys Limited UPL Limited JSW Energy Limited
Godrej Agrovet Limited Godrej Consumer Products Limited Godrej Industries
Godrej Properties Limited Godrej amp Boyce Mfg Co Ltd Ultratech Cement Limited
Vakrangee Limited ACC Limited Adani Ports and Special Economic Zone Limited
SCM Garments PVT Limited Nahar Industrial Enterprises Limited Ambuja Cement Ltd
Adani Green Energy Ltd Reliance Jio Infocomm Limited Bharti Airtel Limited
Gujarat Fluorochemicals Ltd (GFL) Dalmia Bharat Limited HCL Technologies
Havells India Limited Mahindra Susten Eastman Exports Global Clothing Pvt Ltd
JK Tyre amp Industries Ltd Marico Limited Tata Global Beverages Ltd
EPC Industries Limited Mahindra amp Mahindra Financial Services Limited YES BankSBTi companies not in CDP Sample
RE100Dalmia Bharat Ltd Infosys Ltd Mahindra Holidays amp Resorts India Ltd
Tata Motors Ltd
RE100 companies not in CDP Sample
Internal Carbon Pricing (ICP)Pricing carbon in 2020
ACC Ambuja Cements Dalmia Bharat Ltd
Dr Reddyrsquos Laboratories Godrej Consumer Products Godrej Industries
Gujarat Fluorochemicals Hero Motocorp Ltd Hindustan Zinc
63
A N N U A L R E P O R T 2 0 2 0
Infosys Limited JSW Cement Limited JSW Steel Ltd
Mahindra amp Mahindra Mindtree Ltd Shree Cement
Tata Chemicals Tata Consultancy Services Tata Consumer Products
Tata Motors Tata Steel Tech Mahindra
Ultratech Cement Wipro
Planning to price in the next two years
Adani Ports amp Special Economic Zone ARVIND Ltd GAIL
GHCL LIMITED Indian Hotels Co Ltd JK Tyres amp Industries
JSW Energy Jubilant Life Sciences Ltd Larsen amp Toubro Infotech Ltd
Mahindra amp Mahindra Financial Services Mahindra Lifespace Developers Limited Marico
NTPC Ltd Piramal Enterprises Reliance Jio Infocomm Limited
Tata Communications Tata Power Co UPL Limited
Vakrangee Softwares Ltd Vedanta Ltd YES BANK Limited
64
A N N U A L R E P O R T 2 0 2 0
About CDPCDP is a not-for-profit charity that runs the global disclosure system or investors companies cities states and regions to manage their environmental impacts by running a global environmental disclosure system Each year CDP supports thousands of companies cities states and regions to measure and manage their risks and opportunities on climate change water security and deforestation We do so at the request of their investors purchasers and city stakeholders
Over the last two decades we have created a system that has resulted in unparalleled engagement on environmental issues worldwide In 2020 Over 9600 companies reported through CDP on climate change water security and forests and over 800 cities and more than 120 states and regions disclosed their environmental impacts through CDP
CDP IndiaCDP began working in India in 2008 and was formally registered in 2012 working on disclosure and driving climate action It serves as a source of knowledge for hundreds of Indian corporations from those that are just beginning on the road to corporate environmental disclosure through to those looking to improve sustainability and make commitments to reduce environmental impact
It is the only NGO to be named in Indiarsquos INDC submission to the UNFCCC owing to its corporate environmental data repository and tracking of emissions and mitigation data from the Indian Industry CDP India also actively participated in Government of Indiarsquos Ministry of Environment Forests amp Climate Change (MoEFCC) work on future carbon market mechanisms In addition to our work on disclosure CDP India is actively engaged in other initiatives including Internal Carbon Pricing (ICP) Science-based targets (SBT) and RE100
65
A N N U A L R E P O R T 2 0 2 0
CDP ContactsFor more info contact Damandeep Singh Director CDP India damandeepsinghcdpnet infoindiacdpnet
CDP Board of Directors
Bharati Chaturvedi Founder amp Director Chintan Environmental Research and Action Group
Ramakrishnan Mukundan Managing Director amp CEO Tata Chemicals Limited
Damandeep Singh Director CDP India
Important Notice
The contents of this report may be used by anyone providing acknowledgement is given to CDP Worldwide (CDP) This does not represent a license to repackage or resell any of the data reported to CDP or the contributing authors and presented in this report If you intend to repackage or resell any of the contents of this report you need to obtain express permission from CDP before doing so
CDP India has prepared the data and analysis in this report based on responses to the CDP 2020 information request No representation or warranty (express or implied) is given by CDP India as to the accuracy or completeness of the information and opinions contained in this report You should not act upon the information contained in this publication without obtaining specific professional advice To the extent permitted by law CDP India do not accept or assume any liability responsibility or duty of care for any consequences of you or anyone else acting or refraining to act in reliance on the information contained in this report or for any decision based on it All information and views expressed herein by CDP India is based on their judgment at the time of this report and are subject to change without notice due to economic political industry and firm-specific factors Guest commentaries where included in this report reflect the views of their respective authors their inclusion is not an endorsement of them
CDP India their affiliated member firms or companies or their respective shareholders members partners principals directors officers andor employees may have a position in the securities of the companies discussed herein The securities of the companies mentioned in this document may not be eligible for sale in some states or countries nor suitable for all types of investors their value and the income they produce may fluctuate andor be adversely affected by exchange rates
lsquoCDP Worldwidersquo and lsquoCDPrsquo refer to CDP Worldwide a registered charity number 1122330 and a company limited by guarantee registered in England number 05013650
copy 2020 CDP Worldwide All rights reserved
This report is printed on recycled paper
This report is printed on CyclusPrint based on 100 recycled fibres
This report is printed on CyclusPrint based on 100 recycled fibres
Supported by Scoring partner
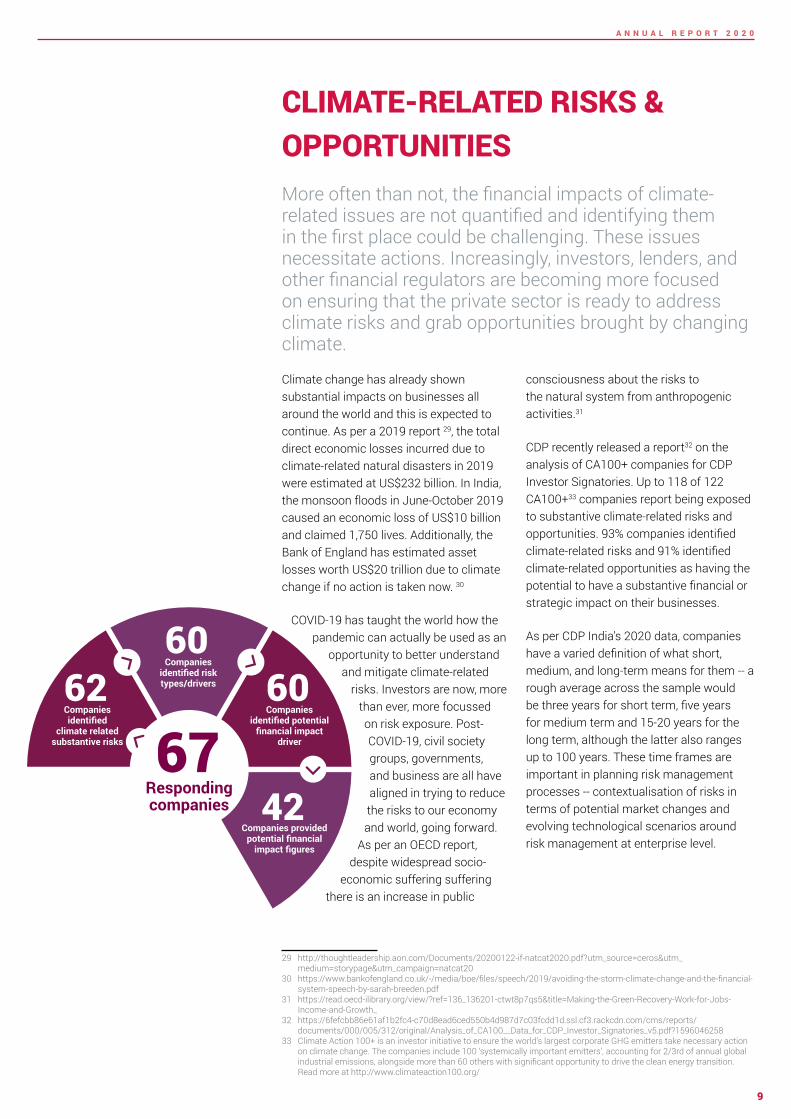
10
A N N U A L R E P O R T 2 0 2 0
THE RISKS OF CLIMATE CHANGE
In terms of risk types current regulation was deemed to be most relevant and always included in 97 of the organisationsrsquo climate-related risk assessments This was followed by emerging regulation and technology Interestingly findings from responses submitted by global companies corroborate this trend analysis as almost all CA100+ respondents reported policy and legal risks as potential drivers for substantive impact when it comes to transition risk34 With regular compliance checks increased stakeholder concern and sustainably evolving consumer demands climate-related risk assessment procedures can help companies become better equipped to handle longer-term uncertainties and liabilities
The number of companies that identified inherent climate-related risks with potential substantive financial or strategic impact on businesses rose to 94 from 88 in 2019 Up to 63 of reporting companies were able to get to the last mile of providing a financial impact figure to the risks identified Disclosing Indian companies put the total inherent financial impact of climate risks at `7138 billion with an average risk per company being `92 billion
Companies have also identified climate-related risks across their value chain with direct operations being the most severely affected and exposed most to acute physical risks followed by emerging regulation current regulations and chronic physical risks Companiesrsquo lsquodownstreamrsquo value chain is affected the most by market risks followed by acute physical risks Downstream value chain refers to the third parties benefiting from the outputs products and services of business activities This may be a companyrsquos customers and clients or the organisations and projects the business invests in This could possibly mean that changing customer behaviour could gravely affect a business operation if there is a shift in the demand for a comparatively low-carbon intensive product as well as greater demand for product efficiency regulations and standards providing clear evidence that there is a continuous shift towards sustainable products
CLIMATE RISKS AN OPPORTUNITY TO RESTRATEGISE
Up to 94 of reporting companies have identified climate-related opportunities as having the potential to make a substantive financial or strategic impact on businesses And 63 have provided a potential financial impact figure to the opportunities related to climate change Disclosing companies put the cost of climate-related opportunities at a total of `2787 billion The figure is a testament to the evolution of the climate change mitigation program and how organisations see this
34 https6fefcbb86e61af1b2fc4-c70d8ead6ced550b4d987d7c03fcdd1dsslcf3rackcdncomcmsreportsdocuments000005312originalAnalysis_of_CA100__Data_for_CDP_Investor_Signatories_v5pdf1596046258
No of Companies
Opp
ortu
nity
typ
es
Opportunity identified in value chain
Direct operations
Downstream
Upstream
Resource efficiency
Product and services
Energy source
Markets
Resilience
41
25 18
34 7
7
9 3
3
2
3
396
6
Risks relevant to Indian companies
Current regulation97Emerging regulations90Reputation90Market85Technology85Legal
Acute physical
Chronic physical
827973
No of Companies
Risk occuring in value chain
No of Companies
Risk
type
s
Reputation
Legal
Emerging regulation
Chronic physical
Technology
Market
Current regulation
Acute physical
Direct operations
Downstream
Upstream
5115
2
2923 4 8
17
8 14 7122 4
40 5 8
2
31
11
A N N U A L R E P O R T 2 0 2 0
Similarly most companies saw resource efficiency as a major climate-related opportunity followed by energy source and products and services in their lsquodirect operationsrsquo The main drivers behind these opportunities were use of more efficient production and distribution processes use of lower-emission sources of energy and development andor expansion of low-emission goods and services In the lsquodownstreamrsquo value chain products and services was majorly witnessed as an opportunity as there is growing consumer awareness and concern around sustainability related issues As a result companies are constantly diversifying their portfolios to address these consumer needs
Prod
uct a
nd s
ervi
ces
Ener
gy S
ourc
e
Resi
lienc
e
Resi
lienc
e
Ener
gy S
ourc
e
Reso
urce
effi
cien
cyM
arke
ts
2787identified to be the financial impact of reported climate-
related opportunities (in rupee billion)
Billion
`452
328
270
18
1719
Responding companies
67Companies
identified climate related
substantive opportunities
63Companies identified
opportunitiy typesdrivers
61
Companies identified
potential financial impact driver
60
Companies provided potential financial impact
figures
42
2041
4715
136
119
42413842
Acut
e ph
ysic
alCu
rren
t reg
ulat
ion
Emer
ging
regu
latio
n
Chro
nic
phys
ical
Repu
tatio
nO
ther
s
Lega
l
Tech
nolo
gyM
arke
t
7138identified to be the financial impact of reported climate-
related risks (in rupee billion)
Billion
`Financial impact of reported climate-related risks (in rupees billion)
Financial impact of reported climate-related opportunities (in rupees billion)
12
A N N U A L R E P O R T 2 0 2 0
Tech Mahindra Tapping into climate-related opportunities
Tech Mahindrarsquos approach towards climate change mitigation strategies is a testament to the efficacy of tapping into and realising climate-related opportunities The company has adopted Science-Based Targets to reduce its emissions and is a signatory to Business Ambition of 15 degree Celsius Tech Mahindra is committed to responsibly managing its operations through continuous improvement in sustainability practices across its value chain The company focuses on carbon emission reductions energy consumption reduction self-generation of energy from renewable energy sources and encouragement for green projects through Power Purchase Agreements The company has taken a target to increase Renewable Energy (RE) to 50 by 2025 Their sustainability report is aligned with CDSB amp Task Force on Climate-related Financial Disclosures (TCFD) frameworks
A constant focus on green energy and sustainable operations has provided a significant saving of US$27 million brought about by increasing renewable energy capacity to 1383MW leading to a saving of 28 million units of electricity adopting energy efficient practices across their facilities
Tech Mahindra has harnessed the power of disruptive next-generation technologies such as Artificial Intelligence (AI) analytics and blockchain to create solutions that ensure both its own and its customersrsquo carbon footprint reduction The company has contextualised opportunities for its customers as well by creating smart city offerings such as SMART Grid Micro-Grid-As-A-Service Intelligent Electric Vehicle Charging System (IEVCS) smart energy management smart traffic management smart lightening management smart waste management systems and command amp control centres These smart city offerings will help reduce carbon footprints across multiple smart cities globally thereby reducing carbon emissions and contributing to green and sustainable solutions It is claimed that the market size for this is expected to reach US$4639 billion by 2027
At present the risks identified by the responding companies significantly outweigh the opportunities Opportunities are slow to emerge and companies need to focus on the use of lower-emission sources of energy development andor expansion of low-emissions goods and services development of climate adaptation resilience and insurance risk solutions and use of more efficient production and distribution processes
In 2015 at the request of the G20 Finance Ministers and Central Bank Governors the Financial Stability Board (FSB) and its chair Mark Carney established the industry-led TCFD This was set up in response to increasing demands from investors lenders insurers regulators policy makers and other stakeholders in the financial markets for decision-useful climate-related information CDP has aligned its information requests with the TCFD alongside introducing a sectoral focus and adopting a forward-looking approach to climate-risk disclosure We are already going in the direction of mandatory disclosure of climate risks how they are present in a companyrsquos activities how they manage it and how resilient they are to it The UK will be the first country in the world to make TCFD-aligned disclosures fully mandatory across the economy by 2025 going beyond the lsquocomply or explain approachrsquo35
35 httpswwwgovukgovernmentnewschancellor-sets-out-ambition-for-future-of-uk-financial-services
13
A N N U A L R E P O R T 2 0 2 0
Under current policies Indiarsquos projected emissions for 2030 can achieve a rating of ldquo15degC Paris Agreement compatiblerdquo if domestic emissions peak and start reducing with international support36 This shows that India has the potential to become a world leader with enhanced 15-degree compatible targets through a swift transition from coal to renewable energy Although India was already on track to meet its NDCs pre-COVID19 it has seen an even more significant drop in emissions since the onset of the pandemic During the peak of lockdown Indiarsquos energy demand reduced by almost 30 in April 202037 ie each additional week of lockdown the annual energy demand fell by 0638 This is mostly due to the significant reduction in energy consumption and power generation via fossil fuel However the impact of the pandemic on emissions is expected to be temporary and emissions are likely to rebound in 202139 as per estimations
In comparison to the NDCs which set an overall emissions target sectoral indicators can be more reliable in making informed decisions on mapping emissions reduction targeting Paris-compatible goals40 The
36 Climate Action Tracker- Fair Share37 Carbon Brief Analysis Indiarsquos CO2 emissions fall for first time in four decades amid coronavirus38 httpswwwieaorgreportsindia-202039 Carbon Brief Global Carbon Project Coronavirus causes lsquorecord fallrsquo in fossil-fuel emissions in 2020 Dec 202040 httpswwwoecd-ilibraryorgdocserver9789264273528-4-en
pdfexpires=1607881602ampid=idampaccname=guestampchecksum=891034D10FA31A953F7924772F23966D41 httpssciencebasedtargetsorgresourceslegacy201505Sectoral-Decarbonization-Approach-Reportpdf42 IPCC Mitigation Pathways Compatible with 15degC in the Context of Sustainable Development
major challenge is how to translate global temperature goals into individual actions However various strategies can be adopted to meet the long-term goals
The Science-Based Targets Initiativersquos (SBTi) Sectoral Decarbonisation Approach (SDA) allocates the well below 2degC carbon budget to different sectors taking into account inherent differences among sectors such as how fast each sector can grow relative to economic and population growth along with its mitigation potential41 According to the Intergovernmental Panel on Climate Change (IPCC) the highest global carbon budget allocation (for the period of 2011-2050) is for the power sector (25) followed by agriculture (24) and industry [including steel aluminium chemical and paper] (14)42
EMISSIONS TRENDS AND VERIFICATION
13increase in number of
organisations reporting
27increase in emissions
reporting (Scope 1+Scope 2)
90increase in scope 3 emissions reporting
India under its NDCs pledged to reduce its emissions intensity by 33-35 by 2030 compared to the 2005 levels The Climate Action Tracker38 rates Indiarsquos NDC target as ldquo2009 Copenhagen 2degC goal compatiblerdquo indicating that its commitment is a ldquofair sharerdquo of the global effort
Scope 1 and Scope 2 Emissions reported via CDP over the years
(In Million tCO2e)
2018 2019 2020
2997
55717037
14
A N N U A L R E P O R T 2 0 2 0
In order to allocate sector-specific questions to companies CDP has developed an Activity Classification System (ACS)43 It is a framework used to classify companies under the most relevant sectors It focuses on the diverse activities from which companies derive revenue associating them with the impacts to their business from climate change water security and deforestation This approach allows a better understanding of company actions based on their environmental risk opportunity and impact CDPrsquos Climate Change questionnaire requests companies to disclose their direct and indirect emissions under different emissions categories Although India saw an overall decrease in emission in 2020 there was an increase in CDP reporting companies and hence an overall increase in emissions reporting For the year
43 https6fefcbb86e61af1b2fc4-c70d8ead6ced550b4d987d7c03fcdd1dsslcf3rackcdncomcmsguidance_docspdfs000001540originalCDP-ACS-full-list-of-classificationspdf1520244912
44 The location-based method reveals what the company is physically putting into the air and the market-based method shows emissions the company is responsible for through its purchasing decisions
2020 the companies reported 70374 MtCO2e of total [Scope 1+Scope 2 (location-based)] emissions which is a 27 increase in reported emissions from 2019 This is mostly because of the significant increase in emissions reporting from several sectors mdash electric utilities cement and other heavy sectors
Only four companies chose a Scope 2 market-based approach and 43 companies selected a scope 2 location-based approach44 The total scope 2 emissions for location-based approach amounted to 181 MtCO2e and market-based approach amounted to 414 MtCO2e It is clear from this breakdown that a range of sectors and processes contribute to global emissions Focusing on any single sector alone would be insufficient However as can be seen in the
Emissions reported in Scope 3 Categories
4949
1414
1111
1010
88
55
33
Use of sold products
Purchased goods and services
Upstream transportation and
distribution
Downstream transportation and
distribution
Fuel and energy related activities (not included
in scope 1 and 2)
End of life treatment of sold products
Others
In 2020 companies have reported MtCO2e of total (Scope 1+2 [location-based]) emissions704
Gross Emissions Data 2020 (in MtCO2e)
682
126418
Gross Scope 1 Emissions
Gross Scope 3 EmissionsGross Scope 2 Emissions (Market and
Location based)
Scope 2 Location based emissions Scope 2 Market based emissions
Metal smelting refining and forming
Financial services
Cement amp concrete
Media telecommunications amp data center services
IT amp software development
Energy utility network
Chemicals
Textiles amp fabric goods
Oil amp gas processing
Biotech and pharma
Thermal power generation
Intermodule transport amp Logistics
Bar Hotels and Restaurants
Transportation equipment
Metallic mineral mining
Others
2911712
703
688536
165 292207
144118113
093087
071063
020057
024045044
157
Scope 2 Market-based emissions Scope 2 location-based emissions
Scope 2 market-based and location-based emissions reported as per CDPrsquos Primary Activity Group classification (in MtCO2e)
15
A N N U A L R E P O R T 2 0 2 0
graph for Gross Scope 2 emissions metal smelting refining and forming sectors contribute to the maximum emissions (1712 MtCO2e) followed by financial services and cement and concrete sectors
Companies reported 1259 MtCO2e of Scope 3 emissions in 2020 a 90 increase from 2019 figures due to higher disclosure as well as more companies disclosing their Scope 3 GHG inventories Almost half of the Scope 3 emissions were reported in the following categories use of sold products (49) followed by purchased goods and services (14) upstream transportation and distribution (11) and downstream transportation and distribution (10)
The ACS sectoral analysis shows that the transportation equipment activity group has the maximum reported scope 3 emissions at 615 MtCO2e followed by metal smelting refining and forming activity group at 2332 MtCO2e and cement and concrete activity group at 989 MtCO2e
Of the responding companies 33 have reported an approximately 11 of reduction in their gross global emissions (Scope 1 and 2 combined) from 2019 and 26 companies reported an approximate 57 increase in their gross global emissions from 2019 Responding companies have identified change in boundary45 as a major reason for a 62 increase in emissions from 2019 followed by acquisitions which led to a to 30 increase Amongst all sectors the electric utilities sector accounts for 83 of total increased emission values and up to 73 of these were due to change in boundary
Amongst all sectors reduction in emissions values since 2019 were mostly caused by emissions reduction initiatives (43) followed by change in output (30) and change in emission estimation methodology (23)
45 This refers to changes in the boundary used for inventory calculation ie changing from financial control to operational control This option could also apply if organisation has incorporated facilities into its inventory that were excluded in previous years
Amongst all sectors steel saw the highest reduction (around 48) in emission values and approximately half of this was achieved only from change in emission estimation methodology through recalibrating the GHG emissions for the reporting period This is followed by cement which reported a 29 reduction in emission values from implementing emissions reduction initiatives It is also noted that more than 30 of responding companies have adopted a change in renewable energy consumption but this accounts for only 35 of total reduction in emission values
Scope 3 emissions reported as per CDPrsquos Primary Activity Group classification (in MtCO2e)
of increased emissions in 2020 attributed to Change in boundary62
32 attributed to acquisitions
Metal smelting refining and forming
Cement amp concrete
Media telecommunications amp data center services
Chemicals
IT amp software development
Food amp beverage processing
Oil amp gas processing
Biotech and pharma
Thermal power generation
Land amp property ownership amp development
Financial services
Transportation equipment
Others
6157
2332
989
796
790
632
385
158
127
073
059
039
055
Third-party verification or assurance in place for Scope 12 amp 3 emissions
3571
Scope 1
3643
Scope 2 (location-based
or market based)
2786
Scope 3
a
ge o
f com
pani
es
16
A N N U A L R E P O R T 2 0 2 0
Third-party verification is one of the significant components of emission reporting An independent verification of self-reported data provides credibility and assurance It helps companies improve their internal processes identify risks and opportunities increase the reliability of their data reduce operational costs and building a strong reputation46 When an organisation monitors and verifies its emissions it can accurately identify and understand the true proportions of emissions from its sources and this can help it realise the major opportunities for emission reduction along with cost benefits
In 2020 50 companies reported third-party verification or assurance for Scope 1 emissions 51 companies for Scope 2 emissions and 39 companies for Scope 3 emissions Compared to 2019 there is an 18 increase in companies that have verified Scope 3 GHG emissions This indicates that Indian companies are becoming increasingly aware of their emission managementaccounting Amongst all sectoral companies which opt for third-party verification of their reported emissions around 25 are from IT amp software development and financial services Cement and concrete sectors rank the lowest on the list CDP encourages companies to have verified data submitted
46 The business benefits of third party verification of climate data A CDP Guide
Building a stronger reputation via third party verification
bull Increase confidence in data for internal and external use
bull Develop and demonstrate an effective carbon reduction strategy Improve business processes
bull Reduce operational costsbull Full-fill one of the mandatory criteria for entry
to the CDP A-list by gaining full points on CDPrsquos Scope 1 and 2 verification questions
bull Provide credibility for products services and internal processes
bull Counteract claims of greenwashing
17
A N N U A L R E P O R T 2 0 2 0
DECARBONISING ACROSS VALUE CHAIN Scope 3 emissions typically arise from the supply chain and the consumers using the product It has been found that the emissions from the supply chain are 5-6 times more than the carbon footprint of a companyrsquos direct operations and hence account for lionrsquos share of an organisationrsquos overall emissions47
47 httpswwwcdpnetenarticlessupply-chainsupplier-engagement-leaderboard-201948 httpswwwbcgcomen-inpublications2020supply-chain-needs-sustainability-strategy
Walking the extra mile in terms of engaging with stakeholders especially suppliers and customers on climate issues allows an organisation to consider the whole gamut of emissions and have better control over their emissions inventory For example metal companies can improve their supply chainrsquos environmental performance through adoption of a circular economy model which leads to an increased use of recycled materials in products reduces the emissions by lowering the overall burden on the manufacturing plant to produce from scratch and creates a closed-loop system with consumers48 This yearrsquos data indicates that 88 of companies engaged with their value chain partners on climate-
related issues an improvement of 5 over 2019 There was also an increase in absolute numbers -- 59 business entities collaborated with value chain partners against 49 last year
The main forms of engagement with suppliers are compliance and onboarding followed by incentivisation and information collection Educationinformation sharing collaboration and innovation are the most common customer engagement processes
Types of engagement with suppliers
No of Companies engaging with value chain on climate-related issues
2121
22
331212
1313
44
44
Other partners in the value chain customers suppliers
Other partners in the value chain suppliers
Customers
Customers Suppliers
Suppliers
Other partners in the value chain
Other partners in the value chain customers
of companies engage with their value chain partners on climate related issues an improvement of 5 from 2019
88
26
Compliance amp onboarding
16
Engagement amp incentivisation
(changing supplier behavior)
9
Information collection
(understanding supplier behavior)
7
Innovation amp collaboration
(changing markets)
No
of C
ompa
nies
18
A N N U A L R E P O R T 2 0 2 0
Organisations are mindful of the fact that climate issues need to be dealt using a participatory approach that encompasses all partners in the value chain as well as engages other external stakeholders Companies are thus getting serious about engaging in a comprehensive dialogue on climate change as this will allow them to have inputs in shaping public policy In their attempt to influence climate policies organisations are establishing communication channels with stakeholders like policymakers trade associations and research funding organisations A positive sign emerging is that majority of the businesses are agreeing to comply with environmental legislations unconditionally Energy efficiency and clean energy generation have garnered the support of 71 and 68 of responding companies respectively Mandatory carbon reporting and increased climate resilience have also found acceptance
With the COVID-19 pandemic wreaking havoc across the world and leading to the first-ever recorded recession in India it is important that companies view this as an opportunity to build a more resilient economy one in harmony with nature and encouraging of a more inclusive environment for supplier engagement that would expedite decarbonising Engaging with the value chain offer a strategic advantage as it allows companies to take a lead on corporate sustainability and puts them in a position to set the blueprint for other businesses to follow
19
A N N U A L R E P O R T 2 0 2 0
Emission reduction targets and initiatives
Targets
In recent years accelerated climate change has forced businesses to set more ambitious climate goals and commit to advocating for a low-carbon economy Today it is considered a standard practice for businesses to report their annual emissions and undertake efforts to reduce their carbon footprint Of the 67 Indian companies responding to investor requests 57 have undertaken a total of 95 emissions reduction targets including absolute targets intensity targets and both absolute and intensity targets 24 of these were approved SBTs
The global pandemic has reinforced the need for business resilience in operations and corporate leaders have started recognising that science-based climate action goes hand-in-hand with building business success49 Companies are looking science-based targets as guiding lights with a defined pathway to future-proof growth and with impending climate change hazards more companies have doubled down on their commitments towards a low-carbon transition50 The momentum for SBTs has reached across a range of industries including cement
49 The new normal 1000 companies are now setting science-based climate targets - Science Based Targets50 httpswwwcdpnetenarticlesclimate2020-lessons-from-an-extraordinary-year
automobiles pharmaceuticals metals amp mining real estate and information technology
As more companies are striving toward commitments this year witnessed an increase in the number of approved SBTs from seven targets last year to 24 targets this year
Leading companies are moving forward by setting long-term emissions reduction targets to mitigate climate-related risks Compared to 2019 this year more targets
were set under a long-term time frame till 2030 and a lesser focus had been given on short-term targets ie till 2020 Most of the companies selected a base year of 2018 and had gone for the intensity targets Hence in upcoming years long-term targets can play a major role for companies to support their sustainability visions and their journey towards low-carbon transition Apart from these companies also reported 83 other targets which included 38 energy consumption targets 13 energy productivity targets and 11 waste management targets amongst others
TARGETS amp PERFORMANCE
More than
three times increase in the number of approved science-based targets
of the responding companies set long-term targets (ie till 2030)
50
15
Absolute target
5Both absolute and intensity
targets
37
Intensity target
10
No target
No of Companies
GHG Emission Reduction Target Types
Absolute emission targets count
Intensity emission targets count
Types of targets based on time-frame of target year
820
Till 2020
1929
Till 2021 - 2030
136
2031 and beyond
20
A N N U A L R E P O R T 2 0 2 0
Emission reduction initiatives
While the number of companies taking up Emission Reduction Initiatives (ERI) has grown from 53 to 58 the number of initiatives has declined from 293 to 287 resulting in a 13 decrease in the estimated annual CO2e savings this year
Energy efficiency in production processes and in buildings continue to account for most ERIs non-energy industrial process emission reductions have been outweighed in their CO2e saving potential
Other emission reduction initiatives such as upgrading equipment with high-efficiency alternatives and digitisation initiatives undertaken by banks accounted for the highest estimated CO2e savings In terms of the highest monetary savings energy efficiency in production processes contributed to 76 of monetary savings followed by energy-efficiency in building services
The steel sector had the highest number of initiatives for energy efficiency in production process and accounted for
of total estimated annual CO2e savings
88Monetary Savings from Emission Reduction Initiatives
Annual monetary savings (Million `) No of Initiatives
20611 1918 576 237 148Energy
efficiency in production processes
Non-energy industrial process
emissions reductions
Other initiative
Waste reduction
and material circularity
Energy efficiency in
buildings
150
63 1210
2
Emission Reduction Initiatives
6340 2772 2574 2016 1278
6310
150
122
Other initiatives
Non-energy industrial process
emissions reductions
Energy efficiency in production processes
Waste reduction
and material circularity
Energy efficiency in
buildings
No of InitiativesEstimated annual CO2e savings (MtCO2e)
21
A N N U A L R E P O R T 2 0 2 0
The rise in climate consciousness among Indian companies is evident from the growing number of those committed to the Science Based Target Initiative (SBTi) By 2020 52 companies have committed to it with a significant growth of more than 37 over last year India is now the leader from emerging economies for having the maximum number of companies committing to SBTi and globally it stands at the sixth position
Of the 52 committed companies 22 have further approved SBTs in 2020 compared to 10 in 2019 The initiative champions SBT setting as a powerful way of future-proofing companiesrsquo growth in the transition towards a low-carbon economy51 The initiativersquos overall aim is for SBT setting to become a standard business practice and for companies to play a major role in driving down global GHG emissions Embedding SBTs as a fundamental component of sustainability management practices is crucial for achieving this
The Sectoral analysis of the Indian SBTi companies highlights the number of companies that are committed to the initiative and the number of those with approved set targets across each sector
51 httpssciencebasedtargetsorgresourcesfilesSBTi-manualpdf52 httpssciencebasedtargetsorgresourceslegacy201805SBT-transport-guidance-Finalpdf
Compared to last year the automobiles and components sector is still leading with the highest commitment and targets set The automobile sector is one of the fastest growing sectors which represents 23 of all energy-related global emissions52 Decarbonisng the automobile sector is possible through disruptive technological innovation land-use planning and transport demand management modal shift and
shifting to electric mobility Companies that set ambitious SBTs can send a strong signal for local regional and national policies to increase the level of ambition and steer the transition
In 2020 28 SBTi committed companies responded to CDPrsquos Investor request to disclose to the Climate Change questionnaire The emissions profile shows that the overall Scope 1+ Scope 2 emissions of SBTi companies responding to CDP represent almost 20 of the total Scope 1+ Scope 2 emissions and 71 of the total Scope 3 emissions in the overall CDP India Investor sample
A greater share of Scope 3 emissions reported by SBTi companies indicate that there is now a greater focus on the Scope 3 GHG Inventory as the companies are planning to set SBTs in coming years As per the SBTi a complete Scope 3 screening or inventory is required for the validation of the SBTs and it is not acceptable to exclude any relevant categories
What is a lsquoScience-Based Targetrsquo
Science Based Targets are the GHG emissions reduction targets consistent with the level of decarbonisation that according to climate science is required to limit global temperature increase to 15- 2ordmC compared to pre-industrial temperature levels
Science Based Target ensures that the company is taking shorter-term action to reduce emissions at a pace that is consistent with keeping warming below 15ordm well-below 2ordm C
SCIENCE-BASED TARGETS AMBITIOUS CORPORATE CLIMATE ACTION
200
128107
74 57 52
United States of America
(USA)
United Kingdom
(UK)
Japan Sweden IndiaFrance
No of Companies
Top 5 countries with SBTi companies
22 28 303
No
of C
ompa
nies 10
22Status of SBTi Companies in India
Committed Target Set
22
A N N U A L R E P O R T 2 0 2 0
CDP India data shows that 33 companies have reported reduction in their gross global emissions (Scope 1 and 2 combined) from the previous reporting year whereas 26 companies have their gross global emissions increased for this reporting year
CDPrsquos data shows that there are 32 companies that are considering setting a SBT in the next two years compared to 29 companies in the previous reporting year There are 11 intensity and eight absolute targets that companies consider to be SBT but this has not been approved by SBTi yet
The increase in these target number highlights that there are more companies which seek to commit to SBTi and get their targets validated in the coming years
Growth in ambition
CDPrsquos five-year data shows a rise in the number of Indian companies committing to the SBTi Their reported emissions increased by 144 due to increased commitment from energy intensive companies this year which includes companies from cement and metal and mining sectors
CDP India investor responding companies
SBTi companies (28 companies respond to CDP)
Emissions Profile (MtCO2e)
6815
134
Scope 1 Scope 2
22282
Scope 3
1259896
NO of Companies
Water Transportation
Professional Services
Textiles Apparel Luxury Goods
Software and Services
Pharmaceuticals and Biotech
Mining - Metals (Iron Aluminium Other Metals)
Food Production - Agricultural Production
Electrical Equipment and Machinery
Electric Utilities and Energy Related
Commercial services and supplies
Air Freight Transportation and Logistics
Food and Beverage Processing
Electric Utilities and IPPs and Energy Traders
Construction Materials
Automobiles and Components
Consumer Products and Durables
Banks Diverse Financials and Insurance
Chemicals
Hospitality
Real Estate
Telecommunications
1
1
3
2
2
2
1
1
1
1
1
1
1
1
2
3
3
2
1
1
6
2
4
1
1
2
3
3
Sectoral Analysis of Indian SBTi companies
Committed Companies Target Set Companies
33
14
Decreased
26
12
Increased
62
Reporting for the first time
1No Change
CDP India investor responding companies
SBTi companies (28 companies respond to CDP)
Comparison of change in gross Scope 1+2 emissions from previous year for SBTi companies vis-agrave-vis CDP reporting
companies
Emission Reduction Targets Reported by Companies in 2020
3
Not SBT not anticipating setting in 2
years
24
8
Not SBT but anticipating setting
in 2 years
4 5
Yes this is SBT approved by SBTi
11 8
Yes this is SBT not approved by
SBTi
Intensity emissions reduction target
Absolute emissions reduction target
No
of c
ompa
nies
23
A N N U A L R E P O R T 2 0 2 0
We witnessed the highest number of SBTi companies responding to CDP India this year which is a 40 growth from last year This further proves that companies are becoming more responsible towards disclosing their GHG Inventory with greater transparency
The graph for the estimated annual carbon savings shows the top three emission reduction initiatives undertaken by SBTi companies reporting to CDP It is evident that over the years low carbon energy purchase and energy efficiency process have gained momentum in reducing GHG emission with an increase in the number of SBTi committed companies implementing these initiatives Maximum carbon savings of 791 MtCO2e have been reported from the cement and concrete sector The metal smelting refining amp forming sector has reported 59237 tons CO2e savings this year with a significant decrease from 70422 tons CO2e savings in the last year There has been a reduction of 443 MtCO2e of estimated annual carbon savings reported by SBTi companies in 2020 as compared to the last year
Data shared by three reporting companies that have also committed to the SBTi (Ambuja Cement Ltd ACC Limited and Ultratech Cement Limited) shows that improving energy efficiency in their production processes has led to cement being the leading sector in reducing GHG emissions
About SBTi
The Science Based Targets initiative champions science-based target setting as a powerful way of boosting companiesrsquo competitive advantage in the transition to the low-carbon economy
It is a collaboration between CDP the United Nations Global Compact (UNGC) World Resources Institute (WRI) and the World-Wide Fund for Nature (WWF) and one of the We Mean Business Coalition commitments
The initiative
bull Showcases companies that set science-based targets through case studies events and media to highlight the increased innovation reduced regulatory uncertainty strengthened investor confidence and improved profitability and competitiveness generated by science-based target setting
bull Defines and promotes best practice in science-based target setting with the support of a Technical Advisory Group
bull Offers resources workshops and guidance to reduce barriers to adoption
bull Independently assesses and approves companiesrsquo targets
Indian SBTi companies responded to CDP Climate Change Investor Program 2020
54
Increase in SBTi companies responding to CDP via 2020 climate Change Investor Disclosure Program compared to previous year
40
Increase in Scope 1+2 Emissions and
Indian SBTi Companies responding to investor request reported reduction in Gross Global emissions compared to previous year
Increase in Scope 3 Emissions covered by SBTi Companies this year as compared to 2019
14450
185
Comparison of Absolute Scope 1+2 emissions (MtCO2e) for SBTi companies reporting to CDP
Emission reported in MtCO2e SBTi companies reporting to CDP
15 16 15 18 20 28
2015 2016 2017 2018 2019 2020
Abso
lute
Sco
pe 1
+2 E
mis
sion
(MtC
O2 e
)
364
8
380
4
479
4
605
5
583
4
142
26
24
A N N U A L R E P O R T 2 0 2 0
Advantages 53
1 Reducing regulatory risks and uncertainties As the government continues to work on implementing the Paris Agreement and meeting the ambition of the country-level pledges Science Based Targets initiative can prove out to be a resilience against the upcoming regulations
2 Strengthening Investor Confidence SBTi can help in strengthening the investor confidence as the investors are highly taking interest in businessesrsquo environmental policies
53 httpssciencebasedtargetsorgblogsix-business-benefits-of-setting-science-based-targets
3 Competitive Edge Companies are getting ahead of their peers by succeeding in the low-carbon transition with increased innovation reduced uncertainty strengthened investor confidence and improved profitability
4 Brand Reputation SBT is a global Initiative which shows robustness confidence and credibility which further helps in building up the brand reputation
Estimated annual CO2e savings of SBTi companies (in lsquo000 tCO2e)
2
Develop Target
3
Submit target for validation
4
Announce Target
1
Commit
Joining Call to Action
We look forward to companies taking action by committing to develop Science-based Targets
68
Energy efficiency Processes
Low carbon energy purchase
Energy efficiency Building services
Estim
ated
ann
ual C
O2e
sav
ings
(in
000
tCO
2e)
60126
2018 2019 2020
124
5184
346
43
7911168
25
A N N U A L R E P O R T 2 0 2 0
Science Based Targets Incubator is a unique project of CDP that was launched in April 2020 with support from MacArthur Foundation amp Shakti Sustainable Energy Foundation in partnership with WWF India to provide technical support with the main objective of handholding and catapulting organisations from commitment stage to target development stage of Science Based Targets Initiative Value Proposition
1 There will be no financial implication on the company
2 Case studies of businesses with validated targets will be shared with the participating companies for peer-to-peer learning
3 Capacity Building workshops and webinars based on recent developments and various other nitty-gritty of SBTi
4 In house trainings and one-on-one meetings with companies where CDP India will explain all stages of the SBTi and provide answers to all the technical queries
26
A N N U A L R E P O R T 2 0 2 0
BUSINESS AMBITION FOR 15degC
lsquoBusiness Ambition for 15degCrsquo is an urgent call to action from a global coalition of UN agencies business and industry leaders Businesses can make a critical contribution to limit the worst impacts of climate change by setting a net-zero target in line with 15degC future57
So far over 300 companies representing more than $36 trillion in market cap have responded to the open letter from global leaders and signed the Business Ambition for 15degC commitment
bull In India 13 companies55 have already aligned and set their target with the most ambitious aim of the Paris Agreement to level global temperature rise to 15degC above preindustrial levels
bull Automobiles and Components and Real Estate are the top sectors that have approved targets aligning with 15degC Ambition
bull In India 13 companies are further committed to Business Ambition for 15degC
bull All the companies in the Real Estate sector from India have approved targets aligning with 15degC Scenario
54 httpssciencebasedtargetsorgbusiness-ambition-for-1-5c55 Mahindra Logistics Ltd Mahindra Heavy Engines Ltd White House Dr Reddys Laboratories Ltd Mahindra EPC Irrigation Limited Swaraj Engines Limited Gromax Agri Equipment
Limited Mahindra Accelo Mahindra Holidays and Resorts India Limited Mahindra Lifespaces Developers Limited Mahindra World City (Jaipur) Ltd Mahindra World City Developers Ltd and Polygenta Technologies Limited
56 httpssciencebasedtargetsorgnet-zero
Net zero a north star for climate action
According to the latest report by the IPCC to limit global warming to 15degC above pre-industrial levels and to avoid the most disastrous impacts of climate change the world must halve CO2 emissions by around 2030 and reach net-zero CO2 emissions by 2050
Companies are increasingly adopting the net-zero climate targets by recognising the importance of keeping global warming to 15degC Between July 2019 and June 2020 over 230 companies committed to reach net-zero emissions as part of the Business Ambition for 15degC campaign an urgent call-to-action for companies to set emissions reduction targets in line with a 15degC future The campaign is led by the SBTi and supported by a global coalition of UN leaders business organisations and NGOs56
27
A N N U A L R E P O R T 2 0 2 0
A carbon price is a cost applied to carbon pollution to discourage polluters Economists agree a carbon price is the single most effective tool for countries to reduce their emissions57 Corporations have been using internal carbon pricing (ICP) as a strategy to manage climate-related business risks and prepare for the transition to a low-carbon economy Carbon pricing policies create strong transparent incentives for firms to internalise the social costs of carbon emissions58 Major investors and financial regulators are calling for businesses to disclose their climate risks and their policies to mitigate emissions59 The most sought-after benefits are that a company can use ICP both as a risk management tool and as a part of its decarbonisation strategy
To see how fast carbon pricing is spreading consider Paragraph 136 of the decision text of the Paris Agreement ldquoproviding incentives for emission reduction activities including tools such as domestic policies and carbon pricingrdquo The final agreement recognised carbon pricingrsquos importance as a powerful incentive to cut emissions by companies and regional state and local governments
The IPCC special report on the impacts of global warming of 15 degC above pre-industrial levels states that an explicit carbon pricing mechanism can theoretically achieve cost-effective emission reductions Along with best practice policies a moderate carbon pricing can help reduce global CO2 emissions significantly60 Parties are encouraged to set prices consistent with Carbon Pricing Leadership Coalitionrsquos
57 What is a carbon price and why do we need one58 Energy the Environment and Technological Change59 Firms ignoring climate crisis will go bankrupt says Mark Carney60 An I P C C Special Report on the impacts of global warming of 15 C above pre-industrial levels and related global
greenhouse gas emission pathways in the context of strengthening the global response to the threat of climate change sustainable development and efforts to eradicate poverty Intergovernmental Panel on Climate Change (2018)
61 Carbon Pricing WBCSD policy paper 2019httpsdocswbcsdorg201909Carbon-Pricing-WBCSD-Policy-Paper-2019pdf WBCSD 2019
62 SHOULD EVERY COUNTRY ON EARTH COPY SWEDENrsquoS CARBON TAX63 httpswwwedienetregistrationregwall
(CPLC) high-level commission on carbon pricing which states that an explicit-price range of US$50ndash100tCO2 by 2030 will be consistent with delivering the Paris Agreement61
Carbon prices have varied widely across existing schemes Success stories such as that of Sweden which currently has the highest carbon price in the world at US$123tCO2 demonstrate that it is indeed possible to make carbon pricing work while the Swedish economy grew by 78 since the introduction of the Swedish carbon tax in 1991 carbon emissions have decreased by 2662 Other countries like The UK
(US$4229) Netherlands (US$3638tCO2) have also committed to increasing their carbon prices in the coming decade63 The worldrsquos top three emitters -- US China and India -- however have put negligible prices on carbon
As part of the lsquoBuild Back Betterrsquo strategy carbon pricing can be a valuable tool
US$123tCO2
Sweden
US$4229tCO2
UK
US$3638tCO2
Netherlands
INTERNAL CARBON PRICEndash ROBUST CLIMATE STRATEGY
28
A N N U A L R E P O R T 2 0 2 0
to guide investment decisions It can help focus on a green stimulus package to recover from the old economy which promotes a carbon-intensive future Different stimulus measures can help clean energy technologies compete with carbon-intensive alternatives and encourage more efficient energy use India is witnessing this momentum ndash a Declaration on Climate Change was signed by 24 key industry captains and Ministry of Environment Forest and Climate Change (MoEFCC) at the virtual India CEO forum on Climate Change on 5th December 2020 Shri Javadekar further said that this declaration by private sector companies voluntarily is a historic step
To guide companies in the implementation of climate-related financial disclosures the TCFD65 developed four recommendations mimicking an organisational structure Governance Strategy Risk Management and Metrics and Targets An ICP is a proposed metric through which entities can safeguard their businesses by internalising market signals The TCFD specifically lists ICP as a key metric to assess climate-related risks and opportunities in line with its strategy and risk management process By attributing a financial cost to risks associated with carbon emissions and translating them into a uniform metric financial decision-makers can integrate transition risks into their business decisions and fill the analysis gap for assets of various time horizons
64 httpnbrienvisnicinViewGeneralLatestNewsaspxId=9829ampYear=202065 httpnbrienvisnicinViewGeneralLatestNewsaspxId=9829ampYear=202066 Implementing the Recommendations of the Task Force on Climate-related Financial Disclosures The Taskforce on Climate-related Financial Disclosures June 2017
Mr Ravi S Prasad Additional Secretary spoke about a coordinating structure for implementation of Paris Agreement which will incorporate internal carbon pricing67
The MoEFCC also constituted a high-level inter-ministerial Apex Committee for Implementation of Paris Agreement (AIPA) in December 2020 under the chairmanship of the Secretary MoEFCCThe purpose of AIPA is to generate a coordinated response on climate change matters that ensures India is on track towards meeting its obligations under the Paris Agreement including its NDC
Senior officials from 14 ministries will serve as Members to AIPA who will oversee the progress in implementation of Indiarsquos NDC and receive periodic information updates to monitor review and revisit climate goals to fulfil the requirements of the Paris Agreement Another key function of AIPA would be to operate as a National Authority to regulate carbon markets in India under Article 6 of the Paris Agreement formulate guidelines for consideration of projects or activities under the article issue guidelines on carbon pricing market mechanism and other similar instruments that have a bearing on climate change and NDCs
It will take note of the contributions of the private sector as well as multi-bi-lateral agencies in the field of climate change and provide guidance for aligning their climate actions with national priorities
ICP will be a useful preparatory tool for future government climate policies
Investors are increasingly demanding comprehensive climate disclosures
It will stay and will be instituted more commonly
A robust carbon pricing system plays an important role in driving
GHG reductions
It complements climate policies for sustained and successful
emissions reductions
It helps make informed decisions and incentivies
low-cost abatement options
Business case for pricing carbon
29
A N N U A L R E P O R T 2 0 2 0
When disclosing on ICP the TCFD recommends that companies should disclose on the followingbull what assumptions are made about how carbon price(s)
would develop over time (within tax andor emissions trading frameworks)
bull geographic scope of implementationbull whether the carbon price would apply only at the mar-
gin or as a base costbull whether the price is applied to specific economic sec-
tors or across the whole economy and in what regionsbull whether a common carbon price is used (at multiple
points in time) or differentiated prices bull assumptions about scope and modality of a CO2 price
via tax or trading scheme
67 httpswwwgreentechmediacomarticlesreadeuropean-oil-majors-ready-to-scale-up-energy-transition-investment68 httpswwwgreenbizcomarticlebp-walks-away-three-us-trade-groups-over-carbon-pricing69 Convention on Biological Diversity ndash Markets for Carbon Offsets Accessible at httpswwwcbdintfinancialoffsetsg-offsetclimatecarbonpdf page 8
Earlier this year BP one of Europersquos oil supermajors announced a carbon price of US$100tonne of CO2 a giant increase from their previous price of US$4067 and walked away from three US-based oil and gas trade organisations - American Fuel and Petrochemical Manufacturers (AFPM) the Western States Petroleum Association (WSPA) and the Western Energy Alliance (WEA) over differences regarding policy positions on carbon pricing68
CDP has been asking companies to disclose their practice of using ICP since 2013 In 2020 23 of the investor responding companies have reported putting a price on carbon as compared to last yearrsquos 19 while the number of companies planning to price in the next two years reduced to 21 from 23 in 2019 After adding Supply Chain responding companies a total of 58 companies are pricing or are planning to price carbon in the next two years in 2020 a 12 increase from 2019 It was further seen that of the 23 companies that are pricing carbon in 2020 52 use a shadow price followed by implicit price
The Task Force defines an internal carbon price as ldquoan internally developed estimated cost of carbon emissionsrdquo which can be used as a planning tool to help identify revenue opportunities and risks as an incentive to drive energy efficiencies to reduce costs and to guide capital investment decisions69
52
26
4
9
44
Shadow price
Implicit price
Implicit price Internal fee
Internal fee
Offsets
Implicit price Shadow price
Types of ICP used by Indian companies
Pricing Planning to price in the next 2 years
2
25
2015
8
36
2016 2017
26
14
2018
14
32
2019
20
31
2020
2533
No
of C
ompa
nies
ICP trend in India
30
A N N U A L R E P O R T 2 0 2 0
Type of ICP Shadow price Carbon fee Implicit price Internal trading
Description Hypothetical cost of carbon emissions
A per-unit fee based on the amount of GHG the company emits (eg `700 per tCO2e)
Helps quantify the capital investments required to meet climate-related targets
Allows business units within a company to trade their allocated carbon credits based on respective emissions
Objectivesusage
The most common form of ICP is a shadow price helps organisations better understand the impacts of climate-related risks such as technological shifts or future regulations It can help a company with both risk management as well as internal strategic planning
It allows companies to model or test how a range of carbon prices affect their divisions capital investments and other planned projects It is similar to forecasting with a range of energy prices
Putting a fee on carbon helps create an actual pool of funds generating a revenue stream to help pave the way for greener projects and further RampD This prepares a company for a carbon-resilient world This tool has the ability to encourage a business to transform into an environmental leader It allows for the creation of internal funds to invest into energy efficiency or renewable energy projects in order to cut energy costs
It also builds awareness of the importance of emission reductions within different business units
An implicit price helps companies understand their initial carbon footprint and is also used as a benchmark to implement a more strategic internal price
Internal trading helps create awareness It allows companies to prepare for stringent forms such as shadow prices or internal fees
Method An additional criterion is introduced in investment analysis during the calculation of the internal rate of return (IRR)
The additional criterion is the carbon value which is incorporated into each investment decision and applied to resulting GHG emissions This carbon price is assumed the same way assumptions are made about exchange rates or commodity prices
It is implemented by voluntarily adding a cost to GHG emissions in relation to operational costs
It increases the operating expenses (OPEX)
There are short-term emissions reductions Transfers of actual funds within the company are done through two mechanisms First by offsetting GHG emissions by purchasing offset credits externally Second by providing internal financing for emission reduction projects low- carbon products amp services and RampD
The carbon fee also provides monetary incentives for pro-environment initiativesactivities
Some companies with emissions reduction or renewable energy targets calculate their lsquoimplicit carbon pricersquo by dividing the cost of abatement procurement by the tonnes of CO2e abated
Trading is driven by the allocation of a fixed number of carbon dioxide emission lsquoallowancesrsquo for individual business units with each allowance equivalent to 1 metric tCO2 If business units exceed their cap they must purchase additional allowances to offset their excess emissions
Where business units under-emit they may sell allowances Business units may also choose to invest in carbon offsets outside their own units in order to sell on the internal trading scheme72
A sectoral analysis of the data finds two high emissions intensive sectors cement and concrete followed by IT and software development An increasing number of companies from cement and IT sectors are now committing to the SBTi and moving towards aligning emissions in line with 15-degree an ICP in such cases can be effectively used as a tool for mitigating climate risks and achieving the greater goal of a SBT or a net-zero target It helps companies build their internal capacity and measure their progress
1313
2626
2222
1313
44 44
1818
Metal smelting refining amp forming
Cement amp concrete
IT amp software development
Biotech amp pharmaFood amp beverage
processing
Chemicals
Transportation equipment
31
A N N U A L R E P O R T 2 0 2 0
Below are the ICP disclosed by Indian companies in 2020
Company Price in INR (`) Price in USD ($) Type of ICP used
ACC 2541 3394 Implicit price Shadow price
Ambuja Cements 21639 3074 Implicit price
Dalmia Bharat Ltd 77334 11 Shadow price
Dr Reddyrsquos Laboratories 937 1332 Implicit price
Godrej Consumer Products Limited 750 10 Shadow price
Godrej Industries 740 10 Shadow price
Hero Motocorp Ltd private private private
Hindustan Zinc 111846 159 Implicit price
Infosys Limited 100182 1425 Implicit price
JSW Cement Limited 1566 21 Shadow price
JSW Steel Ltd 1400 20 Shadow price
Mahindra amp Mahindra 98242 1397 Internal fee
Mindtree Ltd private private private
Shree Cement private private private
Tata Chemicals 140607 20 Shadow price
Tata Consultancy Services 1131 1608 Implicit price Shadow price
Tata Consumer Products Ltd 315 448 Offsets
Tata Motors 980 14 Shadow price
Tata Steel 975 - 2720 15 -3868 Implicit price Shadow Price
Tech Mahindra 70303 10 Implicit price Internal fee
Ultratech Cement 750 1066 Shadow price
Wipro 352291 5011 Shadow price
Since these companies did not provide a conversion rate the average conversion rate for the 2019 calendar year was taken (1` = 0014224USD)
Managing climate risk with Internal Carbon Price and Science Based Targets
By integrating ICP into ambitions targets set by SBT companies can achieve greater emissions reduction SBTs empower companies to engage internal teams with a common data-driven goal and integrate their carbon reduction strategies with other business objectives70 A step that organisations can take to implement TCFD recommendations as well as achieve their SBTs is putting an internal price on carbon It is observed that having an internal carbon price can enhance an organisationrsquos competitiveness71 Several companies are already using ICP to highlight their progress towards targets and inform a business case for low-carbon investments Of the 25 companies that have disclosed to CDP in 2020 13 that committed to SBTi also have an ICP
Setting a carbon price can be a strong commitment towards driving change and action Clear goals for the ICP enable
70 Science-Based Targets How Aligning Carbon Reduction Targets With Climate Science Can Drive Business Growth SampP Dow Jones Indices 201771 httpswwwgreenbizcomarticlemanaging-climate-risk-carbon-pricing-and-science-based-targets72 CDP Handbook on Carbon Pricing73 httpswwwcdpnetenreportsdownloads491874 httpsb8f65cb373b1b7b15feb-c70d8ead6ced550b4d987d7c03fcdd1dsslcf3rackcdncomcmsreportsdocuments000002771originalCDP-Carbon-Pricing-Handbook
pdf1508927220
companies to make better decisions regarding the type and price of carbon72 A high-level commitment can provide a companyrsquos perspective and insight on how other companies have been able to adopt innovative financing practices such as ICP and carbon taxes which are spurred by setting ambitious targets in line with the SBT initiative
In January 2020 in partnership with TERI CDP India released a second handbook in ICP - Putting a Price on Carbon A Handbook for Indian Companies 20 73 a second edition to the handbook released in October 17 74The first handbook was prepared to lay out the landscape of carbon pricing and help companies understand about external and ICP along with guidance on how to approach an internal carbon price The aim of the second handbook was to further mobilise the adoption of internal carbon price by companies The handbook discusses steps to arrive at a price and use it in an organisation including details on indicative pricing levels
32
A N N U A L R E P O R T 2 0 2 0
ACC Ltd are using internal carbon price as a tool to drive and incentivise low-carbon initiatives and emissionenergy reduction projects We have observed that ICP helps ROI to look attractive and helps us make informed decisions
ACC Ltd has already committed and published their 2030 targets for specific CO2 emission reduction and use of waste derived resources (as a part of SD 2030 plan) We have also committed to SBTi and are working on setting stricter targets aligning with below 2 DS To achieve these commitments and relevant targets we believe that ICP may play an important role in prioritising our future actions and investments Going forward we also plan to use the ICP for managing risk and leveraging opportunities
mdash ACC Ltd
Steps to Setting an
internal carbon price
Make a commitment
Communicate your progress
Set the scope of the internal carbon price
Decide price level and variance
Monitoring and reporting
Define the type of ICP
01
02
03
0405
06
07
08
Map your objectives
Establish the degree of influence in business application
33
A N N U A L R E P O R T 2 0 2 0
THE RENEWABLE ENERGY THRUST In 2020 the 67 companies headquartered in India have reported a total of 291 Terra Watt hours (TWh) electricity consumption more than double the previous yearrsquos number Notably the significant increase in total electricity consumption is attributed to just one company ndash Vedanta Limited with 151 TWh of electricity consumption for its global operations
The total electricity consumption excluding Vedanta is 140 TWh 48 higher than the previous year The rise in the total reported electricity consumption is primarily due to an increase in the number of responding companies from the energy intensive sectors These 67 companies have consumed about 16 TWh renewable electricity which is 6 of the total electricity consumption reported in 2020 The share of renewable electricity is 11 without counting Vedanta in the sample This is 6 higher than the previous year
The growth in the share of renewable electricity consumption is due to multiple factors such as the increasing number of voluntary corporate GHG emission reduction targets renewable energy targets and compliance targets such as Renewable Energy Purchase Obligations (RPO) In 2020 18 companies from India have reported various types of renewable energy targets Some of these companies have taken more than one renewable energy target type These 18 companies have reported 98 TWh of electricity consumption of which 13 is from renewable energy sources The level
Type of renewable energy targets
Renewable Energy Targets
17
1 1 2Renewable Electricity
Consumption
Renewable Electricity
Production
Renewable Electricity Capacity
Renewable Energy Financing
Target
No
of C
ompa
nies
RE100 is the global corporate renewable energy initiative bringing together hundreds of large and ambitious businesses committed to 100 renewable electricity Led by the Climate Group and in partnership with CDP RE100rsquos mission is to accelerate change towards zero carbon grids at scale There are 4 companies headquartered in India that have committed to the RE100 initiative - Dalmia Bharat Ltd Infosys Ltd Mahindra Holidays amp Resorts India Ltd and Tata Motors Ltd
The RE100 membership continues to grow and diversify - with 42 of new members coming from the Asia-Pacific region in 2020 With 260+ members and gt278 TWh of electricity consumption aggregated electricity demand of RE100 members is higher than Australiarsquos The share of renewable electricity is 42 of total consumption showing strong progress towards 100 goal
Over 70 global RE100 members have operations in India ndash with gt2 TWh of electricity consumption in the country About 39 of electricity consumed in India came from renewable energy sources largely sourced through unbundled energy attribute certificates and power purchase agreements
Visit RE100org and follow RE100 on Twitter
34
A N N U A L R E P O R T 2 0 2 0
Note Some companies have reported renewable electricity consumption total instead of break-down details as per the sourcing method Data for those companies is not included in the above chart
131
17
03
01
Renewable Electricity Sourcing Methods (TWh)
Self-generation
Unbundled Energy Attribute Certificates (EACs)
Power Purchase Agreement (PPA)
Green Electricity Products
of ambition ie a share of renewable energy in the target year for most of the companies varies between 20-100 Showing the leadership in renewable electricity sourcing 3 companies75 have committed to source 100 renewable electricity across their operations and joined RE100 initiative
GHG emission reduction targets are popular among companies in India and 57 companies have reported absolute intensity or both absolute and intensity targets Among these 30 companies have committed to science-based targets Initiative and their targets are in line with climate science Six companies have dedicated scope 2 emission reduction targets Scope 2 emissions are indirect emissions from the generation of purchased energy consumed by the reporting company Companies with GHG emission reduction targets tend to source renewable energy to reduce their emissions primarily scope 2 emissions The Majority of these companies have taken exclusive renewable energy targets to support meeting their GHG emission reduction targets
Renewable energy plays an important role in the corporate value chain due to its zero-carbon intensity and ability to provide long-term energy security About 34 companies have identified opportunities related to shifting energy usage towards low-carbon energy sources across the value chain Of these 32 have identified opportunities in the direct operations followed by 6 companies in the upstream and 2 in the downstream of the value chain These companies have estimated energy related opportunities worth `317 billion mainly in the direct operations Half of these companies anticipate short time frame (1-5 years) to tap these
75 4 India headquartered companies are committed to the RE100 initiative 3 of them report to CDPrsquos climate questionnaire
opportunities Companies have not just identified energy related opportunities but implemented energy related initiatives in the reporting year across their operations About 31 companies have implemented low-carbon energy consumption or production related initiatives in the reporting year that resulted in an estimated annual carbon savings of 18 million tCO2 and `27 billion of annual monetary savings
Companies from the manufacturing and materials sectors have reported the highest volume -14 TWh of renewable electricity consumption Manufacturing sector companies are relatively performing better than companies from the materials sector in terms of the share of renewable energy in total electricity consumption There are 25 companies from these two sectors mainly energy intensive business such as cement metals and mining steel and transport original equipment manufacturers (OEMs) The aggregate electricity consumption of these companies is over 100 TWh The companies from the fossil fuel-based energy generation are not included in the following charts
A detailed breakdown shows that self-generation of renewable electricity is the most preferred sourcing option among companies followed by purchase of renewable electricity through unbundled Energy Attribute Certificates (EACs) and Power Purchase Agreement (PPA) with an onsiteoffsite generator Up to 10 companies have reported 03 TWh of total renewable electricity consumption via PPA (on-grid and off-grid) which has declined from 11 TWh of consumption reported in the previous year
35
A N N U A L R E P O R T 2 0 2 0
Materials Manufacturing Food beverage amp agriculture
Biotech health care amp pharma
OtherInfrastructureServices
3
17
6
35
3
20
12
Total Electricity Consumption (TWh) Total RE Consumption (TWh) RE
Electricity consumption by sector with Vedanta Limited included in the analysis
Electricity consumption by sector excluding Vedanta Limited
Materials Manufacturing Food beverage amp agriculture
Biotech health care amp pharma
OtherInfrastructureServices
7
17
35
20
1236
Total Electricity Consumption (TWh) Total RE Consumption (TWh) RE
TWh
TWh
36
A N N U A L R E P O R T 2 0 2 0
2737worth opportunities
identified
Billion
`
16of Renewable Electricity Consumption Reported
TWh
704of total [ Scope
1+2location-based] emissions reported
MtCO2e
7138Inherent financial
risk identified
Billion
`
25have Internal Carbon
Pricing
Companies 52Companies in India
SBTi
37
A N N U A L R E P O R T 2 0 2 0
WATER SECURITY The way out of water crisis
Five of the worldrsquos largest cities under water stress are in India with Delhi ranked second on the list76 The water crisis is more alarming than imagined ndash 600 million people in India face high-to-extreme water stress77 Indiarsquos water demand is projected to increase by two times the available supply by 2030 putting hundreds of million people at the risk of water scarcity and ultimately losing the country 6 of its GDP78 In 2019 the country witnessed the worst droughts in recorded history Over 500 million people were affected across the country and major cities such as Chennai experienced lsquozero dayrsquo scenarios wherein water literally ran out Since improvements in water security are essential for Indiarsquos development investing in water merits a sound business case
Though 80 of Indian states have legislations on water conservation and prevention of encroachment of water bodies79 poor data management absence of water pricing inefficient irrigation techniques and the lack of adequate sewage treatment curb the countryrsquos ability to manage water sustainably80 In recent times companies have become more aware of the risks of increased water consumption pollution and unstable precipitation aggravated by climate change81 A 2019 World Bank Report (Quality Unknown)82 warned of the economic health and environmental damage caused by contaminated water highlighting water quality as an ldquoinvisible crisisrdquo that is under-appreciated and underestimated It warned that poor water quality driven by industrial agricultural and urban pollution could lead to a reduction by 13rd of economic growth in some places
76 httpsocialnitigovinuploadssamplewater_index_report2pdf77 httpsnitigovinsitesdefaultfiles2019-06Final20Report20of20the20Research20Study20on2020
Composite20Water20Resources20Management20Index20for20Indian20States20conducted20by20Dalberg20Global20Development20Advisors20Pvt20Ltd_New20Delhipdf
78 httpsnitigovinsitesdefaultfiles2019-06Final20Report20of20the20Research20Study20on2020Composite20Water20Resources20Management20Index20for20Indian20States20conducted20by20Dalberg20Global20Development20Advisors20Pvt20Ltd_New20Delhipdf
79 httpsocialnitigovinuploadssamplewater_index_report2pdf80 httpswwwcdpnetenarticlescompaniesindias-looming-water-crisis-a-call-to-action-for-companies81 Think globally act locally new guidance for companies on sustainable water use - CDP82 httpsopenknowledgeworldbankorghandle109863224583 httpswwwwriorgaqueduct84 Aqueduct Country Ranking (wriorg)85 The objective of the campaign is to drive further corporate transparency around climate change deforestation and water
security by encouraging companies to respond to CDPrsquos disclosure request
Water stress in India remains a key challenge Aqueduct83 ranked India 13th in the world on high water stress score -- 412 out of 584 The private sector is vital to delivering a water secure future Companies in the food textile retail energy industrial chemicals pharmaceuticals and mining sectors account for and wield influence over 70 of the worldrsquos water use and pollution The decisions one takes about how to grow and expand can make or break onersquos ability to tackle the global water crisis
CDPs Water Security program requests companies to disclose critical information on water parameters which are crucial to the business It helps companies monitor and benchmark their performance on these critical parameters to ensure adequate water availability for their businesses Investors and customers are increasingly keen to know how companies respond and adapt to water-related risks The Non-Disclosure Campaign (NDC) is an annual CDP initiative where investors can target companies that have been requested to respond but failed to do so85 Globally for water security Indian companies achieved the highest response rate to the NDC campaign with 50 of engaged companies submitting a response on this critical issue ndash 28 times higher than their control group Responding through CDPrsquos Water Security questionnaire will help businesses understand the risks and opportunities associated with water-related issues
Reduction in Economic Growth caused by power water in some countries
13rd
Water stress by 2030-ratio of withdrawals to renewable supply
People will live in water stress area by 2030
Increase in water demand in last 100 years
WRI 2020
UNEP
UN World Waterdevelopment Report 2020
increase in Water Security investor responding companies in India
8756
1in 2
x6
38
A N N U A L R E P O R T 2 0 2 0
helping them capitalise on actions to safeguard water resources86 The number of disclosing companies increased from 15 last year to 28 companies this year an increase of approximately 87
Measuring Monitoring and Verification
Regular measuring and monitoring of water-related parameters across all operations and the entire value-chain is the first step in laying the path for efficient water management In 2020 28 companies measured a total of 268 water related parameters It was found that amongst volumetric water metrics water discharge was the most monitored accounting for 41 of all measurements Water withdrawals accounted for 29 of all measurements water consumption for 10 and water recycling and reuse accounted for 10 each Although these metrics were being continuously monitored and measured by companies a sector-wide analysis shows that significant growth in some water-intensive sectors has put pressure on the demand for industrial water The electric utilities sector for example reported an increased water demand of 771174 megalitres in 2020 which was the highest amongst all sectors Adani Power Ltd highlighted new aqusitions and increased power generation as major reasons for rise in water demand this year The chemicals sector showed the second highest rise in water demand this year -- 195832 megalitres this year
Some companies have shouldered the responsibility of having audits conducted on their reported water metrics for greater
86 httpsb8f65cb373b1b7b15feb-c70d8ead6ced550b4d987d7c03fcdd1dsslcf3rackcdncomcmsreportsdocuments000000893originalCDP-india-business-case-for-water-disclosurepdf1472051621
87 https6fefcbb86e61af1b2fc4-c70d8ead6ced550b4d987d7c03fcdd1dsslcf3rackcdncomcmsreportsdocuments000005312originalAnalysis_of_CA100__Data_for_CDP_Investor_Signatories_v5pdf1596046258
88 https6fefcbb86e61af1b2fc4-c70d8ead6ced550b4d987d7c03fcdd1dsslcf3rackcdncomcmsreportsdocuments000005312originalAnalysis_of_CA100__Data_for_CDP_Investor_Signatories_v5pdf1596046258
89 https6fefcbb86e61af1b2fc4-c70d8ead6ced550b4d987d7c03fcdd1dsslcf3rackcdncomcmsreportsdocuments000005312originalAnalysis_of_CA100__Data_for_CDP_
transparency and credibility Amongst the verification standards that were employed 26 of the responding organisations used ISAE 3000 with Tata Chemicals being the sole company to apply both ISAE 3000 and AA1000AS to meet assurance standards
In 2020 25 responding companies withdrew consumed and discharged 7933064 megalitres 1403171 megalitres and 6625032 megalitres of water respectively However in 2019 these figures stood at 217736 megalitres 860517 megalitres and 67686 megalitres respectively for 15 responding companies
WATER ASPECTSWater Consumptionndash the amount of water a company has drawn into its boundaries and has permanently removed from the local water cycle90
Of the 28 respondents three did not disclose water consumption data or were in their first year of measurement 9 increased their water consumption over the previous reporting year 12 decreased it and 4 reported no change
Water Withdrawalsndash the amount of water the company has temporarily removed from the local water cycle and returned as discharge water91
Of the 28 respondents three did not disclose water withdrawal data or were in their first year of measurement 7 reported an increase over the previous year 14 had lowered their withdrawal and 4 reported no change
Water Discharges ndash the amount of water that leaves a companys facility and if left untreated could be a source of pollution92
Of the 28 respondents three did not disclose water discharge data or were in their first year of measurement 9 reported an increase in water discharge over the previous year 6 lowered it and 10 reported no change CDPrsquos data highlights new acquisitions increased production activities and project expansions as the primary reasons for increased water demand amongst the companies
of companies measured all water aspects (withdrawals discharge and consumption) across 100 of facilities
64
of companies believe that availbility of good quality freshwater is vital for the success of their business39
2910
4110
10
Water withdrawalsWater recycledreused
Water discharge
Water consumption
Others
Measured and monitored water aspects
39
A N N U A L R E P O R T 2 0 2 0
Data further shows that brackish surface water and seawater were the primary water sources for industries followed by fresh surface water source The electric utilities sector was the most reliant on brackish surface water and seawater accounting for 72 of the sectorrsquos total water withdrawals At 59 fresh surface water was the primary source of withdrawal for the chemicals sector Of the 28 companies 13 had implemented water conservation measures to reduce water withdrawals from groundwater sources this year Water withdrawals from groundwater - renewable accounted for less than 05 of total withdrawals
In terms of water discharge most (81) was released into brackish surface water and seawater environments Discharges into fresh surface water accounted for the remaining 19 of the total discharges Our data suggests more companies are installing zero liquid discharge units and water harvesting techniques across their facilities leading to less groundwater discharge
Fresh surface water accounted for 29 of total water withdrawals by source in 2020 Indiarsquos major river basins - Ganges Brahmaputra Godavari Indus and Cauvery are the primary source of freshwater for the industries Around 15 of total freshwater demand from CDP responding companies was supplied by the
Investor_Signatories_v5pdf159604625890 Worldrsquos 18 Most Water-Stressed Rivers | World Resources Institute (wriorg)
Ganges and Brahmaputra river basins another 15 came from the Godavari basin followed by Cauvery Indus Banas and Sabarmati river basins The demand for water has increased over the years causing these basins to rank among the most water-stressed catchments in the world90 Of the 83 facilities in India 53 were in water-stressed regions Our data shows that around 60 of total responding companies withdrew water from water-stressed regions Of these nine were from the materials industry and two were from the food beverage amp agriculture industry
Governance and Business Strategy
For a long time corporate sustainability strategies have focused on measurable and manageable challenges such as product footprint efficiency in supply chain water conservation and others Businesses have begun to take stock of water security by innovating for improved efficiency measuring direct withdrawals assessing risk to neighbours and considering leakages
CDPrsquos data shows that corporate leaders across India are responding to this crisis by focusing on their water policy to monitor risks and opportunities and integrate it in their strategies Around 71 companies report having a documented water policy that is accessible to the public Up to 93 companies indicated that they have a board-level oversight of water related issues within the organisation observed either by the Chief Executive Officer (CEO) or the director on board followed by the board-level committee
Around 43 of the responding companies report on water-related issues quarterly and 33 more frequently This shows the increasing self-awareness among companies on water-related issues Further 63 of these companies offer some form of
facilities out of a total of 83 from the responding companies were in areas with water-stress53
Water discharge by destination
Brackish surface
water and Seawater
Fresh surface water
Groundwater
Third party
532
225
2
975
156
93
Water discharge (megalitersyear)
125
013
1
Brackish surface
water and Seawater
Groundwater ndash non
renewable
Groundwater ndash renewable
ProducedEntrained
water
Third party
Fresh surface water
231
800
261
04
405
21
489
Water withdrawals (megalitersyear)
Water withdrawals by destination
7564
662
6
No
of c
ampa
nies
Industry
1
Appa
rel
1
Biot
ech
hea
lth
care
amp p
harm
a
1
Man
ufac
turin
g
2Fo
od b
ever
age
amp ag
ricul
ture
1
Pow
er
gene
ratio
n
1
Tran
spor
tatio
n se
rvic
es
1
Serv
ices
9
Mat
eria
ls
Industry-wise water withdrawals from water-stressed areas
40
A N N U A L R E P O R T 2 0 2 0
incentive to their employees ndash monetary or otherwise -- for the management of water related issues
Businesses are stepping up and playing a vital role in developing water initiatives that can ease the stress on crucial watersheds Companies are also looking into water security related long-term business objectives and financial planning as a part of their overall business plans Almost 70 companies prefer short to mid-term (5-10 years) over long-term (11-30 years) planning This does not come as a surprise as water effects are felt locally and require more immediate strategic planning Of the 28 reporting companies 12 use climate-related scenario analysis to inform its water-related business strategy and eight anticipate doing so in the next two years A majority of these companies belong to the chemicals and the electric utilities sector
In 2019 about 13 companies were pricing their water this increased in 2020 to 18 and 50 are now exploring the its possibilities Companies such as Ambuja Cement (US$110 `7800
91 marico-sustainability-report-18pdf
Marico Ltd Establishing a strategy to improve water-security across operations and value chain
With a host of agro-based products water availability is a crucial parameter for Marico Ltd92 Under the risk management framework it has identified adverse impact of water scarcity as an environmental risk to the company To mitigate this environmental risk the company has initiated watershed management programs and a reduced-reuse-recycle model of water management across its operations Through a water stewardship program the company aims to address water security challenges in low rain-fed areas around its workplace and factories
In the reporting period FY 19-20 the company withdrew 202886 cubic meters of water and reported a reduction of 9 from previous year The company had reported a reduction of 31 in water intensity from the 2014 level through the company-wide introduction of water efficiency measures improvements in water recycling water-efficient taps and rainwater harvesting systems For improving water management practices across water stress areas Marico utilised the WRI aqueduct tool to evaluate water risk across all manufacturing facilities in India This tool helped the company identify the number of facilities that fall under the water stress area -- according to it five out of eight plants are in such zones The implementation of water conservation initiatives had helped three water-stressed sites reduce water consumption over the previous year Among three water-stressed sites Jalgaon reported 15 reduction in water consumption Baddi reported 16 and Paonta 28
Establishing a strategy to reduce and minimise water use was one of the companys key commitments Marico foresees its future water withdrawal levels reducing given its move towards improving water efficiency and incorporating recycling throughout the production cycle
Frequency of reporting on water-related issues
633
43
Annually
More frequently than quarterly
Quarterly
6
10 2Half-yearly
As important matters arise
Less frequently than annually
41
A N N U A L R E P O R T 2 0 2 0
to US$8240 `579800 per megalitre) Dr Reddyrsquos Laboratories (US$088`67 to US$591`449 per KL) Piramal Glass and Tata Steel use an internal price on water
Risks amp opportunities
Dwindling water supply is a major cause of concern for businesses since it poses significant direct and indirect impacts Visible risks such as droughts have a more explicit impact as they ruin vegetation and severely undermine the agriculture sector But subtle impacts present challenges to other sectors Water shortages also threaten the long-term viability of businesses by leading to higher costs eventually borne by the consumers Without proper management the economic repercussions of water scarcity will be felt in myriad ways92
In 2020 companies that experienced detrimental water-related impacts have incurred financial losses worth `1580 million Physical risks such as inadequate infrastructure and increased water stress account for more than half of these commercial losses followed by reputational-cum-market like subpar access to water sanitation and hygiene services and regulatory risks eg- failure to set mandatory water efficiency conservation and recycling standards Corporations should thus strategically prioritise dealing with these risks to safeguard their financial bottom lines For this organisations have looked to secure alternate sources of water supply adopt water efficiency and conservation practices as well as reuse and recycling of water
A 2018 report from NITI Aayog93 highlighted the fact that the country faced its worst water crisis that year Rising water challenges have put strong regulatory pressure on businesses in India with significant operational risks The private sector is a big contributor towards deepening water security issues but is also crucial in addressing it
Given the current situation with water resources it is perhaps unsurprising that many of the companies responding to CDP find themselves exposed to a plethora of physical and transition risks ndash that is risks from regulatory or consumer reforms aimed at addressing the water crisis These risks threaten their reputation and license to operate their supply chains security financial stability and their ability to grow As per CDPrsquos Global Water
92 httpsglobalriskinsightscom201612economic-cost-global-water-scarcity93 httpsnitigovinsitesdefaultfiles2019-06Final20Report20of20the20Research20Study20on2020Composite20Water20Resources20Management20Index20
for20Indian20States20conducted20by20Dalberg20Global20Development20Advisors20Pvt20Ltd_New20Delhipdf94 https6fefcbb86e61af1b2fc4-c70d8ead6ced550b4d987d7c03fcdd1dsslcf3rackcdncomcmsreportsdocuments000005165originalCDP_Global_Water_Report_2019
pdf159110644595 The term WASH refers to the provision of water sanitation and hygiene Universal affordable and sustainable access to WASH is a key public health issue within international
development and is the focus of the first two targets of Sustainable Development Goal 6 (SDG 6)96 httpswwwworldbankorgentopicwaterbriefwash-water-sanitation-hygiene-and-covid-19
Report 201994 the combined business value at risk reported in 2019 topped out at US$425 billion with about 40 of the risks anticipated to hit within the next 1-3 years Whether it was the blockading of a Newmont Goldcorp mine in Mexico or poor water quality threatening the production of Unileverrsquos Hellmannrsquos mayonnaise in the Mississippi River Basin the impacts of the global water crisis are already being felt
Water risks and risk assessment
As per the 2020 data 71 of the responding companies consider current or future water-related regulations as a risk to business followed by 57 companies that consider access to WASH95 services for employees as very relevant and always included in their water-risk assessments This shows that companies are vigilant about providing safe access to drinking water sanitation arrangements and proper hygiene at workplace The COVID-19 pandemic has highlighted the importance of WASH to human health and well-being Safely managed WASH services along with good hygiene practices can help prevent infectious diseases that kill millions each year96 In addition 50 companies reported that water used for their key commoditiesraw materials is relevant enough to be considered for their risk-assessment This was the most pertinent for chemical sector companies
of the 28 Indian responding companies undertake water-related risk assessment25
Total financial loss by reporting companies as per risk type
38
53
9
Reputation and Market Risk
Physical Risk
Regulatory Risk
1580 MILLION
In 2020 companies that experienced detrimental water-related impacts have incurred financial losses worth
1580 million
42
A N N U A L R E P O R T 2 0 2 0
It is crucial to consider stakeholders in risk assessment procedures for a comprehensive understanding of water-related risks Of the 25 companies that undertake water-related risk
97 httpswwwweforumorgreportsthe-global-risks-report-2020
assessments 68 always include employees in their internal assessment procedures by conducting training and awareness programs on water conversation initiatives communicating water-related policies etc This is followed by regulators and local communities who are relevant in water-risk assessment procedures at 61 and 54 respectively for the responding companies It is a positive sign that Indian companies are engaging with their employees and local communities and ensuring that the latter are not negatively impacted in terms of habitation health and water availability
According to The World Economic Forumrsquos Global Risk Report 202097 water crises are among the top five risks in terms of impact for the past ten consecutive years Water-related risks are substantive in the risk assessment processes and identified as a threat to companiesrsquo bottom line putting at risk a combined business value of US$425 billion according to CDP 2019 data
RegulatoryPhysical
Reputational
Risk due to company
Risk due to context
Expectedunexpected change or uncertainty in law or regulation
Water scarcity too much water water
unfit for use
Litigation product risks due to changes in
consumer behavior
Caused by inefficient operations produces and services resulting in water pollution over exploitation etc
Caused by changing environmental and social conditions like droughts
flooding etc
Relevancy of water-related risks
7157 57 50 46 46 43
11
Water-related
regulatory frameworks
Access to fully-
functioning safely
managed WASH
services for all employees
Water availability at a basincatchment
level
Implications of water on
your key commoditiesraw materials
Stakeholder conflicts
concerning water
resources at a basincatchment
level
Water quality at a basin
catchment level
Status of ecosystems and habitats
Other contextual
issues please specify
Empl
oyee
s
Regu
lato
rs
Loca
l com
mun
ities
Rive
r bas
in m
anag
emen
t au
thor
ities
Wat
er u
tiliti
es a
t a lo
cal l
evel
Stat
utor
y sp
ecia
l int
eres
t gr
oups
at a
loca
l lev
el
Inve
stor
s
Supp
liers
Oth
er w
ater
use
rs a
t a
basi
nca
tchm
ent l
evel
Oth
er
NG
Os
Cust
omer
s
No of Companies age of Companies
Relevancy of stakeholders in water-risk assessment
6861 54 50 50 46 46 39 36 32 2918
43
A N N U A L R E P O R T 2 0 2 0
Water risk event
Impacting business
Increased Operational amp maintenance Costs Increased Compliance amp
Administration Costs
Closure of Operations
Supply chain distributions
Brand Damage and LitigationsShareholder
Distributions
Risk transferRisk avoidance and mitigation
Technological Risks
Repurational amp Market Risks
Regulatory Risks
Physical Risks
Financial ImpactsResidual Water RiskInherent Water Risks
Increased water stress
143721Increased water scarcity
41105Drought
17604Inadequate infrastructure
820
Physical Risks
Ecosystem vulnerability
300Severe weather events
69Declining water quality
63Flooding
13
Regulatory Risks
Technology Risks
Higher water prices Transition to
water intensive low carbon energy sources
Tighter regulatory standards
2333
120
All the figures reported are in million rupees
44
A N N U A L R E P O R T 2 0 2 0
CDPrsquos data shows that physical risks seem to have the highest magnitude of impact on the Indian responding companies Drought is seen to be the primary driver of potential substantive impact
Where there is risk there is opportunity
Where therersquos risk therersquos reward Industrial wastewater for example is a vast untapped resource It is a potential source of heat power process water and high-value materials And there has never been a better time for this transformation to take place -- technologies are better the regulatory climate is favourable and the business case is clear Meanwhile the market demand for pollution-free products is growing For companies to thrive they will need to be aligned to changing consumer demands If
98 httpswwwmarketsandmarketscomMarket-Reportssmart-water-management-market-1265html
they respond to these opportunities then market differentiation resilience and profitability are on the table
Globally corporate leaders have started realising the untapped potential of smart water technology and the market for smart water management is anticipated to grow from US$846 billion in 2016 to US$2010 billion in 202198 Industrial wastewater has for a long time been reused for cooling towers steel works oil refineries textile manufacturing and paper production It was found that 15 of the 23 companies valued improved water efficiency in operations as their primary opportunity having a substantive financial or strategic impact on business
of the 28 responding companies (approx 93) identified water-related opportunities in their business26
Improved water efficiency in operations
Increased resilience to impacts of climate change
Reduced impact of product use on water resources
Improved community relations
Water recovery from sewage management
Resilience to future regulatory changes
Sales of new productsservices Increased brand value
3000million
`4000
million18752
million
opportunities were identified by 21 respondents
opportunities were identified by 11 respondents
opportunities were identified
by 9 respondents
opportunities were identified
by 4 respondents
Efficiency Resilience Products and services
Markets
22
14
10
4
`329
million
`
`
45
A N N U A L R E P O R T 2 0 2 0
26
17
14
17
2
Others
Recyclingreuse
Consumption
Product water intensity
Discharge
14
10Withdrawals
Water use efficiency
Categories of water targets monitored at the corporate level
of companies set company-wide water targets
of companies set company-wide water goals
5556
Businesses have identified transparency in water management issues as a fundamental activity and disclosure through CDPrsquos annual water questionnaire produces a standard comparable dataset McGill University and Millani found that companies disclosed through CDP ranked 19 percentiles better than the average business in their ability to access capital99 The research showed that a comprehensive voluntary disclosure produces a quality management team with enhanced awareness of threats and opportunities linked to climate and environmental change
Targets and Goals100
In response to declining water resources many companies have started engaging in water stewardship and setting water targets aligned with SDG Goal 6 to ensure availability and sustainable management of water sanitation and hygiene facilities for all101 Developing water-related targets helps companies make meaningful change from informed actions at the local level102 In 2020 four companies did not set water-related targets within their operations Whereas 24 companies had water-related targets 26 of them had set targets for product water intensity 17 set recyclingreuse targets and 14 focused on water use efficiency
Companies can set goals and targets on a range of operational issues to drive performance andor manage risks and opportunities CDPrsquos data shows that a majority had set targets at the company-wide level -- 55 of responding companies reported setting water targets across the company This was followed by 26 who set water targets at the business level and 19 at the site or facility level While setting water goals around 56 of companies monitored their goals at the company level 24 at the sitefacility level and the remaining at the basin business or country-level
99 Craig M Coulombe E Nostrat A 2019 The Role of CDP Disclosure to Improve Access to Capital Research Note httpsf01c8ee6-cac3-40ff-a0e4-8bfb54f2b88bfilesusrcomugd66e92b_30b06fd11b9c43d88428f768676e9a8bpdf
100 Targets ndash quantitative Goals - qualitative101 httpsunstatsunorgsdgsreport2020goal-06102 httpsceowatermandateorgsite-targets-guide
A company has various drivers for setting goals and targets and it tries to align these with increased stakeholder concerns and environmental legislation Data shows that most organisations considered reducing environmental impact and risk mitigation as the primary motivation for monitoring water goals and targets Organisations also considered brand value protection as one of the important factor while setting goals
24
4
Target Set No Target
No
of C
ompa
nies
Water targets monitored at the corporate level
46
A N N U A L R E P O R T 2 0 2 0
Drivers behind setting water targets and goals at the corporate level
Reduced environmental impact
Water stewardship
Risk mitigation
Recommended sector best practice
Corporate social responsibility
Brand value protection
Cost savings
Shared value
Climate change adaptation amp mitigation strategiess
Commitment to the UN SDG
Increase freshwater availability for users
Other drivers
45
14
14
2
2
2
5
14
16
12
161212
12
4
4
4
44
GoalsTargets
age of Companies
47
A N N U A L R E P O R T 2 0 2 0
PROTECTING OUR FOREST WEALTH
The world lost an estimated 10 million hectares of forest annually between 2015 and 2020104 Protecting and restoring forests and other natural ecosystems could provide up to 30 of climate change mitigation action needed to limit global warming to below 20C by 2030105
Global demand for agricultural commodities is the primary driver of deforestation and ecosystem conversion -- timber is extracted unsustainably and land is cleared for agricultural production This represents major risks to businesses as commodities associated with deforestation such as palm oil soy cattle and timber products are the building blocks of millions of products traded globally and therefore feature in the supply chains of numerous organisations
103 httpswwwipccchsrccl104 The State of the Worldrsquos Forests 2020 Forests biodiversity and people105 httpswwwpnasorgcontent1144411645106 httpsappsfasusdagovnewgainapiapiReportDownloadReportByFileNamefileName=Oilseeds20and20
Products20Annual_New20Delhi_India_04-01-2020
The unsustainable production and supply of these commodities and activities not only poses a significant business risk but also has a severe negative impact on the environment especially the climate crisis
Deforestation is fundamentally linked to climate change According to the IPCC Special Report on Climate Change and Land (2019)103 11 of global GHG emissions are from deforestation and from the conversion of natural ecosystems for human use
At an 8 annual growth rate edible oil consumption in India is growing faster than the 3 growth rate in production Imports and imports are rising to fill the gap As a result India still is the largest importer of edible oils followed by China European Union and the United States Indiarsquos edible oil imports in MY 202021 are predicted to rise 6 to 15 MMT of this 85 MMT will be palm oil 35 MMT soybean 28 MMT sunflower seed oil and 02 MMT rapeseed (canola) oil
-United States Department of Agriculture106
In 2020 three Indian companies responded to CDPrsquos forests questionnaire -- one responded to the request for disclosure from investors while two responded to their customers Globally 687 companies responded to CDPrsquos forests questionnaire and 57 of them evaluated deforestation-related risks at US$5312 billion
13The mitigation potential of reduced deforestation is
13 of the global emissions
We cant address climate change without protecting our forests
They are vital carbon stores that help reduce global warming
48
A N N U A L R E P O R T 2 0 2 0
Disclosure on deforestation management through CDP could be a significant opportunity for companies operating in India one of the largest importers of palm oil in the world This can help Indian companies tap into lucrative opportunities by scaling sustainable trends CDPrsquos forests questionnaire allows companies that produce source or use palm oil soy timber cattle cocoa coffee and rubber to disclose Moreover new biodiversity-focused metals amp mining and coal sector questionnaires were introduced in 2019
Palm oil is the most commonly used processed oil in industrial food production with its production being responsible for 5 of global tropical deforestation107 Indiarsquos palm oil imports account for nearly 23rd of its total imports of edible oil This demand was shaken in 2020 when the pandemic hit with a 40 fall in the consumption of palm oil during the lockdown108 Indiarsquos imports which account for nearly 20 of the global trade in palm oil will have a major effect on efforts to make its production and processing sustainable The primary barrier for sustainable palm oil consumption in
India stems from it belonging to a more price-sensitive and volume driven market making environmental impacts a low or non- existent priority in the minds of consumers
Climate change can reduce palm oil production and with demand outstripping supply prices could rise The Roundtable on Sustainable Palm Oil (RSPO) has developed a set of environmental and social criteria which companies must comply with in order to produce Certified Sustainable Palm Oil (CSPO) When properly applied these criteria can help in minimising the negative impacts of palm oil cultivation
107 Deforestation amp Palm Oil 108 As worldrsquos largest importer of palm oil India has a duty to push for ethical production practices109 httpsseaofindiacominterim-data-on-import-of-edible-oils-march-2020-down-by-32-percent-nov19-to-mar20-down-by-10-percent110 httpsappsfasusdagovnewgainapiapiReportDownloadReportByFileNamefileName=Oilseeds20and20Products20Annual_New20Delhi_India_04-01-2020111 httpsresourcetradeearthyear=2018ampexporter=76ampimporter=699ampcategory=87ampunits=value112 httpswwwrvonlsitesdefaultfiles201705poultry-sector-in-india-2017pdf113 httpsresourcetradeearthpublicationscocoa-trade-climate-change-and-deforestation
The Sustainable Palm Oil Coalition for India (I-SPOC) was formed to promote the uptake of sustainable palm oil and its derivatives in India CDP amongst others has joined it as a member
Soy cultivation is the second largest soft commodity driver of tropical deforestation after cattle products Various aspects of soy production generate GHGs that contribute to climate change India imports around 33 lakh tons of soybean oil109 According to data from the US Department of Agriculture India
is set to import 35 lakh metric ton of soybean oil in 20202021110 In addition India is also responsible for clearing huge spaces of forest land in Brazil that contributed to 23 of soybean imports to India in 2018111 Soy is also used as fodder for livestock and a growing local demand for poultry products will further affect Indiarsquos position on deforestation The country ranks amongst the top four producers of egg and chicken in the world and it is increasingly exporting to the Middle East and Europe112
Cocoa has been a notable agent of deforestation since the last century The global production of cocoa has increased from 34 million to 45 million tonnes between 2000 and 2014 while the land use footprint of its plantations rose by 37 to 257 million acres113 About 90 of
cocoa is produced by 7 countries -- Ivory Coast Ghana Indonesia Ecuador Cameroon Brazil and Nigeria The dearth of incentives for improving the plantations combine with high investment costs to make cocoa a low yield crop forcing farmers to resort to clearing untouched forest lands in order to meet the growing demand and
lsquoPalm oil consumption dropped by
in 2020 in India due to COVID-19rsquo
40
Climate-Water-Forest nexus
Water is an essential component of mitigation and adaptation strategies
Rising temperatures and changing weather patterns increase stress on water availability
Tropical forests provide substantial emission reductions by acting as carbon sinks
Droughts resulting from rising temperatures and changes in weather patterns increase the risk of forests fires
A major portion of gobal freshwater depends on forests
49
A N N U A L R E P O R T 2 0 2 0
for cutting down production costs114 In Southern India Cocoa is mainly grown as an intercrop in conjunction with coconut areca nut oil and rubber plantations Indiarsquos consumption in 2015-16 was 30000 tonnes of which 57 was imported while the domestic production rose at an annual rate of 37 in the same period115 Failure to protect forests in the event of a sharp cocoa price increase will lead to unsustainable levels of deforestation116
The US$10 billion coffee industry too leaves a gargantuan ecological footprint It is estimated that every cup of coffee consumed results in the loss of one square inch of forest cover117 Each year around 250000 acres of land is cleared for coffee which is unsustainable The Kodagu district
in the Western Ghats of India is a major biodiversity hotspot which produces about one-third of the countryrsquos coffee This region has more than 270 tree species which are all under significant ecological stress due to the coffee farms that threaten land use and land cover while potentially leading to the felling of about 21000 trees118
An estimated 8-10 of global production of low-cost timber products comes from illegal logging in forests To meet the burgeoning demand of timber produce about 25 million acres of land is converted to fast-
wood forests (timber plantations) across the world annually and this hampers the ecosystem services that nature provides us119 With the World Bank forecasting that the global market for wood is set to quadruple by 2050120 reducing timberrsquos environmental footprint is vital for the industryrsquos success In India there is no provision of a central data pool that maintains records of production and consumption of timber There is a need to address this inconsistency in reporting and data collection by forging a comprehensive strategic policy and providing institutional support121 This would ensure effective collaboration among all stakeholders that would result not only in the production of quality forest products but also a sustainable timber sector
114 httpsresourcetradeearthpublicationscocoa-trade-climate-change-and-deforestation~text=As20cocoa20tends20to20beforest20loss20over20this20time115 httpseconomictimesindiatimescomindustrycons-productsfoodalthough-indias-consumption-of-chocolate-is-steadily-growing-but-we-still-depend-on-imports-for-116 httpsnationalzoosieduscbimigratorybirdsresearchcacaorufcfm117 httpsohiostatepressbookspubsciencebiteschaptera-bitter-brew-coffee-production-deforestation-soil-erosion-and-water-contamination~text=For20every20cup20of20
coffeeinch20of20rainforest20was20destroyedamptext=Chemical20buildup20in20soils20andsoil20eroding2C20and20land20degradation118 httpswebcachegoogleusercontentcomsearchq=cacheYhaeYHVPWasJhttpswwwmdpicom1999-4907114480pdf+ampcd=6amphl=enampct=clnkampgl=in119 httpsresourcetradeearthyear=2018ampexporter=76ampimporter=699ampcategory=87ampunits=value120 httpdocuments1worldbankorgcurateden240231467291388831pdf106467-REVISED-v1-PUBLICpdf121 httpsonlinelibrarywileycomdoifull1011111477-894712094122 httpsglobalforestatlasyaleeduamazonland-usecattle-ranching123 httpsresourcetradeearthyear=2018ampimporter=699ampcategory=779ampunits=value124 httpsresourcetradeearthyear=2018ampimporter=699ampcategory=779ampunits=value125 httplargestanfordeducourses2018ph240halper1~text=Every20half20hour2C20a20cowmore20potent20than20carbon20dioxideamptext=There20is20
rampant20deforestation2C20especiallyto20make20room20for20cattle126 httpswwwinvestopediacomarticlesinvesting0929155-countries-produce-most-carbon-dioxide-co2asp127 httpwwwcwejournalorgvol9no3do-extensive-rubber-plantation-influences-local-environment-a-case-study-from-tripura-northeast-india128 httpswwwibeforgdownloadRubber_Plastics_220708pdf
Beef production remains by far the largest driver of deforestation in the worldrsquos tropical forests as forest land cleared for cattle is more than twice the combined area required for producing soy palm oil and wooden products The problem of cattle ranching
is particularly profound in the Amazon region the largest forest reserve in the world leading to 80 of present deforestation rates122 Clearing land for grazing causes irreversible habitat loss soil degradation and conflict between humans and wild animals India imports 15 and 12 of bovine leather from Turkey and Brazil respectively which poses a great threat to the forest areas of these countries123 It also jeopardises the earnings of the Indian companies manufacturing such products for its European consumers who have a high degree of sensitivity and awareness around deforestation124 In a larger context the impact of cattle stretches far beyond the realm of forests and is one of the key reasons for rising global emissions and climate change There are more than 15 billion cows on Earth with each of them capable of expelling 17 times more GHG emissions than cars in the form of methane burps a gas several times more potent than CO2 in terms of trapping heat It is therefore not surprising that cattle accounts for a colossal 18 in atmospheric carbon emissions125 To put this in perspective this surpasses emissions of the third largest CO2 emitter India which accounts for a 7 share in worldwide emissions126
Another commodity whose production has significant impact on the environment is rubber Environmentalists have warned for years that the rapid expansion of rubber plantations would come at the expense of natural forests Rubber has
not been subjected to extensive publicity in a way that palm oil soy and paper have been over the years given their impact on the environmentmdashpublicity that has led to adoption of robust sustainability criteria for these commodities Indiarsquos natural rubber plantation spans across an area of 183 million acres as of 2012 with the raw material being used as an input for making 35000 finished products of industrial importance127 Currently the impact assessment of large-scale rubber plantations on the environment is non-existent in the country a worrying sign considering Indiarsquos position as the 4th largest consumer in the world128
50
A N N U A L R E P O R T 2 0 2 0
Fossil-fuel and mineral mining accounts for 7 of global deforestation Moreover it not only presents a threat to forest cover and resource extraction but also leads to long-term impacts such as soil and water pollution infrastructure development and
increased anthropogenic activity129 While the effects of large-scale mining are easier to quantify as they are well regulated and undertake environmental impact assessments it is the scope and impact of artisanal and small-scale mining (ASM) that goes under the radar due to lack of data and a high degree of informality in the sector In India this problem warrants special attention since over 12 million people are engaged in the ASM business with women and girls from backward communities and those living below the poverty line being its primary employees130 A landscape-level approach is critical not only to identify and monitor the environmental and social impacts of individual mining projects but also to consider its interactions with other land uses as well given the crucial role forests play in balancing the ecosystem131 Indiarsquos investor requested company Hindustan Zinc Ltd was the first to disclose this year under the mining sector
129 httpsglobalforestatlasyaleeduland-usemining-extraction130 httpswwwpactworldorgstate20of20asm131 httpswwwresearchgatenetpublication38084575_Landscape_approach_for_quantifying_land_use_land_cover_change_1972-2006_and_habitat_diversity_in_a_mining_area_in_
Central_India_Bokaro_Jharkhand
Hindustan Zinc Pioneering forest and biodiversity conservation in the mining sectorHindustan Zinc Limited is the first investor-requested company in India to respond to CDPrsquos Forests questionnaire It demonstrated that a dedicated Biodiversity Policy and Management Standard is its compass in reducing flora and fauna disruption and in minimising or compensating its impact of operation through project scoping site closure and beyond
Companies in India currently lag behind their regional peers in terms of disclosure on deforestation management with only 3 companies disclosing on this topic in 2020
40
65
22
3China Japan IndiaSEA
(Indonesia Malaysia
Phillipines Singapore Vietnam)
Total no of companies disclosing through CDPs Forests questionnaire in 2020 by HQ countryregion
51
A N N U A L R E P O R T 2 0 2 0
Nagpur
Udaipur
Panaji
Kochi
Rajkot
Vadodara
Delhi
Dehradun
Ahmedabad
Thane
Chennai
Tiruchirappalli Coimbatore
Bangalore
Kolkata
Gangtok
Siliguri
India Snapshot
CITIES STATES AND REGIONS
Cities
In 2020 over 800 cities disclosed their environmental information through CDP including 16 Indian cities The number of cities in India disclosing through the CDP-ICLEI Unified Reporting System increased from 13 in 2019 to 17 This was largely due to citiesrsquo ongoing commitments to climate leadership initiatives such as the C40 Cities Climate Leadership Group (C40) the Global Covenant of Mayors for Climate and Energy (GCoM) and our partnership with ICLEI whose South Asia Regional Office also acts as the GCoM South Asia Helpdesk
88 global cities reached CDPrsquos A list which include Bristol (UK) Miami (USA) Cape Town (South Africa) Buenos Aires (Argentina) and Auckland (New Zealand)
despite the COVID-19 pandemic The USA accounts for the highest number
(25) of cities on the A List making up 28 despite the US pulling out of
the Paris Agreement In India more than half the cities in disclosed
that
they either have sustainability targets incorporated into the master planning of the city or it is in progress while only 43 of the cities have a published plan that addresses climate change adaptation Approximately half of the disclosing Indian cities have identified opportunities as a result of addressing climate change and one-third of them have a GHG emission reduction target which is a strong indication towards a low carbon development pathway
States and Regions
In 2020 the Union Territories of Delhi and Jammu amp Kashmir along with over 120 states and regions from across the world disclosed their environmental impacts through CDP Globally 90 of states and regions reporting a 2030 target have one in line with the IPCCrsquos goal to reduce global greenhouse gas emissions by 40-50 from 2010 levels by 2030 and 55 of states and regions with a 2030 emissions reduction
target are showing greater ambition than their national
counterparts
Indian cities and 16
Indian states disclosed to CDP
2
52
A N N U A L R E P O R T 2 0 2 0
ANNEXURESAppendix I Table of emissions scores and sector by company
Sector Company Name 2020 permission Status
Final score 2020
Scope 1 Scope 2 Scope 3 Number of categories reported in Scope 3
Bars hotels amp restaurants
Indian Hotels Co Ltd
public C 50610 239568 23824 3
Biotech amp pharma Biocon public C 41948 133110 Not Provided
Dr Reddyrsquos Laboratories
public B 247317 154836 1272548 8
ZCL Chemicals public D- Not Provided Not Provided Not Provided
Cement amp concrete ACC public B 16966585 643870 648068 3
Ambuja Cements public B 14523738 551219 1973622 7
Dalmia Bharat Ltd
public B 11280051 537968 1320736048 9
JK Cement non public D Private Private Private Private
JSW Cement Limited
public B- 1398609 647870 572488 4
Shree Cement non public C Private Private Private Private
Ultratech Cement
public B 47954830 1327185 5376354 4
Chemicals Aarav Frances amp Flavors Private
Limited
public Not Scored
GHCL LIMITED public D 109470536 496707 Not Provided
Godrej Industries public B 32311 44361 6735893 3
Gujarat Fluorochemicals
non public C Private Private Private Private
Jubilant Life Sciences Ltd
non public C Private Private Private Private
Kansai Nerolac Paints Limited
non public Not Scored Private Private Private Private
Tata Chemicals public B 444988061 4505956 12162395 5
UPL Limited non public Private Private Private Private Private
Godrej Consumer
Products Limited
public A- 33980 30848 26433 2
Note Due to increase in sample size more samples were considered for this report These samples include companies from the BSE Top 200 list CDPrsquos Fixed Income sample FAIRR sample Emerging markets sample Environmental sample and Continuity climate change sampleFor further details visit https6fefcbb86e61af1b2fc4-c70d8ead6ced550b4d987d7c03fcdd1dsslcf3rackcdncomcomfycmsfilesfiles000003423originalCDP_Climate_Change_Sample_Investor_Request_2020pdfNot Scored- Companies who have submitted the minimum version questionnaire
53
A N N U A L R E P O R T 2 0 2 0
Sector Company Name 2020 permission Status
Final score 2020
Scope 1 Scope 2 Scope 3 Number of categories reported in Scope 3
Energy utility networks
Adani Transmission
Ltd
public D 31870076 21155 9379637 3
GAIL public C 4925087 387358 1071 1
Financial services Axis Bank public B 6250 168043 4414712 3
HDFC Bank Ltd public B 764919 390176 1642453 3
Indusind Bank public A 88316 6278567 1277912 3
Kotak Mahindra Bank
public C 9078 69780 4290177 3
LampT Finance Holdings Limited
non public Private Private Private Private Private
State Bank of India
public B- 390 1066386 257902 5
YES BANK Limited
public A- 344515 3099369 4859625 3
Agricultural commodities
Tata Consumer Products Ltd
public A- 11731 34238 3348672939 10
Marico public A- 1380 12140 499568 9
Intermodal transport amp logistics
Adani Ports amp Special
Economic Zone
public B- 95905791 176946845 202567171 3
IT amp software development
HCL Technologies
non public Private Private Private Private Private
Infosys Limited public A- 15344 124063 371602 6
Larsen amp Toubro Infotech Ltd
public B 39485 2521874 1908034 2
Mindtree Ltd non public A- Private Private Private Private
Tata Consultancy
Services
public A- 26714 811815 702615 7
Tech Mahindra public A 1803807 105736586 39285212 5
Wipro public A- 13366 124564 421527 7
Land amp property ownership amp development
Godrej Properties Limited
public Not Scored 4400 2429 422
Mahindra Lifespace
Developers Limited
public B 397 2675 589525 8
Light manufacturing APOLLO TYRES LTD
public Not Scored 24207 60717 Not Provided
JK Tyres amp Industries
public C 158568 88424 Not Provided
54
A N N U A L R E P O R T 2 0 2 0
Sector Company Name 2020 permission Status
Final score 2020
Scope 1 Scope 2 Scope 3 Number of categories reported in Scope 3
Media telecommunications amp data center services
Bharti Airtel non public D Private Private Private Private
Reliance Jio Infocomm
Limited
public B 105018 1826762 243195034 3
Tata Communications
public A- 6376 108482 6938 3
Metal smelting refining amp forming
Hindustan Zinc public A 4480887 253756 4182181 10
Vedanta Ltd public B- 57482869 1864711 Not Provided
JSW Steel Ltd public A- 40045307 476901 4168823 8
Tata Steel public A- 60116322 5687999 14970000 12
Metallic mineral mining
NMDC public D 29004 63671 1957 1
Oil amp gas processing Bharat Petroleum
Corporation
public B 5023580 366230 729820 2
Indian Oil Corporation
public D 18690000 54700 Not Provided
Renewable power generation
Adani Green Energy
public D 841 13313 1174 1
Azure Power public Private 323 2767
Specialized professional services
Mahindra amp Mahindra Financial Services
public B 3370 18847 22922 3
Piramal Enterprises
public C 4430568 8692844 Not Provided
Vakrangee Softwares Ltd
public B 2053355 35409 Not Provided
Textiles amp fabric goods
ARVIND Ltd public B- 3514561 238894 Not Provided
Thermal power generation
Adani Power Ltd public D 58970705 14607 6910800 1
JSW Energy public B 17200521 36117 61151 2
NTPC Ltd public D 252495018 15845 978052 3
Tata Power Co public C 34952981 22051 1226 1
Tobacco ITC Limited public B- 1241718 230192 206064 5
Transportation equipment
Hero Motocorp Ltd
non public D Private Private Private Private
Mahindra amp Mahindra
public A 40654 414552 58425531 11
Tata Motors public A- 60533 266200 3140861 8
55
A N N U A L R E P O R T 2 0 2 0
Climate Change ndash Investor requested companies132
CDP Activity Group Company name Response Status
Air transport InterGlobe Aviation Ltd Not submitted
Jet Airways (India) Ltd Not submitted
Apparel design Page Industries Ltd Not submitted
Bars hotels amp restaurants
Indian Hotels Co Ltd Submitted
Jubilant Foodworks Ltd Not submitted
Biotech amp pharma Abbott India Ltd See Another
Ajanta Pharma Ltd Not submitted
Alkem Laboratories Ltd Not submitted
Aurobindo Pharma Not submitted
Biocon Submitted
Cadila Healthcare Not submitted
Cipla Not submitted
Divirsquos Laboratories Not submitted
Dr Reddyrsquos Laboratories
Submitted
Glenmark Pharmaceuticals
Not submitted
Lupin Not submitted
Natco Pharma Ltd Not submitted
Pfizer Ltd See Another
Sun Pharma Advanced Research Company Ltd
Not submitted
Sun Pharmaceutical Industries
Not submitted
Torrent Pharmaceuticals
Not submitted
Cement amp concrete ACC Submitted
Ambuja Cements Submitted
Dalmia Bharat Ltd Submitted
India Cements Not submitted
JK Cement Ltd Submitted
Orient Cement Limited Not submitted
Shree Cement Submitted
The Ramco Cements Ltd
Not submitted
Ultratech Cement Submitted
132 These include companies from the BSE Top 200 list CDPrsquos Fixed Income sample FAIRR sample Emerging markets sample Environmental sample and Continuity climate change sample For further details visit https6fefcbb86e61af1b2fc4-c70d8ead6ced550b4d987d7c03fcdd1dsslcf3rackcdncomcomfycmsfilesfiles000003423originalCDP_Climate_Change_Sample_Investor_Request_2020pdf
See Another -The response is covered by another CDP reporting company usually the parent company
CDP Activity Group Company name Response Status
Chemicals Asian Paints Not submitted
Berger Paints India Ltd Not submitted
Castrol India Not submitted
Colgate Palmolive India See Another
Coromandel International
Not submitted
Dabur India Not submitted
Emami Ltd Not submitted
Godrej Consumer Products Limited
Submitted
Godrej Industries Submitted
GRAPHITE INDIA LTD Not submitted
HEG LTD Not submitted
Jubilant Life Sciences Ltd
Submitted
Kansai Nerolac Paints Limited
Submitted
PI Industries Ltd Not submitted
Pidilite Industries Ltd Not submitted
Procter amp Gamble Hygiene amp Health Care Ltd
See Another
SRF Ltd Not submitted
Supreme Industries Ltd Not submitted
Tata Chemicals Submitted
UPL Limited Submitted
Coal mining Adani Enterprises Not submitted
Coal India Not submitted
Gujarat Mineral Devp Corpn
Not submitted
Commercial amp consumer services
Quess Corp Ltd Not submitted
Construction Bharti Infratel Limited Not submitted
GVK Power amp Infrastructure
Not submitted
Honeywell Automation India Ltd
See Another
Larsen amp Toubro Not submitted
Voltas Not submitted
Appendix II List of companies invited to respond to CDP
56
A N N U A L R E P O R T 2 0 2 0
CDP Activity Group Company name Response Status
Financial services Gruh Finance Ltd Not submitted
HDFC Asset Management
Not submitted
HDFC Bank Ltd Submitted
HDFC Life Insurance Company Ltd
Not submitted
Housing Development Finance Corporation
Not submitted
ICICI Bank Limited Not submitted
ICICI Lombard General Insurance Company Ltd
Not submitted
ICICI Prudential Life Insurance Company Ltd
Not submitted
IDBI Bank Ltd Not submitted
IDFC First Bank Ltd Not submitted
Indiabulls Housing Finance Ltd
Not submitted
Indiabulls Ventures Ltd Not submitted
Indian Bank Not submitted
Indusind Bank Submitted
Kotak Mahindra Bank Submitted
LampT Finance Holdings Limited
Submitted
LIC Housing Finance Not submitted
Max Financial Services Not submitted
Motilal Oswal Financial Services Ltd
Not submitted
Muthoot Finance Limited
Not submitted
PNB Housing Finance Ltd
Not submitted
Power Finance Corporation
Not submitted
Punjab National Bank Not submitted
RBL Bank Ltd Not submitted
REC Ltd Not submitted
Reliance Nippon Life Asset Management Ltd
Not submitted
SBI Life Insurance Company Ltd
Not submitted
Shriram Transport Finance Co
Not submitted
State Bank of India Submitted
Union Bank of India Not submitted
YES BANK Limited Submitted
CDP Activity Group Company name Response Status
Convenience retail Avenue Supermarts Ltd Not submitted
Discretionary retail Aditya Birla Fashion and Retail Ltd
Not submitted
Future Retail Ltd Not submitted
Electrical amp electronic equipment
Amara Raja Batteries Ltd
Not submitted
Bharat Electronics Not submitted
Crompton Greaves Consumer Electricals Ltd
Not submitted
Exide Industries Not submitted
Havells India Not submitted
Motherson Sumi Systems
Not submitted
Whirlpool of India Ltd See Another
Energy utility networks
Adani Gas Ltd Not submitted
Adani Transmission Ltd Submitted
CESC Ltd Not submitted
GAIL Submitted
Indraprastha Gas Ltd Not submitted
Power Grid Corpn of India
Not submitted
Reliance Infrastructure Not submitted
Torrent Power Not submitted
Financial services AU Small Finance Bank Ltd
Not submitted
Axis Bank Submitted
Bajaj Finance Limited Not submitted
Bajaj Finserv Not submitted
Bajaj Holdings amp Invst (BHIL)
Not submitted
Bandhan Bank Not submitted
Bank of Baroda Not submitted
Bank of India Not submitted
Canara Bank Not submitted
Cholamandalam Investment and Finance Co Ltd
Not submitted
Cholamandalam Investment and Finance Company Ltd
Not submitted
City Union Bank Ltd Not submitted
Edelweiss Financial Services Ltd
Not submitted
Federal Bank Not submitted
General Insurance Corporation of India
Not submitted
57
A N N U A L R E P O R T 2 0 2 0
CDP Activity Group Company name Response Status
Food amp beverage processing
Britannia Industries Not submitted
Marico Submitted
Tata Consumer Products
Submitted
United Breweries Not submitted
United Spirits Not submitted
Varun Beverages Ltd Not submitted
Venkys India Ltd Not submitted
Health care provision Apollo Hospitals Enterprises
Not submitted
Industrial support services
GMR Infrastructure Limited
Not submitted
Intermodal transport amp logistics
Adani Ports amp Special Economic Zone
Submitted
Container Corporation of India
Not submitted
IT amp software development
HCL Technologies Submitted
Infosys Limited Submitted
Larsen amp Toubro Infotech Ltd
Submitted
Mindtree Ltd Submitted
MphasiS Not submitted
Oracle Financial Services
See Another
Tata Consultancy Services
Submitted
Tech Mahindra Submitted
Wipro Submitted
WNS Holdings ADR Not submitted
Land amp property ownership amp development
DLF Not submitted
Godrej Properties Limited
Submitted
Housing Development amp Infrastructure
Not submitted
Oberoi Realty Not submitted
Leisure amp home manufacturing
Rajesh Exports Ltd Not submitted
Titan Company Limited Not submitted
Light manufacturing 3M India Ltd Not submitted
APOLLO TYRES LTD Submitted
Balkrishna Industries Ltd
Not submitted
Ceat Ltd Not submitted
MRF LTD Not submitted
CDP Activity Group Company name Response Status
Media telecommunications amp data center services
Bharti Airtel Submitted
Reliance Communications
Not submitted
Sun TV Network Not submitted
Tata Communications Submitted
Vodafone Idea Ltd Not submitted
Zee Entertainment Enterprises
Not submitted
Metal products manufacturing
AIA Engineering Ltd Not submitted
Bosch Ltd See Another
Endurance Technologies Ltd
Not submitted
Gillette India Not submitted
Metal smelting refining amp forming
Bharat Forge Ltd Not submitted
Essar Steel Limited Not submitted
Hindalco Industries Not submitted
Hindustan Zinc Submitted
Jindal Stainless Ltd Not submitted
Jindal Steel amp Power Not submitted
JSW Steel Ltd Submitted
Steel Authority of India Not submitted
Tata Metaliks Ltd Not submitted
Tata Steel Submitted
Vedanta Ltd Submitted
Metallic mineral mining
National Aluminium Co Not submitted
NMDC Submitted
Oil amp gas extraction amp production
Oil India Ltd Not submitted
Petronet LNG Not submitted
Oil amp gas processing Bharat Petroleum Corporation
Submitted
Hindustan Petroleum Corporation
Not submitted
Indian Oil Corporation Submitted
Mangalore Refinery and Petrochemicals
Not submitted
Nayara Energy Limited Not submitted
Oil amp Natural Gas Corporation
Not submitted
Reliance Industries Not submitted
Oil amp gas storage amp transportation
Gujarat State Petronet Not submitted
Other materials Astral Poly Technik Ltd Not submitted
Powered machinery Bharat Heavy Electricals
Not submitted
Cummins India See Another
58
A N N U A L R E P O R T 2 0 2 0
CDP Activity Group Company name Response Status
Renewable power generation
Adani Green Energy Submitted
Azure Power Submitted
National Hydroelectric Power Corporation Ltd (NHPC)
Not submitted
ReNew Power Private Limited
Not submitted
SJVN Ltd Not submitted
Specialized professional services
LampT Technology Services Ltd
Not submitted
Mahindra amp Mahindra Financial Services
Submitted
NBCC Ltd Not submitted
Piramal Enterprises Submitted
Vakrangee Softwares Ltd
Submitted
Textiles amp fabric goods
ARVIND Ltd Submitted
Birla CelluloseGrasim Industries
Not submitted
Chennai Petroleum Corporation
Not submitted
Thermal power generation
Adani Power Ltd Submitted
Aditya Birla Capital Not submitted
JSW Energy Submitted
KSK Energy Ventures Limited
Not submitted
NLC India Ltd Not submitted
NTPC Ltd Submitted
Reliance Power Not submitted
Tata Power Co Submitted
Tobacco ITC Limited Submitted
Transportation equipment
Ashok Leyland Not submitted
Bajaj Auto Not submitted
Eicher Motors Ltd Not submitted
Hero Motocorp Ltd Submitted
Mahindra amp Mahindra Submitted
Maruti Suzuki India Not submitted
Tata Motors Submitted
TVS Motor Company Ltd
Not submitted
Web amp marketing services
Info Edge (India) Ltd Not submitted
Wood amp paper materials
Century Textiles amp Industries
Not submitted
59
A N N U A L R E P O R T 2 0 2 0
Climate Change ndash Self Selected companies
CDP Activity Group Company name Response Status
Chemicals AARAV FRANCES amp FLAVORS PRIVATE LIMITED Submitted
GHCL LIMITED Submitted
Gujarat Fluorochemicals Submitted
Light manufacturing JK Tyres amp Industries Submitted
Cement amp concrete JSW Cement Limited Submitted
Land amp property ownership amp development Mahindra Lifespace Developers Limited Submitted
Media telecommunications amp data center services
Reliance Jio Infocomm Limited Submitted
Biotech amp pharma ZCL Chemicals Submitted
Water Security ndash Investor requested companies133
CDP Activity Group Name Response Status
Bars hotels amp restaurants Indian Hotels Co Ltd Submitted
Biotech amp pharma Ajanta Pharma Ltd Not submitted
Alkem Laboratories Ltd Not submitted
Aurobindo Pharma Not submitted
Biocon Not submitted
Cadila Healthcare Not submitted
Cipla Not submitted
Divirsquos Laboratories Not submitted
Dr Reddyrsquos Laboratories Submitted
Glenmark Pharmaceuticals Not submitted
Lupin Not submitted
Natco Pharma Ltd Not submitted
Sun Pharmaceutical Industries Not submitted
Torrent Pharmaceuticals Not submitted
ZCL Chemicals Submitted
Cement amp concrete ACC Not submitted
Ambuja Cements Submitted
Dalmia Bharat Ltd Not submitted
Shree Cement Not submitted
The Ramco Cements Ltd Not submitted
Ultratech Cement Submitted
Chemicals Asian Paints Not submitted
Berger Paints India Ltd Not submitted
Castrol India Not submitted
Coromandel International Not submitted
Dabur India Submitted
Emami Ltd Not submitted
Godrej Consumer Products Limited Submitted
Godrej Industries Submitted
Jubilant Life Sciences Ltd Submitted
Kansai Nerolac Paints Limited Submitted
Pidilite Industries Ltd Not submitted
Procter amp Gamble Hygiene amp Health Care Ltd Not submitted
SRF Ltd Not submitted
Supreme Industries Ltd Not submitted
Tata Chemicals Submitted
133 These include companies from the Water Global sample and Continuity water security sample For further details visit https6fefcbb86e61af1b2fc4-c70d8ead6ced550b4d987d7c03fcdd1dsslcf3rackcdncomcomfycmsfilesfiles000003422originalCDP_Water_Security_Sample_Investor_Request_2020pdf
60
A N N U A L R E P O R T 2 0 2 0
CDP Activity Group Name Response Status
UPL Limited Submitted
VVF Ltd Not submitted
Coal mining Adani Enterprises Not submitted
Coal India Not submitted
Construction Larsen amp Toubro Not submitted
Discretionary retail Aditya Birla Fashion and Retail Ltd Not submitted
Electrical amp electronic equipment Amara Raja Batteries Ltd Not submitted
Exide Industries Not submitted
Havells India Not submitted
Energy utility networks GAIL Not submitted
Power Grid Corpn of India Not submitted
Food amp beverage processing Marico Submitted
Tata Consumer Products Ltd Submitted
IT amp software development Tech Mahindra Submitted
Light manufacturing APOLLO TYRES LTD Not submitted
JK Tyres amp Industries Submitted
MRF LTD Not submitted
Media telecommunications amp data center services
Tata Communications Not submitted
Metal smelting refining amp forming Bharat Forge Ltd Not submitted
Hindalco Industries Not submitted
Hindustan Zinc Submitted
Jindal Steel amp Power Not submitted
JSW Steel Ltd Not submitted
Tata Steel Submitted
Metallic mineral mining National Aluminium Co Not submitted
NMDC Not submitted
Oil amp gas extraction amp production Oil India Ltd Not submitted
Petronet LNG Not submitted
Oil amp gas processing Bharat Petroleum Corporation Not submitted
Hindustan Petroleum Corporation Not submitted
Indian Oil Corporation Not submitted
Oil amp Natural Gas Corporation Not submitted
Reliance Industries Not submitted
Oil amp gas storage amp transportation Gujarat State Petronet Not submitted
Specialized professional services Piramal Enterprises Submitted
Textiles amp fabric goods ARVIND Ltd Submitted
Birla CelluloseGrasim Industries Not submitted
Thermal power generation Adani Power Ltd Submitted
JSW Energy Not submitted
NTPC Ltd Submitted
Tata Power Co Submitted
Tobacco ITC Limited Submitted
Transportation equipment Ashok Leyland Not submitted
Bajaj Auto Not submitted
Hero Motocorp Ltd Not submitted
Mahindra amp Mahindra Submitted
Maruti Suzuki India Not submitted
Tata Motors Not submitted
61
A N N U A L R E P O R T 2 0 2 0
Water Security ndash Self Selected companies
CDP Activity Group Name Response Status
Chemicals AARAV FRANCES amp FLAVORS PRIVATE LIMITED Submitted
Transportation services Adani Ports amp Special Economic Zones Submitted
Other materials Piramal Glass Submitted
62
A N N U A L R E P O R T 2 0 2 0
Appendix III - Indian Companies Committed to ActionScience-based Target initiative (SBTi)Approved 15degC
Mahindra Heavy Engines Ltd Mahindra EPC Irrigation Limited White House
Dr Reddys Laboratories Ltd Swaraj Engines Limited Gromax Agri Equipment Limited
Mahindra Accelo Mahindra Holidays and Resorts India Limited Mahindra Lifespaces Developers Limited
Mahindra Lifespaces Developers Limited Mahindra World City (Jaipur) Ltd Mahindra World City Developers Ltd
Polygenta Technologies Limited
Approved well-below 2degC
Tata Chemicals Limited Mahindra amp Mahindra Limited Wipro
Mahindra First Choice Services Ltd Mahindra Electric Mobility Ltd
Approved 2degC
Hindustan Zinc Limited Mahindra Sanyo Special Steel Shree Cement Ltd
Tech Mahindra
SBTi Committed
Infosys Limited UPL Limited JSW Energy Limited
Godrej Agrovet Limited Godrej Consumer Products Limited Godrej Industries
Godrej Properties Limited Godrej amp Boyce Mfg Co Ltd Ultratech Cement Limited
Vakrangee Limited ACC Limited Adani Ports and Special Economic Zone Limited
SCM Garments PVT Limited Nahar Industrial Enterprises Limited Ambuja Cement Ltd
Adani Green Energy Ltd Reliance Jio Infocomm Limited Bharti Airtel Limited
Gujarat Fluorochemicals Ltd (GFL) Dalmia Bharat Limited HCL Technologies
Havells India Limited Mahindra Susten Eastman Exports Global Clothing Pvt Ltd
JK Tyre amp Industries Ltd Marico Limited Tata Global Beverages Ltd
EPC Industries Limited Mahindra amp Mahindra Financial Services Limited YES BankSBTi companies not in CDP Sample
RE100Dalmia Bharat Ltd Infosys Ltd Mahindra Holidays amp Resorts India Ltd
Tata Motors Ltd
RE100 companies not in CDP Sample
Internal Carbon Pricing (ICP)Pricing carbon in 2020
ACC Ambuja Cements Dalmia Bharat Ltd
Dr Reddyrsquos Laboratories Godrej Consumer Products Godrej Industries
Gujarat Fluorochemicals Hero Motocorp Ltd Hindustan Zinc
63
A N N U A L R E P O R T 2 0 2 0
Infosys Limited JSW Cement Limited JSW Steel Ltd
Mahindra amp Mahindra Mindtree Ltd Shree Cement
Tata Chemicals Tata Consultancy Services Tata Consumer Products
Tata Motors Tata Steel Tech Mahindra
Ultratech Cement Wipro
Planning to price in the next two years
Adani Ports amp Special Economic Zone ARVIND Ltd GAIL
GHCL LIMITED Indian Hotels Co Ltd JK Tyres amp Industries
JSW Energy Jubilant Life Sciences Ltd Larsen amp Toubro Infotech Ltd
Mahindra amp Mahindra Financial Services Mahindra Lifespace Developers Limited Marico
NTPC Ltd Piramal Enterprises Reliance Jio Infocomm Limited
Tata Communications Tata Power Co UPL Limited
Vakrangee Softwares Ltd Vedanta Ltd YES BANK Limited
64
A N N U A L R E P O R T 2 0 2 0
About CDPCDP is a not-for-profit charity that runs the global disclosure system or investors companies cities states and regions to manage their environmental impacts by running a global environmental disclosure system Each year CDP supports thousands of companies cities states and regions to measure and manage their risks and opportunities on climate change water security and deforestation We do so at the request of their investors purchasers and city stakeholders
Over the last two decades we have created a system that has resulted in unparalleled engagement on environmental issues worldwide In 2020 Over 9600 companies reported through CDP on climate change water security and forests and over 800 cities and more than 120 states and regions disclosed their environmental impacts through CDP
CDP IndiaCDP began working in India in 2008 and was formally registered in 2012 working on disclosure and driving climate action It serves as a source of knowledge for hundreds of Indian corporations from those that are just beginning on the road to corporate environmental disclosure through to those looking to improve sustainability and make commitments to reduce environmental impact
It is the only NGO to be named in Indiarsquos INDC submission to the UNFCCC owing to its corporate environmental data repository and tracking of emissions and mitigation data from the Indian Industry CDP India also actively participated in Government of Indiarsquos Ministry of Environment Forests amp Climate Change (MoEFCC) work on future carbon market mechanisms In addition to our work on disclosure CDP India is actively engaged in other initiatives including Internal Carbon Pricing (ICP) Science-based targets (SBT) and RE100
65
A N N U A L R E P O R T 2 0 2 0
CDP ContactsFor more info contact Damandeep Singh Director CDP India damandeepsinghcdpnet infoindiacdpnet
CDP Board of Directors
Bharati Chaturvedi Founder amp Director Chintan Environmental Research and Action Group
Ramakrishnan Mukundan Managing Director amp CEO Tata Chemicals Limited
Damandeep Singh Director CDP India
Important Notice
The contents of this report may be used by anyone providing acknowledgement is given to CDP Worldwide (CDP) This does not represent a license to repackage or resell any of the data reported to CDP or the contributing authors and presented in this report If you intend to repackage or resell any of the contents of this report you need to obtain express permission from CDP before doing so
CDP India has prepared the data and analysis in this report based on responses to the CDP 2020 information request No representation or warranty (express or implied) is given by CDP India as to the accuracy or completeness of the information and opinions contained in this report You should not act upon the information contained in this publication without obtaining specific professional advice To the extent permitted by law CDP India do not accept or assume any liability responsibility or duty of care for any consequences of you or anyone else acting or refraining to act in reliance on the information contained in this report or for any decision based on it All information and views expressed herein by CDP India is based on their judgment at the time of this report and are subject to change without notice due to economic political industry and firm-specific factors Guest commentaries where included in this report reflect the views of their respective authors their inclusion is not an endorsement of them
CDP India their affiliated member firms or companies or their respective shareholders members partners principals directors officers andor employees may have a position in the securities of the companies discussed herein The securities of the companies mentioned in this document may not be eligible for sale in some states or countries nor suitable for all types of investors their value and the income they produce may fluctuate andor be adversely affected by exchange rates
lsquoCDP Worldwidersquo and lsquoCDPrsquo refer to CDP Worldwide a registered charity number 1122330 and a company limited by guarantee registered in England number 05013650
copy 2020 CDP Worldwide All rights reserved
This report is printed on recycled paper
This report is printed on CyclusPrint based on 100 recycled fibres
This report is printed on CyclusPrint based on 100 recycled fibres
Supported by Scoring partner
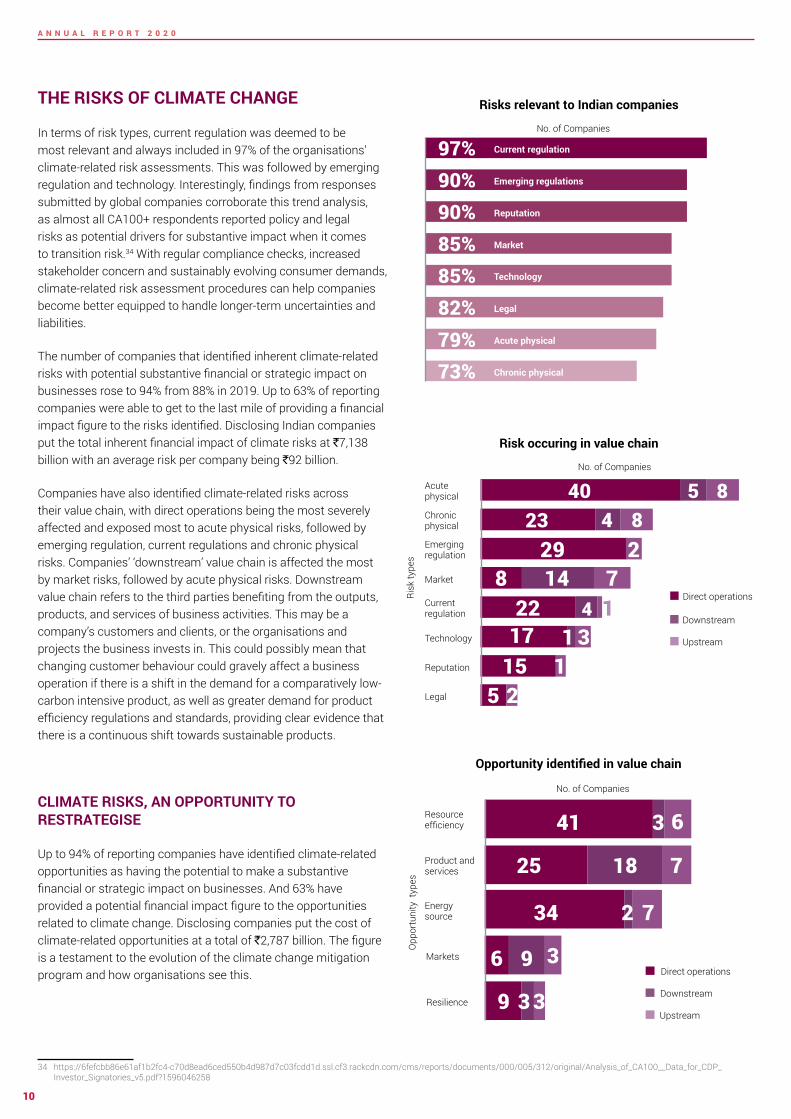
11
A N N U A L R E P O R T 2 0 2 0
Similarly most companies saw resource efficiency as a major climate-related opportunity followed by energy source and products and services in their lsquodirect operationsrsquo The main drivers behind these opportunities were use of more efficient production and distribution processes use of lower-emission sources of energy and development andor expansion of low-emission goods and services In the lsquodownstreamrsquo value chain products and services was majorly witnessed as an opportunity as there is growing consumer awareness and concern around sustainability related issues As a result companies are constantly diversifying their portfolios to address these consumer needs
Prod
uct a
nd s
ervi
ces
Ener
gy S
ourc
e
Resi
lienc
e
Resi
lienc
e
Ener
gy S
ourc
e
Reso
urce
effi
cien
cyM
arke
ts
2787identified to be the financial impact of reported climate-
related opportunities (in rupee billion)
Billion
`452
328
270
18
1719
Responding companies
67Companies
identified climate related
substantive opportunities
63Companies identified
opportunitiy typesdrivers
61
Companies identified
potential financial impact driver
60
Companies provided potential financial impact
figures
42
2041
4715
136
119
42413842
Acut
e ph
ysic
alCu
rren
t reg
ulat
ion
Emer
ging
regu
latio
n
Chro
nic
phys
ical
Repu
tatio
nO
ther
s
Lega
l
Tech
nolo
gyM
arke
t
7138identified to be the financial impact of reported climate-
related risks (in rupee billion)
Billion
`Financial impact of reported climate-related risks (in rupees billion)
Financial impact of reported climate-related opportunities (in rupees billion)
12
A N N U A L R E P O R T 2 0 2 0
Tech Mahindra Tapping into climate-related opportunities
Tech Mahindrarsquos approach towards climate change mitigation strategies is a testament to the efficacy of tapping into and realising climate-related opportunities The company has adopted Science-Based Targets to reduce its emissions and is a signatory to Business Ambition of 15 degree Celsius Tech Mahindra is committed to responsibly managing its operations through continuous improvement in sustainability practices across its value chain The company focuses on carbon emission reductions energy consumption reduction self-generation of energy from renewable energy sources and encouragement for green projects through Power Purchase Agreements The company has taken a target to increase Renewable Energy (RE) to 50 by 2025 Their sustainability report is aligned with CDSB amp Task Force on Climate-related Financial Disclosures (TCFD) frameworks
A constant focus on green energy and sustainable operations has provided a significant saving of US$27 million brought about by increasing renewable energy capacity to 1383MW leading to a saving of 28 million units of electricity adopting energy efficient practices across their facilities
Tech Mahindra has harnessed the power of disruptive next-generation technologies such as Artificial Intelligence (AI) analytics and blockchain to create solutions that ensure both its own and its customersrsquo carbon footprint reduction The company has contextualised opportunities for its customers as well by creating smart city offerings such as SMART Grid Micro-Grid-As-A-Service Intelligent Electric Vehicle Charging System (IEVCS) smart energy management smart traffic management smart lightening management smart waste management systems and command amp control centres These smart city offerings will help reduce carbon footprints across multiple smart cities globally thereby reducing carbon emissions and contributing to green and sustainable solutions It is claimed that the market size for this is expected to reach US$4639 billion by 2027
At present the risks identified by the responding companies significantly outweigh the opportunities Opportunities are slow to emerge and companies need to focus on the use of lower-emission sources of energy development andor expansion of low-emissions goods and services development of climate adaptation resilience and insurance risk solutions and use of more efficient production and distribution processes
In 2015 at the request of the G20 Finance Ministers and Central Bank Governors the Financial Stability Board (FSB) and its chair Mark Carney established the industry-led TCFD This was set up in response to increasing demands from investors lenders insurers regulators policy makers and other stakeholders in the financial markets for decision-useful climate-related information CDP has aligned its information requests with the TCFD alongside introducing a sectoral focus and adopting a forward-looking approach to climate-risk disclosure We are already going in the direction of mandatory disclosure of climate risks how they are present in a companyrsquos activities how they manage it and how resilient they are to it The UK will be the first country in the world to make TCFD-aligned disclosures fully mandatory across the economy by 2025 going beyond the lsquocomply or explain approachrsquo35
35 httpswwwgovukgovernmentnewschancellor-sets-out-ambition-for-future-of-uk-financial-services
13
A N N U A L R E P O R T 2 0 2 0
Under current policies Indiarsquos projected emissions for 2030 can achieve a rating of ldquo15degC Paris Agreement compatiblerdquo if domestic emissions peak and start reducing with international support36 This shows that India has the potential to become a world leader with enhanced 15-degree compatible targets through a swift transition from coal to renewable energy Although India was already on track to meet its NDCs pre-COVID19 it has seen an even more significant drop in emissions since the onset of the pandemic During the peak of lockdown Indiarsquos energy demand reduced by almost 30 in April 202037 ie each additional week of lockdown the annual energy demand fell by 0638 This is mostly due to the significant reduction in energy consumption and power generation via fossil fuel However the impact of the pandemic on emissions is expected to be temporary and emissions are likely to rebound in 202139 as per estimations
In comparison to the NDCs which set an overall emissions target sectoral indicators can be more reliable in making informed decisions on mapping emissions reduction targeting Paris-compatible goals40 The
36 Climate Action Tracker- Fair Share37 Carbon Brief Analysis Indiarsquos CO2 emissions fall for first time in four decades amid coronavirus38 httpswwwieaorgreportsindia-202039 Carbon Brief Global Carbon Project Coronavirus causes lsquorecord fallrsquo in fossil-fuel emissions in 2020 Dec 202040 httpswwwoecd-ilibraryorgdocserver9789264273528-4-en
pdfexpires=1607881602ampid=idampaccname=guestampchecksum=891034D10FA31A953F7924772F23966D41 httpssciencebasedtargetsorgresourceslegacy201505Sectoral-Decarbonization-Approach-Reportpdf42 IPCC Mitigation Pathways Compatible with 15degC in the Context of Sustainable Development
major challenge is how to translate global temperature goals into individual actions However various strategies can be adopted to meet the long-term goals
The Science-Based Targets Initiativersquos (SBTi) Sectoral Decarbonisation Approach (SDA) allocates the well below 2degC carbon budget to different sectors taking into account inherent differences among sectors such as how fast each sector can grow relative to economic and population growth along with its mitigation potential41 According to the Intergovernmental Panel on Climate Change (IPCC) the highest global carbon budget allocation (for the period of 2011-2050) is for the power sector (25) followed by agriculture (24) and industry [including steel aluminium chemical and paper] (14)42
EMISSIONS TRENDS AND VERIFICATION
13increase in number of
organisations reporting
27increase in emissions
reporting (Scope 1+Scope 2)
90increase in scope 3 emissions reporting
India under its NDCs pledged to reduce its emissions intensity by 33-35 by 2030 compared to the 2005 levels The Climate Action Tracker38 rates Indiarsquos NDC target as ldquo2009 Copenhagen 2degC goal compatiblerdquo indicating that its commitment is a ldquofair sharerdquo of the global effort
Scope 1 and Scope 2 Emissions reported via CDP over the years
(In Million tCO2e)
2018 2019 2020
2997
55717037
14
A N N U A L R E P O R T 2 0 2 0
In order to allocate sector-specific questions to companies CDP has developed an Activity Classification System (ACS)43 It is a framework used to classify companies under the most relevant sectors It focuses on the diverse activities from which companies derive revenue associating them with the impacts to their business from climate change water security and deforestation This approach allows a better understanding of company actions based on their environmental risk opportunity and impact CDPrsquos Climate Change questionnaire requests companies to disclose their direct and indirect emissions under different emissions categories Although India saw an overall decrease in emission in 2020 there was an increase in CDP reporting companies and hence an overall increase in emissions reporting For the year
43 https6fefcbb86e61af1b2fc4-c70d8ead6ced550b4d987d7c03fcdd1dsslcf3rackcdncomcmsguidance_docspdfs000001540originalCDP-ACS-full-list-of-classificationspdf1520244912
44 The location-based method reveals what the company is physically putting into the air and the market-based method shows emissions the company is responsible for through its purchasing decisions
2020 the companies reported 70374 MtCO2e of total [Scope 1+Scope 2 (location-based)] emissions which is a 27 increase in reported emissions from 2019 This is mostly because of the significant increase in emissions reporting from several sectors mdash electric utilities cement and other heavy sectors
Only four companies chose a Scope 2 market-based approach and 43 companies selected a scope 2 location-based approach44 The total scope 2 emissions for location-based approach amounted to 181 MtCO2e and market-based approach amounted to 414 MtCO2e It is clear from this breakdown that a range of sectors and processes contribute to global emissions Focusing on any single sector alone would be insufficient However as can be seen in the
Emissions reported in Scope 3 Categories
4949
1414
1111
1010
88
55
33
Use of sold products
Purchased goods and services
Upstream transportation and
distribution
Downstream transportation and
distribution
Fuel and energy related activities (not included
in scope 1 and 2)
End of life treatment of sold products
Others
In 2020 companies have reported MtCO2e of total (Scope 1+2 [location-based]) emissions704
Gross Emissions Data 2020 (in MtCO2e)
682
126418
Gross Scope 1 Emissions
Gross Scope 3 EmissionsGross Scope 2 Emissions (Market and
Location based)
Scope 2 Location based emissions Scope 2 Market based emissions
Metal smelting refining and forming
Financial services
Cement amp concrete
Media telecommunications amp data center services
IT amp software development
Energy utility network
Chemicals
Textiles amp fabric goods
Oil amp gas processing
Biotech and pharma
Thermal power generation
Intermodule transport amp Logistics
Bar Hotels and Restaurants
Transportation equipment
Metallic mineral mining
Others
2911712
703
688536
165 292207
144118113
093087
071063
020057
024045044
157
Scope 2 Market-based emissions Scope 2 location-based emissions
Scope 2 market-based and location-based emissions reported as per CDPrsquos Primary Activity Group classification (in MtCO2e)
15
A N N U A L R E P O R T 2 0 2 0
graph for Gross Scope 2 emissions metal smelting refining and forming sectors contribute to the maximum emissions (1712 MtCO2e) followed by financial services and cement and concrete sectors
Companies reported 1259 MtCO2e of Scope 3 emissions in 2020 a 90 increase from 2019 figures due to higher disclosure as well as more companies disclosing their Scope 3 GHG inventories Almost half of the Scope 3 emissions were reported in the following categories use of sold products (49) followed by purchased goods and services (14) upstream transportation and distribution (11) and downstream transportation and distribution (10)
The ACS sectoral analysis shows that the transportation equipment activity group has the maximum reported scope 3 emissions at 615 MtCO2e followed by metal smelting refining and forming activity group at 2332 MtCO2e and cement and concrete activity group at 989 MtCO2e
Of the responding companies 33 have reported an approximately 11 of reduction in their gross global emissions (Scope 1 and 2 combined) from 2019 and 26 companies reported an approximate 57 increase in their gross global emissions from 2019 Responding companies have identified change in boundary45 as a major reason for a 62 increase in emissions from 2019 followed by acquisitions which led to a to 30 increase Amongst all sectors the electric utilities sector accounts for 83 of total increased emission values and up to 73 of these were due to change in boundary
Amongst all sectors reduction in emissions values since 2019 were mostly caused by emissions reduction initiatives (43) followed by change in output (30) and change in emission estimation methodology (23)
45 This refers to changes in the boundary used for inventory calculation ie changing from financial control to operational control This option could also apply if organisation has incorporated facilities into its inventory that were excluded in previous years
Amongst all sectors steel saw the highest reduction (around 48) in emission values and approximately half of this was achieved only from change in emission estimation methodology through recalibrating the GHG emissions for the reporting period This is followed by cement which reported a 29 reduction in emission values from implementing emissions reduction initiatives It is also noted that more than 30 of responding companies have adopted a change in renewable energy consumption but this accounts for only 35 of total reduction in emission values
Scope 3 emissions reported as per CDPrsquos Primary Activity Group classification (in MtCO2e)
of increased emissions in 2020 attributed to Change in boundary62
32 attributed to acquisitions
Metal smelting refining and forming
Cement amp concrete
Media telecommunications amp data center services
Chemicals
IT amp software development
Food amp beverage processing
Oil amp gas processing
Biotech and pharma
Thermal power generation
Land amp property ownership amp development
Financial services
Transportation equipment
Others
6157
2332
989
796
790
632
385
158
127
073
059
039
055
Third-party verification or assurance in place for Scope 12 amp 3 emissions
3571
Scope 1
3643
Scope 2 (location-based
or market based)
2786
Scope 3
a
ge o
f com
pani
es
16
A N N U A L R E P O R T 2 0 2 0
Third-party verification is one of the significant components of emission reporting An independent verification of self-reported data provides credibility and assurance It helps companies improve their internal processes identify risks and opportunities increase the reliability of their data reduce operational costs and building a strong reputation46 When an organisation monitors and verifies its emissions it can accurately identify and understand the true proportions of emissions from its sources and this can help it realise the major opportunities for emission reduction along with cost benefits
In 2020 50 companies reported third-party verification or assurance for Scope 1 emissions 51 companies for Scope 2 emissions and 39 companies for Scope 3 emissions Compared to 2019 there is an 18 increase in companies that have verified Scope 3 GHG emissions This indicates that Indian companies are becoming increasingly aware of their emission managementaccounting Amongst all sectoral companies which opt for third-party verification of their reported emissions around 25 are from IT amp software development and financial services Cement and concrete sectors rank the lowest on the list CDP encourages companies to have verified data submitted
46 The business benefits of third party verification of climate data A CDP Guide
Building a stronger reputation via third party verification
bull Increase confidence in data for internal and external use
bull Develop and demonstrate an effective carbon reduction strategy Improve business processes
bull Reduce operational costsbull Full-fill one of the mandatory criteria for entry
to the CDP A-list by gaining full points on CDPrsquos Scope 1 and 2 verification questions
bull Provide credibility for products services and internal processes
bull Counteract claims of greenwashing
17
A N N U A L R E P O R T 2 0 2 0
DECARBONISING ACROSS VALUE CHAIN Scope 3 emissions typically arise from the supply chain and the consumers using the product It has been found that the emissions from the supply chain are 5-6 times more than the carbon footprint of a companyrsquos direct operations and hence account for lionrsquos share of an organisationrsquos overall emissions47
47 httpswwwcdpnetenarticlessupply-chainsupplier-engagement-leaderboard-201948 httpswwwbcgcomen-inpublications2020supply-chain-needs-sustainability-strategy
Walking the extra mile in terms of engaging with stakeholders especially suppliers and customers on climate issues allows an organisation to consider the whole gamut of emissions and have better control over their emissions inventory For example metal companies can improve their supply chainrsquos environmental performance through adoption of a circular economy model which leads to an increased use of recycled materials in products reduces the emissions by lowering the overall burden on the manufacturing plant to produce from scratch and creates a closed-loop system with consumers48 This yearrsquos data indicates that 88 of companies engaged with their value chain partners on climate-
related issues an improvement of 5 over 2019 There was also an increase in absolute numbers -- 59 business entities collaborated with value chain partners against 49 last year
The main forms of engagement with suppliers are compliance and onboarding followed by incentivisation and information collection Educationinformation sharing collaboration and innovation are the most common customer engagement processes
Types of engagement with suppliers
No of Companies engaging with value chain on climate-related issues
2121
22
331212
1313
44
44
Other partners in the value chain customers suppliers
Other partners in the value chain suppliers
Customers
Customers Suppliers
Suppliers
Other partners in the value chain
Other partners in the value chain customers
of companies engage with their value chain partners on climate related issues an improvement of 5 from 2019
88
26
Compliance amp onboarding
16
Engagement amp incentivisation
(changing supplier behavior)
9
Information collection
(understanding supplier behavior)
7
Innovation amp collaboration
(changing markets)
No
of C
ompa
nies
18
A N N U A L R E P O R T 2 0 2 0
Organisations are mindful of the fact that climate issues need to be dealt using a participatory approach that encompasses all partners in the value chain as well as engages other external stakeholders Companies are thus getting serious about engaging in a comprehensive dialogue on climate change as this will allow them to have inputs in shaping public policy In their attempt to influence climate policies organisations are establishing communication channels with stakeholders like policymakers trade associations and research funding organisations A positive sign emerging is that majority of the businesses are agreeing to comply with environmental legislations unconditionally Energy efficiency and clean energy generation have garnered the support of 71 and 68 of responding companies respectively Mandatory carbon reporting and increased climate resilience have also found acceptance
With the COVID-19 pandemic wreaking havoc across the world and leading to the first-ever recorded recession in India it is important that companies view this as an opportunity to build a more resilient economy one in harmony with nature and encouraging of a more inclusive environment for supplier engagement that would expedite decarbonising Engaging with the value chain offer a strategic advantage as it allows companies to take a lead on corporate sustainability and puts them in a position to set the blueprint for other businesses to follow
19
A N N U A L R E P O R T 2 0 2 0
Emission reduction targets and initiatives
Targets
In recent years accelerated climate change has forced businesses to set more ambitious climate goals and commit to advocating for a low-carbon economy Today it is considered a standard practice for businesses to report their annual emissions and undertake efforts to reduce their carbon footprint Of the 67 Indian companies responding to investor requests 57 have undertaken a total of 95 emissions reduction targets including absolute targets intensity targets and both absolute and intensity targets 24 of these were approved SBTs
The global pandemic has reinforced the need for business resilience in operations and corporate leaders have started recognising that science-based climate action goes hand-in-hand with building business success49 Companies are looking science-based targets as guiding lights with a defined pathway to future-proof growth and with impending climate change hazards more companies have doubled down on their commitments towards a low-carbon transition50 The momentum for SBTs has reached across a range of industries including cement
49 The new normal 1000 companies are now setting science-based climate targets - Science Based Targets50 httpswwwcdpnetenarticlesclimate2020-lessons-from-an-extraordinary-year
automobiles pharmaceuticals metals amp mining real estate and information technology
As more companies are striving toward commitments this year witnessed an increase in the number of approved SBTs from seven targets last year to 24 targets this year
Leading companies are moving forward by setting long-term emissions reduction targets to mitigate climate-related risks Compared to 2019 this year more targets
were set under a long-term time frame till 2030 and a lesser focus had been given on short-term targets ie till 2020 Most of the companies selected a base year of 2018 and had gone for the intensity targets Hence in upcoming years long-term targets can play a major role for companies to support their sustainability visions and their journey towards low-carbon transition Apart from these companies also reported 83 other targets which included 38 energy consumption targets 13 energy productivity targets and 11 waste management targets amongst others
TARGETS amp PERFORMANCE
More than
three times increase in the number of approved science-based targets
of the responding companies set long-term targets (ie till 2030)
50
15
Absolute target
5Both absolute and intensity
targets
37
Intensity target
10
No target
No of Companies
GHG Emission Reduction Target Types
Absolute emission targets count
Intensity emission targets count
Types of targets based on time-frame of target year
820
Till 2020
1929
Till 2021 - 2030
136
2031 and beyond
20
A N N U A L R E P O R T 2 0 2 0
Emission reduction initiatives
While the number of companies taking up Emission Reduction Initiatives (ERI) has grown from 53 to 58 the number of initiatives has declined from 293 to 287 resulting in a 13 decrease in the estimated annual CO2e savings this year
Energy efficiency in production processes and in buildings continue to account for most ERIs non-energy industrial process emission reductions have been outweighed in their CO2e saving potential
Other emission reduction initiatives such as upgrading equipment with high-efficiency alternatives and digitisation initiatives undertaken by banks accounted for the highest estimated CO2e savings In terms of the highest monetary savings energy efficiency in production processes contributed to 76 of monetary savings followed by energy-efficiency in building services
The steel sector had the highest number of initiatives for energy efficiency in production process and accounted for
of total estimated annual CO2e savings
88Monetary Savings from Emission Reduction Initiatives
Annual monetary savings (Million `) No of Initiatives
20611 1918 576 237 148Energy
efficiency in production processes
Non-energy industrial process
emissions reductions
Other initiative
Waste reduction
and material circularity
Energy efficiency in
buildings
150
63 1210
2
Emission Reduction Initiatives
6340 2772 2574 2016 1278
6310
150
122
Other initiatives
Non-energy industrial process
emissions reductions
Energy efficiency in production processes
Waste reduction
and material circularity
Energy efficiency in
buildings
No of InitiativesEstimated annual CO2e savings (MtCO2e)
21
A N N U A L R E P O R T 2 0 2 0
The rise in climate consciousness among Indian companies is evident from the growing number of those committed to the Science Based Target Initiative (SBTi) By 2020 52 companies have committed to it with a significant growth of more than 37 over last year India is now the leader from emerging economies for having the maximum number of companies committing to SBTi and globally it stands at the sixth position
Of the 52 committed companies 22 have further approved SBTs in 2020 compared to 10 in 2019 The initiative champions SBT setting as a powerful way of future-proofing companiesrsquo growth in the transition towards a low-carbon economy51 The initiativersquos overall aim is for SBT setting to become a standard business practice and for companies to play a major role in driving down global GHG emissions Embedding SBTs as a fundamental component of sustainability management practices is crucial for achieving this
The Sectoral analysis of the Indian SBTi companies highlights the number of companies that are committed to the initiative and the number of those with approved set targets across each sector
51 httpssciencebasedtargetsorgresourcesfilesSBTi-manualpdf52 httpssciencebasedtargetsorgresourceslegacy201805SBT-transport-guidance-Finalpdf
Compared to last year the automobiles and components sector is still leading with the highest commitment and targets set The automobile sector is one of the fastest growing sectors which represents 23 of all energy-related global emissions52 Decarbonisng the automobile sector is possible through disruptive technological innovation land-use planning and transport demand management modal shift and
shifting to electric mobility Companies that set ambitious SBTs can send a strong signal for local regional and national policies to increase the level of ambition and steer the transition
In 2020 28 SBTi committed companies responded to CDPrsquos Investor request to disclose to the Climate Change questionnaire The emissions profile shows that the overall Scope 1+ Scope 2 emissions of SBTi companies responding to CDP represent almost 20 of the total Scope 1+ Scope 2 emissions and 71 of the total Scope 3 emissions in the overall CDP India Investor sample
A greater share of Scope 3 emissions reported by SBTi companies indicate that there is now a greater focus on the Scope 3 GHG Inventory as the companies are planning to set SBTs in coming years As per the SBTi a complete Scope 3 screening or inventory is required for the validation of the SBTs and it is not acceptable to exclude any relevant categories
What is a lsquoScience-Based Targetrsquo
Science Based Targets are the GHG emissions reduction targets consistent with the level of decarbonisation that according to climate science is required to limit global temperature increase to 15- 2ordmC compared to pre-industrial temperature levels
Science Based Target ensures that the company is taking shorter-term action to reduce emissions at a pace that is consistent with keeping warming below 15ordm well-below 2ordm C
SCIENCE-BASED TARGETS AMBITIOUS CORPORATE CLIMATE ACTION
200
128107
74 57 52
United States of America
(USA)
United Kingdom
(UK)
Japan Sweden IndiaFrance
No of Companies
Top 5 countries with SBTi companies
22 28 303
No
of C
ompa
nies 10
22Status of SBTi Companies in India
Committed Target Set
22
A N N U A L R E P O R T 2 0 2 0
CDP India data shows that 33 companies have reported reduction in their gross global emissions (Scope 1 and 2 combined) from the previous reporting year whereas 26 companies have their gross global emissions increased for this reporting year
CDPrsquos data shows that there are 32 companies that are considering setting a SBT in the next two years compared to 29 companies in the previous reporting year There are 11 intensity and eight absolute targets that companies consider to be SBT but this has not been approved by SBTi yet
The increase in these target number highlights that there are more companies which seek to commit to SBTi and get their targets validated in the coming years
Growth in ambition
CDPrsquos five-year data shows a rise in the number of Indian companies committing to the SBTi Their reported emissions increased by 144 due to increased commitment from energy intensive companies this year which includes companies from cement and metal and mining sectors
CDP India investor responding companies
SBTi companies (28 companies respond to CDP)
Emissions Profile (MtCO2e)
6815
134
Scope 1 Scope 2
22282
Scope 3
1259896
NO of Companies
Water Transportation
Professional Services
Textiles Apparel Luxury Goods
Software and Services
Pharmaceuticals and Biotech
Mining - Metals (Iron Aluminium Other Metals)
Food Production - Agricultural Production
Electrical Equipment and Machinery
Electric Utilities and Energy Related
Commercial services and supplies
Air Freight Transportation and Logistics
Food and Beverage Processing
Electric Utilities and IPPs and Energy Traders
Construction Materials
Automobiles and Components
Consumer Products and Durables
Banks Diverse Financials and Insurance
Chemicals
Hospitality
Real Estate
Telecommunications
1
1
3
2
2
2
1
1
1
1
1
1
1
1
2
3
3
2
1
1
6
2
4
1
1
2
3
3
Sectoral Analysis of Indian SBTi companies
Committed Companies Target Set Companies
33
14
Decreased
26
12
Increased
62
Reporting for the first time
1No Change
CDP India investor responding companies
SBTi companies (28 companies respond to CDP)
Comparison of change in gross Scope 1+2 emissions from previous year for SBTi companies vis-agrave-vis CDP reporting
companies
Emission Reduction Targets Reported by Companies in 2020
3
Not SBT not anticipating setting in 2
years
24
8
Not SBT but anticipating setting
in 2 years
4 5
Yes this is SBT approved by SBTi
11 8
Yes this is SBT not approved by
SBTi
Intensity emissions reduction target
Absolute emissions reduction target
No
of c
ompa
nies
23
A N N U A L R E P O R T 2 0 2 0
We witnessed the highest number of SBTi companies responding to CDP India this year which is a 40 growth from last year This further proves that companies are becoming more responsible towards disclosing their GHG Inventory with greater transparency
The graph for the estimated annual carbon savings shows the top three emission reduction initiatives undertaken by SBTi companies reporting to CDP It is evident that over the years low carbon energy purchase and energy efficiency process have gained momentum in reducing GHG emission with an increase in the number of SBTi committed companies implementing these initiatives Maximum carbon savings of 791 MtCO2e have been reported from the cement and concrete sector The metal smelting refining amp forming sector has reported 59237 tons CO2e savings this year with a significant decrease from 70422 tons CO2e savings in the last year There has been a reduction of 443 MtCO2e of estimated annual carbon savings reported by SBTi companies in 2020 as compared to the last year
Data shared by three reporting companies that have also committed to the SBTi (Ambuja Cement Ltd ACC Limited and Ultratech Cement Limited) shows that improving energy efficiency in their production processes has led to cement being the leading sector in reducing GHG emissions
About SBTi
The Science Based Targets initiative champions science-based target setting as a powerful way of boosting companiesrsquo competitive advantage in the transition to the low-carbon economy
It is a collaboration between CDP the United Nations Global Compact (UNGC) World Resources Institute (WRI) and the World-Wide Fund for Nature (WWF) and one of the We Mean Business Coalition commitments
The initiative
bull Showcases companies that set science-based targets through case studies events and media to highlight the increased innovation reduced regulatory uncertainty strengthened investor confidence and improved profitability and competitiveness generated by science-based target setting
bull Defines and promotes best practice in science-based target setting with the support of a Technical Advisory Group
bull Offers resources workshops and guidance to reduce barriers to adoption
bull Independently assesses and approves companiesrsquo targets
Indian SBTi companies responded to CDP Climate Change Investor Program 2020
54
Increase in SBTi companies responding to CDP via 2020 climate Change Investor Disclosure Program compared to previous year
40
Increase in Scope 1+2 Emissions and
Indian SBTi Companies responding to investor request reported reduction in Gross Global emissions compared to previous year
Increase in Scope 3 Emissions covered by SBTi Companies this year as compared to 2019
14450
185
Comparison of Absolute Scope 1+2 emissions (MtCO2e) for SBTi companies reporting to CDP
Emission reported in MtCO2e SBTi companies reporting to CDP
15 16 15 18 20 28
2015 2016 2017 2018 2019 2020
Abso
lute
Sco
pe 1
+2 E
mis
sion
(MtC
O2 e
)
364
8
380
4
479
4
605
5
583
4
142
26
24
A N N U A L R E P O R T 2 0 2 0
Advantages 53
1 Reducing regulatory risks and uncertainties As the government continues to work on implementing the Paris Agreement and meeting the ambition of the country-level pledges Science Based Targets initiative can prove out to be a resilience against the upcoming regulations
2 Strengthening Investor Confidence SBTi can help in strengthening the investor confidence as the investors are highly taking interest in businessesrsquo environmental policies
53 httpssciencebasedtargetsorgblogsix-business-benefits-of-setting-science-based-targets
3 Competitive Edge Companies are getting ahead of their peers by succeeding in the low-carbon transition with increased innovation reduced uncertainty strengthened investor confidence and improved profitability
4 Brand Reputation SBT is a global Initiative which shows robustness confidence and credibility which further helps in building up the brand reputation
Estimated annual CO2e savings of SBTi companies (in lsquo000 tCO2e)
2
Develop Target
3
Submit target for validation
4
Announce Target
1
Commit
Joining Call to Action
We look forward to companies taking action by committing to develop Science-based Targets
68
Energy efficiency Processes
Low carbon energy purchase
Energy efficiency Building services
Estim
ated
ann
ual C
O2e
sav
ings
(in
000
tCO
2e)
60126
2018 2019 2020
124
5184
346
43
7911168
25
A N N U A L R E P O R T 2 0 2 0
Science Based Targets Incubator is a unique project of CDP that was launched in April 2020 with support from MacArthur Foundation amp Shakti Sustainable Energy Foundation in partnership with WWF India to provide technical support with the main objective of handholding and catapulting organisations from commitment stage to target development stage of Science Based Targets Initiative Value Proposition
1 There will be no financial implication on the company
2 Case studies of businesses with validated targets will be shared with the participating companies for peer-to-peer learning
3 Capacity Building workshops and webinars based on recent developments and various other nitty-gritty of SBTi
4 In house trainings and one-on-one meetings with companies where CDP India will explain all stages of the SBTi and provide answers to all the technical queries
26
A N N U A L R E P O R T 2 0 2 0
BUSINESS AMBITION FOR 15degC
lsquoBusiness Ambition for 15degCrsquo is an urgent call to action from a global coalition of UN agencies business and industry leaders Businesses can make a critical contribution to limit the worst impacts of climate change by setting a net-zero target in line with 15degC future57
So far over 300 companies representing more than $36 trillion in market cap have responded to the open letter from global leaders and signed the Business Ambition for 15degC commitment
bull In India 13 companies55 have already aligned and set their target with the most ambitious aim of the Paris Agreement to level global temperature rise to 15degC above preindustrial levels
bull Automobiles and Components and Real Estate are the top sectors that have approved targets aligning with 15degC Ambition
bull In India 13 companies are further committed to Business Ambition for 15degC
bull All the companies in the Real Estate sector from India have approved targets aligning with 15degC Scenario
54 httpssciencebasedtargetsorgbusiness-ambition-for-1-5c55 Mahindra Logistics Ltd Mahindra Heavy Engines Ltd White House Dr Reddys Laboratories Ltd Mahindra EPC Irrigation Limited Swaraj Engines Limited Gromax Agri Equipment
Limited Mahindra Accelo Mahindra Holidays and Resorts India Limited Mahindra Lifespaces Developers Limited Mahindra World City (Jaipur) Ltd Mahindra World City Developers Ltd and Polygenta Technologies Limited
56 httpssciencebasedtargetsorgnet-zero
Net zero a north star for climate action
According to the latest report by the IPCC to limit global warming to 15degC above pre-industrial levels and to avoid the most disastrous impacts of climate change the world must halve CO2 emissions by around 2030 and reach net-zero CO2 emissions by 2050
Companies are increasingly adopting the net-zero climate targets by recognising the importance of keeping global warming to 15degC Between July 2019 and June 2020 over 230 companies committed to reach net-zero emissions as part of the Business Ambition for 15degC campaign an urgent call-to-action for companies to set emissions reduction targets in line with a 15degC future The campaign is led by the SBTi and supported by a global coalition of UN leaders business organisations and NGOs56
27
A N N U A L R E P O R T 2 0 2 0
A carbon price is a cost applied to carbon pollution to discourage polluters Economists agree a carbon price is the single most effective tool for countries to reduce their emissions57 Corporations have been using internal carbon pricing (ICP) as a strategy to manage climate-related business risks and prepare for the transition to a low-carbon economy Carbon pricing policies create strong transparent incentives for firms to internalise the social costs of carbon emissions58 Major investors and financial regulators are calling for businesses to disclose their climate risks and their policies to mitigate emissions59 The most sought-after benefits are that a company can use ICP both as a risk management tool and as a part of its decarbonisation strategy
To see how fast carbon pricing is spreading consider Paragraph 136 of the decision text of the Paris Agreement ldquoproviding incentives for emission reduction activities including tools such as domestic policies and carbon pricingrdquo The final agreement recognised carbon pricingrsquos importance as a powerful incentive to cut emissions by companies and regional state and local governments
The IPCC special report on the impacts of global warming of 15 degC above pre-industrial levels states that an explicit carbon pricing mechanism can theoretically achieve cost-effective emission reductions Along with best practice policies a moderate carbon pricing can help reduce global CO2 emissions significantly60 Parties are encouraged to set prices consistent with Carbon Pricing Leadership Coalitionrsquos
57 What is a carbon price and why do we need one58 Energy the Environment and Technological Change59 Firms ignoring climate crisis will go bankrupt says Mark Carney60 An I P C C Special Report on the impacts of global warming of 15 C above pre-industrial levels and related global
greenhouse gas emission pathways in the context of strengthening the global response to the threat of climate change sustainable development and efforts to eradicate poverty Intergovernmental Panel on Climate Change (2018)
61 Carbon Pricing WBCSD policy paper 2019httpsdocswbcsdorg201909Carbon-Pricing-WBCSD-Policy-Paper-2019pdf WBCSD 2019
62 SHOULD EVERY COUNTRY ON EARTH COPY SWEDENrsquoS CARBON TAX63 httpswwwedienetregistrationregwall
(CPLC) high-level commission on carbon pricing which states that an explicit-price range of US$50ndash100tCO2 by 2030 will be consistent with delivering the Paris Agreement61
Carbon prices have varied widely across existing schemes Success stories such as that of Sweden which currently has the highest carbon price in the world at US$123tCO2 demonstrate that it is indeed possible to make carbon pricing work while the Swedish economy grew by 78 since the introduction of the Swedish carbon tax in 1991 carbon emissions have decreased by 2662 Other countries like The UK
(US$4229) Netherlands (US$3638tCO2) have also committed to increasing their carbon prices in the coming decade63 The worldrsquos top three emitters -- US China and India -- however have put negligible prices on carbon
As part of the lsquoBuild Back Betterrsquo strategy carbon pricing can be a valuable tool
US$123tCO2
Sweden
US$4229tCO2
UK
US$3638tCO2
Netherlands
INTERNAL CARBON PRICEndash ROBUST CLIMATE STRATEGY
28
A N N U A L R E P O R T 2 0 2 0
to guide investment decisions It can help focus on a green stimulus package to recover from the old economy which promotes a carbon-intensive future Different stimulus measures can help clean energy technologies compete with carbon-intensive alternatives and encourage more efficient energy use India is witnessing this momentum ndash a Declaration on Climate Change was signed by 24 key industry captains and Ministry of Environment Forest and Climate Change (MoEFCC) at the virtual India CEO forum on Climate Change on 5th December 2020 Shri Javadekar further said that this declaration by private sector companies voluntarily is a historic step
To guide companies in the implementation of climate-related financial disclosures the TCFD65 developed four recommendations mimicking an organisational structure Governance Strategy Risk Management and Metrics and Targets An ICP is a proposed metric through which entities can safeguard their businesses by internalising market signals The TCFD specifically lists ICP as a key metric to assess climate-related risks and opportunities in line with its strategy and risk management process By attributing a financial cost to risks associated with carbon emissions and translating them into a uniform metric financial decision-makers can integrate transition risks into their business decisions and fill the analysis gap for assets of various time horizons
64 httpnbrienvisnicinViewGeneralLatestNewsaspxId=9829ampYear=202065 httpnbrienvisnicinViewGeneralLatestNewsaspxId=9829ampYear=202066 Implementing the Recommendations of the Task Force on Climate-related Financial Disclosures The Taskforce on Climate-related Financial Disclosures June 2017
Mr Ravi S Prasad Additional Secretary spoke about a coordinating structure for implementation of Paris Agreement which will incorporate internal carbon pricing67
The MoEFCC also constituted a high-level inter-ministerial Apex Committee for Implementation of Paris Agreement (AIPA) in December 2020 under the chairmanship of the Secretary MoEFCCThe purpose of AIPA is to generate a coordinated response on climate change matters that ensures India is on track towards meeting its obligations under the Paris Agreement including its NDC
Senior officials from 14 ministries will serve as Members to AIPA who will oversee the progress in implementation of Indiarsquos NDC and receive periodic information updates to monitor review and revisit climate goals to fulfil the requirements of the Paris Agreement Another key function of AIPA would be to operate as a National Authority to regulate carbon markets in India under Article 6 of the Paris Agreement formulate guidelines for consideration of projects or activities under the article issue guidelines on carbon pricing market mechanism and other similar instruments that have a bearing on climate change and NDCs
It will take note of the contributions of the private sector as well as multi-bi-lateral agencies in the field of climate change and provide guidance for aligning their climate actions with national priorities
ICP will be a useful preparatory tool for future government climate policies
Investors are increasingly demanding comprehensive climate disclosures
It will stay and will be instituted more commonly
A robust carbon pricing system plays an important role in driving
GHG reductions
It complements climate policies for sustained and successful
emissions reductions
It helps make informed decisions and incentivies
low-cost abatement options
Business case for pricing carbon
29
A N N U A L R E P O R T 2 0 2 0
When disclosing on ICP the TCFD recommends that companies should disclose on the followingbull what assumptions are made about how carbon price(s)
would develop over time (within tax andor emissions trading frameworks)
bull geographic scope of implementationbull whether the carbon price would apply only at the mar-
gin or as a base costbull whether the price is applied to specific economic sec-
tors or across the whole economy and in what regionsbull whether a common carbon price is used (at multiple
points in time) or differentiated prices bull assumptions about scope and modality of a CO2 price
via tax or trading scheme
67 httpswwwgreentechmediacomarticlesreadeuropean-oil-majors-ready-to-scale-up-energy-transition-investment68 httpswwwgreenbizcomarticlebp-walks-away-three-us-trade-groups-over-carbon-pricing69 Convention on Biological Diversity ndash Markets for Carbon Offsets Accessible at httpswwwcbdintfinancialoffsetsg-offsetclimatecarbonpdf page 8
Earlier this year BP one of Europersquos oil supermajors announced a carbon price of US$100tonne of CO2 a giant increase from their previous price of US$4067 and walked away from three US-based oil and gas trade organisations - American Fuel and Petrochemical Manufacturers (AFPM) the Western States Petroleum Association (WSPA) and the Western Energy Alliance (WEA) over differences regarding policy positions on carbon pricing68
CDP has been asking companies to disclose their practice of using ICP since 2013 In 2020 23 of the investor responding companies have reported putting a price on carbon as compared to last yearrsquos 19 while the number of companies planning to price in the next two years reduced to 21 from 23 in 2019 After adding Supply Chain responding companies a total of 58 companies are pricing or are planning to price carbon in the next two years in 2020 a 12 increase from 2019 It was further seen that of the 23 companies that are pricing carbon in 2020 52 use a shadow price followed by implicit price
The Task Force defines an internal carbon price as ldquoan internally developed estimated cost of carbon emissionsrdquo which can be used as a planning tool to help identify revenue opportunities and risks as an incentive to drive energy efficiencies to reduce costs and to guide capital investment decisions69
52
26
4
9
44
Shadow price
Implicit price
Implicit price Internal fee
Internal fee
Offsets
Implicit price Shadow price
Types of ICP used by Indian companies
Pricing Planning to price in the next 2 years
2
25
2015
8
36
2016 2017
26
14
2018
14
32
2019
20
31
2020
2533
No
of C
ompa
nies
ICP trend in India
30
A N N U A L R E P O R T 2 0 2 0
Type of ICP Shadow price Carbon fee Implicit price Internal trading
Description Hypothetical cost of carbon emissions
A per-unit fee based on the amount of GHG the company emits (eg `700 per tCO2e)
Helps quantify the capital investments required to meet climate-related targets
Allows business units within a company to trade their allocated carbon credits based on respective emissions
Objectivesusage
The most common form of ICP is a shadow price helps organisations better understand the impacts of climate-related risks such as technological shifts or future regulations It can help a company with both risk management as well as internal strategic planning
It allows companies to model or test how a range of carbon prices affect their divisions capital investments and other planned projects It is similar to forecasting with a range of energy prices
Putting a fee on carbon helps create an actual pool of funds generating a revenue stream to help pave the way for greener projects and further RampD This prepares a company for a carbon-resilient world This tool has the ability to encourage a business to transform into an environmental leader It allows for the creation of internal funds to invest into energy efficiency or renewable energy projects in order to cut energy costs
It also builds awareness of the importance of emission reductions within different business units
An implicit price helps companies understand their initial carbon footprint and is also used as a benchmark to implement a more strategic internal price
Internal trading helps create awareness It allows companies to prepare for stringent forms such as shadow prices or internal fees
Method An additional criterion is introduced in investment analysis during the calculation of the internal rate of return (IRR)
The additional criterion is the carbon value which is incorporated into each investment decision and applied to resulting GHG emissions This carbon price is assumed the same way assumptions are made about exchange rates or commodity prices
It is implemented by voluntarily adding a cost to GHG emissions in relation to operational costs
It increases the operating expenses (OPEX)
There are short-term emissions reductions Transfers of actual funds within the company are done through two mechanisms First by offsetting GHG emissions by purchasing offset credits externally Second by providing internal financing for emission reduction projects low- carbon products amp services and RampD
The carbon fee also provides monetary incentives for pro-environment initiativesactivities
Some companies with emissions reduction or renewable energy targets calculate their lsquoimplicit carbon pricersquo by dividing the cost of abatement procurement by the tonnes of CO2e abated
Trading is driven by the allocation of a fixed number of carbon dioxide emission lsquoallowancesrsquo for individual business units with each allowance equivalent to 1 metric tCO2 If business units exceed their cap they must purchase additional allowances to offset their excess emissions
Where business units under-emit they may sell allowances Business units may also choose to invest in carbon offsets outside their own units in order to sell on the internal trading scheme72
A sectoral analysis of the data finds two high emissions intensive sectors cement and concrete followed by IT and software development An increasing number of companies from cement and IT sectors are now committing to the SBTi and moving towards aligning emissions in line with 15-degree an ICP in such cases can be effectively used as a tool for mitigating climate risks and achieving the greater goal of a SBT or a net-zero target It helps companies build their internal capacity and measure their progress
1313
2626
2222
1313
44 44
1818
Metal smelting refining amp forming
Cement amp concrete
IT amp software development
Biotech amp pharmaFood amp beverage
processing
Chemicals
Transportation equipment
31
A N N U A L R E P O R T 2 0 2 0
Below are the ICP disclosed by Indian companies in 2020
Company Price in INR (`) Price in USD ($) Type of ICP used
ACC 2541 3394 Implicit price Shadow price
Ambuja Cements 21639 3074 Implicit price
Dalmia Bharat Ltd 77334 11 Shadow price
Dr Reddyrsquos Laboratories 937 1332 Implicit price
Godrej Consumer Products Limited 750 10 Shadow price
Godrej Industries 740 10 Shadow price
Hero Motocorp Ltd private private private
Hindustan Zinc 111846 159 Implicit price
Infosys Limited 100182 1425 Implicit price
JSW Cement Limited 1566 21 Shadow price
JSW Steel Ltd 1400 20 Shadow price
Mahindra amp Mahindra 98242 1397 Internal fee
Mindtree Ltd private private private
Shree Cement private private private
Tata Chemicals 140607 20 Shadow price
Tata Consultancy Services 1131 1608 Implicit price Shadow price
Tata Consumer Products Ltd 315 448 Offsets
Tata Motors 980 14 Shadow price
Tata Steel 975 - 2720 15 -3868 Implicit price Shadow Price
Tech Mahindra 70303 10 Implicit price Internal fee
Ultratech Cement 750 1066 Shadow price
Wipro 352291 5011 Shadow price
Since these companies did not provide a conversion rate the average conversion rate for the 2019 calendar year was taken (1` = 0014224USD)
Managing climate risk with Internal Carbon Price and Science Based Targets
By integrating ICP into ambitions targets set by SBT companies can achieve greater emissions reduction SBTs empower companies to engage internal teams with a common data-driven goal and integrate their carbon reduction strategies with other business objectives70 A step that organisations can take to implement TCFD recommendations as well as achieve their SBTs is putting an internal price on carbon It is observed that having an internal carbon price can enhance an organisationrsquos competitiveness71 Several companies are already using ICP to highlight their progress towards targets and inform a business case for low-carbon investments Of the 25 companies that have disclosed to CDP in 2020 13 that committed to SBTi also have an ICP
Setting a carbon price can be a strong commitment towards driving change and action Clear goals for the ICP enable
70 Science-Based Targets How Aligning Carbon Reduction Targets With Climate Science Can Drive Business Growth SampP Dow Jones Indices 201771 httpswwwgreenbizcomarticlemanaging-climate-risk-carbon-pricing-and-science-based-targets72 CDP Handbook on Carbon Pricing73 httpswwwcdpnetenreportsdownloads491874 httpsb8f65cb373b1b7b15feb-c70d8ead6ced550b4d987d7c03fcdd1dsslcf3rackcdncomcmsreportsdocuments000002771originalCDP-Carbon-Pricing-Handbook
pdf1508927220
companies to make better decisions regarding the type and price of carbon72 A high-level commitment can provide a companyrsquos perspective and insight on how other companies have been able to adopt innovative financing practices such as ICP and carbon taxes which are spurred by setting ambitious targets in line with the SBT initiative
In January 2020 in partnership with TERI CDP India released a second handbook in ICP - Putting a Price on Carbon A Handbook for Indian Companies 20 73 a second edition to the handbook released in October 17 74The first handbook was prepared to lay out the landscape of carbon pricing and help companies understand about external and ICP along with guidance on how to approach an internal carbon price The aim of the second handbook was to further mobilise the adoption of internal carbon price by companies The handbook discusses steps to arrive at a price and use it in an organisation including details on indicative pricing levels
32
A N N U A L R E P O R T 2 0 2 0
ACC Ltd are using internal carbon price as a tool to drive and incentivise low-carbon initiatives and emissionenergy reduction projects We have observed that ICP helps ROI to look attractive and helps us make informed decisions
ACC Ltd has already committed and published their 2030 targets for specific CO2 emission reduction and use of waste derived resources (as a part of SD 2030 plan) We have also committed to SBTi and are working on setting stricter targets aligning with below 2 DS To achieve these commitments and relevant targets we believe that ICP may play an important role in prioritising our future actions and investments Going forward we also plan to use the ICP for managing risk and leveraging opportunities
mdash ACC Ltd
Steps to Setting an
internal carbon price
Make a commitment
Communicate your progress
Set the scope of the internal carbon price
Decide price level and variance
Monitoring and reporting
Define the type of ICP
01
02
03
0405
06
07
08
Map your objectives
Establish the degree of influence in business application
33
A N N U A L R E P O R T 2 0 2 0
THE RENEWABLE ENERGY THRUST In 2020 the 67 companies headquartered in India have reported a total of 291 Terra Watt hours (TWh) electricity consumption more than double the previous yearrsquos number Notably the significant increase in total electricity consumption is attributed to just one company ndash Vedanta Limited with 151 TWh of electricity consumption for its global operations
The total electricity consumption excluding Vedanta is 140 TWh 48 higher than the previous year The rise in the total reported electricity consumption is primarily due to an increase in the number of responding companies from the energy intensive sectors These 67 companies have consumed about 16 TWh renewable electricity which is 6 of the total electricity consumption reported in 2020 The share of renewable electricity is 11 without counting Vedanta in the sample This is 6 higher than the previous year
The growth in the share of renewable electricity consumption is due to multiple factors such as the increasing number of voluntary corporate GHG emission reduction targets renewable energy targets and compliance targets such as Renewable Energy Purchase Obligations (RPO) In 2020 18 companies from India have reported various types of renewable energy targets Some of these companies have taken more than one renewable energy target type These 18 companies have reported 98 TWh of electricity consumption of which 13 is from renewable energy sources The level
Type of renewable energy targets
Renewable Energy Targets
17
1 1 2Renewable Electricity
Consumption
Renewable Electricity
Production
Renewable Electricity Capacity
Renewable Energy Financing
Target
No
of C
ompa
nies
RE100 is the global corporate renewable energy initiative bringing together hundreds of large and ambitious businesses committed to 100 renewable electricity Led by the Climate Group and in partnership with CDP RE100rsquos mission is to accelerate change towards zero carbon grids at scale There are 4 companies headquartered in India that have committed to the RE100 initiative - Dalmia Bharat Ltd Infosys Ltd Mahindra Holidays amp Resorts India Ltd and Tata Motors Ltd
The RE100 membership continues to grow and diversify - with 42 of new members coming from the Asia-Pacific region in 2020 With 260+ members and gt278 TWh of electricity consumption aggregated electricity demand of RE100 members is higher than Australiarsquos The share of renewable electricity is 42 of total consumption showing strong progress towards 100 goal
Over 70 global RE100 members have operations in India ndash with gt2 TWh of electricity consumption in the country About 39 of electricity consumed in India came from renewable energy sources largely sourced through unbundled energy attribute certificates and power purchase agreements
Visit RE100org and follow RE100 on Twitter
34
A N N U A L R E P O R T 2 0 2 0
Note Some companies have reported renewable electricity consumption total instead of break-down details as per the sourcing method Data for those companies is not included in the above chart
131
17
03
01
Renewable Electricity Sourcing Methods (TWh)
Self-generation
Unbundled Energy Attribute Certificates (EACs)
Power Purchase Agreement (PPA)
Green Electricity Products
of ambition ie a share of renewable energy in the target year for most of the companies varies between 20-100 Showing the leadership in renewable electricity sourcing 3 companies75 have committed to source 100 renewable electricity across their operations and joined RE100 initiative
GHG emission reduction targets are popular among companies in India and 57 companies have reported absolute intensity or both absolute and intensity targets Among these 30 companies have committed to science-based targets Initiative and their targets are in line with climate science Six companies have dedicated scope 2 emission reduction targets Scope 2 emissions are indirect emissions from the generation of purchased energy consumed by the reporting company Companies with GHG emission reduction targets tend to source renewable energy to reduce their emissions primarily scope 2 emissions The Majority of these companies have taken exclusive renewable energy targets to support meeting their GHG emission reduction targets
Renewable energy plays an important role in the corporate value chain due to its zero-carbon intensity and ability to provide long-term energy security About 34 companies have identified opportunities related to shifting energy usage towards low-carbon energy sources across the value chain Of these 32 have identified opportunities in the direct operations followed by 6 companies in the upstream and 2 in the downstream of the value chain These companies have estimated energy related opportunities worth `317 billion mainly in the direct operations Half of these companies anticipate short time frame (1-5 years) to tap these
75 4 India headquartered companies are committed to the RE100 initiative 3 of them report to CDPrsquos climate questionnaire
opportunities Companies have not just identified energy related opportunities but implemented energy related initiatives in the reporting year across their operations About 31 companies have implemented low-carbon energy consumption or production related initiatives in the reporting year that resulted in an estimated annual carbon savings of 18 million tCO2 and `27 billion of annual monetary savings
Companies from the manufacturing and materials sectors have reported the highest volume -14 TWh of renewable electricity consumption Manufacturing sector companies are relatively performing better than companies from the materials sector in terms of the share of renewable energy in total electricity consumption There are 25 companies from these two sectors mainly energy intensive business such as cement metals and mining steel and transport original equipment manufacturers (OEMs) The aggregate electricity consumption of these companies is over 100 TWh The companies from the fossil fuel-based energy generation are not included in the following charts
A detailed breakdown shows that self-generation of renewable electricity is the most preferred sourcing option among companies followed by purchase of renewable electricity through unbundled Energy Attribute Certificates (EACs) and Power Purchase Agreement (PPA) with an onsiteoffsite generator Up to 10 companies have reported 03 TWh of total renewable electricity consumption via PPA (on-grid and off-grid) which has declined from 11 TWh of consumption reported in the previous year
35
A N N U A L R E P O R T 2 0 2 0
Materials Manufacturing Food beverage amp agriculture
Biotech health care amp pharma
OtherInfrastructureServices
3
17
6
35
3
20
12
Total Electricity Consumption (TWh) Total RE Consumption (TWh) RE
Electricity consumption by sector with Vedanta Limited included in the analysis
Electricity consumption by sector excluding Vedanta Limited
Materials Manufacturing Food beverage amp agriculture
Biotech health care amp pharma
OtherInfrastructureServices
7
17
35
20
1236
Total Electricity Consumption (TWh) Total RE Consumption (TWh) RE
TWh
TWh
36
A N N U A L R E P O R T 2 0 2 0
2737worth opportunities
identified
Billion
`
16of Renewable Electricity Consumption Reported
TWh
704of total [ Scope
1+2location-based] emissions reported
MtCO2e
7138Inherent financial
risk identified
Billion
`
25have Internal Carbon
Pricing
Companies 52Companies in India
SBTi
37
A N N U A L R E P O R T 2 0 2 0
WATER SECURITY The way out of water crisis
Five of the worldrsquos largest cities under water stress are in India with Delhi ranked second on the list76 The water crisis is more alarming than imagined ndash 600 million people in India face high-to-extreme water stress77 Indiarsquos water demand is projected to increase by two times the available supply by 2030 putting hundreds of million people at the risk of water scarcity and ultimately losing the country 6 of its GDP78 In 2019 the country witnessed the worst droughts in recorded history Over 500 million people were affected across the country and major cities such as Chennai experienced lsquozero dayrsquo scenarios wherein water literally ran out Since improvements in water security are essential for Indiarsquos development investing in water merits a sound business case
Though 80 of Indian states have legislations on water conservation and prevention of encroachment of water bodies79 poor data management absence of water pricing inefficient irrigation techniques and the lack of adequate sewage treatment curb the countryrsquos ability to manage water sustainably80 In recent times companies have become more aware of the risks of increased water consumption pollution and unstable precipitation aggravated by climate change81 A 2019 World Bank Report (Quality Unknown)82 warned of the economic health and environmental damage caused by contaminated water highlighting water quality as an ldquoinvisible crisisrdquo that is under-appreciated and underestimated It warned that poor water quality driven by industrial agricultural and urban pollution could lead to a reduction by 13rd of economic growth in some places
76 httpsocialnitigovinuploadssamplewater_index_report2pdf77 httpsnitigovinsitesdefaultfiles2019-06Final20Report20of20the20Research20Study20on2020
Composite20Water20Resources20Management20Index20for20Indian20States20conducted20by20Dalberg20Global20Development20Advisors20Pvt20Ltd_New20Delhipdf
78 httpsnitigovinsitesdefaultfiles2019-06Final20Report20of20the20Research20Study20on2020Composite20Water20Resources20Management20Index20for20Indian20States20conducted20by20Dalberg20Global20Development20Advisors20Pvt20Ltd_New20Delhipdf
79 httpsocialnitigovinuploadssamplewater_index_report2pdf80 httpswwwcdpnetenarticlescompaniesindias-looming-water-crisis-a-call-to-action-for-companies81 Think globally act locally new guidance for companies on sustainable water use - CDP82 httpsopenknowledgeworldbankorghandle109863224583 httpswwwwriorgaqueduct84 Aqueduct Country Ranking (wriorg)85 The objective of the campaign is to drive further corporate transparency around climate change deforestation and water
security by encouraging companies to respond to CDPrsquos disclosure request
Water stress in India remains a key challenge Aqueduct83 ranked India 13th in the world on high water stress score -- 412 out of 584 The private sector is vital to delivering a water secure future Companies in the food textile retail energy industrial chemicals pharmaceuticals and mining sectors account for and wield influence over 70 of the worldrsquos water use and pollution The decisions one takes about how to grow and expand can make or break onersquos ability to tackle the global water crisis
CDPs Water Security program requests companies to disclose critical information on water parameters which are crucial to the business It helps companies monitor and benchmark their performance on these critical parameters to ensure adequate water availability for their businesses Investors and customers are increasingly keen to know how companies respond and adapt to water-related risks The Non-Disclosure Campaign (NDC) is an annual CDP initiative where investors can target companies that have been requested to respond but failed to do so85 Globally for water security Indian companies achieved the highest response rate to the NDC campaign with 50 of engaged companies submitting a response on this critical issue ndash 28 times higher than their control group Responding through CDPrsquos Water Security questionnaire will help businesses understand the risks and opportunities associated with water-related issues
Reduction in Economic Growth caused by power water in some countries
13rd
Water stress by 2030-ratio of withdrawals to renewable supply
People will live in water stress area by 2030
Increase in water demand in last 100 years
WRI 2020
UNEP
UN World Waterdevelopment Report 2020
increase in Water Security investor responding companies in India
8756
1in 2
x6
38
A N N U A L R E P O R T 2 0 2 0
helping them capitalise on actions to safeguard water resources86 The number of disclosing companies increased from 15 last year to 28 companies this year an increase of approximately 87
Measuring Monitoring and Verification
Regular measuring and monitoring of water-related parameters across all operations and the entire value-chain is the first step in laying the path for efficient water management In 2020 28 companies measured a total of 268 water related parameters It was found that amongst volumetric water metrics water discharge was the most monitored accounting for 41 of all measurements Water withdrawals accounted for 29 of all measurements water consumption for 10 and water recycling and reuse accounted for 10 each Although these metrics were being continuously monitored and measured by companies a sector-wide analysis shows that significant growth in some water-intensive sectors has put pressure on the demand for industrial water The electric utilities sector for example reported an increased water demand of 771174 megalitres in 2020 which was the highest amongst all sectors Adani Power Ltd highlighted new aqusitions and increased power generation as major reasons for rise in water demand this year The chemicals sector showed the second highest rise in water demand this year -- 195832 megalitres this year
Some companies have shouldered the responsibility of having audits conducted on their reported water metrics for greater
86 httpsb8f65cb373b1b7b15feb-c70d8ead6ced550b4d987d7c03fcdd1dsslcf3rackcdncomcmsreportsdocuments000000893originalCDP-india-business-case-for-water-disclosurepdf1472051621
87 https6fefcbb86e61af1b2fc4-c70d8ead6ced550b4d987d7c03fcdd1dsslcf3rackcdncomcmsreportsdocuments000005312originalAnalysis_of_CA100__Data_for_CDP_Investor_Signatories_v5pdf1596046258
88 https6fefcbb86e61af1b2fc4-c70d8ead6ced550b4d987d7c03fcdd1dsslcf3rackcdncomcmsreportsdocuments000005312originalAnalysis_of_CA100__Data_for_CDP_Investor_Signatories_v5pdf1596046258
89 https6fefcbb86e61af1b2fc4-c70d8ead6ced550b4d987d7c03fcdd1dsslcf3rackcdncomcmsreportsdocuments000005312originalAnalysis_of_CA100__Data_for_CDP_
transparency and credibility Amongst the verification standards that were employed 26 of the responding organisations used ISAE 3000 with Tata Chemicals being the sole company to apply both ISAE 3000 and AA1000AS to meet assurance standards
In 2020 25 responding companies withdrew consumed and discharged 7933064 megalitres 1403171 megalitres and 6625032 megalitres of water respectively However in 2019 these figures stood at 217736 megalitres 860517 megalitres and 67686 megalitres respectively for 15 responding companies
WATER ASPECTSWater Consumptionndash the amount of water a company has drawn into its boundaries and has permanently removed from the local water cycle90
Of the 28 respondents three did not disclose water consumption data or were in their first year of measurement 9 increased their water consumption over the previous reporting year 12 decreased it and 4 reported no change
Water Withdrawalsndash the amount of water the company has temporarily removed from the local water cycle and returned as discharge water91
Of the 28 respondents three did not disclose water withdrawal data or were in their first year of measurement 7 reported an increase over the previous year 14 had lowered their withdrawal and 4 reported no change
Water Discharges ndash the amount of water that leaves a companys facility and if left untreated could be a source of pollution92
Of the 28 respondents three did not disclose water discharge data or were in their first year of measurement 9 reported an increase in water discharge over the previous year 6 lowered it and 10 reported no change CDPrsquos data highlights new acquisitions increased production activities and project expansions as the primary reasons for increased water demand amongst the companies
of companies measured all water aspects (withdrawals discharge and consumption) across 100 of facilities
64
of companies believe that availbility of good quality freshwater is vital for the success of their business39
2910
4110
10
Water withdrawalsWater recycledreused
Water discharge
Water consumption
Others
Measured and monitored water aspects
39
A N N U A L R E P O R T 2 0 2 0
Data further shows that brackish surface water and seawater were the primary water sources for industries followed by fresh surface water source The electric utilities sector was the most reliant on brackish surface water and seawater accounting for 72 of the sectorrsquos total water withdrawals At 59 fresh surface water was the primary source of withdrawal for the chemicals sector Of the 28 companies 13 had implemented water conservation measures to reduce water withdrawals from groundwater sources this year Water withdrawals from groundwater - renewable accounted for less than 05 of total withdrawals
In terms of water discharge most (81) was released into brackish surface water and seawater environments Discharges into fresh surface water accounted for the remaining 19 of the total discharges Our data suggests more companies are installing zero liquid discharge units and water harvesting techniques across their facilities leading to less groundwater discharge
Fresh surface water accounted for 29 of total water withdrawals by source in 2020 Indiarsquos major river basins - Ganges Brahmaputra Godavari Indus and Cauvery are the primary source of freshwater for the industries Around 15 of total freshwater demand from CDP responding companies was supplied by the
Investor_Signatories_v5pdf159604625890 Worldrsquos 18 Most Water-Stressed Rivers | World Resources Institute (wriorg)
Ganges and Brahmaputra river basins another 15 came from the Godavari basin followed by Cauvery Indus Banas and Sabarmati river basins The demand for water has increased over the years causing these basins to rank among the most water-stressed catchments in the world90 Of the 83 facilities in India 53 were in water-stressed regions Our data shows that around 60 of total responding companies withdrew water from water-stressed regions Of these nine were from the materials industry and two were from the food beverage amp agriculture industry
Governance and Business Strategy
For a long time corporate sustainability strategies have focused on measurable and manageable challenges such as product footprint efficiency in supply chain water conservation and others Businesses have begun to take stock of water security by innovating for improved efficiency measuring direct withdrawals assessing risk to neighbours and considering leakages
CDPrsquos data shows that corporate leaders across India are responding to this crisis by focusing on their water policy to monitor risks and opportunities and integrate it in their strategies Around 71 companies report having a documented water policy that is accessible to the public Up to 93 companies indicated that they have a board-level oversight of water related issues within the organisation observed either by the Chief Executive Officer (CEO) or the director on board followed by the board-level committee
Around 43 of the responding companies report on water-related issues quarterly and 33 more frequently This shows the increasing self-awareness among companies on water-related issues Further 63 of these companies offer some form of
facilities out of a total of 83 from the responding companies were in areas with water-stress53
Water discharge by destination
Brackish surface
water and Seawater
Fresh surface water
Groundwater
Third party
532
225
2
975
156
93
Water discharge (megalitersyear)
125
013
1
Brackish surface
water and Seawater
Groundwater ndash non
renewable
Groundwater ndash renewable
ProducedEntrained
water
Third party
Fresh surface water
231
800
261
04
405
21
489
Water withdrawals (megalitersyear)
Water withdrawals by destination
7564
662
6
No
of c
ampa
nies
Industry
1
Appa
rel
1
Biot
ech
hea
lth
care
amp p
harm
a
1
Man
ufac
turin
g
2Fo
od b
ever
age
amp ag
ricul
ture
1
Pow
er
gene
ratio
n
1
Tran
spor
tatio
n se
rvic
es
1
Serv
ices
9
Mat
eria
ls
Industry-wise water withdrawals from water-stressed areas
40
A N N U A L R E P O R T 2 0 2 0
incentive to their employees ndash monetary or otherwise -- for the management of water related issues
Businesses are stepping up and playing a vital role in developing water initiatives that can ease the stress on crucial watersheds Companies are also looking into water security related long-term business objectives and financial planning as a part of their overall business plans Almost 70 companies prefer short to mid-term (5-10 years) over long-term (11-30 years) planning This does not come as a surprise as water effects are felt locally and require more immediate strategic planning Of the 28 reporting companies 12 use climate-related scenario analysis to inform its water-related business strategy and eight anticipate doing so in the next two years A majority of these companies belong to the chemicals and the electric utilities sector
In 2019 about 13 companies were pricing their water this increased in 2020 to 18 and 50 are now exploring the its possibilities Companies such as Ambuja Cement (US$110 `7800
91 marico-sustainability-report-18pdf
Marico Ltd Establishing a strategy to improve water-security across operations and value chain
With a host of agro-based products water availability is a crucial parameter for Marico Ltd92 Under the risk management framework it has identified adverse impact of water scarcity as an environmental risk to the company To mitigate this environmental risk the company has initiated watershed management programs and a reduced-reuse-recycle model of water management across its operations Through a water stewardship program the company aims to address water security challenges in low rain-fed areas around its workplace and factories
In the reporting period FY 19-20 the company withdrew 202886 cubic meters of water and reported a reduction of 9 from previous year The company had reported a reduction of 31 in water intensity from the 2014 level through the company-wide introduction of water efficiency measures improvements in water recycling water-efficient taps and rainwater harvesting systems For improving water management practices across water stress areas Marico utilised the WRI aqueduct tool to evaluate water risk across all manufacturing facilities in India This tool helped the company identify the number of facilities that fall under the water stress area -- according to it five out of eight plants are in such zones The implementation of water conservation initiatives had helped three water-stressed sites reduce water consumption over the previous year Among three water-stressed sites Jalgaon reported 15 reduction in water consumption Baddi reported 16 and Paonta 28
Establishing a strategy to reduce and minimise water use was one of the companys key commitments Marico foresees its future water withdrawal levels reducing given its move towards improving water efficiency and incorporating recycling throughout the production cycle
Frequency of reporting on water-related issues
633
43
Annually
More frequently than quarterly
Quarterly
6
10 2Half-yearly
As important matters arise
Less frequently than annually
41
A N N U A L R E P O R T 2 0 2 0
to US$8240 `579800 per megalitre) Dr Reddyrsquos Laboratories (US$088`67 to US$591`449 per KL) Piramal Glass and Tata Steel use an internal price on water
Risks amp opportunities
Dwindling water supply is a major cause of concern for businesses since it poses significant direct and indirect impacts Visible risks such as droughts have a more explicit impact as they ruin vegetation and severely undermine the agriculture sector But subtle impacts present challenges to other sectors Water shortages also threaten the long-term viability of businesses by leading to higher costs eventually borne by the consumers Without proper management the economic repercussions of water scarcity will be felt in myriad ways92
In 2020 companies that experienced detrimental water-related impacts have incurred financial losses worth `1580 million Physical risks such as inadequate infrastructure and increased water stress account for more than half of these commercial losses followed by reputational-cum-market like subpar access to water sanitation and hygiene services and regulatory risks eg- failure to set mandatory water efficiency conservation and recycling standards Corporations should thus strategically prioritise dealing with these risks to safeguard their financial bottom lines For this organisations have looked to secure alternate sources of water supply adopt water efficiency and conservation practices as well as reuse and recycling of water
A 2018 report from NITI Aayog93 highlighted the fact that the country faced its worst water crisis that year Rising water challenges have put strong regulatory pressure on businesses in India with significant operational risks The private sector is a big contributor towards deepening water security issues but is also crucial in addressing it
Given the current situation with water resources it is perhaps unsurprising that many of the companies responding to CDP find themselves exposed to a plethora of physical and transition risks ndash that is risks from regulatory or consumer reforms aimed at addressing the water crisis These risks threaten their reputation and license to operate their supply chains security financial stability and their ability to grow As per CDPrsquos Global Water
92 httpsglobalriskinsightscom201612economic-cost-global-water-scarcity93 httpsnitigovinsitesdefaultfiles2019-06Final20Report20of20the20Research20Study20on2020Composite20Water20Resources20Management20Index20
for20Indian20States20conducted20by20Dalberg20Global20Development20Advisors20Pvt20Ltd_New20Delhipdf94 https6fefcbb86e61af1b2fc4-c70d8ead6ced550b4d987d7c03fcdd1dsslcf3rackcdncomcmsreportsdocuments000005165originalCDP_Global_Water_Report_2019
pdf159110644595 The term WASH refers to the provision of water sanitation and hygiene Universal affordable and sustainable access to WASH is a key public health issue within international
development and is the focus of the first two targets of Sustainable Development Goal 6 (SDG 6)96 httpswwwworldbankorgentopicwaterbriefwash-water-sanitation-hygiene-and-covid-19
Report 201994 the combined business value at risk reported in 2019 topped out at US$425 billion with about 40 of the risks anticipated to hit within the next 1-3 years Whether it was the blockading of a Newmont Goldcorp mine in Mexico or poor water quality threatening the production of Unileverrsquos Hellmannrsquos mayonnaise in the Mississippi River Basin the impacts of the global water crisis are already being felt
Water risks and risk assessment
As per the 2020 data 71 of the responding companies consider current or future water-related regulations as a risk to business followed by 57 companies that consider access to WASH95 services for employees as very relevant and always included in their water-risk assessments This shows that companies are vigilant about providing safe access to drinking water sanitation arrangements and proper hygiene at workplace The COVID-19 pandemic has highlighted the importance of WASH to human health and well-being Safely managed WASH services along with good hygiene practices can help prevent infectious diseases that kill millions each year96 In addition 50 companies reported that water used for their key commoditiesraw materials is relevant enough to be considered for their risk-assessment This was the most pertinent for chemical sector companies
of the 28 Indian responding companies undertake water-related risk assessment25
Total financial loss by reporting companies as per risk type
38
53
9
Reputation and Market Risk
Physical Risk
Regulatory Risk
1580 MILLION
In 2020 companies that experienced detrimental water-related impacts have incurred financial losses worth
1580 million
42
A N N U A L R E P O R T 2 0 2 0
It is crucial to consider stakeholders in risk assessment procedures for a comprehensive understanding of water-related risks Of the 25 companies that undertake water-related risk
97 httpswwwweforumorgreportsthe-global-risks-report-2020
assessments 68 always include employees in their internal assessment procedures by conducting training and awareness programs on water conversation initiatives communicating water-related policies etc This is followed by regulators and local communities who are relevant in water-risk assessment procedures at 61 and 54 respectively for the responding companies It is a positive sign that Indian companies are engaging with their employees and local communities and ensuring that the latter are not negatively impacted in terms of habitation health and water availability
According to The World Economic Forumrsquos Global Risk Report 202097 water crises are among the top five risks in terms of impact for the past ten consecutive years Water-related risks are substantive in the risk assessment processes and identified as a threat to companiesrsquo bottom line putting at risk a combined business value of US$425 billion according to CDP 2019 data
RegulatoryPhysical
Reputational
Risk due to company
Risk due to context
Expectedunexpected change or uncertainty in law or regulation
Water scarcity too much water water
unfit for use
Litigation product risks due to changes in
consumer behavior
Caused by inefficient operations produces and services resulting in water pollution over exploitation etc
Caused by changing environmental and social conditions like droughts
flooding etc
Relevancy of water-related risks
7157 57 50 46 46 43
11
Water-related
regulatory frameworks
Access to fully-
functioning safely
managed WASH
services for all employees
Water availability at a basincatchment
level
Implications of water on
your key commoditiesraw materials
Stakeholder conflicts
concerning water
resources at a basincatchment
level
Water quality at a basin
catchment level
Status of ecosystems and habitats
Other contextual
issues please specify
Empl
oyee
s
Regu
lato
rs
Loca
l com
mun
ities
Rive
r bas
in m
anag
emen
t au
thor
ities
Wat
er u
tiliti
es a
t a lo
cal l
evel
Stat
utor
y sp
ecia
l int
eres
t gr
oups
at a
loca
l lev
el
Inve
stor
s
Supp
liers
Oth
er w
ater
use
rs a
t a
basi
nca
tchm
ent l
evel
Oth
er
NG
Os
Cust
omer
s
No of Companies age of Companies
Relevancy of stakeholders in water-risk assessment
6861 54 50 50 46 46 39 36 32 2918
43
A N N U A L R E P O R T 2 0 2 0
Water risk event
Impacting business
Increased Operational amp maintenance Costs Increased Compliance amp
Administration Costs
Closure of Operations
Supply chain distributions
Brand Damage and LitigationsShareholder
Distributions
Risk transferRisk avoidance and mitigation
Technological Risks
Repurational amp Market Risks
Regulatory Risks
Physical Risks
Financial ImpactsResidual Water RiskInherent Water Risks
Increased water stress
143721Increased water scarcity
41105Drought
17604Inadequate infrastructure
820
Physical Risks
Ecosystem vulnerability
300Severe weather events
69Declining water quality
63Flooding
13
Regulatory Risks
Technology Risks
Higher water prices Transition to
water intensive low carbon energy sources
Tighter regulatory standards
2333
120
All the figures reported are in million rupees
44
A N N U A L R E P O R T 2 0 2 0
CDPrsquos data shows that physical risks seem to have the highest magnitude of impact on the Indian responding companies Drought is seen to be the primary driver of potential substantive impact
Where there is risk there is opportunity
Where therersquos risk therersquos reward Industrial wastewater for example is a vast untapped resource It is a potential source of heat power process water and high-value materials And there has never been a better time for this transformation to take place -- technologies are better the regulatory climate is favourable and the business case is clear Meanwhile the market demand for pollution-free products is growing For companies to thrive they will need to be aligned to changing consumer demands If
98 httpswwwmarketsandmarketscomMarket-Reportssmart-water-management-market-1265html
they respond to these opportunities then market differentiation resilience and profitability are on the table
Globally corporate leaders have started realising the untapped potential of smart water technology and the market for smart water management is anticipated to grow from US$846 billion in 2016 to US$2010 billion in 202198 Industrial wastewater has for a long time been reused for cooling towers steel works oil refineries textile manufacturing and paper production It was found that 15 of the 23 companies valued improved water efficiency in operations as their primary opportunity having a substantive financial or strategic impact on business
of the 28 responding companies (approx 93) identified water-related opportunities in their business26
Improved water efficiency in operations
Increased resilience to impacts of climate change
Reduced impact of product use on water resources
Improved community relations
Water recovery from sewage management
Resilience to future regulatory changes
Sales of new productsservices Increased brand value
3000million
`4000
million18752
million
opportunities were identified by 21 respondents
opportunities were identified by 11 respondents
opportunities were identified
by 9 respondents
opportunities were identified
by 4 respondents
Efficiency Resilience Products and services
Markets
22
14
10
4
`329
million
`
`
45
A N N U A L R E P O R T 2 0 2 0
26
17
14
17
2
Others
Recyclingreuse
Consumption
Product water intensity
Discharge
14
10Withdrawals
Water use efficiency
Categories of water targets monitored at the corporate level
of companies set company-wide water targets
of companies set company-wide water goals
5556
Businesses have identified transparency in water management issues as a fundamental activity and disclosure through CDPrsquos annual water questionnaire produces a standard comparable dataset McGill University and Millani found that companies disclosed through CDP ranked 19 percentiles better than the average business in their ability to access capital99 The research showed that a comprehensive voluntary disclosure produces a quality management team with enhanced awareness of threats and opportunities linked to climate and environmental change
Targets and Goals100
In response to declining water resources many companies have started engaging in water stewardship and setting water targets aligned with SDG Goal 6 to ensure availability and sustainable management of water sanitation and hygiene facilities for all101 Developing water-related targets helps companies make meaningful change from informed actions at the local level102 In 2020 four companies did not set water-related targets within their operations Whereas 24 companies had water-related targets 26 of them had set targets for product water intensity 17 set recyclingreuse targets and 14 focused on water use efficiency
Companies can set goals and targets on a range of operational issues to drive performance andor manage risks and opportunities CDPrsquos data shows that a majority had set targets at the company-wide level -- 55 of responding companies reported setting water targets across the company This was followed by 26 who set water targets at the business level and 19 at the site or facility level While setting water goals around 56 of companies monitored their goals at the company level 24 at the sitefacility level and the remaining at the basin business or country-level
99 Craig M Coulombe E Nostrat A 2019 The Role of CDP Disclosure to Improve Access to Capital Research Note httpsf01c8ee6-cac3-40ff-a0e4-8bfb54f2b88bfilesusrcomugd66e92b_30b06fd11b9c43d88428f768676e9a8bpdf
100 Targets ndash quantitative Goals - qualitative101 httpsunstatsunorgsdgsreport2020goal-06102 httpsceowatermandateorgsite-targets-guide
A company has various drivers for setting goals and targets and it tries to align these with increased stakeholder concerns and environmental legislation Data shows that most organisations considered reducing environmental impact and risk mitigation as the primary motivation for monitoring water goals and targets Organisations also considered brand value protection as one of the important factor while setting goals
24
4
Target Set No Target
No
of C
ompa
nies
Water targets monitored at the corporate level
46
A N N U A L R E P O R T 2 0 2 0
Drivers behind setting water targets and goals at the corporate level
Reduced environmental impact
Water stewardship
Risk mitigation
Recommended sector best practice
Corporate social responsibility
Brand value protection
Cost savings
Shared value
Climate change adaptation amp mitigation strategiess
Commitment to the UN SDG
Increase freshwater availability for users
Other drivers
45
14
14
2
2
2
5
14
16
12
161212
12
4
4
4
44
GoalsTargets
age of Companies
47
A N N U A L R E P O R T 2 0 2 0
PROTECTING OUR FOREST WEALTH
The world lost an estimated 10 million hectares of forest annually between 2015 and 2020104 Protecting and restoring forests and other natural ecosystems could provide up to 30 of climate change mitigation action needed to limit global warming to below 20C by 2030105
Global demand for agricultural commodities is the primary driver of deforestation and ecosystem conversion -- timber is extracted unsustainably and land is cleared for agricultural production This represents major risks to businesses as commodities associated with deforestation such as palm oil soy cattle and timber products are the building blocks of millions of products traded globally and therefore feature in the supply chains of numerous organisations
103 httpswwwipccchsrccl104 The State of the Worldrsquos Forests 2020 Forests biodiversity and people105 httpswwwpnasorgcontent1144411645106 httpsappsfasusdagovnewgainapiapiReportDownloadReportByFileNamefileName=Oilseeds20and20
Products20Annual_New20Delhi_India_04-01-2020
The unsustainable production and supply of these commodities and activities not only poses a significant business risk but also has a severe negative impact on the environment especially the climate crisis
Deforestation is fundamentally linked to climate change According to the IPCC Special Report on Climate Change and Land (2019)103 11 of global GHG emissions are from deforestation and from the conversion of natural ecosystems for human use
At an 8 annual growth rate edible oil consumption in India is growing faster than the 3 growth rate in production Imports and imports are rising to fill the gap As a result India still is the largest importer of edible oils followed by China European Union and the United States Indiarsquos edible oil imports in MY 202021 are predicted to rise 6 to 15 MMT of this 85 MMT will be palm oil 35 MMT soybean 28 MMT sunflower seed oil and 02 MMT rapeseed (canola) oil
-United States Department of Agriculture106
In 2020 three Indian companies responded to CDPrsquos forests questionnaire -- one responded to the request for disclosure from investors while two responded to their customers Globally 687 companies responded to CDPrsquos forests questionnaire and 57 of them evaluated deforestation-related risks at US$5312 billion
13The mitigation potential of reduced deforestation is
13 of the global emissions
We cant address climate change without protecting our forests
They are vital carbon stores that help reduce global warming
48
A N N U A L R E P O R T 2 0 2 0
Disclosure on deforestation management through CDP could be a significant opportunity for companies operating in India one of the largest importers of palm oil in the world This can help Indian companies tap into lucrative opportunities by scaling sustainable trends CDPrsquos forests questionnaire allows companies that produce source or use palm oil soy timber cattle cocoa coffee and rubber to disclose Moreover new biodiversity-focused metals amp mining and coal sector questionnaires were introduced in 2019
Palm oil is the most commonly used processed oil in industrial food production with its production being responsible for 5 of global tropical deforestation107 Indiarsquos palm oil imports account for nearly 23rd of its total imports of edible oil This demand was shaken in 2020 when the pandemic hit with a 40 fall in the consumption of palm oil during the lockdown108 Indiarsquos imports which account for nearly 20 of the global trade in palm oil will have a major effect on efforts to make its production and processing sustainable The primary barrier for sustainable palm oil consumption in
India stems from it belonging to a more price-sensitive and volume driven market making environmental impacts a low or non- existent priority in the minds of consumers
Climate change can reduce palm oil production and with demand outstripping supply prices could rise The Roundtable on Sustainable Palm Oil (RSPO) has developed a set of environmental and social criteria which companies must comply with in order to produce Certified Sustainable Palm Oil (CSPO) When properly applied these criteria can help in minimising the negative impacts of palm oil cultivation
107 Deforestation amp Palm Oil 108 As worldrsquos largest importer of palm oil India has a duty to push for ethical production practices109 httpsseaofindiacominterim-data-on-import-of-edible-oils-march-2020-down-by-32-percent-nov19-to-mar20-down-by-10-percent110 httpsappsfasusdagovnewgainapiapiReportDownloadReportByFileNamefileName=Oilseeds20and20Products20Annual_New20Delhi_India_04-01-2020111 httpsresourcetradeearthyear=2018ampexporter=76ampimporter=699ampcategory=87ampunits=value112 httpswwwrvonlsitesdefaultfiles201705poultry-sector-in-india-2017pdf113 httpsresourcetradeearthpublicationscocoa-trade-climate-change-and-deforestation
The Sustainable Palm Oil Coalition for India (I-SPOC) was formed to promote the uptake of sustainable palm oil and its derivatives in India CDP amongst others has joined it as a member
Soy cultivation is the second largest soft commodity driver of tropical deforestation after cattle products Various aspects of soy production generate GHGs that contribute to climate change India imports around 33 lakh tons of soybean oil109 According to data from the US Department of Agriculture India
is set to import 35 lakh metric ton of soybean oil in 20202021110 In addition India is also responsible for clearing huge spaces of forest land in Brazil that contributed to 23 of soybean imports to India in 2018111 Soy is also used as fodder for livestock and a growing local demand for poultry products will further affect Indiarsquos position on deforestation The country ranks amongst the top four producers of egg and chicken in the world and it is increasingly exporting to the Middle East and Europe112
Cocoa has been a notable agent of deforestation since the last century The global production of cocoa has increased from 34 million to 45 million tonnes between 2000 and 2014 while the land use footprint of its plantations rose by 37 to 257 million acres113 About 90 of
cocoa is produced by 7 countries -- Ivory Coast Ghana Indonesia Ecuador Cameroon Brazil and Nigeria The dearth of incentives for improving the plantations combine with high investment costs to make cocoa a low yield crop forcing farmers to resort to clearing untouched forest lands in order to meet the growing demand and
lsquoPalm oil consumption dropped by
in 2020 in India due to COVID-19rsquo
40
Climate-Water-Forest nexus
Water is an essential component of mitigation and adaptation strategies
Rising temperatures and changing weather patterns increase stress on water availability
Tropical forests provide substantial emission reductions by acting as carbon sinks
Droughts resulting from rising temperatures and changes in weather patterns increase the risk of forests fires
A major portion of gobal freshwater depends on forests
49
A N N U A L R E P O R T 2 0 2 0
for cutting down production costs114 In Southern India Cocoa is mainly grown as an intercrop in conjunction with coconut areca nut oil and rubber plantations Indiarsquos consumption in 2015-16 was 30000 tonnes of which 57 was imported while the domestic production rose at an annual rate of 37 in the same period115 Failure to protect forests in the event of a sharp cocoa price increase will lead to unsustainable levels of deforestation116
The US$10 billion coffee industry too leaves a gargantuan ecological footprint It is estimated that every cup of coffee consumed results in the loss of one square inch of forest cover117 Each year around 250000 acres of land is cleared for coffee which is unsustainable The Kodagu district
in the Western Ghats of India is a major biodiversity hotspot which produces about one-third of the countryrsquos coffee This region has more than 270 tree species which are all under significant ecological stress due to the coffee farms that threaten land use and land cover while potentially leading to the felling of about 21000 trees118
An estimated 8-10 of global production of low-cost timber products comes from illegal logging in forests To meet the burgeoning demand of timber produce about 25 million acres of land is converted to fast-
wood forests (timber plantations) across the world annually and this hampers the ecosystem services that nature provides us119 With the World Bank forecasting that the global market for wood is set to quadruple by 2050120 reducing timberrsquos environmental footprint is vital for the industryrsquos success In India there is no provision of a central data pool that maintains records of production and consumption of timber There is a need to address this inconsistency in reporting and data collection by forging a comprehensive strategic policy and providing institutional support121 This would ensure effective collaboration among all stakeholders that would result not only in the production of quality forest products but also a sustainable timber sector
114 httpsresourcetradeearthpublicationscocoa-trade-climate-change-and-deforestation~text=As20cocoa20tends20to20beforest20loss20over20this20time115 httpseconomictimesindiatimescomindustrycons-productsfoodalthough-indias-consumption-of-chocolate-is-steadily-growing-but-we-still-depend-on-imports-for-116 httpsnationalzoosieduscbimigratorybirdsresearchcacaorufcfm117 httpsohiostatepressbookspubsciencebiteschaptera-bitter-brew-coffee-production-deforestation-soil-erosion-and-water-contamination~text=For20every20cup20of20
coffeeinch20of20rainforest20was20destroyedamptext=Chemical20buildup20in20soils20andsoil20eroding2C20and20land20degradation118 httpswebcachegoogleusercontentcomsearchq=cacheYhaeYHVPWasJhttpswwwmdpicom1999-4907114480pdf+ampcd=6amphl=enampct=clnkampgl=in119 httpsresourcetradeearthyear=2018ampexporter=76ampimporter=699ampcategory=87ampunits=value120 httpdocuments1worldbankorgcurateden240231467291388831pdf106467-REVISED-v1-PUBLICpdf121 httpsonlinelibrarywileycomdoifull1011111477-894712094122 httpsglobalforestatlasyaleeduamazonland-usecattle-ranching123 httpsresourcetradeearthyear=2018ampimporter=699ampcategory=779ampunits=value124 httpsresourcetradeearthyear=2018ampimporter=699ampcategory=779ampunits=value125 httplargestanfordeducourses2018ph240halper1~text=Every20half20hour2C20a20cowmore20potent20than20carbon20dioxideamptext=There20is20
rampant20deforestation2C20especiallyto20make20room20for20cattle126 httpswwwinvestopediacomarticlesinvesting0929155-countries-produce-most-carbon-dioxide-co2asp127 httpwwwcwejournalorgvol9no3do-extensive-rubber-plantation-influences-local-environment-a-case-study-from-tripura-northeast-india128 httpswwwibeforgdownloadRubber_Plastics_220708pdf
Beef production remains by far the largest driver of deforestation in the worldrsquos tropical forests as forest land cleared for cattle is more than twice the combined area required for producing soy palm oil and wooden products The problem of cattle ranching
is particularly profound in the Amazon region the largest forest reserve in the world leading to 80 of present deforestation rates122 Clearing land for grazing causes irreversible habitat loss soil degradation and conflict between humans and wild animals India imports 15 and 12 of bovine leather from Turkey and Brazil respectively which poses a great threat to the forest areas of these countries123 It also jeopardises the earnings of the Indian companies manufacturing such products for its European consumers who have a high degree of sensitivity and awareness around deforestation124 In a larger context the impact of cattle stretches far beyond the realm of forests and is one of the key reasons for rising global emissions and climate change There are more than 15 billion cows on Earth with each of them capable of expelling 17 times more GHG emissions than cars in the form of methane burps a gas several times more potent than CO2 in terms of trapping heat It is therefore not surprising that cattle accounts for a colossal 18 in atmospheric carbon emissions125 To put this in perspective this surpasses emissions of the third largest CO2 emitter India which accounts for a 7 share in worldwide emissions126
Another commodity whose production has significant impact on the environment is rubber Environmentalists have warned for years that the rapid expansion of rubber plantations would come at the expense of natural forests Rubber has
not been subjected to extensive publicity in a way that palm oil soy and paper have been over the years given their impact on the environmentmdashpublicity that has led to adoption of robust sustainability criteria for these commodities Indiarsquos natural rubber plantation spans across an area of 183 million acres as of 2012 with the raw material being used as an input for making 35000 finished products of industrial importance127 Currently the impact assessment of large-scale rubber plantations on the environment is non-existent in the country a worrying sign considering Indiarsquos position as the 4th largest consumer in the world128
50
A N N U A L R E P O R T 2 0 2 0
Fossil-fuel and mineral mining accounts for 7 of global deforestation Moreover it not only presents a threat to forest cover and resource extraction but also leads to long-term impacts such as soil and water pollution infrastructure development and
increased anthropogenic activity129 While the effects of large-scale mining are easier to quantify as they are well regulated and undertake environmental impact assessments it is the scope and impact of artisanal and small-scale mining (ASM) that goes under the radar due to lack of data and a high degree of informality in the sector In India this problem warrants special attention since over 12 million people are engaged in the ASM business with women and girls from backward communities and those living below the poverty line being its primary employees130 A landscape-level approach is critical not only to identify and monitor the environmental and social impacts of individual mining projects but also to consider its interactions with other land uses as well given the crucial role forests play in balancing the ecosystem131 Indiarsquos investor requested company Hindustan Zinc Ltd was the first to disclose this year under the mining sector
129 httpsglobalforestatlasyaleeduland-usemining-extraction130 httpswwwpactworldorgstate20of20asm131 httpswwwresearchgatenetpublication38084575_Landscape_approach_for_quantifying_land_use_land_cover_change_1972-2006_and_habitat_diversity_in_a_mining_area_in_
Central_India_Bokaro_Jharkhand
Hindustan Zinc Pioneering forest and biodiversity conservation in the mining sectorHindustan Zinc Limited is the first investor-requested company in India to respond to CDPrsquos Forests questionnaire It demonstrated that a dedicated Biodiversity Policy and Management Standard is its compass in reducing flora and fauna disruption and in minimising or compensating its impact of operation through project scoping site closure and beyond
Companies in India currently lag behind their regional peers in terms of disclosure on deforestation management with only 3 companies disclosing on this topic in 2020
40
65
22
3China Japan IndiaSEA
(Indonesia Malaysia
Phillipines Singapore Vietnam)
Total no of companies disclosing through CDPs Forests questionnaire in 2020 by HQ countryregion
51
A N N U A L R E P O R T 2 0 2 0
Nagpur
Udaipur
Panaji
Kochi
Rajkot
Vadodara
Delhi
Dehradun
Ahmedabad
Thane
Chennai
Tiruchirappalli Coimbatore
Bangalore
Kolkata
Gangtok
Siliguri
India Snapshot
CITIES STATES AND REGIONS
Cities
In 2020 over 800 cities disclosed their environmental information through CDP including 16 Indian cities The number of cities in India disclosing through the CDP-ICLEI Unified Reporting System increased from 13 in 2019 to 17 This was largely due to citiesrsquo ongoing commitments to climate leadership initiatives such as the C40 Cities Climate Leadership Group (C40) the Global Covenant of Mayors for Climate and Energy (GCoM) and our partnership with ICLEI whose South Asia Regional Office also acts as the GCoM South Asia Helpdesk
88 global cities reached CDPrsquos A list which include Bristol (UK) Miami (USA) Cape Town (South Africa) Buenos Aires (Argentina) and Auckland (New Zealand)
despite the COVID-19 pandemic The USA accounts for the highest number
(25) of cities on the A List making up 28 despite the US pulling out of
the Paris Agreement In India more than half the cities in disclosed
that
they either have sustainability targets incorporated into the master planning of the city or it is in progress while only 43 of the cities have a published plan that addresses climate change adaptation Approximately half of the disclosing Indian cities have identified opportunities as a result of addressing climate change and one-third of them have a GHG emission reduction target which is a strong indication towards a low carbon development pathway
States and Regions
In 2020 the Union Territories of Delhi and Jammu amp Kashmir along with over 120 states and regions from across the world disclosed their environmental impacts through CDP Globally 90 of states and regions reporting a 2030 target have one in line with the IPCCrsquos goal to reduce global greenhouse gas emissions by 40-50 from 2010 levels by 2030 and 55 of states and regions with a 2030 emissions reduction
target are showing greater ambition than their national
counterparts
Indian cities and 16
Indian states disclosed to CDP
2
52
A N N U A L R E P O R T 2 0 2 0
ANNEXURESAppendix I Table of emissions scores and sector by company
Sector Company Name 2020 permission Status
Final score 2020
Scope 1 Scope 2 Scope 3 Number of categories reported in Scope 3
Bars hotels amp restaurants
Indian Hotels Co Ltd
public C 50610 239568 23824 3
Biotech amp pharma Biocon public C 41948 133110 Not Provided
Dr Reddyrsquos Laboratories
public B 247317 154836 1272548 8
ZCL Chemicals public D- Not Provided Not Provided Not Provided
Cement amp concrete ACC public B 16966585 643870 648068 3
Ambuja Cements public B 14523738 551219 1973622 7
Dalmia Bharat Ltd
public B 11280051 537968 1320736048 9
JK Cement non public D Private Private Private Private
JSW Cement Limited
public B- 1398609 647870 572488 4
Shree Cement non public C Private Private Private Private
Ultratech Cement
public B 47954830 1327185 5376354 4
Chemicals Aarav Frances amp Flavors Private
Limited
public Not Scored
GHCL LIMITED public D 109470536 496707 Not Provided
Godrej Industries public B 32311 44361 6735893 3
Gujarat Fluorochemicals
non public C Private Private Private Private
Jubilant Life Sciences Ltd
non public C Private Private Private Private
Kansai Nerolac Paints Limited
non public Not Scored Private Private Private Private
Tata Chemicals public B 444988061 4505956 12162395 5
UPL Limited non public Private Private Private Private Private
Godrej Consumer
Products Limited
public A- 33980 30848 26433 2
Note Due to increase in sample size more samples were considered for this report These samples include companies from the BSE Top 200 list CDPrsquos Fixed Income sample FAIRR sample Emerging markets sample Environmental sample and Continuity climate change sampleFor further details visit https6fefcbb86e61af1b2fc4-c70d8ead6ced550b4d987d7c03fcdd1dsslcf3rackcdncomcomfycmsfilesfiles000003423originalCDP_Climate_Change_Sample_Investor_Request_2020pdfNot Scored- Companies who have submitted the minimum version questionnaire
53
A N N U A L R E P O R T 2 0 2 0
Sector Company Name 2020 permission Status
Final score 2020
Scope 1 Scope 2 Scope 3 Number of categories reported in Scope 3
Energy utility networks
Adani Transmission
Ltd
public D 31870076 21155 9379637 3
GAIL public C 4925087 387358 1071 1
Financial services Axis Bank public B 6250 168043 4414712 3
HDFC Bank Ltd public B 764919 390176 1642453 3
Indusind Bank public A 88316 6278567 1277912 3
Kotak Mahindra Bank
public C 9078 69780 4290177 3
LampT Finance Holdings Limited
non public Private Private Private Private Private
State Bank of India
public B- 390 1066386 257902 5
YES BANK Limited
public A- 344515 3099369 4859625 3
Agricultural commodities
Tata Consumer Products Ltd
public A- 11731 34238 3348672939 10
Marico public A- 1380 12140 499568 9
Intermodal transport amp logistics
Adani Ports amp Special
Economic Zone
public B- 95905791 176946845 202567171 3
IT amp software development
HCL Technologies
non public Private Private Private Private Private
Infosys Limited public A- 15344 124063 371602 6
Larsen amp Toubro Infotech Ltd
public B 39485 2521874 1908034 2
Mindtree Ltd non public A- Private Private Private Private
Tata Consultancy
Services
public A- 26714 811815 702615 7
Tech Mahindra public A 1803807 105736586 39285212 5
Wipro public A- 13366 124564 421527 7
Land amp property ownership amp development
Godrej Properties Limited
public Not Scored 4400 2429 422
Mahindra Lifespace
Developers Limited
public B 397 2675 589525 8
Light manufacturing APOLLO TYRES LTD
public Not Scored 24207 60717 Not Provided
JK Tyres amp Industries
public C 158568 88424 Not Provided
54
A N N U A L R E P O R T 2 0 2 0
Sector Company Name 2020 permission Status
Final score 2020
Scope 1 Scope 2 Scope 3 Number of categories reported in Scope 3
Media telecommunications amp data center services
Bharti Airtel non public D Private Private Private Private
Reliance Jio Infocomm
Limited
public B 105018 1826762 243195034 3
Tata Communications
public A- 6376 108482 6938 3
Metal smelting refining amp forming
Hindustan Zinc public A 4480887 253756 4182181 10
Vedanta Ltd public B- 57482869 1864711 Not Provided
JSW Steel Ltd public A- 40045307 476901 4168823 8
Tata Steel public A- 60116322 5687999 14970000 12
Metallic mineral mining
NMDC public D 29004 63671 1957 1
Oil amp gas processing Bharat Petroleum
Corporation
public B 5023580 366230 729820 2
Indian Oil Corporation
public D 18690000 54700 Not Provided
Renewable power generation
Adani Green Energy
public D 841 13313 1174 1
Azure Power public Private 323 2767
Specialized professional services
Mahindra amp Mahindra Financial Services
public B 3370 18847 22922 3
Piramal Enterprises
public C 4430568 8692844 Not Provided
Vakrangee Softwares Ltd
public B 2053355 35409 Not Provided
Textiles amp fabric goods
ARVIND Ltd public B- 3514561 238894 Not Provided
Thermal power generation
Adani Power Ltd public D 58970705 14607 6910800 1
JSW Energy public B 17200521 36117 61151 2
NTPC Ltd public D 252495018 15845 978052 3
Tata Power Co public C 34952981 22051 1226 1
Tobacco ITC Limited public B- 1241718 230192 206064 5
Transportation equipment
Hero Motocorp Ltd
non public D Private Private Private Private
Mahindra amp Mahindra
public A 40654 414552 58425531 11
Tata Motors public A- 60533 266200 3140861 8
55
A N N U A L R E P O R T 2 0 2 0
Climate Change ndash Investor requested companies132
CDP Activity Group Company name Response Status
Air transport InterGlobe Aviation Ltd Not submitted
Jet Airways (India) Ltd Not submitted
Apparel design Page Industries Ltd Not submitted
Bars hotels amp restaurants
Indian Hotels Co Ltd Submitted
Jubilant Foodworks Ltd Not submitted
Biotech amp pharma Abbott India Ltd See Another
Ajanta Pharma Ltd Not submitted
Alkem Laboratories Ltd Not submitted
Aurobindo Pharma Not submitted
Biocon Submitted
Cadila Healthcare Not submitted
Cipla Not submitted
Divirsquos Laboratories Not submitted
Dr Reddyrsquos Laboratories
Submitted
Glenmark Pharmaceuticals
Not submitted
Lupin Not submitted
Natco Pharma Ltd Not submitted
Pfizer Ltd See Another
Sun Pharma Advanced Research Company Ltd
Not submitted
Sun Pharmaceutical Industries
Not submitted
Torrent Pharmaceuticals
Not submitted
Cement amp concrete ACC Submitted
Ambuja Cements Submitted
Dalmia Bharat Ltd Submitted
India Cements Not submitted
JK Cement Ltd Submitted
Orient Cement Limited Not submitted
Shree Cement Submitted
The Ramco Cements Ltd
Not submitted
Ultratech Cement Submitted
132 These include companies from the BSE Top 200 list CDPrsquos Fixed Income sample FAIRR sample Emerging markets sample Environmental sample and Continuity climate change sample For further details visit https6fefcbb86e61af1b2fc4-c70d8ead6ced550b4d987d7c03fcdd1dsslcf3rackcdncomcomfycmsfilesfiles000003423originalCDP_Climate_Change_Sample_Investor_Request_2020pdf
See Another -The response is covered by another CDP reporting company usually the parent company
CDP Activity Group Company name Response Status
Chemicals Asian Paints Not submitted
Berger Paints India Ltd Not submitted
Castrol India Not submitted
Colgate Palmolive India See Another
Coromandel International
Not submitted
Dabur India Not submitted
Emami Ltd Not submitted
Godrej Consumer Products Limited
Submitted
Godrej Industries Submitted
GRAPHITE INDIA LTD Not submitted
HEG LTD Not submitted
Jubilant Life Sciences Ltd
Submitted
Kansai Nerolac Paints Limited
Submitted
PI Industries Ltd Not submitted
Pidilite Industries Ltd Not submitted
Procter amp Gamble Hygiene amp Health Care Ltd
See Another
SRF Ltd Not submitted
Supreme Industries Ltd Not submitted
Tata Chemicals Submitted
UPL Limited Submitted
Coal mining Adani Enterprises Not submitted
Coal India Not submitted
Gujarat Mineral Devp Corpn
Not submitted
Commercial amp consumer services
Quess Corp Ltd Not submitted
Construction Bharti Infratel Limited Not submitted
GVK Power amp Infrastructure
Not submitted
Honeywell Automation India Ltd
See Another
Larsen amp Toubro Not submitted
Voltas Not submitted
Appendix II List of companies invited to respond to CDP
56
A N N U A L R E P O R T 2 0 2 0
CDP Activity Group Company name Response Status
Financial services Gruh Finance Ltd Not submitted
HDFC Asset Management
Not submitted
HDFC Bank Ltd Submitted
HDFC Life Insurance Company Ltd
Not submitted
Housing Development Finance Corporation
Not submitted
ICICI Bank Limited Not submitted
ICICI Lombard General Insurance Company Ltd
Not submitted
ICICI Prudential Life Insurance Company Ltd
Not submitted
IDBI Bank Ltd Not submitted
IDFC First Bank Ltd Not submitted
Indiabulls Housing Finance Ltd
Not submitted
Indiabulls Ventures Ltd Not submitted
Indian Bank Not submitted
Indusind Bank Submitted
Kotak Mahindra Bank Submitted
LampT Finance Holdings Limited
Submitted
LIC Housing Finance Not submitted
Max Financial Services Not submitted
Motilal Oswal Financial Services Ltd
Not submitted
Muthoot Finance Limited
Not submitted
PNB Housing Finance Ltd
Not submitted
Power Finance Corporation
Not submitted
Punjab National Bank Not submitted
RBL Bank Ltd Not submitted
REC Ltd Not submitted
Reliance Nippon Life Asset Management Ltd
Not submitted
SBI Life Insurance Company Ltd
Not submitted
Shriram Transport Finance Co
Not submitted
State Bank of India Submitted
Union Bank of India Not submitted
YES BANK Limited Submitted
CDP Activity Group Company name Response Status
Convenience retail Avenue Supermarts Ltd Not submitted
Discretionary retail Aditya Birla Fashion and Retail Ltd
Not submitted
Future Retail Ltd Not submitted
Electrical amp electronic equipment
Amara Raja Batteries Ltd
Not submitted
Bharat Electronics Not submitted
Crompton Greaves Consumer Electricals Ltd
Not submitted
Exide Industries Not submitted
Havells India Not submitted
Motherson Sumi Systems
Not submitted
Whirlpool of India Ltd See Another
Energy utility networks
Adani Gas Ltd Not submitted
Adani Transmission Ltd Submitted
CESC Ltd Not submitted
GAIL Submitted
Indraprastha Gas Ltd Not submitted
Power Grid Corpn of India
Not submitted
Reliance Infrastructure Not submitted
Torrent Power Not submitted
Financial services AU Small Finance Bank Ltd
Not submitted
Axis Bank Submitted
Bajaj Finance Limited Not submitted
Bajaj Finserv Not submitted
Bajaj Holdings amp Invst (BHIL)
Not submitted
Bandhan Bank Not submitted
Bank of Baroda Not submitted
Bank of India Not submitted
Canara Bank Not submitted
Cholamandalam Investment and Finance Co Ltd
Not submitted
Cholamandalam Investment and Finance Company Ltd
Not submitted
City Union Bank Ltd Not submitted
Edelweiss Financial Services Ltd
Not submitted
Federal Bank Not submitted
General Insurance Corporation of India
Not submitted
57
A N N U A L R E P O R T 2 0 2 0
CDP Activity Group Company name Response Status
Food amp beverage processing
Britannia Industries Not submitted
Marico Submitted
Tata Consumer Products
Submitted
United Breweries Not submitted
United Spirits Not submitted
Varun Beverages Ltd Not submitted
Venkys India Ltd Not submitted
Health care provision Apollo Hospitals Enterprises
Not submitted
Industrial support services
GMR Infrastructure Limited
Not submitted
Intermodal transport amp logistics
Adani Ports amp Special Economic Zone
Submitted
Container Corporation of India
Not submitted
IT amp software development
HCL Technologies Submitted
Infosys Limited Submitted
Larsen amp Toubro Infotech Ltd
Submitted
Mindtree Ltd Submitted
MphasiS Not submitted
Oracle Financial Services
See Another
Tata Consultancy Services
Submitted
Tech Mahindra Submitted
Wipro Submitted
WNS Holdings ADR Not submitted
Land amp property ownership amp development
DLF Not submitted
Godrej Properties Limited
Submitted
Housing Development amp Infrastructure
Not submitted
Oberoi Realty Not submitted
Leisure amp home manufacturing
Rajesh Exports Ltd Not submitted
Titan Company Limited Not submitted
Light manufacturing 3M India Ltd Not submitted
APOLLO TYRES LTD Submitted
Balkrishna Industries Ltd
Not submitted
Ceat Ltd Not submitted
MRF LTD Not submitted
CDP Activity Group Company name Response Status
Media telecommunications amp data center services
Bharti Airtel Submitted
Reliance Communications
Not submitted
Sun TV Network Not submitted
Tata Communications Submitted
Vodafone Idea Ltd Not submitted
Zee Entertainment Enterprises
Not submitted
Metal products manufacturing
AIA Engineering Ltd Not submitted
Bosch Ltd See Another
Endurance Technologies Ltd
Not submitted
Gillette India Not submitted
Metal smelting refining amp forming
Bharat Forge Ltd Not submitted
Essar Steel Limited Not submitted
Hindalco Industries Not submitted
Hindustan Zinc Submitted
Jindal Stainless Ltd Not submitted
Jindal Steel amp Power Not submitted
JSW Steel Ltd Submitted
Steel Authority of India Not submitted
Tata Metaliks Ltd Not submitted
Tata Steel Submitted
Vedanta Ltd Submitted
Metallic mineral mining
National Aluminium Co Not submitted
NMDC Submitted
Oil amp gas extraction amp production
Oil India Ltd Not submitted
Petronet LNG Not submitted
Oil amp gas processing Bharat Petroleum Corporation
Submitted
Hindustan Petroleum Corporation
Not submitted
Indian Oil Corporation Submitted
Mangalore Refinery and Petrochemicals
Not submitted
Nayara Energy Limited Not submitted
Oil amp Natural Gas Corporation
Not submitted
Reliance Industries Not submitted
Oil amp gas storage amp transportation
Gujarat State Petronet Not submitted
Other materials Astral Poly Technik Ltd Not submitted
Powered machinery Bharat Heavy Electricals
Not submitted
Cummins India See Another
58
A N N U A L R E P O R T 2 0 2 0
CDP Activity Group Company name Response Status
Renewable power generation
Adani Green Energy Submitted
Azure Power Submitted
National Hydroelectric Power Corporation Ltd (NHPC)
Not submitted
ReNew Power Private Limited
Not submitted
SJVN Ltd Not submitted
Specialized professional services
LampT Technology Services Ltd
Not submitted
Mahindra amp Mahindra Financial Services
Submitted
NBCC Ltd Not submitted
Piramal Enterprises Submitted
Vakrangee Softwares Ltd
Submitted
Textiles amp fabric goods
ARVIND Ltd Submitted
Birla CelluloseGrasim Industries
Not submitted
Chennai Petroleum Corporation
Not submitted
Thermal power generation
Adani Power Ltd Submitted
Aditya Birla Capital Not submitted
JSW Energy Submitted
KSK Energy Ventures Limited
Not submitted
NLC India Ltd Not submitted
NTPC Ltd Submitted
Reliance Power Not submitted
Tata Power Co Submitted
Tobacco ITC Limited Submitted
Transportation equipment
Ashok Leyland Not submitted
Bajaj Auto Not submitted
Eicher Motors Ltd Not submitted
Hero Motocorp Ltd Submitted
Mahindra amp Mahindra Submitted
Maruti Suzuki India Not submitted
Tata Motors Submitted
TVS Motor Company Ltd
Not submitted
Web amp marketing services
Info Edge (India) Ltd Not submitted
Wood amp paper materials
Century Textiles amp Industries
Not submitted
59
A N N U A L R E P O R T 2 0 2 0
Climate Change ndash Self Selected companies
CDP Activity Group Company name Response Status
Chemicals AARAV FRANCES amp FLAVORS PRIVATE LIMITED Submitted
GHCL LIMITED Submitted
Gujarat Fluorochemicals Submitted
Light manufacturing JK Tyres amp Industries Submitted
Cement amp concrete JSW Cement Limited Submitted
Land amp property ownership amp development Mahindra Lifespace Developers Limited Submitted
Media telecommunications amp data center services
Reliance Jio Infocomm Limited Submitted
Biotech amp pharma ZCL Chemicals Submitted
Water Security ndash Investor requested companies133
CDP Activity Group Name Response Status
Bars hotels amp restaurants Indian Hotels Co Ltd Submitted
Biotech amp pharma Ajanta Pharma Ltd Not submitted
Alkem Laboratories Ltd Not submitted
Aurobindo Pharma Not submitted
Biocon Not submitted
Cadila Healthcare Not submitted
Cipla Not submitted
Divirsquos Laboratories Not submitted
Dr Reddyrsquos Laboratories Submitted
Glenmark Pharmaceuticals Not submitted
Lupin Not submitted
Natco Pharma Ltd Not submitted
Sun Pharmaceutical Industries Not submitted
Torrent Pharmaceuticals Not submitted
ZCL Chemicals Submitted
Cement amp concrete ACC Not submitted
Ambuja Cements Submitted
Dalmia Bharat Ltd Not submitted
Shree Cement Not submitted
The Ramco Cements Ltd Not submitted
Ultratech Cement Submitted
Chemicals Asian Paints Not submitted
Berger Paints India Ltd Not submitted
Castrol India Not submitted
Coromandel International Not submitted
Dabur India Submitted
Emami Ltd Not submitted
Godrej Consumer Products Limited Submitted
Godrej Industries Submitted
Jubilant Life Sciences Ltd Submitted
Kansai Nerolac Paints Limited Submitted
Pidilite Industries Ltd Not submitted
Procter amp Gamble Hygiene amp Health Care Ltd Not submitted
SRF Ltd Not submitted
Supreme Industries Ltd Not submitted
Tata Chemicals Submitted
133 These include companies from the Water Global sample and Continuity water security sample For further details visit https6fefcbb86e61af1b2fc4-c70d8ead6ced550b4d987d7c03fcdd1dsslcf3rackcdncomcomfycmsfilesfiles000003422originalCDP_Water_Security_Sample_Investor_Request_2020pdf
60
A N N U A L R E P O R T 2 0 2 0
CDP Activity Group Name Response Status
UPL Limited Submitted
VVF Ltd Not submitted
Coal mining Adani Enterprises Not submitted
Coal India Not submitted
Construction Larsen amp Toubro Not submitted
Discretionary retail Aditya Birla Fashion and Retail Ltd Not submitted
Electrical amp electronic equipment Amara Raja Batteries Ltd Not submitted
Exide Industries Not submitted
Havells India Not submitted
Energy utility networks GAIL Not submitted
Power Grid Corpn of India Not submitted
Food amp beverage processing Marico Submitted
Tata Consumer Products Ltd Submitted
IT amp software development Tech Mahindra Submitted
Light manufacturing APOLLO TYRES LTD Not submitted
JK Tyres amp Industries Submitted
MRF LTD Not submitted
Media telecommunications amp data center services
Tata Communications Not submitted
Metal smelting refining amp forming Bharat Forge Ltd Not submitted
Hindalco Industries Not submitted
Hindustan Zinc Submitted
Jindal Steel amp Power Not submitted
JSW Steel Ltd Not submitted
Tata Steel Submitted
Metallic mineral mining National Aluminium Co Not submitted
NMDC Not submitted
Oil amp gas extraction amp production Oil India Ltd Not submitted
Petronet LNG Not submitted
Oil amp gas processing Bharat Petroleum Corporation Not submitted
Hindustan Petroleum Corporation Not submitted
Indian Oil Corporation Not submitted
Oil amp Natural Gas Corporation Not submitted
Reliance Industries Not submitted
Oil amp gas storage amp transportation Gujarat State Petronet Not submitted
Specialized professional services Piramal Enterprises Submitted
Textiles amp fabric goods ARVIND Ltd Submitted
Birla CelluloseGrasim Industries Not submitted
Thermal power generation Adani Power Ltd Submitted
JSW Energy Not submitted
NTPC Ltd Submitted
Tata Power Co Submitted
Tobacco ITC Limited Submitted
Transportation equipment Ashok Leyland Not submitted
Bajaj Auto Not submitted
Hero Motocorp Ltd Not submitted
Mahindra amp Mahindra Submitted
Maruti Suzuki India Not submitted
Tata Motors Not submitted
61
A N N U A L R E P O R T 2 0 2 0
Water Security ndash Self Selected companies
CDP Activity Group Name Response Status
Chemicals AARAV FRANCES amp FLAVORS PRIVATE LIMITED Submitted
Transportation services Adani Ports amp Special Economic Zones Submitted
Other materials Piramal Glass Submitted
62
A N N U A L R E P O R T 2 0 2 0
Appendix III - Indian Companies Committed to ActionScience-based Target initiative (SBTi)Approved 15degC
Mahindra Heavy Engines Ltd Mahindra EPC Irrigation Limited White House
Dr Reddys Laboratories Ltd Swaraj Engines Limited Gromax Agri Equipment Limited
Mahindra Accelo Mahindra Holidays and Resorts India Limited Mahindra Lifespaces Developers Limited
Mahindra Lifespaces Developers Limited Mahindra World City (Jaipur) Ltd Mahindra World City Developers Ltd
Polygenta Technologies Limited
Approved well-below 2degC
Tata Chemicals Limited Mahindra amp Mahindra Limited Wipro
Mahindra First Choice Services Ltd Mahindra Electric Mobility Ltd
Approved 2degC
Hindustan Zinc Limited Mahindra Sanyo Special Steel Shree Cement Ltd
Tech Mahindra
SBTi Committed
Infosys Limited UPL Limited JSW Energy Limited
Godrej Agrovet Limited Godrej Consumer Products Limited Godrej Industries
Godrej Properties Limited Godrej amp Boyce Mfg Co Ltd Ultratech Cement Limited
Vakrangee Limited ACC Limited Adani Ports and Special Economic Zone Limited
SCM Garments PVT Limited Nahar Industrial Enterprises Limited Ambuja Cement Ltd
Adani Green Energy Ltd Reliance Jio Infocomm Limited Bharti Airtel Limited
Gujarat Fluorochemicals Ltd (GFL) Dalmia Bharat Limited HCL Technologies
Havells India Limited Mahindra Susten Eastman Exports Global Clothing Pvt Ltd
JK Tyre amp Industries Ltd Marico Limited Tata Global Beverages Ltd
EPC Industries Limited Mahindra amp Mahindra Financial Services Limited YES BankSBTi companies not in CDP Sample
RE100Dalmia Bharat Ltd Infosys Ltd Mahindra Holidays amp Resorts India Ltd
Tata Motors Ltd
RE100 companies not in CDP Sample
Internal Carbon Pricing (ICP)Pricing carbon in 2020
ACC Ambuja Cements Dalmia Bharat Ltd
Dr Reddyrsquos Laboratories Godrej Consumer Products Godrej Industries
Gujarat Fluorochemicals Hero Motocorp Ltd Hindustan Zinc
63
A N N U A L R E P O R T 2 0 2 0
Infosys Limited JSW Cement Limited JSW Steel Ltd
Mahindra amp Mahindra Mindtree Ltd Shree Cement
Tata Chemicals Tata Consultancy Services Tata Consumer Products
Tata Motors Tata Steel Tech Mahindra
Ultratech Cement Wipro
Planning to price in the next two years
Adani Ports amp Special Economic Zone ARVIND Ltd GAIL
GHCL LIMITED Indian Hotels Co Ltd JK Tyres amp Industries
JSW Energy Jubilant Life Sciences Ltd Larsen amp Toubro Infotech Ltd
Mahindra amp Mahindra Financial Services Mahindra Lifespace Developers Limited Marico
NTPC Ltd Piramal Enterprises Reliance Jio Infocomm Limited
Tata Communications Tata Power Co UPL Limited
Vakrangee Softwares Ltd Vedanta Ltd YES BANK Limited
64
A N N U A L R E P O R T 2 0 2 0
About CDPCDP is a not-for-profit charity that runs the global disclosure system or investors companies cities states and regions to manage their environmental impacts by running a global environmental disclosure system Each year CDP supports thousands of companies cities states and regions to measure and manage their risks and opportunities on climate change water security and deforestation We do so at the request of their investors purchasers and city stakeholders
Over the last two decades we have created a system that has resulted in unparalleled engagement on environmental issues worldwide In 2020 Over 9600 companies reported through CDP on climate change water security and forests and over 800 cities and more than 120 states and regions disclosed their environmental impacts through CDP
CDP IndiaCDP began working in India in 2008 and was formally registered in 2012 working on disclosure and driving climate action It serves as a source of knowledge for hundreds of Indian corporations from those that are just beginning on the road to corporate environmental disclosure through to those looking to improve sustainability and make commitments to reduce environmental impact
It is the only NGO to be named in Indiarsquos INDC submission to the UNFCCC owing to its corporate environmental data repository and tracking of emissions and mitigation data from the Indian Industry CDP India also actively participated in Government of Indiarsquos Ministry of Environment Forests amp Climate Change (MoEFCC) work on future carbon market mechanisms In addition to our work on disclosure CDP India is actively engaged in other initiatives including Internal Carbon Pricing (ICP) Science-based targets (SBT) and RE100
65
A N N U A L R E P O R T 2 0 2 0
CDP ContactsFor more info contact Damandeep Singh Director CDP India damandeepsinghcdpnet infoindiacdpnet
CDP Board of Directors
Bharati Chaturvedi Founder amp Director Chintan Environmental Research and Action Group
Ramakrishnan Mukundan Managing Director amp CEO Tata Chemicals Limited
Damandeep Singh Director CDP India
Important Notice
The contents of this report may be used by anyone providing acknowledgement is given to CDP Worldwide (CDP) This does not represent a license to repackage or resell any of the data reported to CDP or the contributing authors and presented in this report If you intend to repackage or resell any of the contents of this report you need to obtain express permission from CDP before doing so
CDP India has prepared the data and analysis in this report based on responses to the CDP 2020 information request No representation or warranty (express or implied) is given by CDP India as to the accuracy or completeness of the information and opinions contained in this report You should not act upon the information contained in this publication without obtaining specific professional advice To the extent permitted by law CDP India do not accept or assume any liability responsibility or duty of care for any consequences of you or anyone else acting or refraining to act in reliance on the information contained in this report or for any decision based on it All information and views expressed herein by CDP India is based on their judgment at the time of this report and are subject to change without notice due to economic political industry and firm-specific factors Guest commentaries where included in this report reflect the views of their respective authors their inclusion is not an endorsement of them
CDP India their affiliated member firms or companies or their respective shareholders members partners principals directors officers andor employees may have a position in the securities of the companies discussed herein The securities of the companies mentioned in this document may not be eligible for sale in some states or countries nor suitable for all types of investors their value and the income they produce may fluctuate andor be adversely affected by exchange rates
lsquoCDP Worldwidersquo and lsquoCDPrsquo refer to CDP Worldwide a registered charity number 1122330 and a company limited by guarantee registered in England number 05013650
copy 2020 CDP Worldwide All rights reserved
This report is printed on recycled paper
This report is printed on CyclusPrint based on 100 recycled fibres
This report is printed on CyclusPrint based on 100 recycled fibres
Supported by Scoring partner