Embed Size (px)
Citation preview

Contents lists available at SciVerse ScienceDirect
Building and Environment
journa l homepage: www.e lsev i er .com/loca t e /bui ldenv
Experimental study of ventilation performance in laboratories with chemical spills
Mingang Jin a, Farhad Memarzadeh b, Kisup Lee a, Qingyan Chen a, c, *
a School of Mechanical Engineering, Purdue University, West Lafayette, IN 47907, USA b Division of Technical Resources, National Institutes of Health, Bethesda, MD 20892, USA c School of Environmental Science and Engineering, Tianjin University, Tianjin 300072, China
A R T I C L E I N F O
Article history: Received 27 January 2012 Received in revised form 21 April 2012 Accepted 25 April 2012
Keywords: Chemical spills Ventilation performance Bench hood exhaust Laboratory ventilation
A B S T R A C T
Chemical spills occur frequently in laboratories. The current ventilation code for laboratories recom- mends a ventilation rate of 12 ACH for maintaining a safe laboratory environment. On the other hand, the energy saving potential encourages a reduction of the ventilation rate. But the effect of reducing the ventilation rate on the indoor air quality in a laboratory with chemical spills has not been well studied. This experimental study investigated the ventilation performance under different ventilation rates in a chemistry laboratory mockup. The impact of wall exhaust locations and chemical spill positions was examined related to the contaminant concentration distribution in the laboratory. This investigation also studied the ventilation performance with and without the use of bench hood exhausts. The results showed that the contaminant concentration was not linearly proportional to the ventilation rate. If the chemical spill position was close to an exhaust, the contaminant concentration in the laboratory could be rather low. The bench hood exhaust had the potential to effectively reduce the contaminant concen- tration. The results indicated that the ventilation rate in a chemistry laboratory may be reduced without increasing the safety risk if the ventilation system is properly designed.
© 2012 Elsevier Ltd. All rights reserved.
1. Introduction
Chemical exposures have always been a concern in occupational health. People working in laboratories are more likely to be exposed to hazardous chemicals [1,2]. As a result, they are expected to have a higher risk of developing serious diseases [3], such as leukemia [4], lymphatic cancer [5], breast cancer [6], and brain cancer [7]. Additionally, chemical exposure might increase the reproductive risks of chemists and laboratory workers [8]. Notably, spontaneous abortion is strongly correlated with exposure of female laboratory workers to toluene, xylenes, formalin, and chloroform [9]. Recent studies also found that combined exposure to ziram, maneb, and paraquat increases the risk of Parkinson’s disease threefold [10]. Although chemicals in a laboratory are usually kept safe, it is inevitable that accidental spills will some- times occur. If these chemicals are spilled on the bench top or on the floor, they may evaporate and disperse into the laboratory through the air circulation, which will increase exposure of the laboratory personnel to these chemicals.
* Corresponding author. School of Mechanical Engineering, Purdue University, West Lafayette, IN 47907, USA. Tel.: þ1 765 496 7562; fax: þ1 765 496 0539.
E-mail addresses: [email protected], [email protected] (Q. Chen).
Chemical spills occurred occasionally in a small amount. One should always try to minimize the risk (source), add protective measures close to the source to avoid spreading of the contaminant, and protect the persons working in the environ- ment by creating different sections within the space to ensure a safe workplace for the occupants. If a large amount of spill occurs, one should further protect the occupants by equipping them with protective masks or clothing and increase dilution by increasing air-exchange rate if possible or evacuate from the site.
A common practice to address accidental spills of chemicals is to impose a minimum ventilation rate on the ventilation system, so the chemical concentration in the laboratory is diluted to a reasonably low level [11]. The recommended ventilation rate from various standards and guidelines varies from 4 to 12 air changes per hour (ACH) [12]. To use a higher ventilation rate in general could result in a lower average contaminant concentration, but more energy would be consumed. Because nearly half of the electricity used in a typical laboratory can be attributed to ventilation [12], the use of a lower ventilation rate could substantially reduce the energy consumption. Thus, it is important to study how to reduce the ventilation rate for energy efficiency while still maintaining a safe laboratory environment.
0360-1323/$ e see front matter © 2012 Elsevier Ltd. All rights reserved. http://dx.doi.org/10.1016/j.buildenv.2012.04.022

328 M. Jin et al. / Building and Environment 57 (2012) 327e335
Many researchers have investigated the effect of the ventilation
rate on the indoor air quality (IAQ) of a laboratory in the case of chemical spills. Klein et al. [13,14] experimentally investigated the transient variation of contaminant concentration at different ventilation rates under a controlled release of organic solvents as small spills. Their results suggested that a ventilation rate above 12 ACH was unnecessary, while a rate below 8 ACH warranted careful consideration. An optimal design for an air supply and exhaust system could potentially allow a lower ventilation rate. Mem- arzadeh et al. [15] applied Computational Fluid Dynamics (CFD) to assess the contaminant concentration in a laboratory with bench top chemical spills when the ventilation rate was reduced from 12 to 6 ACH. Their results concluded that IAQ was not directly proportional to the reduction in the ventilation rate but rather due to a combination of factors including the ventilation system design, the control of local conditions, and the use of standard operating procedures specific to the laboratory operations. They found that a lower ventilation rate could be used without a major impact on the air quality in the occupied zone. Sandru et al. [16] found that the concentration below the imposed exposure limits could be ach- ieved by 6 ACH in case of moderately hazardous chemicals through health hazard analysis. But this ventilation rate could not assure the protection of operator in the proximity of the source because the contaminant was not uniformly distributed. Smith et al. [17] also pointed out that the minimum ventilation rate should be deter- mined based on factors including lab procedure, contaminant source, and exposure limit, etc.
However, it is still not clear how different factors influence the ventilation performance, which is important for optimizing the
ventilation system so as to reduce the ventilation rate. In this study, several factors including ventilation rates, spill locations and exhaust locations were investigated. In addition, bench hood exhausts, as a form of local exhaust system that can capture contaminant from the source before entering the workspace, was investigated in this study. The effect of bench hood on removing contaminant from chemical spills was examined. The investigation used a series of measurements in a chemical laboratory mock-up with chemical spills. The measured contaminant concentration in the laboratory was used to evaluate the impact of these factors on the ventilation performance. 2. Research method
2.1 Experimental setup
This investigation built a full-scale chemical laboratory mock-up
by using an environmental chamber with dimensions of 4.3 m x 4.8 m x 2.73 m, as depicted in Fig. 1. The environmental chamber can provide a controlled air supply with various airflow rates and air distributions. It can also maintain a stable thermal condition because the enclosures were well insulated. The labora- tory had two desks and two shelves, as well as three pieces of heated boxes on the desks to simulate different equipment. Three human simulators were installed to simulate personnel working in the laboratory.
Table 1 shows the dimensions, locations, and power inputs of the objects in the laboratory. This investigation used 56 hot-sphere anemometers to measure the air velocity and temperature. Each
Fig. 1. Sketch and photos of full-scale laboratory mock-up: (a) sketch of view 1, (b) sketch of view 2, (c) photo of view 1, and (d) photo of view 2.
329
transducer module had a power input of 5 W. Thus, the total heat generation rate in the laboratory was 926 W (46 W/m2 floor area).
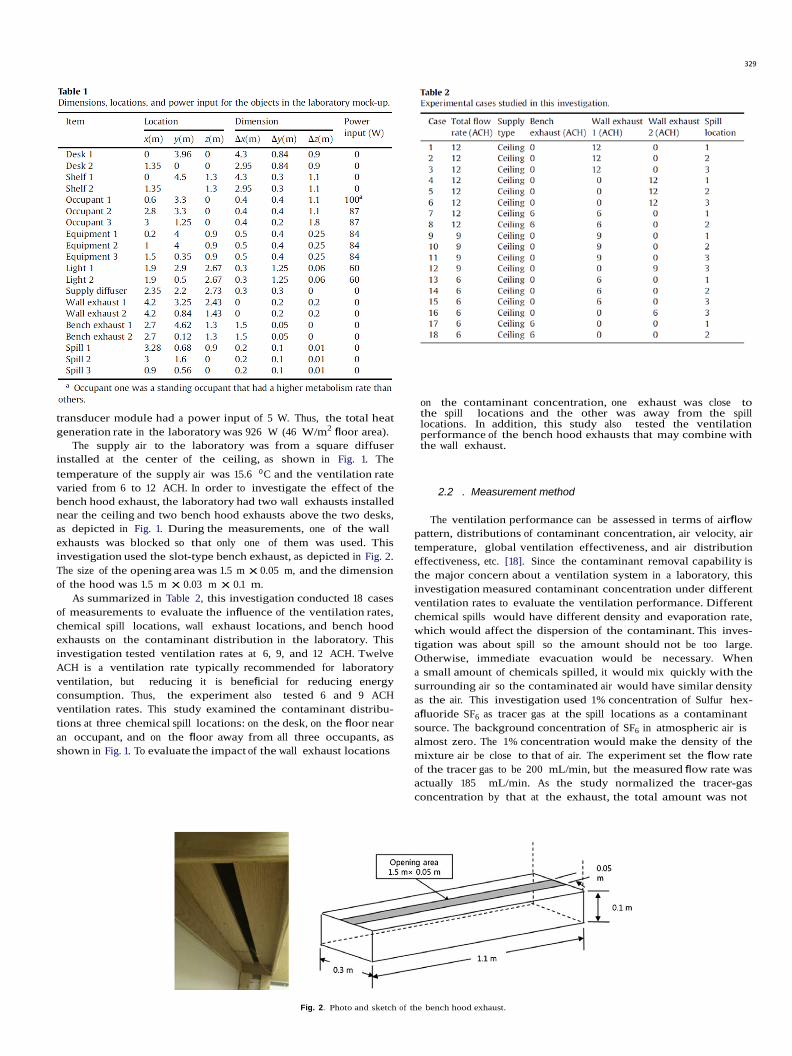
The supply air to the laboratory was from a square diffuser installed at the center of the ceiling, as shown in Fig. 1. The temperature of the supply air was 15.6 o C and the ventilation rate varied from 6 to 12 ACH. In order to investigate the effect of the bench hood exhaust, the laboratory had two wall exhausts installed near the ceiling and two bench hood exhausts above the two desks, as depicted in Fig. 1. During the measurements, one of the wall exhausts was blocked so that only one of them was used. This investigation used the slot-type bench exhaust, as depicted in Fig. 2. The size of the opening area was 1.5 m x 0.05 m, and the dimension of the hood was 1.5 m x 0.03 m x 0.1 m.
As summarized in Table 2, this investigation conducted 18 cases of measurements to evaluate the influence of the ventilation rates, chemical spill locations, wall exhaust locations, and bench hood exhausts on the contaminant distribution in the laboratory. This investigation tested ventilation rates at 6, 9, and 12 ACH. Twelve ACH is a ventilation rate typically recommended for laboratory ventilation, but reducing it is beneficial for reducing energy consumption. Thus, the experiment also tested 6 and 9 ACH ventilation rates. This study examined the contaminant distribu- tions at three chemical spill locations: on the desk, on the floor near an occupant, and on the floor away from all three occupants, as shown in Fig. 1. To evaluate the impact of the wall exhaust locations
on the contaminant concentration, one exhaust was close to the spill locations and the other was away from the spill locations. In addition, this study also tested the ventilation performance of the bench hood exhausts that may combine with the wall exhaust.
2.2 . Measurement method
The ventilation performance can be assessed in terms of airflow
pattern, distributions of contaminant concentration, air velocity, air temperature, global ventilation effectiveness, and air distribution effectiveness, etc. [18]. Since the contaminant removal capability is the major concern about a ventilation system in a laboratory, this investigation measured contaminant concentration under different ventilation rates to evaluate the ventilation performance. Different chemical spills would have different density and evaporation rate, which would affect the dispersion of the contaminant. This inves- tigation was about spill so the amount should not be too large. Otherwise, immediate evacuation would be necessary. When a small amount of chemicals spilled, it would mix quickly with the surrounding air so the contaminated air would have similar density as the air. This investigation used 1% concentration of Sulfur hex- afluoride SF6 as tracer gas at the spill locations as a contaminant source. The background concentration of SF6 in atmospheric air is almost zero. The 1% concentration would make the density of the mixture air be close to that of air. The experiment set the flow rate of the tracer gas to be 200 mL/min, but the measured flow rate was actually 185 mL/min. As the study normalized the tracer-gas concentration by that at the exhaust, the total amount was not
Fig. 2. Photo and sketch of the bench hood exhaust.

330 M. Jin et al. / Building and Environment 57 (2012) 327e335
important as soon as the SF6 concentration in the room air can be detected by the gas analyzer used. This investigation found the concentration was appropriate.
Before each experiment, this study used the constant tracer-gas method [19] to ensure a desirable airflow rate in the ventilation system and through the bench hood exhaust. To measure the total airflow rate in the laboratory, the SF6 was released into the labo- ratory at a constant rate. After reaching steady state, the concen- tration of the SF6 at the air supply and exhaust was measured. The airflow rate could then be calculated by
different heights (0.1 m, 0.6 m, 1.1 m, 1.7 m, and 2.6 m above the floor) to measure the contaminant concentration in the 8 locations.
According to the manual, the hot-sphere anemometers used had an accuracy of 0.02 m/s for velocity and 0.2 K for air temperature, respectively. A photo-acoustic multi-gas analyzer (INNOVA model 1312) with a multipoint sampler (INNOVA model 1309) was used to measure the tracer-gas concentration with an accuracy of 0.001 ppm. The sampler could only draw air-samples through tubing from up to 12 different sampling positions. Thus, to measure the contaminant concentration at 40 sampling points, it had to be done four times. For each sampling point, this investigation took 10 measurements to obtain an average value for the contaminant
concentration. Because each measurement took about 15 s to
where, S is the release rate of the SF6 in the laboratory, and Ce and Ci the SF6 concentration at air exhaust and supply, respectively. This investigation used a mixing fan to enhance the mixing in the laboratory so that a steady and homogeneous distribution could be realized. Similarly, to measure the airflow rate through the bench hood exhaust, the SF6 was released at a constant rate at the bench hood exhaust. By measuring the SF6 concentration at the duct connected to the bench hood exhaust as Ce and the concentration outside the bench hood exhaust as Ci, the airflow rate through the bench hood exhaust could also be determined with Equation (1).
After verifying the ventilation rate, this investigation continued to operate the HVAC system for 6e8 h to reach a thermally steady- state condition in the laboratory. Then the SF6 was released at the spill location to simulate a gaseous contaminant. The measurement would start after the steady state of SF6 distribution was reached.
In addition to the contaminant concentration, the air velocity and air temperature were measured in the experiment. Monitoring the air velocity and air temperature would be helpful for judging if the steady state was reached and for analyzing the airflow features in the laboratory. As depicted in Fig. 3, the air velocity, air temperature, and contaminant concentration were measured at 8 positions in the laboratory. At each position, this investigation employed 7 hot-sphere anemometers to measure air velocity and air temperature at different heights. The study also used ultrasonic anemometers to measure the air velocity and temperature for one test case to verify the data obtained by the hot-sphere anemome- ters. The hot-sphere anemometers were placed 0.1 m, 0.6 m, 1.1 m, 1.4 m, 1.7 m, 2.0 m, and 2.6 m above the floor in the 8 locations, respectively. In addition, five sampling tubes were mounted at
receive a data entry, it required about 2 h to complete the concentration measurements in one case.
After the measurements, the SF6 concentration at the air supply and exhaust was measured again to check if the flow rate remained unchanged during the experiment, which meant that the difference between the two measurements was less than 5%.
3. Results
This investigation evaluated the contaminant distribution in the
laboratory to assess the performance of the ventilation system. Based on the data collected from the 18 cases, this study examined average contaminant concentration in the laboratory and local concentration around occupants (near poles 1, 6, and 8) to inves- tigate the global and local features of the contaminant distributions with different factors, such as ventilation rates, chemical spill locations, exhaust locations, and use of bench hood exhaust.
3.1. Contaminant distributions with different ventilation rates
Fig. 4 compares contaminant concentration at three different
ventilation rates (Cases 1, 9, and 13). Under perfect mixing condi- tions, the average contaminant concentration at steady state in the laboratory should decay linearly with the increasing ventilation rate. Since a perfect mixing condition was difficult to obtain, Fig. 4(a) shows that the average contaminant concentration in the laboratory decreased marginally when the ventilation rate was increased from 6 to 9 ACH. But a further increase of the ventilation rate from 9 to 12 ACH could reduce the contaminant concentration
Fig. 3. Measurement locations: (a) Horizontal locations; (b) Vertical locations.

M. Jin et al. / Building and Environment 57 (2012) 327e335
Fig. 4. The contaminant concentration at different ventilation rates with spill location 1: (a) Average concentration; (b) Concentration near the occupants.
from 0.4 to 0.3 ppm. The same trend can be found for the contaminant concentration at breathing level of a sitting occupant (1.1 m above the floor) and a standing occupant (1.7 m above the floor). The airflow in the laboratory generated an uneven distri- bution of contaminant that was evidence of non-perfect mixing, so the average contaminant concentration would not change linearly with the ventilation rate. The contaminant concentration near the occupants may depend on the airflow pattern more than the ventilation rate. As shown in Fig. 4(b), the contaminant concen- tration at breathing level of pole 8 was much higher at 9 ACH than at 12 or 6 ACH. Pole 8 was located near spill location 1, and the contaminant distribution in this region was greatly affected by the airflow pattern. Comparing the contaminant concentration at pole 8 with 9 ACH and 6 ACH revealed that increasing the ventilation rate would not necessarily lower the concentration, which is consistent with the findings of Memarzadeh et al. [15].
3.2. Contaminant distributions with different chemical spill
locations
Chemical spill accidents are unpredictable and spill locations are random. This investigation examined the contaminant distribution
with different chemical spill locations. Fig. 5 compares the average contaminant concentration with three spill locations under 12 ACH (Cases 1, 2, and 3), 9 ACH (Cases 9, 10, and 11), and 6 ACH (Cases 13, 14, and 15), respectively. Fig. 5(a) and (b) show that the spill loca- tions did not have much impact on the concentration level in the laboratory at 12 and 9 ACH. However, when the ventilation rate was decreased to 6 ACH, the average contaminant concentration with spill location 3 was much higher than that with spill locations 1 and 2, as shown in Fig. 5(c). When the ventilation rate was at 6 ACH, the jet from the diffuser could not reach the region of spill location 3. The contaminant was then trapped in the corner and moved slowly to the rest of the laboratory. Therefore, the average concentration was much higher. Again, the results show that the decrease in the ventilation rate did not imply a linear increase in the contaminant concentration under the three spill locations. However, it is also not recommended to use a ventilation rate that is too low because it is hard to achieve better mixing of the room air.
Fig. 6 further depicts the contaminant concentration at the breathing level near the three occupants (poles 1, 6, and 8) with different ventilation rates and spill locations. The contaminant concentration was high at regions close to the spill location. As shown in Fig. 6, for spill locations 1 and 2, the contaminant
Fig. 5. The average contaminant concentration with different spill locations at different ventilation rates: (a) 12 ACH, (b) 9 ACH, and (c) 6 ACH.

M. Jin et al. / Building and Environment 57 (2012) 327e335
Fig. 6. The local contaminant concentration with different spill locations at different ventilation rates: (a) 12 ACH, (b) 9 ACH, and (c) 6 ACH.
concentration at pole 8 was relatively higher than at the other two positions because pole 8 was closer to the contaminant sources. On the other hand, for a specific measurement position, even though the chemical spill was closer, the local contaminant concentration might not be higher. The local airflow pattern would change the impact of the spill location on the local contaminant concentration. For example, Fig. 6(a) and (c) show that, although spill location 1 was much closer to pole 8 than spill location 3, the contaminant concentration at pole 8 was lower at 12 and 6 ACH.
3.3. Contaminant distributions with different wall exhaust locations
Fig. 7 compares the average contaminant concentration in the laboratory with two different wall exhaust locations near the ceiling when a chemical spill occurred at location 1 (Cases 1 and 4), 2 (Cases 2 and 5) and 3(Cases 3 and 6), respectively. A significant decrease in contaminant concentration was achieved by replacing exhaust 1 with exhaust 2 when the spills were at locations 1 and 2.
Fig. 7. The impact of exhaust location on the average contaminant concentration at 12 ACH: (a) with spill location 1, (b) with spill location 2, and (c) with spill location 3.

M. Jin et al. / Building and Environment 57 (2012) 327e335
Fig. 8. The local contaminant concentration with different exhaust locations at 12 ACH: (a) Average concentration with spill location 1; (b) Average concentration with spill location 2; (c) Average concentration with spill location 3.
Since exhaust 2 was closer to the contaminant sources, it could extract more contaminants such as a local exhaust hood, which was very beneficial. This would also require the exhaust be very close to the contaminant sources. When the spill was at location 3 which was a bit further away from the exhausts, the two exhausts had no impact on the contaminant concentration in the laboratory, as illustrated in Fig. 7(c).
Fig. 8 further compares the local concentration at the breathing level near three occupants (poles 1, 6, and 8) with different exhaust and spill locations. As shown in Fig. 8(a) and (b), the contaminant concentration at these three positions decreased a lot by replacing exhaust 1 with exhaust 2 when the chemical spill was at locations 1 and 2, which was consistent with the variation of average contaminant concentration in the laboratory. When the spill occurred at location 3, the contaminant concentration decreased at pole 8, but increased at pole 1 by using exhaust 2, as shown in Fig. 8(c). When the spill location was far away from the exhausts, the two exhausts could still influence the local distribution of the contaminant through changing the airflow pattern in the laboratory.
3.4. Contaminant distributions with and without bench hood exhaust
The bench hood exhaust system proved to be an effective energy saving strategy to control thermal comfort by removing the heat dissipation on the bench top [20], but its ability to remove contaminants caused by accidental chemical spills was not tested in previous experiments. This investigation tried to evaluate the contaminant concentration with and without using a bench hood exhaust system. As shown in Fig. 9, the bench hood exhaust could effectively reduce the contaminant concentration in the laboratory. A reduction of 70% and 35% was achieved for spill locations 1 (Cases 1 and 7) and 2 (Cases 2 and 8) at 12 ACH, respectively. When the chemical spill occurred on the bench top (spill location 1), the bench hood had a very high capture effi- ciency and could extract more contaminants. If the chemical spill occurred on the ground (spill location 2), the contaminant concentration could still be decreased through the use of a bench hood exhaust. But the reduction rate was not as significant as in the other cases.
Fig. 9. The average contaminant concentration with and without bench exhaust at 12 ACH, (a) at spill location 1 and (b) at spill location 2.

M. Jin et al. / Building and Environment 57 (2012) 327e335
Fig. 10. The local contaminant concentration with and without bench exhaust at 12 ACH, (a) at spill location 1 and (b) at spill location 2.
Fig. 10 further compares the local contaminant concentration around the occupants. The contaminant concentration at the breathing level of all the occupants was reduced significantly by using the bench hood exhaust. The maximum reduction rate was 75% and 37% at pole 8 for spill locations 1 and 2, respectively. The number was consistent with that for the average concentration, as shown in Fig. 9.
This investigation also measured the contamination concen- tration with only a bench hood exhaust. As shown in Fig. 11, the contaminant concentration decreased by 37% and 29% for spill location 1 (Cases 13 and 17) and 2 (Cases 14 and 18), respectively, when changing the wall exhaust to the bench hood exhaust at 6 ACH. Comparing the reduction rate at 12 ACH where both the wall exhaust and the bench hood exhaust were used in Fig. 9, using only a bench hood exhaust was not as effective as using both a wall and a bench hood exhaust.
4. Discussion
Based on the data collected from the measurements, this investigation further compared the ventilation effectiveness in the 18 cases. The ventilation effectiveness Ev was defined by Equation (2) [21]:
shown in Cases 13, 14, and 15, although the ventilation rate was only 6 ACH, the ventilation effectiveness was higher than in the corresponding cases with 12 ACH (Cases 1, 2, and 3) and 9 ACH (Cases 9, 10, and 11).
Comparing Cases 4 and 5 with Cases 1 and 2 shows that the ventilation effectiveness was higher when the spill location was close to the wall exhaust. The impact of spill locations on ventila- tion effectiveness was affected by the ventilation rate and the exhaust location. As shown by Cases 1, 2, 3, 9, 10, 11, 13, 14 and 15 when wall exhaust 1 was used, the variation of ventilation effec- tiveness was small with different spill locations under 12 ACH and 9 ACH. But lower ventilation effectiveness was found with spill location 3 under 6 ACH. When wall exhaust 2 was used, the change of spill location could cause significant variation of ventilation effectiveness as shown in Cases 4, 5 and 6. The bench hood could improve the ventilation effectiveness, particularly when the chemical spill occurred on the bench top in Cases 7 and 17. However, it is better also to use the wall exhaust as in Case 7, when compared with only using the bench hood as in Case 17.
A comparison of Fig. 12(a) and (b) suggests that the contaminant concentration in the laboratory depended on both ventilation rate and ventilation effectiveness. By increasing only the ventilation rate, the contaminant concentration could be lower but may not be very effective. An air distribution with a higher ventilation effec- tiveness would be most desirable. For example, Case 17 with only 6
ACH had high ventilation effectiveness, so its concentration was almost the same as in most of the cases with 12 ACH.
where Ce is the contaminant concentration at the exhaust, Cs the contaminant concentration at the supply, and Cb the contaminant concentration at the breathing zone.
Fig. 12(a) plotted the ventilation effectiveness of the 18 cases investigated in this study. Comparing the ventilation effectiveness under different ventilation rates, an increase in the ventilation rate would not necessarily result in higher ventilation effectiveness. As
The experimental investigation could only obtain very limited information as shown in this paper. It is very difficult to see a complete picture of the airflow pattern in our measurements. The intention of this study was to obtained experimental data for validating a computer model using CFD. Then the validated CFD model can be used to conduct thorough analysis of the venti- lation performance as the model would provide very detailed
Fig. 11. The average contaminant concentration at 6 ACH with wall exhaust or with bench exhaust, (a) at spill location 1 and (b) at spill location 2.

M. Jin et al. / Building and Environment 57 (2012) 327e335
Fig. 12. Comparison of (a) ventilation effectiveness with (b) average contaminant concentration in the 18 cases.
information. We would report our numerical effort in a future paper, as it would be a major effort.
5. Conclusions
This investigation conducted an experimental study on venti- lation performance in a laboratory with chemical spills by using an environmental chamber. The study measured the contaminant distributions in 18 cases to assess the impact of ventilation rates, spill locations, exhaust locations, and the use of bench hood exhaust on ventilation performance. The study led to the following major findings:
A higher ventilation rate could normally result in a lower average contamination concentration, but the reduction in the contaminant concentration was not linearly proportional to the increase in the ventilation rate. The local contaminant concentra- tion at some positions may not have reduced since local airflow
pattern played a more important role. An increase in ventilation rate would not necessarily result in higher ventilation effectiveness.
The impact of spill locations on ventilation performance was affected by the ventilation rate and the exhaust location. At a higher ventilation rate, the air in the laboratory was much better mixed so the ventilation performance was less sensitive to the spill location. The exhaust location had little impact on the ventilation perfor- mance unless it was very close to the spill position.
The application of the bench hood could significantly improve the ventilation effectiveness, particularly for a chemical spill occurring on the bench top. The combined use of the wall exhaust and the bench hood exhaust was better than using only the bench hood, if the spill was on the bench top.
The investigation found that the contamination concentration in the laboratory depended on both the ventilation rate and the ventilation effectiveness. Therefore, it is more efficient and cost effective to increase the ventilation effectiveness. References
[1] Hertlein F. Monitoring airborne contaminants in chemical laboratories. J Chem Educ 1979;56(5):199e201.
[2] Takada S, Okamoto S, Yamada C, Ukai H, Samoto H, Ohashi F, et al. Chemical exposures in research laboratories in a university. Ind Health 2008;46(2): 166e73.
[3] Li FP, Fraumeni Jr JF, Mantel N, Miller RW. Cancer mortality among chemists. J Natl Cancer Inst 1969;43(5):1159e64.
[4] Olin R. Leukaemia and Hodgkin’s disease among Swedish chemistry gradu- ates. Lancet 1976;2:916.
[5] Gustavsson P, Reuterwall C, Sadigh J, Söderholm M. Mortality and cancer incidence among laboratory technicians in medical research and routine laboratories (Sweden). Cancer Causes & Control 1999;10(1):59e64.
[6] Walrath J, Li FP, Hoar SK, Mead MW, Fraumeni JF. Causes of death among female chemists. Am J Public Health 1985;75(8):883e5.
[7] Divine BJ, Barron V. Texaco Mortality Study: II. Patterns of mortality among white males by specific job groups. Am J Ind Med 1986;10(4):371e81.
[8] Dement JM, Cromer JR. Cancer and reproductive risks among chemists and laboratory workers: a review. Appl Occup Environ Hyg 1992;7(2):120e6.
[9] Wennborg H, Bodin L, Vainio H, Axelsson G. Pregnancy outcome of personnel in Swedish biomedical research laboratories. J Occup Environ Med/Am Coll Occup Environ Med 2000;42(4):438e46.
[10] Wang A, Costello S, Cockburn M, Zhang X, Bronstein J, Ritz B. Parkinson’s disease risk from ambient exposure to pesticides. Eur J Epidemiol 2011;26(7): 547e55.
[11] Memarzadeh F. Guest editorial. J Chem Health Saf 2009;16(5):5e6. [12] Beil G. Optimizing laboratory ventilation rates: process and strategies. J Chem
Health Saf 2006;16(5):14e9. [13] Klein RC, King C, Kosior A. Laboratory air quality and room ventilation rates.
J Chem Health Saf 2009;16(5):36e42. [14] Klein RC, King C, Kosior A. Laboratory air quality and room ventilation rates:
an update. J Chem Health Saf 2011;18(2):21e4. [15] Memarzadeh F. Effect of reducing ventilation rate on indoor air quality and
energy cost in laboratories. J Chem Health Saf 2009;16(5):20e6. [16] Sandru E, Ouyang X. Planning and designing laboratory ventilation systems
for the safety of the users and protection of the environment. In: Proceedings of the 10th: 27e35. International Conference on Indoor Air Quality and Climate. Beijing: China; 2005 Sep 4e9.
[17] Smith TC, Yancey Smith S. Specification of airflow rates in laboratories. J Chem Health Saf 2009;16.
[18] Chen Q, Lee K, Mazumdar S, Poussou S, Wang L, Wang M, et al. Ventilation performance prediction for buildings: model assessment. Building Environ 2010;45(2):295e303.
[19] Sherman MH. Tracer-gas techniques for measuring ventilation in a single zone. Building Environ 1990;25(4):365e74.
[20] Memazadeh F. Controlling laboratory IAQ and energy costs. Heat Piping, Air- Conditioning Eng 2007 Oct.
[21] ASHRAE. ASHRAE handbook-fundamentals. Atlanta, GA: American Society of Heating Refrigerating and Air-Conditioning Engineers, INC.; 2005.