Embed Size (px)
Citation preview
Building a portfolio of well-managed, high cash-flowing
nightclubs and restaurants
NASDAQ: RICK
Investor Presentation
November 19, 2020
www.rcihospitality.com
2
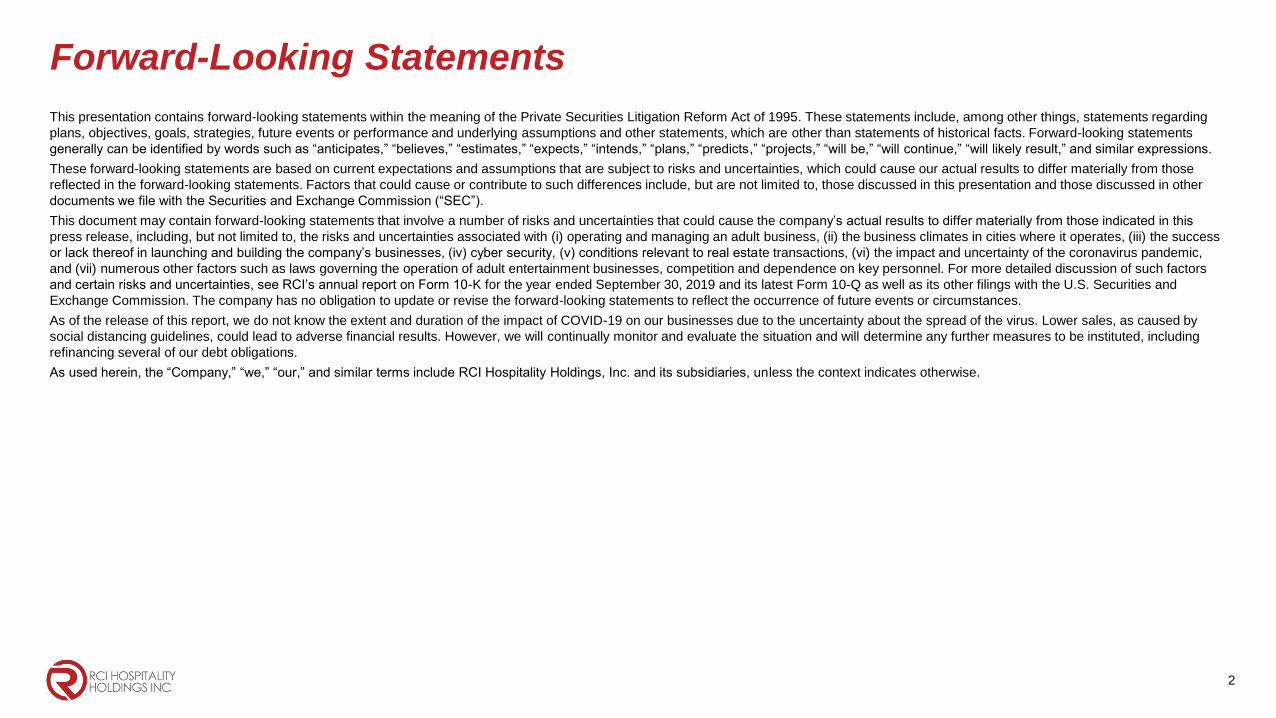
Forward-Looking Statements
This presentation contains forward-looking statements within the meaning of the Private Securities Litigation Reform Act of 1995. These statements include, among other things, statements regarding
plans, objectives, goals, strategies, future events or performance and underlying assumptions and other statements, which are other than statements of historical facts. Forward-looking statements
generally can be identified by words such as “anticipates,” “believes,” “estimates,” “expects,” “intends,” “plans,” “predicts,” “projects,” “will be,” “will continue,” “will likely result,” and similar expressions.
These forward-looking statements are based on current expectations and assumptions that are subject to risks and uncertainties, which could cause our actual results to differ materially from those
reflected in the forward-looking statements. Factors that could cause or contribute to such differences include, but are not limited to, those discussed in this presentation and those discussed in other
documents we file with the Securities and Exchange Commission (“SEC”).
This document may contain forward-looking statements that involve a number of risks and uncertainties that could cause the company’s actual results to differ materially from those indicated in this
press release, including, but not limited to, the risks and uncertainties associated with (i) operating and managing an adult business, (ii) the business climates in cities where it operates, (iii) the success
or lack thereof in launching and building the company’s businesses, (iv) cyber security, (v) conditions relevant to real estate transactions, (vi) the impact and uncertainty of the coronavirus pandemic,
and (vii) numerous other factors such as laws governing the operation of adult entertainment businesses, competition and dependence on key personnel. For more detailed discussion of such factors
and certain risks and uncertainties, see RCI’s annual report on Form 10-K for the year ended September 30, 2019 and its latest Form 10-Q as well as its other filings with the U.S. Securities and
Exchange Commission. The company has no obligation to update or revise the forward-looking statements to reflect the occurrence of future events or circumstances.
As of the release of this report, we do not know the extent and duration of the impact of COVID-19 on our businesses due to the uncertainty about the spread of the virus. Lower sales, as caused by
social distancing guidelines, could lead to adverse financial results. However, we will continually monitor and evaluate the situation and will determine any further measures to be instituted, including
refinancing several of our debt obligations.
As used herein, the “Company,” “we,” “our,” and similar terms include RCI Hospitality Holdings, Inc. and its subsidiaries, unless the context indicates otherwise.
3
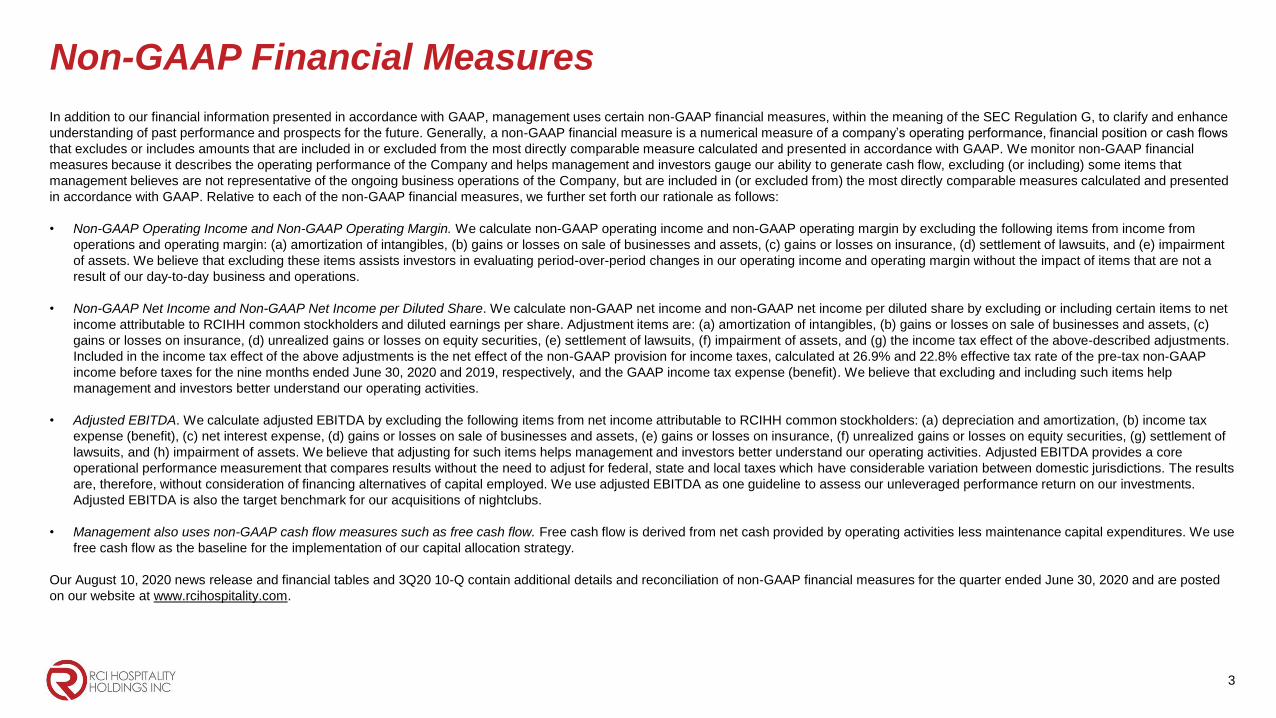
Non-GAAP Financial Measures
In addition to our financial information presented in accordance with GAAP, management uses certain non-GAAP financial measures, within the meaning of the SEC Regulation G, to clarify and enhance
understanding of past performance and prospects for the future. Generally, a non-GAAP financial measure is a numerical measure of a company’s operating performance, financial position or cash flows
that excludes or includes amounts that are included in or excluded from the most directly comparable measure calculated and presented in accordance with GAAP. We monitor non-GAAP financial
measures because it describes the operating performance of the Company and helps management and investors gauge our ability to generate cash flow, excluding (or including) some items that
management believes are not representative of the ongoing business operations of the Company, but are included in (or excluded from) the most directly comparable measures calculated and presented
in accordance with GAAP. Relative to each of the non-GAAP financial measures, we further set forth our rationale as follows:
• Non-GAAP Operating Income and Non-GAAP Operating Margin. We calculate non-GAAP operating income and non-GAAP operating margin by excluding the following items from income from
operations and operating margin: (a) amortization of intangibles, (b) gains or losses on sale of businesses and assets, (c) gains or losses on insurance, (d) settlement of lawsuits, and (e) impairment
of assets. We believe that excluding these items assists investors in evaluating period-over-period changes in our operating income and operating margin without the impact of items that are not a
result of our day-to-day business and operations.
• Non-GAAP Net Income and Non-GAAP Net Income per Diluted Share. We calculate non-GAAP net income and non-GAAP net income per diluted share by excluding or including certain items to net
income attributable to RCIHH common stockholders and diluted earnings per share. Adjustment items are: (a) amortization of intangibles, (b) gains or losses on sale of businesses and assets, (c)
gains or losses on insurance, (d) unrealized gains or losses on equity securities, (e) settlement of lawsuits, (f) impairment of assets, and (g) the income tax effect of the above-described adjustments.
Included in the income tax effect of the above adjustments is the net effect of the non-GAAP provision for income taxes, calculated at 26.9% and 22.8% effective tax rate of the pre-tax non-GAAP
income before taxes for the nine months ended June 30, 2020 and 2019, respectively, and the GAAP income tax expense (benefit). We believe that excluding and including such items help
management and investors better understand our operating activities.
• Adjusted EBITDA. We calculate adjusted EBITDA by excluding the following items from net income attributable to RCIHH common stockholders: (a) depreciation and amortization, (b) income tax
expense (benefit), (c) net interest expense, (d) gains or losses on sale of businesses and assets, (e) gains or losses on insurance, (f) unrealized gains or losses on equity securities, (g) settlement of
lawsuits, and (h) impairment of assets. We believe that adjusting for such items helps management and investors better understand our operating activities. Adjusted EBITDA provides a core
operational performance measurement that compares results without the need to adjust for federal, state and local taxes which have considerable variation between domestic jurisdictions. The results
are, therefore, without consideration of financing alternatives of capital employed. We use adjusted EBITDA as one guideline to assess our unleveraged performance return on our investments.
Adjusted EBITDA is also the target benchmark for our acquisitions of nightclubs.
• Management also uses non-GAAP cash flow measures such as free cash flow. Free cash flow is derived from net cash provided by operating activities less maintenance capital expenditures. We use
free cash flow as the baseline for the implementation of our capital allocation strategy.
Our August 10, 2020 news release and financial tables and 3Q20 10-Q contain additional details and reconciliation of non-GAAP financial measures for the quarter ended June 30, 2020 and are posted
on our website at www.rcihospitality.com.
4
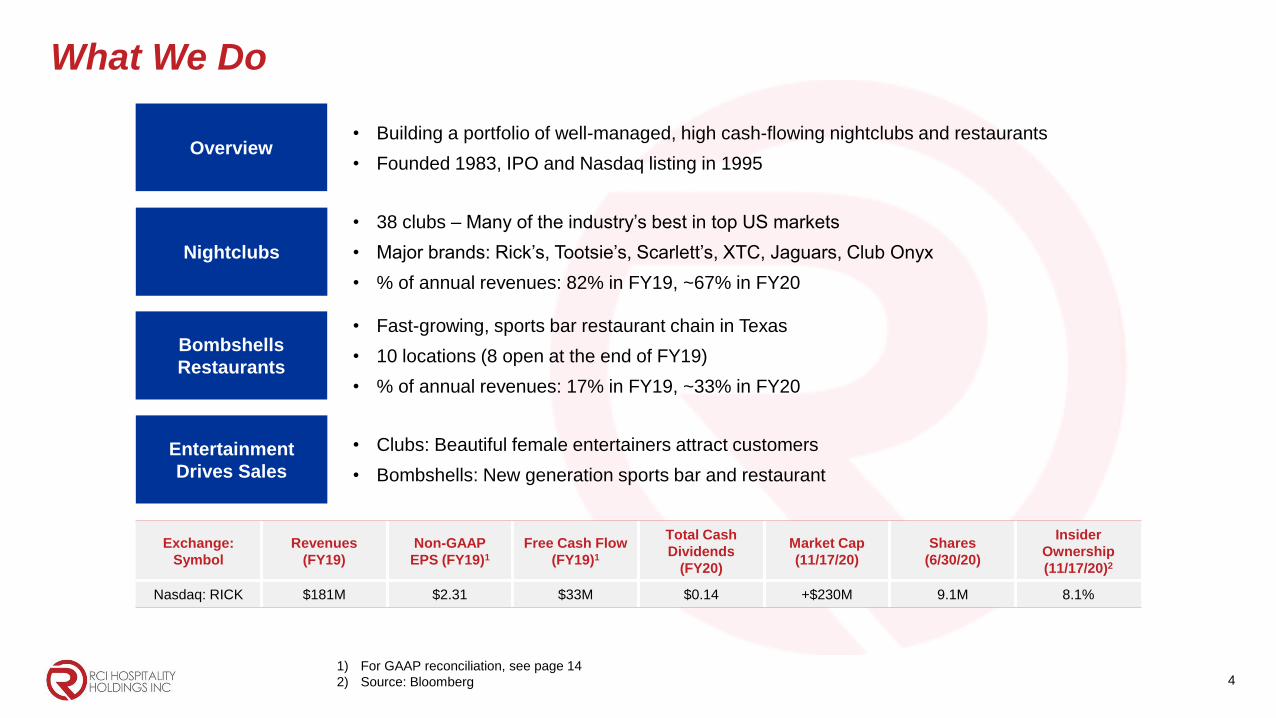
What We Do
Nightclubs
• 38 clubs – Many of the industry’s best in top US markets
• Major brands: Rick’s, Tootsie’s, Scarlett’s, XTC, Jaguars, Club Onyx
• % of annual revenues: 82% in FY19, ~67% in FY20
Overview• Building a portfolio of well-managed, high cash-flowing nightclubs and restaurants
• Founded 1983, IPO and Nasdaq listing in 1995
Entertainment
Drives Sales
• Clubs: Beautiful female entertainers attract customers
• Bombshells: New generation sports bar and restaurant
Bombshells
Restaurants
• Fast-growing, sports bar restaurant chain in Texas
• 10 locations (8 open at the end of FY19)
• % of annual revenues: 17% in FY19, ~33% in FY20
Exchange:
Symbol
Revenues
(FY19)
Non-GAAP
EPS (FY19)1
Free Cash Flow
(FY19)1
Total Cash
Dividends
(FY20)
Market Cap
(11/17/20)
Shares
(6/30/20)
Insider
Ownership
(11/17/20)2
Nasdaq: RICK $181M $2.31 $33M $0.14 +$230M 9.1M 8.1%
1) For GAAP reconciliation, see page 14
2) Source: Bloomberg
5
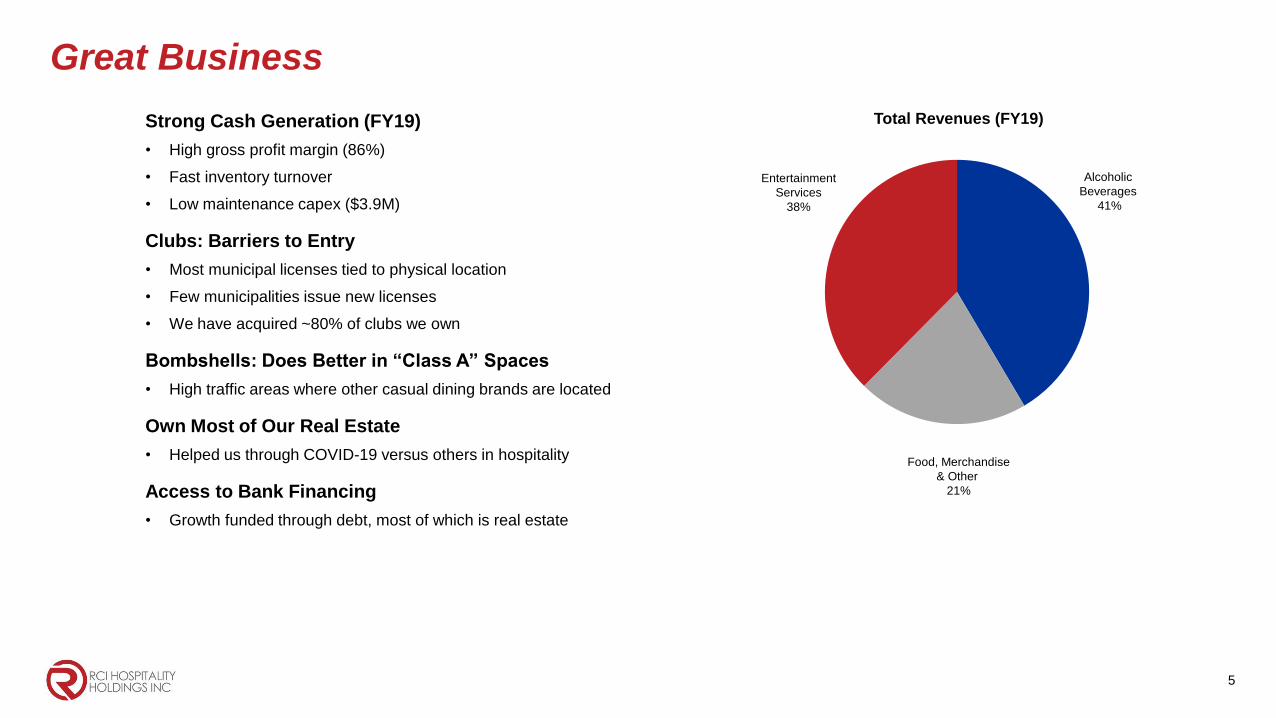
Great Business
Strong Cash Generation (FY19)
• High gross profit margin (86%)
• Fast inventory turnover
• Low maintenance capex ($3.9M)
Clubs: Barriers to Entry
• Most municipal licenses tied to physical location
• Few municipalities issue new licenses
• We have acquired ~80% of clubs we own
Bombshells: Does Better in “Class A” Spaces
• High traffic areas where other casual dining brands are located
Own Most of Our Real Estate
• Helped us through COVID-19 versus others in hospitality
Access to Bank Financing
• Growth funded through debt, most of which is real estate
Total Revenues (FY19)
Alcoholic
Beverages
41%
Entertainment
Services
38%
Food, Merchandise
& Other
21%
6
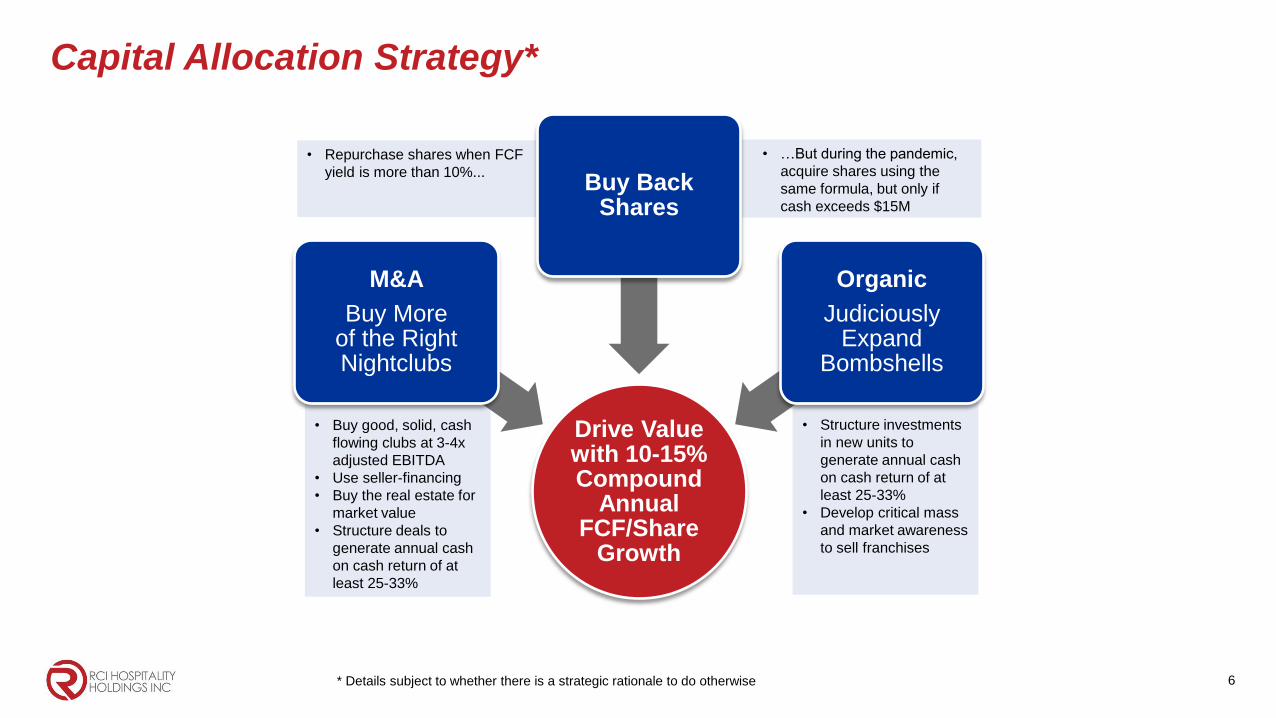
Capital Allocation Strategy*
* Details subject to whether there is a strategic rationale to do otherwise
• …But during the pandemic,
acquire shares using the
same formula, but only if
cash exceeds $15M
• Repurchase shares when FCF
yield is more than 10%...
• Structure investments
in new units to
generate annual cash
on cash return of at
least 25-33%
• Develop critical mass
and market awareness
to sell franchises
• Buy good, solid, cash
flowing clubs at 3-4x
adjusted EBITDA
• Use seller-financing
• Buy the real estate for
market value
• Structure deals to
generate annual cash
on cash return of at
least 25-33%
Drive Value with 10-15% Compound
Annual FCF/Share
Growth
M&A
Buy More of the Right Nightclubs
Buy Back Shares
Organic
Judiciously Expand
Bombshells
7
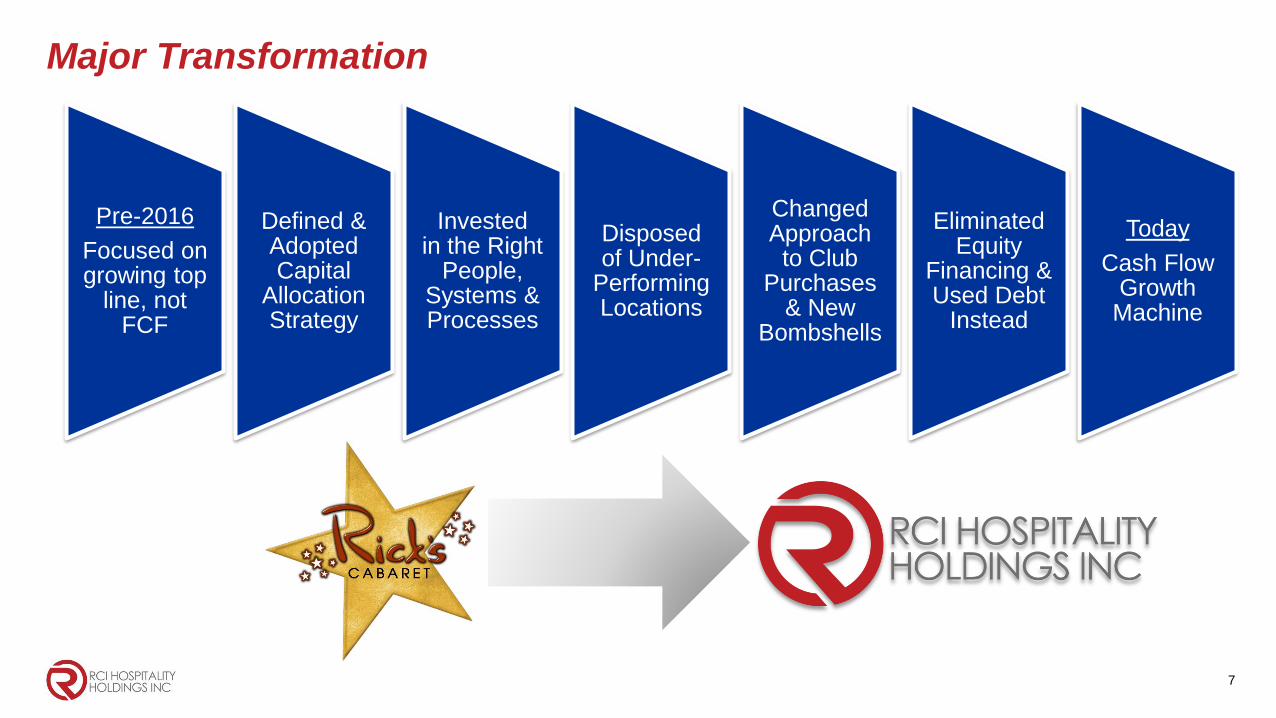
Major Transformation
Pre-2016
Focused on growing top
line, not FCF
Defined & Adopted Capital
Allocation Strategy
Invested in the Right
People, Systems & Processes
Disposed of Under-
Performing Locations
Changed Approach to Club
Purchases & New
Bombshells
Eliminated Equity
Financing & Used Debt
Instead
Today
Cash Flow Growth
Machine
8
10.41
10.23
9.74 9.729.66
FY15 FY16 FY17 FY18 FY19
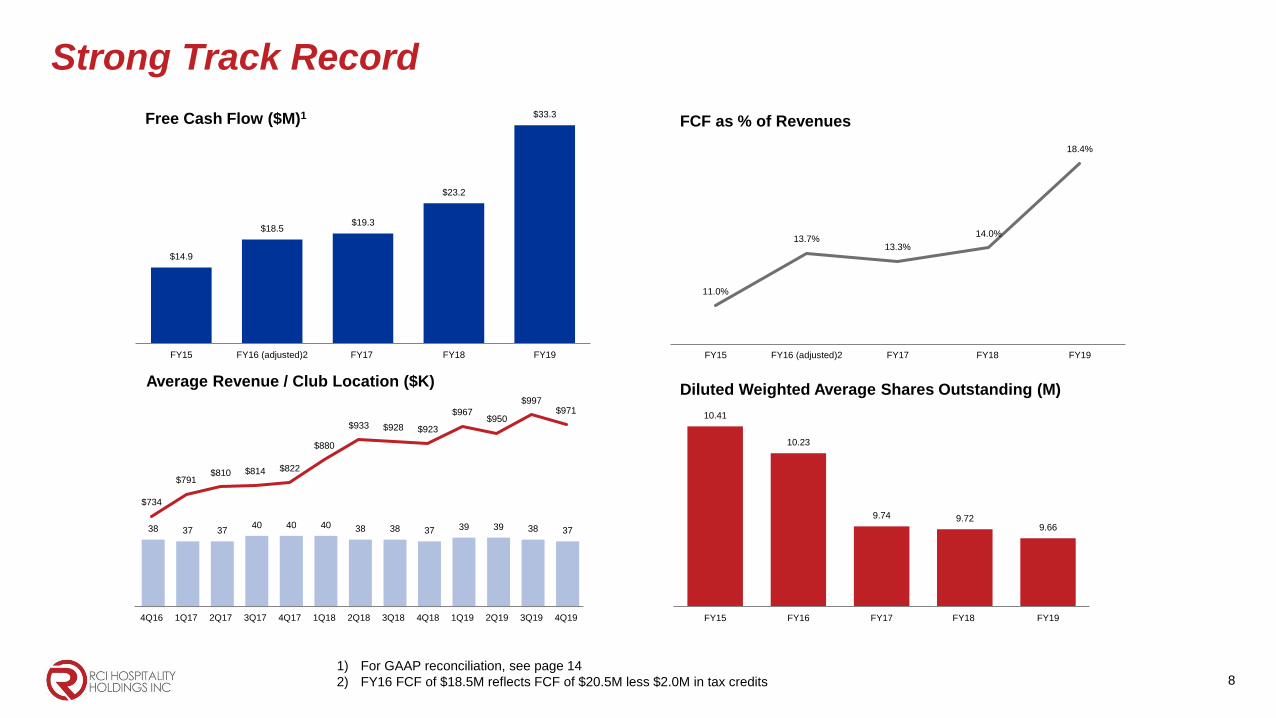
Strong Track Record
$14.9
$18.5$19.3
$23.2
$33.3
FY15 FY16 (adjusted)2 FY17 FY18 FY19
Free Cash Flow ($M)1
11.0%
13.7%13.3%
14.0%
18.4%
FY15 FY16 (adjusted)2 FY17 FY18 FY19
FCF as % of Revenues
Diluted Weighted Average Shares Outstanding (M)
1) For GAAP reconciliation, see page 14
2) FY16 FCF of $18.5M reflects FCF of $20.5M less $2.0M in tax credits
38 37 3740 40 40 38 38 37 39 39 38 37
$734
$791$810 $814 $822
$880
$933 $928 $923
$967$950
$997$971
4Q16 1Q17 2Q17 3Q17 4Q17 1Q18 2Q18 3Q18 4Q18 1Q19 2Q19 3Q19 4Q19
Average Revenue / Club Location ($K)
9
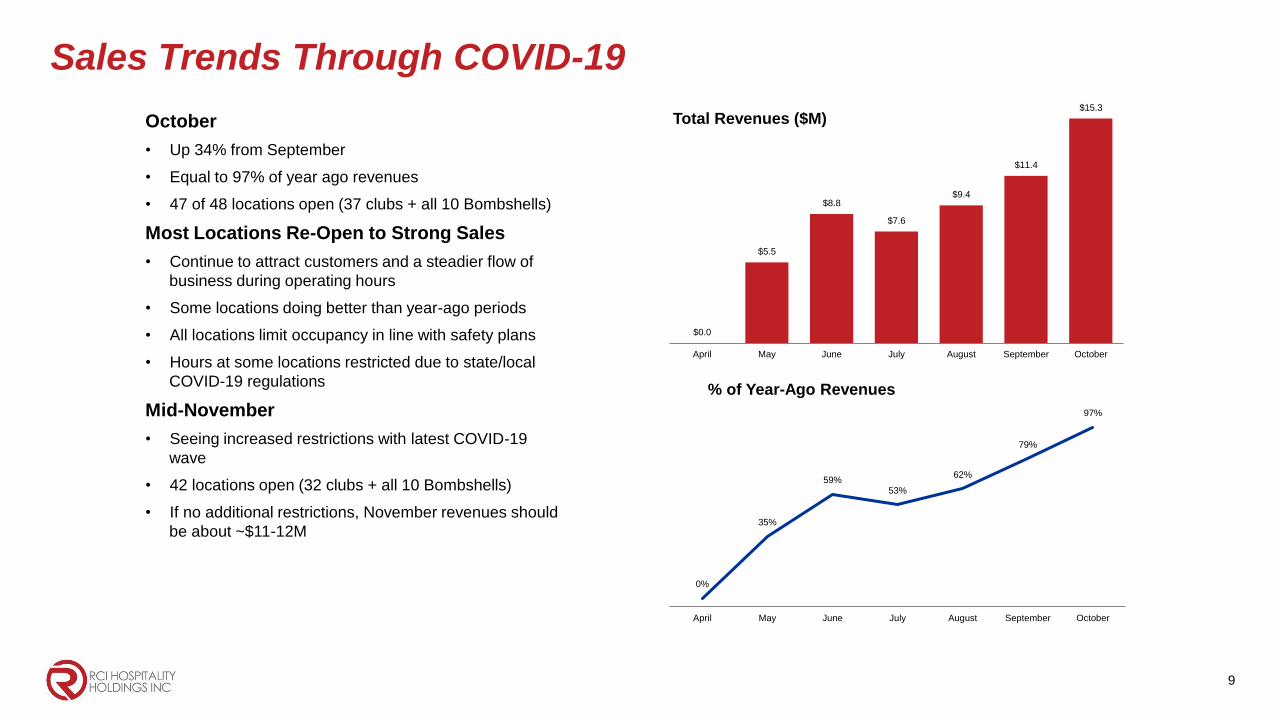
$0.0
$5.5
$8.8
$7.6
$9.4
$11.4
$15.3
April May June July August September October
Sales Trends Through COVID-19
October
• Up 34% from September
• Equal to 97% of year ago revenues
• 47 of 48 locations open (37 clubs + all 10 Bombshells)
Most Locations Re-Open to Strong Sales
• Continue to attract customers and a steadier flow of
business during operating hours
• Some locations doing better than year-ago periods
• All locations limit occupancy in line with safety plans
• Hours at some locations restricted due to state/local
COVID-19 regulations
Mid-November
• Seeing increased restrictions with latest COVID-19
wave
• 42 locations open (32 clubs + all 10 Bombshells)
• If no additional restrictions, November revenues should
be about ~$11-12M
Total Revenues ($M)
0%
35%
59%53%
62%
79%
97%
April May June July August September October
% of Year-Ago Revenues
10
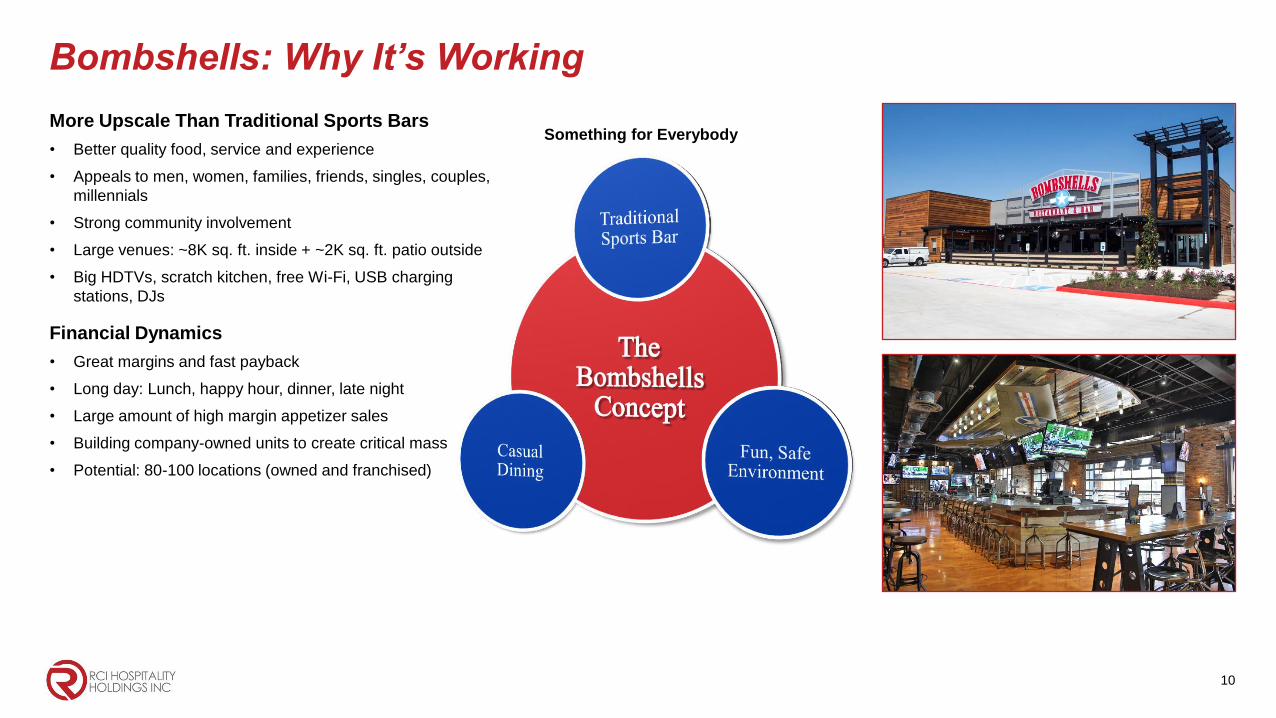
Bombshells: Why It’s Working
Something for EverybodyMore Upscale Than Traditional Sports Bars
• Better quality food, service and experience
• Appeals to men, women, families, friends, singles, couples,
millennials
• Strong community involvement
• Large venues: ~8K sq. ft. inside + ~2K sq. ft. patio outside
• Big HDTVs, scratch kitchen, free Wi-Fi, USB charging
stations, DJs
Financial Dynamics
• Great margins and fast payback
• Long day: Lunch, happy hour, dinner, late night
• Large amount of high margin appetizer sales
• Building company-owned units to create critical mass
• Potential: 80-100 locations (owned and franchised)
11
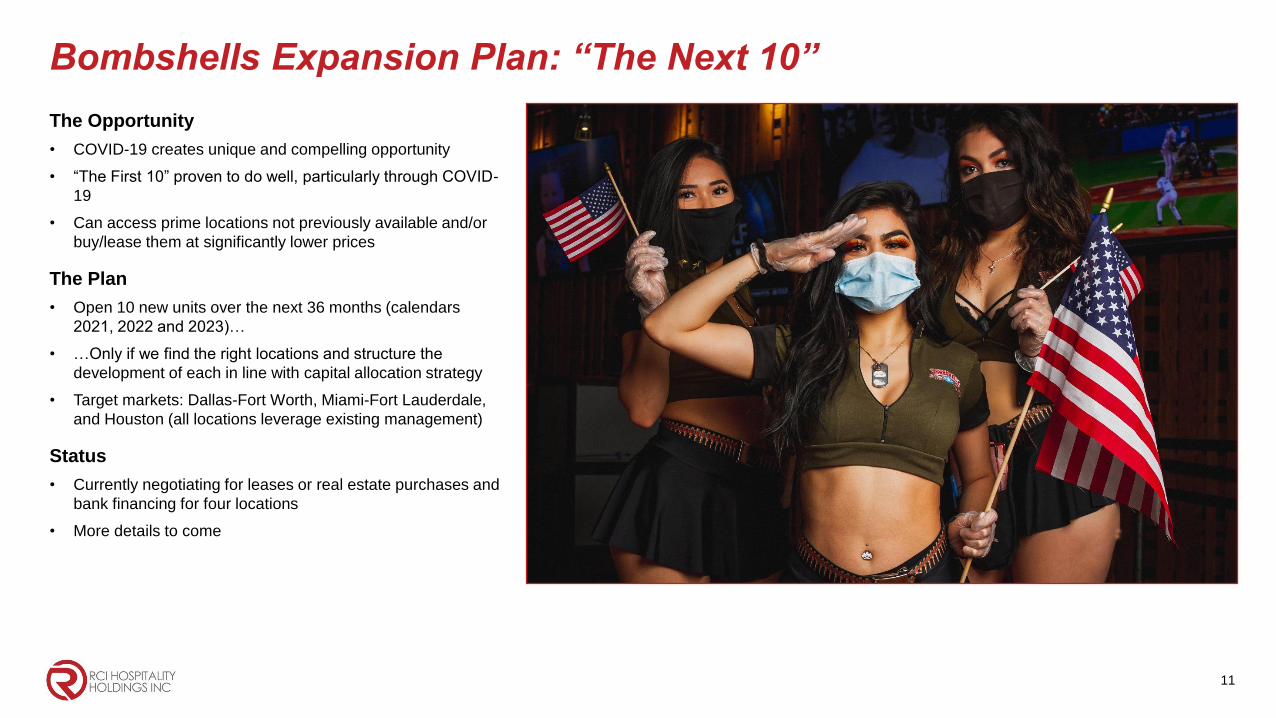
The Opportunity
• COVID-19 creates unique and compelling opportunity
• “The First 10” proven to do well, particularly through COVID-
19
• Can access prime locations not previously available and/or
buy/lease them at significantly lower prices
The Plan
• Open 10 new units over the next 36 months (calendars
2021, 2022 and 2023)…
• …Only if we find the right locations and structure the
development of each in line with capital allocation strategy
• Target markets: Dallas-Fort Worth, Miami-Fort Lauderdale,
and Houston (all locations leverage existing management)
Status
• Currently negotiating for leases or real estate purchases and
bank financing for four locations
• More details to come
Bombshells Expansion Plan: “The Next 10”
12
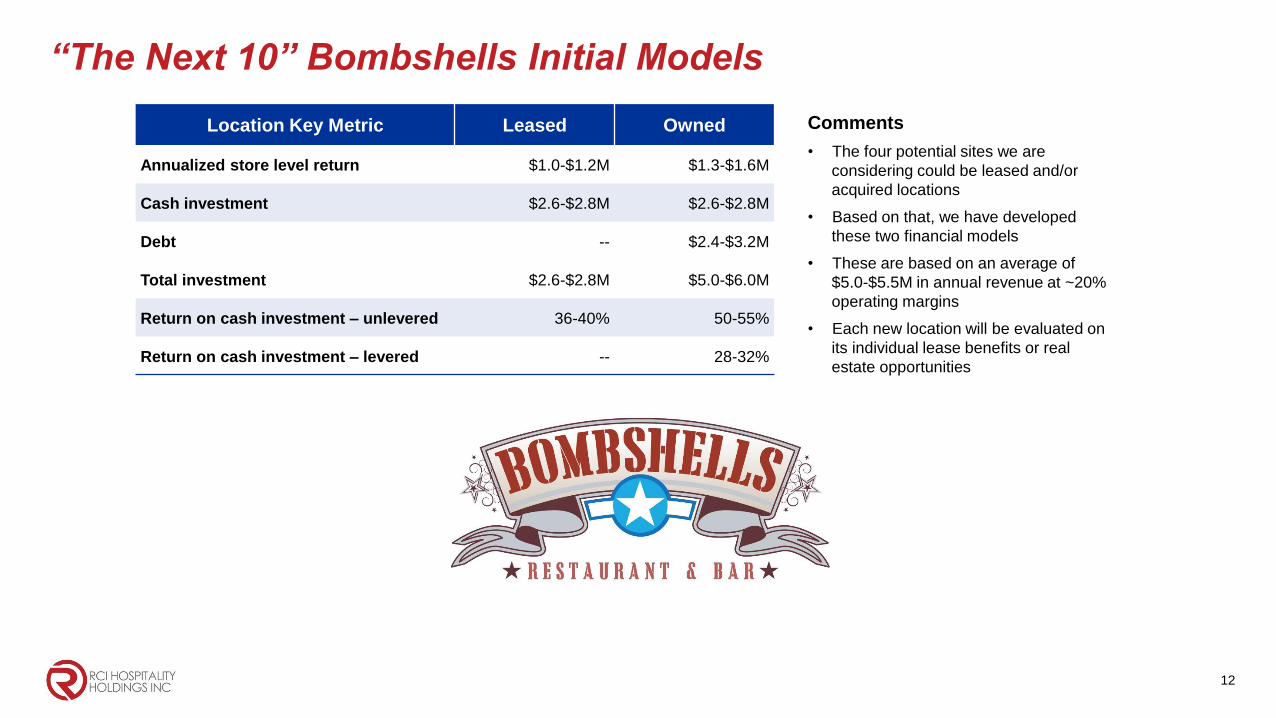
“The Next 10” Bombshells Initial Models
Location Key Metric Leased Owned
Annualized store level return $1.0-$1.2M $1.3-$1.6M
Cash investment $2.6-$2.8M $2.6-$2.8M
Debt -- $2.4-$3.2M
Total investment $2.6-$2.8M $5.0-$6.0M
Return on cash investment – unlevered 36-40% 50-55%
Return on cash investment – levered -- 28-32%
Comments
• The four potential sites we are
considering could be leased and/or
acquired locations
• Based on that, we have developed
these two financial models
• These are based on an average of
$5.0-$5.5M in annual revenue at ~20%
operating margins
• Each new location will be evaluated on
its individual lease benefits or real
estate opportunities
13
Key Takeaways
• RCI has gone through a major transformation
• Driven by FCF/PS growth based on disciplined capital allocation
• COVID-19 has created compelling investment opportunities for the company
• We believe our core strategies will work well as we emerge from COVID-19
• Pre-COVID-19, we believe we were on a $35-$38M FCF annualized run rate based on all
subsidiary locations open
• We expect to generate adequate cash flow from operations for the next 12 months
(assuming no additional shutdown)
• We may see increased market share in both the nightclub and restaurant segments as a
result of competitors closing due to COVID-19
14
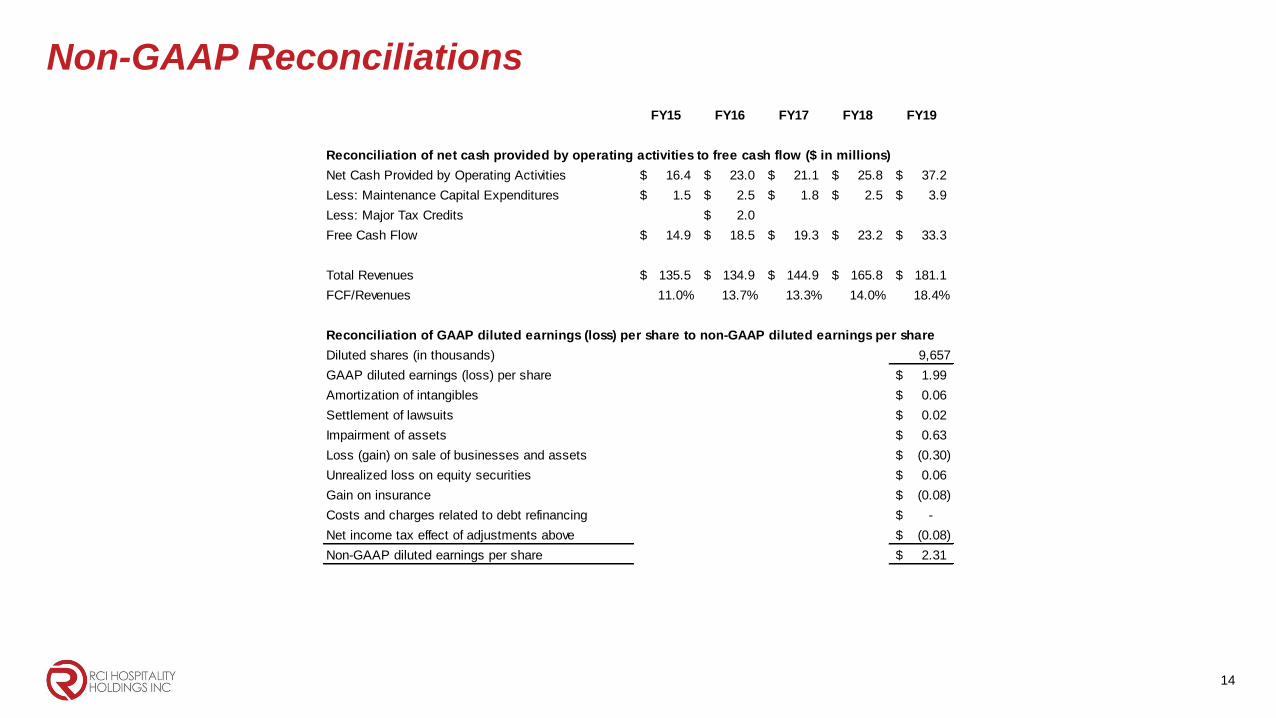
Non-GAAP Reconciliations
FY15 FY16 FY17 FY18 FY19
Reconciliation of net cash provided by operating activities to free cash flow ($ in millions)
Net Cash Provided by Operating Activities 16.4$ 23.0$ 21.1$ 25.8$ 37.2$
Less: Maintenance Capital Expenditures 1.5$ 2.5$ 1.8$ 2.5$ 3.9$
Less: Major Tax Credits 2.0$
Free Cash Flow 14.9$ 18.5$ 19.3$ 23.2$ 33.3$
Total Revenues 135.5$ 134.9$ 144.9$ 165.8$ 181.1$
FCF/Revenues 11.0% 13.7% 13.3% 14.0% 18.4%
Reconciliation of GAAP diluted earnings (loss) per share to non-GAAP diluted earnings per share
Diluted shares (in thousands) 9,657
GAAP diluted earnings (loss) per share 1.99$
Amortization of intangibles 0.06$
Settlement of lawsuits 0.02$
Impairment of assets 0.63$
Loss (gain) on sale of businesses and assets (0.30)$
Unrealized loss on equity securities 0.06$
Gain on insurance (0.08)$
Costs and charges related to debt refinancing -$
Net income tax effect of adjustments above (0.08)$
Non-GAAP diluted earnings per share 2.31$

15
Corporate Office10737 Cutten Road
Houston, TX 77066
Phone: (281) 397-6730
Investor RelationsGary Fishman
Steven Anreder
Phone: (212) 532-3232
IR Websitewww.rcihospitality.com
Nasdaq: RICK
Contact Information