Embed Size (px)
DESCRIPTION
Building a mainstream wind i ndustry admist shale g as realities. mainstream. w ind industry. shale gas. can the wind industry survive Shale Gas ?. Shale Production is up 340% since 2008, and Henry Hub prices are down 50% in the same time. Henry Hub Price. - PowerPoint PPT Presentation
Citation preview

Building a mainstream wind industry admist
shale gas realities
mainstreamwind industryshale gas

can the wind industry
survive Shale Gas?

Shale Production
Henry Hub Price
Source: Energy Information Administration
Shale Production is up 340% since 2008, and
Henry Hub prices are down 50% in the same time
January 2008 August 2014

Source: Energy Information Administration, Enerfax
Falling gas prices have led to
Energy Prices at key US Power Hubs
Gas Price
January 2008 August 2014
falling but volatile power
prices

However things have not gone that bad
for wind energy…

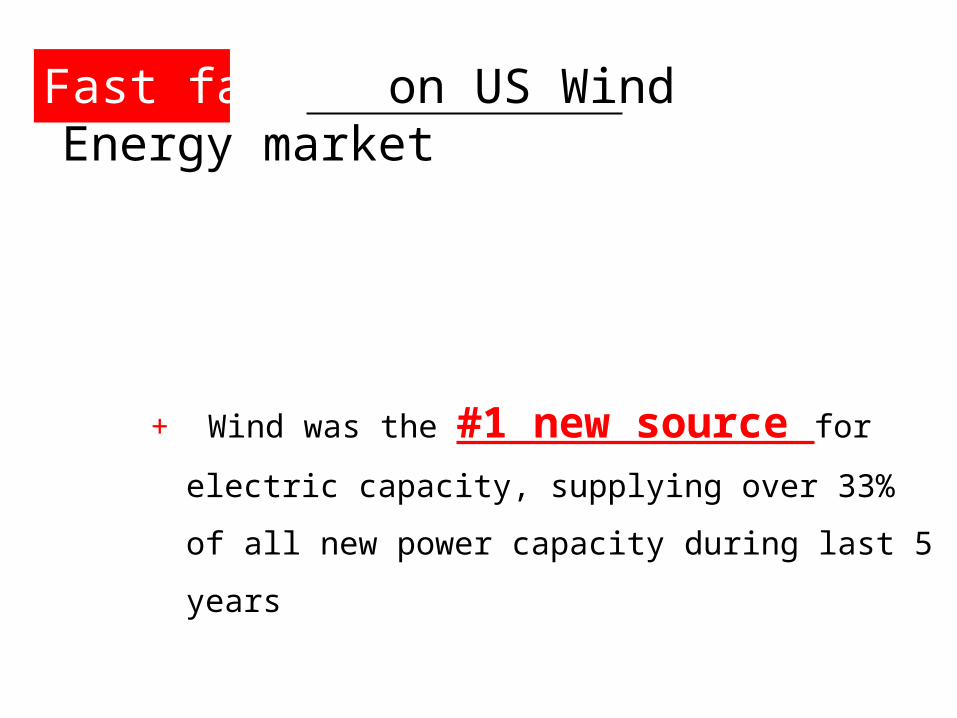
Fast facts on US Wind Energy market

+ 60GW of operating capacity, across more than
900 wind projects and 45,000 utility-scale wind turbines
Fast facts on US Wind Energy market

Fast facts on US Wind Energy market
+ Invested over $100B across 50GW of new capacity during
last decade
Fast facts on US Wind Energy market
+ Wind was the #1 new source for electric capacity,
supplying over 33% of all new power capacity during last 5
years

Fast facts on US Wind Energy market
+ 550 active manufacturing facilities to supply components
reaching over 70% domestic content in 2013

wind is becoming a mainstream source of electricity

Source: Energy Velocity, a EDPR NA análisys, EIA
19501952
19541956
19581960
19621964
19661968
19701972
19741976
19781980
19821984
19861988
19901992
19941996
19982000
20022004
20062008
20102012
0
10,000
20,000
30,000
40,000
50,000
60,000
70,000
80,000Hydro46 yr
Coal40 yr
Nuclear32 yr Gas
20 yr
Oil39 yr Renewables
10 yr
Capacity, GW

the U.S. generated 4.1%
of its electricity from wind in 2013,
up from 3.5% in 2012

ERCOT: 10%
Data Source: EIA
Chart Source: AWEA U.S. Wind Industry Annual Market Report 2013
20% of electricity in states such as IA and SD and over 10% across nine states

and, what about Texas?

Investment in new transmission infrastructure: $6.2 Billion
Wind penetration: up to 40% during windiest days
Capacity under construction in 2014: 7,000 MWs
# 1 in wind powerTexas
Installed capacity: 12,800 MWs

but, what has changed over the last years to drive this growth?

for the industry in general

for the industry in general
technology innovation

20
The evolution of taller towers & larger generators increases production while decreasing the number of turbines per wind farm
100MW wind farm (2007)
Tower: 80mRotor: 80-85m 245k
MWh
360k
MWh
50% increase in Annual
Production
Production increases exponentially with wind speed and rotor diameter
100MW wind farm (2014)
Tower: 100mRotor: ~110m

As blade length increases, so does production while the wind speed needed to produce a profitable project decreases
Year Introduced
Swept Area
NCF @ 7.5 m/s
1984 – 17m 227 13.2%
1995 – 44m 1521 20.6%
2000 – 80m 5026 30.6%*
2005 – 90m 6361 38.5%
2010 – 100m 7854 40.3%*
2013 – 110m 9503 44.2%*
8m
21m
39m
44m
Blade Length
*Avg. wind speed required to match the V110’s AEP @ 7.5 m/s (i.e., 7646 MWh):
V80: 11.0 m/s V100: 8.25 m/s
By adding 89% more swept area, we can produce the same amount of energy at lower wind speed sites
49m
54m
+570%
+231%
+27%
+23%
+21%

Improved technology allows for attractive NCF at lower wind speeds opening up wind potential in previously
underserved areas
Source: NREL, AWS
Regions benefit the most from the recent technology evolution

…and while energy demand growth
remained low ….

100 GW
50 GW
0 GW2020
63.8 GW
20252010 2015
There is significant pressure on coal generators
63.8 GW retired or officially announced to retire since 2010
23.0 GW Already Retired
40.8 GW Announced
Market analysts expect as much as 15% of the coal
fleet to retire by 2025
Source: Energy Information Administration, Energy Velocity
EIA Projection

+ Cheap electricity
+ Fixed prices of electricity for 20-25 yrs
New pockets of wind energy demand from large industrial consumers, who look for

but, what is driving such growth in TX?

$6.2 billion of investment in
transmission infrastructure
&
some of the best wind resource
in the country


however, challenges remain

Challenge #1
volatile market
difficult to plan

Installed U.S. Wind Energy Capacity
Source: AWEA U.S. Wind Industry Third Quarter 2013 Market Report


70% of wind benefits in Republican districts, but it does not translate into R leadership support

Challenge #2
Myths diluting
our brand

Wind brand is getting diluted
now seems that
everything is CLEAN not GREEN

Renewable energy subsidies are dwarfed by those for fossil fuels
37Source: Congressional Research Service, May 2010
Natural Gas Credit for unconventional
fuel (shale, etc)
Renewable energy PTCTax
benefits for oil & gas

3-6 birds per wind-powered megawatt are lost annually in the U.S, 186K – 372K per yr based on
current installed capacity
Wind vs Birds
National Academy of Sciences found less than 3 in 100,000 (i.e., .0003%) of human-caused bird fatalities are attributed to wind energy
By contrast, FWS has estimated:• Collisions with buildings kill 97 to 976 million birds annually • Collisions with high-tension lines kill at least 130 million birds per yr • Collisions with communications towers kill 4-5 million, but could be as
high as 50 million birds annually;• Cars kill 80 million birds annually • Environmental toxins including pesticides kill more than 72 million birds
annually;

Challenge #3
Texas?

40
SD
MT
TexasKS
NC
MO
ID
VA
GA
IAOK
TN
NE
Indiana
ARMS
WV
AL
SC LA
ND
DC
KY
WY
AK NH
CT
MA
MEVTCA
HI
RI
NY
IL
NJ
NM
MD
UT
CO
MI
AZPennsylvania
OR
WI
Florida NVMN
DE
Ohio
WA
CO2 emissions per MWh of electricity generated
HighElectricity Consumption
per Capita
High
Low
US Average
Texas generation fleet emits less CO2 per MWh than the average state… US
Average

41
45
114120120121
220
US AverageIndianaOhioTexas Pennsylvania Florida
Million metric tons of carbon dioxide emitted in 2010
…however, Texas leads the nation in carbon dioxide emissions from electricity generation

42
Carbon Emissions per MWh
Water Consumption
per MWh
Natural Gas
WindSolar Nuclear
Coal
water shortage meets carbon emissions

43
Industrial / Mining
Irrigation & Livestock
Domestic & Commercial
Power Generation41%
39%
12%
8%
5
100
225
550
775Nuclear
Solar PV
Pulverized Coal
Natural Gas CC
Wind
Water Consumption over Plant Life CycleGallons consumed per MWh generated
Note: Water consumption including fuel cycle, plant construction & demolition, and plant operationSource: National Renewable Energy Laboratory
water usage for energy generation
44
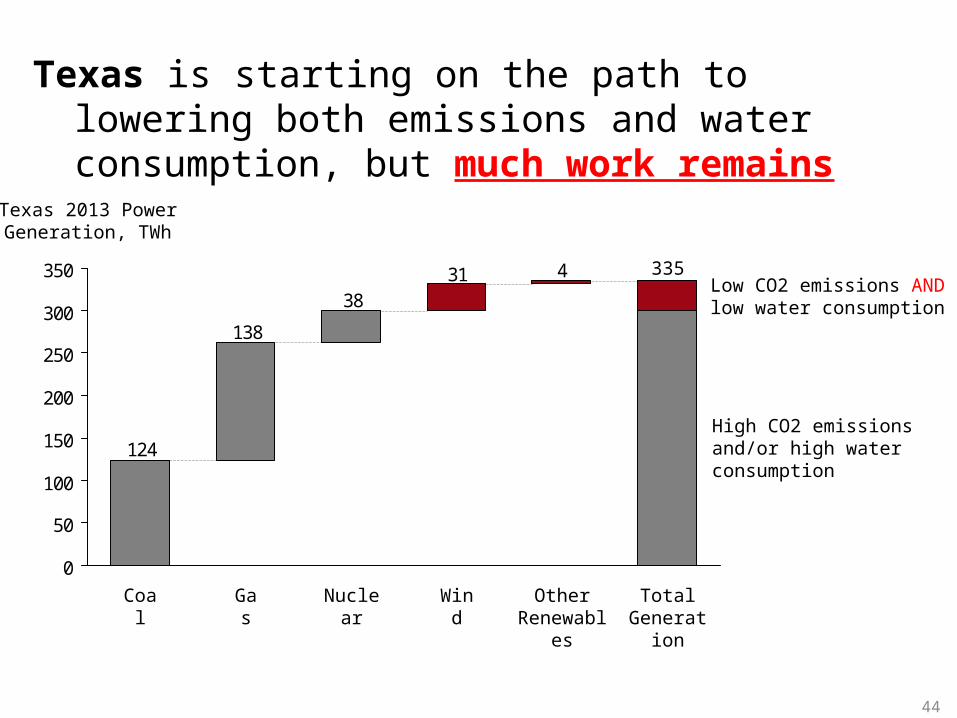
43138
138
124
0
50
100
150
200
250
300
350
Texas 2013 PowerGeneration, TWh
Total Generation
335
90%
10%
Other Renewables
WindNuclearGasCoal
Texas is starting on the path to lowering both emissions and water consumption, but much work remains
High CO2 emissions and/or high water consumption
Low CO2 emissions AND low water consumption

45
What can Texas do?

46
Doing nothing is the worst path forward“You can’t be neutral in a moving train”

Leveling the playing field
47
Energy efficiency and mix
Transmission infrastructure
Carbon price
Responsible siting

48
Thanks