Embed Size (px)
Citation preview
Building aLogging Pipeline
on AWS
The Goal
Debug issues that may have happened days or even weeks previously, and which may involve multiple services in a
distributed architecture.
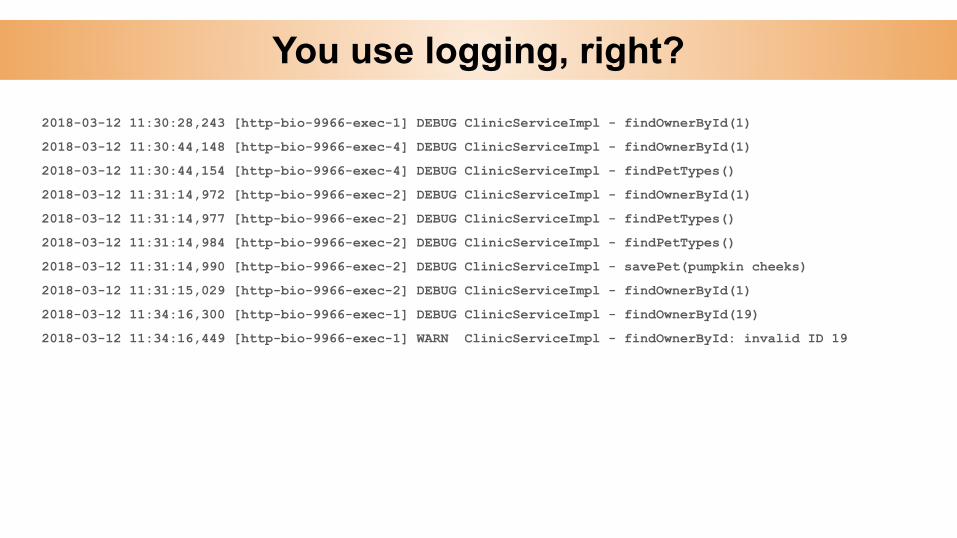
You use logging, right?2018-03-12 11:30:28,243 [http-bio-9966-exec-1] DEBUG ClinicServiceImpl - findOwnerById(1)
2018-03-12 11:30:44,148 [http-bio-9966-exec-4] DEBUG ClinicServiceImpl - findOwnerById(1)
2018-03-12 11:30:44,154 [http-bio-9966-exec-4] DEBUG ClinicServiceImpl - findPetTypes()
2018-03-12 11:31:14,972 [http-bio-9966-exec-2] DEBUG ClinicServiceImpl - findOwnerById(1)
2018-03-12 11:31:14,977 [http-bio-9966-exec-2] DEBUG ClinicServiceImpl - findPetTypes()
2018-03-12 11:31:14,984 [http-bio-9966-exec-2] DEBUG ClinicServiceImpl - findPetTypes()
2018-03-12 11:31:14,990 [http-bio-9966-exec-2] DEBUG ClinicServiceImpl - savePet(pumpkin cheeks)
2018-03-12 11:31:15,029 [http-bio-9966-exec-2] DEBUG ClinicServiceImpl - findOwnerById(1)
2018-03-12 11:34:16,300 [http-bio-9966-exec-1] DEBUG ClinicServiceImpl - findOwnerById(19)
2018-03-12 11:34:16,449 [http-bio-9966-exec-1] WARN ClinicServiceImpl - findOwnerById: invalid ID 19
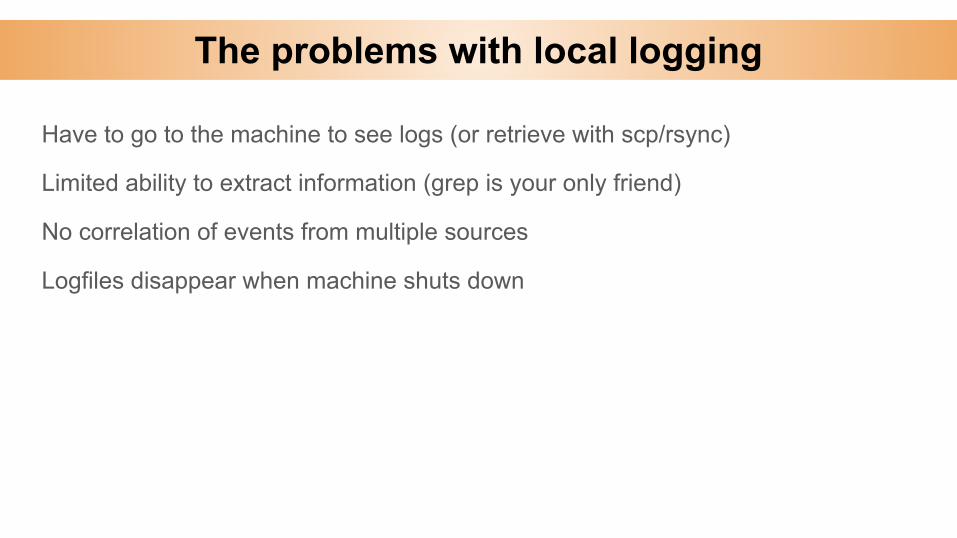
The problems with local logging
Have to go to the machine to see logs (or retrieve with scp/rsync)
Limited ability to extract information (grep is your only friend)
No correlation of events from multiple sources
Logfiles disappear when machine shuts down
Options for Centralized Logging
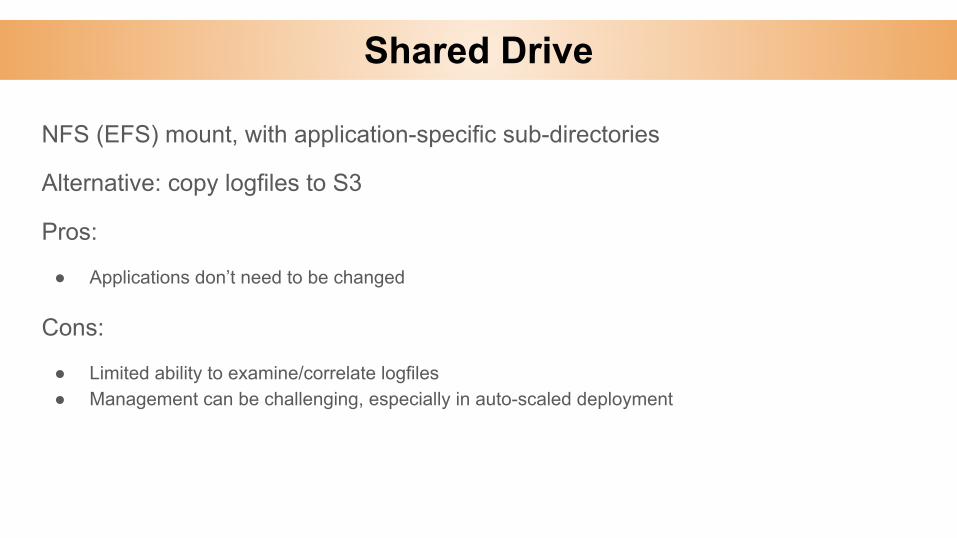
Shared Drive
NFS (EFS) mount, with application-specific sub-directories
Alternative: copy logfiles to S3
Pros:
● Applications don’t need to be changed
Cons:
● Limited ability to examine/correlate logfiles● Management can be challenging, especially in auto-scaled deployment
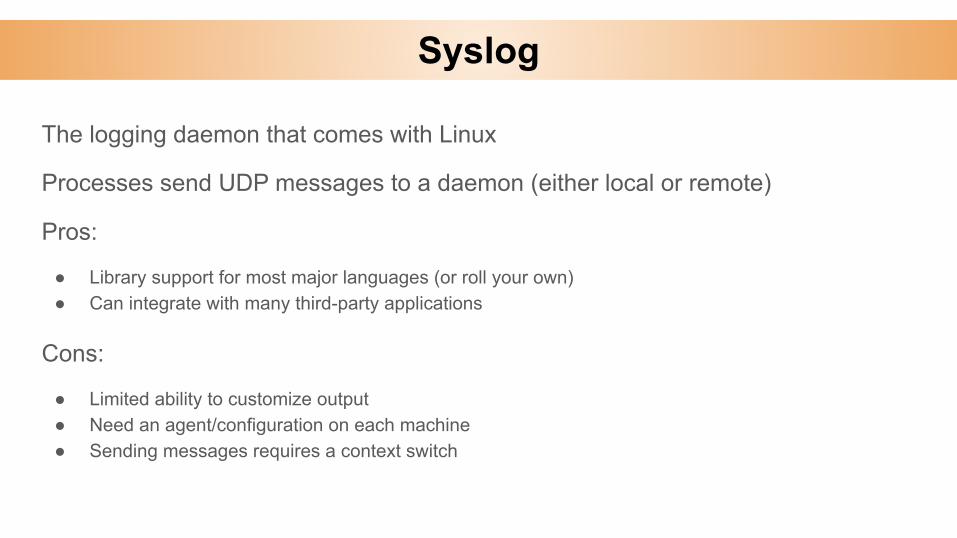
Syslog
The logging daemon that comes with Linux
Processes send UDP messages to a daemon (either local or remote)
Pros:
● Library support for most major languages (or roll your own)● Can integrate with many third-party applications
Cons:
● Limited ability to customize output● Need an agent/configuration on each machine● Sending messages requires a context switch
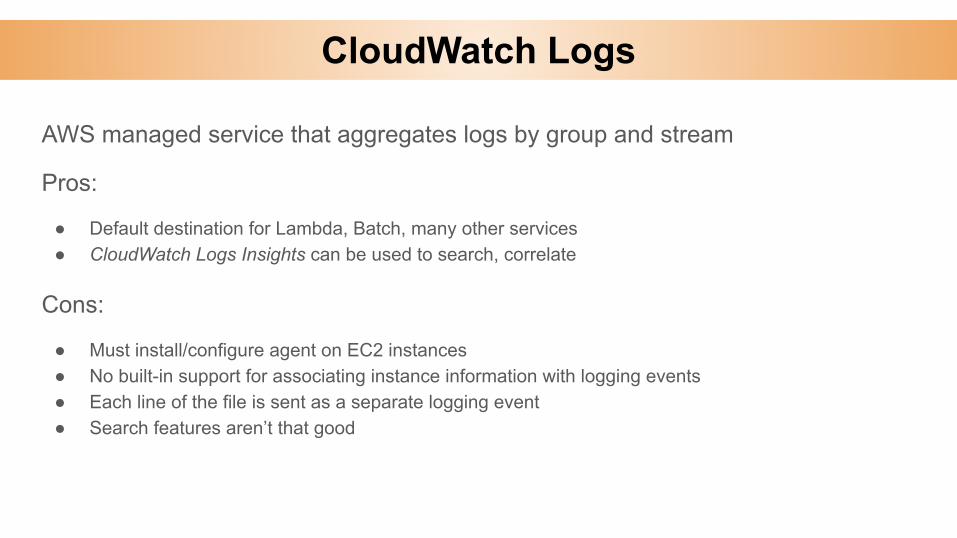
CloudWatch Logs
AWS managed service that aggregates logs by group and stream
Pros:
● Default destination for Lambda, Batch, many other services● CloudWatch Logs Insights can be used to search, correlate
Cons:
● Must install/configure agent on EC2 instances● No built-in support for associating instance information with logging events● Each line of the file is sent as a separate logging event● Search features aren’t that good
External Service Providers
Several companies provide Log Management as a Service: they ingest your logs, store them in a search engine, and provide you a variety of ways to analyze.
Pros:
● Nothing to manage locally (other than feeding the logs to the service)● Can ingest many different formats● Wide variety of analytics tools, including machine learning
Cons:
● Cost ratchets up quickly depending on volume and storage duration● Not all plans support archives● Log data is not under your control
Logstash / Elasticsearch / Kibana
The standard “roll your own” solution: Logstash parses logfiles and sends them to Elasticsearch, Kibana provides analytics.
Pros:
● Search-engine-based log analysis/correlation● Can find pre-built parsers for standard logging formats
Cons:
● Must install/configure agent● “Roll your own” means you deploy and maintain
An AWS-Centric Alternative
Kinesis / Firehose / AWS Elasticsearch / Kibana
A homegrown solution that leverages several AWS services.
Pros:
● Amazon manages the components -- It Just Works™● Scalable: configure each component to match volumes● Can use Lambda functions to parse arbitrary messages● Easy to archive messages (on S3)● Kinesis stream can service multiple destinations
Cons:
● More expensive than fully-managed solutions at small scales● Still some management required (cleanup of old indexes)● Must provide logging events to Elasticsearch in JSON
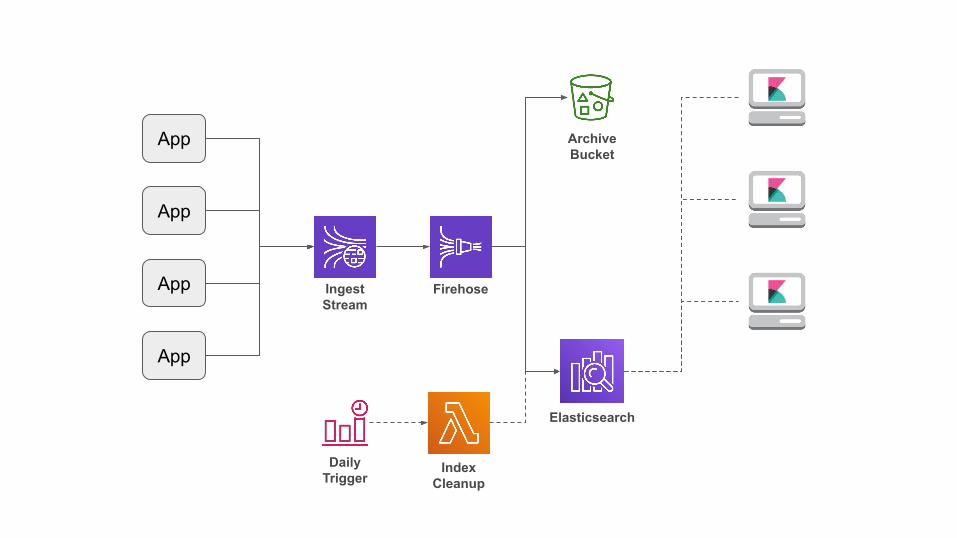
ArchiveBucket
Elasticsearch
Firehose
App
App
App
App
IndexCleanup
Ingest Stream
DailyTrigger
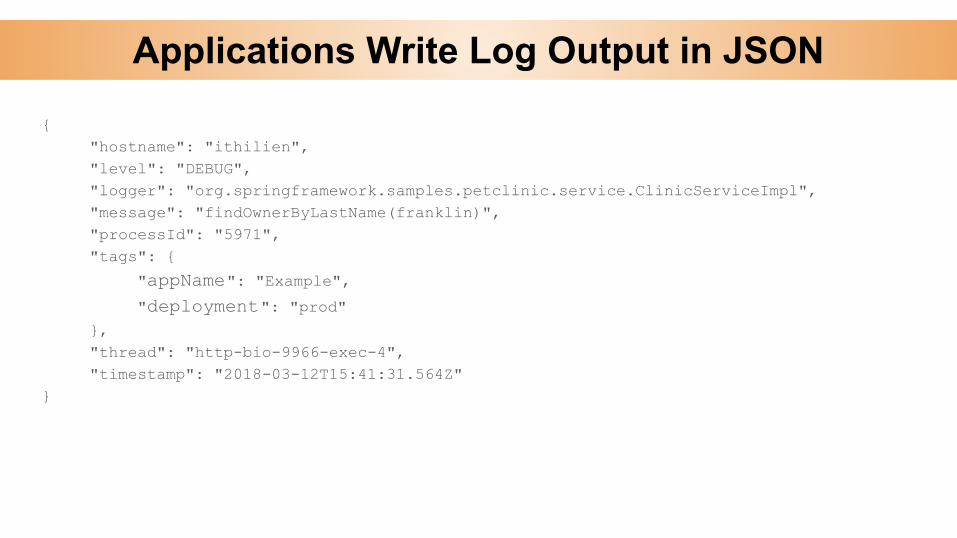
Applications Write Log Output in JSON
{"hostname": "ithilien","level": "DEBUG","logger": "org.springframework.samples.petclinic.service.ClinicServiceImpl","message": "findOwnerByLastName(franklin)","processId": "5971","tags": {
"appName": "Example","deployment": "prod"
},"thread": "http-bio-9966-exec-4","timestamp": "2018-03-12T15:41:31.564Z"
}
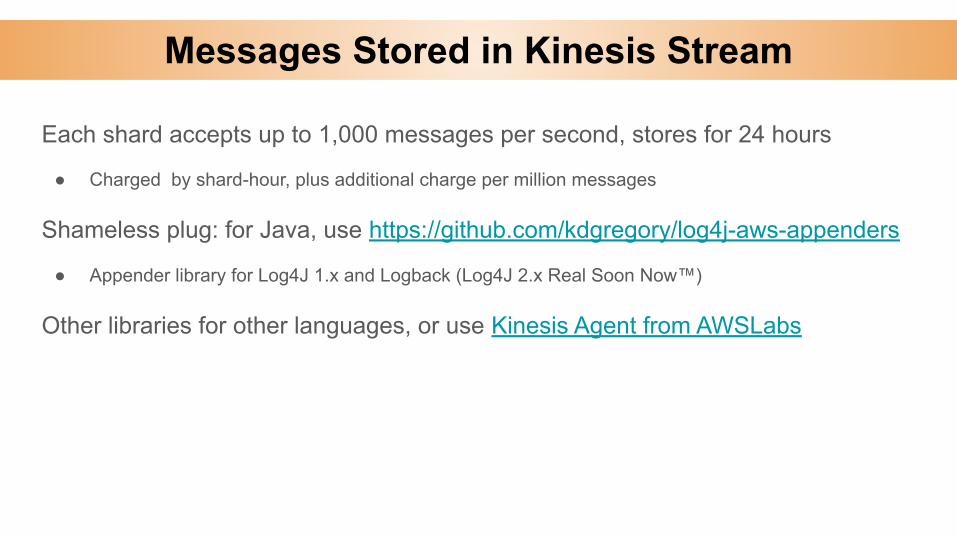
Messages Stored in Kinesis Stream
Each shard accepts up to 1,000 messages per second, stores for 24 hours
● Charged by shard-hour, plus additional charge per million messages
Shameless plug: for Java, use https://github.com/kdgregory/log4j-aws-appenders
● Appender library for Log4J 1.x and Logback (Log4J 2.x Real Soon Now™)
Other libraries for other languages, or use Kinesis Agent from AWSLabs
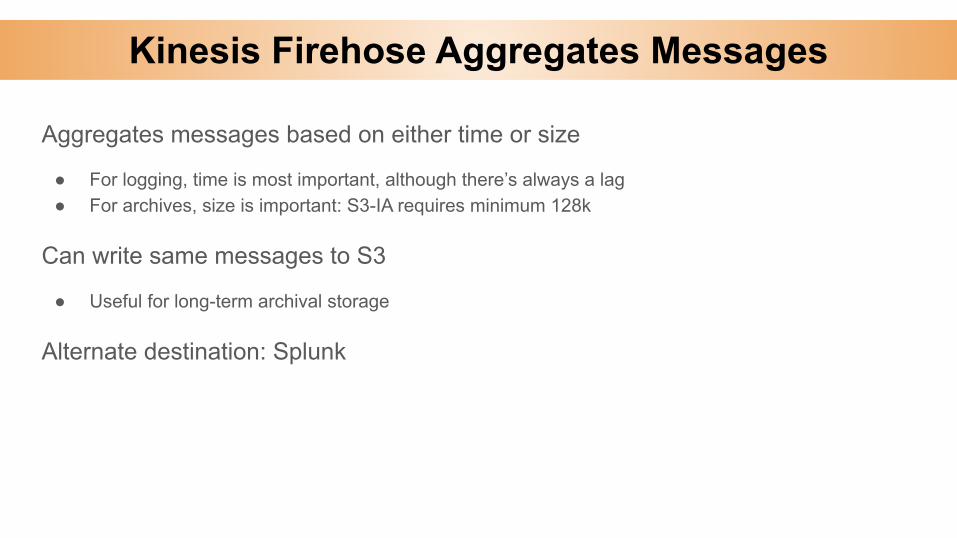
Kinesis Firehose Aggregates Messages
Aggregates messages based on either time or size
● For logging, time is most important, although there’s always a lag● For archives, size is important: S3-IA requires minimum 128k
Can write same messages to S3
● Useful for long-term archival storage
Alternate destination: Splunk
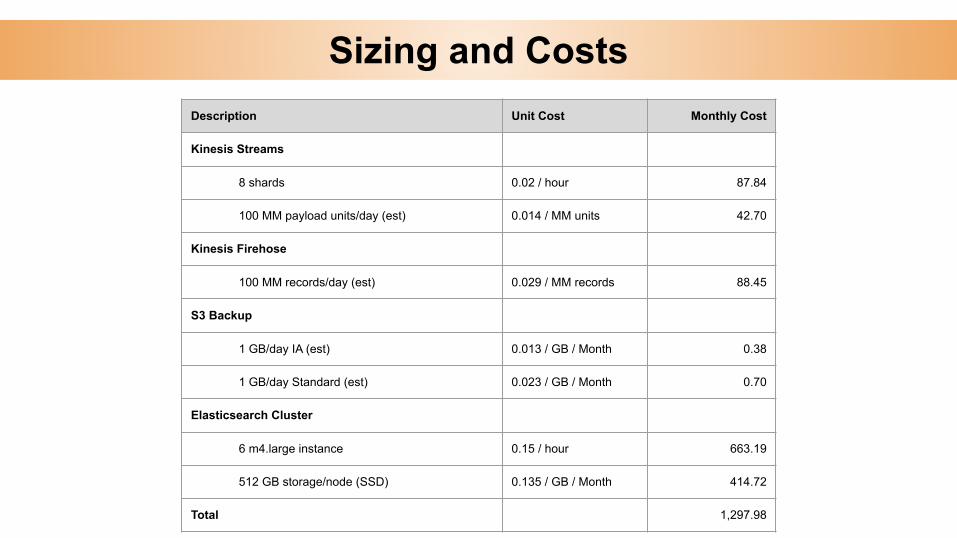
Sizing and CostsDescription Unit Cost Monthly Cost
Kinesis Streams
8 shards 0.02 / hour 87.84
100 MM payload units/day (est) 0.014 / MM units 42.70
Kinesis Firehose
100 MM records/day (est) 0.029 / MM records 88.45
S3 Backup
1 GB/day IA (est) 0.013 / GB / Month 0.38
1 GB/day Standard (est) 0.023 / GB / Month 0.70
Elasticsearch Cluster
6 m4.large instance 0.15 / hour 663.19
512 GB storage/node (SSD) 0.135 / GB / Month 414.72
Total 1,297.98
Demos
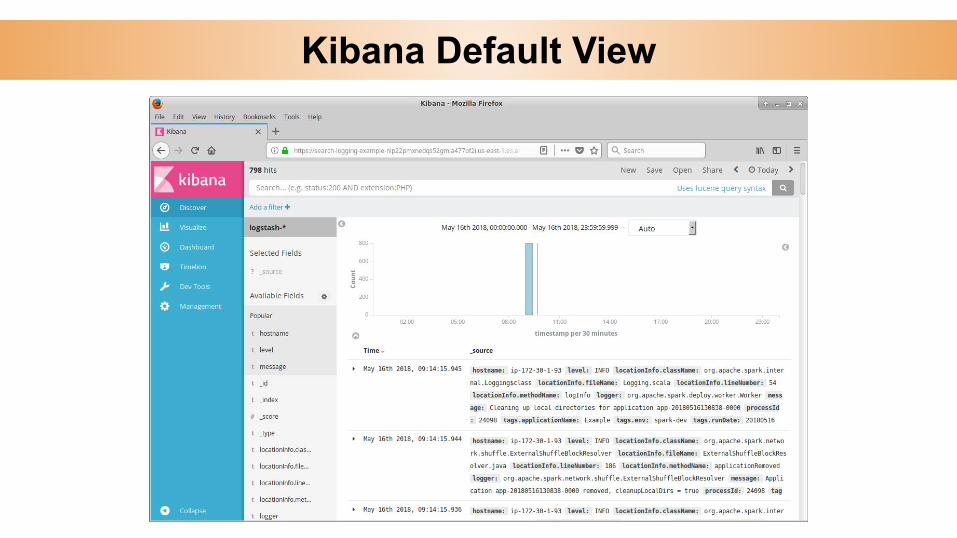
Kibana Default View
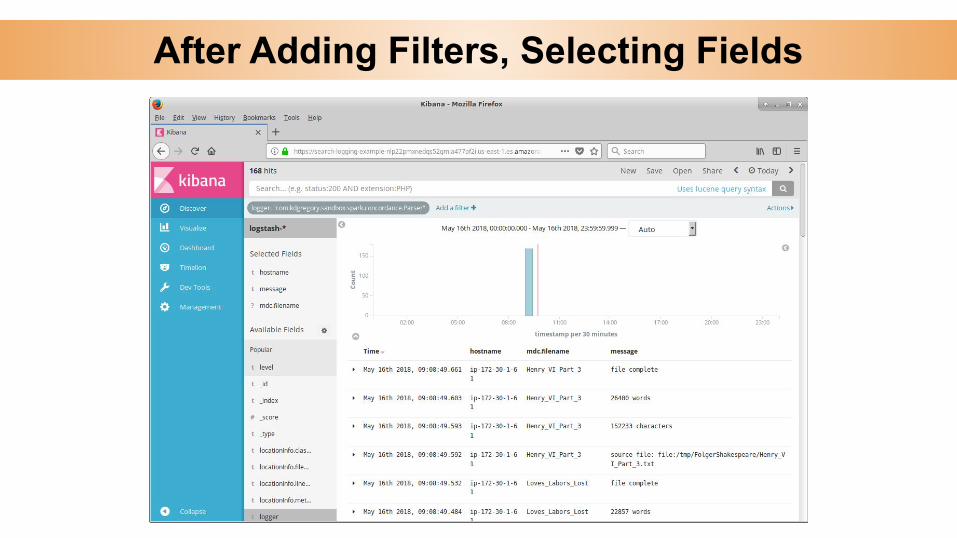
After Adding Filters, Selecting Fields
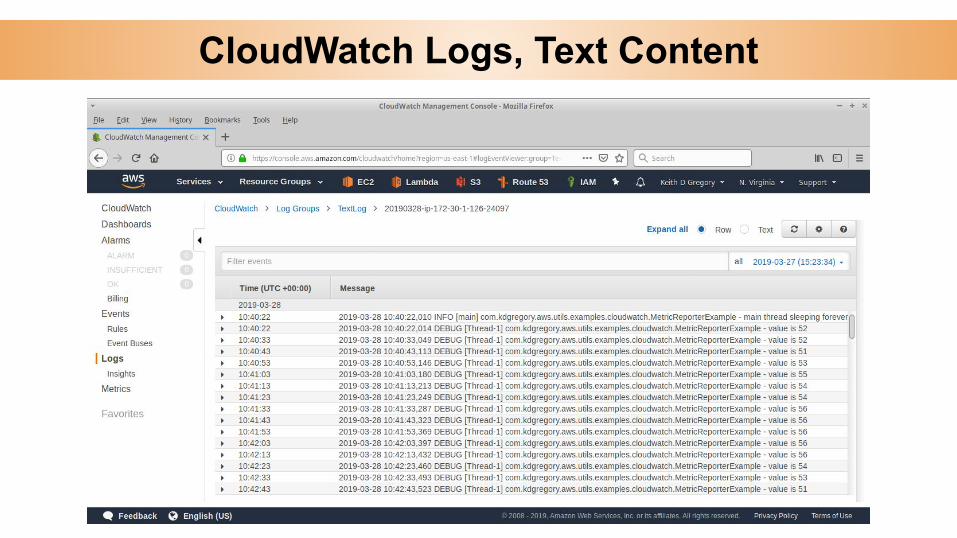
CloudWatch Logs, Text Content
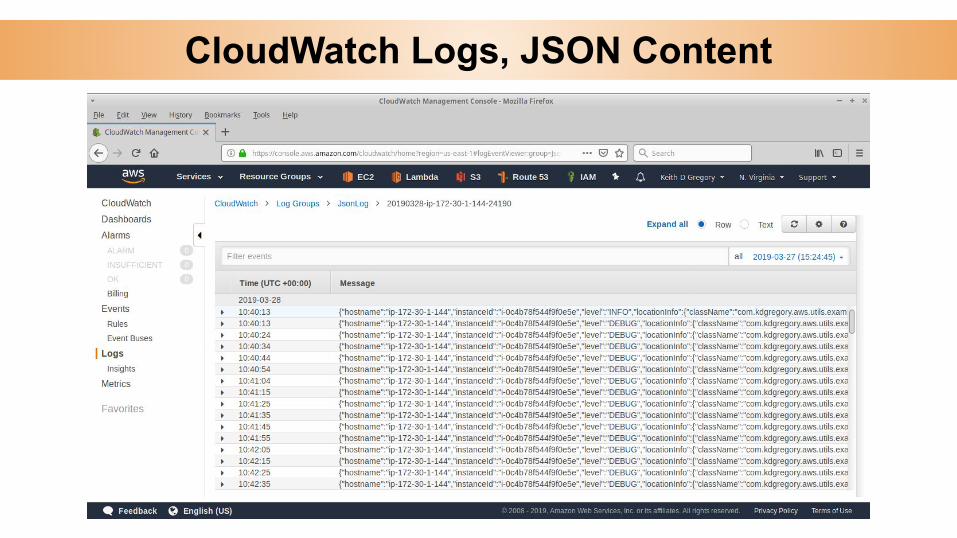
CloudWatch Logs, JSON Content
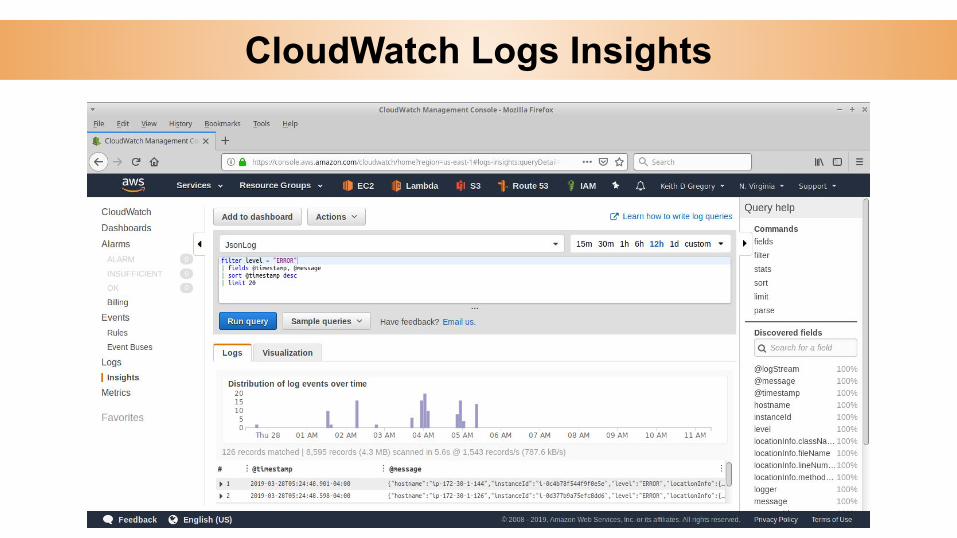
CloudWatch Logs Insights
ELB Access Logs
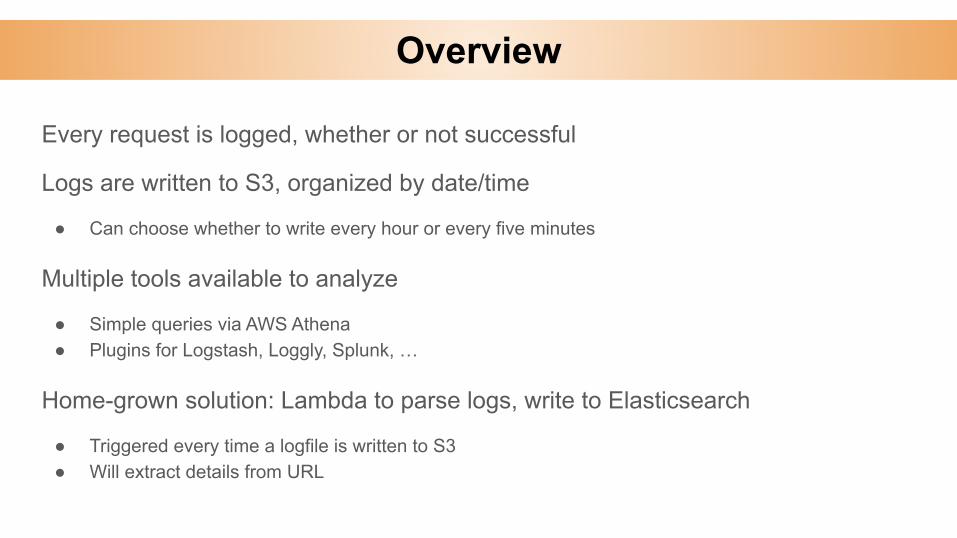
Overview
Every request is logged, whether or not successful
Logs are written to S3, organized by date/time
● Can choose whether to write every hour or every five minutes
Multiple tools available to analyze
● Simple queries via AWS Athena● Plugins for Logstash, Loggly, Splunk, …
Home-grown solution: Lambda to parse logs, write to Elasticsearch
● Triggered every time a logfile is written to S3● Will extract details from URL
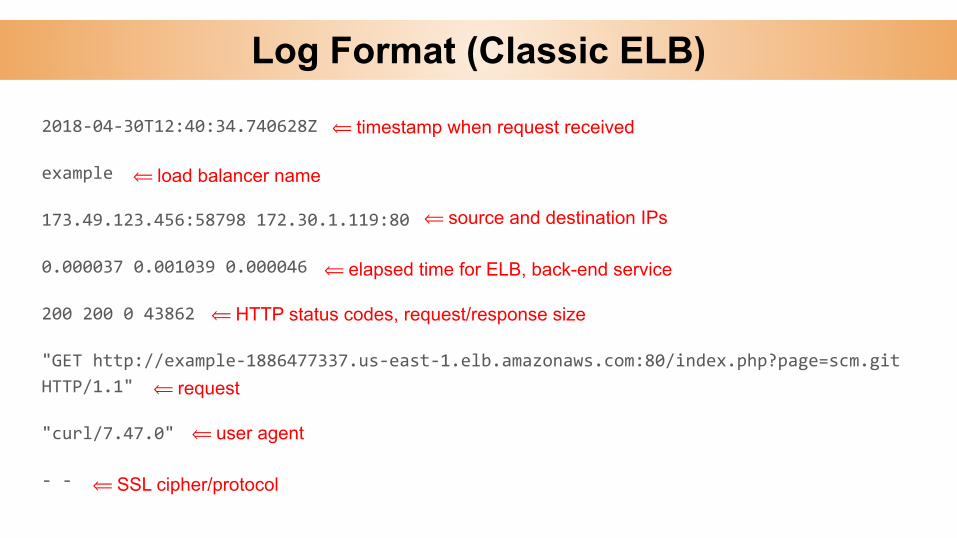
Log Format (Classic ELB)
2018-04-30T12:40:34.740628Z
example
173.49.123.456:58798 172.30.1.119:80
0.000037 0.001039 0.000046
200 200 0 43862
"GET http://example-1886477337.us-east-1.elb.amazonaws.com:80/index.php?page=scm.git
HTTP/1.1"
"curl/7.47.0"
- -
⟸ timestamp when request received
⟸ load balancer name
⟸ source and destination IPs
⟸ elapsed time for ELB, back-end service
⟸ HTTP status codes, request/response size
⟸ request
⟸ user agent
⟸ SSL cipher/protocol
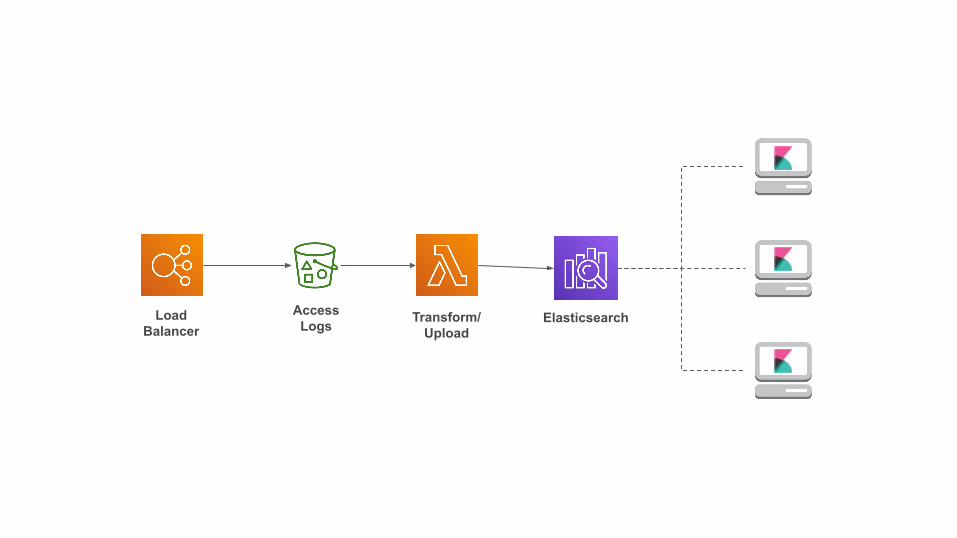
AccessLogs ElasticsearchTransform/
UploadLoad
Balancer
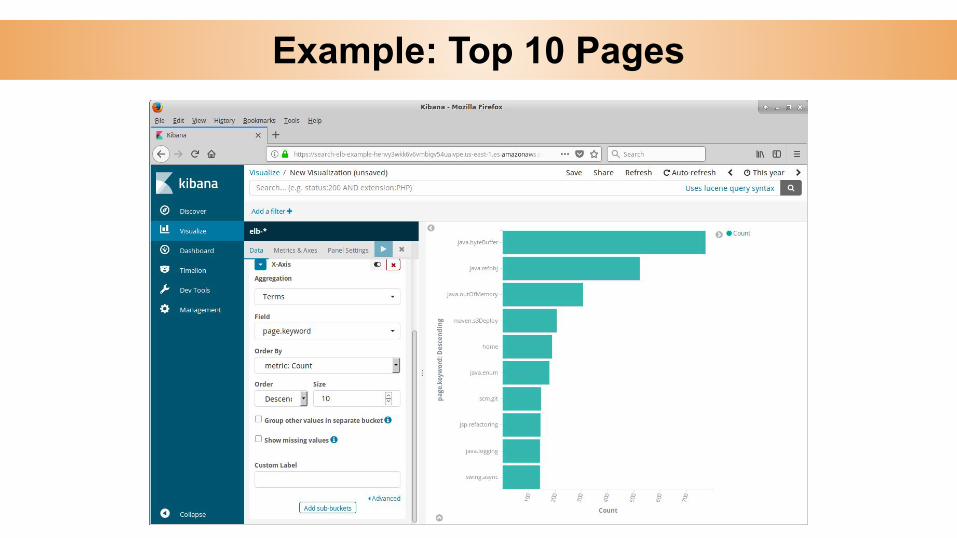
Example: Top 10 Pages
CloudWatch Metrics
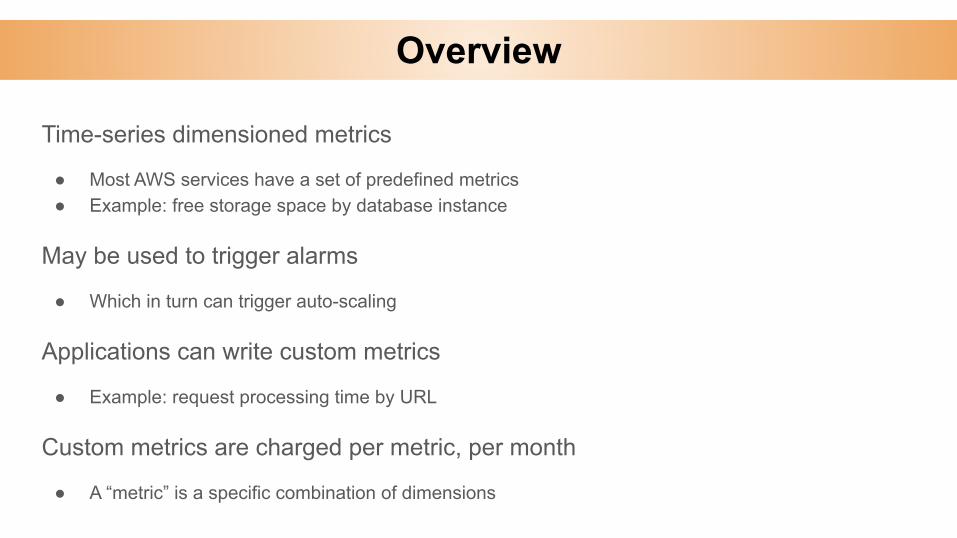
Overview
Time-series dimensioned metrics
● Most AWS services have a set of predefined metrics● Example: free storage space by database instance
May be used to trigger alarms
● Which in turn can trigger auto-scaling
Applications can write custom metrics
● Example: request processing time by URL
Custom metrics are charged per metric, per month
● A “metric” is a specific combination of dimensions
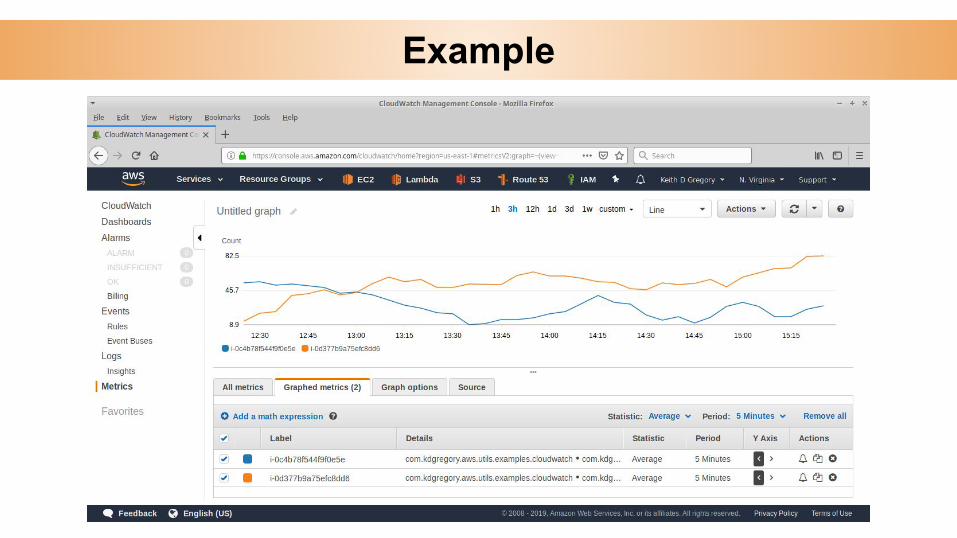
Example

For More Information
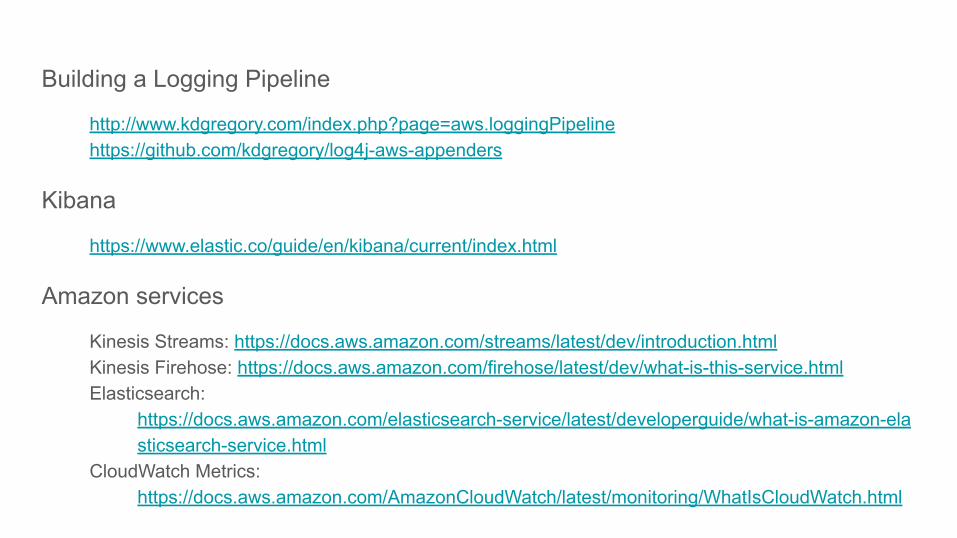
Building a Logging Pipeline
http://www.kdgregory.com/index.php?page=aws.loggingPipelinehttps://github.com/kdgregory/log4j-aws-appenders
Kibana
https://www.elastic.co/guide/en/kibana/current/index.html
Amazon services
Kinesis Streams: https://docs.aws.amazon.com/streams/latest/dev/introduction.htmlKinesis Firehose: https://docs.aws.amazon.com/firehose/latest/dev/what-is-this-service.htmlElasticsearch:
https://docs.aws.amazon.com/elasticsearch-service/latest/developerguide/what-is-amazon-elasticsearch-service.html
CloudWatch Metrics: https://docs.aws.amazon.com/AmazonCloudWatch/latest/monitoring/WhatIsCloudWatch.html