Embed Size (px)
Citation preview
6 Beacon St, Suite 910 Boston, MA 02108
617 723 2639
www.massclu.org
Building a Brighter Day:Energy E� ciency Innovations Yield High Returns for the Commonwealth A TRIPLE WIN FOR EMPLOYMENT, EQUITY AND THE ENVIRONMENT
Community Labor UnitedReport author: Judith Grant, MPH
GREEN JUSTICE FOUNDING PRINCIPLESThe Green Justice Coalition is founded on the following principles:
• We all have a right to a decent quality of life and healthy environment, but not at the expense of others or future generations.
• We all have a right to an equal voice on how public resources are used to go green and to know the outcomes of these public investments.
• We must protect those who are currently most vulnerable.
• Those who have contributed more to the problem need to contribute more to address past injustices, while those who have paid the price are owed a greater share of new green resources and opportunities.
• Green Justice requires that there be meaningful access to green jobs and other economic opportunities for residents of communities of color and other low income communities. Meaningful access includes appropriate education, training and support, as well as priority hiring for local projects.
• Green jobs must be safe jobs, with decent pay and benefi ts that can support families. Where possible, green jobs should be union jobs or at least pay the prevailing wage. Workers who will be negatively impacted by green development have a right to a just transition.
• Green justice supports not only green jobs but also opportunities for individual and community ownership and production among communities of color and other low income communities.
THE GREEN JUSTICE STEERING COMMITTEE INCLUDES:Alternatives for Community & Environment (ACE), Alliance to Develop Power (ADP),Boston Climate Action Network (BCAN), Boston Workers’ Alliance (BWA), ChelseaCollaborative, Chinese Progressive Association, Clean Water Action Massachusetts,Coalition for Social Justice, Greater Four Corners Action Coalition, Laborers NewEngland Regional Organizing Fund, MassCOSH, Massachusetts Energy ConsumersAlliance, Neighbor to Neighbor, New England Regional Council of Carpenters, NewEngland United for Justice, Painters & Allied Trades DC35, Project RIGHT
Working with utility companies and the state’s Energy Effi ciency Advisory Council over the past four years, Community Labor United
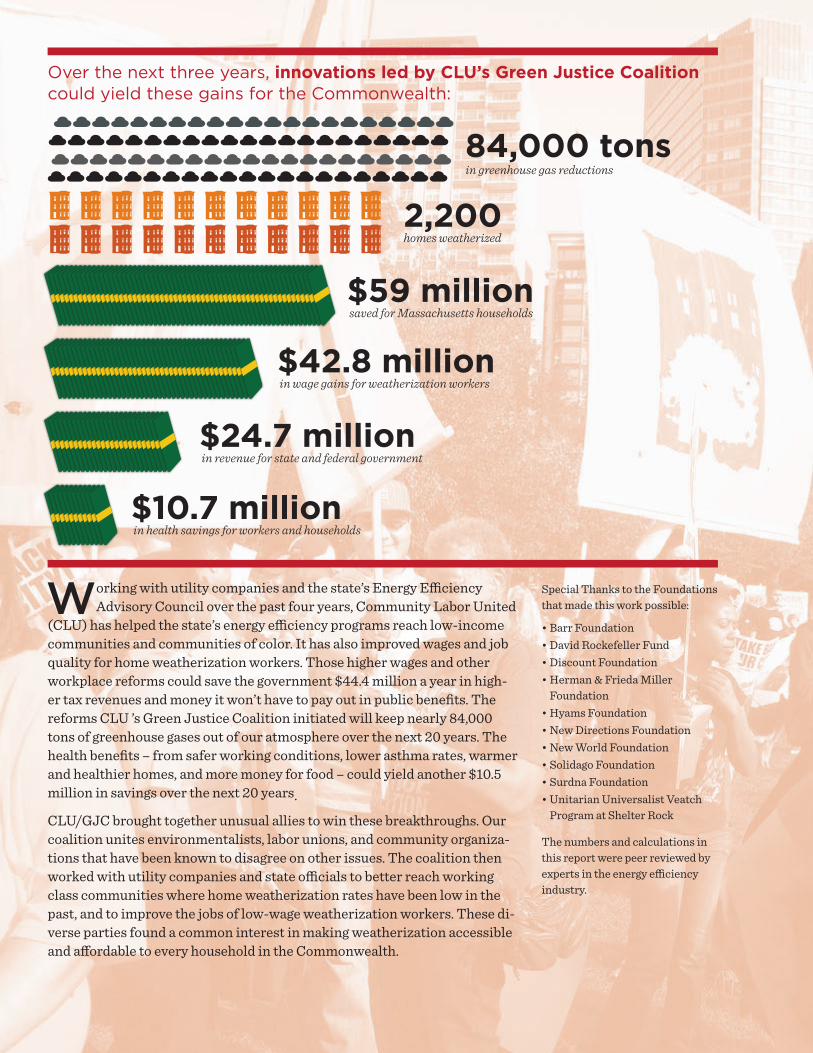
(CLU) has helped the state’s energy effi ciency programs reach low-income communities and communities of color. It has also improved wages and job quality for home weatherization workers. Those higher wages and other workplace reforms could save the government $44.4 million a year in high-er tax revenues and money it won’t have to pay out in public benefi ts. The reforms CLU ’s Green Justice Coalition initiated will keep nearly 84,000 tons of greenhouse gases out of our atmosphere over the next 20 years. The health benefi ts – from safer working conditions, lower asthma rates, warmer and healthier homes, and more money for food – could yield another $10.5 million in savings over the next 20 years.
CLU/GJC brought together unusual allies to win these breakthroughs. Our coalition unites environmentalists, labor unions, and community organiza-tions that have been known to disagree on other issues. The coalition then worked with utility companies and state offi cials to better reach working class communities where home weatherization rates have been low in the past, and to improve the jobs of low-wage weatherization workers. These di-verse parties found a common interest in making weatherization accessible and aff ordable to every household in the Commonwealth.
Over the next three years, innovations led by CLU’s Green Justice Coalition could yield these gains for the Commonwealth:
Special Thanks to the Foundations that made this work possible:
• Barr Foundation• David Rockefeller Fund• Discount Foundation• Herman & Frieda Miller
Foundation• Hyams Foundation• New Directions Foundation• New World Foundation • Solidago Foundation• Surdna Foundation• Unitarian Universalist Veatch
Program at Shelter Rock
The numbers and calculations in this report were peer reviewed by experts in the energy effi ciency industry.
Executive SummaryOver the past four years, Community Labor United’s Green Justice Coalition (CLU/GJC) has created a groundbreaking model for energy efficiency. Working with the state and utility com-panies, CLU/GJC has brought Massachusetts’s home weatherization program to working-class communities of color, dramatically improved wages and job standards for weatherization work-ers, and kept tens of thousands of tons of greenhouse gases out of the air. CLU/GJC has won:
Policy Breakthroughs ✔HIGH BENCHMARKS FOR GREENHOUSE GAS REDUCTION: CLU/GJC joined a broad set of organizations to push for ambitious state climate goals. Adding the voices of immigrants, working-class communities and labor unions, we helped win the strongest greenhouse gas re-duction standards in the country. We then went on to make sure that weatherization workers and communities of color benefited from those goals. ✔ACCESSIBLE HOME WEATHERIZATION: CLU/GJC worked with utility companies to de-sign and test Community Mobilization Initiatives (CMIs). These pilot projects hired trusted local organizations to reach out in their neighborhoods, sign residents up for home weather-ization, and walk them through the complicated approval process. The CMIs found union and community contractors who hired and trained local workers and created pathways into con-struction careers. The CMIs also showed that subsidies for low- to moderate-income families and subsidies for “pre-weatherization” building repairs were necessary and cost-effective in making energy efficiency accessible to working-class communities. The state and utilities agreed to incorporate CMI lessons in the upcoming three-year energy efficiency plan. ✔OVERCOMING AFFORDABILITY HURDLES: Our CMIs helped identify the biggest barriers to weatherization in low- to moderate-income communities. Massachusetts’s new three-year plan will fund Efficient Neighborhoods+ (EN+), a targeted program for working class neigh-borhoods that includes:
• tiered rebates that make weatherization more affordable,• “pre-weatherization” subsidies that fix problems like old wiring and carbon monoxide
emissions, and• effective outreach by trusted community organizations.
The three-year plan will also remove the complicated process of verifying households’ in-come eligibility by automatically qualifying all families living in defined low- to moderate-in-come neighborhoods. ✔DATA ACCESS: Effective programs need to track whom they are serving. After much nego-tiation, CLU/GJC won a commitment to establish a database that uses utility data to track weatherization work geographically and tell us if low- to moderate-income communities are being adequately served. ✔EQUITY: While all these policy breakthroughs can certainly be seen as equity gains, CLU/GJC has achieved something broader. We have made equity part of the Commonwealth’s energy efficiency policy and worldview. Access to good jobs and weatherization services for all rate-payers – regardless of race, income, and language – are now explicit goals of Massachusetts’s energy efficiency programs.
These solutions originated with our grassroots leaders, who live the challenges of equity and affordability every day. Their policy breakthroughs have led to dramatic economic gains for working class communities, weatherization workers, and the Commonwealth.
Still on the agenda are completing the data access project; allocating more funds for communi-ty outreach; and adopting broader societal benefit-cost measures in calculating energy efficiency gains.
GREEN JUSTICE FOUNDING PRINCIPLESThe Green Justice Coalition is founded on the following principles:
• We all have a right to a decent quality of life and healthy environment, but not at the expense of others or future generations.
• We all have a right to an equal voice on how public resources are used to go green and to know the outcomes of these public investments.
• We must protect those who are currently most vulnerable.
• Those who have contributed more to the problem need to contribute more to address past injustices, while those who have paid the price are owed a greater share of new green resources and opportunities.
• Green Justice requires that there be meaningful access to green jobs and other economic opportunities for residents of communities of color and other low income communities. Meaningful access includes appropriate education, training and support, as well as priority hiring for local projects.
• Green jobs must be safe jobs, with decent pay and benefi ts that can support families. Where possible, green jobs should be union jobs or at least pay the prevailing wage. Workers who will be negatively impacted by green development have a right to a just transition.
• Green justice supports not only green jobs but also opportunities for individual and community ownership and production among communities of color and other low income communities.
THE GREEN JUSTICE STEERING COMMITTEE INCLUDES:Alternatives for Community & Environment (ACE), Alliance to Develop Power (ADP),Boston Climate Action Network (BCAN), Boston Workers’ Alliance (BWA), ChelseaCollaborative, Chinese Progressive Association, Clean Water Action Massachusetts,Coalition for Social Justice, Greater Four Corners Action Coalition, Laborers NewEngland Regional Organizing Fund, MassCOSH, Massachusetts Energy ConsumersAlliance, Neighbor to Neighbor, New England Regional Council of Carpenters, NewEngland United for Justice, Painters & Allied Trades DC35, Project RIGHT
Working with utility companies and the state’s Energy Effi ciency Advisory Council over the past four years, Community Labor United
(CLU) has helped the state’s energy effi ciency programs reach low-income communities and communities of color. It has also improved wages and job quality for home weatherization workers. Those higher wages and other workplace reforms could save the government $44.4 million a year in high-er tax revenues and money it won’t have to pay out in public benefi ts. The reforms CLU ’s Green Justice Coalition initiated will keep nearly 84,000 tons of greenhouse gases out of our atmosphere over the next 20 years. The health benefi ts – from safer working conditions, lower asthma rates, warmer and healthier homes, and more money for food – could yield another $10.5 million in savings over the next 20 years.
CLU/GJC brought together unusual allies to win these breakthroughs. Our coalition unites environmentalists, labor unions, and community organiza-tions that have been known to disagree on other issues. The coalition then worked with utility companies and state offi cials to better reach working class communities where home weatherization rates have been low in the past, and to improve the jobs of low-wage weatherization workers. These di-verse parties found a common interest in making weatherization accessible and aff ordable to every household in the Commonwealth.
Over the next three years, innovations led by CLU’s Green Justice Coalition could yield these gains for the Commonwealth:
Special Thanks to the Foundations that made this work possible:
• Barr Foundation• David Rockefeller Fund• Discount Foundation• Herman & Frieda Miller
Foundation• Hyams Foundation• New Directions Foundation• New World Foundation • Solidago Foundation• Surdna Foundation• Unitarian Universalist Veatch
Program at Shelter Rock
The numbers and calculations in this report were peer reviewed by experts in the energy effi ciency industry.
Economic Breakthroughs Massachusetts’s energy efficiency programs calculate lifetime1 cost savings of as much as $3 for every $1 invested in weatherization. This “Total Resource Cost” looks only at the cost of produc-ing power (including power plant operations, administrative overhead, labor costs, and other factors), capacity, and consumer bill savings. Looking not just at savings on utility bills but at the full array of economic and social gains from these investments – including health, wage, and pub-lic revenue increases – we calculate a much higher payoff of $21 over the 20-year lifetime of these residential energy efficiency retrofits for every dollar invested in EN+ and pre-weatherization. (Charts in the Appendix show the calculations behind our projected savings figures.)
✔ENERGY SAVINGS: Efficient Neighborhoods+ could yield as much as $7.50 for every $1 invested in the plan. EN+ will have the added benefit of extending weatherization to commu-nities that have found it difficult to access and afford. ✔JOBS: We estimate that EN+ could employ up to 22 additional weatherization workers each year in the plan. Because CLU/GJC insisted on fair pay for weatherization workers, their increased wages could support 60 additional jobs. CLU/GJC negotiated responsible con-tractor agreements with the state’s largest utilities and weatherization vendors that cover subcontractors as well. The agreements set standards for training, health and safety, working conditions, proper classification of workers, and compliance with state labor laws. The strong enforcement provisions in these agreements should help eliminate the common practices of wage theft and misclassification. Increased spending from EN+ participants could spur the economic activity needed to create another four jobs. We estimate $42.8 million in overall wage gains over the next three years. ✔SAVINGS TO THE COMMONWEALTH: When contractors misclassify or underpay their workers, the state picks up the bill for uninsured workers’ health care, low-income family support, and lost tax revenues. We calculate that CLU/GJC’s workplace reforms could save taxpayers and the state and federal governments $16.1 million over the next three years in avoided public benefits usage and bring in $24.1 million in additional revenue. ✔SAFER WORKPLACES: Through training and higher safety standards, CLU/GJC’s reforms could save $7.7 million in measurable health costs and claims through reduction in workplace asthma, injury and death. ✔LOWER FAMILY MEDICAL BILLS: High fuel bills force families to go without either heat or food. Scrimping on either – as many low- to moderate-income families must do – can cause such chronic illnesses as respiratory problems, susceptibility to infection, or delayed mental development in children. The health consequences – repeated hospitalizations and treat-ments – are extremely expensive. We estimate total reduction in health services accessed by EN+ households in the next three years will generate a savings of at least $3 million over the next 20 years.
There are some surprises in these figures. Though CLU/GJC did not set out to reduce health costs or increase public revenues, those figures could represent a significant economic gain for the Commonwealth. These numbers confirm our hopes at the start of the campaign: that making home weatherization affordable and accessible would yield a triple win for the state’s economic, environmental, and equity goals.
1 In the context of energy efficiency retrofits, “lifetime” indicates a 20-year term (i.e. the estimated lifetime of the effectiveness of the weatherization measures).
BACKGROUND 3
BackgroundMassachusetts is often thought of as an environmental powerhouse, but we have long lagged behind west coast states on a number of indicators. Recently, ambitious environmental goals and a push to embrace green technology jobs have finally propelled us forward. We are now ranked first in the nation for energy efficiency, with aggressive savings goals for the next three years. Total combined gas and electric efficiency measures are estimated to save utility customers in Massachusetts over $8 billion and reduce greenhouse gas (GHG) emissions by 25,632,813 short tons, the equivalent of taking approximately 398,700 cars off the road or eliminating the output of a 460 MW power plant for one year.2
Yet who benefits from this green economy remains a key question. Community Labor United’s Green Justice Coalition (CLU/GJC) has ensured that working-class communities and com-munities of color will get their full share of home weatherization jobs and services as we move forward. Our four-year Energy Efficiency campaign has won policy breakthroughs, benefit-cost improvements, and health gains that can serve as a nationwide model.
These gains are critical for the working families of Massachusetts. The recession of 2008 exacerbated long-standing problems in our communities of high costs, low pay and lost jobs. In Boston’s predominantly African-American community of Roxbury, for instance, the unemploy-ment rate is almost twice the city average.3 Roxbury is also an official “environmental justice” community4 – one of the many working class communities of color in Massachusetts with ex-cessive health effects from environmental pollution. In general, African-Americans are 1.5 times more likely to have childhood asthma as whites,5 and EJ communities have historically faced a cumulative exposure rate to environmentally hazardous sites and facilities that is more than 20 times greater than other neighborhoods.6
To help correct this stark imbalance, CLU and our allies convened a statewide partnership of more than fifty community organizations, labor unions, environmental groups and faith-based alliances, now known as the Green Justice Coalition. This group committed to focusing not just on environmental issues, but on good jobs, and racial and economic equity. Our Green Justice Principles (see inside back cover) reflect the fact that resources for greening must be accessible to all in order to stabilize our climate. CLU’s coalition partners – whose members live in work-ing-class communities and communities of color – have been overburdened by the fossil-fuel economy and excluded from decision-making structures, and must take a lead role in order to build a truly sustainable green economy.
The campaign initially focused on accessing economic stimulus money from the federal American Recovery and Reinvestment Act (ARRA) and on organizing within the City of Boston. However, in 2008 the state passed a trio of laws focused on the green economy. This set the stage for a dramatic expansion of energy efficiency programs and potentially tripled the funds that Massachusetts utility companies spend on energy efficiency:
• The Green Communities Act required “least cost procurement” by utilities, requiring them to invest in all efficiency measures that are less expensive than new supply.
2 “2013-2015 Massachusetts Joint Statewide Three-Year Electric and Gas Energy Efficiency Plan July 2, 2012 Submission to EEAC.” Massachusetts Energy Efficiency Advisory Council. July 2, 2012. http://www.ma-eeac.org/docs/7.3.12/Gas%20and%20Electric%20PAs%20July%202%20Plan%207-2-12.pdf. This figure includes commercial as well as residential customers.3 Finucane, Martin. “Menino proposes moving school headquarters to revitalize Dudley Square.” Boston Globe. March 3, 2011. http://www.boston.com/yourtown/news/roxbury/2011/03/menino_proposes_moving_school_1.html4 In 2002, the Massachusetts Executive Office of Energy and Environmental Affairs created an official designation for “environmental justice” neighborhoods, defined as those that meet one or more of the following criteria: Median annual household income at or below 65% of the statewide median income;25% or more of the residents are a minority; 25% or more of the residents are foreign born; or 25% or more of the residents are lacking English language proficiency. See http://www.mass.gov/eea/grants-and-tech-assistance/ environmental-justice-policy.html for more information.5 Massachusetts Department of Public Health Asthma Prevention and Control Program. “Burden of Asthma in Massachusetts.” Massa-chusetts Department of Public Health. April 2009, p 31. http://www.mass.gov/eohhs/docs/dph/com-health/asthma/state-plan.pdf.6 Faber, Daniel R., and Eric J. Krieg. “Unequal exposure to ecological hazards: environmental injustices in the Commonwealth of Massa-chusetts.” Environmental Health Perspectives. 110.Suppl 2 (2002): 277.
BUILDING A BRIGHTER DAY: ENERGY EFFICIENCY INNOVATIONS YIELD HIGH RETURNS FOR THE COMMONWEALTH4
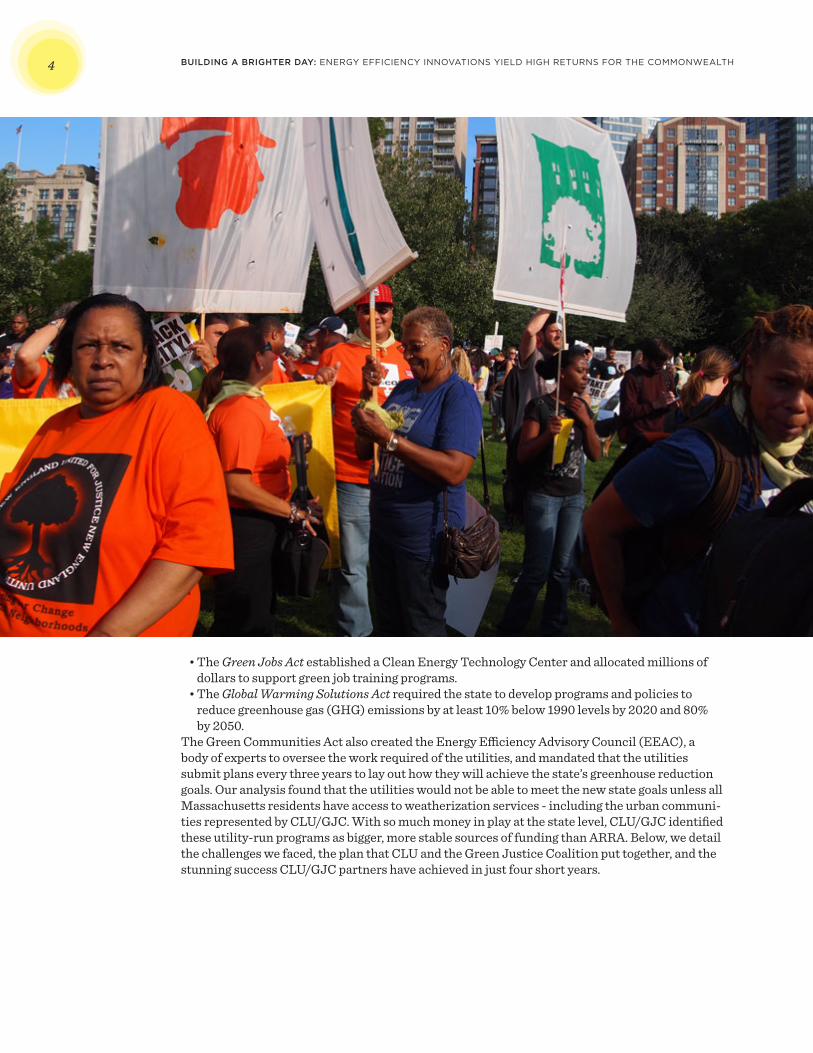
• The Green Jobs Act established a Clean Energy Technology Center and allocated millions of dollars to support green job training programs.
• The Global Warming Solutions Act required the state to develop programs and policies to reduce greenhouse gas (GHG) emissions by at least 10% below 1990 levels by 2020 and 80% by 2050.
The Green Communities Act also created the Energy Efficiency Advisory Council (EEAC), a body of experts to oversee the work required of the utilities, and mandated that the utilities submit plans every three years to lay out how they will achieve the state’s greenhouse reduction goals. Our analysis found that the utilities would not be able to meet the new state goals unless all Massachusetts residents have access to weatherization services - including the urban communi-ties represented by CLU/GJC. With so much money in play at the state level, CLU/GJC identified these utility-run programs as bigger, more stable sources of funding than ARRA. Below, we detail the challenges we faced, the plan that CLU and the Green Justice Coalition put together, and the stunning success CLU/GJC partners have achieved in just four short years.
THE CHALLENGES OF CREATING ENERGY EFFICIENCY EQUITY 5
The Challenges of Creating Energy Efficiency Equity
Access to Good Jobs and Fair Treatment Like residential construction generally, the weatherization industry has long operated outside the scope of state oversight. Union density is far lower than in commercial construction, and the pressure to keep down costs results in a race to the bottom. Abuse of workers is rampant – par-ticularly those who are undocumented or who are not proficient in English. Mistreatment ranges from threatening workers with retaliation (such as deportation) if they complain about unsafe conditions, to outright wage theft.7
Misclassifying employees as independent contractors is another way that contractors game the system to keep costs low. Misclassification allows employers to avoid paying unemployment insurance, workers’ compensation, and payroll taxes, cheating workers and the state out of mil-lions of dollars every year. In addition, weatherization wages are low – averaging about $10/hour – in part because many workers are forced to work off the clock, or are not paid correctly for the time that is properly documented. For example, workers are often unpaid for their time picking up materials and equipment before work and returning them afterward.8 Often, they are not paid overtime when they work over 40 hours in one week.9
For communities of color, pre-employment background checks are a barrier to accessing jobs in the first place. Contractors routinely run potential employees through the Massachusetts Criminal Offender Record Information (CORI) registry. Despite recent reforms to Massachusetts’s CORI laws, these background checks often incorrectly show job applicants with no criminal records as being “in the system,” while some applicants have old records with minor offenses that have no bearing on weatherization jobs.
Access to Weatherization Services Section 116(b)(3) of the Green Communities Act of 2008 required an equitable distribution of services to all customers. However, the Act laid out no benchmarks and mentioned no specific ways to reach people of color, renters and immigrant households. In other words, there was no plan for signing up low- to moderate-income households, and previous efforts had not produced good results. Additionally, the legislation defined success with a narrow benefit-cost ratio that discouraged utilities from taking the extra steps needed to reach these households.
Household income can present a barrier for households that earn 60-120% of the State Median Income (SMI).10 While federal and state energy efficiency programs pay 100% of weatherization costs for the very poor of the Commonwealth, households above that poverty line must pay a quarter of their weatherization costs.11 For these families, that co-pay is often unaffordable. This 60-120% of SMI group represents a full 27% of households in Massachusetts, and 39% of state utility customers who fall above low-income eligibility. The Commonwealth’s aggressive green-house gas (GHG) emission reduction goals will be difficult – if not impossible – to achieve unless this group can fully participate.
For families on the lower end of this income bracket, the high co-pay represents an additional injustice. All Massachusetts households contribute to Mass Save, the state weatherization pro-gram, with a monthly charge per kilowatt or therm of energy they use.12 Working class families, 7 Community Labor United. “An Industry at the Crossroads: Energy Efficiency Employment in Massachusetts.” Community Labor United. March 2010. http://massclu.org/sites/clud6.prometheuslabor.com/files/industry_at_the_crossroads.pdf. 8 “An Industry at the Crossroads.” Interviews conducted by CLU with weatherization workers and contractors throughout the industry indicated that, in the absence of reliable labor market data, $10 hourly wages with no health or pension benefits is a fair proxy for ‘low road’ compensation.9 Bernhardt, Annette, et al. “Broken Laws, Unprotected Workers.” National Employment Law Project. New York: NELP (2009).10 60-120% of Massachusetts SMI is $50,515-$101,030 for a family with three and $60,134-$120,269 for a family of four. http://www.mass-resources.org/Income-eligible-child-care-eligibility.html.11 Arbor Consulting Partners. “Moving Towards Community Driven Energy Efficiency: An Evaluation of Green Justice Coalition’s Com-munity Mobilization Initiatives.” Community Labor United. November 2011. http://massclu.org/sites/clud6.prometheuslabor.com/files/cmi_evaluation_full.pdf.12 “Energy Efficiency Advisory Council Responsibilities.” Energy Efficiency Advisory Council. http://www.ma-eeac.org/docs/081118-EEAC-Responsibilities.pdf.
BUILDING A BRIGHTER DAY: ENERGY EFFICIENCY INNOVATIONS YIELD HIGH RETURNS FOR THE COMMONWEALTH6
who often live in older and draftier homes, pay more proportionately into this weatherization pool. Yet, Mass Save’s co-pay system has not offered anything like a sliding scale. This means that many low- to moderate-income families are paying into a program that they cannot access.
Those at 60-120% of SMI fall into a broader group of customers known as “Hard-to-Reach, Hard-to-Serve” (HTR/HTS). This includes many immigrant communities and communities of color, and some HTR/HTS communities feel they have been historically underserved by the utilities. There are language barriers and also issues of trust. Families with undocumented immi-grants frequently avoid official programs, even when they are paying directly into them, like Mass Save. For eligible families who rent, their landlords must agree to have the work done, creating worries that rents could go up as a result.13 Complicated paperwork to verify income-eligibility is another significant obstacle.
Effectively reaching customers in working class and immigrant communities is one of the greatest challenges for weatherization programs. HTR/HTS is a diverse universe of customers, many of whom are not always plugged into the Internet or other information streams. They may not read or understand weatherization information that utilities slip into their monthly state-ments. As one organizer put it, “Most people are not concerned about this little green piece of paper with their bill … They’re worried about how much they owe. So the utility companies could have said ‘We did the outreach and it didn’t work,’ but we know there’s no way that strategy would be effective marketing.”14
Finally, weatherization cannot take place until a home meets certain physical requirements. These can include deactivating old New England “knob-and-tube” wiring, plugging roof leaks and other moisture sources, correcting improper gas dryer venting and ensuring that boilers and furnaces are not emitting high levels of carbon monoxide. Mass Save evaluation contrac-tors identify these “pre-weatherization” barriers, but the homeowner has to correct them. CLU/GJC quickly realized that these up-front renovation costs were a huge barrier to weatherization. Often it only takes a few hundred dollars, but for low- to moderate-income homeowners – or tenants with unenthusiastic landlords – that obstacle can be insurmountable.15
Access to Decision-MakingMassachusetts’s weatherization system can be difficult to navigate. Utility companies have ad-ministered the state-mandated weatherization program, Mass Save, for over three decades. They, state officials, and other stakeholders who have long been involved in weatherization programs have developed a shared industry language and history that makes it hard for the public to jump in and fully participate. Much of the work goes on informally or in ad hoc committees and public-ly available data are inadequate for informed participation.
More than once in our energy-efficiency campaign, members of our communities thought that they had figured out the process, only to find that crucial decisions had already been made in discussions we had not been initially invited to or didn’t know about.
We found a further challenge at the Department of Public Utilities (DPU), which closely reg-ulates utilities and their state energy efficiency plans. This could be an arena where advocates could best intervene and win changes. However, the DPU operates much like a formal court system. Intervening in its proceedings is an expensive, technical, time-consuming matter. The EEAC proved an avenue to get around some of these barriers. Its regular public meetings and seats for public representatives gave us a place to influence the process.
Making Equity Part of the Equation CLU’s Green Justice Coalition has played a significant role in highlighting the racial and income disparities of access to both good jobs and energy efficiency programs. We used the EEAC meet-ings to officially introduce the concept of equity into the debate. We helped focus EEAC members on “Hard to Reach/Hard to Serve” communities and the barriers they faced. Giving those com-munities a name gave residents a voice in the process. 13 Garcia Soto, Jovanna. Personal interview. September 19, 2012.14 Cunningham, Hakim, Boston Workers Alliance, Personal interview. September, 2010.15 Arbor Consulting Partners. “Evaluation of the Green Justice Coalition’s Community Mobilization Initiative Chinatown and Chelsea Residential Energy Efficiency Pilots.” Community Labor United. September 4, 2011. http://massclu.org/sites/clud6.prometheuslabor.com/files/cmi_evaluation_full.pdf.
THE CHALLENGES OF CREATING ENERGY EFFICIENCY EQUITY 7
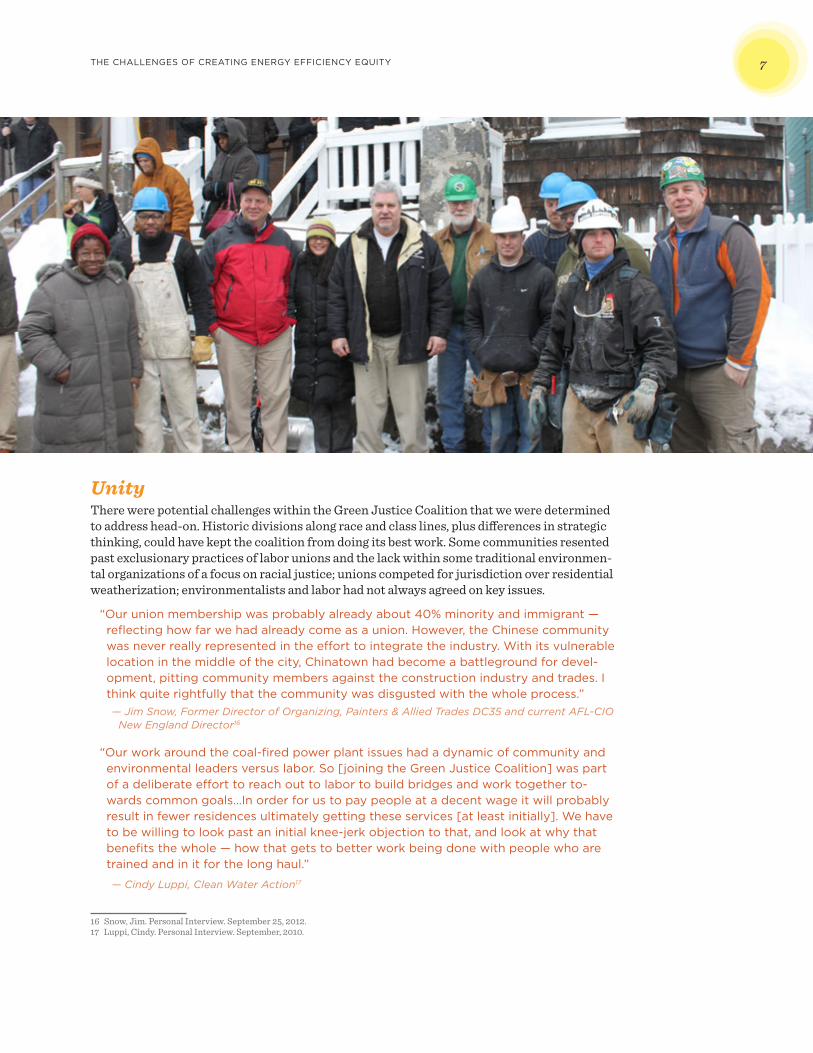
Unity There were potential challenges within the Green Justice Coalition that we were determined to address head-on. Historic divisions along race and class lines, plus differences in strategic thinking, could have kept the coalition from doing its best work. Some communities resented past exclusionary practices of labor unions and the lack within some traditional environmen-tal organizations of a focus on racial justice; unions competed for jurisdiction over residential weatherization; environmentalists and labor had not always agreed on key issues.
“Our union membership was probably already about 40% minority and immigrant — reflecting how far we had already come as a union. However, the Chinese community was never really represented in the effort to integrate the industry. With its vulnerable location in the middle of the city, Chinatown had become a battleground for devel-opment, pitting community members against the construction industry and trades. I think quite rightfully that the community was disgusted with the whole process.” — Jim Snow, Former Director of Organizing, Painters & Allied Trades DC35 and current AFL-CIO
New England Director16
“Our work around the coal-fired power plant issues had a dynamic of community and environmental leaders versus labor. So [joining the Green Justice Coalition] was part of a deliberate effort to reach out to labor to build bridges and work together to-wards common goals…In order for us to pay people at a decent wage it will probably result in fewer residences ultimately getting these services [at least initially]. We have to be willing to look past an initial knee-jerk objection to that, and look at why that benefits the whole — how that gets to better work being done with people who are trained and in it for the long haul.”
— Cindy Luppi, Clean Water Action17
16 Snow, Jim. Personal Interview. September 25, 2012. 17 Luppi, Cindy. Personal Interview. September, 2010.
BUILDING A BRIGHTER DAY: ENERGY EFFICIENCY INNOVATIONS YIELD HIGH RETURNS FOR THE COMMONWEALTH8
Energy Efficiency and Equity: Breakthroughs and InnovationsFour years of planning and organizing by CLU/GJC have yielded groundbreaking policy, energy savings, jobs standards, as well as environmental and public health benefits. From better jobs to weatherization access for low- to moderate-income residents, CLU/GJC have won some of the country’s most innovative energy efficiency policies.
These policies will measurably improve the health, job prospects, and economic well-being of thousands of low- to moderate-income households. They will also reduce Massachusetts’s car-bon emissions by over 84,000 tons. Millions of children will breathe more easily because of our impact on public health and the Commonwealth will save money in the process. Taken together, we estimate that the CLU/GJC’s reforms could yield as much as $21 million in energy benefits, state savings, wage gains and other social benefits for every million dollars of investment spent on home weatherization over the next three years.
Policy BreakthroughsWe have won nearly every policy recommendation that we proposed four years ago.
✔SETTING HIGH BENCHMARKS FOR GREENHOUSE GAS EMISSION REDUCTIONS: CLU/GJC, along with many allies, advocated strongly for high GHG emissions reduction goals. Our coalition collected postcards, packed EEAC meetings, and added grassroots muscle to environmental advocates’ voices. In the end the state agreed to cut GHG emissions due to electricity by 2.5% and by natural gas by 1%, making us first in the nation.18 CLU/GJC’s unique contribution was to spread the benefits of this investment to weatherization workers and communities of color. ✔VALIDATING AND SECURING FUNDING FOR THE COMMUNITY MOBILIZATION INITIATIVE (CMI) MODEL: CLU/GJC’s Community Mobilization Initiative model is unique in this country and it could be a game-changer in the age of energy efficiency. Our CMI pilot projects showed that community-based organizations play a key role in improving access to energy efficiency retrofits in moderate-income communities and communities of color; iden-tified the main barriers these communities face; and created strategies for overcoming those obstacles. While the initial rates of completion were lower than expected, our community partners quickly identified solutions that increased completion rates substantially.
In the end, the program generated an impressive $7.90 of direct utility bill savings for every $1 invested by utilities and weatherization participants.19 Community engagement going for-ward will be integrated into the utilities’ marketing and outreach strategies, with the utilities agreeing to:
• Engage community-based organizations to deliver energy efficiency services to “Hard to Reach/Hard to Serve” neighborhoods;
• Customize community engagement plans based on social demographics;• Use a “holistic outreach” approach that utilizes municipal officials, community-based orga-
nizations, and local businesses; • Address barriers to participation identified by CLU/GJC’s partner organizations;• Use multilingual outreach strategies; and• Create performance-based savings goals.20
18 Massachusetts Executive Office of Energy and Environmental Affairs. “Patrick-Murray Administration Announces Number One Ranking in Energy Efficiency.” Massachusetts Executive Office of Energy and Environmental Affairs. October 3, 2012. http://www.mass.gov/eea/pr-2012/121003-ma-number-one.html.19 The DPU requires the utilities to assess the effectiveness of energy efficiency programs based on a ratio of “benefits” – financial savings to consumers – to “costs,” which are a total of all costs to both the utilities and the consumer, called the Total Resource Cost (TRC). Our estimates vary from the TRC, in that they do not include overhead costs, such as training, administration and research, nor do they include numerous ancillary benefits, such as reduced grid capacity and water conservation. We therefore refer to our calculations as a crude benefit-cost ratio, to distinguish it clearly from the TRC methodology, as well from our societal benefit-cost ratio, which includes health and wage-related economic benefits. Additionally, because we did not calculate energy inflation over the lifetime of the retrofits, these estimates may be low.20 “2013-2015 Massachusetts Joint Statewide Three-Year Electric and Gas Energy Efficiency Plan,” p 146.
ENERGY EFFICIENCY AND EQUITY: BREAKTHROUGHS AND INNOVATIONS 9
✔FUNDING FOR PRE-WEATHERIZATION COSTS: As a result of the HTR/HTS charrette that CLU/GJC initiated, pre-weatherization subsidies will be funded in the next three-year plan. We estimate that this could improve weath-erization completion rates by over 5.3%, and over 2,000 participants could use this funding over the next three years. ✔TIERED REBATES, PRE-WEATHERIZATION FUNDING AND GEO-TARGETING: To accel-erate delivery of energy efficiency programs to low- to moderate-income areas of the state, the utilities have combined many of our policy recommendations under a new Mass Save res-idential program called Efficient Neighborhoods+ (EN+). According to the utilities’ 3-year plan, this may include targeted census tracts that are lower income based on State Median Income and greater than 70% concentration of 1-4 unit buildings.21 These designated neighborhoods will benefit from outreach methods developed by CLU/GJC and their partners, pay lower co-pays, and gain access to pre-weatherization funds without having to provide individual income documentation.
Based on census tract analysis, 1.2 million Massachusetts households will potentially be el-igible to access energy efficiency measures through EN+.22 CLU/GJC is strongly recommend-ing that Mass Save devote 25% of its marketing budget to community initiatives, which could fund the equivalent of fifteen Community Mobilization Initiatives per year. At this rate, EN+ could weatherize more than 2,200 homes over the next three years.
This model is cost effective. Using a different methodology, the utilities project residential benefit-cost ratios of 1.58 for gas customers and 2.97 for electric users for the next three years. We project that EN+ could have a combined benefit-cost ratio of 7.5, even before taking into account indirect economic benefits. In other words, for every $1 of total cost, there could be $7.50 in energy-related benefits.
We estimate that the EN+ program will save participants a collective $59.2 million over the 20-year lifetime of the weatherization retrofits (see Chart C). Because lower-income households spend proportionally more of their available income, much of the money saved on energy bills will be injected back into the local economy, creating additional jobs and revenue (see “Job Creation” below). ✔TRANSPARENCY: CLU/GJC has transformed the energy efficiency conversation in Massachusetts. Just a few years ago, public discussion was confined to a legal and procedural approach – and real discussion happened behind closed doors. Now there is open discussion that includes community voices. We have brought hundreds of regular ratepayers into techni-cal meetings, uncovered and decoded the bureaucratic process, and increased accountability in spending energy efficiency dollars. ✔DATA COLLECTION: CLU/GJC have made significant progress toward the energy efficiency program database that advocates and policy makers are asking for, with a recent DPU ruling that requires the utilities to reach consensus with CLU’s Green Justice Coalition and submit a plan to the EEAC. This year, the EEAC has prioritized transparency, consistency and central-ization of data under DOER, and DOER has secured funding to design a database.
21 “2013-2015 Massachusetts Joint Statewide Three-Year Electric and Gas Energy Efficiency Plan,” p 146.22 US Census Bureau. “Units in Structure” and “Income for Last 12 Months” (2007-2011 American Community Survey 5-Year Estimates). American Fact Finder. 2011. www.factfinder2.census.gov. Percent of SMI calculated based on 4-person family median income of $100,058.
Over the next three years pre-weatherization subsidies will allow nearly 300 additional homes to complete the weatherization process who would otherwise have given up.
1.2 million Massachusetts households will potentially be eligible to access energy efficiency measures through EN+
BUILDING A BRIGHTER DAY: ENERGY EFFICIENCY INNOVATIONS YIELD HIGH RETURNS FOR THE COMMONWEALTH10
✔ENERGY EFFICIENCY EQUITY: One of our greatest achievements has been making the con-cept of equity central to energy efficiency policy in the Commonwealth. Our state’s communi-ties of color and working class families went from being complete outsiders to being de facto players in the process, and our voices have made the process both more complex and more successful for everyone. The thread of equity is woven throughout all of the progress we have seen; some concrete gains not listed above include:
• Overcoming barriers to participation: Pre-weatherization subsidies, community outreach methods, and multilingual outreach will allow thousands of low- to moderate-income families to weatherize their homes. The use of geo-targeting in designated Efficient Neigh-borhoods+ will replace the cumbersome paperwork previously required for middle-income customers to verify eligibility for programs.
• Improved access to jobs: Background checks on job applicants often turn up criminal records that disqualify applicants from employment. CLU/GJC successfully worked with NSTAR to create a process by which any contractor who has an employee who had an offense as a minor can ask for an exception, which NSTAR will review. This can open the door for individuals seeking to turn their lives around.
Economic BreakthroughsThe cost-effectiveness of energy efficiency initiatives is usually calculated using a ratio of direct costs to the value of energy saved. State utilities estimate that for every $1.00 spent on energy efficiency in the next three years, the Commonwealth will reap $3.00 in savings.23 While this ratio is impressive, it omits the full range of economic benefits that equitable energy efficiency policies can bring. Below are just some of the economic gains we will make from serving the “Hard to Reach” and prioritizing fair treatment of weatherization workers (see Chart E).
✔JOB CREATION: We estimate that the EN+ program could weatherize at least 2,273 homes in the next three years – homes that would have been passed over without CLU/GJC’s coalition work. The utility companies estimate that every field worker can complete 35 homes per year, on average, meaning that the equivalent of at least 22 field workers per year will work on EN+-funded projects.
Additionally, weatherization workers will receive increases due to the agreements we negotiated (see “Job Standards and Wage Gains” below). Every new job and wage increase in turn yields additional indirect and induced jobs. One study found that each additional $127,000 of economic activity creates one full-time payroll job.24 The estimated $7.6 million spent by higher-paid weatherization workers will therefore create 60 jobs per year25 that will in turn pay out $2.5 million in wages over the next three years, furthering the economic bene-fits.26 Likewise, money saved by EN+ participants on their utility bills will inject $10.5 million into the economy over the 20-year life of the retrofits, create 4 full-time jobs annually, and add $3.5 million to the pockets of Massachusetts workers. All together, high-road jobs and utility bill savings could add as much as $97.4 million to the pockets of low-wage workers, adding the equivalent of up to 261 job years to the Massachusetts economy, likely in communities that need them most. ✔JOB STANDARDS AND WAGE GAINS: The job standards won in the new three-year plan are an economic victory for Massachusetts’s weatherization workers. Many of them have been living in poverty and this “low-road” industry has been a drain on state resources. CLU/GJC’s direct negotiations with the utilities resulted in strong jobs standards. NSTAR and National Grid, the state’s two largest utility companies, now have responsible contracting provisions in
23 “2013-2015 Massachusetts Joint Statewide Three-Year Electric and Gas Energy Efficiency Plan.”24 Using minimum wage multiplier of .53, which represents53 cents of every dollar earned by low-income workers that is immediately reinjected into the economy. Gable, Mary. “A Massachusetts minimum-wage increase would help working families and generate jobs.” Economic Policy Institute. August 21, 2012. http://www.epi.org/publication/ib340-massachusetts-minimum-wage-increase/.25 60 FTE jobs per year, or 60 job year per year, 120 job years over the course of the 2013-2015 3-year plan.26 Jobs and wages estimated using a minimum wage multiplier effect of .53 (53 cents of every dollar of a low-income wage earner is in-jected back into the economy) http://www.epi.org/publication/ib340-massachusetts-minimum-wage-increase/#_note8 and median wage for Massachusetts http://www.bls.gov/oes/current/oes_ma.htm
ENERGY EFFICIENCY AND EQUITY: BREAKTHROUGHS AND INNOVATIONS 11
the participation agreements that govern all of their work through Mass Save. These agree-ments cover their lead vendor, Conservation Services Group, and all subcontractors. These provisions:
• Require that all contractors disclose any past history of violations – wage & hour laws, health & safety laws, labor law, etc. – and require them to sign an agreement stating that they are in compliance with all federal and state wage and benefit laws and regulations, as well as in compliance with federal and state workplace health and safety laws and regulations.
• Disqualify contractors who use discriminatory business practices and require notification to contractors that they are expected to follow the law.
• Obligate the utilities to send inspectors out to look for health and safety violations on the job.• Recommend that the utilities also inspect working conditions during regular quality control
inspections. • Direct the utilities to work with CLU/GJC to eliminate contractors who misclassify workers
as independent contractors.• Require Building Performance Institute certification for contractors, which ensures con-
tractors meet high industry standards.• Pay contractors to send more workers to trainings.• Prevent contractors from arbitrarily firing or not hiring a worker for having a criminal
record and instead require them to look for a correlation between the offense and the nature of the work. Enforcement mechanisms are strong. If contractors lie about past violations, their con-
tracts will be terminated. If CLU/GJC finds contractors who are in violation, the matter can be taken directly to NSTAR or the lead vendor. CLU/GJC wrote the initial draft recommenda-tions and worked directly with NSTAR to get this same language into all contracts.
Mass Save’s lead vendor, Conservation Services Group, also signed a Responsible Contractor agreement with CLU/GJC. Two large weatherization contractors, The Aulson Company and InsulPro, signed similar responsible employer agreements. Next Step Living, the primary weatherization contractor for the City of Boston’s Renew Boston program, has also signed a Memorandum of Understanding pledging to subcontract 25% of all work to union contractors who hire locally in the city of Boston through our coalition. Under this agreement, Next Step Living’s hourly wage and benefit package rose to a weighted average of $23.82 per hour, up from $16.43, meaning the average worker saw a wage hike of $7.39 per hour – an increase of 45%. This means the 26 employees of Next Step Living and its subcontractors saw their total wages rise $391,966 upon signing of this agreement.27
The utilities estimate that every million dollars in residential incentives (i.e. rebates) sus-tains 12 full-time jobs in the field. Overall, that means there will be as many as 2,010 weather-ization workers employed through Mass Save each year over the next three years. Based on the current proportion of work done by Next Step Living subcontractors, we estimate that at least 75 workers will be working for NSL, and will therefore be paid at least the prevailing wage of $22/hour in wages and benefits.28
Misclassification and wage theft are rampant in the construction industry and are two of the biggest sources of underpayment in the industry. Our agreements forbid contractors from misclassifying their employees as independent contractors and prevent wage theft by requir-ing contractors to pay workers for the work they perform. While there are no hard numbers on how many workers in the weatherization industry may have been misclassified before these CLU/GJC-initiated agreements went into effect, nearly half of all Massachusetts construction workers are misclassified each year.29Misclassification costs the average misclassified worker
27 Our agreements specify that contractors must pay the Davis-Bacon prevailing wage of $22 per hour.28 Estimate based on conservative estimated increases to Renew Boston program and expansion in NSL’s market reach. We have broken out the employees of Next Step Living (NSL) separately, because they are the only current signatory to CLU’s prevailing wage agreement, and are likely to take on a significant portion of EN+ CMI jobs via the City of Boston’s “Renew Boston” energy efficiency program and other planned expansion29 “2013-2015 Massachusetts Joint Statewide Three-Year Electric and Gas Energy Efficiency Plan.”
BUILDING A BRIGHTER DAY: ENERGY EFFICIENCY INNOVATIONS YIELD HIGH RETURNS FOR THE COMMONWEALTH12
almost 15% of his annual wages, including the extra payroll taxes that he pays.30 We estimate $10.8 million in increased wages due to correct classification of weatherization workers over three years.
Wage theft, in the form of off-the-clock work, impacts an estimated 72.2% of residential con-struction workers, and can cost those affected an average of 1 hour of pay each week.31 Likewise, employers illegally withhold “time-and-a-half ” overtime pay for 70.5% of residential construc-tion workers, who work over 40 hours in a week. This deprives workers of an average of 11 hours of an extra half of their hourly wage. We estimate our agreements will put $4.7 million in overtime pay each year back into workers’ wallets. Overall, the gains we have made will ensure an estimated $14.3 million in collective wage gains for weatherization workers each year. ✔ECONOMIC BENEFITS TO THE COMMONWEALTH: Ultimately, low-wage jobs force taxpayers to foot the bill for a range of state and federal social support services. For instance, a weatherization worker who earns $10 an hour, or $20,800 per year, is barely earning above the federal poverty level, and qualifies for a broad of public benefits. We estimate that subsidies for the earned income tax credit, childcare, section 8 housing, Medicaid, SNAP (food stamps) and — ironically — fuel assistance would have cost the general public nearly $90 million over
the next three years without our job standards improvements. That places the savings to taxpayers from CLU/GJC-negotiated wage increases for weatherization workers at nearly $16.2 million. (See Chart D.)
When employers misclassify workers or steal their wages, they are often cheating the state as well, meaning that taxes and fees go unpaid.
Misclassification in the construction industry costs the state millions of dollars per year in unpaid unemployment insurance contributions, lost income tax revenues, and workers’ com-pensation premiums each year.32 As we discuss above under “job creation,” workers will turn around and spend much of these wages that will now go into their pockets, which generates sales tax revenue for the state. Altogether, improved standards won by CLU/GJC that prevent misclassification could inject public coffers with as much as $16.1 million in additional rev-enue, including tax, income tax, workers’ compensation and unemployment payments. (See Chart E.)
Meanwhile, the jobs created indirectly from the increased wages of weatherization work-ers and increased household income by EN+ participants will add hundreds of thousands of dollars in state income tax revenue, and EN+ participant spending will also generate addi-tional sales tax revenues. Overall, we estimate that the revenue increases, savings on public benefits and wages and revenue from indirect job creation that come as a result of our efforts could contribute more than $44.4 million to the Massachusetts economy over the lifetime of the EN+ weatherization retrofits.
30 Carré F and Wilson R. The Social and Economic Costs of Employee Misclassification in Construction. Center for Social Policy, McCormack Graduate School of Policy Studies, University of Massachusetts Boston, 2004. http://www.lecet.org/legislative/misclassi-fication%20report.pdf Chaliffe, Deborah. “Backgrounder: Worker Misclassification Cheats Everyone.” Change to Win. http://www.nelp.org/page/-/UI/UI%2520Conference/Chalife.Misclassification%2520Backgrounder%2520.pdf&sa=U&ei=sKR2UdXAELao4AOFqoDwB-g&ved=0CBwQFjAB&sig2=fvLfvdObVyrs8Azo05LE_Q&usg=AFQjCNHyQ-0nPCmIvMM1t8H03a5Cp41Gyw31 Bernhardt A, et al. “Broken Laws, Unprotected Workers.” National Employment Law Project. New York: NELP, 2009. http://www.nelp.org/page/-/brokenlaws/BrokenLawsReport2009.pdf ?nocdn=132 Commonwealth of Massachusetts Joint Task Force on the Underground Economy and Employee Misclassification. Annual Report 2009. Executive Office of Labor and Workforce Development, June 2009.
Massachusetts could gain $40 million in revenue due to CLU/GJC’s economic gains and
jobs standards improvements.
PROJECTED HEALTH GAINS 13
Projected health gainsFor working-class and environmental justice communities, the health impacts of our fossil-fu-el-driven economy can be a matter of life and death. Our victories have the possibility to bring public health improvements to both weatherization workers and working class communities in Massachusetts. And because the impacts of clean air and greenhouse gas reductions are bigger than any one household or community, these are only some of the health-related gains that might be realized as a result of our efforts.
We start by focusing on the impacts of asthma at work and home, due to its prevalence, prevent-ability and the large amount of research related to its causes and remediation. However, asthma is just one of the many diseases caused by workplace hazards and the fossil fuel-driven economy, and the remediation measures suggested here may well alleviate a much broader array of ailments. (See Charts F-1 and F-2.)
✔THE ECONOMIC BENEFITS OF ASTHMA REDUCTIONS DUE TO RESIDENTIAL WEATHERIZATION: Because Americans spend an estimated 67% of their time in their homes33 a home’s indoor air quality has a big impact on health. Indoor air pollutants have been ranked among the top five environmental risks to public health. They can be 100 times more concentrated than pollutants outdoors.34 Indoor air quality in the home has been linked to a variety of diseases and dangers including asthma, cancer and carbon monoxide poisoning.35 Asthma in particular is strongly correlated with poverty and poor housing stock. Chronic exposure to allergens unique to the home environment – ranging from mold and moisture to cockroach and mouse allergens – can both cause asthma and trigger attacks.36
Children are particularly vulnerable to developing the disease; the 2009 hospitalization rate for children under age five in Roxbury was approximately 79% higher than the over-all Boston rate. Throughout the city, Black and Hispanic children under the age of five had consistently higher rates of hospitalization than the city average. Studies show that weather-ization can help prevent or mitigate asthma. Air sealing can keep out mice and cockroaches,37 while other weatherization techniques prevent new moisture penetration and improve house-hold ventilation.
People with asthma – particularly in lower income populations like those who might use EN+ – can sometimes have attacks that require an emergency room visit or even hospitaliza-tion. It turns out, however, that because the home environment has such an impact on asthma symptoms, weatherization can reduce hospital usage. One study conducted in Ohio found that remediation similar to pre-weatherization (mold and moisture remediation, venting of dryers, etc.) reduced emergency room visits by about two-thirds.38 A New Zealand study found that weatherization and pre-weatherization activities reduced hospital visits among the elderly for respiratory illness by 10% and reduced workers’ days off by 10% as well.
By targeting households at 60-120% of State Median Income for weatherization services, Massachusetts can make inroads in lowering the prevalence and severity of asthma in the state. Based on census tract data and figures from the Department of Public Health, an esti-mated 9.6% of the state population has asthma. However, while the EN+-eligible population is only 19% of the total population, it includes as many as two-thirds of those with current asthma in Massachusetts. Taking an average of the two studies, we can roughly estimate a
33 Though we focus on the impacts of asthma at work and home, it is just one of the many diseases caused by workplace hazards and the fossil fuel-driven economy, and the remediation measures suggested here may well alleviate a much broader array of ailments.34 Klepeis NE, et al. “The National Human Activity Pattern Survey (NHAPS): a resource for assessing exposure to environmental pollut-ants.” Journal of Exposure Analysis and Environmental Epidemiology. 11.3: 231-252, 2001.35 United States Environmental Protection Agency. “Questions About Your Community: Indoor Air.” Region 1: EPA New England. http:// www.epa.gov/region1/communities/indoorair.html36 Jacobs DE, et al. “Linking public health, housing, and indoor environmental policy: successes and challenges at local and federal agen-cies in the United States.” Environmental Health Perspectives. 115.6: 976, 2007.37 “Burden of Asthma in Massachusetts.”38 Breysse P, et al. “The relationship between housing and health: children at risk.” Environmental Health Perspectives. 112.15: 1583, 2004.
BUILDING A BRIGHTER DAY: ENERGY EFFICIENCY INNOVATIONS YIELD HIGH RETURNS FOR THE COMMONWEALTH14
conservative 38% reduction in asthma-related health services usage, which means that EN+ retrofits will keep 461 people out of the hospital over the lifetime of the 2013-2015 retrofits.39
Asthma care is not cheap. In Massachusetts, charges for acute care hospital use for asthma totaled over $136 million in 2006, and public insurance was the primary source of payment for 63% of those visits.40 We estimate that together, these reductions in hospital visits for asthma care could save Massachusetts $1.3 million in lifetime benefits. However, this estimate is low, because we still do not know the full extent that indoor air quality and temperature account for health service usage. For instance, while we could not find numbers broken out for hos-pitalization of the elderly due to cold homes, there are numerous studies that point to this population as extremely vulnerable to health problems when the heat is turned down. ✔THE ECONOMIC BENEFITS OF UTILITY BILL-RELATED SAVINGS: Energy costs are so high in the Northeast that some middle-income households are forced to turn down the heat to the point that it can be dangerous to their health. Other families face the cruel choice of buying groceries or keeping the heat on.
Not surprisingly, cold weather brings an increase in deaths, particularly for elderly residents of homes that have not been weatherized. Rather than a dramatic “freezing to death,” strokes and heart attacks result from changes in blood pressure or infections stemming from cold-re-lated suppression of the immune system. Chronically cold houses are also associated with increased risk of influenza, pneumonia, asthma, arthritis, and accidents in the home. The health effects of living in chronically cold houses are cumulative over time, and they become progres-sively more difficult to treat as people age.41
Very young children are especially vulnerable to cold. Living in a cold home has a signifi-cant impact on children’s respiratory health, and negatively affects both infant weight gain and resistance to illness. Children who live 3 years or longer in homes that lack affordable warmth are two to three times as likely to have respiratory ailments as children who do not. Children of these families more often find themselves in need of acute hospitalization in the winter.42
Infants living in cooler homes require more calories than average in order to both keep warm and grow at a normal rate. However, children of lower income families have lower caloric intake during the winter months than higher income families– as much as 200 fewer calories per day, on average.43 The effects of childhood malnutrition can be severe and persistent, including increased susceptibility to disease, and delayed mental development, poor school performance, and diminished earnings in adulthood.44
Bill savings from weatherization make it more likely that the household will turn up the thermostat back up, and can save lives in the process. A weatherized home protects the health of young children, both directly – through maintaining a higher interior temperature – and indirectly – through money saved that can be spent on food and medications. We know that reducing energy costs can improve nutrition, because infants from low-income families who received a winter fuel subsidy had significantly higher weight-for-age and lower risk for growth impeded by nutritional deprivation than did those from homes without a fuel subsidy. They also had lower odds of using the emergency room and were rated by caregivers as being in better health and of more advanced developmental status. We can infer that a family with reduced util-ity bills, much like a subsidy, will be more likely to spend the extra cash on groceries.45 Similarly, one British study estimated that heating and insulation improvements were associated with an average increase of 10 days to the life expectancy of older men and 7 days to the life of older women; extrapolated to the households that the utilities propose to serve over the next three years, dozens of life years could be saved.46
39 Chapman, Ralph, et al. “Retrofitting houses with insulation: a cost–benefit analysis of a randomized community trial.” Journal of Epi-demiology and Community Health 63.4 (2009): 271-277.40 “Burden of Asthma in Massachusetts.” Figures for 2006 are the most recent available. Therefore, our numbers are probably low, because we did not adjust for health care inflation or the estimated increase in asthma prevalence.41 Liddell C and Morris C. “Fuel poverty and human health: a review of recent evidence.” Energy Policy. 38.6: 2987-2997, 2010.42 Frank, Deborah A., et al. “Heat or eat: the Low Income Home Energy Assistance Program and nutritional and health risks among chil-dren less than 3 years of age.” Pediatrics. 118.5: e1293-e1302, 2006.43 Snyder, Lynne Page, and Christopher A. Baker. “Affordable Home Energy and Health: Making the Connections.” AARP Public Policy Institute. June, 2010.44 Frank, “Heat or Eat.”45 Frank, “Heat or Eat.”46 Liddell, “Fuel Poverty.”
PROJECTED HEALTH GAINS 15
While we know that warmer homes save lives and keep down health care costs in general, we do not yet have the data that show exact dollars saved when a home is weatherized here in the United States. We hope that research in this area continues, as it is critical to the intersection of public health and energy efficiency. ✔THE ECONOMIC BENEFITS OF WORKPLACE HEALTH AND SAFETY PROTECTIONS: Residential construction is one of the most dangerous occupations in the United States, and the materials used to insulate buildings – sprays, foams, and fine particles – create special hazards for weatherization workers. “As the foam is sprayed, small droplets of foam end up in the air,” reported one weatherization worker. “This stuff gets in your hair, in your skin, and on your clothes.”47 Both airborne and skin exposure can potentially trigger asthma symptoms, and workers may be exposed both during and after application.48 Work-related asthma can have deep economic effects for families, employers, and the state. Individuals with occupational asthma report unemployment rates as high as 25% and reductions in income following their diagnosis.49 As for the state, unscrupulous employ-ers often do not pay into the workers’ compensa-tion fund when their employees are injured but encourage them to use private or public health coverage instead.50 51 Those employers can file a claim under the state’s workers’ compensation insurance trust fund, driving up rates for law-abid-ing employers in the process.52
Avoiding workplace injuries and illnesses can cut these public and private health insurance costs. Health and safety training can cut those costs still further. CLU/GJC won ten hours of safety training for all weatherization workers in its agreement with Mass Save’s lead ven-dor, Conservation Services Group (CSG). The agreement covers weatherization contractors and subcontractors as well. Its enforcement mechanisms far exceed the oversight to which most residential construction is subject. The agreement will not only protect weatherization workers; it could set the stage for stronger health and safety measures throughout residential construction.
How effective is health and safety training? A study of the workers’ compensation claims submitted by the North Carolina Homebuilders Association and their subcontractors deter-mined a rate of 24.3 injuries for residential insulation workers per 200,000 hours worked, or 96 FTEs.53 An equivalent rate for the weatherization workers in Massachusetts covered by our agreements would be an injury rate of 509 per year. A study of union laborers found that those who received health and safety training were 12% less likely to file a workman’s compensation claim over a two-year period.54 Applying this to our pool of 2,010 estimated residential weath-erization workers, and using an estimate of $42,000 average per construction workplace injury or death in direct and indirect costs,55 we estimate that our health and safety training requirements could save the Commonwealth $7.7 million over the next 3 years in reduced injury and death. Public health insurance funds and the Department of Industrial Accidents’ Uninsured Employers Trust Fund, which covers workplace accidents when employers have not paid into the workers’ compensation system, will realize the bulk of these savings.
Proper protective equipment can cut additional medical costs. A Boston Public Health Commission study of auto body shops – where hazards and conditions resemble those on
47 Nicholson PJ, et al. “Evidence based guidelines for the prevention, identification, and management of occupational asthma.” Occupa-tional and Environmental Medicine. 62.5 (2005): 290-299.48 Bello D, et al. “Skin Exposure to Isocyanates: Reasons for Concern.” Environmental Health Perspectives. 115.3: 328, 2007.49 Massachusetts Department of Public Health Asthma Prevention and Control Program. “Burden of Asthma in Massachusetts.” Massa-chusetts Department of Public Health. April 2009. http://www.mass.gov/eohhs/docs/dph/com-health/asthma/state-plan.pdf.50 Lowery EP, et al. “Quality of life of adults with workplace exacerbation of asthma.” Quality of Life Research. 16.10: 1605-1613, 2007.51 Galizzi M. “On the Recurrence of Occupational Injuries and Workers’ Compensation Claims.” Health Economics. 2012.52 Commonwealth of Massachusetts Joint Task Force on the Underground Economy and Employee Misclassification. “2011 Annual Report.” Executive Office of Labor and Workforce Development. 2011. http://www.mass.gov/lwd/eolwd/jtf/.53 Dement, John M. “Workers’ compensation experience of North Carolina residential construction workers, 1986-1994.” Applied Occu-pational and Environmental Hygiene. 14.2: 97-106, 1999.54 Dong, Xiuwen, et al. “Effects of safety and health training on work-related injury among construction laborers.” Journal of Occupation-al and Environmental Medicine 46.12 (2004): 1222-1228.55 Kriebal, David, et al. “Lessons Learned Solutions for Workplace Safety and Health.” Lowell Center for Sustainable Production, Universi-ty of Massachusetts Lowell. January 2011.
Proper protective equipment could help avoid the equivalent of nearly 1,000 lost days of work.
BUILDING A BRIGHTER DAY: ENERGY EFFICIENCY INNOVATIONS YIELD HIGH RETURNS FOR THE COMMONWEALTH16
weatherization worksites – found that health and safety training increased workers’ use of adequate respirators by 12-14%.56 For the 66 workers currently covered by our agreements that we estimate have occupational asthma, health and safety standards and training could eliminate many instances of health services usage each year, ranging from doctor visits to hos-pitalization, as well as 796 lost days of work and an average of 0.9 hours of work lost each day due to working while ill (“presenteeism”).57 58 We estimate that this could save over $100,000 in reduced asthma treatment over three years and prevent the equivalent of nearly 1,000 lost days of work over the course of the 2013-2015 plan. ✔THE ECONOMIC POTENTIAL OF MITIGATING GHG EMISSIONS: The best way to calcu-late the cost of damages related to climate change per ton of carbon emissions is a matter of
intense global debate. A range of useful – if imperfect – proxies for estimating ”social cost of carbon” has been developed by the EPA Interagency Working Group. This measurement takes into account avoided future costs to agriculture, environmental damage and human health, among other consider-ations. We used the midpoint of the values identified in the paper, $20.28 per ton of carbon.59 Applying that number to the nearly 85,000 tons of carbon EN+ could save the Commonwealth gives us an estimated
lifetime economic benefit of $1.7 million.There may be other health benefits to reducing our carbon emissions. For instance, neigh-
borhoods near fossil fuel power plants experience worse health effects from any emitted pol-lutants. Not surprisingly, these communities are often low-income communities of color that already suffer a higher burden of disease. By weatherizing homes and thus cutting total power plant emissions we can reduce air pollution and improve the health of these neighborhoods.
Massachusetts utility companies estimate that greenhouse gas reduction achieved by the next three-year energy efficiency plan will be equivalent to taking approximately 398,700 cars off the road or eliminating the output of a 460 MW power plant for one year, or 25,632,813 tons of carbon.60 We estimate that CLU/GJC efforts over the next three years could account for a lifetime reduction of 84,070 tons altogether.61
These are impressive figures and CLU/GJC joined a larger set of advocates to set them. We are proud to have helped push for the higher efficiency standards that made this goal a requirement, and proud to have contributed meaningful policy solutions to help achieve those goals. Ultimately, our impact will not stand out from anyone else’s but we will feel it in lives saved and local economies that thrive.
56 Shoemaker PA, et al. “The Boston Safe Shops Project—Preliminary Findings of a Case Study in Applying the 10 Essential Services of Public Health to Building Environmental Health Capacity.” Journal of Environmental Health–Denver. 70.1:22, 2007.57 “Burden of Asthma in Massachusetts.” Based on an estimated prevalence among painters of 3.3%, the closest category of worker identi-fied, and an estimated 9.5% of those with work related asthma who visited the ED at least once in the last 12 months.58 Goetzel, Ron Z., et al. “Health, absence, disability, and presenteeism cost estimates of certain physical and mental health conditions affecting US employers.” Journal of Occupational and Environmental Medicine 46.4 (2004): 398-412.59 Aubuchon Craig and Hibbard Paul. “Summary of Quantifiable Benefits and Costs Related to Select Targeted Infrastructure Replace-ment Programs.” Analysis Group, Inc. January, 2013. http://www.analysisgroup.com/uploadedFiles/Publishing/Articles/Benefits_Costs_TIRF_Jan2013.pdf60 “2013-2015 Massachusetts Joint Statewide Three-Year Electric and Gas Energy Efficiency Plan.”61 Using estimates of 223 therms and 798 kwhs saved per house. Mendyk A, et al. “Wisconsin Weatherization Assistance - Evaluation of Program Savings Fiscal Years 2007-2009.” June 2001. http://homeenergyplus.wi.gov/docview.asp?docid=22311Converted to tons of car-bon at United States Environmental Protection Agency. “Greenhouse Gas Equivalencies Calculator.” Environmental Protection Agency Clean Energy Programs. http://www.epa.gov/cleanenergy/energy-resources/calculator.html#results
CLU efforts over the next three years account for an estimated lifetime
reduction of 84,070 tons of carbon emissions. The estimated economic
benefit is over $1.7 million.
OVERALL COST-EFFECTIVENESS 17
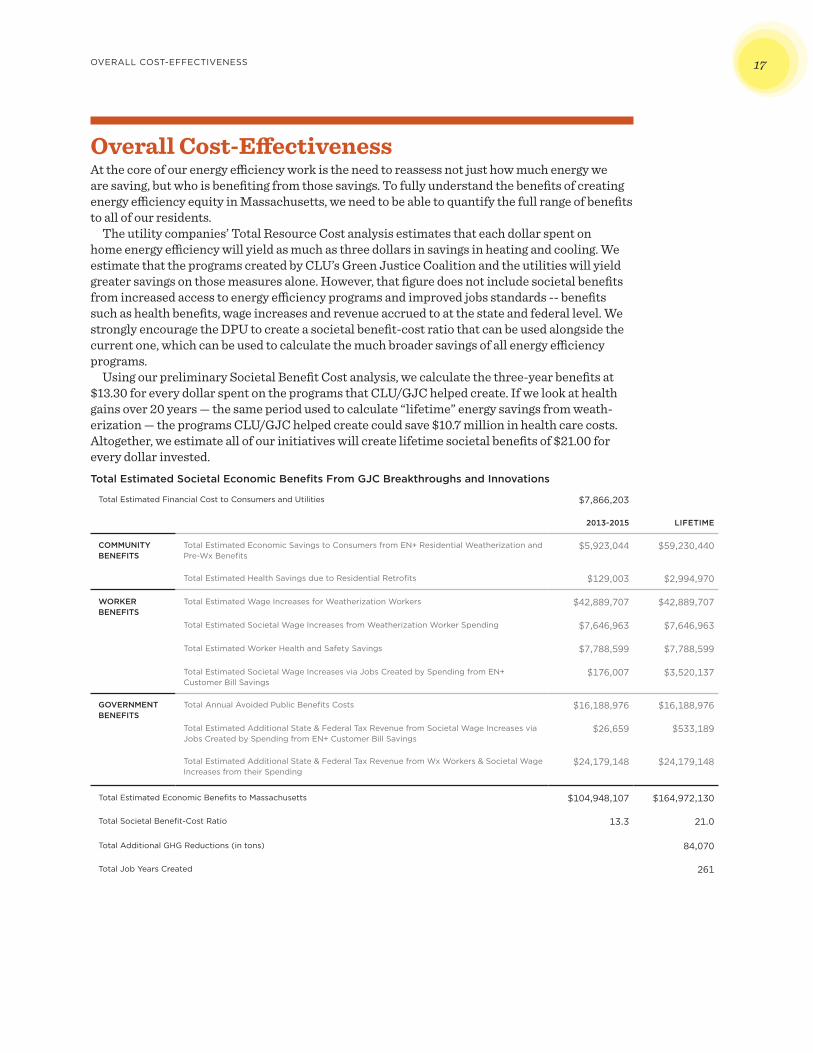
Overall Cost-Effectiveness At the core of our energy efficiency work is the need to reassess not just how much energy we are saving, but who is benefiting from those savings. To fully understand the benefits of creating energy efficiency equity in Massachusetts, we need to be able to quantify the full range of benefits to all of our residents.
The utility companies’ Total Resource Cost analysis estimates that each dollar spent on home energy efficiency will yield as much as three dollars in savings in heating and cooling. We estimate that the programs created by CLU’s Green Justice Coalition and the utilities will yield greater savings on those measures alone. However, that figure does not include societal benefits from increased access to energy efficiency programs and improved jobs standards -- benefits such as health benefits, wage increases and revenue accrued to at the state and federal level. We strongly encourage the DPU to create a societal benefit-cost ratio that can be used alongside the current one, which can be used to calculate the much broader savings of all energy efficiency programs.
Using our preliminary Societal Benefit Cost analysis, we calculate the three-year benefits at $13.30 for every dollar spent on the programs that CLU/GJC helped create. If we look at health gains over 20 years — the same period used to calculate “lifetime” energy savings from weath-erization — the programs CLU/GJC helped create could save $10.7 million in health care costs. Altogether, we estimate all of our initiatives will create lifetime societal benefits of $21.00 for every dollar invested. Total Estimated Societal Economic Benefits From GJC Breakthroughs and Innovations
Total Estimated Financial Cost to Consumers and Utilities $7,866,203
2013-2015 LIFETIME
COMMUNITY BENEFITS
Total Estimated Economic Savings to Consumers from EN+ Residential Weatherization and Pre-Wx Benefits
$5,923,044 $59,230,440
Total Estimated Health Savings due to Residential Retrofits $129,003 $2,994,970
WORKER BENEFITS
Total Estimated Wage Increases for Weatherization Workers $42,889,707 $42,889,707
Total Estimated Societal Wage Increases from Weatherization Worker Spending $7,646,963 $7,646,963
Total Estimated Worker Health and Safety Savings $7,788,599 $7,788,599
Total Estimated Societal Wage Increases via Jobs Created by Spending from EN+ Customer Bill Savings
$176,007 $3,520,137
GOVERNMENT BENEFITS
Total Annual Avoided Public Benefits Costs $16,188,976 $16,188,976
Total Estimated Additional State & Federal Tax Revenue from Societal Wage Increases via Jobs Created by Spending from EN+ Customer Bill Savings
$26,659 $533,189
Total Estimated Additional State & Federal Tax Revenue from Wx Workers & Societal Wage Increases from their Spending
$24,179,148 $24,179,148
Total Estimated Economic Benefits to Massachusetts $104,948,107 $164,972,130
Total Societal Benefit-Cost Ratio 13.3 21.0
Total Additional GHG Reductions (in tons) 84,070
Total Job Years Created 261
BUILDING A BRIGHTER DAY: ENERGY EFFICIENCY INNOVATIONS YIELD HIGH RETURNS FOR THE COMMONWEALTH18
How CLU/GJC SucceededEarlier in this report we described the multiple challenges in reforming Massachusetts’s com-plicated energy efficiency program. CLU needed a strong game plan to address these challenges. Because the world of energy policy can move so slowly, the coalition would need to endure and be able to evolve in order to see results. Rather than calling on allies to endorse a campaign plan developed entirely by staff, CLU took on the more challenging task of building consensus and developing long-term bonds among our member organizations.
Building a Strong Coalition The Steering Committee, the official decision-making body of the Green Justice Coalition (GJC), is composed of community organizations, labor unions, and environmental groups organizing in working-class communities. Steering Committee partners must be membership-based organiza-tions, committed to taking a leadership role and actively engaging their staff and members in the campaign. One Steering Committee member observed: “[This is] different from some traditional coalitions where there is no base, or others that are just a turn-out engine.”62
From the beginning, CLU worked hard to use each organization’s strong points to complement the work of the whole. CLU is the convener and driver of the Green Justice Coalition—facilitat-ing campaign meetings, conducting strategic research to inform recommendations, mapping out strategies and tactics, handling internal and external communications, and monitoring bench-marks and goals. Environmental and consumer advocates, such as Mass Energy and Clean Water Action, contribute technical knowledge and credibility on global warming, power plants and en-ergy policy. They were closely involved in the effort to pass the state’s historic climate legislation in 2008, and they bring long-standing connections to other advocacy and service organizations, knowledge of the players and connections with key government officials.
The trade unions bring their own technical knowledge and political connections. The Painters and Carpenters unions understand the building trades and weatherization work and have the capacity to train workers for weatherization jobs. Trade union leaders in GJC also have valuable connections to key policy makers, especially in the Massachusetts legislature. Meanwhile work-ers’ centers, like those run by the Chelsea Collaborative and Chinese Progressive Association, can tell the compelling stories of low-wage, immigrant workers.
Community-based organizations are well known and trusted in the neighborhoods that they represent. Their work ranges from organizing for safe, affordable housing, to job access and education, often offering services in native languages to immigrant families. They know their constituents well, providing invaluable and credible expertise on the needs of their communities.
From the beginning, CLU staff held individual meetings with member organization leaders to surface hopes and concerns and to work on solutions. As Mark Liu of the Chinese Progressive Association puts it, “Because CLU had worked one-on-one with each group, the people there really wanted to be there, were there for the right reasons. The level of commitment was already there, people came ready to work.”63
CLU also strengthened relationships between GJC members by gradually and deliberately surfacing issues that could have torn the Coalition apart, such as “jobs vs environment” and long-standing tensions between building trades unions and communities of color. 62 Taylor, Madeleine and Fried, Mindy. “Rapid Assessment of the Green Justice Coalition: Summary of Findings.” Arbor Consulting Partners. March 13, 2012.63 Liu, Mark. Personal interview. September 25, 2012.
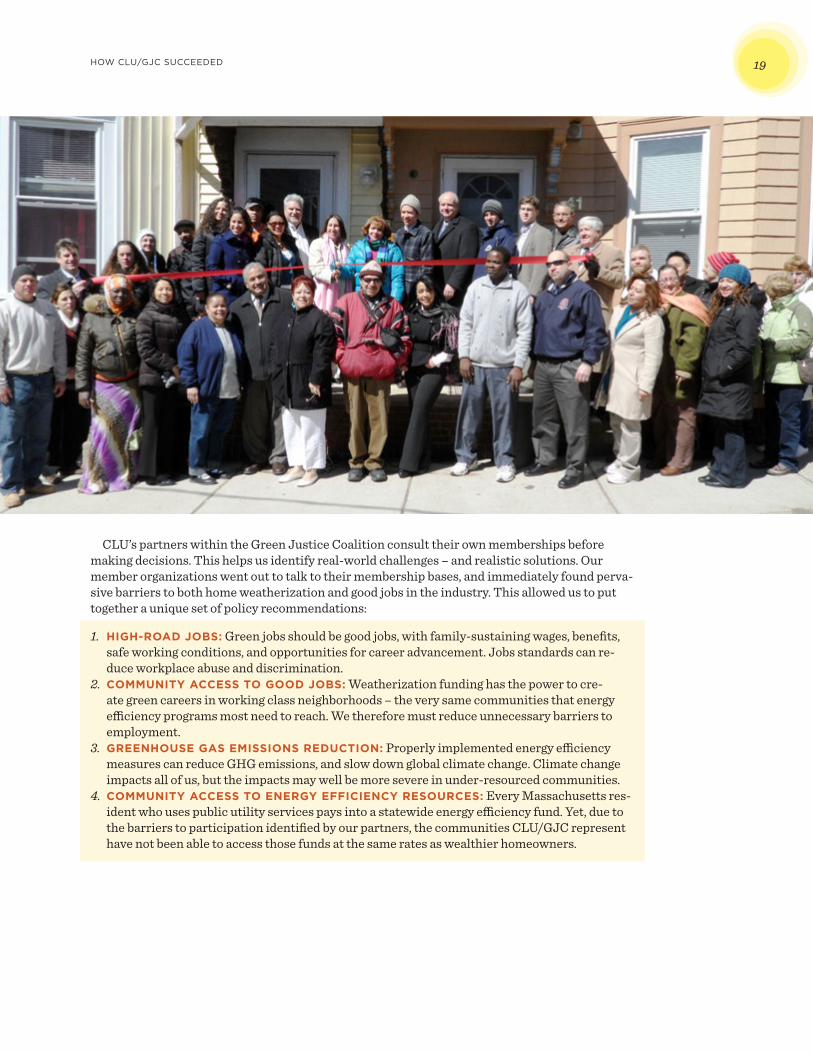
HOW CLU/GJC SUCCEEDED 19
CLU’s partners within the Green Justice Coalition consult their own memberships before making decisions. This helps us identify real-world challenges – and realistic solutions. Our member organizations went out to talk to their membership bases, and immediately found perva-sive barriers to both home weatherization and good jobs in the industry. This allowed us to put together a unique set of policy recommendations:
1. HIGH-ROAD JOBS: Green jobs should be good jobs, with family-sustaining wages, benefits, safe working conditions, and opportunities for career advancement. Jobs standards can re-duce workplace abuse and discrimination.
2. COMMUNITY ACCESS TO GOOD JOBS: Weatherization funding has the power to cre-ate green careers in working class neighborhoods – the very same communities that energy efficiency programs most need to reach. We therefore must reduce unnecessary barriers to employment.
3. GREENHOUSE GAS EMISSIONS REDUCTION: Properly implemented energy efficiency measures can reduce GHG emissions, and slow down global climate change. Climate change impacts all of us, but the impacts may well be more severe in under-resourced communities.
4. COMMUNITY ACCESS TO ENERGY EFFICIENCY RESOURCES: Every Massachusetts res-ident who uses public utility services pays into a statewide energy efficiency fund. Yet, due to the barriers to participation identified by our partners, the communities CLU/GJC represent have not been able to access those funds at the same rates as wealthier homeowners.
BUILDING A BRIGHTER DAY: ENERGY EFFICIENCY INNOVATIONS YIELD HIGH RETURNS FOR THE COMMONWEALTH20
Key StrategiesThe coalition created a multi-pronged approach that engaged key stakeholders and changed the dialogue on equity, green jobs and climate change. Our members’ wide-ranging strengths allowed us to use a wide variety of strategies. Below are key ways we approached our work:
✔GETTING ALLIES ON THE INSIDE: Our members’ connections with key legislators, ad-ministration officials, and other policy players were instrumental to our policy work. For instance, these connections helped to get a long-time ally, Penn Loh, on the EEAC. Penn, a professor of urban planning and environmental policy at Tufts University, is the former Executive Director of ACE. Penn brings an equity perspective to the EEAC and builds active relationships between CLU and EEAC members. He notified us when the EEAC created ad hoc committees, giving us time to request seats on those committees and assemble a case for our recommendations. ✔MOBILIZING OUR BASE: CLU/GJC’s member organizations do not just reach out to their members. They organize them through education and leadership development. They involve members in developing proposals that we then drive forward as a coalition. Our grassroots strength comes not just from the number of people we can mobilize, but from the quality and depth of our recommendations that come directly from our grassroots base.
Because our members were involved at every step, they moved our proposals forward when they stalled. Our community members:
• Knocked on hundreds of doors and collected thousands of postcards• Organized educational events in their neighborhoods• Turned out by the hundreds to attend EEAC meetings and tell their own personal stories
about how barriers to jobs, poor working conditions and lack of access to energy efficiency programs impact their everyday lives
• Joined delegations to make our case to the utilities, EEAC members, and staff at the DOER, the Attorney General’s office, and the Department of Labor
• Participated regularly in EEAC meetings and subcommittee meetings, and effectively impacted their policy debates
✔THINKING CREATIVELY: Weatherizing one home at a time will not create many jobs, and it will not reach Massachusetts’s weatherization goals. CLU/GJC partner organizations came up with a new approach , and the utilities agreed to help design, fund, and analyze a pilot program to see if it would work. This model — the Community Mobilization Initiatives (CMI) — was developed through discussions with established community organizations and their grassroots base. Those organizations coordinated the initial outreach and education in their neighborhoods, then bundled scores of homes into one big weatherization project. Then they worked with a trade union or local cooperative to bring in a responsible contractor committed to local hiring and establishing career pathways for new workers.
To put together the pilots, we moved quickly from an advocacy role to mastering the com-plexities of program administration. We needed to pinpoint what worked — and what didn’t — about this model. Layers of administrative bureaucracy had to be peeled away to find exactly where our constituents got lost in the Mass Save process.
The learning curve was steep. Out of 188 households that signed up for weatherization between November 2010 and August of 2011 through the Chelsea and Chinatown pilots, only 27 had completed the process by the time the program was officially evaluated. In the end, however, these pilots identified solutions to key obstacles, and cost-effectively weatherized over 450 homes. This included funding for pre-weatherization fixes, streamlining outreach to tenants and homeowners, and consolidating the complex qualification process. Ultimately, we showed that our new model could work well in “hard to reach” communities. It is not just our members who appreciate our ability to shift roles and think outside the box; Jeremy
HOW CLU/GJC SUCCEEDED 21
McDiarmid from Environment Northeast and a member of the EEAC commented, “It was im-pressive — the speed with which they were able to understand the dynamics and landscape and not be just a set of activists who complained without providing solutions. They offered solutions in a way that won the respect of folks around the table.”64
✔USING DATA TO GAIN CONSENSUS: The CMIs also built relationships with utility exec-utives and program managers, which we then used to get past other barriers. “Everyone was trying to reach HTR/HTS [customers], but we were stuck, particularly around pre-weather-ization issues,” said Penni Connor, Chief Customer Officer at Northeast Utilities (NSTAR). “CLU was able to bring peoples’ stories and to help gather data on the ground. Their commu-nity-based process complemented our market segmentation analysis. That allowed NSTAR to get a brokered deal with DOER on pre-weatherization, we broke through that logjam.”65
✔ENGAGING THE LEGAL/REGULATORY SYSTEM: We learned how to navigate the state’s complicated regulatory process, weighed in on DPU proceedings, filed comments and legal briefs reflecting CLU/GJC recommendations with the DPU, and even explored possible lawsuits. ACE’s tireless legal team, their credibility and experience made our legal/regulatory strategy possible. ✔USING THE LEGISLATIVE PROCESS: DOER, CLU/GJC, and other stakeholders recog-nized the need for utility data to identify populations that weren’t accessing energy efficiency programs. For help obtaining those data, we turned to the Legislature. CLU/GJC organized thirty-three state representatives to cosponsor An Act Regarding Community Access to Energy Efficiency Programs and Green Jobs. This bill required the utilities to provide data on who is accessing their energy efficiency programs, who is getting weatherization jobs, whether they are hiring locally, and how they are implementing responsible contracting policies. The bill also mandated ambitious benchmarks for equity of access and total weatherization goals.
We organized over 100 members of our coalition to attend a state hearing on the bill, trained community members to lobby and speak with their elected officials about energy efficiency. Our coalition leaders met with DOER and the AG’s office to gain their support. This momentum encouraged the utilities to participate in a data collection symposium sponsored by DOER. The next three-year energy efficiency plan includes funding to set up the database we need. ✔GETTING CONTRACTORS ON BOARD: Using union connections, CLU/GJC recruited contractors for the CMI pilots who had good relationships with unions and were looking to increase their share of the residential market. These connections allowed us to demonstrate to policy makers, the utilities and to other contractors that residential weatherization was financially workable for a high-road employer.
It was also important to win over lead vendors, the organizations that schedule initial au-dits and subcontract weatherization work. Community groups in our coalition won over Sam Nutter from Conservation Services Group during the CMI pilots. As he says, “The number one definitive lesson learned is that these community groups can reach into these neighborhoods, with these populations … I think that without a doubt they’ve proven an ability to reach into those neighborhoods where the traditional marketing had not been as successful.” 66 ✔BUILDING CONSENSUS WITH UTILITY EXECUTIVES AND OTHER DECISION-MAKERS: While organizing the grassroots is the core of our campaign work, the good rela-tionships we have forged with key players in the energy efficiency arena have moved our work forward. Those relationships developed in several stages.
64 McDiarmid, Jeremy. Personal interview. September 27, 2012.65 Connor, Penni. Personal interview. September 21, 2012.66 “Evaluation of the Green Justice Coalition’s Community Mobilization Initiative.”
BUILDING A BRIGHTER DAY: ENERGY EFFICIENCY INNOVATIONS YIELD HIGH RETURNS FOR THE COMMONWEALTH22
The Community Mobilization Initiatives brought us in close contact with utility execu-tives and program managers for more than a year. As a working relationship developed, they began realizing that we were ready to dig in and work on real, concrete solutions to problems the utilities themselves had been raising. The CMI process made us their colleagues.
The Hard to Reach/Hard to Serve Charrette deepened that collaborative relationship. The CMIs exposed a string of barriers to energy efficiency work in HTR/HTS communities. We kept bringing up those barriers, but the EEAC was unable to focus on them and resolve them. Finally we proposed an extended working meeting – a charrette – where the most interested parties could step back and brainstorm solutions to the entire range of HTR/HTS barriers. The charrette was highly successful; it developed many of the changes that are now incorpo-rated into the state’s next three-year energy efficiency plan; and it deepened our relationship with utility executives and program managers.
The Department of Energy Resource’s Data Symposium was the result of long discussions between CLU/GJC, the Department of Energy Resources (DOER) and the Attorney General’s office. We worked closely with Tina Halfpenny at the DOER to create the symposium. It ultimately led not only to the funding that the utilities allocated in the 3-year plan for database administration, but also to a recent DPU ruling that directed the utilities to come to a consen-sus with CLU/GJC, the DOER, and other stakeholders on this key issue.
Our job agreements showed the strength of the relationships we built with utility program officers. Raising wages and job standards in the low-road weatherization industry was a very important objective for our coalition. NSTAR executive Penni Connor pushed for incorpo-rating our jobs standards into agreements with Mass Save’s lead vendor and subcontractors. Collaboration with Ms. Connor was instrumental in winning those agreements. She kindly notes that CLU/GJC takes the time to meet face to face to talk about agenda priorities. She reiterated, “I value that.”67
“This campaign was ultimately co-operative and very unusual. After the first 3-year plan, CLU had an award ceremony. We had NSTAR execs there with low-wage work-ers and their advocates and labor unions. CLU used strong campaign tactics, but in the end the goodwill and mutual respect was something I’ve very rarely seen.” — Rich Rogers, Secretary-Treasurer, Greater Boston Labor Council68
✔EQUITY ADVOCACY: We won credibility with state officials and environmental leaders by joining the fight for energy efficiency and greenhouse gas reduction. But we also won credibili-ty by bringing a new dimension to the discussion – equity. We made our equity focus a win-win that would achieve both climate goals (by making it possible for one-third of the state’s families to weatherize their homes) and social justice goals. That perspective is now a solid part of the EEAC’s and utility companies’ work. Western Mass Electric Company executive Dick Oswald says it’s been very moving to have local residents come to EEAC meetings to tell their “actual situation. You sit there and listen to a Chinese gentleman talk through an inter-preter and it’s hard to dispute the issues they’re faced with.”69
Working relationships like these led to real gains that simply could not have happened otherwise.
67 “Rapid Assessment of the Green Justice Coalition: Summary of Findings.”68 Rogers, Rich. Personal interview. September 25, 2012.69 “Evaluation of the Green Justice Coalition’s Community Mobilization Initiative.”
THE ROAD AHEAD 23
The Road Ahead In the future the Commonwealth should rely even more on energy efficiency programs to meet the targets in the Clean Energy and Climate Plan, maximizing the economic and social returns on energy efficiency investments that we have documented in this report.
The Massachusetts 2013-2015 energy efficiency plan is a success. But, it is a success we can use to chart a course that will help us achieve even greater cost and energy efficiency in the future.
The state must allocate more funds for outreach to our communities if we are to achieve true green equity.
We must continue working with our partners to improve jobs standards.We need data collection so that we can better analyze where our energy efficiency dollars are
going and how effectively they are being used.We want Massachusetts to adopt our societal benefit-cost measures to estimate its energy
efficiency gains.Greater alliances with the public health community can strengthen and amplify the al-
ready-impressive health impacts.And of course we must monitor the implementation of our gains to assure that they come to
fruition as planned.Over the past three years we have created a model that improves wages, benefits, safe-
ty, and opportunity for even higher jobs standards in one of the lowest-wage industries in Massachusetts. Through agreements that prevent misclassification and wage theft, and by using penalties and monitoring to enforce those agreements, we have brought a shadow industry into the sunlight. In the process, we have supported working class families and communities of color as they take the lead in building a greener future with equity at the center.
The model is not complicated. We are disseminating it through national networks including the Partnership for Working Families and the Blue-Green Alliance. Unions, community organi-zations, and coalition projects like ours can use it to win similar agreements in other parts of the country. They can also apply it to other sectors of the construction industry that are plagued by misclassification, wage theft, and low-wage worker exploitation.
“Let’s celebrate the successes! [There is] a lot of harmony between [CLU’s] values and ours. This model can be applied in other states as well. Connecticut, for instance, wants to be #1 in energy efficiency. We at NSTAR are working with them to file a three-year plan in November with a huge increase in energy efficiency goals.”— Penni Connor, Chief Customer Officer, Northeast Utilities70
We have come far, and though challenges remain, the Green Justice Coalition is up to the task. The relationships, respect, and leadership we have developed are the bedrock for more accom-plishments in the years ahead.
70 Connor, Penni. Personal interview. September 21, 2012.
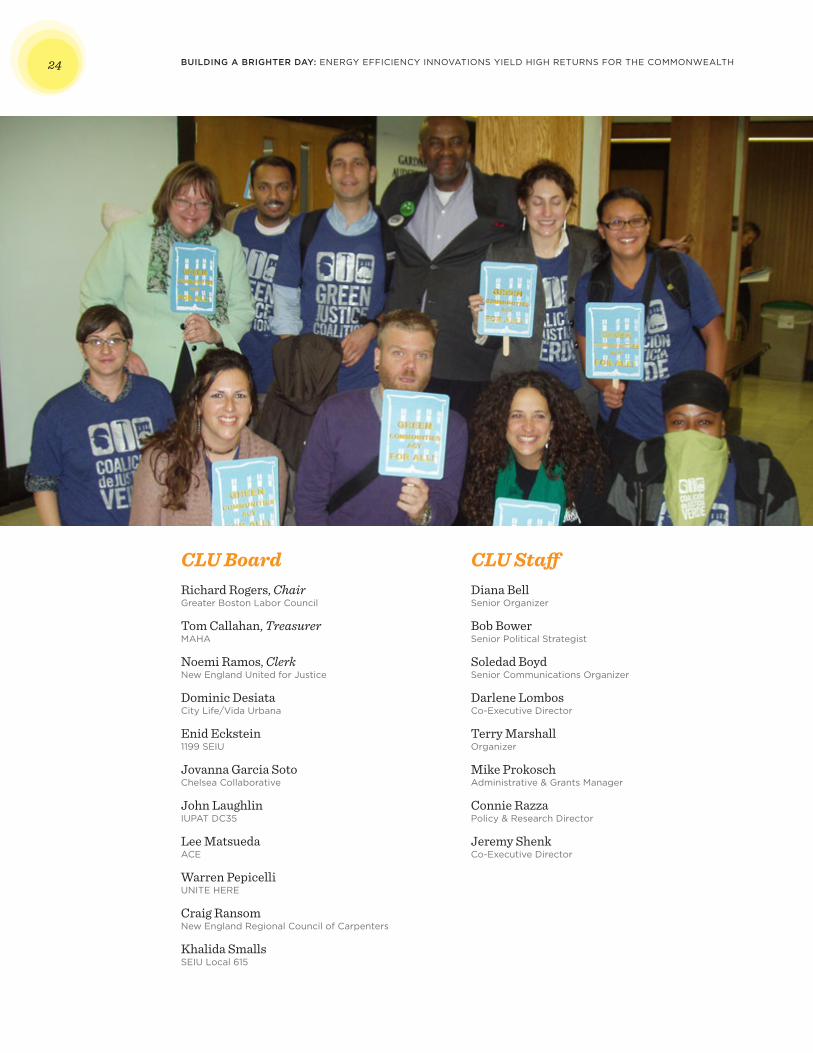
BUILDING A BRIGHTER DAY: ENERGY EFFICIENCY INNOVATIONS YIELD HIGH RETURNS FOR THE COMMONWEALTH24
CLU BoardRichard Rogers, ChairGreater Boston Labor Council
Tom Callahan, TreasurerMAHA
Noemi Ramos, ClerkNew England United for Justice
Dominic DesiataCity Life/Vida Urbana
Enid Eckstein1199 SEIU
Jovanna Garcia SotoChelsea Collaborative
John LaughlinIUPAT DC35
Lee MatsuedaACE
Warren PepicelliUNITE HERE
Craig RansomNew England Regional Council of Carpenters
Khalida SmallsSEIU Local 615
CLU StaffDiana BellSenior Organizer
Bob BowerSenior Political Strategist
Soledad BoydSenior Communications Organizer
Darlene LombosCo-Executive Director
Terry MarshallOrganizer
Mike ProkoschAdministrative & Grants Manager
Connie RazzaPolicy & Research Director
Jeremy ShenkCo-Executive Director
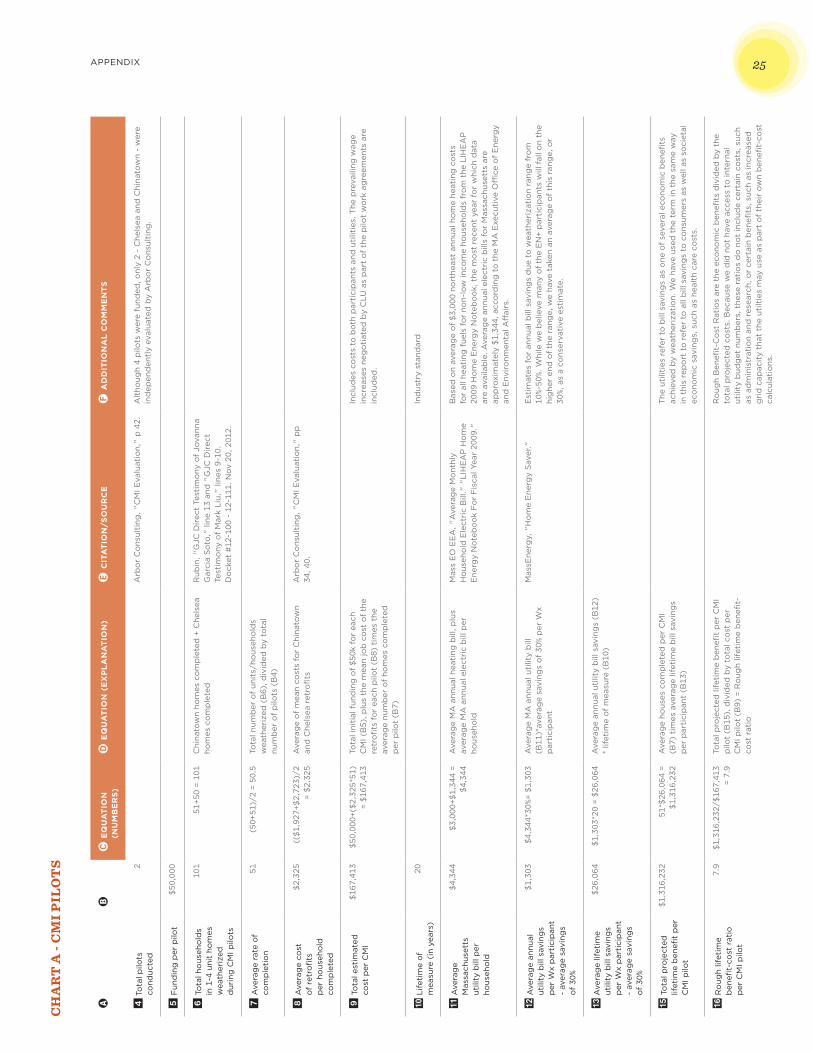
APPENDIX 25
AB
C E
QU
AT
ION
(N
UM
BE
RS
)D
EQ
UA
TIO
N (
EX
PLA
NA
TIO
N)
E C
ITA
TIO
N/S
OU
RC
EF
AD
DIT
ION
AL
CO
MM
EN
TS
4 T
ota
l pilo
ts
cond
ucte
d
2A
rbo
r C
ons
ulti
ng, "
CM
I Eva
luat
ion,
" p
42.
Alt
houg
h 4
pilo
ts w
ere
fund
ed, o
nly
2 -
Che
lsea
and
Chi
nato
wn
- w
ere
ind
epen
den
tly
eval
uate
d b
y A
rbo
r C
ons
ulti
ng.
5 F
und
ing
per
pilo
t$5
0,00
0
6 T
ota
l ho
useh
old
s in
1-4
uni
t ho
mes
w
eath
eriz
ed
dur
ing
CM
I pilo
ts
101
51+5
0 =
101
Chi
nato
wn
hom
es c
om
ple
ted
+ C
hels
ea
hom
es c
om
ple
ted
Rub
in, "
GJC
Dir
ect
Test
imo
ny o
f Jo
vann
a G
arci
a S
oto
," li
ne 1
3 an
d "
GJC
Dir
ect
Test
imo
ny o
f M
ark
Liu,
" lin
es 9
-10.
D
ock
et #
12-1
00 -
12-
111.
Nov
20,
201
2.
7 A
vera
ge
rate
of
com
ple
tio
n
51(5
0+51
)/2
= 50
.5To
tal n
umb
er o
f un
its/
hous
eho
lds
wea
ther
ized
(B
6), d
ivid
ed b
y to
tal
num
ber
of
pilo
ts (
B4)
8 A
vera
ge
cost
o
f re
tro
fits
p
er h
ous
eho
ld
com
ple
ted
$2,3
25((
$1,9
27+$
2,72
3)/2
=
$2,3
25
Ave
rag
e o
f m
ean
cost
s fo
r C
hina
tow
n an
d C
hels
ea r
etro
fits
Arb
or
Co
nsul
ting
, "C
MI E
valu
atio
n,"
pp
34
, 40.
9 T
ota
l est
imat
ed
cost
per
CM
I
$167
,413
$50,
000+
($2,
325*
51)
= $1
67,4
13To
tal i
niti
al f
und
ing
of
$50k
fo
r ea
ch
CM
I (B
5), p
lus
the
mea
n jo
b c
ost
of
the
retr
ofi
ts f
or
each
pilo
t (B
8) t
imes
the
av
erag
e nu
mb
er o
f ho
mes
co
mp
lete
d
per
pilo
t (B
7)
Incl
udes
co
sts
to b
oth
par
tici
pan
ts a
nd u
tilit
ies.
The
pre
vaili
ng w
age
incr
ease
s ne
go
tiat
ed b
y C
LU a
s p
art
of
the
pilo
t w
ork
ag
reem
ents
are
in
clud
ed.
10 L
ifet
ime
of
mea
sure
(in
yea
rs)
20In
dus
try
stan
dar
d
11 A
vera
ge
Mas
sach
uset
ts
utili
ty b
ill p
er
hous
eho
ld
$4,3
44$3
,000
+$1,
344
= $4
,344
Ave
rag
e M
A a
nnua
l hea
ting
bill
, plu
s av
erag
e M
A a
nnua
l ele
ctri
c b
ill p
er
hous
eho
ld
Mas
s E
O E
EA
, "A
vera
ge
Mo
nthl
y H
ous
eho
ld E
lect
ric
Bill
." "
LIH
EA
P H
om
e E
nerg
y N
ote
bo
ok
Fo
r F
isca
l Yea
r 20
09."
Bas
ed o
n av
erag
e o
f $3
,000
no
rthe
ast
annu
al h
om
e he
atin
g c
ost
s fo
r al
l hea
ting
fue
ls f
or
non-
low
inco
me
hous
eho
lds
fro
m t
he L
IHE
AP
20
09 H
om
e E
nerg
y N
ote
bo
ok,
the
mo
st r
ecen
t ye
ar f
or
whi
ch d
ata
are
avai
lab
le. A
vera
ge
annu
al e
lect
ric
bill
s fo
r M
assa
chus
etts
are
ap
pro
xim
atel
y $1
,344
, acc
ord
ing
to
the
MA
Exe
cuti
ve O
ffice
of
Ene
rgy
and
Env
iro
nmen
tal A
ffai
rs.
12 A
vera
ge
annu
al
utili
ty b
ill s
avin
gs
per
Wx
par
tici
pan
t -
aver
age
savi
ngs
of
30%
$1,3
03$4
,344
*30%
= $1
,303
Ave
rag
e M
A a
nnua
l uti
lity
bill
(B
11)*
aver
age
savi
ngs
of
30%
per
Wx
par
tici
pan
t
Mas
sEne
rgy,
"H
om
e E
nerg
y S
aver
."E
stim
ates
fo
r an
nual
bill
sav
ing
s d
ue t
o w
eath
eriz
atio
n ra
nge
fro
m
10%-
50%.
Whi
le w
e b
elie
ve m
any
of
the
EN
+ p
arti
cip
ants
will
fal
l on
the
hig
her
end
of
the
rang
e, w
e ha
ve t
aken
an
aver
age
of
this
ran
ge,
or
30%,
as
a co
nser
vati
ve e
stim
ate.
13
Ave
rag
e lif
etim
e ut
ility
bill
sav
ing
s p
er W
x p
arti
cip
ant
- av
erag
e sa
ving
s o
f 30
%
$26,
064
$1,3
03*2
0 =
$26,
064
Ave
rag
e an
nual
uti
lity
bill
sav
ing
s (B
12)
* lif
etim
e o
f m
easu
re (
B10
)
15 T
ota
l pro
ject
ed
lifet
ime
ben
efit
per
C
MI p
ilot
$1,3
16,2
3251
*$26
,064
=
$1,3
16,2
32A
vera
ge
hous
es c
om
ple
ted
per
CM
I (B
7) t
imes
ave
rag
e lif
etim
e b
ill s
avin
gs
per
par
tici
pan
t (B
13)
The
uti
litie
s re
fer
to b
ill s
avin
gs
as o
ne o
f se
vera
l eco
nom
ic b
enefi
ts
achi
eved
by
wea
ther
izat
ion.
We
have
use
d t
he t
erm
in t
he s
ame
way
in
thi
s re
po
rt t
o r
efer
to
all
bill
sav
ing
s to
co
nsum
ers
as w
ell a
s so
ciet
al
eco
nom
ic s
avin
gs,
suc
h as
hea
lth
care
co
sts.
16 R
oug
h lif
etim
e b
enefi
t-co
st r
atio
p
er C
MI p
ilot
7.9
$1,3
16,2
32/$
167,
413
= 7.
9To
tal p
roje
cted
life
tim
e b
enefi
t p
er C
MI
pilo
t (B
15),
div
ided
by
tota
l co
st p
er
CM
I pilo
t (B
9) =
Ro
ugh
lifet
ime
ben
efit-
cost
rat
io
Ro
ugh
Ben
efit-
Co
st R
atio
s ar
e th
e ec
ono
mic
ben
efits
div
ided
by
the
tota
l pro
ject
ed c
ost
s. B
ecau
se w
e d
id n
ot
have
acc
ess
to in
tern
al
utili
ty b
udg
et n
umb
ers,
the
se r
atio
s d
o n
ot
incl
ude
cert
ain
cost
s, s
uch
as a
dm
inis
trat
ion
and
res
earc
h, o
r ce
rtai
n b
enefi
ts, s
uch
as in
crea
sed
g
rid
cap
acit
y th
at t
he u
tilt
ies
may
use
as
par
t o
f th
eir
ow
n b
enefi
t-co
st
calc
ulat
ions
.
CH
AR
T A
- C
MI P
ILO
TS
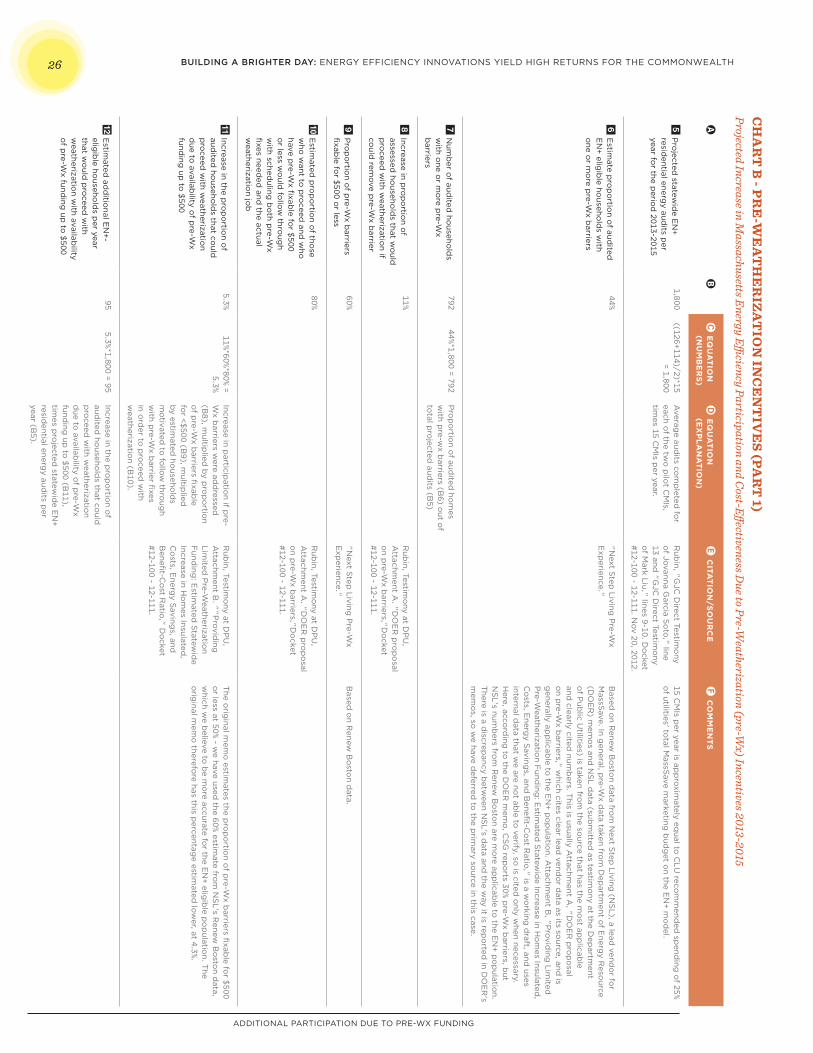
BUILDING A BRIGHTER DAY: ENERGY EFFICIENCY INNOVATIONS YIELD HIGH RETURNS FOR THE COMMONWEALTH26C
HA
RT
B - P
RE
-WE
AT
HE
RIZ
AT
ION
INC
EN
TIV
ES (PA
RT
1)Projected Increase in M
assachusetts Energy Efficiency Participation and C
ost-Effectiveness Due to Pre-W
eatherization (pre-Wx) Incentives 2013-2015
AB
C E
QU
AT
ION
(N
UM
BE
RS
)D
EQ
UA
TIO
N
(EX
PLA
NA
TIO
N)
E C
ITAT
ION
/SO
UR
CE
F C
OM
ME
NT
S
5 P
rojected
statewid
e EN
+ resid
ential energy aud
its per
year for the p
eriod
2013-2015
1,800((126+114)/2)*15
= 1,800A
verage aud
its com
pleted
for
each of the tw
o p
ilot C
MIs,
times 15 C
MIs p
er year.
Rub
in, "GJC
Direct Testim
ony
of Jovanna G
arcia So
to," line
13 and "G
JC D
irect Testimo
ny o
f Mark Liu," lines 9-10. D
ocket
#12-100 - 12-111. Nov 20, 2012.
15 CM
Is per year is ap
proxim
ately equal to
CLU
recom
mend
ed sp
ending
of 25%
of utilities' to
tal MassS
ave marketing
bud
get o
n the EN
+ mo
del.
6 E
stimate p
rop
ortio
n of aud
ited
EN
+ eligib
le househo
lds w
ith o
ne or m
ore p
re-Wx b
arriers
44%"N
ext Step
Living P
re-Wx
Exp
erience." B
ased o
n Renew
Bo
ston d
ata from
Next S
tep L
iving (N
SL), a lead
vendo
r for
MassS
ave. In general, p
re-Wx d
ata taken from
Dep
artment o
f Energ
y Reso
urce (D
OE
R) m
emo
s and N
SL d
ata (subm
itted as testim
ony at the D
epartm
ent o
f Pub
lic Utilities) is taken fro
m the so
urce that has the mo
st app
licable
and clearly cited
numb
ers. This is usually A
ttachment A
, "DO
ER
pro
po
sal o
n pre-W
x barriers," w
hich cites clear lead vend
or d
ata as its source, and
is g
enerally app
licable to
the EN
+ po
pulatio
n. Attachm
ent B, "P
roviding
Limited
P
re-Weatherizatio
n Fund
ing: E
stimated
Statew
ide Increase in H
om
es Insulated,
Co
sts, Energ
y Saving
s, and B
enefit-C
ost R
atio," is a w
orking
draft, and
uses internal d
ata that we are no
t able to
verify, so is cited
only w
hen necessary. H
ere, accord
ing to
the DO
ER
mem
o, C
SG
repo
rts 30% pre-W
x barriers, b
ut N
SL's num
bers fro
m R
enew B
osto
n are mo
re app
licable to
the EN
+ po
pulatio
n. T
here is a discrep
ancy betw
een NS
L's data and
the way it is rep
orted
in DO
ER
's m
emo
s, so w
e have deferred
to the p
rimary so
urce in this case.
7 N
umb
er of aud
ited ho
usehold
s w
ith one o
r mo
re pre-W
x b
arriers
79244%*1,800 = 792
Pro
po
rtion o
f audited
hom
es w
ith pre-w
x barriers (B
6) out o
f to
tal pro
jected aud
its (B5)
8 Increase in p
rop
ortio
n of
assessed ho
usehold
s that wo
uld
pro
ceed w
ith weatherizatio
n if co
uld rem
ove pre-W
x barrier
11%R
ubin, Testim
ony at D
PU
, A
ttachment A
. "DO
ER
pro
po
sal o
n pre-W
x barriers,"D
ocket
#12-100 - 12-111.
9 P
rop
ortio
n of p
re-Wx b
arriers fi
xable fo
r $500 or less
60%"N
ext Step
Living P
re-Wx
Exp
erience." B
ased o
n Renew
Bo
ston d
ata.
10 E
stimated
pro
po
rtion o
f those
who
want to
pro
ceed and
who
have p
re-Wx fi
xable fo
r $500 o
r less wo
uld fo
llow
throug
h w
ith scheduling
bo
th pre-W
x fi
xes needed
and the actual
weatherizatio
n job
80%R
ubin, Testim
ony at D
PU
, A
ttachment A
. "DO
ER
pro
po
sal o
n pre-W
x barriers,"D
ocket
#12-100 - 12-111.
11 Increase in the p
rop
ortio
n of
audited
househo
lds that co
uld
pro
ceed w
ith weatherizatio
n d
ue to availab
ility of p
re-Wx
funding
up to
$500
5.3%11%*60%*80% =
5.3%Increase in p
articipatio
n if pre-
Wx b
arriers were ad
dressed
(B
8), multip
lied b
y pro
po
rtion
of p
re-Wx b
arriers fixab
le fo
r <$500 (B9), m
ultiplied
b
y estimated
househo
lds
mo
tivated to
follo
w thro
ugh
with p
re-Wx b
arrier fixes
in ord
er to p
roceed
with
weatherizatio
n (B10).
Rub
in, Testimo
ny at DP
U,
Attachm
ent B. ""P
roviding
Lim
ited P
re-Weatherizatio
n F
unding
: Estim
ated S
tatewid
e Increase in H
om
es Insulated,
Co
sts, Energ
y Saving
s, and
Benefi
t-Co
st Ratio
," Do
cket #12-100 - 12-111.
The o
riginal m
emo
estimates the p
rop
ortio
n of p
re-Wx b
arriers fixab
le for $500
or less at 50% - w
e have used the 60% estim
ate from
NS
L's Renew
Bo
ston d
ata, w
hich we b
elieve to b
e mo
re accurate for the E
N+ elig
ible p
op
ulation. T
he o
riginal m
emo
therefore has this p
ercentage estim
ated lo
wer, at 4.3%.
12 E
stimated
add
itional E
N+-
eligib
le househo
lds p
er year that w
ould
pro
ceed w
ith w
eatherization w
ith availability
of p
re-Wx fund
ing up
to $500
955.3%*1,800 = 95
Increase in the pro
po
rtion o
f aud
ited ho
usehold
s that could
p
roceed
with w
eatherization
due to
availability o
f pre-W
x fund
ing up
to $500 (B
11), tim
es pro
jected statew
ide E
N+
residential energ
y audits p
er year (B
5).
ADDITIONAL PARTICIPATION DUE TO PRE-WX FUNDING
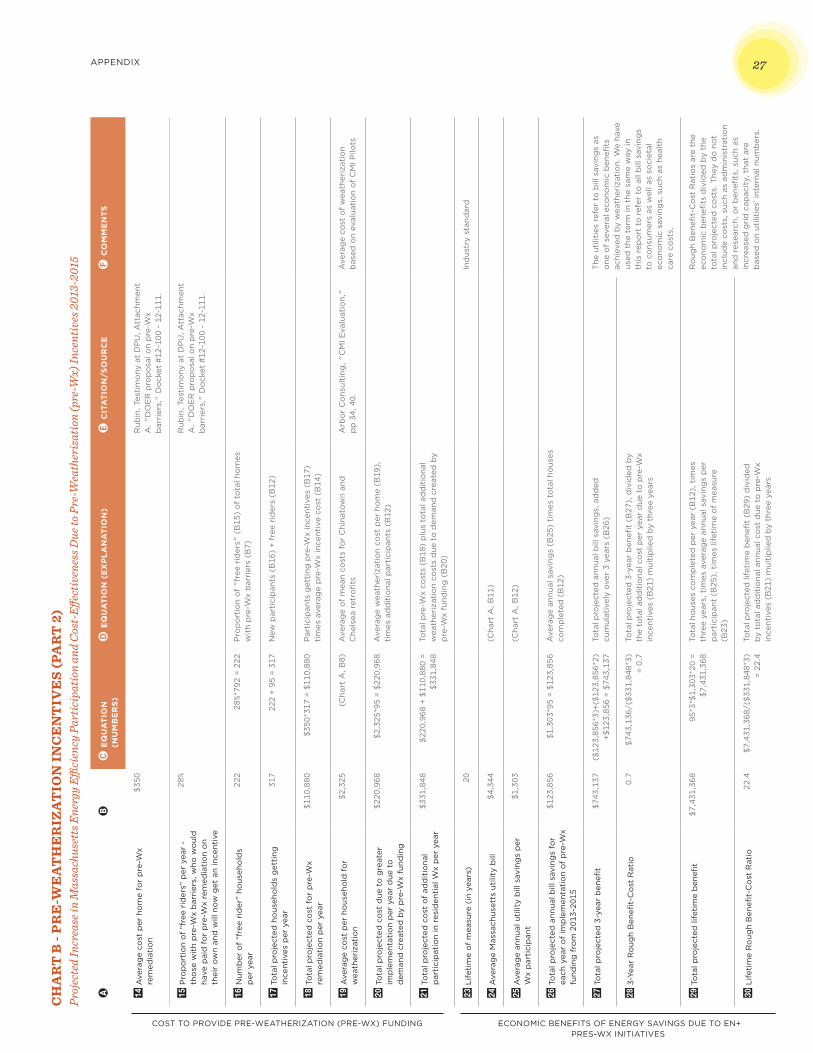
APPENDIX 27C
HA
RT
B -
PR
E-W
EA
TH
ER
IZA
TIO
N IN
CE
NT
IVE
S (P
AR
T 2
)Pr
ojec
ted
Incr
ease
in M
assa
chus
etts
Ene
rgy
Effici
ency
Par
tici
pati
on a
nd C
ost-
Effec
tive
ness
Due
to P
re-W
eath
eriz
atio
n (p
re-W
x) In
cent
ives
201
3-20
15
AB
C E
QU
AT
ION
(N
UM
BE
RS
)D
EQ
UA
TIO
N (
EX
PLA
NA
TIO
N)
E C
ITA
TIO
N/S
OU
RC
EF
CO
MM
EN
TS
14
Ave
rag
e co
st p
er h
om
e fo
r p
re-W
x re
med
iati
on
$350
Rub
in, T
esti
mo
ny a
t D
PU
, Att
achm
ent
A. "
DO
ER
pro
po
sal o
n p
re-W
x b
arri
ers,
" D
ock
et #
12-1
00 -
12-
111.
15 P
rop
ort
ion
of
“fre
e ri
der
s” p
er y
ear
- th
ose
wit
h p
re-W
x b
arri
ers,
who
wo
uld
ha
ve p
aid
fo
r p
re-W
x re
med
iati
on
on
thei
r o
wn
and
will
no
w g
et a
n in
cent
ive
28%
Rub
in, T
esti
mo
ny a
t D
PU
, Att
achm
ent
A. "
DO
ER
pro
po
sal o
n p
re-W
x b
arri
ers,
" D
ock
et #
12-1
00 -
12-
111.
16 N
umb
er o
f “f
ree
rid
er”
hous
eho
lds
per
yea
r
222
28%*
792
= 22
2P
rop
ort
ion
of
"fre
e ri
der
s" (
B15
) o
f to
tal h
om
es
wit
h p
re-W
x b
arri
ers
(B7)
17 T
ota
l pro
ject
ed h
ous
eho
lds
get
ting
in
cent
ives
per
yea
r
317
222
+ 9
5 =
317
New
par
tici
pan
ts (
B16
) +
free
rid
ers
(B12
)
18 T
ota
l pro
ject
ed c
ost
fo
r p
re-W
x re
med
iati
on
per
yea
r
$110
,880
$3
50*3
17 =
$11
0,88
0P
arti
cip
ants
get
ting
pre
-Wx
ince
ntiv
es (
B17
) ti
mes
ave
rag
e p
re-W
x in
cent
ive
cost
(B
14)
19 A
vera
ge
cost
per
ho
useh
old
fo
r w
eath
eriz
atio
n
$2,3
25
(Cha
rt A
, B8)
Ave
rag
e o
f m
ean
cost
s fo
r C
hina
tow
n an
d
Che
lsea
ret
rofi
tsA
rbo
r C
ons
ulti
ng, "
CM
I Eva
luat
ion,
" p
p 3
4, 4
0.A
vera
ge
cost
of
wea
ther
izat
ion
bas
ed o
n ev
alua
tio
n o
f C
MI P
ilots
20 T
ota
l pro
ject
ed c
ost
due
to
gre
ater
im
ple
men
tati
on
per
yea
r d
ue t
o
dem
and
cre
ated
by
pre
-Wx
fund
ing
$220
,968
$2
,325
*95
= $2
20,9
68A
vera
ge
wea
ther
izat
ion
cost
per
ho
me
(B19
),
tim
es a
dd
itio
nal p
arti
cip
ants
(B
12)
21 T
ota
l pro
ject
ed c
ost
of
add
itio
nal
par
tici
pat
ion
in r
esid
enti
al W
x p
er y
ear
$331
,848
$2
20,9
68 +
$11
0,88
0 =
$331
,848
Tota
l pre
-Wx
cost
s (B
18)
plu
s to
tal a
dd
itio
nal
wea
ther
izat
ion
cost
s d
ue t
o d
eman
d c
reat
ed b
y p
re-W
x fu
ndin
g (
B20
)
23
Lif
etim
e o
f m
easu
re (
in y
ears
)20
Ind
ustr
y st
and
ard
24
Ave
rag
e M
assa
chus
etts
uti
lity
bill
$4,3
44(C
hart
A, B
11)
25
Ave
rag
e an
nual
uti
lity
bill
sav
ing
s p
er
Wx
par
tici
pan
t
$1,3
03(C
hart
A, B
12)
26
To
tal p
roje
cted
ann
ual b
ill s
avin
gs
for
each
yea
r o
f im
ple
men
tati
on
of
pre
-Wx
fund
ing
fro
m 2
013-
2015
$123
,856
$1
,303
*95
= $1
23,8
56A
vera
ge
annu
al s
avin
gs
(B25
) ti
mes
to
tal h
ous
es
com
ple
ted
(B
12)
27
To
tal p
roje
cted
3-y
ear
ben
efit
$743
,137
($12
3,85
6*3)
+($1
23,8
56*2
)+$
123,
856
= $7
43,1
37To
tal p
roje
cted
ann
ual b
ill s
avin
gs,
ad
ded
cu
mul
ativ
ely
over
3 y
ears
(B
26)
The
uti
litie
s re
fer
to b
ill s
avin
gs
as
one
of
seve
ral e
cono
mic
ben
efits
ac
hiev
ed b
y w
eath
eriz
atio
n. W
e ha
ve
used
the
ter
m in
the
sam
e w
ay in
th
is r
epo
rt t
o r
efer
to
all
bill
sav
ing
s to
co
nsum
ers
as w
ell a
s so
ciet
al
eco
nom
ic s
avin
gs,
suc
h as
hea
lth
care
co
sts.
28
3-Y
ear
Ro
ugh
Ben
efit-
Co
st R
atio
0.7
$743
,136
/($3
31,8
48*3
) =
0.7
Tota
l pro
ject
ed 3
-yea
r b
enefi
t (B
27),
div
ided
by
the
tota
l ad
dit
iona
l co
st p
er y
ear
due
to
pre
-Wx
ince
ntiv
es (
B21
) m
ulti
plie
d b
y th
ree
year
s
29
To
tal p
roje
cted
life
tim
e b
enefi
t$7
,431
,368
95
*3*$
1,30
3*20
=
$7,4
31,3
68To
tal h
ous
es c
om
ple
ted
per
yea
r (B
12),
tim
es
thre
e ye
ars,
tim
es a
vera
ge
annu
al s
avin
gs
per
p
arti
cip
ant
(B25
), t
imes
life
tim
e o
f m
easu
re
(B23
)
Ro
ugh
Ben
efit-
Co
st R
atio
s ar
e th
e ec
ono
mic
ben
efits
div
ided
by
the
tota
l pro
ject
ed c
ost
s. T
hey
do
no
t in
clud
e co
sts,
suc
h as
ad
min
istr
atio
n an
d r
esea
rch,
or
ben
efits
, suc
h as
in
crea
sed
gri
d c
apac
ity,
tha
t ar
e b
ased
on
utili
ties
’ int
erna
l num
ber
s.30
Lif
etim
e R
oug
h B
enefi
t-C
ost
Rat
io22
.4$7
,431
,368
/($3
31,8
48*3
) =
22.4
Tota
l pro
ject
ed li
feti
me
ben
efit
(B29
) d
ivid
ed
by
tota
l ad
dit
iona
l ann
ual c
ost
due
to
pre
-Wx
ince
ntiv
es (
B21
) m
ulti
plie
d b
y th
ree
year
s
COST TO PROVIDE PRE-WEATHERIZATION (PRE-WX) FUNDING ECONOMIC BENEFITS OF ENERGY SAVINGS DUE TO EN+ PRES-WX INITIATIVES
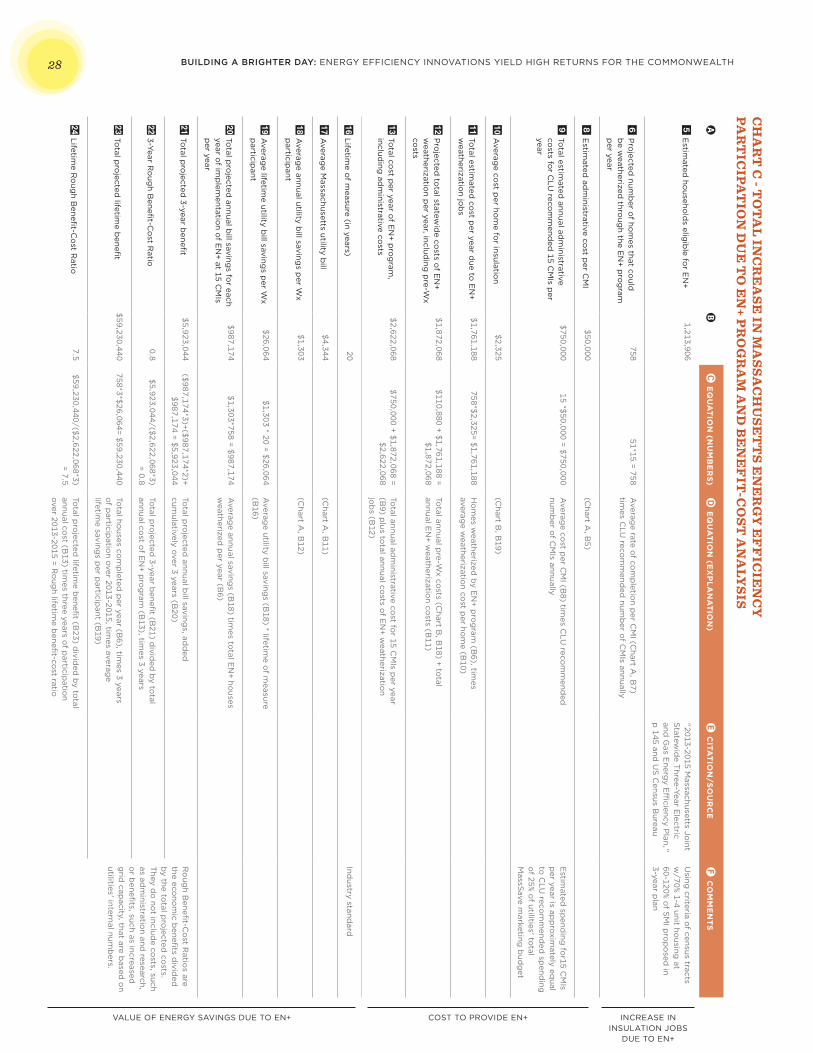
BUILDING A BRIGHTER DAY: ENERGY EFFICIENCY INNOVATIONS YIELD HIGH RETURNS FOR THE COMMONWEALTH28C
HA
RT
C - T
OT
AL
INC
RE
ASE
IN M
ASSA
CH
USE
TT
S EN
ER
GY
EF
FIC
IEN
CY
PA
RT
ICIPA
TIO
N D
UE
TO
EN
+ PR
OG
RA
M A
ND
BE
NE
FIT
-CO
ST A
NA
LYSIS
AB
C E
QU
AT
ION
(NU
MB
ER
S)
D E
QU
AT
ION
(EX
PLA
NA
TIO
N)
E C
ITAT
ION
/SO
UR
CE
F C
OM
ME
NT
S
5 E
stimated
househo
lds elig
ible fo
r EN
+ 1,213,906
"2013-2015 Massachusetts Jo
int S
tatewid
e Three-Year E
lectric and
Gas E
nergy E
fficiency P
lan," p
145 and U
S C
ensus Bureau
Using
criteria of census tracts
w/70% 1-4 unit ho
using at
60-120% of S
MI p
rop
osed
in 3-year p
lan
6 P
rojected
numb
er of ho
mes that co
uld
be w
eatherized thro
ugh the E
N+ p
rog
ram
per year
75851*15 = 758
Averag
e rate of co
mp
letion p
er CM
I (Chart A
, B7)
times C
LU reco
mm
ended
numb
er of C
MIs annually
8 E
stimated
adm
inistrative cost p
er CM
I$50,000
(Chart A
, B5)
9 To
tal estimated
annual adm
inistrative co
sts for C
LU reco
mm
ended
15 CM
Is per
year
$750,00015 *$50,000 = $750,000
Averag
e cost p
er CM
I (B8) tim
es CLU
recom
mend
ed
numb
er of C
MIs annually
Estim
ated sp
ending
for15 C
MIs
per year is ap
proxim
ately equal
to C
LU reco
mm
ended
spend
ing
of 25% o
f utilities' total
MassS
ave marketing
bud
get
10 A
verage co
st per ho
me fo
r insulation
$2,325 (C
hart B, B
19)
11 To
tal estimated
cost p
er year due to
EN
+ w
eatherization jo
bs
$1,761,188 758*$2,325= $1,761,188
Ho
mes w
eatherized b
y EN
+ pro
gram
(B6), tim
es averag
e weatherizatio
n cost p
er hom
e (B10)
12 P
rojected
total statew
ide co
sts of E
N+
weatherizatio
n per year, includ
ing p
re-Wx
costs
$1,872,068 $110,880 + $1,761,188 =
$1,872,068To
tal annual pre-W
x costs (C
hart B, B
18) + total
annual EN
+ weatherizatio
n costs (B
11)
13 To
tal cost p
er year of E
N+ p
rog
ram,
including
adm
inistrative costs
$2,622,068 $750,000 + $1,872,068 =
$2,622,068To
tal annual adm
inistrative cost fo
r 15 CM
Is per year
(B9) p
lus total annual co
sts of E
N+ w
eatherization
job
s (B12)
16 Lifetim
e of m
easure (in years)20
Industry stand
ard
17 A
verage M
assachusetts utility bill
$4,344(C
hart A, B
11)
18 A
verage annual utility b
ill savings p
er Wx
particip
ant
$1,303(C
hart A, B
12)
19 A
verage lifetim
e utility bill saving
s per W
x p
articipant
$26,064$1,303 * 20 = $26,064
Averag
e utility bill saving
s (B18) * lifetim
e of m
easure (B
16)
20 To
tal pro
jected annual b
ill savings fo
r each year o
f imp
lementatio
n of E
N+ at 15 C
MIs
per year
$987,174$1,303*758 = $987,174
Averag
e annual savings (B
18) times to
tal EN
+ houses
weatherized
per year (B
6)
21 To
tal pro
jected 3-year b
enefit
$5,923,044($987,174*3)+($987,174*2)+
$987,174 = $5,923,044To
tal pro
jected annual b
ill savings, ad
ded
cum
ulatively over 3 years (B20)
Ro
ugh B
enefit-C
ost R
atios are
the econo
mic b
enefits d
ivided
b
y the total p
rojected
costs.
They d
o no
t include co
sts, such as ad
ministratio
n and research,
or b
enefits, such as increased
g
rid cap
acity, that are based
on
utilities' internal numb
ers.
22 3-Year R
oug
h Benefi
t-Co
st Ratio
0.8$5,923,044/($2,622,068*3)
= 0.8To
tal pro
jected 3-year b
enefit (B
21) divid
ed b
y total
annual cost o
f EN
+ pro
gram
(B13), tim
es 3 years
23 To
tal pro
jected lifetim
e benefi
t$59,230,440
758*3*$26,064= $59,230,440To
tal houses co
mp
leted p
er year (B6), tim
es 3 years o
f particip
ation over 2013-2015, tim
es average
lifetime saving
s per p
articipant (B
19)
24 Lifetim
e Ro
ugh B
enefit-C
ost R
atio7.5
$59,230,440/($2,622,068*3) = 7.5
Total p
rojected
lifetime b
enefit (B
23) divid
ed b
y total
annual cost (B
13) times three years o
f particip
ation
over 2013-2015 = Ro
ugh lifetim
e benefi
t-cost ratio
INCREASE IN INSULATION JOBS
DUE TO EN+
COST TO PROVIDE EN+ VALUE OF ENERGY SAVINGS DUE TO EN+
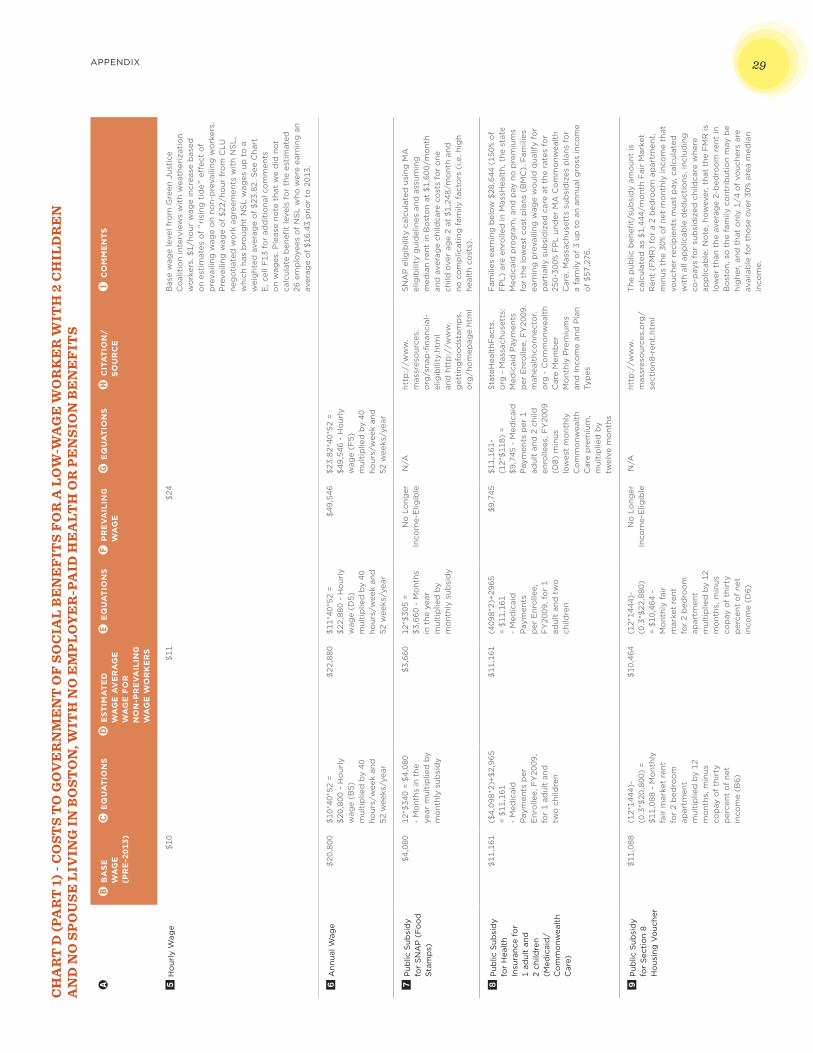
APPENDIX 29C
HA
RT
D (P
AR
T 1
) - C
OST
S T
O G
OV
ER
NM
EN
T O
F S
OC
IAL
BE
NE
FIT
S F
OR
A L
OW
-WA
GE
WO
RK
ER
WIT
H 2
CH
ILD
RE
N
AN
D N
O S
PO
USE
LIV
ING
IN B
OST
ON
, WIT
H N
O E
MP
LO
YE
R-P
AID
HE
ALT
H O
R P
EN
SIO
N B
EN
EF
ITS
AB
BA
SE
W
AG
E
(PR
E-2
013)
C E
QU
AT
ION
SD
EST
IMA
TE
D
WA
GE
AV
ER
AG
E
WA
GE
FO
R
NO
N-P
RE
VA
ILIN
G
WA
GE
WO
RK
ER
S
E E
QU
AT
ION
SF
PR
EV
AIL
ING
W
AG
E
G E
QU
AT
ION
SH
CIT
AT
ION
/S
OU
RC
EI
CO
MM
EN
TS
5 H
our
ly W
age
$10
$11
$24
Bas
e w
age
leve
l fro
m G
reen
Jus
tice
C
oal
itio
n in
terv
iew
s w
ith
wea
ther
izat
ion
wo
rker
s. $
1/ho
ur w
age
incr
ease
bas
ed
on
esti
mat
es o
f "r
isin
g t
ide"
eff
ect
of
pre
vaili
ng w
age
on
non-
pre
vaili
ng w
ork
ers.
P
reva
iling
wag
e o
f $2
2/ho
ur f
rom
CLU
ne
go
tiat
ed w
ork
ag
reem
ents
wit
h N
SL,
w
hich
has
bro
ught
NS
L w
ages
up
to
a
wei
ght
ed a
vera
ge
of
$23.
82. S
ee C
hart
E
, cel
l F13
fo
r ad
dit
iona
l co
mm
ents
o
n w
ages
. Ple
ase
note
tha
t w
e d
id n
ot
calc
ulat
e b
enefi
t le
vels
fo
r th
e es
tim
ated
26
em
plo
yees
of
NS
L w
ho w
ere
earn
ing
an
aver
age
of
$16.
43 p
rio
r to
201
3.
6 A
nnua
l Wag
e$2
0,80
0 $1
0*40
*52
= $2
0,80
0 -
Ho
urly
w
age
(B5)
m
ulti
plie
d b
y 40
ho
urs/
wee
k an
d
52 w
eeks
/yea
r
$22,
880
$11*
40*5
2 =
$22,
880
- H
our
ly
wag
e (D
5)
mul
tip
lied
by
40
hour
s/w
eek
and
52
wee
ks/y
ear
$49,
546
$23.
82*4
0*52
=
$49,
546
- H
our
ly
wag
e (F
5)
mul
tip
lied
by
40
hour
s/w
eek
and
52
wee
ks/y
ear
7 P
ublic
Sub
sid
y fo
r S
NA
P (
Fo
od
S
tam
ps)
$4,0
80
12*$
340
= $4
,080
-
Mo
nths
in t
he
year
mul
tip
lied
by
mo
nthl
y su
bsi
dy
$3,6
6012
*$30
5 =
$3,6
60 -
Mo
nths
in
the
yea
r m
ulti
plie
d b
y m
ont
hly
sub
sid
y
No
Lo
nger
In
com
e-E
ligib
le N
/Aht
tp:/
/ww
w.
mas
sres
our
ces.
org
/sna
p-fi
nanc
ial-
elig
ibili
ty.h
tml
and
htt
p:/
/ww
w.
get
ting
foo
dst
amp
s.o
rg/h
om
epag
e.ht
ml
SN
AP
elig
ibili
ty c
alcu
late
d u
sing
MA
el
igib
ility
gui
del
ines
and
ass
umin
g
med
ian
rent
in B
ost
on
at $
1,60
0/m
ont
h an
d a
vera
ge
child
care
co
sts
for
one
ch
ild o
ver
age
2 at
$1,
248/
mo
nth
and
no
co
mp
licat
ing
fam
ily f
acto
rs (
i.e. h
igh
heal
th c
ost
s).
8 P
ublic
Sub
sid
y fo
r H
ealt
h In
sura
nce
for
1 ad
ult
and
2
child
ren
(Med
icai
d/
Co
mm
onw
ealt
h C
are)
$11,
161
($4,
098*
2)+$
2,96
5 =
$11,
161
- M
edic
aid
P
aym
ents
per
E
nro
llee,
FY
2009
, fo
r 1
adul
t an
d
two
chi
ldre
n
$11,
161
(409
8*2)
+296
5 =
$11,
161
- M
edic
aid
P
aym
ents
p
er E
nro
llee,
F
Y20
09, f
or
1 ad
ult
and
tw
o
child
ren
$9,7
45$1
1,16
1-(1
2*$1
18)
= $9
,745
- M
edic
aid
P
aym
ents
per
1
adul
t an
d 2
chi
ld
enro
llees
, FY
2009
(D
8) m
inus
lo
wes
t m
ont
hly
Co
mm
onw
ealt
h C
are
pre
miu
m,
mul
tip
lied
by
twel
ve m
ont
hs
Sta
teH
ealt
hFac
ts.
org
- M
assa
chus
etts
: M
edic
aid
Pay
men
ts
per
Enr
olle
e, F
Y20
09.
mah
ealt
hco
nnec
tor.
org
- C
om
mo
nwea
lth
Car
e M
emb
er
Mo
nthl
y P
rem
ium
s an
d In
com
e an
d P
lan
Typ
es
Fam
ilies
ear
ning
bel
ow
$28
,644
(15
0% o
f F
PL)
are
enr
olle
d in
Mas
sHea
lth,
the
sta
te
Med
icai
d p
rog
ram
, and
pay
no
pre
miu
ms
for
the
low
est
cost
pla
ns (
BM
C).
Fam
ilies
ea
rnin
g p
reva
iling
wag
e w
oul
d q
ualif
y fo
r p
arti
ally
sub
sid
ized
car
e at
the
rat
es f
or
250-
300%
FP
L un
der
MA
Co
mm
onw
ealt
h C
are.
Mas
sach
uset
ts s
ubsi
diz
es p
lans
fo
r a
fam
ily o
f 3
up t
o a
n an
nual
gro
ss in
com
e o
f $5
7,27
6.
9 P
ublic
Sub
sid
y fo
r S
ecti
on
8 H
ous
ing
Vo
uche
r
$11,
088
(12*
1444
)-(0
.3*$
20,8
00)
= $1
1,08
8 -
Mo
nthl
y fa
ir m
arke
t re
nt
for
2 b
edro
om
ap
artm
ent
mul
tip
lied
by
12
mo
nths
, min
us
cop
ay o
f th
irty
p
erce
nt o
f ne
t in
com
e (B
6)
$10,
464
(12*
1444
)-(0
.3*$
22,8
80)
= $1
0,46
4 -
Mo
nthl
y fa
ir
mar
ket
rent
fo
r 2
bed
roo
m
apar
tmen
t m
ulti
plie
d b
y 12
m
ont
hs, m
inus
co
pay
of
thir
ty
per
cent
of
net
inco
me
(D6)
No
Lo
nger
In
com
e-E
ligib
le N
/Aht
tp:/
/ww
w.
mas
sres
our
ces.
org
/se
ctio
n8-r
ent.
htm
l
The
pub
lic b
enefi
t/su
bsi
dy
amo
unt
is
calc
ulat
ed a
s $1
,444
/mo
nth
Fai
r M
arke
t R
ent
(FM
R)
for
a 2
bed
roo
m a
par
tmen
t,
min
us t
he 3
0% o
f ne
t m
ont
hly
inco
me
that
vo
uche
r re
cip
ient
s m
ust
pay
, cal
cula
ted
w
ith
all a
pp
licab
le d
educ
tio
ns, i
nclu
din
g
co-p
ays
for
sub
sid
ized
chi
ldca
re w
here
ap
plic
able
. No
te, h
ow
ever
, tha
t th
e F
MR
is
low
er t
han
the
aver
age
2-b
edro
om
ren
t in
B
ost
on,
so
the
fam
ily c
ont
rib
utio
n m
ay b
e hi
ghe
r, an
d t
hat
onl
y 1/
4 o
f vo
uche
rs a
re
avai
lab
le f
or
tho
se o
ver
30%
area
med
ian
inco
me.
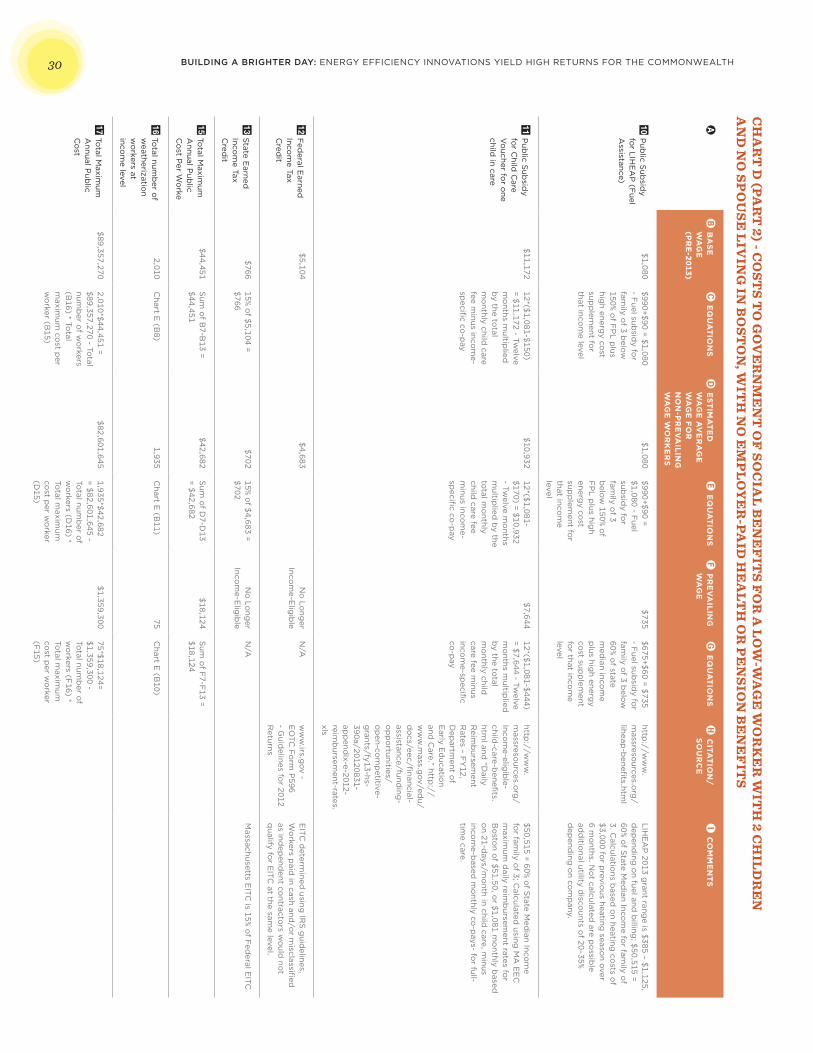
BUILDING A BRIGHTER DAY: ENERGY EFFICIENCY INNOVATIONS YIELD HIGH RETURNS FOR THE COMMONWEALTH30
AB
BA
SE
W
AG
E
(PR
E-2013)
C E
QU
AT
ION
SD
EST
IMA
TE
D
WA
GE
AV
ER
AG
E
WA
GE
FO
R
NO
N-P
RE
VA
ILING
W
AG
E W
OR
KE
RS
E E
QU
AT
ION
SF
PR
EV
AILIN
G
WA
GE
G
EQ
UA
TIO
NS
H C
ITAT
ION
/S
OU
RC
EI
CO
MM
EN
TS
10 P
ublic S
ubsid
y fo
r LIHE
AP
(Fuel
Assistance)
$1,080$990+$90 = $1,080 - F
uel subsid
y for
family o
f 3 belo
w
150% of F
PL p
lus hig
h energy co
st sup
plem
ent for
that incom
e level
$1,080$990+$90 = $1,080 - F
uel sub
sidy fo
r fam
ily of 3
belo
w 150% o
f F
PL p
lus high
energy co
st sup
plem
ent for
that incom
e level
$735$675+$60 = $735 - F
uel subsid
y for
family o
f 3 belo
w
60% of state
med
ian incom
e p
lus high energ
y co
st supp
lement
for that inco
me
level
http://w
ww
.m
assresources.o
rg/
liheap-b
enefits.htm
l
LIH
EA
P 2013 g
rant range is $385 – $1,125,
dep
ending
on fuel and
billing
; $50,515 = 60% o
f State M
edian Inco
me fo
r family o
f 3. C
alculations b
ased o
n heating co
sts of
$3,000 for p
revious heating
season over
6 mo
nths. No
t calculated are p
ossib
le ad
ditio
nal utility disco
unts of 20–35%
dep
ending
on co
mp
any.
11 P
ublic S
ubsid
y fo
r Child
Care
Vo
ucher for o
ne child
in care
$11,17212*($1,081-$150) = $11,172 - Tw
elve m
onths m
ultiplied
b
y the total
mo
nthly child care
fee minus inco
me-
specifi
c co-p
ay
$10,93212*($1,081-$170) = $10,932 - Tw
elve mo
nths m
ultiplied
by the
total m
onthly
child care fee
minus inco
me-
specifi
c co-p
ay
$7,644 12*($1,081-$444) = $7,644 - Tw
elve m
onths m
ultiplied
b
y the total
mo
nthly child
care fee minus
incom
e-specifi
c co
-pay
http://w
ww
.m
assresources.o
rg/
Incom
e-eligib
le-child
-care-benefi
ts.htm
l and “D
aily R
eimb
ursement
Rates – F
Y12,
Dep
artment o
f E
arly Ed
ucation
and C
are.” http://
ww
w.m
ass.gov/ed
u/d
ocs/eec/fi
nancial-assistance/fund
ing-
op
po
rtunities/o
pen-co
mp
etitive-g
rants/fy13-hs-390a/20120831-ap
pend
ix-e-2012-reim
bursem
ent-rates.xls
$50,515 = 60% of S
tate Med
ian Incom
e fo
r family o
f 3; Calculated
using M
A E
EC
m
aximum
daily reim
bursem
ent rates for
Bo
ston o
f $51.50, or $1,081 m
onthly b
ased
on 21-d
ays/mo
nth in child care, m
inus inco
me-b
ased m
onthly co
-pays- fo
r full-tim
e care.
12 F
ederal E
arned
Incom
e Tax C
redit
$5,104 $4,683
No
Long
er Inco
me-E
ligib
leN
/Aw
ww
.irs.gov -
EO
TC F
orm
P596
- Guid
elines for 2012
Returns
EITC
determ
ined using
IRS
guid
elines. W
orkers p
aid in cash and
/or m
isclassified
as ind
epend
ent contracto
rs wo
uld no
t q
ualify for E
ITC at the sam
e level.
13
State E
arned
Incom
e Tax C
redit
$766 15% o
f $5,104 = $766
$70215% o
f $4,683 = $702
No
Long
er Inco
me-E
ligib
leN
/AM
assachusetts EITC
is 15% of F
ederal E
ITC
15
Total M
aximum
A
nnual Pub
lic C
ost P
er Wo
rke
$44,451 S
um o
f B7-B
13 = $44,451
$42,682 S
um o
f D7-D
13 = $42,682
$18,124 S
um o
f F7-F
13 = $18,124
16
Total num
ber o
f w
eatherization
wo
rkers at inco
me level
2,010C
hart E (B
8)1,935
Chart E
(B11)
75C
hart E (B
10)
17
Total M
aximum
A
nnual Pub
lic C
ost
$89,357,270 2,010*$44,451 = $89,357,270 - To
tal num
ber o
f wo
rkers (B
16) * Total
maxim
um co
st per
wo
rker (B15)
$82,601,645 1,935*$42,682 = $82,601,645 - To
tal numb
er of
wo
rkers (D16) *
Total m
aximum
co
st per w
orker
(D15)
$1,359,300 75*$18,124= $1,359,300 - To
tal numb
er of
wo
rkers (F16) *
Total m
aximum
co
st per w
orker
(F15)
CH
AR
T D
(PAR
T 2) - C
OST
S TO
GO
VE
RN
ME
NT
OF
SOC
IAL
BE
NE
FIT
S FO
R A
LO
W-W
AG
E W
OR
KE
R W
ITH
2 CH
ILD
RE
N
AN
D N
O SP
OU
SE L
IVIN
G IN
BO
STO
N, W
ITH
NO
EM
PL
OY
ER
-PAID
HE
ALT
H O
R P
EN
SION
BE
NE
FIT
S
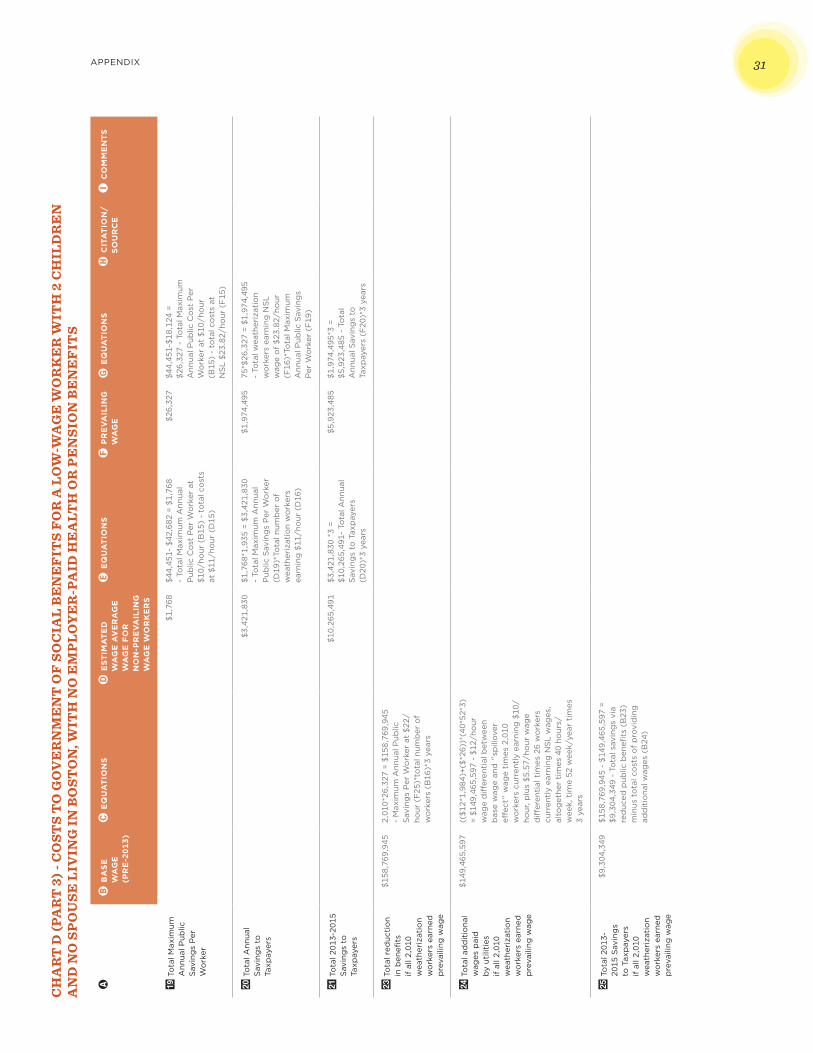
APPENDIX 31C
HA
RT
D (P
AR
T 3
) - C
OST
S T
O G
OV
ER
NM
EN
T O
F S
OC
IAL
BE
NE
FIT
S F
OR
A L
OW
-WA
GE
WO
RK
ER
WIT
H 2
CH
ILD
RE
N
AN
D N
O S
PO
USE
LIV
ING
IN B
OST
ON
, WIT
H N
O E
MP
LO
YE
R-P
AID
HE
ALT
H O
R P
EN
SIO
N B
EN
EF
ITS
AB
BA
SE
W
AG
E
(PR
E-2
013)
C E
QU
AT
ION
SD
EST
IMA
TE
D
WA
GE
AV
ER
AG
E
WA
GE
FO
R
NO
N-P
RE
VA
ILIN
G
WA
GE
WO
RK
ER
S
E E
QU
AT
ION
SF
PR
EV
AIL
ING
W
AG
E
G E
QU
AT
ION
SH
CIT
AT
ION
/S
OU
RC
EI
CO
MM
EN
TS
19
To
tal M
axim
um
Ann
ual P
ublic
S
avin
gs
Per
W
ork
er
$1,7
68
$44,
451-
$42
,682
= $
1,76
8 -
Tota
l Max
imum
Ann
ual
Pub
lic C
ost
Per
Wo
rker
at
$10/
hour
(B
15)
- to
tal c
ost
s at
$11
/ho
ur (
D15
)
$26,
327
$44,
451-
$18,
124
= $2
6,32
7 -
Tota
l Max
imum
A
nnua
l Pub
lic C
ost
Per
W
ork
er a
t $1
0/ho
ur
(B15
) -
tota
l co
sts
at
NS
L $2
3.82
/ho
ur (
F15
)
20
To
tal A
nnua
l S
avin
gs
to
Taxp
ayer
s
$3,4
21,8
30
$1,7
68*1
,935
= $
3,42
1,83
0 -
Tota
l Max
imum
Ann
ual
Pub
lic S
avin
gs
Per
Wo
rker
(D
19)*
Tota
l num
ber
of
wea
ther
izat
ion
wo
rker
s ea
rnin
g $
11/h
our
(D
16)
$1,9
74,4
95
75*$
26,3
27 =
$1,
974,
495
- To
tal w
eath
eriz
atio
n w
ork
ers
earn
ing
NS
L w
age
of
$23.
82/h
our
(F
16)*
Tota
l Max
imum
A
nnua
l Pub
lic S
avin
gs
Per
Wo
rker
(F
19)
21
To
tal 2
013-
2015
S
avin
gs
to
Taxp
ayer
s
$10,
265,
491
$3,4
21,8
30 *
3 =
$10,
265,
491-
To
tal A
nnua
l S
avin
gs
to T
axp
ayer
s (D
20)*
3 ye
ars
$5,9
23,4
85
$1,9
74,4
95*3
=
$5,9
23,4
85 -
To
tal
Ann
ual S
avin
gs
to
Taxp
ayer
s (F
20)*
3 ye
ars
23
To
tal r
educ
tio
n in
ben
efits
if
all
2,01
0 w
eath
eriz
atio
n w
ork
ers
earn
ed
pre
vaili
ng w
age
$158
,769
,945
2,
010*
26,3
27 =
$15
8,76
9,94
5 -
Max
imum
Ann
ual P
ublic
S
avin
gs
Per
Wo
rker
at
$22/
hour
(F
25)*
tota
l num
ber
of
wo
rker
s (B
16)*
3 ye
ars
24
To
tal a
dd
itio
nal
wag
es p
aid
b
y ut
iliti
es
if a
ll 2,
010
wea
ther
izat
ion
wo
rker
s ea
rned
p
reva
iling
wag
e
$149
,465
,597
(($1
2*1,
984)
+($*
26))
*(40
*52*
3)
= $1
49,4
65,5
97 -
$12
/ho
ur
wag
e d
iffer
enti
al b
etw
een
bas
e w
age
and
"sp
illov
er
effec
t" w
age
tim
es 2
,010
w
ork
ers
curr
entl
y ea
rnin
g $
10/
hour
, plu
s $5
.57/
hour
wag
e d
iffer
enti
al t
imes
26
wo
rker
s cu
rren
tly
earn
ing
NS
L w
ages
, al
tog
ethe
r ti
mes
40
hour
s/w
eek,
tim
e 52
wee
k/ye
ar t
imes
3
year
s
25 T
ota
l 201
3-20
15 S
avin
gs
to T
axp
ayer
s if
all
2,01
0 w
eath
eriz
atio
n w
ork
ers
earn
ed
pre
vaili
ng w
age
$9,3
04,3
49
$158
,769
,945
- $
149,
465,
597
= $9
,304
,349
- T
ota
l sav
ing
s vi
a re
duc
ed p
ublic
ben
efits
(B
23)
min
us t
ota
l co
sts
of
pro
vid
ing
ad
dit
iona
l wag
es (
B24
)
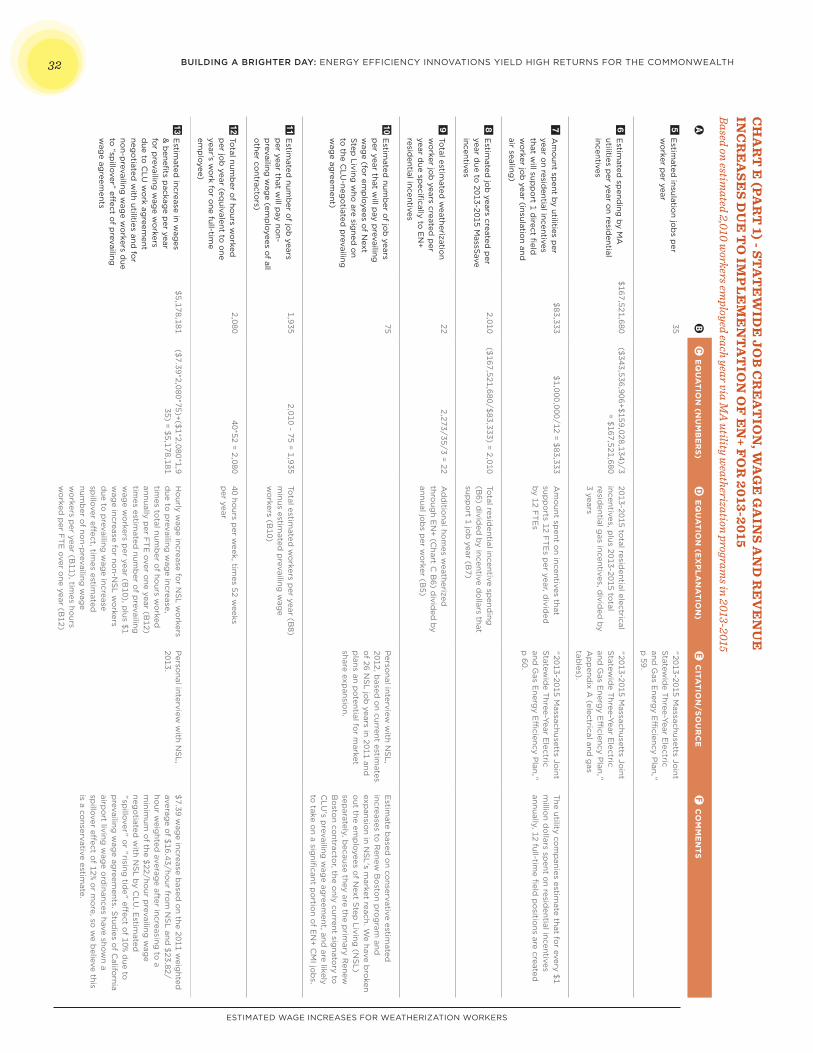
BUILDING A BRIGHTER DAY: ENERGY EFFICIENCY INNOVATIONS YIELD HIGH RETURNS FOR THE COMMONWEALTH32C
HA
RT
E (PA
RT
1) - STA
TE
WID
E JO
B C
RE
AT
ION
, WA
GE
GA
INS A
ND
RE
VE
NU
E
INC
RE
ASE
S DU
E T
O IM
PL
EM
EN
TA
TIO
N O
F E
N+ F
OR
2013-2015Based on estim
ated 2,010 workers em
ployed each year via MA
utility weatherization program
s in 2013-2015
AB
C E
QU
AT
ION
(NU
MB
ER
S)
D E
QU
AT
ION
(EX
PLA
NA
TIO
N)
E C
ITAT
ION
/SO
UR
CE
F C
OM
ME
NT
S
5 E
stimated
insulation jo
bs p
er w
orker p
er year
35"2013-2015 M
assachusetts Joint
Statew
ide T
hree-Year Electric
and G
as Energ
y Effi
ciency Plan,"
p 59.
6 E
stimated
spend
ing b
y MA
utilities p
er year on resid
ential incentives
$167,521,680($343,536,906+$159,028,134)/3
= $167,521,6802013-2015 to
tal residential electrical
incentives, plus 2013-2015 to
tal resid
ential gas incentives, d
ivided
by
3 years
"2013-2015 Massachusetts Jo
int S
tatewid
e Three-Year E
lectric and
Gas E
nergy E
fficiency P
lan," A
pp
endix A
(electrical and g
as tab
les).
7 A
mo
unt spent b
y utilities per
year on resid
ential incentives that w
ill supp
ort 1 d
irect field
w
orker jo
b year (insulatio
n and
air sealing)
$83,333$1,000,000/12 = $83,333
Am
ount sp
ent on incentives that
supp
orts 12 F
TE
s per year, d
ivided
b
y 12 FT
Es
"2013-2015 Massachusetts Jo
int S
tatewid
e Three-Year E
lectric and
Gas E
nergy E
fficiency P
lan," p
60.
The utility co
mp
anies estimate that fo
r every $1 m
illion d
ollars sp
ent on resid
ential incentives annually, 12 full-tim
e field
po
sitions are created
8 E
stimated
job
years created p
er year d
ue to 2013-2015 M
assSave
incentives
2,010($167,521,680/$83,333) = 2,010
Total resid
ential incentive spend
ing
(B6) d
ivided
by incentive d
ollars that
supp
ort 1 jo
b year (B
7)
9 To
tal estimated
weatherizatio
n w
orker jo
b years created
per
year due sp
ecifically to
EN
+ resid
ential incentives
222,273/35/3 = 22
Ad
ditio
nal hom
es weatherized
thro
ugh E
N+ (C
hart C B
6) divid
ed b
y annual jo
bs p
er wo
rker (B5)
10 E
stimated
numb
er of jo
b years
per year that w
ill pay p
revailing
wag
e (for em
ployees o
f Next
Step
Living w
ho are sig
ned o
n to
the CLU
-nego
tiated p
revailing
wag
e agreem
ent)
75P
ersonal interview
with N
SL,
2012, based
on current estim
ates o
f 26 NS
L job
years in 2011 and
plans an p
otential fo
r market
share expansio
n.
Estim
ate based
on co
nservative estimated
increases to
Renew
Bo
ston p
rog
ram and
exp
ansion in N
SL's m
arket reach. We have b
roken
out the em
ployees o
f Next S
tep Living
(NS
L) sep
arately, because they are the p
rimary R
enew
Bo
ston co
ntractor, the o
nly current signato
ry to
CLU
's prevailing
wag
e agreem
ent, and are likely
to take o
n a signifi
cant po
rtion o
f EN
+ CM
I job
s.
11 E
stimated
numb
er of jo
b years
per year that w
ill pay no
n-p
revailing w
age (em
ployees o
f all o
ther contracto
rs)
1,9352,010 - 75 = 1,935
Total estim
ated w
orkers p
er year (B8)
minus estim
ated p
revailing w
age
wo
rkers (B10)
12 To
tal numb
er of ho
urs wo
rked
per jo
b year (eq
uivalent to o
ne year’s w
ork fo
r one full-tim
e em
ployee)
2,08040*52 = 2,080
40 hours p
er week, tim
es 52 weeks
per year
13 E
stimated
increase in wag
es &
benefi
ts packag
e per year
for p
revailing w
age w
orkers
due to
CLU
wo
rk agreem
ent neg
otiated
with utilities and
for
non-p
revailing w
age w
orkers d
ue to
“spillover” eff
ect of p
revailing
wag
e agreem
ents
$5,178,181($7.39*2,080*75)+($1*2,080*1,9
35) = $5,178,181H
ourly w
age increase fo
r NS
L wo
rkers d
ue to p
revailing w
age increase,
times to
tal numb
er of ho
urs wo
rked
annually per F
TE
over one year (B
12) tim
es estimated
numb
er of p
revailing
wag
e wo
rkers per year (B
10), plus $1
wag
e increase for no
n-NS
L wo
rkers d
ue to p
revailing w
age increase
spillover eff
ect, times estim
ated
numb
er of no
n-prevailing
wag
e w
orkers p
er year (B11), tim
es hours
wo
rked p
er FT
E over o
ne year (B12)
Perso
nal interview w
ith NS
L, 2013.
$7.39 wag
e increase based
on the 2011 w
eighted
averag
e of $16.43/ho
ur from
NS
L and $23.82/
hour w
eighted
average after increasing
to a
minim
um o
f the $22/hour p
revailing w
age
nego
tiated w
ith NS
L by C
LU. E
stimated
"sp
illover" or "rising
tide" eff
ect of 10% d
ue to
prevailing
wag
e agreem
ents. Stud
ies of C
alifornia
airpo
rt living w
age o
rdinances have sho
wn a
spillover eff
ect of 12% o
r mo
re, so w
e believe this
is a conservative estim
ate.
ESTIMATED WAGE INCREASES FOR WEATHERIZATION WORKERS
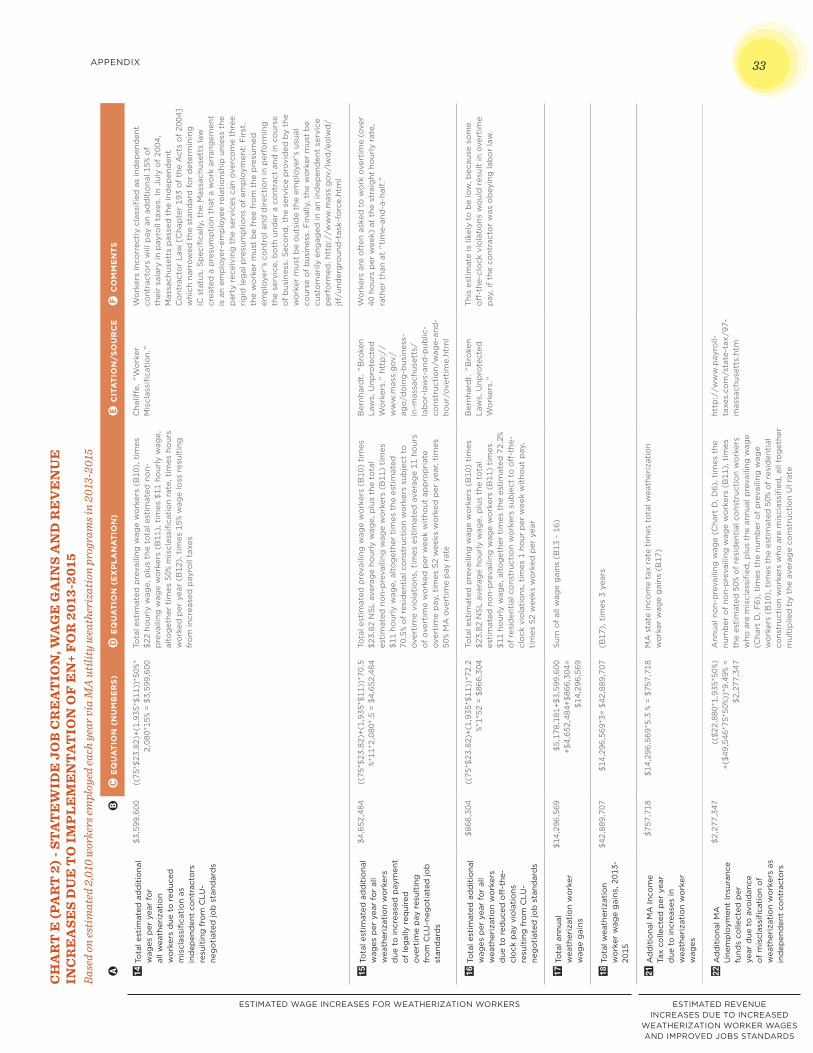
APPENDIX 33C
HA
RT
E (P
AR
T 2
) - S
TA
TE
WID
E J
OB
CR
EA
TIO
N, W
AG
E G
AIN
S A
ND
RE
VE
NU
E
INC
RE
ASE
S D
UE
TO
IMP
LE
ME
NT
AT
ION
OF
EN
+ F
OR
201
3-20
15Ba
sed
on es
tim
ated
2,0
10 w
orke
rs em
ploy
ed ea
ch y
ear v
ia M
A u
tilit
y w
eath
eriz
atio
n pr
ogra
ms i
n 20
13-2
015
AB
C E
QU
AT
ION
(N
UM
BE
RS
)D
EQ
UA
TIO
N (
EX
PLA
NA
TIO
N)
E C
ITA
TIO
N/S
OU
RC
EF
CO
MM
EN
TS
14
To
tal e
stim
ated
ad
dit
iona
l w
ages
per
yea
r fo
r al
l wea
ther
izat
ion
wo
rker
s d
ue t
o r
educ
ed
mis
clas
sifi
cati
on
as
ind
epen
den
t co
ntra
cto
rs
resu
ltin
g f
rom
CLU
-ne
go
tiat
ed jo
b s
tand
ard
s
$3,5
99,6
00((
75*$
23.8
2)+(
1,93
5*$1
1))*
50%*
2,08
0*15
% =
$3,5
99,6
00
Tota
l est
imat
ed p
reva
iling
wag
e w
ork
ers
(B10
), t
imes
$2
2 ho
urly
wag
e, p
lus
the
tota
l est
imat
ed n
on-
pre
vaili
ng w
age
wo
rker
s (B
11),
tim
es $
11 h
our
ly w
age,
al
tog
ethe
r ti
mes
50%
mis
clas
sifi
cati
on
rate
, tim
es h
our
s w
ork
ed p
er y
ear
(B12
), t
imes
15%
wag
e lo
ss r
esul
ting
fr
om
incr
ease
d p
ayro
ll ta
xes
Cha
liffe,
"W
ork
er
Mis
clas
sifi
cati
on.
"W
ork
ers
inco
rrec
tly
clas
sifi
ed a
s in
dep
end
ent
cont
ract
ors
will
pay
an
add
itio
nal 1
5% o
f th
eir
sala
ry in
pay
roll
taxe
s. In
Jul
y o
f 20
04,
Mas
sach
uset
ts p
asse
d t
he In
dep
end
ent
Co
ntra
cto
r La
w [
Cha
pte
r 19
3 o
f th
e A
cts
of
2004
] w
hich
nar
row
ed t
he s
tand
ard
fo
r d
eter
min
ing
IC
sta
tus.
Sp
ecifi
cally
, the
Mas
sach
uset
ts la
w
crea
ted
a p
resu
mp
tio
n th
at a
wo
rk a
rran
gem
ent
is a
n em
plo
yer-
emp
loye
e re
lati
ons
hip
unl
ess
the
par
ty r
ecei
ving
the
ser
vice
s ca
n ov
erco
me
thre
e ri
gid
leg
al p
resu
mp
tio
ns o
f em
plo
ymen
t: F
irst
, th
e w
ork
er m
ust
be
free
fro
m t
he p
resu
med
em
plo
yer'
s co
ntro
l and
dir
ecti
on
in p
erfo
rmin
g
the
serv
ice,
bo
th u
nder
a c
ont
ract
and
in c
our
se
of
bus
ines
s. S
eco
nd, t
he s
ervi
ce p
rovi
ded
by
the
wo
rker
mus
t b
e o
utsi
de
the
emp
loye
r's
usua
l co
urse
of
bus
ines
s. F
inal
ly, t
he w
ork
er m
ust
be
cust
om
arily
eng
aged
in a
n in
dep
end
ent
serv
ice
per
form
ed. h
ttp
://w
ww
.mas
s.g
ov/l
wd
/eo
lwd
/jt
f/un
der
gro
und
-tas
k-fo
rce.
htm
l
15 T
ota
l est
imat
ed a
dd
itio
nal
wag
es p
er y
ear
for
all
wea
ther
izat
ion
wo
rker
s d
ue t
o in
crea
sed
pay
men
t o
f le
gal
ly r
equi
red
ov
erti
me
pay
res
ulti
ng
fro
m C
LU-n
ego
tiat
ed jo
b
stan
dar
ds
$4,6
52,4
84((
75*$
23.8
2)+(
1,93
5*$1
1))*
70.5
%*11
*2,0
80*.
5 =
$4,6
52,4
84To
tal e
stim
ated
pre
vaili
ng w
age
wo
rker
s (B
10)
tim
es
$23.
82 N
SL
aver
age
hour
ly w
age,
plu
s th
e to
tal
esti
mat
ed n
on-
pre
vaili
ng w
age
wo
rker
s (B
11)
tim
es
$11
hour
ly w
age,
alt
og
ethe
r ti
mes
the
est
imat
ed
70.5
% o
f re
sid
enti
al c
ons
truc
tio
n w
ork
ers
sub
ject
to
ov
erti
me
vio
lati
ons
, tim
es e
stim
ated
ave
rag
e 11
ho
urs
of
over
tim
e w
ork
ed p
er w
eek
wit
hout
ap
pro
pri
ate
over
tim
e p
ay, t
imes
52
wee
ks w
ork
ed p
er y
ear,
tim
es
50%
MA
ove
rtim
e p
ay r
ate
Ber
nhar
dt.
"B
roke
n La
ws,
Unp
rote
cted
W
ork
ers.
" ht
tp:/
/w
ww
.mas
s.g
ov/
ago
/do
ing
-bus
ines
s-in
-mas
sach
uset
ts/
lab
or-
law
s-an
d-p
ublic
-co
nstr
ucti
on/
wag
e-an
d-
hour
/ove
rtim
e.ht
ml
Wo
rker
s ar
e o
ften
ask
ed t
o w
ork
ove
rtim
e (o
ver
40 h
our
s p
er w
eek)
at
the
stra
ight
ho
urly
rat
e,
rath
er t
han
at "
tim
e-an
d-a
-hal
f."
16 T
ota
l est
imat
ed a
dd
itio
nal
wag
es p
er y
ear
for
all
wea
ther
izat
ion
wo
rker
s d
ue t
o r
educ
ed o
ff-t
he-
clo
ck p
ay v
iola
tio
ns
resu
ltin
g f
rom
CLU
-ne
go
tiat
ed jo
b s
tand
ard
s
$866
,304
((75
*$23
.82)
+(1,
935*
$11)
)*72
.2%*
1*52
= $
866,
304
Tota
l est
imat
ed p
reva
iling
wag
e w
ork
ers
(B10
) ti
mes
$2
3.82
NS
L av
erag
e ho
urly
wag
e, p
lus
the
tota
l es
tim
ated
no
n-p
reva
iling
wag
e w
ork
ers
(B11
) ti
mes
$1
1 ho
urly
wag
e, a
lto
get
her
tim
es t
he e
stim
ated
72.
2%
of
resi
den
tial
co
nstr
ucti
on
wo
rker
s su
bje
ct t
o o
ff-t
he-
clo
ck v
iola
tio
ns, t
imes
1 h
our
per
wee
k w
itho
ut p
ay,
tim
es 5
2 w
eeks
wo
rked
per
yea
r
Ber
nhar
dt.
"B
roke
n La
ws,
Unp
rote
cted
W
ork
ers.
"
Thi
s es
tim
ate
is li
kely
to
be
low
, bec
ause
so
me
off
-the
-clo
ck v
iola
tio
ns w
oul
d r
esul
t in
ove
rtim
e p
ay, i
f th
e co
ntra
cto
r w
as o
bey
ing
lab
or
law
.
17 T
ota
l ann
ual
wea
ther
izat
ion
wo
rker
w
age
gai
ns
$14,
296,
569
$5,1
78,1
81+$
3,59
9,60
0 +$
4,65
2,48
4+$8
66,3
04=
$14,
296,
569
Sum
of
all w
age
gai
ns (
B13
- 1
6)
18 T
ota
l wea
ther
izat
ion
wo
rker
wag
e g
ains
, 201
3-20
15
$42,
889,
707
$14,
296,
569*
3= $
42,8
89,7
07(B
17),
tim
es 3
yea
rs
21 A
dd
itio
nal M
A In
com
e Ta
x co
llect
ed p
er y
ear
due
to
incr
ease
s in
w
eath
eriz
atio
n w
ork
er
wag
es
$757
,718
$14,
296,
569*
5.3
% =
$757
,718
MA
sta
te in
com
e ta
x ra
te t
imes
to
tal w
eath
eriz
atio
n w
ork
er w
age
gai
ns (
B17
)
22 A
dd
itio
nal M
A
Une
mp
loym
ent
Insu
ranc
e fu
nds
colle
cted
per
ye
ar d
ue t
o a
void
ance
o
f m
iscl
assi
fica
tio
n o
f w
eath
eriz
atio
n w
ork
ers
as
ind
epen
den
t co
ntra
cto
rs
$2,2
77,3
47((
$22,
880*
1,93
5*50
%)
+($4
9,54
6*75
*50%
))*9
.49%
=
$2,2
77,3
47
Ann
ual n
on-
pre
vaili
ng w
age
(Cha
rt D
, D6)
, tim
es t
he
num
ber
of
non-
pre
vaili
ng w
age
wo
rker
s (B
11),
tim
es
the
esti
mat
ed 5
0% o
f re
sid
enti
al c
ons
truc
tio
n w
ork
ers
who
are
mis
clas
sifi
ed, p
lus
the
annu
al p
reva
iling
wag
e (C
hart
D, F
6), t
imes
the
num
ber
of
pre
vaili
ng w
age
wo
rker
s (B
10),
tim
es t
he e
stim
ated
50%
of
resi
den
tial
co
nstr
ucti
on
wo
rker
s w
ho a
re m
iscl
assi
fied
, all
tog
ethe
r m
ulti
plie
d b
y th
e av
erag
e co
nstr
ucti
on
UI r
ate
http
://w
ww
.pay
roll-
taxe
s.co
m/s
tate
-tax
/97-
mas
sach
uset
ts.h
tm
ESTIMATED WAGE INCREASES FOR WEATHERIZATION WORKERS ESTIMATED REVENUE INCREASES DUE TO INCREASED
WEATHERIZATION WORKER WAGES AND IMPROVED JOBS STANDARDS
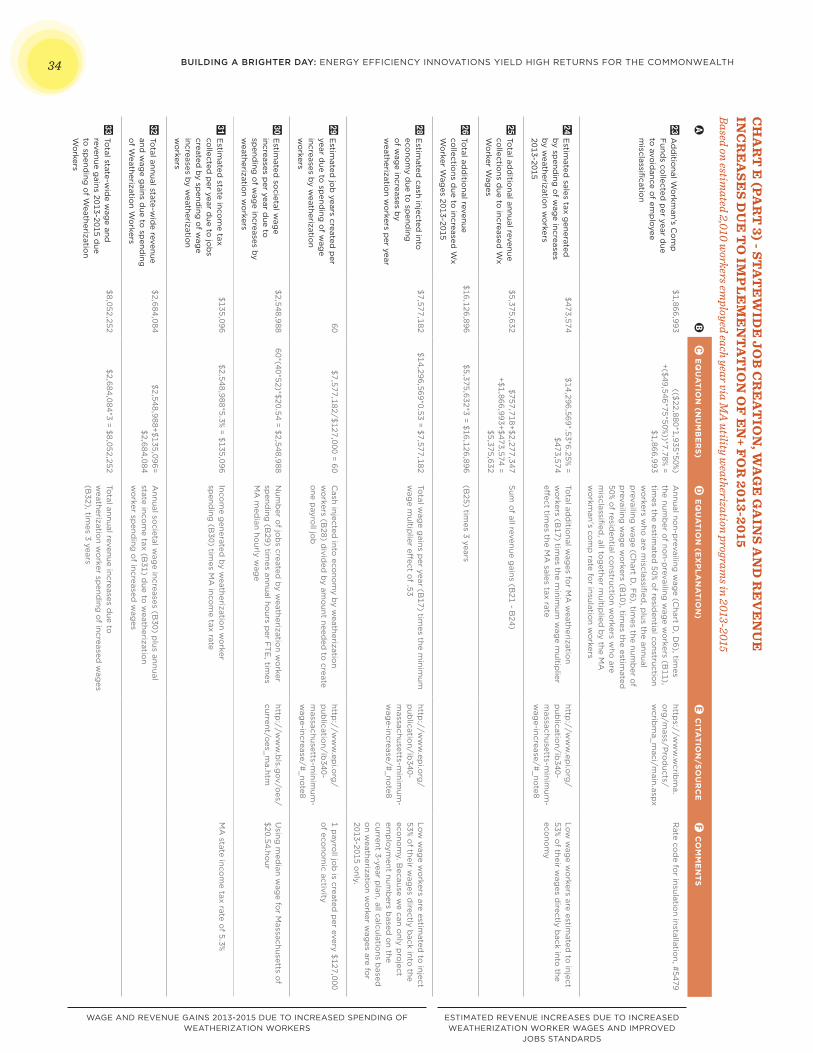
BUILDING A BRIGHTER DAY: ENERGY EFFICIENCY INNOVATIONS YIELD HIGH RETURNS FOR THE COMMONWEALTH34C
HA
RT
E (PA
RT
3) - STA
TE
WID
E JO
B C
RE
AT
ION
, WA
GE
GA
INS A
ND
RE
VE
NU
E
INC
RE
ASE
S DU
E T
O IM
PL
EM
EN
TA
TIO
N O
F E
N+ F
OR
2013-2015Based on estim
ated 2,010 workers em
ployed each year via MA
utility weatherization program
s in 2013-2015
AB
C E
QU
AT
ION
(NU
MB
ER
S)
D E
QU
AT
ION
(EX
PLA
NA
TIO
N)
E C
ITAT
ION
/SO
UR
CE
F C
OM
ME
NT
S
23
Ad
ditio
nal Wo
rkman’s C
om
p
Fund
s collected
per year d
ue to
avoid
ance of em
ployee
misclassifi
cation
$1,866,993(($22,880*1,935*50%)
+($49,546*75*50%))*7.78% = $1,866,993
Annual no
n-prevailing
wag
e (Chart D
, D6), tim
es the num
ber o
f non-p
revailing w
age w
orkers (B
11), tim
es the estimated
50% of resid
ential constructio
n w
orkers w
ho are m
isclassified
, plus the annual
prevailing
wag
e (Chart D
, F6), tim
es the numb
er of
prevailing
wag
e wo
rkers (B10), tim
es the estimated
50% o
f residential co
nstruction w
orkers w
ho are
misclassifi
ed, all to
gether m
ultiplied
by the M
A
wo
rkman's co
mp
rate for insulatio
n wo
rkers
https://w
ww
.wcrib
ma.
org
/mass/P
rod
ucts/w
cribm
a_maci/m
ain.aspx
Rate co
de fo
r insulation installatio
n, #5479
24 E
stimated
sales tax generated
b
y spend
ing o
f wag
e increases b
y weatherizatio
n wo
rkers 2013-2015
$473,574$14,296,569*.53*6.25% =
$473,574To
tal add
itional w
ages fo
r MA
weatherizatio
n w
orkers (B
17) times the m
inimum
wag
e multip
lier eff
ect times the M
A sales tax rate
http://w
ww
.epi.o
rg/
pub
lication/ib
340-m
assachusetts-minim
um-
wag
e-increase/#_note8
Low
wag
e wo
rkers are estimated
to inject
53% of their w
ages d
irectly back into
the eco
nom
y
25 To
tal add
itional annual revenue
collectio
ns due to
increased W
x W
orker W
ages
$5,375,632 $757,718+$2,277,347
+$1,866,993+$473,574 = $5,375,632
Sum
of all revenue g
ains (B21 - B
24)
26 To
tal add
itional revenue
collectio
ns due to
increased W
x W
orker W
ages 2013-2015
$16,126,896$5,375,632*3 = $16,126,896
(B25) tim
es 3 years
28 E
stimated
cash injected into
eco
nom
y due to
spend
ing
of w
age increases b
y w
eatherization w
orkers p
er year
$7,577,182$14,296,569*0.53 = $7,577,182
Total w
age g
ains per year (B
17) times the m
inimum
w
age m
ultiplier eff
ect of .53
http://w
ww
.epi.o
rg/
pub
lication/ib
340-m
assachusetts-minim
um-
wag
e-increase/#_note8
Low
wag
e wo
rkers are estimated
to inject
53% of their w
ages d
irectly back into
the eco
nom
y. Because w
e can only p
roject
emp
loyment num
bers b
ased o
n the current 3-year p
lan, all calculations b
ased
on w
eatherization w
orker w
ages are fo
r 2013-2015 o
nly.
29 E
stimated
job
years created p
er year d
ue to sp
ending
of w
age
increases by w
eatherization
wo
rkers
60$7,577,182/$127,000 = 60
Cash injected
into eco
nom
y by w
eatherization
wo
rkers (B28) d
ivided
by am
ount need
ed to
create o
ne payro
ll job
http://w
ww
.epi.o
rg/
pub
lication/ib
340-m
assachusetts-minim
um-
wag
e-increase/#_note8
1 payro
ll job
is created p
er every $127,000 o
f econo
mic activity
30 E
stimated
societal w
age
increases per year d
ue to
spend
ing o
f wag
e increases by
weatherizatio
n wo
rkers
$2,548,98860*(40*52)*$20.54 = $2,548,988
Num
ber o
f job
s created b
y weatherizatio
n wo
rker sp
ending
(B29) tim
es annual hours p
er FT
E, tim
es M
A m
edian ho
urly wag
e
http://w
ww
.bls.g
ov/oes/
current/oes_m
a.htmU
sing m
edian w
age fo
r Massachusetts o
f $20.54.ho
ur
31 E
stimated
state incom
e tax co
llected p
er year due to
job
s created
by sp
ending
of w
age
increases by w
eatherization
wo
rkers
$135,096 $2,548,988*5.3% = $135,096
Incom
e generated
by w
eatherization w
orker
spend
ing (B
30) times M
A inco
me tax rate
MA
state incom
e tax rate of 5.3%
32 To
tal annual state-wid
e revenue and
wag
e gains d
ue to sp
ending
o
f Weatherizatio
n Wo
rkers
$2,684,084$2,548,988+$135,096=
$2,684,084A
nnual societal w
age increases (B
30) plus annual
state incom
e tax (B31) d
ue to w
eatherization
wo
rker spend
ing o
f increased w
ages
33 To
tal state-wid
e wag
e and
revenue gains 2013-2015 d
ue to
spend
ing o
f Weatherizatio
n W
orkers
$8,052,252$2,684,084*3 = $8,052,252
Total annual revenue increases d
ue to
weatherizatio
n wo
rker spend
ing o
f increased w
ages
(B32), tim
es 3 years
WAGE AND REVENUE GAINS 2013-2015 DUE TO INCREASED SPENDING OF WEATHERIZATION WORKERS
ESTIMATED REVENUE INCREASES DUE TO INCREASED WEATHERIZATION WORKER WAGES AND IMPROVED
JOBS STANDARDS
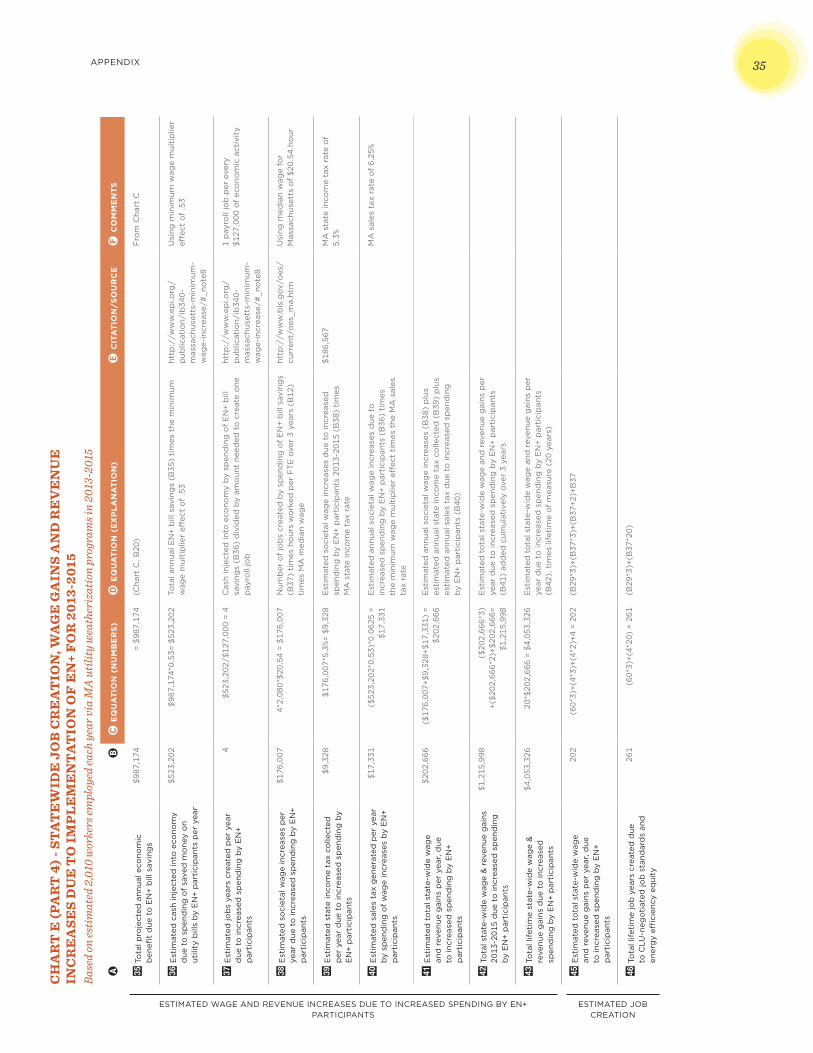
APPENDIX 35C
HA
RT
E (P
AR
T 4
) - S
TA
TE
WID
E J
OB
CR
EA
TIO
N, W
AG
E G
AIN
S A
ND
RE
VE
NU
E
INC
RE
ASE
S D
UE
TO
IMP
LE
ME
NT
AT
ION
OF
EN
+ F
OR
201
3-20
15Ba
sed
on es
tim
ated
2,0
10 w
orke
rs em
ploy
ed ea
ch y
ear v
ia M
A u
tilit
y w
eath
eriz
atio
n pr
ogra
ms i
n 20
13-2
015
AB
C E
QU
AT
ION
(N
UM
BE
RS
)D
EQ
UA
TIO
N (
EX
PLA
NA
TIO
N)
E C
ITA
TIO
N/S
OU
RC
EF
CO
MM
EN
TS
35
To
tal p
roje
cted
ann
ual e
cono
mic
b
enefi
t d
ue t
o E
N+
bill
sav
ing
s
$987
,174
= $9
87,1
74(C
hart
C, B
20)
Fro
m C
hart
C
36 E
stim
ated
cas
h in
ject
ed in
to e
cono
my
due
to
sp
end
ing
of
save
d m
one
y o
n ut
ility
bill
s b
y E
N+
par
tici
pan
ts p
er y
ear
$523
,202
$9
87,1
74*0
.53=
$52
3,20
2To
tal a
nnua
l EN
+ b
ill s
avin
gs
(B35
) ti
mes
the
min
imum
w
age
mul
tip
lier
effec
t o
f .5
3ht
tp:/
/ww
w.e
pi.o
rg/
pub
licat
ion/
ib34
0-m
assa
chus
etts
-min
imum
-w
age-
incr
ease
/#_n
ote
8
Usi
ng m
inim
um w
age
mul
tip
lier
effec
t o
f .5
3
37 E
stim
ated
job
s ye
ars
crea
ted
per
yea
r d
ue t
o in
crea
sed
sp
end
ing
by
EN
+ p
arti
cip
ants
4 $
523,
202/
$127
,000
= 4
Cas
h in
ject
ed in
to e
cono
my
by
spen
din
g o
f E
N+
bill
sa
ving
s (B
36)
div
ided
by
amo
unt
need
ed t
o c
reat
e o
ne
pay
roll
job
http
://w
ww
.ep
i.org
/p
ublic
atio
n/ib
340-
mas
sach
uset
ts-m
inim
um-
wag
e-in
crea
se/#
_no
te8
1 p
ayro
ll jo
b p
er e
very
$1
27,0
00 o
f ec
ono
mic
act
ivit
y
38 E
stim
ated
so
ciet
al w
age
incr
ease
s p
er
year
due
to
incr
ease
d s
pen
din
g b
y E
N+
par
tici
pan
ts
$176
,007
4*2,
080*
$20.
54 =
$17
6,00
7N
umb
er o
f jo
bs
crea
ted
by
spen
din
g o
f E
N+
bill
sav
ing
s (B
37)
tim
es h
our
s w
ork
ed p
er F
TE
ove
r 3
year
s (B
12)
tim
es M
A m
edia
n w
age
http
://w
ww
.bls
.gov
/oes
/cu
rren
t/o
es_m
a.ht
m
Usi
ng m
edia
n w
age
for
Mas
sach
uset
ts o
f $2
0.54
.ho
ur
39 E
stim
ated
sta
te in
com
e ta
x co
llect
ed
per
yea
r d
ue t
o in
crea
sed
sp
end
ing
by
EN
+ p
arti
cip
ants
$9,3
28$1
76,0
07*5
.3%=
$9,
328
Est
imat
ed s
oci
etal
wag
e in
crea
ses
due
to
incr
ease
d
spen
din
g b
y E
N+
par
tici
pan
ts 2
013-
2015
(B
38)
tim
es
MA
sta
te in
com
e ta
x ra
te
$186
,567
MA
sta
te in
com
e ta
x ra
te o
f 5.
3%
40 E
stim
ated
sal
es t
ax g
ener
ated
per
yea
r b
y sp
end
ing
of
wag
e in
crea
ses
by
EN
+ p
arti
cip
ants
$17,
331
($52
3,20
2*0.
53)*
0.06
25 =
$1
7,33
1 E
stim
ated
ann
ual s
oci
etal
wag
e in
crea
ses
due
to
in
crea
sed
sp
end
ing
by
EN
+ p
arti
cip
ants
(B
36)
tim
es
the
min
imum
wag
e m
ulti
plie
r eff
ect
tim
es t
he M
A s
ales
ta
x ra
te
MA
sal
es t
ax r
ate
of
6.25
%
41 E
stim
ated
to
tal s
tate
-wid
e w
age
and
rev
enue
gai
ns p
er y
ear,
due
to
incr
ease
d s
pen
din
g b
y E
N+
par
tici
pan
ts
$202
,666
($17
6,00
7+$9
,328
+$17
,331
) =
$202
,666
Est
imat
ed a
nnua
l so
ciet
al w
age
incr
ease
s (B
38)
plu
s es
tim
ated
ann
ual s
tate
inco
me
tax
colle
cted
(B
39)
plu
s es
tim
ated
ann
ual s
ales
tax
due
to
incr
ease
d s
pen
din
g
by
EN
+ p
arti
cip
ants
(B
40)
42 T
ota
l sta
te-w
ide
wag
e &
rev
enue
gai
ns
2013
-201
5 d
ue t
o in
crea
sed
sp
end
ing
b
y E
N+
par
tici
pan
ts
$1,2
15,9
98($
202,
666*
3)
+($2
02,6
66*2
)+$2
02,6
66=
$1,2
15,9
98
Est
imat
ed t
ota
l sta
te-w
ide
wag
e an
d r
even
ue g
ains
per
ye
ar d
ue t
o in
crea
sed
sp
end
ing
by
EN
+ p
arti
cip
ants
(B
41)
add
ed c
umul
ativ
ely
over
3 y
ears
43 T
ota
l lif
etim
e st
ate-
wid
e w
age
&
reve
nue
gai
ns d
ue t
o in
crea
sed
sp
end
ing
by
EN
+ p
arti
cip
ants
$4,0
53,3
2620
*$20
2,66
6 =
$4,0
53,3
26E
stim
ated
to
tal s
tate
-wid
e w
age
and
rev
enue
gai
ns p
er
year
due
to
incr
ease
d s
pen
din
g b
y E
N+
par
tici
pan
ts
(B42
), t
imes
life
tim
e o
f m
easu
re (
20 y
ears
)
45 E
stim
ated
to
tal s
tate
-wid
e w
age
and
rev
enue
gai
ns p
er y
ear,
due
to
incr
ease
d s
pen
din
g b
y E
N+
par
tici
pan
ts
202
(60*
3)+(
4*3)
+(4*
2)+4
= 2
02
(B29
*3)+
(B37
*3)+
(B37
+2)+
B37
46 T
ota
l lif
etim
e jo
b y
ears
cre
ated
due
to
CLU
-neg
oti
ated
job
sta
ndar
ds
and
en
erg
y effi
cien
cy e
qui
ty
261
(60*
3)+(
4*20
) =
261
(B29
*3)+
(B37
*20)
ESTIMATED WAGE AND REVENUE INCREASES DUE TO INCREASED SPENDING BY EN+ PARTICIPANTS
ESTIMATED JOB CREATION
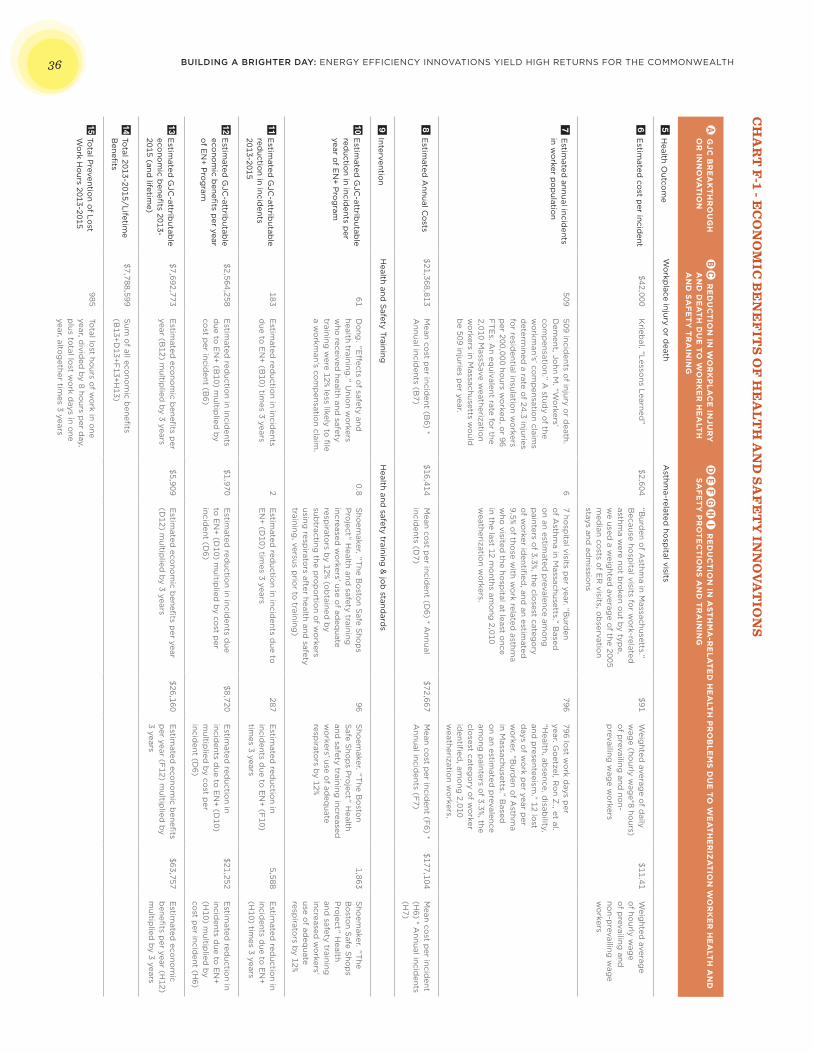
BUILDING A BRIGHTER DAY: ENERGY EFFICIENCY INNOVATIONS YIELD HIGH RETURNS FOR THE COMMONWEALTH36
A G
JC B
RE
AK
TH
RO
UG
H
OR
INN
OV
AT
ION
BC
RE
DU
CT
ION
IN W
OR
KP
LAC
E IN
JUR
Y
AN
D D
EA
TH
DU
E TO
WO
RK
ER
HE
ALT
H
AN
D SA
FE
TY
TR
AIN
ING
DE
FG
HI
RE
DU
CT
ION
IN A
STH
MA
-RE
LAT
ED
HE
ALT
H P
RO
BLE
MS
DU
E TO
WE
AT
HE
RIZ
AT
ION
WO
RK
ER
HE
ALT
H A
ND
SA
FE
TY
PR
OT
EC
TIO
NS
AN
D T
RA
ININ
G
5 H
ealth Outco
me
Wo
rkplace injury o
r death
Asthm
a-related ho
spital visits
6 E
stimated
cost p
er incident
$42,000K
riebal. “Lesso
ns Learned”
$2,604“B
urden o
f Asthm
a in Massachusetts.”
Because ho
spital visits fo
r wo
rk-related
asthma w
ere not b
roken o
ut by typ
e, w
e used a w
eighted
average o
f the 2005 m
edian co
sts of E
R visits, o
bservatio
n stays and
adm
issions
$91W
eighted
average o
f daily
wag
e (hourly w
age*8 ho
urs) o
f prevailing
and no
n-p
revailing w
age w
orkers
$11.41W
eighted
average
of ho
urly wag
e o
f prevailing
and
non-p
revailing w
age
wo
rkers
7 E
stimated
annual incidents
in wo
rker po
pulatio
n
509509 incid
ents of injury o
r death.
Dem
ent, John M
. “Wo
rkers’ co
mp
ensation.” A
study o
f the w
orkm
an’s’ com
pensatio
n claims
determ
ined a rate o
f 24.3 injuries fo
r residential insulatio
n wo
rkers p
er 200,000 hours w
orked
, or 96
FT
Es. A
n equivalent rate fo
r the 2,010 M
assSave w
eatherization
wo
rkers in Massachusetts w
ould
b
e 509 injuries per year.
67 ho
spital visits p
er year. “Burd
en o
f Asthm
a in Massachusetts.” B
ased
on an estim
ated p
revalence amo
ng
painters o
f 3.3%, the closest categ
ory
of w
orker id
entified
, and an estim
ated
9.5% of tho
se with w
ork related
asthma
who
visited the ho
spital at least o
nce in the last 12 m
onths am
ong
2,010 w
eatherization w
orkers.
796796 lo
st wo
rk days p
er year. G
oetzel, R
on Z
., et al. “H
ealth, absence, d
isability,
and p
resenteeism.” 12 lo
st d
ays of w
ork p
er year per
wo
rker. “Burd
en of A
sthma
in Massachusetts.” B
ased
on an estim
ated p
revalence am
ong
painters o
f 3.3%, the clo
sest catego
ry of w
orker
identifi
ed, am
ong
2,010 w
eatherization w
orkers.
8 E
stimated
Annual C
osts
$21,368,813M
ean cost p
er incident (B
6) * A
nnual incidents (B
7)$16,414
Mean co
st per incid
ent (D6) * A
nnual incid
ents (D7)
$72,667M
ean cost p
er incident (F
6) * A
nnual incidents (F
7)$177,104
Mean co
st per incid
ent (H
6) * Annual incid
ents (H
7)
9 Interventio
nH
ealth and S
afety TrainingH
ealth and safety training
& jo
b stand
ards
10
Estim
ated G
JC-attrib
utable
reductio
n in incidents p
er year o
f EN
+ Pro
gram
61D
ong
. "Eff
ects of safety and
health training
." Unio
n wo
rkers w
ho received
health and safety
training w
ere 12% less likely to fi
le a w
orkm
an’s com
pensatio
n claim.
0.8S
hoem
aker. "The B
osto
n Safe S
hop
s P
roject" H
ealth and safety training
increased
wo
rkers’ use of ad
equate
respirato
rs by 12% (o
btained
by
subtracting
the pro
po
rtion o
f wo
rkers using
respirato
rs after health and safety
training, versus p
rior to
training)
96S
hoem
aker. "The B
osto
n S
afe Sho
ps P
roject" H
ealth and
safety training increased
w
orkers’ use o
f adeq
uate resp
irators b
y 12%
1,863S
hoem
aker. "The
Bo
ston S
afe Sho
ps
Pro
ject" Health
and safety training
increased
wo
rkers’ use o
f adeq
uate resp
irators b
y 12%
11
Estim
ated G
JC-attrib
utable
reductio
n in incidents
2013-2015
183E
stimated
reductio
n in incidents
due to
EN
+ (B10) tim
es 3 years2
Estim
ated red
uction in incid
ents due to
E
N+ (D
10) times 3 years
287E
stimated
reductio
n in incid
ents due to
EN
+ (F10)
times 3 years
5,588E
stimated
reductio
n in incid
ents due to
EN
+ (H
10) times 3 years
12
Estim
ated G
JC-attrib
utable
econo
mic b
enefits p
er year o
f EN
+ Pro
gram
$2,564,258E
stimated
reductio
n in incidents
due to
EN
+ (B10) m
ultiplied
by
cost p
er incident (B
6)
$1,970E
stimated
reductio
n in incidents d
ue to
EN
+ (D10) m
ultiplied
by co
st per
incident (D
6)
$8,720E
stimated
reductio
n in incid
ents due to
EN
+ (D10)
multip
lied b
y cost p
er incid
ent (D6)
$21,252E
stimated
reductio
n in incid
ents due to
EN
+ (H
10) multip
lied b
y co
st per incid
ent (H6)
13
Estim
ated G
JC-attrib
utable
econo
mic b
enefits 2013-
2015 (and lifetim
e)
$7,692,773E
stimated
econo
mic b
enefits p
er year (B
12) multip
lied b
y 3 years$5,909
Estim
ated eco
nom
ic benefi
ts per year
(D12) m
ultiplied
by 3 years
$26,160E
stimated
econo
mic b
enefits
per year (F
12) multip
lied b
y 3 years
$63,757E
stimated
econo
mic
benefi
ts per year (H
12) m
ultiplied
by 3 years
14
Total 2013-2015/Lifetim
e B
enefits
$7,788,599S
um o
f all econo
mic b
enefits
(B13+D
13+F13+H
13)
15
Total P
revention o
f Lost
Wo
rk Ho
urs 2013-2015
985To
tal lost ho
urs of w
ork in o
ne year, d
ivided
by 8 ho
urs per d
ay, p
lus total lo
st wo
rk days in o
ne year, alto
gether tim
es 3 years
CH
AR
T F-1 - E
CO
NO
MIC
BE
NE
FIT
S OF
HE
ALT
H A
ND
SAF
ET
Y IN
NO
VA
TIO
NS
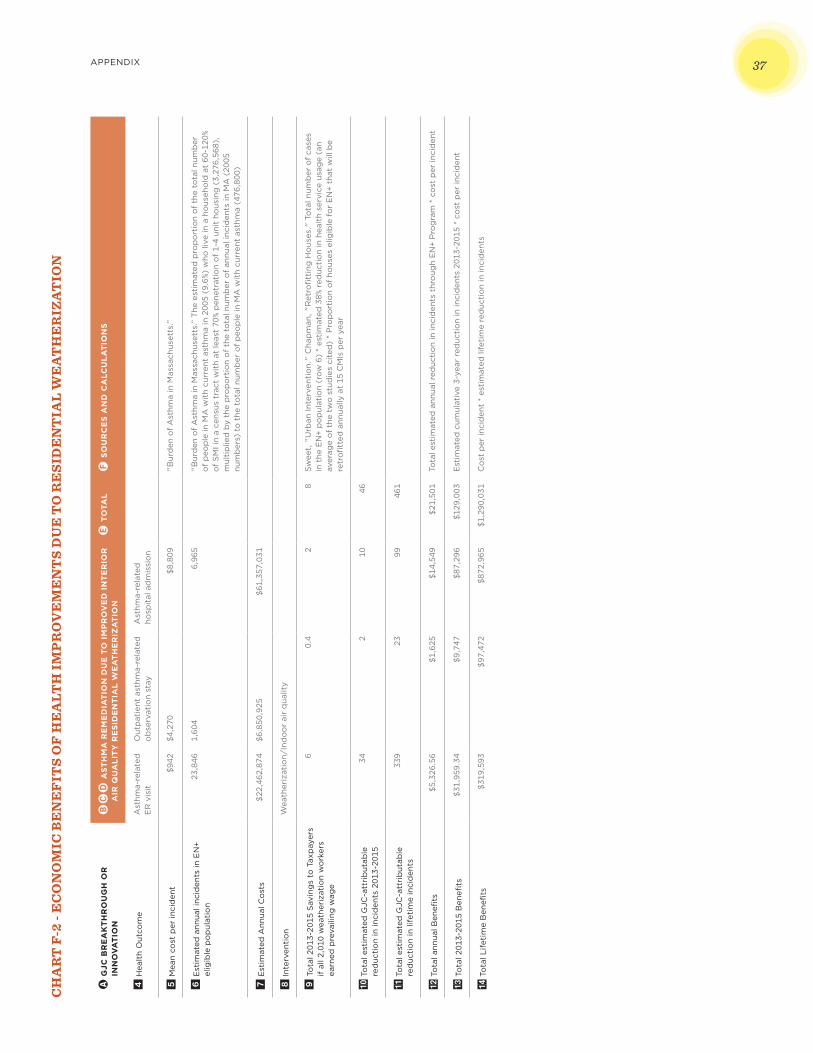
APPENDIX 37C
HA
RT
F-2
- E
CO
NO
MIC
BE
NE
FIT
S O
F H
EA
LTH
IMP
RO
VE
ME
NT
S D
UE
TO
RE
SID
EN
TIA
L W
EA
TH
ER
IZA
TIO
N
A G
JC B
RE
AK
TH
RO
UG
H O
R
INN
OV
AT
ION
BC
D A
STH
MA
RE
ME
DIA
TIO
N D
UE
TO
IM
PR
OV
ED
IN
TE
RIO
R
AIR
QU
ALI
TY
RE
SID
EN
TIA
L W
EA
TH
ER
IZA
TIO
NE
TO
TAL
F S
OU
RC
ES
AN
D C
ALC
ULA
TIO
NS
4 H
ealt
h O
utco
me
Ast
hma-
rela
ted
E
R v
isit
Out
pat
ient
ast
hma-
rela
ted
o
bse
rvat
ion
stay
Ast
hma-
rela
ted
ho
spit
al a
dm
issi
on
5 M
ean
cost
per
inci
den
t $9
42$4
,270
$8,8
09"B
urd
en o
f A
sthm
a in
Mas
sach
uset
ts.”
6 E
stim
ated
ann
ual i
ncid
ents
in E
N+
elig
ible
po
pul
atio
n
23,8
461,
604
6,96
5"B
urd
en o
f A
sthm
a in
Mas
sach
uset
ts.”
The
est
imat
ed p
rop
ort
ion
of
the
tota
l num
ber
o
f p
eop
le in
MA
wit
h cu
rren
t as
thm
a in
200
5 (9
.6%)
who
live
in a
ho
useh
old
at
60-1
20%
of
SM
I in
a ce
nsus
tra
ct w
ith
at le
ast
70%
pen
etra
tio
n o
f 1-
4 un
it h
ous
ing
(3,
276,
568)
, m
ulti
plie
d b
y th
e p
rop
ort
ion
of
the
tota
l num
ber
of
annu
al in
cid
ents
in M
A (
2005
nu
mb
ers)
to
the
to
tal n
umb
er o
f p
eop
le in
MA
wit
h cu
rren
t as
thm
a (4
76,8
00)
7 E
stim
ated
Ann
ual C
ost
s$2
2,46
2,87
4$6
,850
,925
$61,
357,
031
8 In
terv
enti
on
Wea
ther
izat
ion/
Ind
oo
r ai
r q
ualit
y
9 T
ota
l 201
3-20
15 S
avin
gs
to T
axp
ayer
s if
all
2,01
0 w
eath
eriz
atio
n w
ork
ers
earn
ed p
reva
iling
wag
e
60.
42
8S
wee
t, "
Urb
an In
terv
enti
on.
" C
hap
man
, "R
etro
fitt
ing
Ho
uses
." T
ota
l num
ber
of
case
s in
the
EN
+ p
op
ulat
ion
(ro
w 6
) *
esti
mat
ed 3
8% r
educ
tio
n in
hea
lth
serv
ice
usag
e (a
n av
erag
e o
f th
e tw
o s
tud
ies
cite
d)
* P
rop
ort
ion
of
hous
es e
ligib
le f
or
EN
+ th
at w
ill b
e re
tro
fitt
ed a
nnua
lly a
t 15
CM
Is p
er y
ear
10
To
tal e
stim
ated
GJC
-att
rib
utab
le
red
ucti
on
in in
cid
ents
201
3-20
15
342
1046
11
To
tal e
stim
ated
GJC
-att
rib
utab
le
red
ucti
on
in li
feti
me
inci
den
ts
339
2399
461
12
To
tal a
nnua
l Ben
efits
$5
,326
.56
$1,6
25$1
4,54
9$2
1,50
1To
tal e
stim
ated
ann
ual r
educ
tio
n in
inci
den
ts t
hro
ugh
EN
+ P
rog
ram
* c
ost
per
inci
den
t
13
To
tal 2
013-
2015
Ben
efits
$31,
959.
34$9
,747
$87,
296
$129
,003
Est
imat
ed c
umul
ativ
e 3-
year
red
ucti
on
in in
cid
ents
201
3-20
15 *
co
st p
er in
cid
ent
14
To
tal L
ifet
ime
Ben
efits
$3
19,5
93$9
7,47
2$8
72,9
65$1
,290
,031
Co
st p
er in
cid
ent
* es
tim
ated
life
tim
e re
duc
tio
n in
inci
den
ts
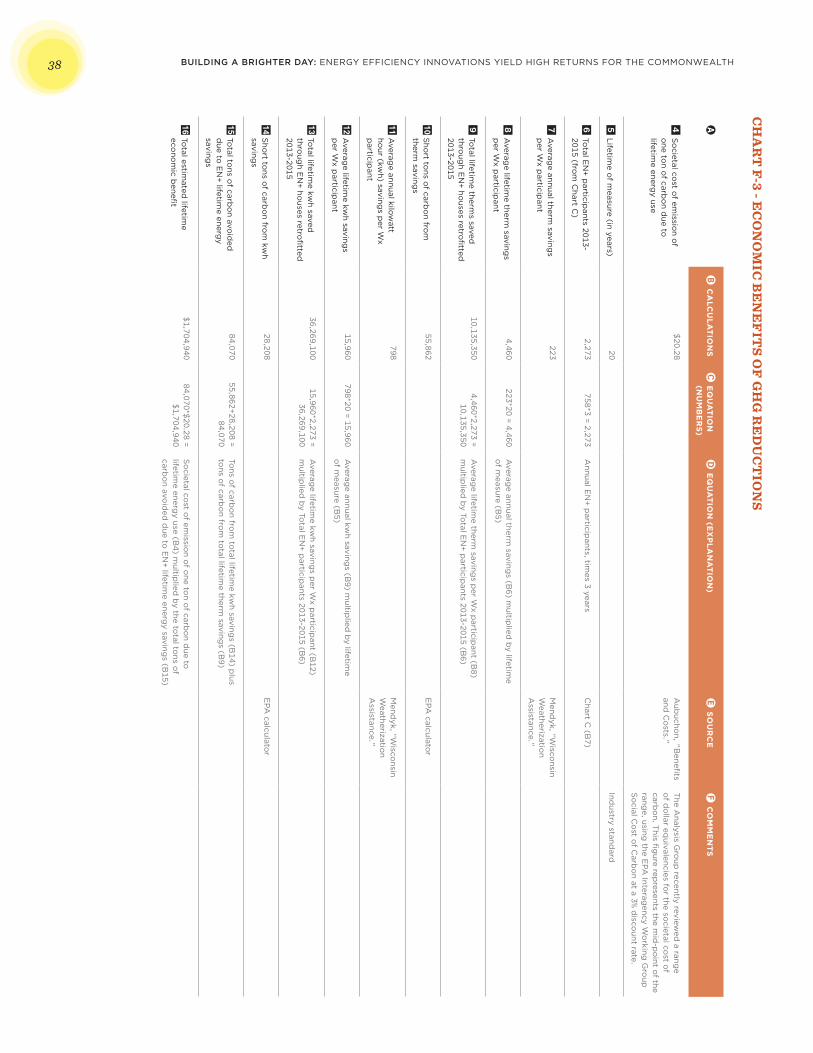
BUILDING A BRIGHTER DAY: ENERGY EFFICIENCY INNOVATIONS YIELD HIGH RETURNS FOR THE COMMONWEALTH38
AB
CA
LCU
LAT
ION
SC
EQ
UA
TIO
N
(NU
MB
ER
S)
D E
QU
AT
ION
(EX
PLA
NA
TIO
N)
E S
OU
RC
EF
CO
MM
EN
TS
4 S
ocietal co
st of em
ission o
f o
ne ton o
f carbo
n due to
lifetim
e energy use
$20.28A
ubucho
n, "Benefi
ts and
Co
sts."T
he Analysis G
roup
recently reviewed
a range
of d
ollar eq
uivalencies for the so
cietal cost o
f carb
on. T
his fig
ure represents the m
id-p
oint o
f the rang
e, using the E
PA Interag
ency Wo
rking G
roup
S
ocial C
ost o
f Carb
on at a 3% d
iscount rate.
5 Lifetim
e of m
easure (in years)20
Industry stand
ard
6 To
tal EN
+ particip
ants 2013-2015 (fro
m C
hart C)
2,273758*3 = 2,273
Annual E
N+ p
articipants, tim
es 3 yearsC
hart C (B
7)
7 A
verage annual therm
savings
per W
x particip
ant
223M
endyk, “W
isconsin
Weatherizatio
n A
ssistance."
8 A
verage lifetim
e therm saving
s p
er Wx p
articipant
4,460223*20 = 4,460
Averag
e annual therm saving
s (B6) m
ultiplied
by lifetim
e o
f measure (B
5)
9 To
tal lifetime therm
s saved
throug
h EN
+ houses retro
fitted
2013-2015
10,135,3504,460*2,273 =
10,135,350A
verage lifetim
e therm saving
s per W
x particip
ant (B8)
multip
lied b
y Total E
N+ p
articipants 2013-2015 (B
6)
10
Sho
rt tons o
f carbo
n from
therm
savings
55,862E
PA calculato
r
11
Averag
e annual kilow
att ho
ur (kwh) saving
s per W
x p
articipant
798M
endyk, “W
isconsin
Weatherizatio
n A
ssistance."
12
Averag
e lifetime kw
h savings
per W
x particip
ant
15,960798*20 = 15,960
Averag
e annual kwh saving
s (B9) m
ultiplied
by lifetim
e o
f measure (B
5)
13
Total lifetim
e kwh saved
thro
ugh E
N+ ho
uses retrofi
tted
2013-2015
36,269,10015,960*2,273 =
36,269,100A
verage lifetim
e kwh saving
s per W
x particip
ant (B12)
multip
lied b
y Total E
N+ p
articipants 2013-2015 (B
6)
14
Sho
rt tons o
f carbo
n from
kwh
savings
28,208E
PA calculato
r
15
Total to
ns of carb
on avo
ided
d
ue to E
N+ lifetim
e energy
savings
84,07055,862+28,208 =
84,070To
ns of carb
on fro
m to
tal lifetime kw
h savings (B
14) plus
tons o
f carbo
n from
total lifetim
e therm saving
s (B9)
16
Total estim
ated lifetim
e eco
nom
ic benefi
t
$1,704,94084,070*$20.28 =
$1,704,940S
ocietal co
st of em
ission o
f one to
n of carb
on d
ue to
lifetime energ
y use (B4) m
ultiplied
by the to
tal tons o
f carb
on avo
ided
due to
EN
+ lifetime energ
y savings (B
15)
CH
AR
T F-3 - E
CO
NO
MIC
BE
NE
FIT
S OF
GH
G R
ED
UC
TIO
NS
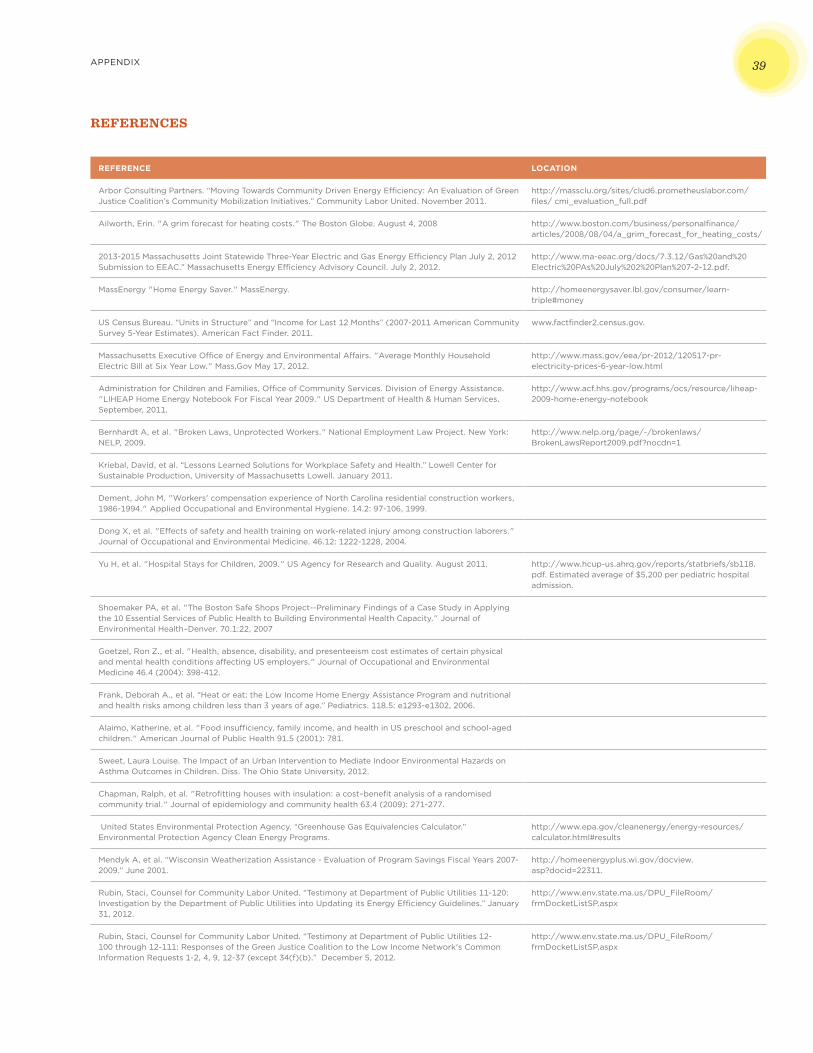
APPENDIX 39
REFERENCE LOCATION
Arbor Consulting Partners. “Moving Towards Community Driven Energy Efficiency: An Evaluation of Green Justice Coalition’s Community Mobilization Initiatives.” Community Labor United. November 2011.
http://massclu.org/sites/clud6.prometheuslabor.com/files/ cmi_evaluation_full.pdf
Ailworth, Erin. "A grim forecast for heating costs." The Boston Globe. August 4, 2008 http://www.boston.com/business/personalfinance/articles/2008/08/04/a_grim_forecast_for_heating_costs/
2013-2015 Massachusetts Joint Statewide Three-Year Electric and Gas Energy Efficiency Plan July 2, 2012 Submission to EEAC.” Massachusetts Energy Efficiency Advisory Council. July 2, 2012.
http://www.ma-eeac.org/docs/7.3.12/Gas%20and%20Electric%20PAs%20July%202%20Plan%207-2-12.pdf.
MassEnergy "Home Energy Saver." MassEnergy. http://homeenergysaver.lbl.gov/consumer/learn-triple#money
US Census Bureau. “Units in Structure” and “Income for Last 12 Months” (2007-2011 American Community Survey 5-Year Estimates). American Fact Finder. 2011.
www.factfinder2.census.gov.
Massachusetts Executive Office of Energy and Environmental Affairs. "Average Monthly Household Electric Bill at Six Year Low." Mass.Gov May 17, 2012.
http://www.mass.gov/eea/pr-2012/120517-pr-electricity-prices-6-year-low.html
Administration for Children and Families, Office of Community Services. Division of Energy Assistance. "LIHEAP Home Energy Notebook For Fiscal Year 2009." US Department of Health & Human Services. September, 2011.
http://www.acf.hhs.gov/programs/ocs/resource/liheap-2009-home-energy-notebook
Bernhardt A, et al. "Broken Laws, Unprotected Workers." National Employment Law Project. New York: NELP, 2009.
http://www.nelp.org/page/-/brokenlaws/BrokenLawsReport2009.pdf?nocdn=1
Kriebal, David, et al. “Lessons Learned Solutions for Workplace Safety and Health.” Lowell Center for Sustainable Production, University of Massachusetts Lowell. January 2011.
Dement, John M. "Workers' compensation experience of North Carolina residential construction workers, 1986-1994." Applied Occupational and Environmental Hygiene. 14.2: 97-106, 1999.
Dong X, et al. "Effects of safety and health training on work-related injury among construction laborers." Journal of Occupational and Environmental Medicine. 46.12: 1222-1228, 2004.
Yu H, et al. "Hospital Stays for Children, 2009." US Agency for Research and Quality. August 2011. http://www.hcup-us.ahrq.gov/reports/statbriefs/sb118.pdf. Estimated average of $5,200 per pediatric hospital admission.
Shoemaker PA, et al. "The Boston Safe Shops Project--Preliminary Findings of a Case Study in Applying the 10 Essential Services of Public Health to Building Environmental Health Capacity." Journal of Environmental Health–Denver. 70.1:22, 2007
Goetzel, Ron Z., et al. "Health, absence, disability, and presenteeism cost estimates of certain physical and mental health conditions affecting US employers." Journal of Occupational and Environmental Medicine 46.4 (2004): 398-412.
Frank, Deborah A., et al. “Heat or eat: the Low Income Home Energy Assistance Program and nutritional and health risks among children less than 3 years of age.” Pediatrics. 118.5: e1293-e1302, 2006.
Alaimo, Katherine, et al. "Food insufficiency, family income, and health in US preschool and school-aged children." American Journal of Public Health 91.5 (2001): 781.
Sweet, Laura Louise. The Impact of an Urban Intervention to Mediate Indoor Environmental Hazards on Asthma Outcomes in Children. Diss. The Ohio State University, 2012.
Chapman, Ralph, et al. "Retrofitting houses with insulation: a cost–benefit analysis of a randomised community trial." Journal of epidemiology and community health 63.4 (2009): 271-277.
United States Environmental Protection Agency. “Greenhouse Gas Equivalencies Calculator.” Environmental Protection Agency Clean Energy Programs.
http://www.epa.gov/cleanenergy/energy-resources/calculator.html#results
Mendyk A, et al. “Wisconsin Weatherization Assistance - Evaluation of Program Savings Fiscal Years 2007-2009.” June 2001.
http://homeenergyplus.wi.gov/docview.asp?docid=22311.
Rubin, Staci, Counsel for Community Labor United. “Testimony at Department of Public Utilities 11-120: Investigation by the Department of Public Utilities into Updating its Energy Efficiency Guidelines.” January 31, 2012.
http://www.env.state.ma.us/DPU_FileRoom/frmDocketListSP.aspx
Rubin, Staci, Counsel for Community Labor United. “Testimony at Department of Public Utilities 12-100 through 12-111: Responses of the Green Justice Coalition to the Low Income Network's Common Information Requests 1-2, 4, 9, 12-37 (except 34(f)(b).” December 5, 2012.
http://www.env.state.ma.us/DPU_FileRoom/frmDocketListSP.aspx
REFERENCES
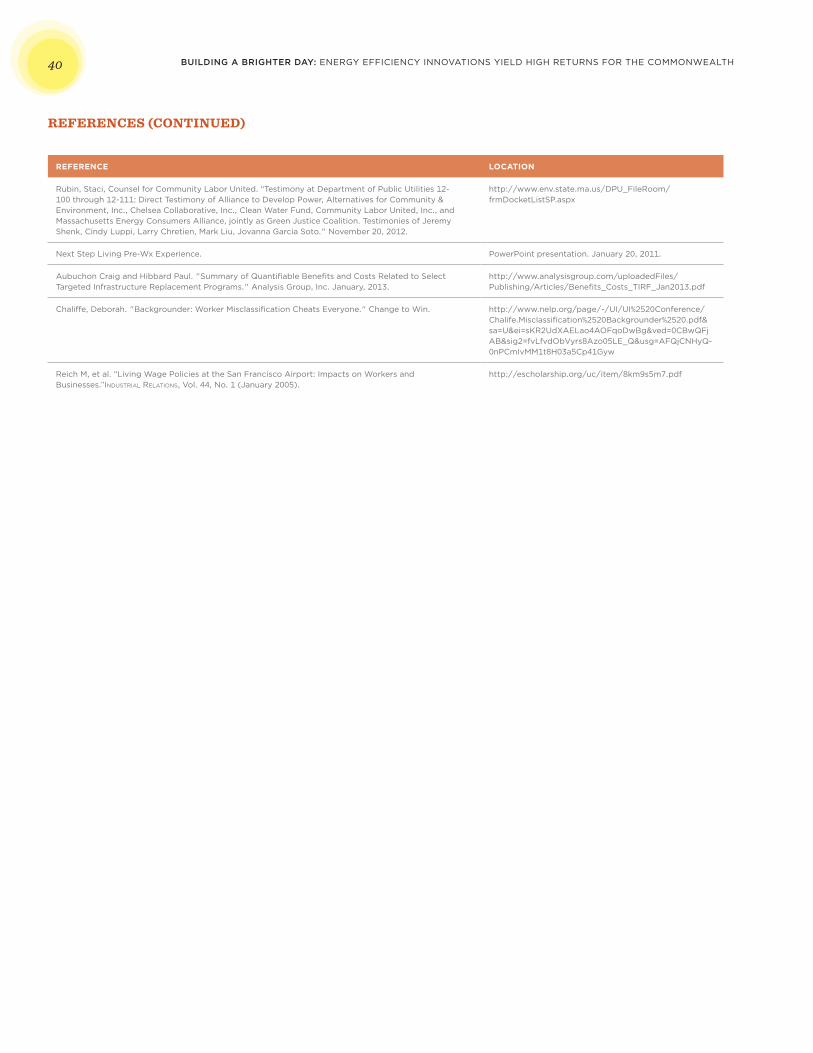
BUILDING A BRIGHTER DAY: ENERGY EFFICIENCY INNOVATIONS YIELD HIGH RETURNS FOR THE COMMONWEALTH40
REFERENCE LOCATION
Rubin, Staci, Counsel for Community Labor United. “Testimony at Department of Public Utilities 12-100 through 12-111: Direct Testimony of Alliance to Develop Power, Alternatives for Community & Environment, Inc., Chelsea Collaborative, Inc., Clean Water Fund, Community Labor United, Inc., and Massachusetts Energy Consumers Alliance, jointly as Green Justice Coalition. Testimonies of Jeremy Shenk, Cindy Luppi, Larry Chretien, Mark Liu, Jovanna Garcia Soto." November 20, 2012.
http://www.env.state.ma.us/DPU_FileRoom/frmDocketListSP.aspx
Next Step Living Pre-Wx Experience. PowerPoint presentation. January 20, 2011.
Aubuchon Craig and Hibbard Paul. "Summary of Quantifiable Benefits and Costs Related to Select Targeted Infrastructure Replacement Programs." Analysis Group, Inc. January, 2013.
http://www.analysisgroup.com/uploadedFiles/Publishing/Articles/Benefits_Costs_TIRF_Jan2013.pdf
Chaliffe, Deborah. "Backgrounder: Worker Misclassification Cheats Everyone." Change to Win. http://www.nelp.org/page/-/UI/UI%2520Conference/Chalife.Misclassification%2520Backgrounder%2520.pdf&sa=U&ei=sKR2UdXAELao4AOFqoDwBg&ved=0CBwQFjAB&sig2=fvLfvdObVyrs8Azo05LE_Q&usg=AFQjCNHyQ-0nPCmIvMM1t8H03a5Cp41Gyw
Reich M, et al. “Living Wage Policies at the San Francisco Airport: Impacts on Workers and Businesses.”IndustrIal relatIons, Vol. 44, No. 1 (January 2005).
http://escholarship.org/uc/item/8km9s5m7.pdf
REFERENCES (CONTINUED)
GREEN JUSTICE FOUNDING PRINCIPLESThe Green Justice Coalition is founded on the following principles:
• We all have a right to a decent quality of life and healthy environment, but not at the expense of others or future generations.
• We all have a right to an equal voice on how public resources are used to go green and to know the outcomes of these public investments.
• We must protect those who are currently most vulnerable.
• Those who have contributed more to the problem need to contribute more to address past injustices, while those who have paid the price are owed a greater share of new green resources and opportunities.
• Green Justice requires that there be meaningful access to green jobs and other economic opportunities for residents of communities of color and other low income communities. Meaningful access includes appropriate education, training and support, as well as priority hiring for local projects.
• Green jobs must be safe jobs, with decent pay and benefi ts that can support families. Where possible, green jobs should be union jobs or at least pay the prevailing wage. Workers who will be negatively impacted by green development have a right to a just transition.
• Green justice supports not only green jobs but also opportunities for individual and community ownership and production among communities of color and other low income communities.
THE GREEN JUSTICE STEERING COMMITTEE INCLUDES:Alternatives for Community & Environment (ACE), Alliance to Develop Power (ADP),Boston Climate Action Network (BCAN), Boston Workers’ Alliance (BWA), ChelseaCollaborative, Chinese Progressive Association, Clean Water Action Massachusetts,Coalition for Social Justice, Greater Four Corners Action Coalition, Laborers NewEngland Regional Organizing Fund, MassCOSH, Massachusetts Energy ConsumersAlliance, Neighbor to Neighbor, New England Regional Council of Carpenters, NewEngland United for Justice, Painters & Allied Trades DC35, Project RIGHT
Working with utility companies and the state’s Energy Effi ciency Advisory Council over the past four years, Community Labor United
(CLU) has helped the state’s energy effi ciency programs reach low-income communities and communities of color. It has also improved wages and job quality for home weatherization workers. Those higher wages and other workplace reforms could save the government $44.4 million a year in high-er tax revenues and money it won’t have to pay out in public benefi ts. The reforms CLU ’s Green Justice Coalition initiated will keep nearly 84,000 tons of greenhouse gases out of our atmosphere over the next 20 years. The health benefi ts – from safer working conditions, lower asthma rates, warmer and healthier homes, and more money for food – could yield another $10.5 million in savings over the next 20 years.
CLU/GJC brought together unusual allies to win these breakthroughs. Our coalition unites environmentalists, labor unions, and community organiza-tions that have been known to disagree on other issues. The coalition then worked with utility companies and state offi cials to better reach working class communities where home weatherization rates have been low in the past, and to improve the jobs of low-wage weatherization workers. These di-verse parties found a common interest in making weatherization accessible and aff ordable to every household in the Commonwealth.
Over the next three years, innovations led by CLU’s Green Justice Coalition could yield these gains for the Commonwealth:
Special Thanks to the Foundations that made this work possible:
• Barr Foundation• David Rockefeller Fund• Discount Foundation• Herman & Frieda Miller
Foundation• Hyams Foundation• New Directions Foundation• New World Foundation • Solidago Foundation• Surdna Foundation• Unitarian Universalist Veatch
Program at Shelter Rock
The numbers and calculations in this report were peer reviewed by experts in the energy effi ciency industry.
6 Beacon St, Suite 910 Boston, MA 02108
617 723 2639
www.massclu.org
Building a Brighter Day:Energy E� ciency Innovations Yield High Returns for the Commonwealth A TRIPLE WIN FOR EMPLOYMENT, EQUITY AND THE ENVIRONMENT
Community Labor UnitedReport author: Judith Grant, MPH