Embed Size (px)
DESCRIPTION
buffet
Citation preview
Buffett’s Alpha 1
Buffett’s Alpha
Andrea Frazzini, David Kabiller, and Lasse H. Pedersen*
First Draft: May 3, 2012
This draft: August 29, 2012
Comments Welcome
Abstract
Berkshire Hathaway has a higher Sharpe ratio than any stock or mutual fund with a
history of more than 30 years and Berkshire has a significant alpha to traditional risk
factors. However, we find that the alpha become statistically insignificant when
controlling for exposures to Betting-Against-Beta and quality factors. We estimate that
Berkshire’s average leverage is about 1.6-to-1 and that it relies on unusually low-cost and
stable sources of financing. Berkshire’s returns can thus largely be explained by the use
of leverage combined with a focus on cheap, safe, quality stocks. We find that
Berkshire’s portfolio of publicly-traded stocks outperform private companies, suggesting
that Buffett’s returns are more due to stock selection than to a direct effect on
management.
* Andrea Frazzini and David Kabiller are at AQR Capital Management, Two Greenwich Plaza, Greenwich,
CT 06830, e-mail: [email protected]; web: http://www.econ.yale.edu/~af227/ . Lasse H. Pedersen is
at New York University, Copenhagen Business School, AQR Capital Management, CEPR, FRIC, and
NBER, 44 West Fourth Street, NY 10012-1126; e-mail: [email protected]; web:
http://www.stern.nyu.edu/~lpederse/. We thank Cliff Asness, Aaron Brown, John Howard, Ronen Israel,
Sarah Jiang and Scott Richardson for helpful comments and discussions. We are grateful to Nigel Dally for
providing us with historical 10-K filings.
Buffett’s Alpha 2
1. Introduction: The Secret Behind the Oracle’s Alpha
While much has been said and written about Warren Buffett and his investment
style, there has been little rigorous empirical analysis that explains his performance.
Every investor has a view on how Buffett has done it, but we seek the answer via a
thorough empirical analysis in light of some of the latest research on the drivers of stock
market returns.1
Buffett’s record is remarkable in many ways, but just how spectacular has the
performance of Berkshire Hathaway been compared to other stocks or mutual funds?
Looking at all U.S. stocks from 1926 to 2011 that have been traded for more than 30
years, we find that Berkshire Hathaway has the highest Sharpe ratio among all. Similarly,
Berkshire has a higher Sharpe ratio than all U.S. mutual funds that have been around for
more than 30 years.
We find that the Sharpe ratio of Berkshire Hathaway is 0.76 over the period 1976-
2011. While nearly double the Sharpe ratio of the overall stock market, this is lower than
many investors imagine. Adjusting for the market exposure, Berkshire’s information
ratio2 is even lower, 0.66. This Sharpe ratio reflects high average returns, but also
significant risk and periods of losses and significant drawdowns.
If his Sharpe ratio is very good but not unachievably good, then how did Buffett
become one of the most successful investors in the world? The answer is that Buffett has
boosted his returns with leverage, and that he has stuck to a good strategy for a very long
time period, surviving rough periods where others might have been forced into a fire sale
or a career shift. We estimate that Buffett applies a leverage of about 1.6-to-1, boosting
both his risk and excess return in that proportion. Thus, his many accomplishments
include having the conviction, wherewithal, and skill to operate with leverage and its risk
over multiple decades.
This leaves the key question: How does Buffett pick stocks to achieve a relatively
attractive return stream that can be leveraged? We identify several features of his
portfolio: He buys stocks that are “safe” (with low beta and low volatility), “cheap” (i.e.,
value stocks with low price-to-book ratios), and high-quality (meaning stocks that are
1 Based on the original insights of Black (1972) and Black, Jensen, and Scholes (1972), Frazzini and
Pedersen (2010) show that leverage and margin requirements change equilibrium risk premia. They show
that investors without binding leverage constraints can profit from Betting Against Beta (BAB), buying
low-risk assets and shorting risky assets. Frazzini and Pedersen (2012) extend this finding to derivatives
with embedded leverage, Asness, Frazzini, and Pedersen (2012a) to the risk-return relation across asset
classes, and Asness, Frazzini, and Pedersen (2012b) to fundamental measures of risk denoted quality.
2 The Information ratio is defined as the intercept in a regression of monthly excess returns divided by the
standard deviation of the residuals. The explanatory variable in the regression is the monthly excess returns
of the CRSP value-weighted market portfolio. Sharpe ratios and information ratios are annualized.
Buffett’s Alpha 3
profitable, stable, growing, and with high payout ratios). This statistical finding is
certainly with Buffett’s writings, e.g.:
Whether we’re talking about socks or stocks, I like buying quality
merchandise when it is marked down
– Warren Buffett, Berkshire Hathaway Inc., Annual Report, 2008.
Stocks with these characteristics – low risk, cheap, and high quality – tend to
perform well in general, not just the ones that Buffett buys. Our analysis seeks to
determine if Hathaway’s investment success is truly idiosyncratic or “alpha”, or if it can
be explained simply by these characteristics.
The standard academic factors that capture the market, size, value, and momentum
premia cannot explain Buffett’s performance so it has to date been a mystery (Martin and
Puthenpurackal (2008)). Given Buffett’s tendency to buy stocks with low return risk and
low fundamental risk, we further adjust his performance for the Betting-Against-Beta
(BAB) factor of Frazzini and Pedersen (2010) and the quality factor of Asness, Frazzini,
and Pedersen (2012b). We find that accounting for these factors explains a large part of
Buffett's performance. In other words, accounting for the general tendency of high-
quality, safe, and cheap stocks to outperform can explain much of Buffett’s performance
and controlling for these factors makes Buffett’s alpha statistically insignificant.
To illustrate this point in a different way, we create a portfolio that tracks Buffett’s
market exposure and active stock-selection themes, leveraged to the same active risk as
Berkshire. We find that this systematic Buffett-style portfolio performs comparably to
Berkshire Hathaway. Buffett’s genius thus appears to be at least partly in recognizing
early on, implicitly or explicitly, that these factors work, applying leverage without ever
having to fire sale, and sticking to his principles. Perhaps this is what he means by his
modest comment:
Ben Graham taught me 45 years ago that in investing it is not
necessary to do extraordinary things to get extraordinary results
– Warren Buffett, Berkshire Hathaway Inc., Annual Report, 1994.
It cannot be emphasized enough that explaining Buffett’s performance with the
benefit of hindsight does not diminish his outstanding accomplishment. He decided to
invest based on these principles half a century ago! He found a way to apply leverage.
Finally, he managed to stick to his principles and continue operating at high risk even
after experiencing some ups and downs that have caused many other investors to rethink
and retreat from their original strategies.
Finally, we consider whether Buffett’s skill is due to his ability to buy the right
stocks versus his ability as a CEO. Said differently, is Buffett mainly an investor or a
manager? To address this, we decompose Berkshire’s returns into a part due to
Buffett’s Alpha 4
investments in publicly traded stocks and another part due to private companies run
within Berkshire. The idea is that the return of the public stocks is mainly driven by
Buffett’s stock selection skill, whereas the private companies could also have a larger
element of management. We find that both public and private companies contribute to
Buffett’s performance, but the portfolio of public stocks performed better, suggesting that
Buffett’s skill is mostly in stock selection. Why then does Buffett rely heavily on private
companies as well, including insurance and reinsurance businesses? One reason might be
that this structure provides a steady source of financing, allowing him to leverage his
stock selection ability. Indeed, we find that 36% of Buffett’s liabilities consist of
insurance float with an average cost below the T-Bill rate.
In summary, we find that Buffett has developed a unique access to leverage that he
has invested in safe, high-quality, cheap stocks and that these key characteristics can
largely explain his impressive performance.
2. Data Sources
We use stock return data from the CRSP database, balance sheet data from the
Compustat/XpressFeed database as well as hand-collected annual reports, holdings data
for Berkshire Hathaway from Thomson Financial Institutional (13F) Holding Database
(based on Berkshire’s SEC filings), the size and cost of the insurance float from hand-
collected comments in Berkshire Hathaway’s annual reports, and mutual fund data from
the CRSP Mutual Fund Database. We also use factor returns from Ken French’s website,
from Frazzini and Pedersen (2010), and Asness, Frazzini, and Pedersen (2012b). We
describe our data sources and data filters in more detail in Appendix B.
3. Buffett’s Track Record
Buffett’s track record is clearly outstanding. A dollar invested in Berkshire
Hathaway in November 1976 (when our data sample starts) would have been worth more
than $1500 at the end of 2011. Over this time, Berkshire realized an average annual
return of 19.0% in excess of the T-Bill rate, significantly outperforming the general stock
market’s average excess return of 6.1%.
Berkshire stock also entailed more risk, realizing a volatility of 24.9%, higher than
the market volatility of 15.8%. However, Berskhire’s excess return was high even
relative to its risk, earning a Sharpe ratio of 19.0%/24.9% = 0.76, nearly twice the
market’s Sharpe ratio of 0.39. Berkshire realized a market beta of only 0.7, an important
point that we will discuss in more detail when we analyze the types of stocks that Buffett
buys. Adjusting Berkshire’s performance for market exposure, we compute its
Information ratio to be 0.66.
Buffett’s Alpha 5
These performance measures reflect Buffett’s impressive returns, but also that
Berkshire has been associated with some risk. Berkshire has had a number of down years
and drawdown periods. For example, from June 30, 1998 to February 29, 2000, Berkshire
lost 44% of its market value while the overall stock market gained 32%. While many
fund managers might have had trouble surviving a 76% shortfall, Buffett’s impeccable
reputation and unique structure as a corporation allowed him to stay the course and
rebound as the internet bubble burst.
To put Buffett’s performance in perspective, we compare Berkshire’s Sharpe and
Information ratios to those of all other U.S. common stocks. If Buffett is more of a stock
picker than a manager, an even better reference group than other stocks might be the
universe of actively managed mutual funds, so Table 1 compares Berkshire to both of
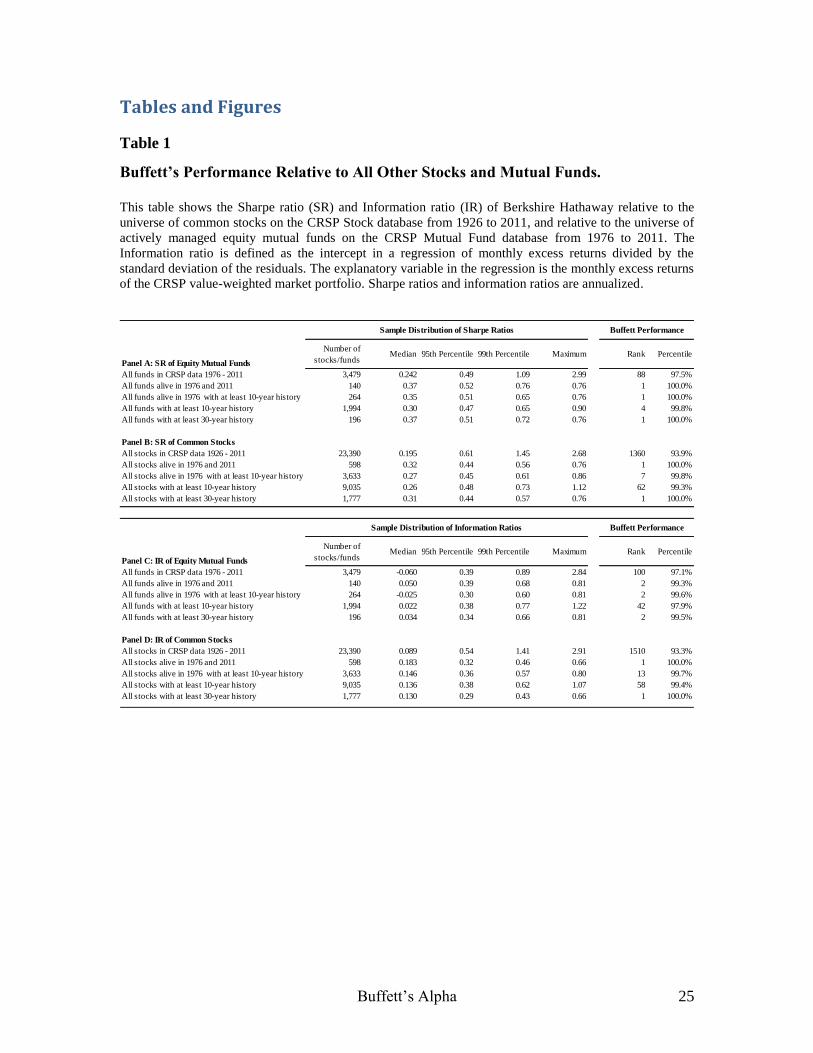
these groups.
Berkshire is in the top 3% among all mutual funds and top 7% among all stocks.
However, the stocks or mutual funds with the highest Sharpe ratios are often ones that
have only existed for short time and had a good run, which is associated with a large
degree of randomness.
To minimize the effect of randomness, Table 1 also compares Berkshire to all
stocks or mutual funds with at least a 10-year or 30-year history. Berkshire’s performance
is truly outstanding seen in this perspective. Among all stocks with at least a 30-year
history from 1926 to 2011, Berkshire has realized the highest Sharpe ratio and
Information ratio. If you could travel back in time and pick one stock in 1976, Berkshire
would be your pick. Figures 1 and 2 also illustrate how Berkshire lies in the very best tail
of the performance distribution of mutual funds and stocks that have survived at least 30
years.
4. Berkshire’s Leverage
Berkshire’s large returns come both from a high Sharpe ratio and an ability to
leverage performance to achieve large returns at higher risk. Berkshire uses leverage to
magnify returns, but how much leverage is used? Further, what are the sources of
leverage, their terms, and costs? To answer these questions, we study Berkshire
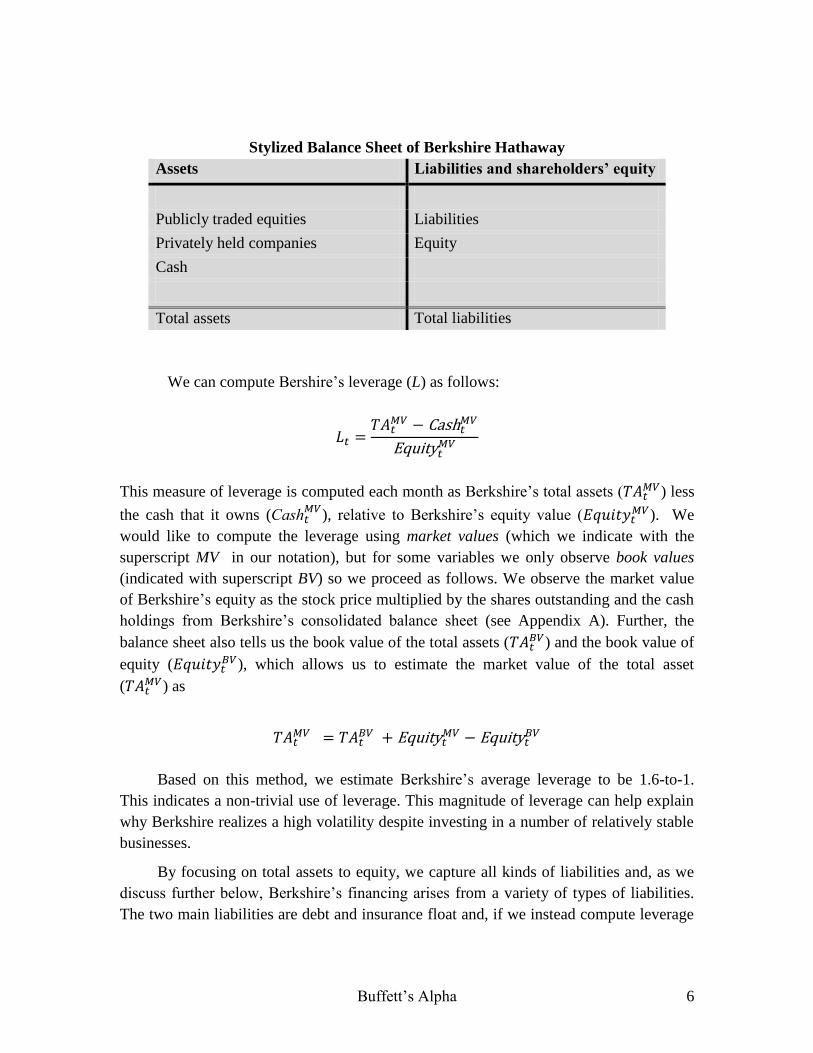
Hathaway’s balance sheet, which can be summarized as follows:
Buffett’s Alpha 6
Stylized Balance Sheet of Berkshire Hathaway
Assets Liabilities and shareholders’ equity
Publicly traded equities Liabilities
Privately held companies Equity
Cash
Total assets Total liabilities
We can compute Bershire’s leverage (L) as follows:
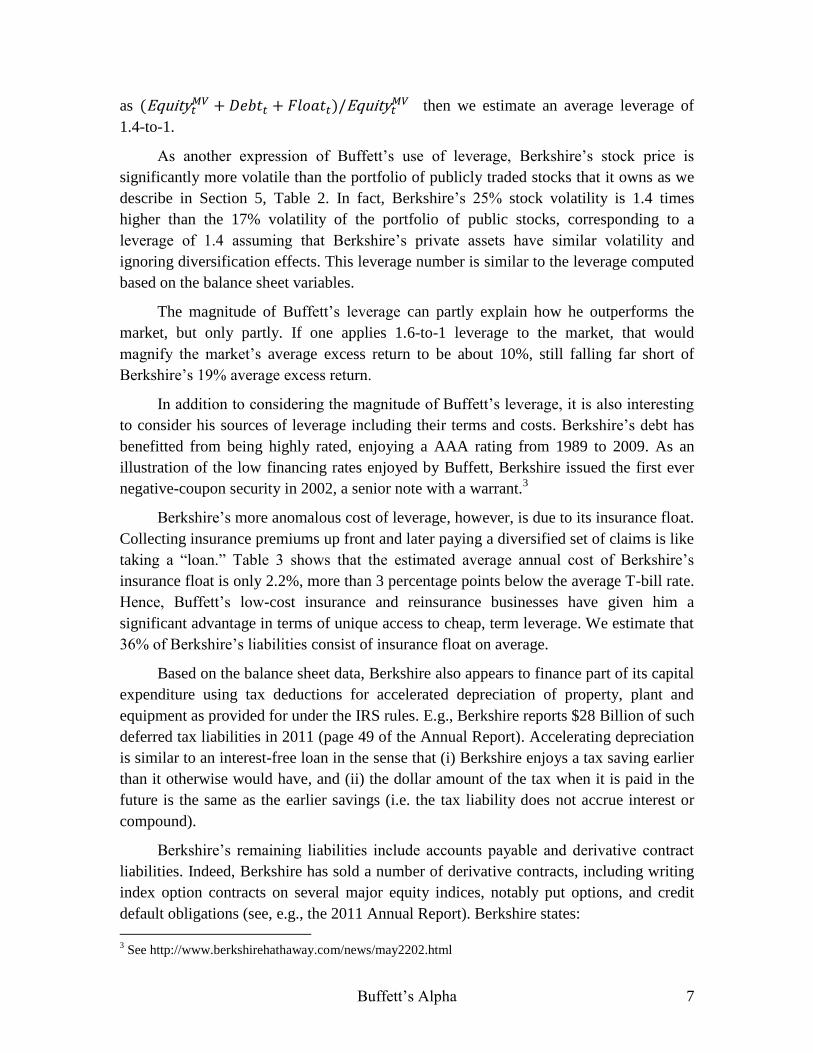
This measure of leverage is computed each month as Berkshire’s total assets ( ) less
the cash that it owns (
), relative to Berkshire’s equity value ( ). We
would like to compute the leverage using market values (which we indicate with the
superscript MV in our notation), but for some variables we only observe book values
(indicated with superscript BV) so we proceed as follows. We observe the market value
of Berkshire’s equity as the stock price multiplied by the shares outstanding and the cash
holdings from Berkshire’s consolidated balance sheet (see Appendix A). Further, the
balance sheet also tells us the book value of the total assets ( ) and the book value of
equity ( ), which allows us to estimate the market value of the total asset
( ) as
Based on this method, we estimate Berkshire’s average leverage to be 1.6-to-1.
This indicates a non-trivial use of leverage. This magnitude of leverage can help explain
why Berkshire realizes a high volatility despite investing in a number of relatively stable
businesses.
By focusing on total assets to equity, we capture all kinds of liabilities and, as we
discuss further below, Berkshire’s financing arises from a variety of types of liabilities.
The two main liabilities are debt and insurance float and, if we instead compute leverage
Buffett’s Alpha 7
as
then we estimate an average leverage of
1.4-to-1.
As another expression of Buffett’s use of leverage, Berkshire’s stock price is
significantly more volatile than the portfolio of publicly traded stocks that it owns as we
describe in Section 5, Table 2. In fact, Berkshire’s 25% stock volatility is 1.4 times
higher than the 17% volatility of the portfolio of public stocks, corresponding to a
leverage of 1.4 assuming that Berkshire’s private assets have similar volatility and
ignoring diversification effects. This leverage number is similar to the leverage computed
based on the balance sheet variables.
The magnitude of Buffett’s leverage can partly explain how he outperforms the
market, but only partly. If one applies 1.6-to-1 leverage to the market, that would
magnify the market’s average excess return to be about 10%, still falling far short of
Berkshire’s 19% average excess return.
In addition to considering the magnitude of Buffett’s leverage, it is also interesting
to consider his sources of leverage including their terms and costs. Berkshire’s debt has
benefitted from being highly rated, enjoying a AAA rating from 1989 to 2009. As an
illustration of the low financing rates enjoyed by Buffett, Berkshire issued the first ever
negative-coupon security in 2002, a senior note with a warrant.3
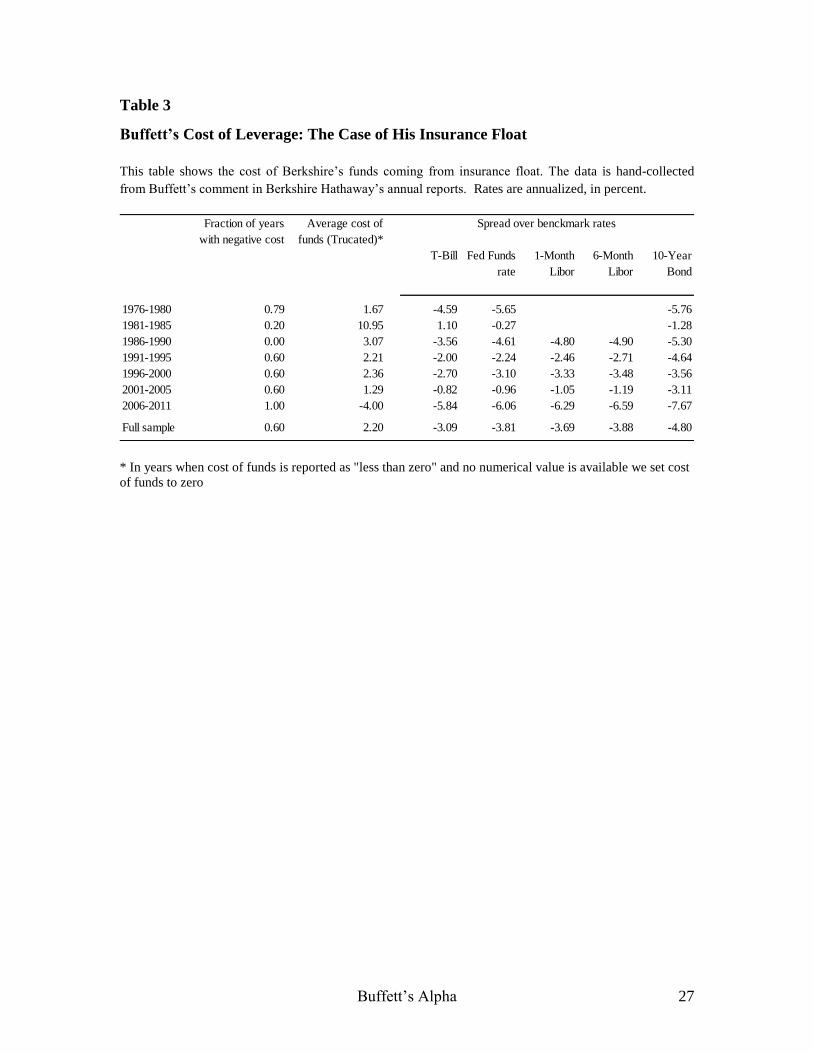
Berkshire’s more anomalous cost of leverage, however, is due to its insurance float.
Collecting insurance premiums up front and later paying a diversified set of claims is like
taking a “loan.” Table 3 shows that the estimated average annual cost of Berkshire’s
insurance float is only 2.2%, more than 3 percentage points below the average T-bill rate.
Hence, Buffett’s low-cost insurance and reinsurance businesses have given him a
significant advantage in terms of unique access to cheap, term leverage. We estimate that
36% of Berkshire’s liabilities consist of insurance float on average.
Based on the balance sheet data, Berkshire also appears to finance part of its capital
expenditure using tax deductions for accelerated depreciation of property, plant and
equipment as provided for under the IRS rules. E.g., Berkshire reports $28 Billion of such
deferred tax liabilities in 2011 (page 49 of the Annual Report). Accelerating depreciation
is similar to an interest-free loan in the sense that (i) Berkshire enjoys a tax saving earlier
than it otherwise would have, and (ii) the dollar amount of the tax when it is paid in the
future is the same as the earlier savings (i.e. the tax liability does not accrue interest or
compound).
Berkshire’s remaining liabilities include accounts payable and derivative contract
liabilities. Indeed, Berkshire has sold a number of derivative contracts, including writing
index option contracts on several major equity indices, notably put options, and credit
default obligations (see, e.g., the 2011 Annual Report). Berkshire states:
3 See http://www.berkshirehathaway.com/news/may2202.html
Buffett’s Alpha 8
We received the premiums on these contracts in full at the contract
inception dates … With limited exceptions, our equity index put
option and credit default contracts contain no collateral posting
requirements with respect to changes in either the fair value or
intrinsic value of the contracts and/or a downgrade of Berkshire’s
credit ratings.
– Warren Buffett, Berkshire Hathaway Inc., Annual Report, 2011.
Hence, Berkshire’s sale of derivatives may both serve as a source of financing and
as a source of revenue as such derivatives tend to be expensive (Frazzini and Pedersen
(2012)). Frazzini and Pedersen (2012) show that investors that are either unable or
unwilling to use leverage will pay a premium for instruments that embed the leverage,
such as option contracts and levered ETFs. Hence, Buffett can profit by supplying this
embedded leverage as he has a unique access to stable and cheap financing.
5. Decomposing Berkshire: Public Stocks vs. Private Companies
Berkshire Hathaway stock return can be decomposed into the performance of the
publicly traded companies that it owns, the performance of the privately held companies
that it owns, and the leverage it uses. The performance of the publicly traded companies
is a measure of Buffett’s stock selection ability whereas the performance of the privately
held companies additionally captures his success as a manager.
To evaluate Buffett’s pure stock selection ability, we collect the portfolio of
publicly held companies using Berkshire’s 13F filings to the Securities and Exchange
Commission, and we construct a monthly times series of the market value of all
Berkshire’s public stocks ( ) as well as the monthly return on this mimicking
portfolio (
). Specifically, at the end of each calendar quarter, we collect
Berkshire’s common stock holdings from its 13F filing and compute portfolio monthly
returns, weighted by Berkshire’s dollar holdings, under the assumption that the firm did
not change holdings between reports. The stocks in the portfolio are refreshed quarterly
based on the latest 13F, and the portfolio is rebalanced monthly to keep constant weights.
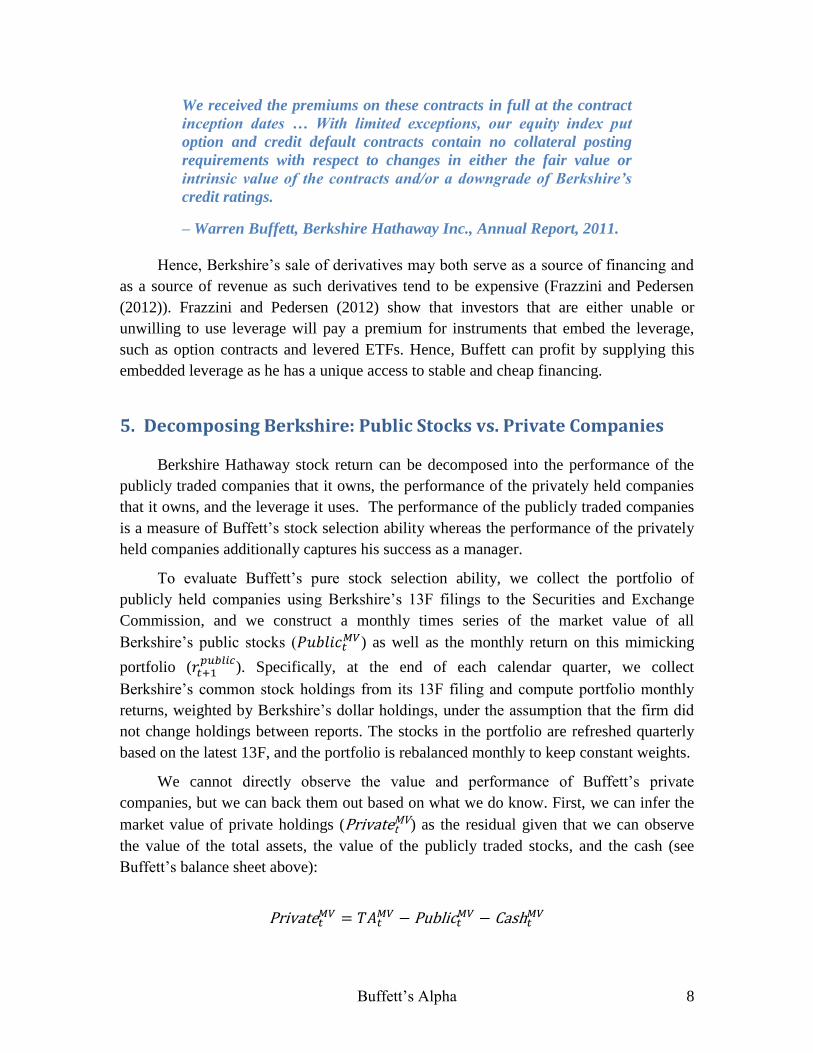
We cannot directly observe the value and performance of Buffett’s private
companies, but we can back them out based on what we do know. First, we can infer the
market value of private holdings ( ) as the residual given that we can observe
the value of the total assets, the value of the publicly traded stocks, and the cash (see
Buffett’s balance sheet above):
Buffett’s Alpha 9
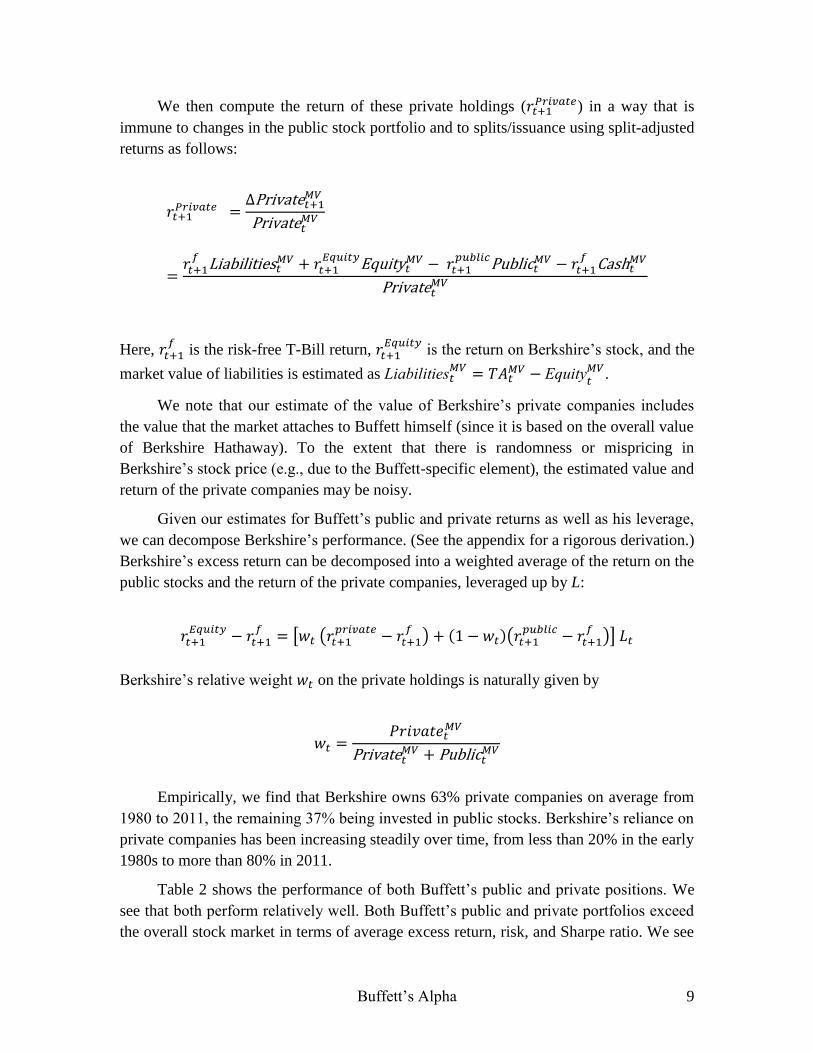
We then compute the return of these private holdings ( ) in a way that is
immune to changes in the public stock portfolio and to splits/issuance using split-adjusted
returns as follows:
Here,
is the risk-free T-Bill return,
is the return on Berkshire’s stock, and the
market value of liabilities is estimated as
.
We note that our estimate of the value of Berkshire’s private companies includes
the value that the market attaches to Buffett himself (since it is based on the overall value
of Berkshire Hathaway). To the extent that there is randomness or mispricing in
Berkshire’s stock price (e.g., due to the Buffett-specific element), the estimated value and
return of the private companies may be noisy.
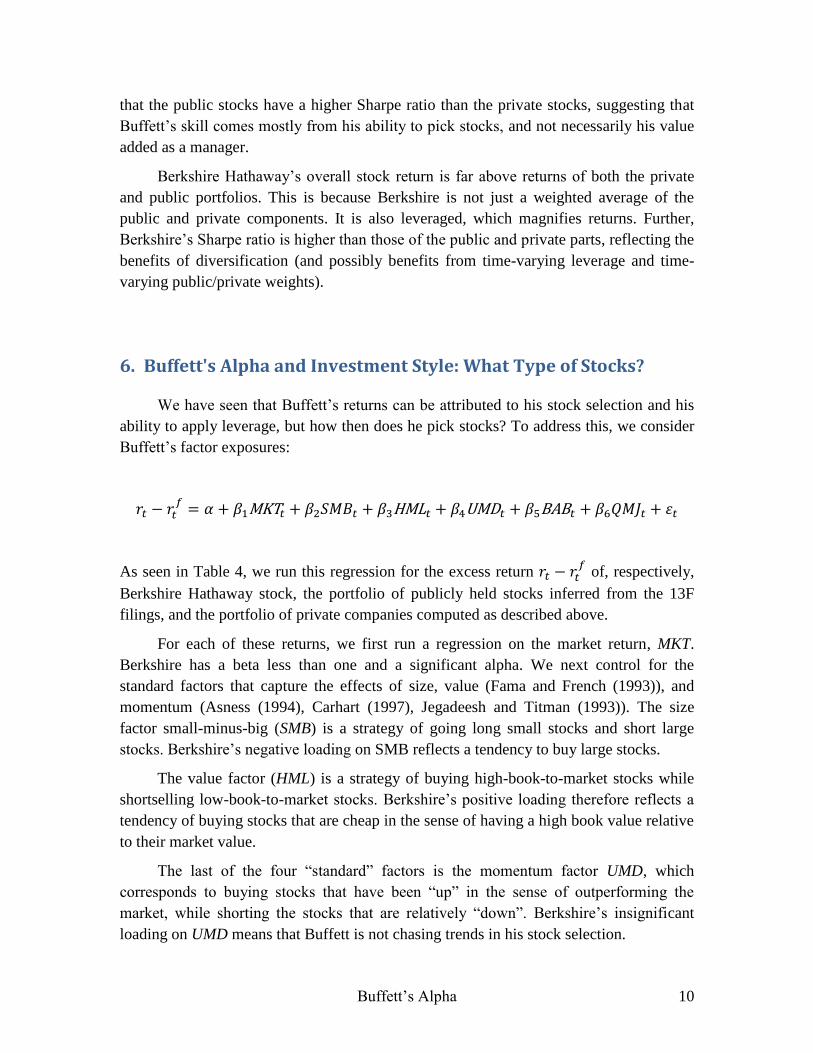
Given our estimates for Buffett’s public and private returns as well as his leverage,
we can decompose Berkshire’s performance. (See the appendix for a rigorous derivation.)
Berkshire’s excess return can be decomposed into a weighted average of the return on the
public stocks and the return of the private companies, leveraged up by L:
[ (
) (
)]
Berkshire’s relative weight on the private holdings is naturally given by
Empirically, we find that Berkshire owns 63% private companies on average from
1980 to 2011, the remaining 37% being invested in public stocks. Berkshire’s reliance on
private companies has been increasing steadily over time, from less than 20% in the early
1980s to more than 80% in 2011.
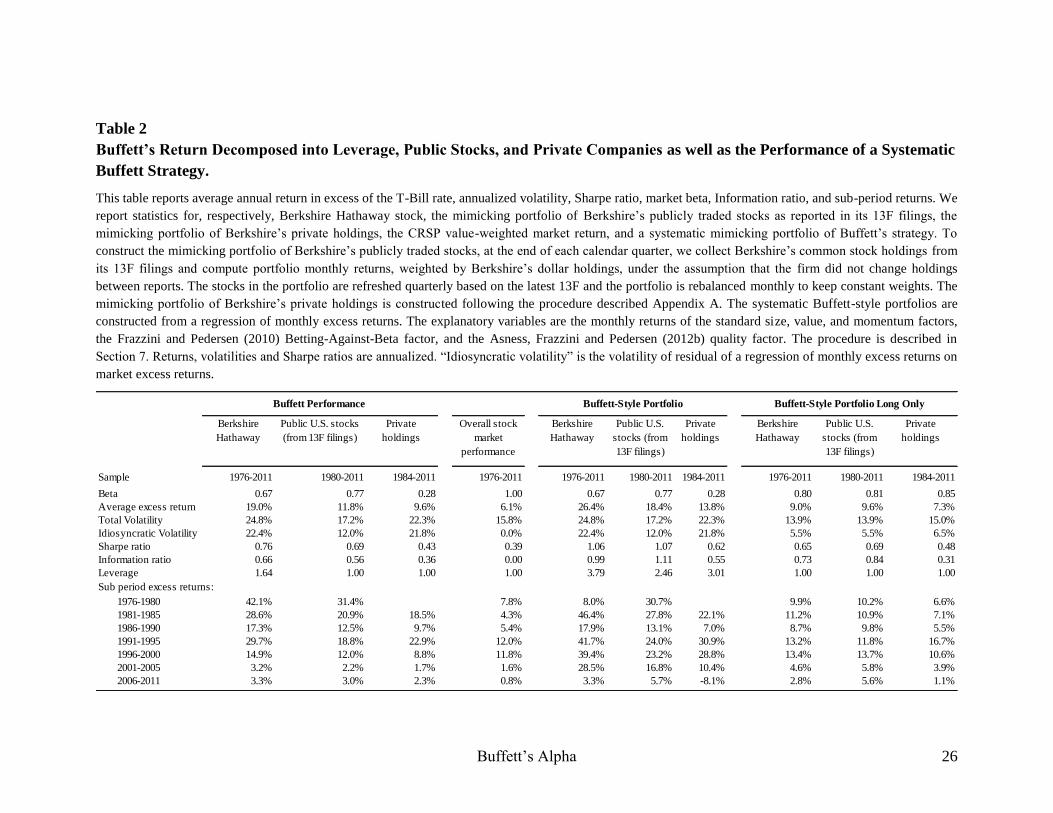
Table 2 shows the performance of both Buffett’s public and private positions. We
see that both perform relatively well. Both Buffett’s public and private portfolios exceed
the overall stock market in terms of average excess return, risk, and Sharpe ratio. We see
Buffett’s Alpha 10
that the public stocks have a higher Sharpe ratio than the private stocks, suggesting that
Buffett’s skill comes mostly from his ability to pick stocks, and not necessarily his value
added as a manager.
Berkshire Hathaway’s overall stock return is far above returns of both the private
and public portfolios. This is because Berkshire is not just a weighted average of the
public and private components. It is also leveraged, which magnifies returns. Further,
Berkshire’s Sharpe ratio is higher than those of the public and private parts, reflecting the
benefits of diversification (and possibly benefits from time-varying leverage and time-
varying public/private weights).
6. Buffett's Alpha and Investment Style: What Type of Stocks?
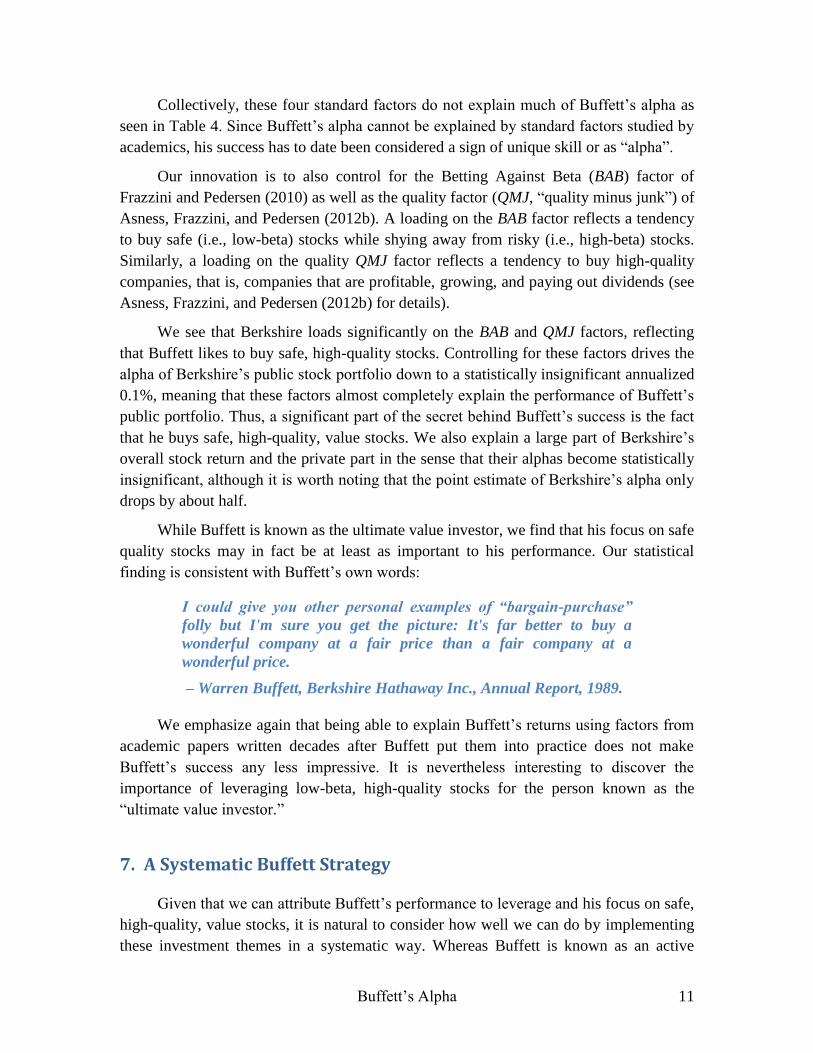
We have seen that Buffett’s returns can be attributed to his stock selection and his
ability to apply leverage, but how then does he pick stocks? To address this, we consider
Buffett’s factor exposures:
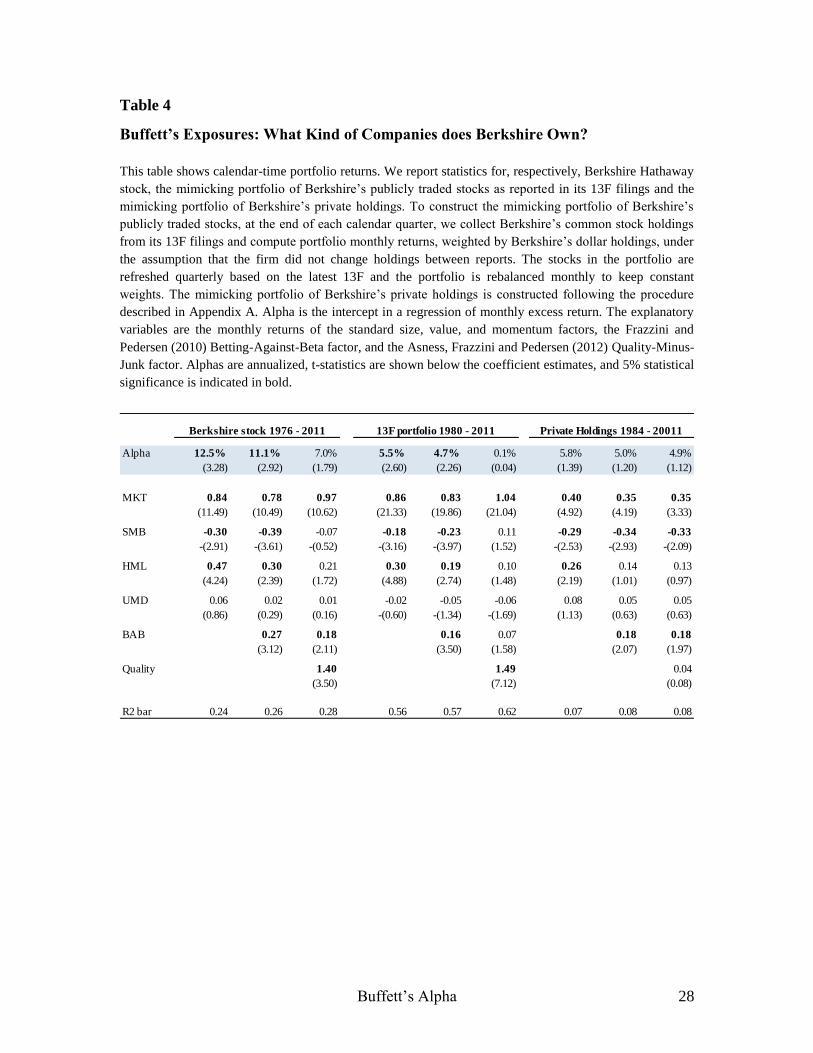
As seen in Table 4, we run this regression for the excess return of, respectively,
Berkshire Hathaway stock, the portfolio of publicly held stocks inferred from the 13F
filings, and the portfolio of private companies computed as described above.
For each of these returns, we first run a regression on the market return, MKT.
Berkshire has a beta less than one and a significant alpha. We next control for the
standard factors that capture the effects of size, value (Fama and French (1993)), and
momentum (Asness (1994), Carhart (1997), Jegadeesh and Titman (1993)). The size
factor small-minus-big (SMB) is a strategy of going long small stocks and short large
stocks. Berkshire’s negative loading on SMB reflects a tendency to buy large stocks.
The value factor (HML) is a strategy of buying high-book-to-market stocks while
shortselling low-book-to-market stocks. Berkshire’s positive loading therefore reflects a
tendency of buying stocks that are cheap in the sense of having a high book value relative
to their market value.
The last of the four “standard” factors is the momentum factor UMD, which
corresponds to buying stocks that have been “up” in the sense of outperforming the
market, while shorting the stocks that are relatively “down”. Berkshire’s insignificant
loading on UMD means that Buffett is not chasing trends in his stock selection.
Buffett’s Alpha 11
Collectively, these four standard factors do not explain much of Buffett’s alpha as
seen in Table 4. Since Buffett’s alpha cannot be explained by standard factors studied by
academics, his success has to date been considered a sign of unique skill or as “alpha”.
Our innovation is to also control for the Betting Against Beta (BAB) factor of
Frazzini and Pedersen (2010) as well as the quality factor (QMJ, “quality minus junk”) of
Asness, Frazzini, and Pedersen (2012b). A loading on the BAB factor reflects a tendency
to buy safe (i.e., low-beta) stocks while shying away from risky (i.e., high-beta) stocks.
Similarly, a loading on the quality QMJ factor reflects a tendency to buy high-quality
companies, that is, companies that are profitable, growing, and paying out dividends (see
Asness, Frazzini, and Pedersen (2012b) for details).
We see that Berkshire loads significantly on the BAB and QMJ factors, reflecting
that Buffett likes to buy safe, high-quality stocks. Controlling for these factors drives the
alpha of Berkshire’s public stock portfolio down to a statistically insignificant annualized
0.1%, meaning that these factors almost completely explain the performance of Buffett’s
public portfolio. Thus, a significant part of the secret behind Buffett’s success is the fact
that he buys safe, high-quality, value stocks. We also explain a large part of Berkshire’s
overall stock return and the private part in the sense that their alphas become statistically
insignificant, although it is worth noting that the point estimate of Berkshire’s alpha only
drops by about half.
While Buffett is known as the ultimate value investor, we find that his focus on safe
quality stocks may in fact be at least as important to his performance. Our statistical
finding is consistent with Buffett’s own words:
I could give you other personal examples of “bargain-purchase”
folly but I'm sure you get the picture: It's far better to buy a
wonderful company at a fair price than a fair company at a
wonderful price.
– Warren Buffett, Berkshire Hathaway Inc., Annual Report, 1989.
We emphasize again that being able to explain Buffett’s returns using factors from
academic papers written decades after Buffett put them into practice does not make
Buffett’s success any less impressive. It is nevertheless interesting to discover the
importance of leveraging low-beta, high-quality stocks for the person known as the
“ultimate value investor.”
7. A Systematic Buffett Strategy
Given that we can attribute Buffett’s performance to leverage and his focus on safe,
high-quality, value stocks, it is natural to consider how well we can do by implementing
these investment themes in a systematic way. Whereas Buffett is known as an active
Buffett’s Alpha 12
stock picker, we will try to go back to Buffett’s roots and, in the spirit of Graham and
Dodd (1934), focus on systematically implemented screens.
We consider systematic Buffett-style portfolios that track Buffett’s market
exposure and active stock-selection themes. First, we capture Buffett’s market exposure
as the slope of a univariate regression of Berkshire’s excess returns on the market
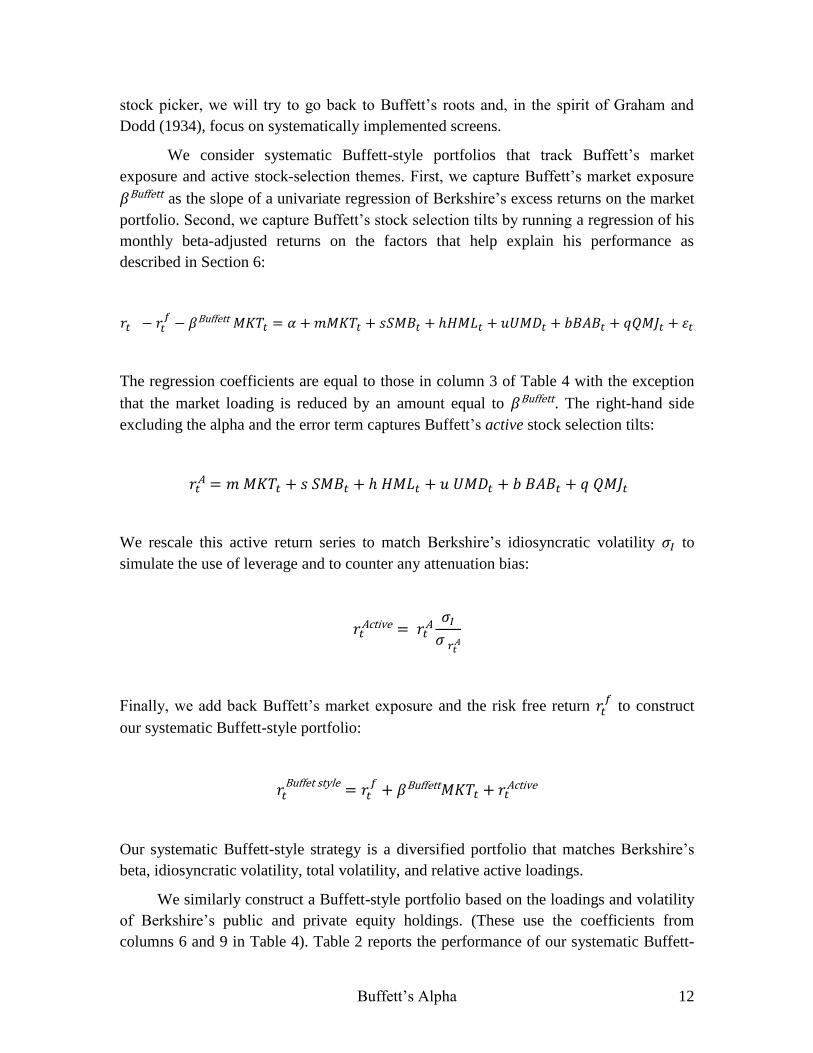
portfolio. Second, we capture Buffett’s stock selection tilts by running a regression of his
monthly beta-adjusted returns on the factors that help explain his performance as
described in Section 6:
The regression coefficients are equal to those in column 3 of Table 4 with the exception
that the market loading is reduced by an amount equal to . The right-hand side
excluding the alpha and the error term captures Buffett’s active stock selection tilts:
We rescale this active return series to match Berkshire’s idiosyncratic volatility to
simulate the use of leverage and to counter any attenuation bias:
Finally, we add back Buffett’s market exposure and the risk free return to construct
our systematic Buffett-style portfolio:
Our systematic Buffett-style strategy is a diversified portfolio that matches Berkshire’s
beta, idiosyncratic volatility, total volatility, and relative active loadings.
We similarly construct a Buffett-style portfolio based on the loadings and volatility
of Berkshire’s public and private equity holdings. (These use the coefficients from
columns 6 and 9 in Table 4). Table 2 reports the performance of our systematic Buffett-
Buffett’s Alpha 13
style portfolios and Figure 3 shows the cumulative return of Berkshire Hathaway,
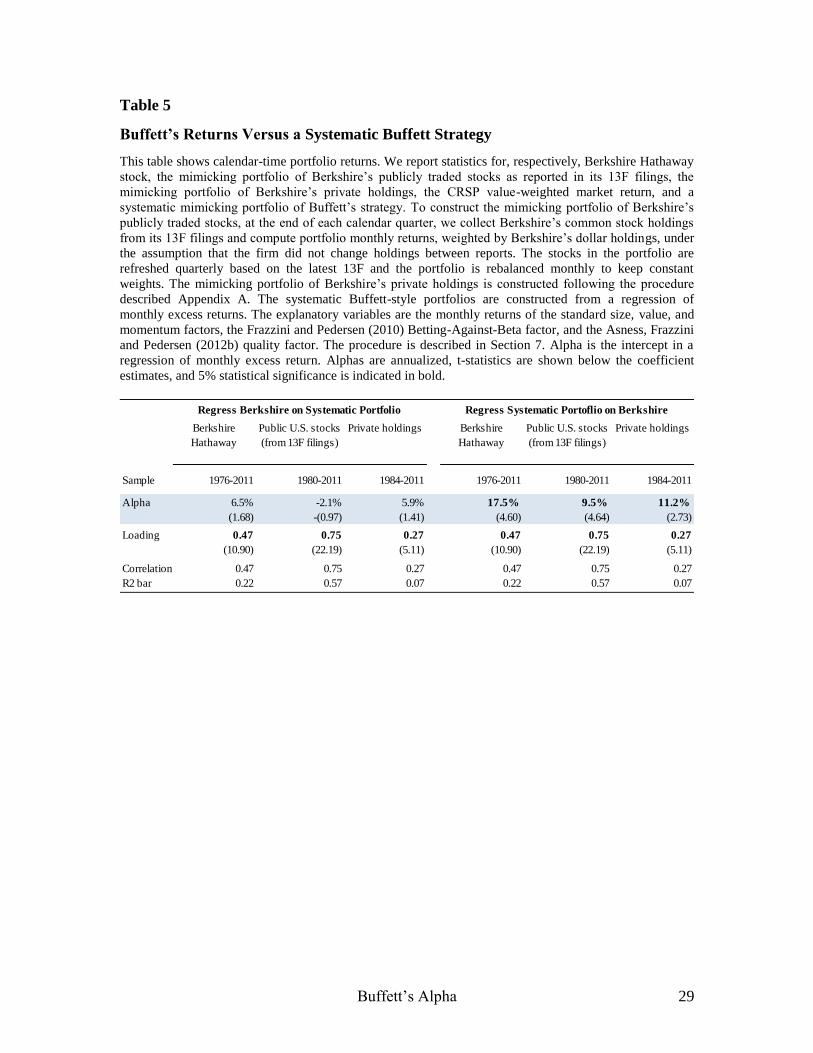
Buffett’s public stocks and our systematic Buffett-style strategies. Finally, Table 5
reports correlations, alphas, and loadings for our systematic Buffett-style portfolios and
their actual Buffett counterparts.
As seen in the Table C1 and Figure C1, the performance of the systematic
Buffett-style portfolios is comparable to Buffett’s actual return. Since the simulated
Buffett-style portfolios do not account for transaction costs and other costs and benefit
from hindsight, their apparent outperformance should be discounted. The main insight
here is the high co-variation between Buffett’s actual performance and the performance
of a diversified Buffett-style strategy.
We match the public stock portfolio especially closely, perhaps because this public
portfolio is observed directly and its returns are calculated based on public stocks returns
using the same methodology as our systematic portfolios. Berkshire’s overall stock price,
on the other hand, may have idiosyncratic price variation (e.g., due to the value of Buffett
himself) that cannot be replicated using other stocks. This idiosyncratic Berkshire
variation is even more severe for the private part, which may also suffer from
measurement issues.
The comparison between Berkshire’s public stock portfolio and the corresponding
Buffett-style portfolio is also the cleaner test of Buffett’s stock selection since both are
simulated returns without any transaction costs or taxes. Indeed, the correlation between
our systematic portfolio and Berkshire’s public stock portfolio (shown in Table 5) is
75%, meaning that our systematic portfolio explains 57% of the variance of the public
stock portfolio. The correlations for the Berkshire’s stock price and Buffett’s private
investments are lower (47% and 27% respectively), but still large in magnitude. Table 5
also shows that our systematic portfolios have significant alphas with respect to their
corresponding Buffett counterpart, while none of the Buffett portfolios have statistically
significant alphas with respect to their systematic counterpart. This may be because our
systematic portfolios have similar factor tilts as Buffett’s, but they hold a much larger
number of securities, thus benefitting from diversification.
The Berkshire Hathaway stock return does reflect the incurred transaction costs and
possibly additional taxes, so that makes Berkshire’s performance all the more impressive.
Given Berkshire’s modest turnover, transaction costs were likely small initially. As
Berkshire grew, so did transaction costs and this could potentially account for some of
Berkshire’s diminishing returns over time. Further, Berkshire may have been increasingly
forced to focus on large stocks. Indeed, Table 4 shows that Berkshire has a negative
loading on the size factor SMB, reflecting a tendency to buy large firms. However,
Berkshire initially focused on small firms (reflected in a positive SMB loading in the first
half of the time period, not shown), and only became biased towards large stocks in the
Buffett’s Alpha 14
later time period. Hence, Berkshire’s diminishing returns could also be related to capacity
constraints.
Assessing the impact of taxes on Berkshire’s performance is complicated. For
Berkshire’s private holdings, the joint ownership in a multinational company is
associated with tax advantages. For the public stocks, Berkshire could face double
corporate taxes, that is, pay tax both indirectly in the portfolio companies’ earnings and in
Berkshire as it receives dividends or realizes capital gains. However, Berkshire can
deduct 70-80% of the dividends received, defer capital gains taxes by holding on to the
positions such that gains remain unrealized,4 and minimize taxes by allocating earnings
abroad as a multinational.5 Hence, it is difficult to assess whether Berkshire is at a tax
disadvantage overall.
In addition to the systematic long-short portfolios, we also compute a long-only,
unleveraged systematic Buffett-style strategy. At the end of each calendar month, we
sort securities based on the portfolio weights corresponding to our active tilts and
construct an equal weighted portfolio that holds the top 50 stocks with the highest
portfolio weight. Table 2 shows that these simpler Buffett-style portfolios also perform
well, albeit not as well as when we allow short selling.
As a final robustness check, we consider Buffett-style portfolios that do not rely on
in-sample regression coefficients. Specifically, we create an implementable Buffett-style
strategy by only using information up to month to construct portfolio weights for the
next month . As seen in Appendix C, these portfolios have very similar performance
and alphas as our full sample Buffett-style portfolios.
In summary, if one had applied leverage to a portfolio of safe, high-quality, value
stocks consistently over this time period, then one would have achieved a remarkable
return, as did Buffett. Of course, he started doing it half a century before we wrote this
paper!
4 For a corporation, capital gains are subject to corporate taxes at 35% (and there is no special provision for
long-term capital gains). While capital gains taxes can be deferred from a cash-flow perspective as long as
they are unrealized, the accrued capital gains tax does nevertheless lead to an expense from a GAAP-
accounting perspective. Said differently, Berkshire does not pay any taxes for unrealized capital gains, but
such unrealized capital gains do lower Berkshire’s reported earnings and hence its book value of equity,
while raising the GAAP liability called principally deferred income taxes.
5 For instance, Berkshire’s 2011 Annual Report states: “We have not established deferred income taxes
with respect to undistributed earnings of certain foreign subsidiaries. Earnings expected to remain
reinvested indefinitely were approximately $6.6 billion as of December 31, 2011. Upon distribution as
dividends or otherwise, such amounts would be subject to taxation in the U.S. as well as foreign countries.
However, U.S. income tax liabilities would be offset, in whole or in part, by allowable tax credits with
respect to income taxes previously paid to foreign jurisdictions. Further, repatriation of all earnings of
foreign subsidiaries would be impracticable to the extent that such earnings represent capital needed to
support normal business operations in those jurisdictions. As a result, we currently believe that any
incremental U.S. income tax liabilities arising from the repatriation of distributable earnings of foreign
subsidiaries would not be material.”
Buffett’s Alpha 15
8. Conclusion: Lessons from an Alpha Male
Buffett’s performance is outstanding as the best among all stocks and mutual funds
that have existed for at least 30 years. Nevertheless, his Sharpe ratio of 0.76 might be
lower than many investors imagine. While optimistic asset managers often claim to be
able to achieve Sharpe ratios above 1 or 2, long-term investors might do well by setting a
realistic performance goal and bracing themselves for the tough periods that even Buffett
has experienced.
In essence, we find that the secret to Buffett’s success is his preference for cheap,
safe, high-quality stocks combined with his consistent use of leverage to magnify returns
while surviving the inevitable large absolute and relative drawdowns this entails. Indeed,
we find that stocks with the characteristics favored by Buffett have done well in general,
that Buffett applies about 1.6-to-1 leverage financed partly using insurance float with a
low financing rate, and that leveraging safe stocks can largely explain Buffett’s
performance.
Buffett’s Alpha 16
References
Asness, C. S. (1994), “Variables that Explain Stock Returns”, Ph.D. Dissertation,
University of Chicago.
Asness, C., A. Frazzini, and L. H. Pedersen (2012a), “Leverage Aversion and Risk
Parity”, Financial Analysts Journal, 68(1), 47-59..
Asness, C., A. Frazzini, and L. H. Pedersen (2012b), “Quality Investment”, working
paper, AQR Capital Management, New York University.
Black, F. (1972), “Capital market equilibrium with restricted borrowing,” Journal of
business, 45, 3, pp. 444-455.
Black, F., M.C. Jensen, and M. Scholes (1972), “The Capital Asset Pricing Model: Some
Empirical Tests.” In Michael C. Jensen (ed.), Studies in the Theory of Capital Markets,
New York, pp. 79-121.
Carhart, M. (1997), "On persistence in mutual fund performance", Journal of Finance 52,
57–82.
Fama, E.F. and French, K.R. (1993), "Common risk factors in the returns on stocks and
bonds", Journal of Financial Economics 33, 3–56.
Frazzini, A. and L. H. Pedersen (2010), “Betting Against Beta”, working paper, AQR
Capital Management, New York University and NBER (WP 16601).
Frazzini, A. and L. H. Pedersen (2012), “Embedded Leverage”, working paper, AQR
Capital Management, New York University.
Graham, B. and D. L. Dodd (1934), “Security Analysis,” McGraw Hill.
Jegadeesh, N. and S. Titman (1993), “Returns to Buying Winners and Selling Losers:
Implications for Stock Market Efficiency,” The Journal of Finance, vol. 48, no. 1, pp. 65-
91.
Kacperczyk, M., C. Sialm, and L. Zheng (2008), “Unobserved Actions of Mutual Funds,”
Review of Financial Studies, 21, 2379-2416.
Lowenstein, R. (2008), “Buffett The Biography,” Duckworth Press, London, UK.
Martin, G.S. and J. Puthenpurackal (2008), “Imitation is the Sincerest Form of Flattery:
Warren Buffett and Berkshire Hathaway,” working paper American University.
Buffett’s Alpha 17
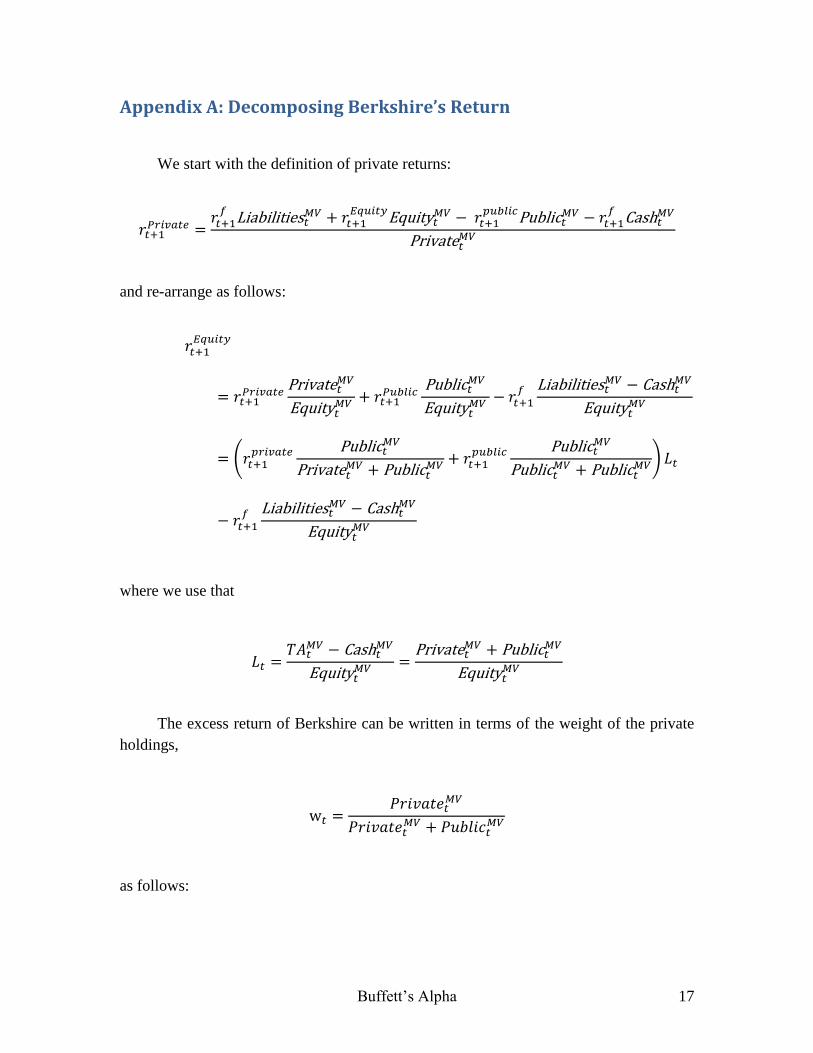
Appendix A: Decomposing Berkshire’s Return
We start with the definition of private returns:
and re-arrange as follows:
(
)
where we use that
The excess return of Berkshire can be written in terms of the weight of the private
holdings,
as follows:
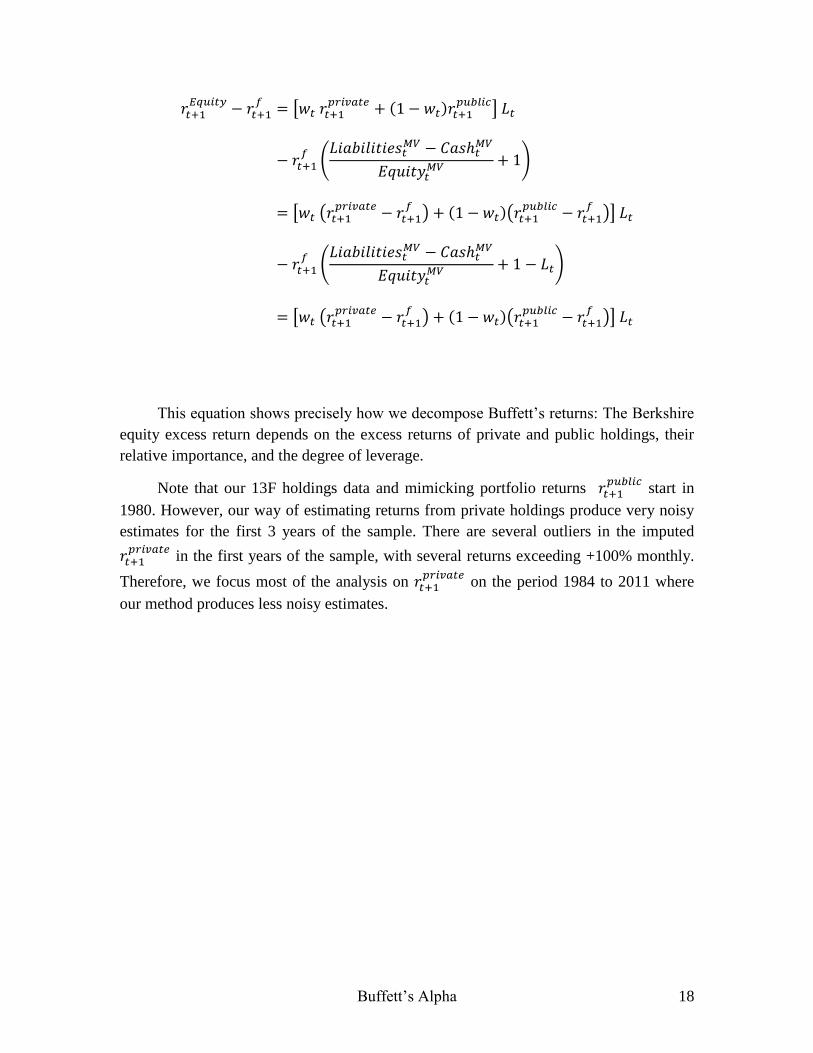
Buffett’s Alpha 18
[
]
(
)
[ (
) (
)]
(
)
[ (
) (
)]
This equation shows precisely how we decompose Buffett’s returns: The Berkshire
equity excess return depends on the excess returns of private and public holdings, their
relative importance, and the degree of leverage.
Note that our 13F holdings data and mimicking portfolio returns
start in
1980. However, our way of estimating returns from private holdings produce very noisy
estimates for the first 3 years of the sample. There are several outliers in the imputed
in the first years of the sample, with several returns exceeding +100% monthly.
Therefore, we focus most of the analysis on
on the period 1984 to 2011 where
our method produces less noisy estimates.
Buffett’s Alpha 19
Appendix B: Data Sources and Methodology
The data in this study are derived from a variety of sources.
Stock return data
Stock return and price data is from the CRSP database. Our data includes all
domestic common stocks (share code 10 and 11) on the CRSP tape between December
1925 and December 2011. To compute Berkshire Hathaway’s stock returns we value-
weight both share classes A and B based on lagged market capitalization (Berkshire
Hathaway introduced a share class B in April 1996). The stock return data for Berkshire
Hathaway on the CRSP tape starts in 1976. Hence, we only have data on the last 35 years
of Warren Buffett’s record. He ran various private investment partnership from 1957 to
1969, started trading Berkshire Hathaway in 1962, took control of Berkshire in 1965, and
started using Berkshire as his main investment vehicle after he closed his partnerships in
1969 (Lowenstein (2008)). At the time of writing we have been unable to collect data on
Berkshire Hathaway’s stock price prior to its introduction on the CRSP tape and
Buffett’s’ partnership performance so our study covers the period 1976 to 2011, which
can be viewed as a conservative estimate of Buffett’s complete track record and out-of-
sample evidence relative to his first almost 20 years of success.
Balance sheet data
Our main source of balance sheet data is the Compustat/XpressFeed database.
However, due to the presence of several errors in the cash item (especially in the
quarterly reports in the early part of the sample) we check and correct this data with
information extracted from the original 10-K company filings as well as information from
Berkshire’s annual letter to the shareholders. Berkshire holds a significant amount of cash
on its balance sheet, which we hand collect from Berkshire’s Annual Report, Form 10K.
We make the following adjustments: For the end of 1985, the official cash number
includes a significant amount of cash set aside for the purchases of Capital Cities
Communications and Scott Fetzer. Therefore, we use the pro forma consolidated balance
sheet presented in note (18) on page 42 of the Annual Report. For the end of 1987, we
use the restated cash figure mentioned in the 1988 Annual Report note 1(b) page 25. For
other balance sheet items, we also focus on annual balance sheet data.
Buffett’s Alpha 20
13F holdings data
We download holdings data for Berkshire Hathaway from Thomson Financial
Institutional (13F) Holding Database which includes holdings of all US entities
exercising investment discretion over $100 million, filed with the SEC. The data on
Berkshire’s public stock holdings run from 1980 to 2009.
Mutual fund data
We collect mutual fund returns from the CRSP Mutual Fund Database. The data
run from 1976 to 2011. We focus our analysis on open-end actively managed domestic
equity mutual funds. Our sample selection procedure follows that of Kacperzczyk, Sialm,
and Zheng (2008), and we refer to their Appendix for details about the screens that were
used and summary statistics of the data.
Buffett’s Alpha 21
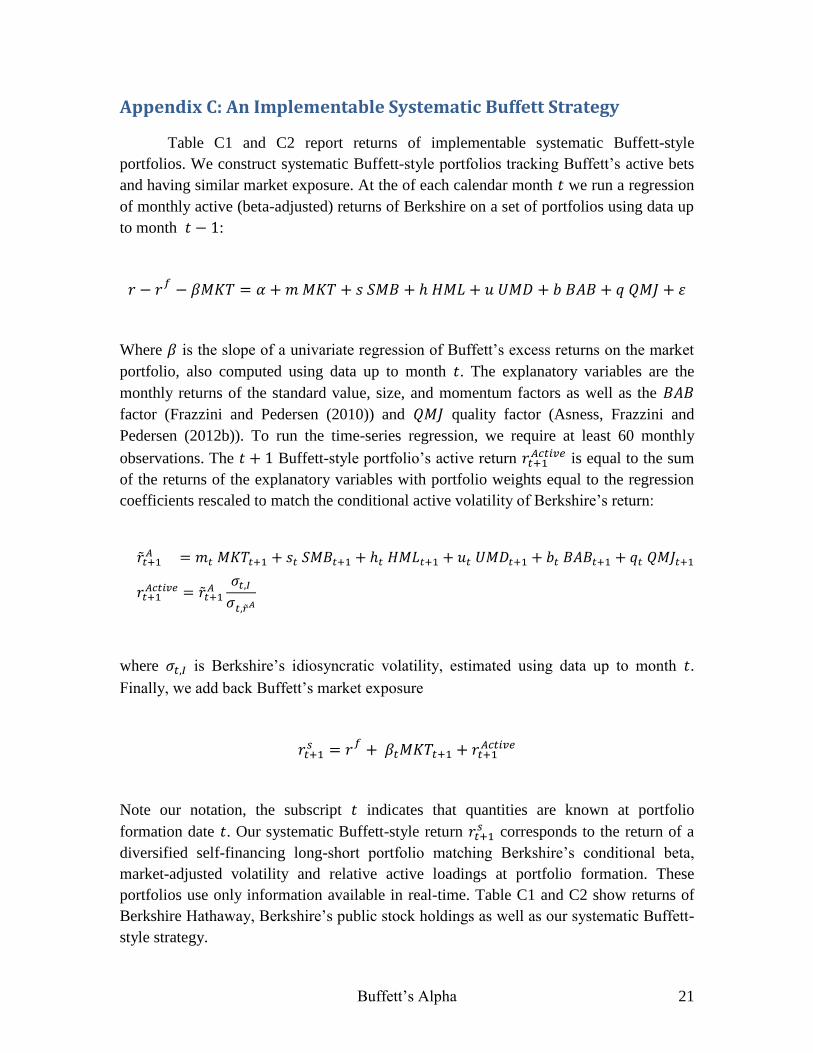
Appendix C: An Implementable Systematic Buffett Strategy
Table C1 and C2 report returns of implementable systematic Buffett-style
portfolios. We construct systematic Buffett-style portfolios tracking Buffett’s active bets
and having similar market exposure. At the of each calendar month we run a regression
of monthly active (beta-adjusted) returns of Berkshire on a set of portfolios using data up
to month :
Where is the slope of a univariate regression of Buffett’s excess returns on the market
portfolio, also computed using data up to month . The explanatory variables are the
monthly returns of the standard value, size, and momentum factors as well as the
factor (Frazzini and Pedersen (2010)) and quality factor (Asness, Frazzini and
Pedersen (2012b)). To run the time-series regression, we require at least 60 monthly
observations. The Buffett-style portfolio’s active return is equal to the sum
of the returns of the explanatory variables with portfolio weights equal to the regression
coefficients rescaled to match the conditional active volatility of Berkshire’s return:
where is Berkshire’s idiosyncratic volatility, estimated using data up to month .
Finally, we add back Buffett’s market exposure
Note our notation, the subscript indicates that quantities are known at portfolio
formation date . Our systematic Buffett-style return corresponds to the return of a
diversified self-financing long-short portfolio matching Berkshire’s conditional beta,
market-adjusted volatility and relative active loadings at portfolio formation. These
portfolios use only information available in real-time. Table C1 and C2 show returns of
Berkshire Hathaway, Berkshire’s public stock holdings as well as our systematic Buffett-
style strategy.

Buffett’s Alpha 22
In addition to the systematic long-sort portfolios, we also compute a real-time
long-only, unlevered systematic Buffett-style strategy. At the end of each calendar
month , we sort securities based on the portfolio weights corresponding to our active tilts
computed using data up month and construct an equal weighted portfolio that holds the
top 50 stocks with the highest portfolio weight.
Buffett’s Alpha 23
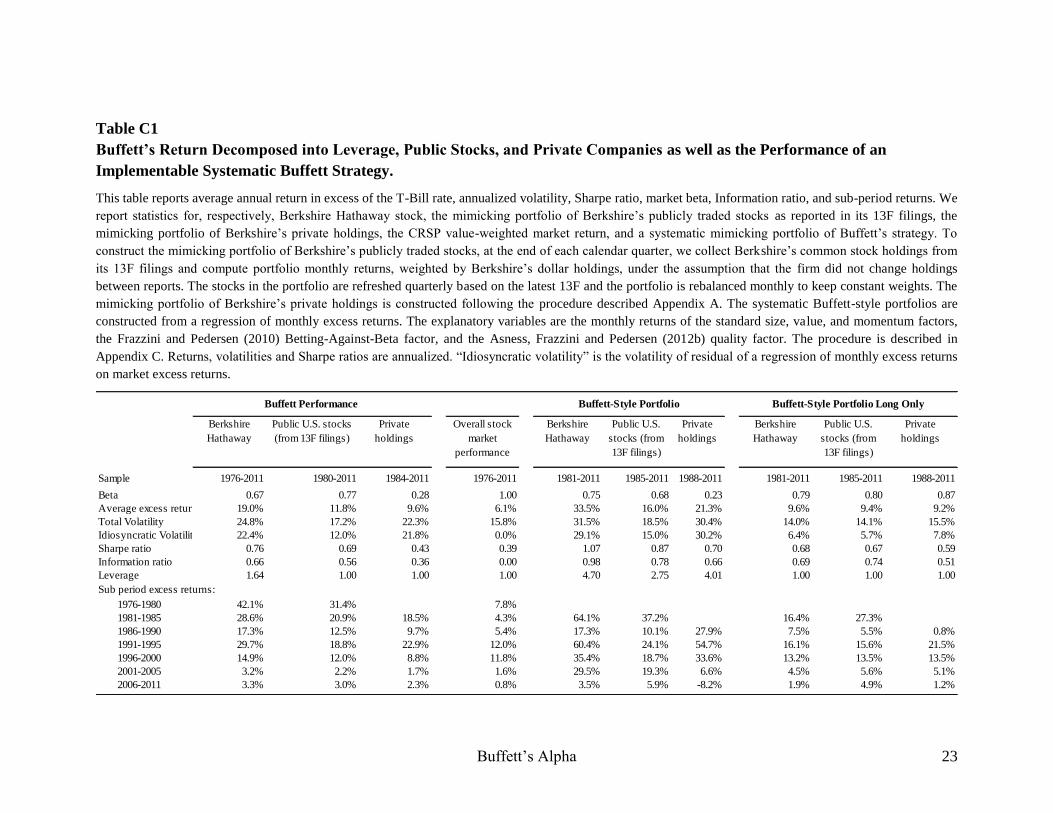
Table C1
Buffett’s Return Decomposed into Leverage, Public Stocks, and Private Companies as well as the Performance of an
Implementable Systematic Buffett Strategy.
This table reports average annual return in excess of the T-Bill rate, annualized volatility, Sharpe ratio, market beta, Information ratio, and sub-period returns. We
report statistics for, respectively, Berkshire Hathaway stock, the mimicking portfolio of Berkshire’s publicly traded stocks as reported in its 13F filings, the
mimicking portfolio of Berkshire’s private holdings, the CRSP value-weighted market return, and a systematic mimicking portfolio of Buffett’s strategy. To
construct the mimicking portfolio of Berkshire’s publicly traded stocks, at the end of each calendar quarter, we collect Berkshire’s common stock holdings from
its 13F filings and compute portfolio monthly returns, weighted by Berkshire’s dollar holdings, under the assumption that the firm did not change holdings
between reports. The stocks in the portfolio are refreshed quarterly based on the latest 13F and the portfolio is rebalanced monthly to keep constant weights. The
mimicking portfolio of Berkshire’s private holdings is constructed following the procedure described Appendix A. The systematic Buffett-style portfolios are
constructed from a regression of monthly excess returns. The explanatory variables are the monthly returns of the standard size, value, and momentum factors,
the Frazzini and Pedersen (2010) Betting-Against-Beta factor, and the Asness, Frazzini and Pedersen (2012b) quality factor. The procedure is described in
Appendix C. Returns, volatilities and Sharpe ratios are annualized. “Idiosyncratic volatility” is the volatility of residual of a regression of monthly excess returns
on market excess returns.
Berkshire
Hathaway
Public U.S. stocks
(from 13F filings)
Private
holdings
Overall stock
market
performance
Berkshire
Hathaway
Public U.S.
stocks (from
13F filings)
Private
holdings
Berkshire
Hathaway
Public U.S.
stocks (from
13F filings)
Private
holdings
Sample 1976-2011 1980-2011 1984-2011 1976-2011 1981-2011 1985-2011 1988-2011 1981-2011 1985-2011 1988-2011
Beta 0.67 0.77 0.28 1.00 0.75 0.68 0.23 0.79 0.80 0.87
Average excess return 19.0% 11.8% 9.6% 6.1% 33.5% 16.0% 21.3% 9.6% 9.4% 9.2%
Total Volatility 24.8% 17.2% 22.3% 15.8% 31.5% 18.5% 30.4% 14.0% 14.1% 15.5%
Idiosyncratic Volatility 22.4% 12.0% 21.8% 0.0% 29.1% 15.0% 30.2% 6.4% 5.7% 7.8%
Sharpe ratio 0.76 0.69 0.43 0.39 1.07 0.87 0.70 0.68 0.67 0.59
Information ratio 0.66 0.56 0.36 0.00 0.98 0.78 0.66 0.69 0.74 0.51
Leverage 1.64 1.00 1.00 1.00 4.70 2.75 4.01 1.00 1.00 1.00
Sub period excess returns:
1976-1980 42.1% 31.4% 7.8%
1981-1985 28.6% 20.9% 18.5% 4.3% 64.1% 37.2% 16.4% 27.3%
1986-1990 17.3% 12.5% 9.7% 5.4% 17.3% 10.1% 27.9% 7.5% 5.5% 0.8%
1991-1995 29.7% 18.8% 22.9% 12.0% 60.4% 24.1% 54.7% 16.1% 15.6% 21.5%
1996-2000 14.9% 12.0% 8.8% 11.8% 35.4% 18.7% 33.6% 13.2% 13.5% 13.5%
2001-2005 3.2% 2.2% 1.7% 1.6% 29.5% 19.3% 6.6% 4.5% 5.6% 5.1%
2006-2011 3.3% 3.0% 2.3% 0.8% 3.5% 5.9% -8.2% 1.9% 4.9% 1.2%
Buffett Performance Buffett-Style Portfolio Buffett-Style Portfolio Long Only
Buffett’s Alpha 24
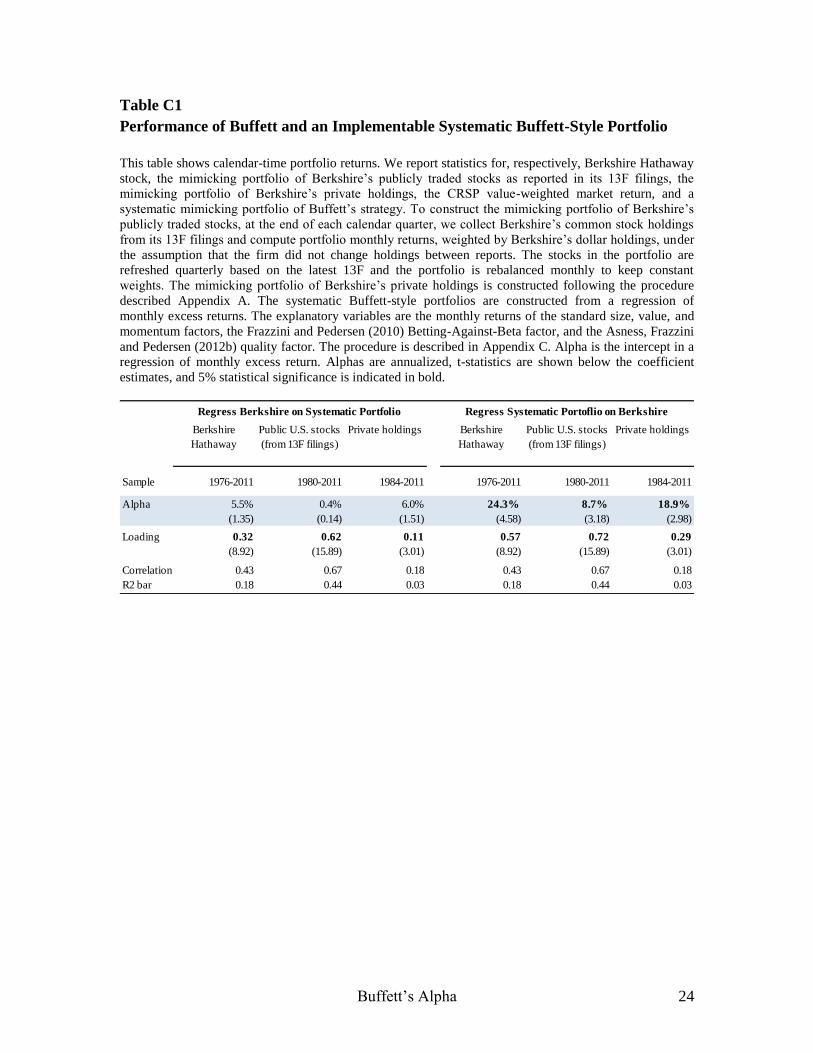
Table C1
Performance of Buffett and an Implementable Systematic Buffett-Style Portfolio
This table shows calendar-time portfolio returns. We report statistics for, respectively, Berkshire Hathaway
stock, the mimicking portfolio of Berkshire’s publicly traded stocks as reported in its 13F filings, the
mimicking portfolio of Berkshire’s private holdings, the CRSP value-weighted market return, and a
systematic mimicking portfolio of Buffett’s strategy. To construct the mimicking portfolio of Berkshire’s
publicly traded stocks, at the end of each calendar quarter, we collect Berkshire’s common stock holdings
from its 13F filings and compute portfolio monthly returns, weighted by Berkshire’s dollar holdings, under
the assumption that the firm did not change holdings between reports. The stocks in the portfolio are
refreshed quarterly based on the latest 13F and the portfolio is rebalanced monthly to keep constant
weights. The mimicking portfolio of Berkshire’s private holdings is constructed following the procedure
described Appendix A. The systematic Buffett-style portfolios are constructed from a regression of
monthly excess returns. The explanatory variables are the monthly returns of the standard size, value, and
momentum factors, the Frazzini and Pedersen (2010) Betting-Against-Beta factor, and the Asness, Frazzini
and Pedersen (2012b) quality factor. The procedure is described in Appendix C. Alpha is the intercept in a
regression of monthly excess return. Alphas are annualized, t-statistics are shown below the coefficient
estimates, and 5% statistical significance is indicated in bold.
Berkshire
Hathaway
Public U.S. stocks
(from 13F filings)
Private holdings Berkshire
Hathaway
Public U.S. stocks
(from 13F filings)
Private holdings
Sample 1976-2011 1980-2011 1984-2011 1976-2011 1980-2011 1984-2011
Alpha 5.5% 0.4% 6.0% 24.3% 8.7% 18.9%
(1.35) (0.14) (1.51) (4.58) (3.18) (2.98)
Loading 0.32 0.62 0.11 0.57 0.72 0.29
(8.92) (15.89) (3.01) (8.92) (15.89) (3.01)
Correlation 0.43 0.67 0.18 0.43 0.67 0.18
R2 bar 0.18 0.44 0.03 0.18 0.44 0.03
Regress Berkshire on Systematic Portfolio Regress Systematic Portoflio on Berkshire
Buffett’s Alpha 25
Tables and Figures
Table 1
Buffett’s Performance Relative to All Other Stocks and Mutual Funds.
This table shows the Sharpe ratio (SR) and Information ratio (IR) of Berkshire Hathaway relative to the
universe of common stocks on the CRSP Stock database from 1926 to 2011, and relative to the universe of
actively managed equity mutual funds on the CRSP Mutual Fund database from 1976 to 2011. The
Information ratio is defined as the intercept in a regression of monthly excess returns divided by the
standard deviation of the residuals. The explanatory variable in the regression is the monthly excess returns
of the CRSP value-weighted market portfolio. Sharpe ratios and information ratios are annualized.
Panel A: SR of Equity Mutual Funds
Number of
stocks/fundsMedian 95th Percentile 99th Percentile Maximum Rank Percentile
All funds in CRSP data 1976 - 2011 3,479 0.242 0.49 1.09 2.99 88 97.5%
All funds alive in 1976 and 2011 140 0.37 0.52 0.76 0.76 1 100.0%
All funds alive in 1976 with at least 10-year history 264 0.35 0.51 0.65 0.76 1 100.0%
All funds with at least 10-year history 1,994 0.30 0.47 0.65 0.90 4 99.8%
All funds with at least 30-year history 196 0.37 0.51 0.72 0.76 1 100.0%
Panel B: SR of Common Stocks
All stocks in CRSP data 1926 - 2011 23,390 0.195 0.61 1.45 2.68 1360 93.9%
All stocks alive in 1976 and 2011 598 0.32 0.44 0.56 0.76 1 100.0%
All stocks alive in 1976 with at least 10-year history 3,633 0.27 0.45 0.61 0.86 7 99.8%
All stocks with at least 10-year history 9,035 0.26 0.48 0.73 1.12 62 99.3%
All stocks with at least 30-year history 1,777 0.31 0.44 0.57 0.76 1 100.0%
Panel C: IR of Equity Mutual Funds
Number of
stocks/fundsMedian 95th Percentile 99th Percentile Maximum Rank Percentile
All funds in CRSP data 1976 - 2011 3,479 -0.060 0.39 0.89 2.84 100 97.1%
All funds alive in 1976 and 2011 140 0.050 0.39 0.68 0.81 2 99.3%
All funds alive in 1976 with at least 10-year history 264 -0.025 0.30 0.60 0.81 2 99.6%
All funds with at least 10-year history 1,994 0.022 0.38 0.77 1.22 42 97.9%
All funds with at least 30-year history 196 0.034 0.34 0.66 0.81 2 99.5%
Panel D: IR of Common Stocks
All stocks in CRSP data 1926 - 2011 23,390 0.089 0.54 1.41 2.91 1510 93.3%
All stocks alive in 1976 and 2011 598 0.183 0.32 0.46 0.66 1 100.0%
All stocks alive in 1976 with at least 10-year history 3,633 0.146 0.36 0.57 0.80 13 99.7%
All stocks with at least 10-year history 9,035 0.136 0.38 0.62 1.07 58 99.4%
All stocks with at least 30-year history 1,777 0.130 0.29 0.43 0.66 1 100.0%
Sample Distribution of Information Ratios Buffett Performance
Buffett PerformanceSample Distribution of Sharpe Ratios
Buffett’s Alpha 26
Table 2
Buffett’s Return Decomposed into Leverage, Public Stocks, and Private Companies as well as the Performance of a Systematic
Buffett Strategy.
This table reports average annual return in excess of the T-Bill rate, annualized volatility, Sharpe ratio, market beta, Information ratio, and sub-period returns. We
report statistics for, respectively, Berkshire Hathaway stock, the mimicking portfolio of Berkshire’s publicly traded stocks as reported in its 13F filings, the
mimicking portfolio of Berkshire’s private holdings, the CRSP value-weighted market return, and a systematic mimicking portfolio of Buffett’s strategy. To
construct the mimicking portfolio of Berkshire’s publicly traded stocks, at the end of each calendar quarter, we collect Berkshire’s common stock holdings from
its 13F filings and compute portfolio monthly returns, weighted by Berkshire’s dollar holdings, under the assumption that the firm did not change holdings
between reports. The stocks in the portfolio are refreshed quarterly based on the latest 13F and the portfolio is rebalanced monthly to keep constant weights. The
mimicking portfolio of Berkshire’s private holdings is constructed following the procedure described Appendix A. The systematic Buffett-style portfolios are
constructed from a regression of monthly excess returns. The explanatory variables are the monthly returns of the standard size, value, and momentum factors,
the Frazzini and Pedersen (2010) Betting-Against-Beta factor, and the Asness, Frazzini and Pedersen (2012b) quality factor. The procedure is described in
Section 7. Returns, volatilities and Sharpe ratios are annualized. “Idiosyncratic volatility” is the volatility of residual of a regression of monthly excess returns on
market excess returns.
Berkshire
Hathaway
Public U.S. stocks
(from 13F filings)
Private
holdings
Overall stock
market
performance
Berkshire
Hathaway
Public U.S.
stocks (from
13F filings)
Private
holdings
Berkshire
Hathaway
Public U.S.
stocks (from
13F filings)
Private
holdings
Sample 1976-2011 1980-2011 1984-2011 1976-2011 1976-2011 1980-2011 1984-2011 1976-2011 1980-2011 1984-2011
Beta 0.67 0.77 0.28 1.00 0.67 0.77 0.28 0.80 0.81 0.85
Average excess return 19.0% 11.8% 9.6% 6.1% 26.4% 18.4% 13.8% 9.0% 9.6% 7.3%
Total Volatility 24.8% 17.2% 22.3% 15.8% 24.8% 17.2% 22.3% 13.9% 13.9% 15.0%
Idiosyncratic Volatility 22.4% 12.0% 21.8% 0.0% 22.4% 12.0% 21.8% 5.5% 5.5% 6.5%
Sharpe ratio 0.76 0.69 0.43 0.39 1.06 1.07 0.62 0.65 0.69 0.48
Information ratio 0.66 0.56 0.36 0.00 0.99 1.11 0.55 0.73 0.84 0.31
Leverage 1.64 1.00 1.00 1.00 3.79 2.46 3.01 1.00 1.00 1.00
Sub period excess returns:
1976-1980 42.1% 31.4% 7.8% 8.0% 30.7% 9.9% 10.2% 6.6%
1981-1985 28.6% 20.9% 18.5% 4.3% 46.4% 27.8% 22.1% 11.2% 10.9% 7.1%
1986-1990 17.3% 12.5% 9.7% 5.4% 17.9% 13.1% 7.0% 8.7% 9.8% 5.5%
1991-1995 29.7% 18.8% 22.9% 12.0% 41.7% 24.0% 30.9% 13.2% 11.8% 16.7%
1996-2000 14.9% 12.0% 8.8% 11.8% 39.4% 23.2% 28.8% 13.4% 13.7% 10.6%
2001-2005 3.2% 2.2% 1.7% 1.6% 28.5% 16.8% 10.4% 4.6% 5.8% 3.9%
2006-2011 3.3% 3.0% 2.3% 0.8% 3.3% 5.7% -8.1% 2.8% 5.6% 1.1%
Buffett Performance Buffett-Style Portfolio Buffett-Style Portfolio Long Only
Buffett’s Alpha 27
Table 3
Buffett’s Cost of Leverage: The Case of His Insurance Float
This table shows the cost of Berkshire’s funds coming from insurance float. The data is hand-collected
from Buffett’s comment in Berkshire Hathaway’s annual reports. Rates are annualized, in percent.
* In years when cost of funds is reported as "less than zero" and no numerical value is available we set cost
of funds to zero
Fraction of years
with negative cost
Average cost of
funds (Trucated)*
T-Bill Fed Funds
rate
1-Month
Libor
6-Month
Libor
10-Year
Bond
1976-1980 0.79 1.67 -4.59 -5.65 -5.76
1981-1985 0.20 10.95 1.10 -0.27 -1.28
1986-1990 0.00 3.07 -3.56 -4.61 -4.80 -4.90 -5.30
1991-1995 0.60 2.21 -2.00 -2.24 -2.46 -2.71 -4.64
1996-2000 0.60 2.36 -2.70 -3.10 -3.33 -3.48 -3.56
2001-2005 0.60 1.29 -0.82 -0.96 -1.05 -1.19 -3.11
2006-2011 1.00 -4.00 -5.84 -6.06 -6.29 -6.59 -7.67
Full sample 0.60 2.20 -3.09 -3.81 -3.69 -3.88 -4.80
Spread over benckmark rates
Buffett’s Alpha 28
Table 4
Buffett’s Exposures: What Kind of Companies does Berkshire Own?
This table shows calendar-time portfolio returns. We report statistics for, respectively, Berkshire Hathaway
stock, the mimicking portfolio of Berkshire’s publicly traded stocks as reported in its 13F filings and the
mimicking portfolio of Berkshire’s private holdings. To construct the mimicking portfolio of Berkshire’s
publicly traded stocks, at the end of each calendar quarter, we collect Berkshire’s common stock holdings
from its 13F filings and compute portfolio monthly returns, weighted by Berkshire’s dollar holdings, under
the assumption that the firm did not change holdings between reports. The stocks in the portfolio are
refreshed quarterly based on the latest 13F and the portfolio is rebalanced monthly to keep constant
weights. The mimicking portfolio of Berkshire’s private holdings is constructed following the procedure
described in Appendix A. Alpha is the intercept in a regression of monthly excess return. The explanatory
variables are the monthly returns of the standard size, value, and momentum factors, the Frazzini and
Pedersen (2010) Betting-Against-Beta factor, and the Asness, Frazzini and Pedersen (2012) Quality-Minus-
Junk factor. Alphas are annualized, t-statistics are shown below the coefficient estimates, and 5% statistical
significance is indicated in bold.
Alpha 12.5% 11.1% 7.0% 5.5% 4.7% 0.1% 5.8% 5.0% 4.9%
(3.28) (2.92) (1.79) (2.60) (2.26) (0.04) (1.39) (1.20) (1.12)
MKT 0.84 0.78 0.97 0.86 0.83 1.04 0.40 0.35 0.35
(11.49) (10.49) (10.62) (21.33) (19.86) (21.04) (4.92) (4.19) (3.33)
SMB -0.30 -0.39 -0.07 -0.18 -0.23 0.11 -0.29 -0.34 -0.33
-(2.91) -(3.61) -(0.52) -(3.16) -(3.97) (1.52) -(2.53) -(2.93) -(2.09)
HML 0.47 0.30 0.21 0.30 0.19 0.10 0.26 0.14 0.13
(4.24) (2.39) (1.72) (4.88) (2.74) (1.48) (2.19) (1.01) (0.97)
UMD 0.06 0.02 0.01 -0.02 -0.05 -0.06 0.08 0.05 0.05
(0.86) (0.29) (0.16) -(0.60) -(1.34) -(1.69) (1.13) (0.63) (0.63)
BAB 0.27 0.18 0.16 0.07 0.18 0.18
(3.12) (2.11) (3.50) (1.58) (2.07) (1.97)
Quality 1.40 1.49 0.04
(3.50) (7.12) (0.08)
R2 bar 0.24 0.26 0.28 0.56 0.57 0.62 0.07 0.08 0.08
Berkshire stock 1976 - 2011 13F portfolio 1980 - 2011 Private Holdings 1984 - 20011
Buffett’s Alpha 29
Table 5
Buffett’s Returns Versus a Systematic Buffett Strategy
This table shows calendar-time portfolio returns. We report statistics for, respectively, Berkshire Hathaway
stock, the mimicking portfolio of Berkshire’s publicly traded stocks as reported in its 13F filings, the
mimicking portfolio of Berkshire’s private holdings, the CRSP value-weighted market return, and a
systematic mimicking portfolio of Buffett’s strategy. To construct the mimicking portfolio of Berkshire’s
publicly traded stocks, at the end of each calendar quarter, we collect Berkshire’s common stock holdings
from its 13F filings and compute portfolio monthly returns, weighted by Berkshire’s dollar holdings, under
the assumption that the firm did not change holdings between reports. The stocks in the portfolio are
refreshed quarterly based on the latest 13F and the portfolio is rebalanced monthly to keep constant
weights. The mimicking portfolio of Berkshire’s private holdings is constructed following the procedure
described Appendix A. The systematic Buffett-style portfolios are constructed from a regression of
monthly excess returns. The explanatory variables are the monthly returns of the standard size, value, and
momentum factors, the Frazzini and Pedersen (2010) Betting-Against-Beta factor, and the Asness, Frazzini
and Pedersen (2012b) quality factor. The procedure is described in Section 7. Alpha is the intercept in a
regression of monthly excess return. Alphas are annualized, t-statistics are shown below the coefficient
estimates, and 5% statistical significance is indicated in bold.
Berkshire
Hathaway
Public U.S. stocks
(from 13F filings)
Private holdings Berkshire
Hathaway
Public U.S. stocks
(from 13F filings)
Private holdings
Sample 1976-2011 1980-2011 1984-2011 1976-2011 1980-2011 1984-2011
Alpha 6.5% -2.1% 5.9% 17.5% 9.5% 11.2%
(1.68) -(0.97) (1.41) (4.60) (4.64) (2.73)
Loading 0.47 0.75 0.27 0.47 0.75 0.27
(10.90) (22.19) (5.11) (10.90) (22.19) (5.11)
Correlation 0.47 0.75 0.27 0.47 0.75 0.27
R2 bar 0.22 0.57 0.07 0.22 0.57 0.07
Regress Berkshire on Systematic Portfolio Regress Systematic Portoflio on Berkshire
Buffett’s Alpha 30
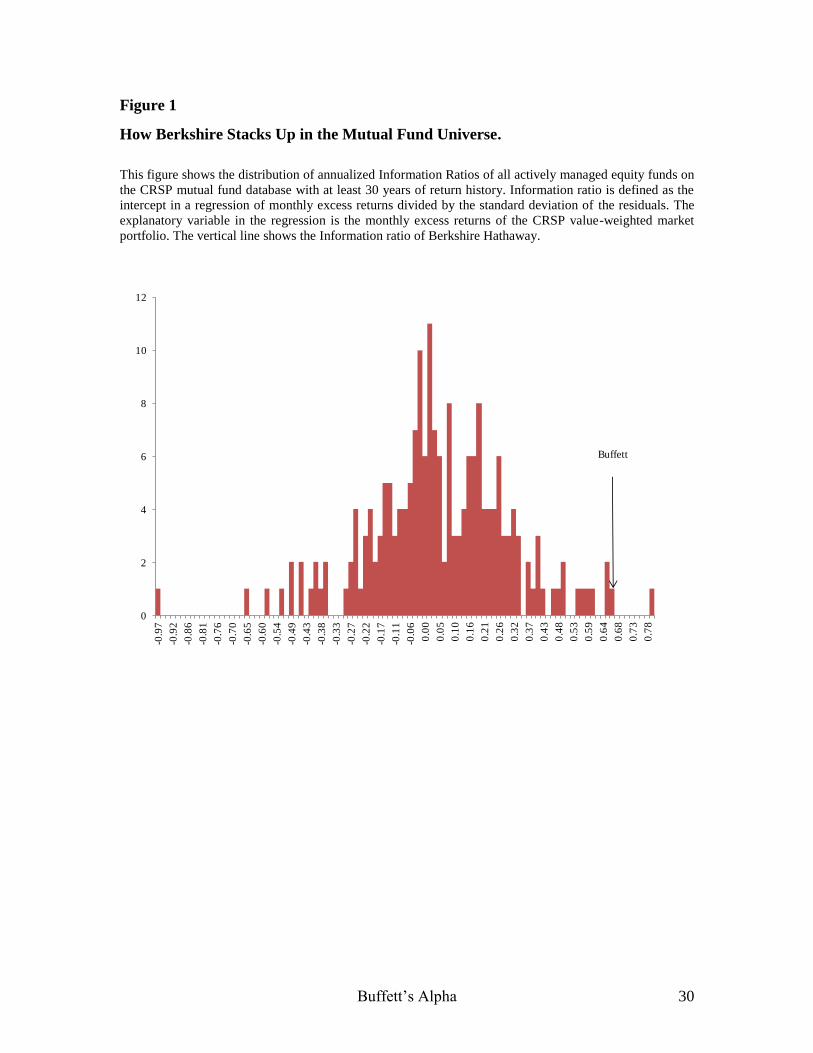
Figure 1
How Berkshire Stacks Up in the Mutual Fund Universe.
This figure shows the distribution of annualized Information Ratios of all actively managed equity funds on
the CRSP mutual fund database with at least 30 years of return history. Information ratio is defined as the
intercept in a regression of monthly excess returns divided by the standard deviation of the residuals. The
explanatory variable in the regression is the monthly excess returns of the CRSP value-weighted market
portfolio. The vertical line shows the Information ratio of Berkshire Hathaway.
0
2
4
6
8
10
12
-0.9
7
-0.9
2
-0.8
6
-0.8
1
-0.7
6
-0.7
0
-0.6
5
-0.6
0
-0.5
4
-0.4
9
-0.4
3
-0.3
8
-0.3
3
-0.2
7
-0.2
2
-0.1
7
-0.1
1
-0.0
6
0.0
0
0.0
5
0.1
0
0.1
6
0.2
1
0.2
6
0.3
2
0.3
7
0.4
3
0.4
8
0.5
3
0.5
9
0.6
4
0.6
8
0.7
3
0.7
8
Buffett
Buffett’s Alpha 31
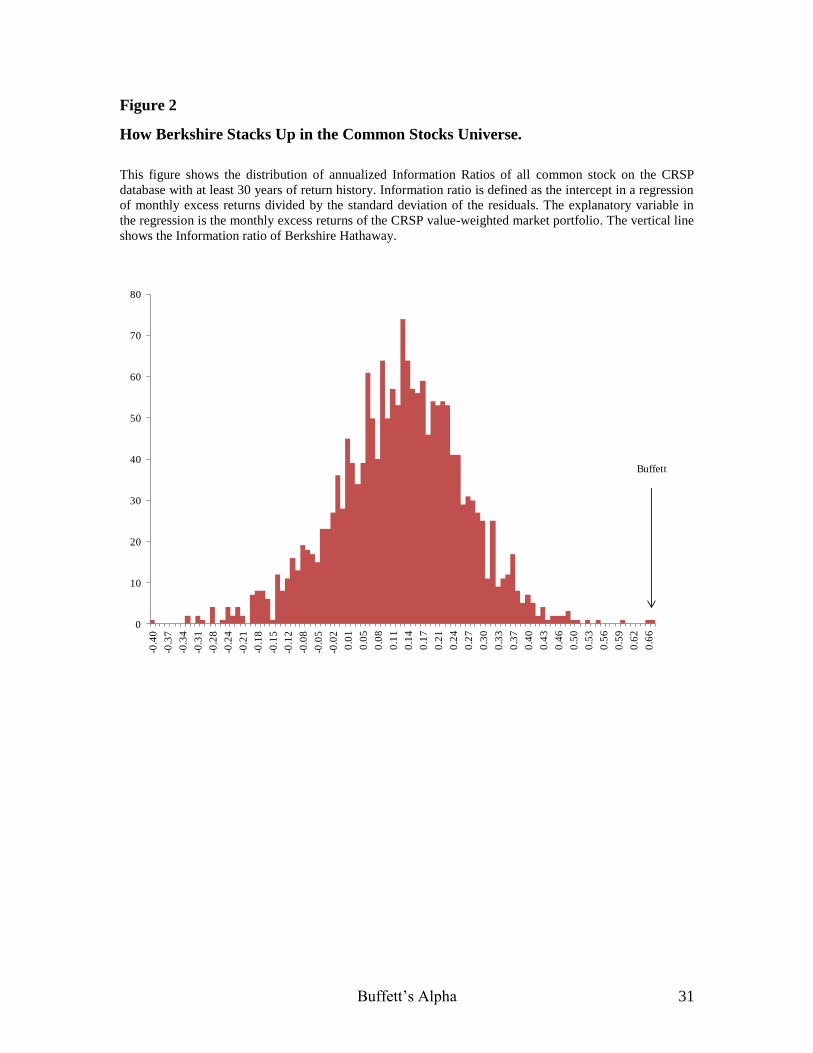
Figure 2
How Berkshire Stacks Up in the Common Stocks Universe.
This figure shows the distribution of annualized Information Ratios of all common stock on the CRSP
database with at least 30 years of return history. Information ratio is defined as the intercept in a regression
of monthly excess returns divided by the standard deviation of the residuals. The explanatory variable in
the regression is the monthly excess returns of the CRSP value-weighted market portfolio. The vertical line
shows the Information ratio of Berkshire Hathaway.
0
10
20
30
40
50
60
70
80
-0.4
0
-0.3
7
-0.3
4
-0.3
1
-0.2
8
-0.2
4
-0.2
1
-0.1
8
-0.1
5
-0.1
2
-0.0
8
-0.0
5
-0.0
2
0.0
1
0.0
5
0.0
8
0.1
1
0.1
4
0.1
7
0.2
1
0.2
4
0.2
7
0.3
0
0.3
3
0.3
7
0.4
0
0.4
3
0.4
6
0.5
0
0.5
3
0.5
6
0.5
9
0.6
2
0.6
6
Buffett
Buffett’s Alpha 32
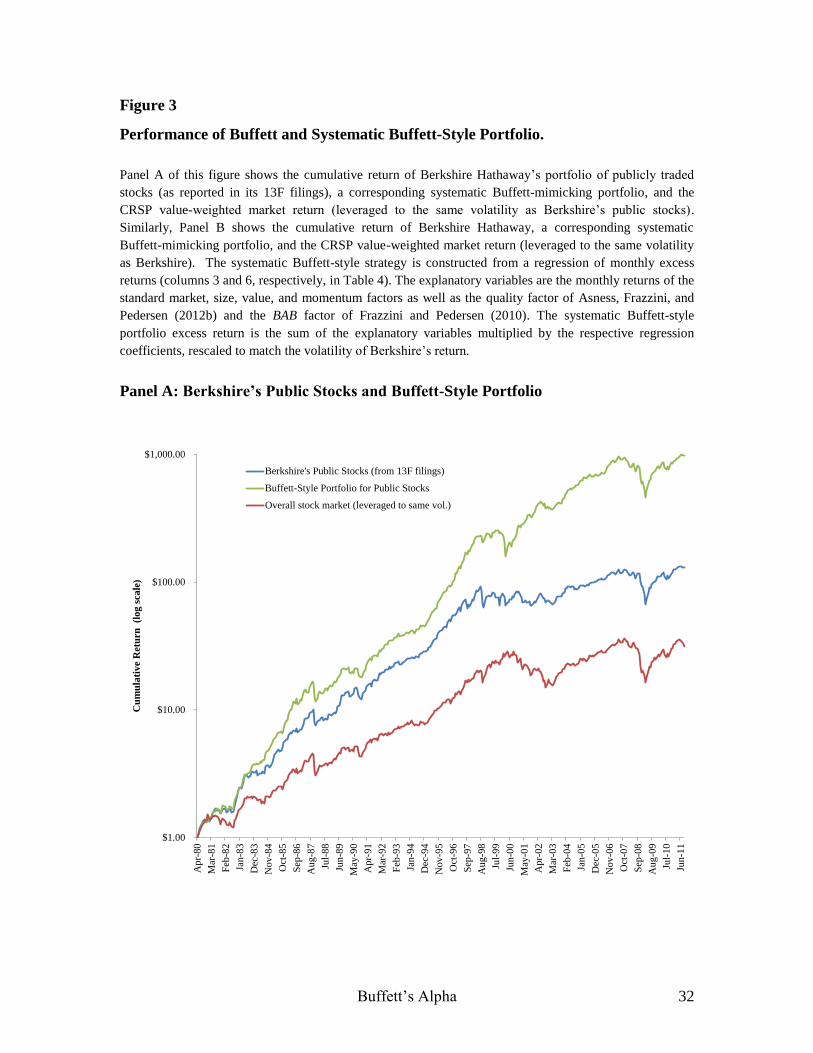
Figure 3
Performance of Buffett and Systematic Buffett-Style Portfolio.
Panel A of this figure shows the cumulative return of Berkshire Hathaway’s portfolio of publicly traded
stocks (as reported in its 13F filings), a corresponding systematic Buffett-mimicking portfolio, and the
CRSP value-weighted market return (leveraged to the same volatility as Berkshire’s public stocks).
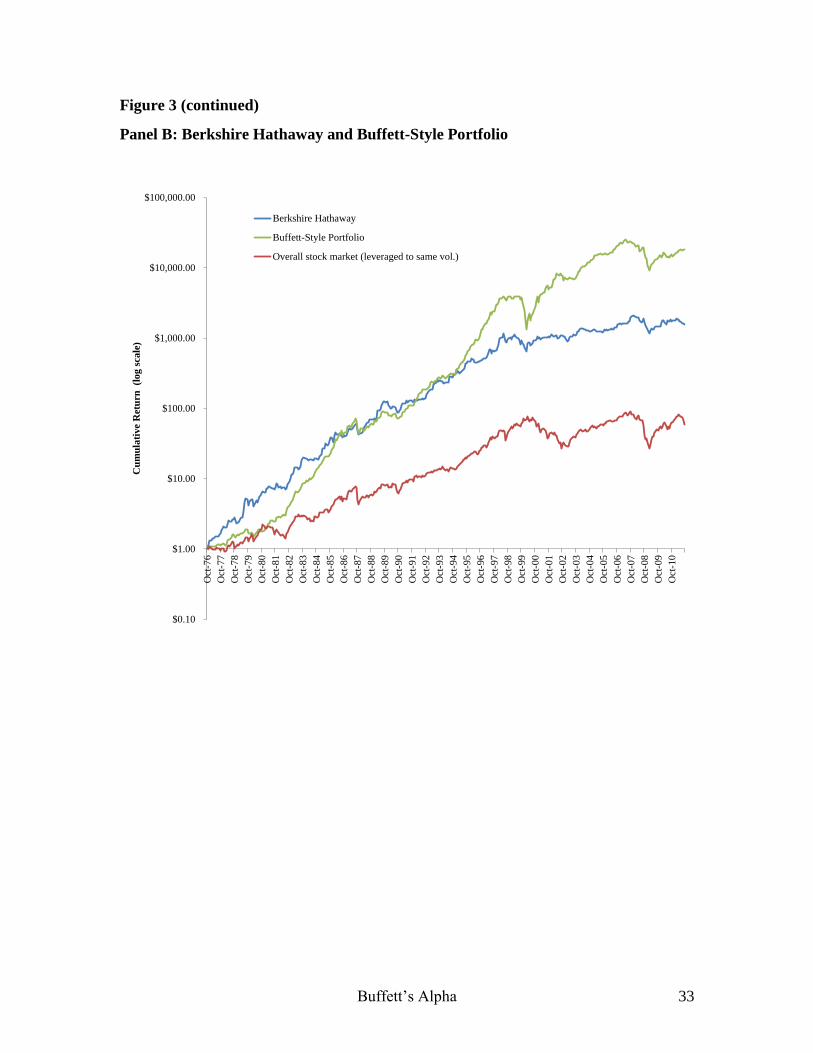
Similarly, Panel B shows the cumulative return of Berkshire Hathaway, a corresponding systematic
Buffett-mimicking portfolio, and the CRSP value-weighted market return (leveraged to the same volatility
as Berkshire). The systematic Buffett-style strategy is constructed from a regression of monthly excess
returns (columns 3 and 6, respectively, in Table 4). The explanatory variables are the monthly returns of the
standard market, size, value, and momentum factors as well as the quality factor of Asness, Frazzini, and
Pedersen (2012b) and the BAB factor of Frazzini and Pedersen (2010). The systematic Buffett-style
portfolio excess return is the sum of the explanatory variables multiplied by the respective regression
coefficients, rescaled to match the volatility of Berkshire’s return.
Panel A: Berkshire’s Public Stocks and Buffett-Style Portfolio
$1.00
$10.00
$100.00
$1,000.00
Apr-
80
Mar
-81
Feb
-82
Jan-8
3
Dec
-83
Nov-8
4
Oct
-85
Sep
-86
Aug-8
7
Jul-
88
Jun-8
9
May
-90
Apr-
91
Mar
-92
Feb
-93
Jan-9
4
Dec
-94
Nov-9
5
Oct
-96
Sep
-97
Aug-9
8
Jul-
99
Jun-0
0
May
-01
Apr-
02
Mar
-03
Feb
-04
Jan-0
5
Dec
-05
Nov-0
6
Oct
-07
Sep
-08
Aug-0
9
Jul-
10
Jun-1
1
Cu
mu
lati
ve
Ret
urn
(l
og
sca
le)
Berkshire's Public Stocks (from 13F filings)
Buffett-Style Portfolio for Public Stocks
Overall stock market (leveraged to same vol.)
Buffett’s Alpha 33
Figure 3 (continued)
Panel B: Berkshire Hathaway and Buffett-Style Portfolio
$0.10
$1.00
$10.00
$100.00
$1,000.00
$10,000.00
$100,000.00O
ct-7
6
Oct
-77
Oct
-78
Oct
-79
Oct
-80
Oct
-81
Oct
-82
Oct
-83
Oct
-84
Oct
-85
Oct
-86
Oct
-87
Oct
-88
Oct
-89
Oct
-90
Oct
-91
Oct
-92
Oct
-93
Oct
-94
Oct
-95
Oct
-96
Oct
-97
Oct
-98
Oct
-99
Oct
-00
Oct
-01
Oct
-02
Oct
-03
Oct
-04
Oct
-05
Oct
-06
Oct
-07
Oct
-08
Oct
-09
Oct
-10
Cu
mu
lati
ve
Ret
urn
(l
og
sca
le)
Berkshire Hathaway
Buffett-Style Portfolio
Overall stock market (leveraged to same vol.)