Embed Size (px)
Citation preview
CHAPTER 27
Budgeting and Budgetary Control
Introduction
Budgeting has come to be accepted as an efficient method of short-term planning and control. It is employed, no doubt, in large business houses, but even the small businesses are using it at least in some informal manner. Through the budgets, a business wants to know clearly as to what it proposes to do during an accounting period or a part thereof. The technique of budgeting is an important application of Management Accounting. Probably, the greatest aid to good management that has ever been devised is the use of budgets and budgetary control. It is a versatile tool and has helped managers cope with many problems including inflation.
DEFINITION OF BUDGET
The Chartered Institute of Management Accountants, England, defines a 'budget' as under:
" A financial and/or quantitative statement, prepared and approved prior to define period of time, of the policy to be persued during that period for the purpose of attaining a given objective."
According to Brown and Howard of Management Accountant "a budget is a predetermined statement of managerial policy during the given period which provides a standard for comparison with the results actually achieved."
Essentials of a Budget
An analysis of the above said definitions reveal the following essentials of a budget:
(1) It is prepared for a definite future period.
(2) It is a statement prepared prior to a defined period of time.
(3) The Budget is monetary and I or quantitative statement of policy.
(4) The Budget is a predetermined statement and its purpose is to attain a given objective.
A budget, therefore, be taken as a document which is closely related to both the managerial as well as accounting functions of an organization.
562 A Textbook of Financial Cost and Management Accounting
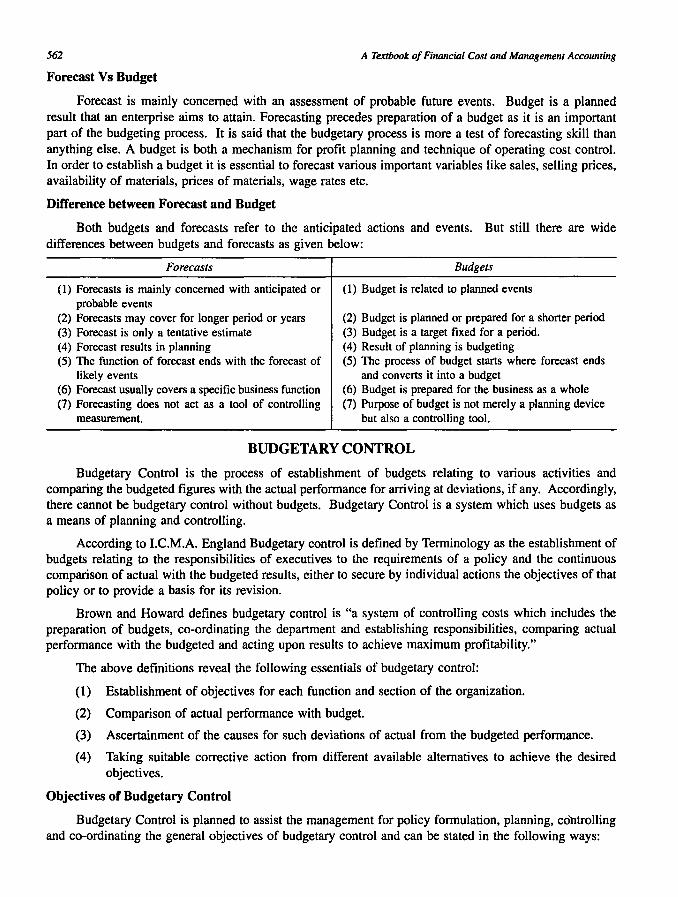
Forecast Vs Budget
Forecast is mainly concerned with an assessment of probable future events. Budget is a planned result that an enterprise aims to attain. Forecasting precedes preparation of a budget as it is an important part of the budgeting process. It is said that the budgetary process is more a test of forecasting skill than anything else. A budget is both a mechanism for profit planning and technique of operating cost control. In order to establish a budget it is essential to forecast various important variables like sales, selling prices, availability of materials, prices of materials, wage rates etc.
Difference between Forecast and Budget
Both budgets and forecasts refer to the anticipated actions and events. But still there are wide differences between budgets and forecasts as given below:
Forecasts
(1) Forecasts is mainly concerned with anticipated or probable events
(2) Forecasts may cover for longer period or years (3) Forecast is only a tentative estimate (4) Forecast results in planning (5) The function of forecast ends with the forecast of
likely events (6) Forecast usually covers a specific business function (7) Forecasting does not act as a tool of controlling
measurement.
Budgets
(1) Budget is related to planned events
(2) Budget is planned or prepared for a shorter period (3) Budget is a target fixed for a periOd. (4) Result of planning is budgeting (5) The process of budget starts where forecast ends
and converts it into a budget (6) Budget is prepared for the business as a whole (7) Purpose of budget is not merely a planning device
but also a controlling tool.
BUDGETARY CONTROL Budgetary Control is the process of establishment of budgets relating to various activities and
comparing the budgeted figures with the actual performance for arriving at deviations, if any. Accordingly, there cannot be budgetary control without budgets. Budgetary Control is a system which uses budgets as a means of planning and controlling.
According to I.C.M.A. England Budgetary control is defined by Terminology as the establishment of budgets relating to the responsibilities of executives to the requirements of a policy and the continuous comparison of actual with the budgeted results, either to secure by individual actions the objectives of that policy or to provide a basis for its revision.
Brown and Howard defines budgetary control is "a system of controlling costs which includes the preparation of budgets, co-ordinating the department and establishing responsibilities, comparing actual performance with the budgeted and acting upon results to achieve maximum profitability."
The above definitions reveal the following essentials of budgetary control:
(1) Establishment of objectives for each function and section of the organization.
(2) Comparison of actual performance with budget.
(3) Ascertainment of the causes for such deviations of actual from the budgeted performance.
(4) Taking suitable corrective action from different available alternatives to achieve the desired objectives.
Objectives of Budgetary Control
Budgetary Control is planned to assist the management for policy formulation, planning, controlling and co-ordinating the general objectives of budgetary control and can be stated in the following ways:
Budgeting and Budgetary Control 563
(1) Planning: A budget is a plan of action. Budgeting ensures a detailed plan of action for a business over a period of time.
(2) Co-ordination: Budgetary control co-ordinates the various activities of the entity or organization and secure co-operation of all concerned towards the common goal.
(3) Control: Control is necessary to ensure that plans and objectives are being achieved. Control follows planning and co-ordination. No control performance is possible without predetermined standards. Thus, budgetary control makes control possible by continuous measures against predetermined targets. If there is any variation between the budgeted performance and the actual performance, the same is subject to analysis and corrective action.
Scope and Techniques of Standard Costing and Budgetary Control
Scope:
(1) Budgets are prepared for different functions of business such as production, sales etc. Actual results are compared with the budgets and control is exercised.
Standards on the other hand are complied by classifying, recording and allocation of the expenses to cost units. Actual costs are compared with standard costs.
(2) Budgets have a wide range of coverage of the entire organization. Each operation or process is divided into number of elements and standards are set for each such element.
(3) Budgetary control is concerned with origin of expenditure at functional levels.
Standard costing is concerned with the requirements of each element of cost.
(4) Budget is a projection of financial accounts whereas standard costing projects the cost accounts.
Technique:
(1) Budgetary control is exercised by putting budgets and actuals side by side.
Variances are not normally revealed in the accounts. Standard costing variances are revealed through accounts.
(2) Budgetary control system can be operated in parts. For example, Advertisement Budgets, Research and Development Budgets, etc. Standard costing is not put into operation in parts.
(3) Budgetary control of expenses is broad in nature whereas standard costing system is a far more technically improved system by means of which the variances are analysed in detail.
Requisites for Effective Budgetary Control
The following are the requisites for effective budgetary control :
(1) Clear cut objectives and goals should be well defined.
(2) The ultimate objective of realising maximum benefits should always be kept uppermost.
(3) There should be a budget manual which contains all details regarding plan and procedures for its execution. It should also specify the time table for budget preparation for approval, details about responsibility, cost centers etc.
(4) Budget committee should be set up for budget preparation and efficient execution of the plan.
(5) A budget should always be related to a specified time period.
564 A TeXlbook of Financial Cost and Management Accounting
(6) Support of top management is necessary in order to get the full support and co-operation of the system of budgetary control.
(7) To make budgetary control successful, there should be a proper delegation of authority and responsibility.
(8) Adequate accounting system is essential to make the budgeting successful.
(9) The employees should be properly educated about the benefits of budgeting system.
(10) The budgeting system should not cost more to operate than it is worth.
(11) Key factor or limiting factor, if any, should consider before preparation of budget.
(12) For budgetary control to be effective, proper periodic reporting system should be introduced.
Organization for Budgetary Control
In order to introduce budgetary control system, the following are essential to be considered for a sound and efficient organization. The important aspects to be considered are :
1. Organisation Chart
2. Budget Center
3. Budget Officer
4. Budget Committee
5. Budget Manual
6. Budget Period
7. Key Factor
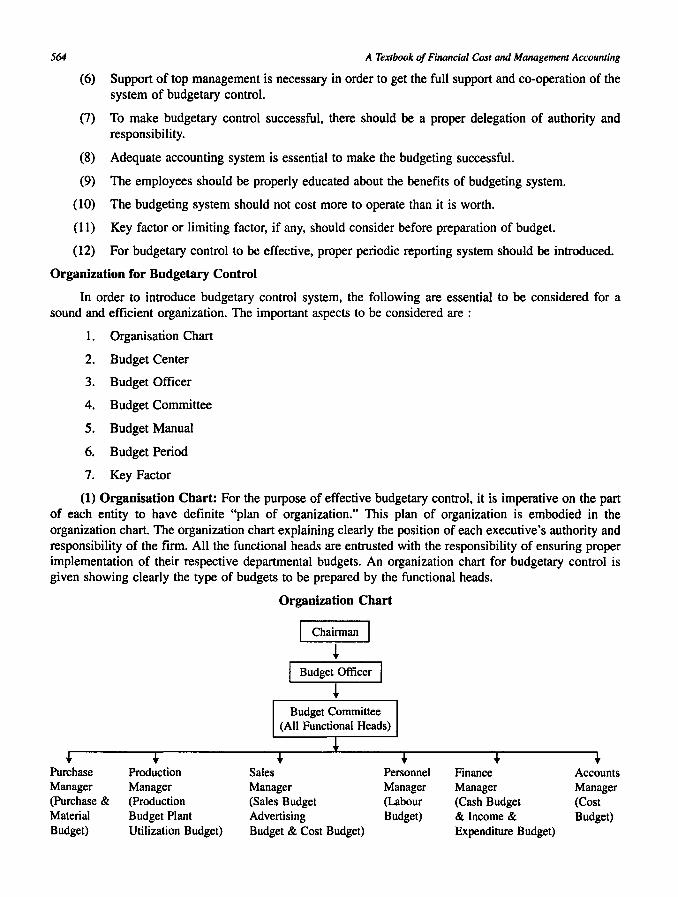
(1) Organisation Chart: For the purpose of effective budgetary control, it is imperative on the part of each entity to have definite "plan of organization." This plan of organization is embodied in the organization chart. The organization chart explaining clearly the position of each executive's authority and responsibility of the firm. All the functional heads are entrusted with the responsibility of ensuring proper implementation of their respective departmental budgets. An organization chart for budgetary control is given showing clearly the type of budgets to be prepared by the functional heads.
Organization Chart
I Chairman I ~
Budget Officer
~
Purchase Production Sales Personnel Finance Accounts Manager Manager Manager Manager Manager Manager (Purchase & (Production (Sales Budget (Labour (Cash Budget (Cost Material Budget Plant Advertising Budget) & Income & Budget) Budget) Utilization Budget) Budget & Cost Budget) Expenditure Budget)
Budgeting and Budgetary Control 565
From the above chart we can observe that the chairman of the company is the overall in charge of the functions of the Budgeted Committee. A Budget Officer is the convener of the budget committee, who helps in co-ordination. The Purchase Manager, Production Manager, Sales Manager, Personnel Manager, Finance Manager and Account Manager are made responsible to prepare their budgets.
(2) Budget Center: A Budget Center is defined by the terminology as "a section of the organization of an undertaking defined for the purpose of budgetary control." For effective budgetary control budget centre or departments should be established for each of which budget will be set with the help of the head of the department concerned.
(3) Budget Officer: Budget Officer is usually some senior member of the accounting staff who controls the budgetary process. He does not prepare the budget himself, but facilitates and co-ordinates the budgeting activity. He assists the individual departmental heads and the budget committee, and ensures that their decisions are communicated to the appropriate people.
(4) Budget Committee: Budget Committee comprising of the Managing Director, the Production Manager, Sales Manager and Accountant. The main objectives of this committee is to agree on all departmental budgets, normal standard hours and allocations. In small concerns, the Budget Officer may co-ordinate the work for preparation and implementation of budgets. In large-scale concern a budget committee is setup for preparation of budgets and execution of budgetary control.
(5) Budget Manual: A Budget Manual has been defined as "a document which set out the responsibilities of persons engaged in the routine of and the forms and records required for budgetary control." It contains all details regarding the plan and procedures for its execution. It also specifies the time table for budget preparation to approval, details about responsibility, cost centers, constitution and organization of budget committee, duties and responsibilities of budget officer.
(6) Budget Period: A budget is always related to specified time period. The budget period is the length of time for which a budget is prepared and employed. The period may depend upon the type of budget. There is no specific period as such. However, for the sake of convenience, the budget period may be fixed depending upon the following factors:
(a) Types of Business
(b) Types of Budget
(c) Nature of the demand of the product
(d) Length of trade cycle
(e) Economic factors
(f) Ava!lability of accounting period
(g) Availability of finance
(h) Control operation
Key Factor
Key Factor is also called as "Limiting Factor" or Governing Factor. While preparing the budget, it is necessary to consider key factor for successful budgetary control. The influence of the Key Factor which dominates the business operations in order to ensure that the functional budgets are reasonably capable of fulfilment. The Key Factors include.
(1) Raw materials may be in. short supply.
(2) Non-availability of skilled labours.
566 A Textbook of Financial Cost and Management Accounting
(3) Government restrictions.
(4) Limited sales due to insufficient sales promotion.
(5) Shortage of power.
(6) Underutilization of plant capacity.
(7) Shortage of efficient executives.
(8) Management policies regarding lack of capital.
(9) Insufficient research into new product development.
(10) , Insufficiency due to shortage of space.
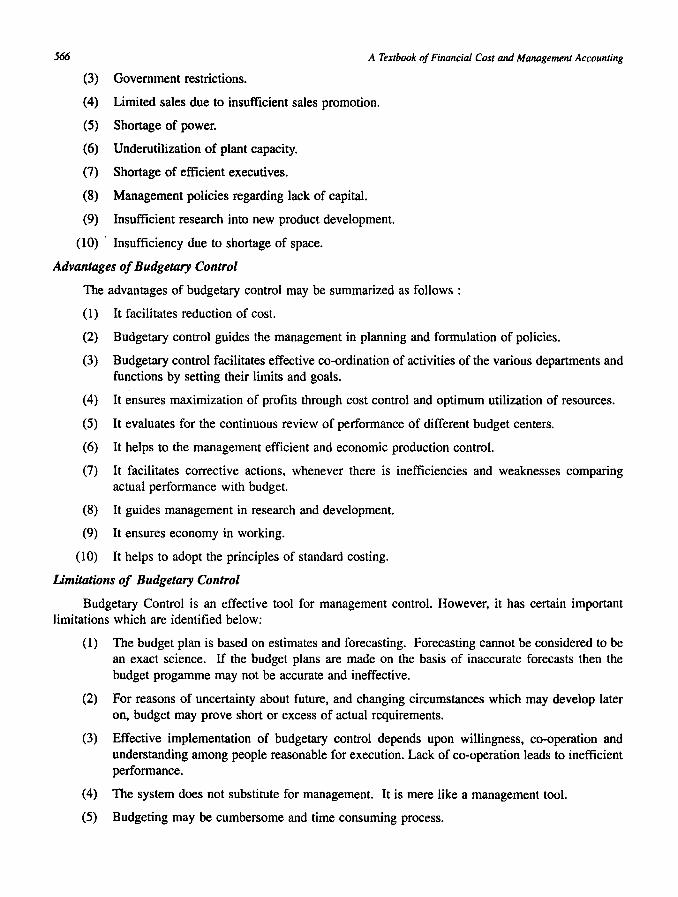
Advantages of Budgetary Control
The advantages of budgetary control may be summarized as follows :
(1) It facilitates reduction of cost.
(2) Budgetary control guides the management in planning and formulation of policies.
(3) Budgetary control facilitates effective co-ordination of activities of the various departments and functions by setting their limits and goals.
(4) It ensures maximization of profits through cost control and optimum utilization of resources.
(5) It evaluates for the continuous review of performance of different budget centers.
(6) It helps to the management efficient and economic production control.
(7) It facilitates corrective actions, whenever there is inefficiencies and weaknesses comparing actual performance with budget.
(8) It guides management in research and development.
(9) It ensures economy in working.
(10) It helps to adopt the principles of standard costing.
Limitations of Budgetary Control
Budgetary Control is an effective tool for management control. However, it has certain important limitations which are identified below:
(1) The budget plan is based on estimates and forecasting. Forecasting cannot be considered to be an exact science. If the budget plans are made on the basis of inaccurate forecasts then the budget progamme may not be accurate and ineffective.
(2) For reasons of uncertainty about future, and changing circumstances which may develop later on, budget may prove short or excess of actual requirements.
(3) Effective implementation of budgetary control depends upon willingness, co-operation and understanding among people reasonable for execution. Lack of co-operation leads to inefficient performance.
(4) The system does not substitute for management. It is mere like a management tool.
(5) Budgeting may be cumbersome and time consuming process.
Budgeting and Budgetary Control 567
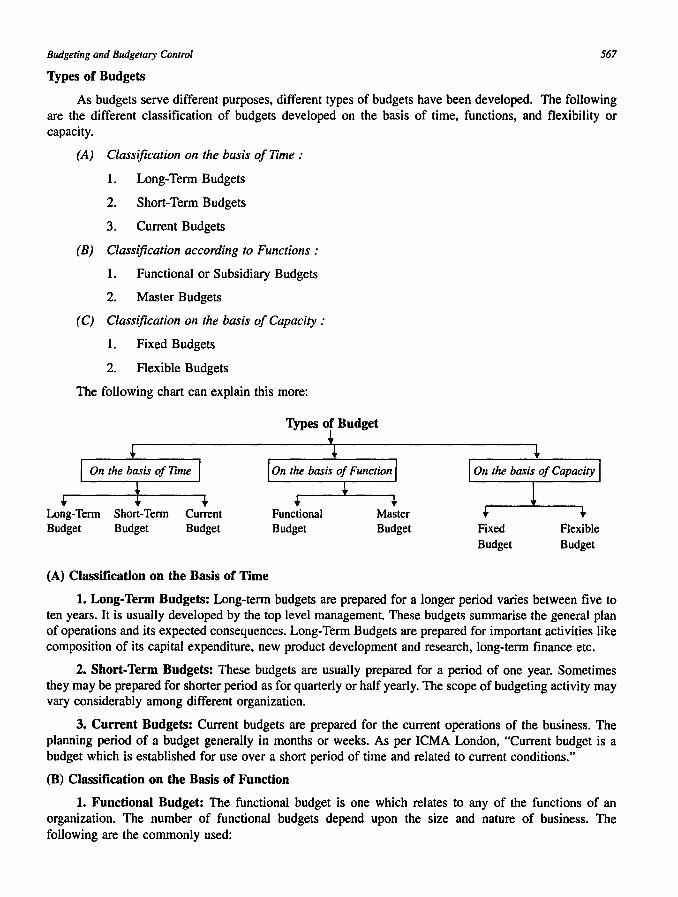
Types of Budgets
As budgets serve different purposes, different types of budgets have been developed. The following are the different classification of budgets developed on the basis of time, functions, and flexibility or capacity.
(A) Classification on the basis of Time:
1. Long-Term Budgets
2. Short-Term Budgets
3. Current Budgets
(B) Classification according to Functions:
1. Functional or Subsidiary Budgets
2. Master Budgets
(C) Classification on the basis of Capacity :
1. Fixed Budgets
2. Flexible Budgets
The following chart can explain this more:
Types of Budget t
Long-Term Short-Term Budget Budget
Current Budget
(A) Classification on the Basis of Time
Functional Budget
Master Budget Fixed
Budget Flexible Budget
1. Long-Term Budgets: Long-term budgets are prepared for a longer period varies between five to ten years. It is usually developed by the top level management. These budgets summarise the general plan of operations and its expected consequences. Long-Term Budgets are prepared for important activities like composition of its capital expenditure, new product development and research, long-term finance etc.
2. Short-Term Budgets: These budgets are usually prepared for a period of one year. Sometimes they may be prepared for shorter period as for quarterly or half yearly. The scope of budgeting activity may vary considerably among different organization.
3. Current Budgets: Current budgets are prepared for the current operations of the business. The planning period of a budget generally in months or weeks. As per ICMA London, "Current budget is a budget which is established for use over a short period of time and related to current conditions."
(B) Classification on the Basis of Function
1. Functional Budget: The functional budget is one which relates to any of the functions of an organization. The number of functional budgets depend upon the size and nature of business. The following are the commonly used:
568 A Textbook of Financial Cost and Management Accounting
(1) Sales Budget
(2) Purchase Budget
(3) Production Budget
(4) Selling and Distribution Cost Budget
(5) Labour Cost Budget
(6) Cash Budget
(7) Capital Expenditure Budget
2. Master Budget: The Master Budget is a summary budget. This budget encompasses all the functional activities into one harmonious unit. The ICMA England defines a Master Budget as the summary budget incorporating its functional budgets, which is finally approved, adopted and employed.
(C) Classification on the Basis of Capacity
1. Fixed Budget: A fixed budget is designed to remain unchanged irrespective of the level of activity actually attained.
2. Flexible Budget: A flexible budget is a budget which is designed to change in accordance with the various level of activity actually attained. The flexible budget also called as Variable Budget or Sliding Scale Budget, takes both fixed, variable and semi fixed manufacturing costs into account.
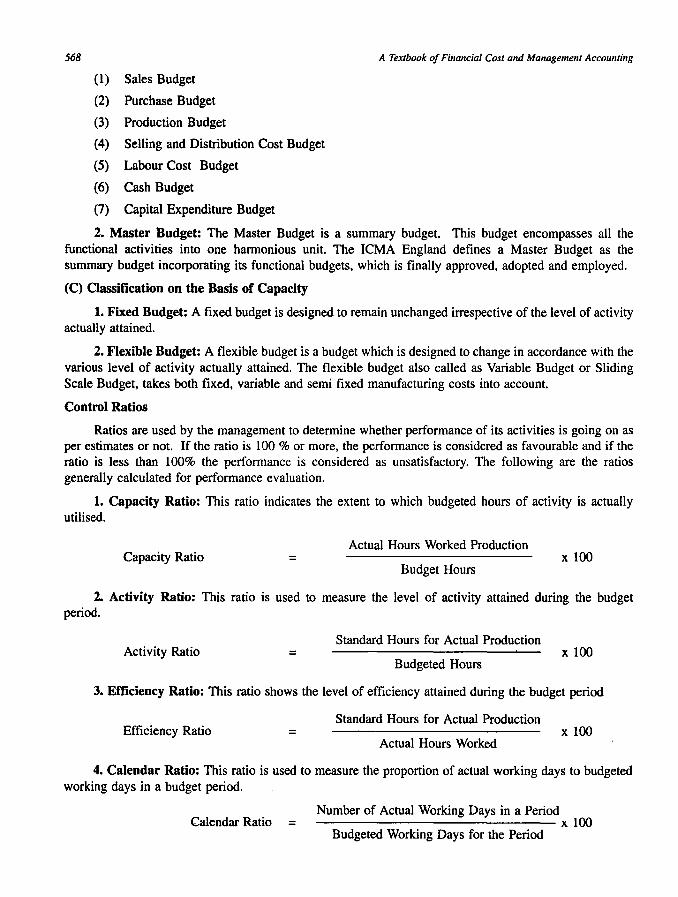
Control Ratios
Ratios are used by the management to determine whether performance of its activities is going on as per estimates or not. If the ratio is 100 % or more, the performance is considered as favourable and if the ratio is less than 100% the performance is considered as unsatisfactory. The following are the ratios generally calculated for performance evaluation.
1. Capacity Ratio: This ratio indicates the extent to which budgeted hours of activity is actually utilised.
Actual Hours Worked Production Capacity Ratio = x 100
Budget Hours
2. Activity Ratio: This ratio is used to measure the level of activity attained during the budget period.
Standard Hours for Actual Production Activity Ratio = x 100
Budgeted Hours
3. Efficiency Ratio: This ratio shows the level of efficiency attained during the budget period
Efficiency Ratio = Standard Hours for Actual Production
Actual Hours Worked x 100
4. Calendar Ratio: This ratio is used to measure the proportion of actual working days to budgeted working days in a budget period.
Calendar Ratio = Number of Actual Working Days in a Period ------------------------------x 100
Budgeted Working Days for the Period
Budgeting and Budgetary Control 569
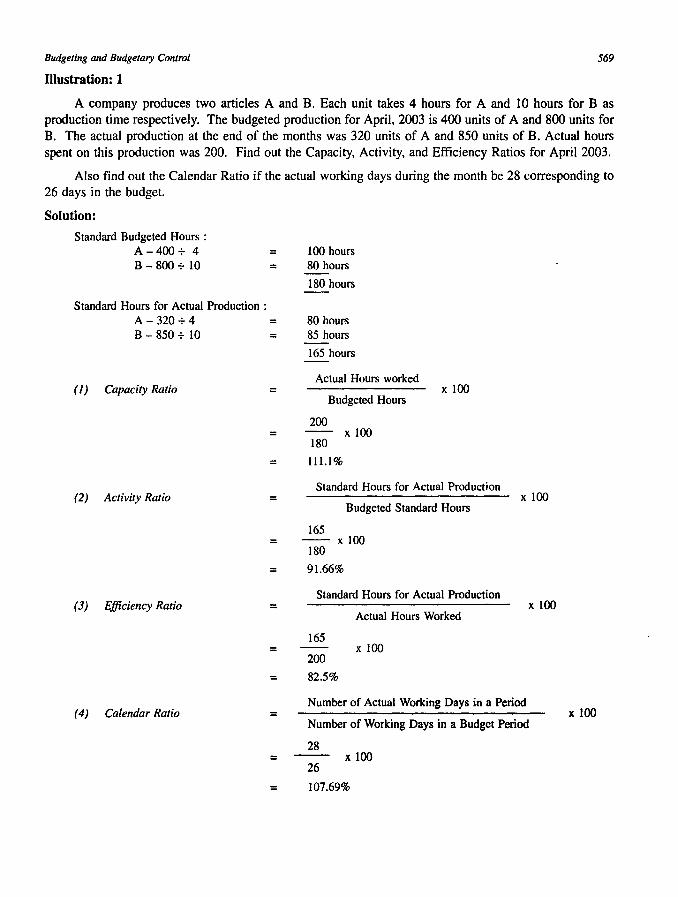
Illustration: 1
A company produces two articles A and B. Each unit takes 4 hours for A and 10 hours for B as production time respectively. The budgeted production for April, 2003 is 400 units of A and 800 units for B. The actual production at the end of the months was 320 units of A and 850 units of B. Actual hours spent on this production was 200. Find out the Capacity, Activity, and Efficiency Ratios for April 2003.
Also find out the Calendar Ratio if the actual working days during the month be 28 corresponding to 26 days in the budget.
Solution:
Standard Budgeted Hours: A-400+ 4 = B-800+10 =
Standard Hours for Actual Production: A - 320 + 4 = B-850+1O =
( 1) Capacity Ratio =
100 hours 80 hours
180 hours
80 hours 85 hours
165 hours
Actual Hours worked
Budgeted Hours
200
x 100
= -- x 100
(2) Activity Ratio
(3) Efficiency Ratio
180
= 111.1%
=
=
Standard Hours for Actual Production
Budgeted Standard Hours
165
180 x 100
= 91.66%
=
=
Standard Hours for Actual Production
Actual Hours Worked
165
200 x 100
= 82.5%
x 100
x 100
(4) Calendar Ratio = Number of Actual Working Days in a Period
Number of Working Days in a Budget Period
28 = x 100
26
= 107.69%
x 100
570
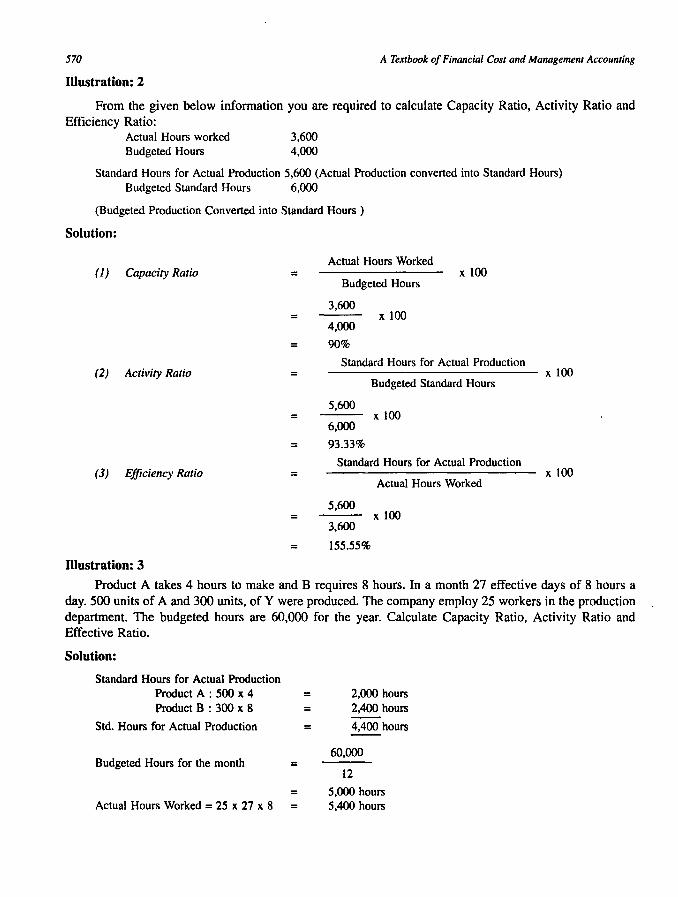
Illustration: 2
A Textbook of Financial Cost and Management Accounting
From the given below information you are required to calculate Capacity Ratio, Activity Ratio and Efficiency Ratio:
Actual Hours worked Budgeted Hours
3,600 4,000
Standard Hours for Actual Production 5,600 (Actual Production converted into Standard Hours) Budgeted Standard Hours 6,000
(Budgeted Production Converted into Standard Hours )
Solution:
( 1 ) Capacity Ratio
(2) Activity Ratio
(3) Efficiency Ratio
Illustration: 3
=
=
=
=
Actual Hours Worked
Budgeted Hours
3,600
4,000
90%
x 100
x 100
Standard Hours for Actual Production
5,600
6,000
Budgeted Standard Hours
x 100
= 93.33%
=
=
Standard Hours for Actual Production
Actual Hours Worked
5,600
3,600 x 100
= 155.55%
x 100
x 100
Product A takes 4 hours to make and B requires 8 hours. In a month 27 effective days of 8 hours a day. 500 units of A and 300 units, of Y were produced. The company employ 25 workers in the production department. The budgeted hours are 60,000 for the year. Calculate Capacity Ratio, Activity Ratio and Effective Ratio.
Solution:
Standard Hours for Actual Production Product A : 500 x 4 = Product B : 300 x 8 =
Std. Hours for Actual Production =
Budgeted Hours for the month =
= Actual Hours Worked = 25 x 27 x 8 =
2,000 hours 2,400 hours
4,400 hours
60,000
12
5,000 hours 5,400 hours
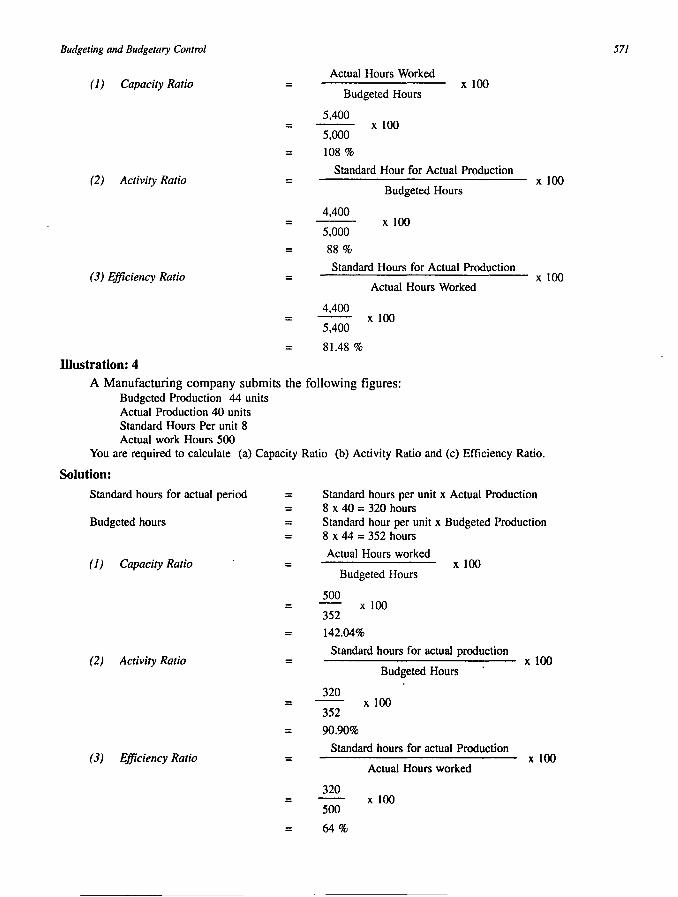
Budgeting and Budgetary Control
( 1 ) Capacity Ratio =
=
= (2) Activity Ratio =
=
= (3) Efficiency Ratio =
Illustration: 4
Actual Hours Worked x 100
Budgeted Hours
5,400 x 100
5,000
108%
Standard Hour for Actual Production
Budgeted Hours
4,400 x 100
5,000
88 %
Standard Hours for Actual Production
4,400
5,400
81.48 %
Actual Hours Worked
x 100
x 100
x 100
A Manufacturing company submits the following figures: Budgeted Production 44 units Actual Production 40 units Standard Hours Per unit 8 Actual work Hours 500
You are required to calculate (a) Capacity Ratio (b) Activity Ratio and (c) Efficiency Ratio.
Solution:
Standard hours for actual period = =
Budgeted hours = =
( 1 ) Capacity Ratio =
=
= (2) Activity Ratio =
=
= (3) Efficiency Ratio =
=
=
Standard hours per unit x Actual Production 8 x 40 = 320 hours Standard hour per unit x Budgeted Production 8 x 44 = 352 hours
Actual Hours worked x 100
Budgeted Hours
500 x 100
352
142.04%
Standard hours for actual production x 100
Budgeted Hours
320 x 100
352
90.90%
Standard hours for actual Production x 100
Actual Hours worked
320 x 100
500
64%
571
572 A Textbook of Financial Cost and Management Accounting
Performance of Budgeting
Perfonnance of Budget has been defined as a "budget based on functions, activities and projects."
Perfonnance of Budgeting may be described as "the budgeting system in which input costs are related to the perfonnance, i.e., end results."
According to National Institute of Bank Management, Perfonnance Budgeting is, "the Process of analyzing, identifying, simplifying and crystallizing specific perfonnance objectives of a job to be achieved over a period, in the framework of the organizational objectives, the purpose and objectives of the job."
From the above definitions, it is clear that budgetary perfonnance involves the following:
(1) Establishment of well defined centers of responsibilities:
(2) Establishment for each responsibility centre - a programme of target perfonnance is -physical units.
(3) Forecasting the amount of expenditure required to meet the physical plan laid down.
(4) Comparison of the actual perfonnance with the budgets, i.e., evaluation of perfonnance.
(5) Undertaking periodic review of the programme with a view to make modifications as required.
SOME IMPORTANT BUDGETS
Sales Budget
Sales Budget is one of the important functional budget. Sales estimate is the commencement of budgeting may be made in quantitative terms. Sales budget is primarily concerned with forecasting of what products will be sold in what quantities and at what prices during the budget period. Sales budget is prepared by the sales executives taking into account number of relevant and influencing factors such as :
(1) Analysis of past sales (Product wise; Territory wise, Quote wise).
(2) Key Factors.
(3) Market Conditions.
(4) Production Capacity.
(5) Government Restrictions.
(6) Competitor's Strength and Weakness.
(7) Advertisement, Publicity and Sales Promotion.
(8) Pricing Policy.
(9) Consumer Behaviour.
(10) Nature of Business.
( 11 ) Types of Product.
(12) Company Objectives.
Budgeting and Budgetary Control
(13) Salesmen's Report.
(14) Marketing Research's Reports.
(15) Product Life Cycle.
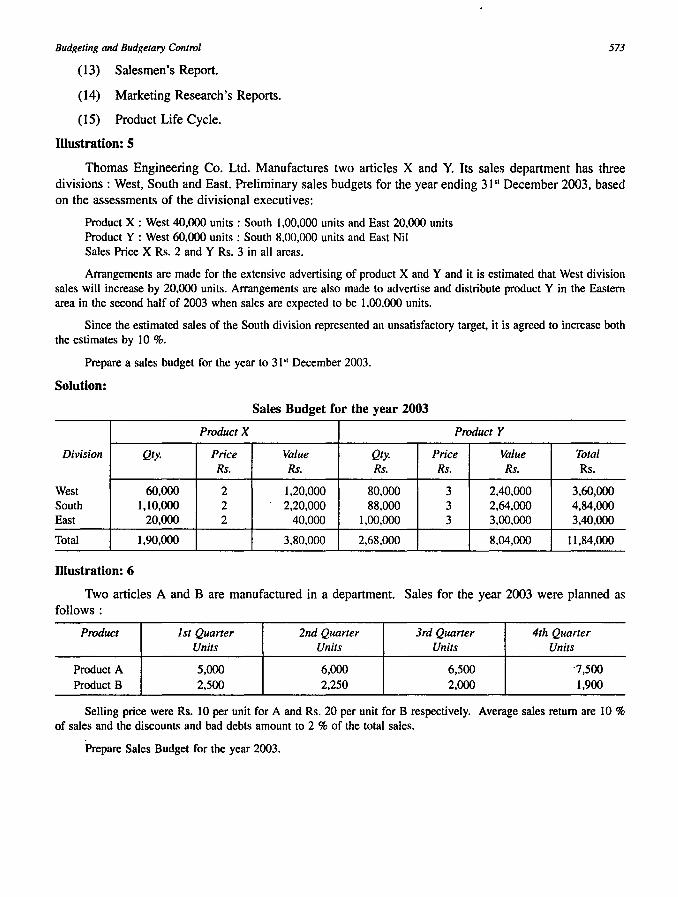
Illustration: 5
573
Thomas Engineering Co. Ltd. Manufactures two articles X and Y. Its sales department has three divisions: West, South and East. Preliminary sales budgets for the year ending 3151 December 2003. based on the assessments of the divisional executives:
Product X : West 40,000 units: South 1,00,000 units and East 20,000 units Product Y : West 60,000 units: South 8,00,000 units and East Nil Sales Price X Rs. 2 and Y Rs. 3 in all areas.
Arrangements are made for the extensive advertising of product X and Y and it is estimated that West division sales will increase by 20,000 units. Arrangements are also made to advertise and distribute product Y in the Eastern area in the second half of 2003 when sales are expected to be 1,00,000 units.
Since the estimated sales of the South division represented an unsatisfactory target, it is agreed to increase both the estimates by 10 %.
Prepare a sales budget for the year to 31" December 2003.
Solution:
Sales Budget for the year 2003
Product X Product Y
Division Qty. Price Value Qty. Price Value Total Rs. Rs. Rs. Rs. Rs. Rs.
West 60,000 2 1,20,000 80,000 3 2,40,000 3,60,000 South 1,10,000 2 2,20,000 88,000 3 2,64,000 4,84,000 East 20,000 2 40,000 1,00,000 3 3,00,000 3,40,000
Total 1,90,000 3,80,000 2,68.000 8.04,000 11,84,000
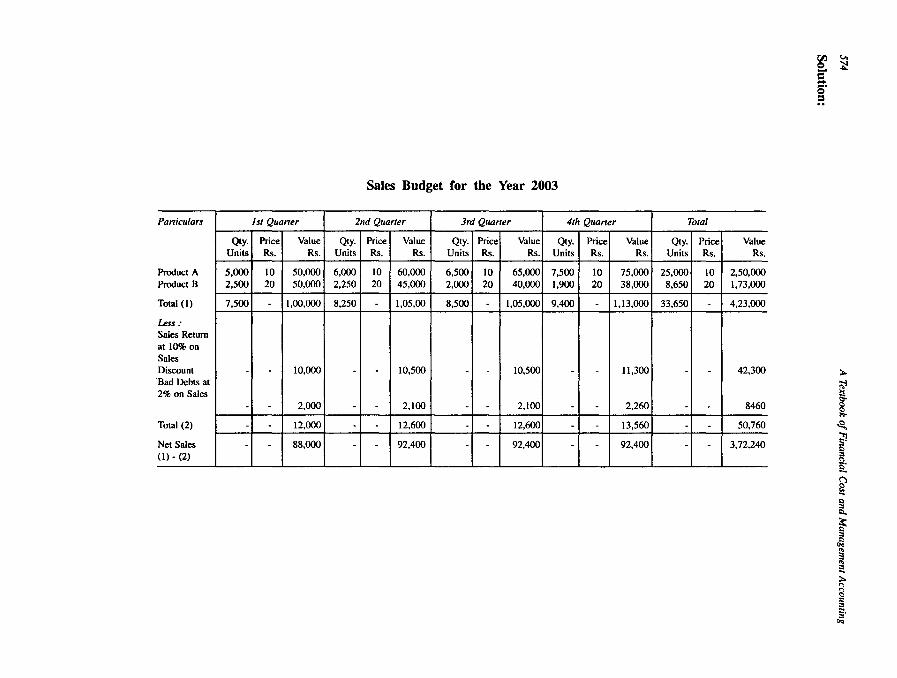
Illustration: 6
Two articles A and B are manufactured in a department. Sales for the year 2003 were planned as follows:
Product 1st Quaner 2nd Quarter 3rd Quaner 4th Quarter Units Units Units Units
Product A 5,000 6,000 6,500 "7,500 Product B 2,500 2,250 2,000 1,900
Selling price were Rs. 10 per unit for A and Rs. 20 per unit for B respectively. Average sales return are 10 % of sales and the discounts and bad debts amount to 2 % of the total sales.
Prepare Sales Budget for the year 2003.
Sales Budget for the Year 2003
Paniculars 1st Quaner 211d Quaner 3rd Quaner 4th Quaner Total
Qty. Price Value Qty. Price Value Qty. Price Value Qty. Price Value Qty. Price Value Units Rs. Rs. Units Rs. Rs. Units Rs. Rs. Units Rs. Rs. Units Rs. Rs.
Product A 5,000 10 50,000 6,000 10 60,000 6,500 10 65,000 7,500 10 75,000 25,000 10 2,50,000 Product B 2,500 20 50,000 2,250 20 45,000 2,000 20 40,000 1,900 20 38,000 8,650 20 1,73,000
Total (I) 7,500 - 1,00,000 8,250 - 1,05,00 8,500 - 1,05,000 9,400 - 1,13,000 33,650 - 4,23,000
Less: Sales Return at 10% on Sales Discount - - 10,000 - - 10,500 - - 10,500 - - 11,300 - - 42,300 'Bad Debts at 2% on Sales
- - 2,000 - - 2,100 - - 2,100 - - 2,260 - - 8460
Total (2) - - 12,000 - - 12,600 - - 12,600 - - 13,560 - - 50,760
Net Sales - - 88,000 - - 92,400 - - 92,400 - - 92,400 - - 3,72,240 (I) - (2)
Budgeting and Budgetary Control 575
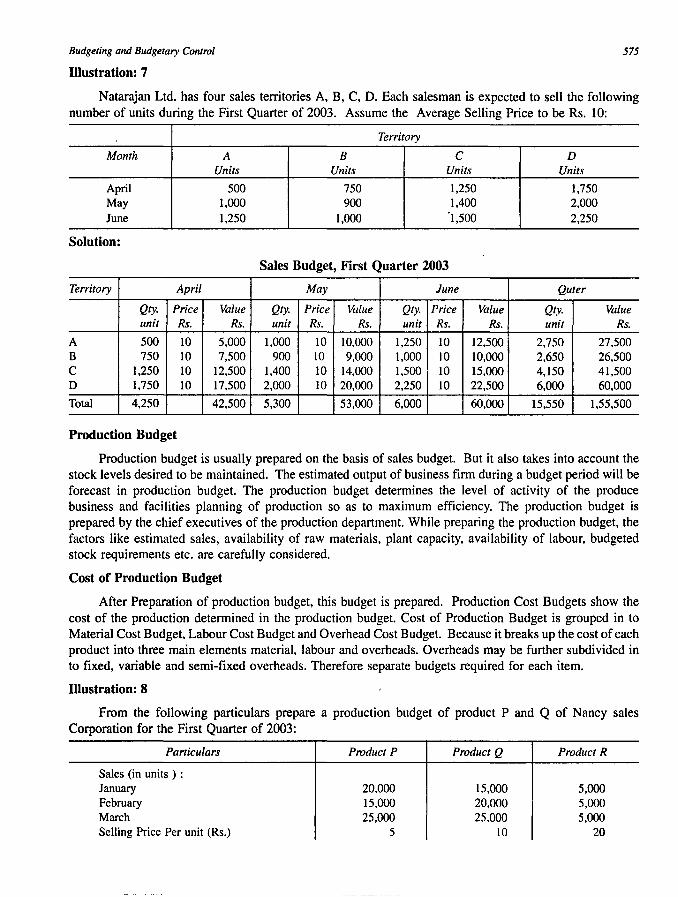
Illustration: 7
Natarajan Ltd. has four sales territories A, B, C, D. Each salesman is expected to sell the following number of units during the First Quarter of 2003. Assume the Average Selling Price to be Rs. 10:
Territory
Month A B C D Units Units Units Units
April 500 750 1,250 1,750 May 1,000 900 1.400 2,000 June 1,250 1,000 '1,500 2,250
Solution:
Sales Budget, First Quarter 2003
Territory April May June Quter
Qty. Price Value Qty. Price Value Qty. Price Value Qty. Value unit Rs. Rs. unit Rs. Rs. unit Rs. Rs. unit Rs.
A 500 10 5,000 1,000 10 10,000 1,250 10 12,500 2,750 27.500 B 750 10 7,500 900 10 9,000 1,000 10 10,000 2.650 26,500 C 1,250 10 12,500 1.400 10 14,000 1,500 10 15,000 4,150 41,500 D 1,750 10 17,500 2,000 10 20,000 2,250 10 22,500 6,000 60,000
Total 4,250 42,500 5,300 53,000 6,000 60,000 15,550 1,55,500
Production Budget
Production budget is usually prepared on the basis of sales budget. But it also takes into account the stock levels desired to be maintained. The estimated output of business firm during a budget period will be forecast in production budget. The production budget determines the level of activity of the produce business and facilities planning of production so as to maximum efficiency. The production budget is prepared by the chief executives of the production department. While preparing the production budget, the factors like estimated sales, availability of raw materials, plant capacity, availability of labour, budgeted stock requirements etc. are carefully considered.
Cost of Production Budget
After Preparation of production budget, this budget is prepared. Production Cost Budgets show the cost of the production determined in the production budget. Cost of Production Budget is grouped in to Material Cost Budget, Labour Cost Budget and Overhead Cost Budget. Because it breaks up the cost of each product into three main elements material, labour and overheads. Overheads may be further subdivided in to fixed, variable and semi-fixed overheads. Therefore separate budgets required for each item.
Illustration: 8
From the following particulars prepare a production budget of product P and Q of Nancy sales Corporation for the First Quarter of 2003:
Particulars Product P Product Q Product R
Sales (in units) : January 20,000 15,000 5,000 February 15,000 20,000 5,000 March 25,000 25.000 5,000 Selling Price Per unit (Rs.) 5 10 20
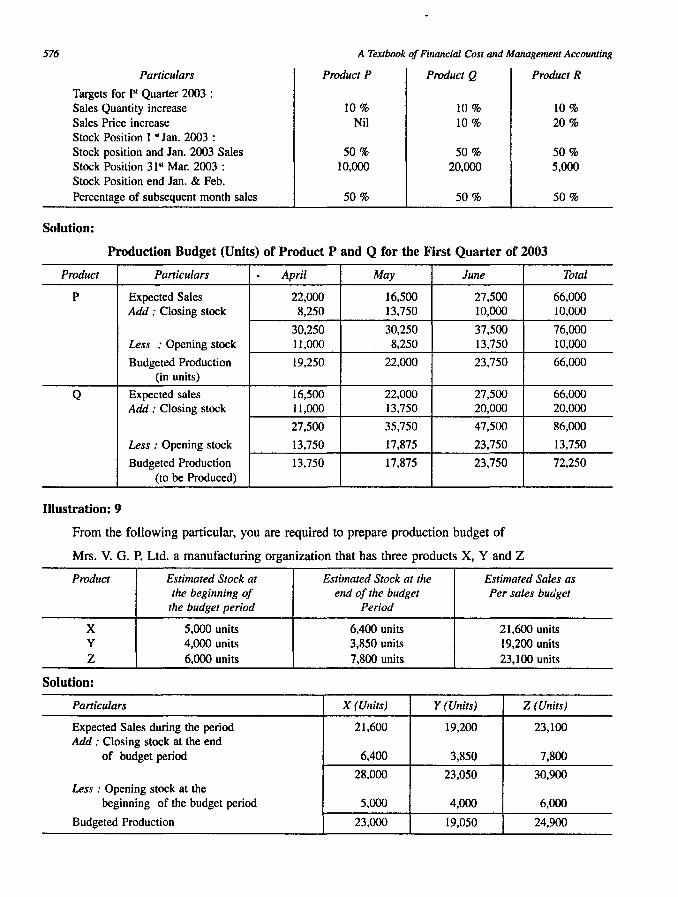
576
Particulars
Targets for 1st Quarter 2003 : Sales Quantity increase Sales Price increase Stock Position I "Jan. 2003 : Stock position and Jan. 2003 Sales Stock Position 31" Mar. 2003 : Stock Position end Jan. & Feb. Percentage of subsequent month sales
Solution:
A Textbook of Financial Cost and Management Accounting
Product P Product Q Product R
10% 10% 10% Nil 10% 20 %
50 % 50 % 50 % 10,000 20,000 5,000
50% 50 % 50 %
Production Budget (Units) of Product P and Q for the First Quarter of 2003
Product Particulars . April May June Total
P Expected Sales 22,000 16,500 27,500 66,000 Add : Closing stock 8,250 13,750 10,000 10,000
30,250 30,250 37,500 76,000 Less : Opening stock 11,000 8,250 13,750 10,000
Budgeted Production 19,250 22,000 23,750 66,000 (in units)
Q Expected sales 16,500 22,000 27,500 66,000 Add : Closing stock 11,000 13,750 20,000 20,000
27,500 35,750 47,500 86,000
Less: Opening stock 13,750 17,875 23,750 13,750
Budgeted Production 13,750 17,875 23,750 72,250 (to be Produced)
Illustration: 9
From the following particular, you are required to prepare production budget of
Mrs. V. G. P. Ltd. a manufacturing organization that has three products X, Y and Z
Product Estimated Stock at Estimated Stock at the Estimated Sales as the beginning of end of the budget Per sales budget
the budget period Period
X 5,000 units 6,400 units 21,600 units y 4,000 units 3,850 units 19,200 units Z 6,000 units 7,800 units 23,100 units
Solution:
Particulars X (Units) Y (Units) Z (Units)
Expected Sales during the period 21,600 19,200 23,100 Add : Closing stock at the end
of budget period 6,400 3,850 7,800
28,000 23,050 30,900 Less : Opening stock at the
beginning of the budget period 5,000 4,000 6,000
Budgeted Production 23,000 19,050 24,900
Budgeting and Budgetary Control
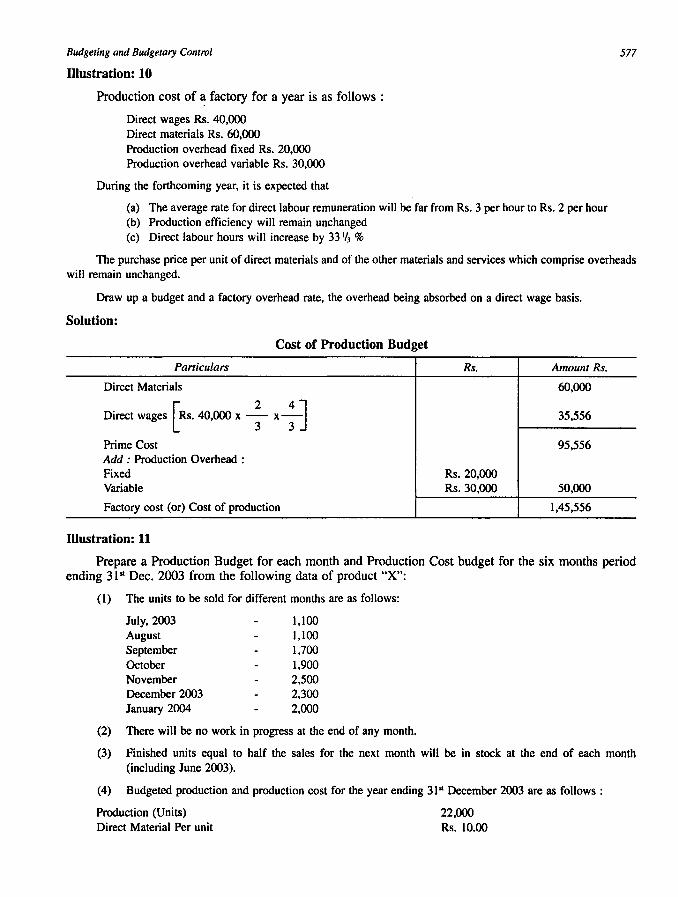
Illustration: 10
Production cost of a factory for a year is as follows :
Direct wages Rs. 40,000 Direct materials Rs. 60,000 Production overhead fixed Rs. 20,000 Production overhead variable Rs. 30,000
During the forthcoming year, it is expected that
(a) The average rate for direct labour remuneration will be far from Rs. 3 per hour to Rs. 2 per hour (b) Production efficiency will remain unchanged (c) Direct labour hours will increase by 33 1/3 %
577
The purchase price per unit of direct materials and of the other materials and services which comprise overheads will remain unchanged.
Draw up a budget and a factory overhead rate, the overhead being absorbed on a direct wage basis.
Solution:
Cost of Production Budget
Paniculars Rs. Amount Rs.
Direct Materials 60,000
Direct wages [RS. 40,000 x ; x : j 35,556
Prime Cost 95,556 Add : Production Overhead : Fixed Rs.20,OOO Variable Rs.30,OOO 50,000
Factory cost (or) Cost of production 1,45,556
Illustration: 11
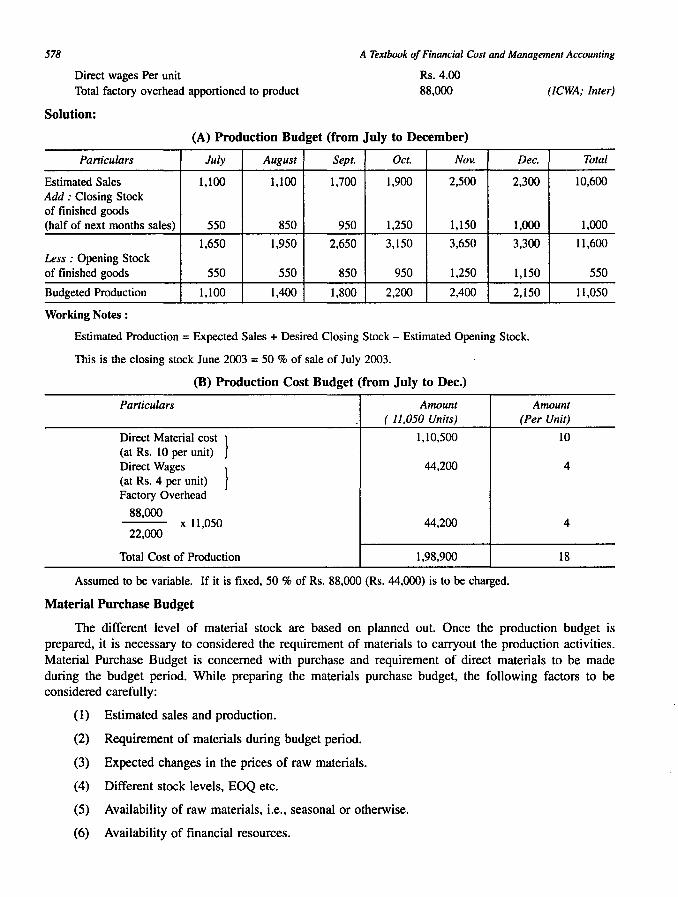
Prepare a Production Budget for each month and Production Cost budget for the six months period ending 31 51 Dec. 2003 from the following data of product "X":
(1) The units to be sold for different months are as follows:
July, 2003 August September October November December 2003 January 2004
1,100 1,100 1,700 1,900 2,500 2,300 2,000
(2) There will be no work in progress at the end of any month.
(3) Finished units equal to half the sales for the next month will be in stock at the end of each month (including June 2003).
(4) Budgeted production and production cost for the year ending 31" December 2003 are as follows:
Production (Units) Direct Material Per unit
22,000 Rs.IO.00
578 A Textbook of Financial Cost and Management Accounting
Direct wages Per unit Total factory overhead apportioned to product
Rs. 4.00 88,000 (ICWA; Inter)
Solution:
(A) Production Budget (from July to December)
Particulars July August Sept. Oct. Nov. Dec.
Estimated Sales 1,100 1,100 1,700 1,900 2,500 2,300 Add,' Closing Stock of finished goods (half of next months sales) 550 850 950 1,250 1,150 1,000
1,650 1,950 2,650 3,150 3,650 3,300 Less,' Opening Stock of finished goods 550 550 850 950 1,250 1,150
Budgeted Production 1,100 1,400 1,800 2,200 2,400 2,150
Working Notes :
Estimated Production = Expected Sales + Desired Closing Stock - Estimated Opening Stock.
This is the closing stock June 2003 = 50 % of sale of July 2003.
(B) Production Cost Budget (from July to Dec.)
Particulars Amount Amount ( 11.050 Units) (Per Unit)
Direct Material cost } 1,10,500 10 (at Rs. 10 per unit) Direct Wages
} 44,200 4
(at Rs. 4 per unit) Factory Overhead
88,000 x 11,050 44,200 4
22,000
Total Cost of Production 1,98,900 18
Assumed to be variable. If it is fixed, 50 % of Rs. 88,000 (Rs. 44,000) is to be charged.
Material Purchase Budget
Total
10,600
1,000
11,600
550
11,050
The different level of material stock are based on planned out. Once the production budget is prepared, it is necessary to considered the requirement of materials to carryout the production activities. Material Purchase Budget is concerned with purchase and requirement of direct materials to be made during the budget period. While preparing the materials purchase budget, the following factors to be considered carefully:
(1) Estimated sales and production.
(2) Requirement of materials during budget period.
(3) Expected changes in the prices of raw materials.
(4) Different stock levels, EOQ etc.
(5) Availability of raw materials, i.e., seasonal or otherwise.
(6) Availability of financial resources.
Budgeting and Budgetary Control
(7) Price trend in the market.
(8) Company's stock policy etc.
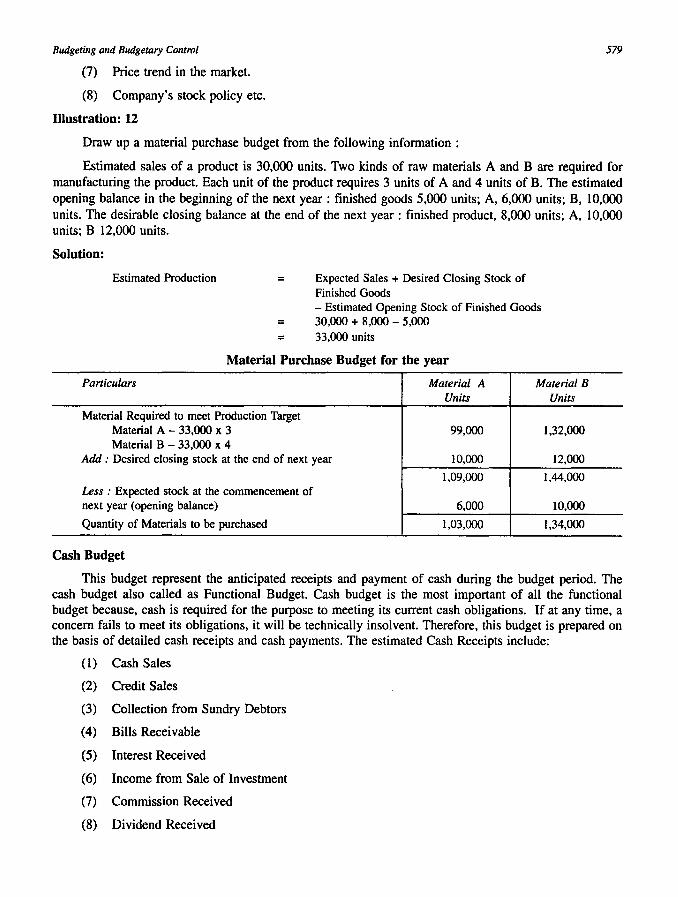
Illustration: 12
Draw up a material purchase budget from the following information :
579
Estimated sales of a product is 30,000 units. Two kinds of raw materials A and B are required for manufacturing the product. Each unit of the product requires 3 units of A and 4 units of B. The estimated opening balance in the beginning of the next year: finished goods 5,000 units; A, 6,000 units; B, 10,000 units. The desirable closing balance at the end of the next year: finished product, 8,000 units; A, 10,000 units; B 12,000 units.
Solution:
Estimated Production =
=
Expected Sales + Desired Closing Stock of Finished Goods - Estimated Opening Stock of Finished Goods 30,000 + 8,000 - 5,000
= 33,000 units
Material Purchase Budget for the year
Particulars Material A Material B Units Units
Material Required to meet Production Target Material A - 33,000 x 3 99,000 1,32,000 Material B - 33,000 x 4
Add : Desired closing stock at the end of next year 10,000 12,000
1,09,000 1,44,000 Less : Expected stock at the commencement of next year (opening balance) 6,000 10,000
Quantity of Materials to be purchased 1,03,000 1,34,000
Cash Budget
This budget represent the anticipated receipts and payment of cash during the budget period. The cash budget also called as Functional Budget. Cash budget is the most important of all the functional budget because, cash is required for the purpose to meeting its current cash obligations. If at any time, a concern fails to meet its obligations, it will be technically insolvent. Therefore, this budget is prepared on the basis of detailed cash receipts and cash payments. The estimated Cash Receipts include:
(1) Cash Sales
(2) Credit Sales
(3) Collection from Sundry Debtors
(4) Bills Receivable
(5) Interest Received
(6) Income from Sale of Investment
(7) Commission Received
(8) Dividend Received
580 A Textbook of Financial Cost and Management Accounting
(9) Income from Non-Trading Operations etc.
The estimated Cash Payments include the following :
(1) Cash Purchase
(2) Payment to Creditors
(3) Payment of Wages
(4) Payments relate to Production Expenses
(5) Payments relate to Office and Administrative Expenses
(6) Payments relate to Selling and Distribution Expenses
(7) Any other payments relate to Revenue and Capital Expenditure
(8) Income Tax Payable, Dividend Payable etc.
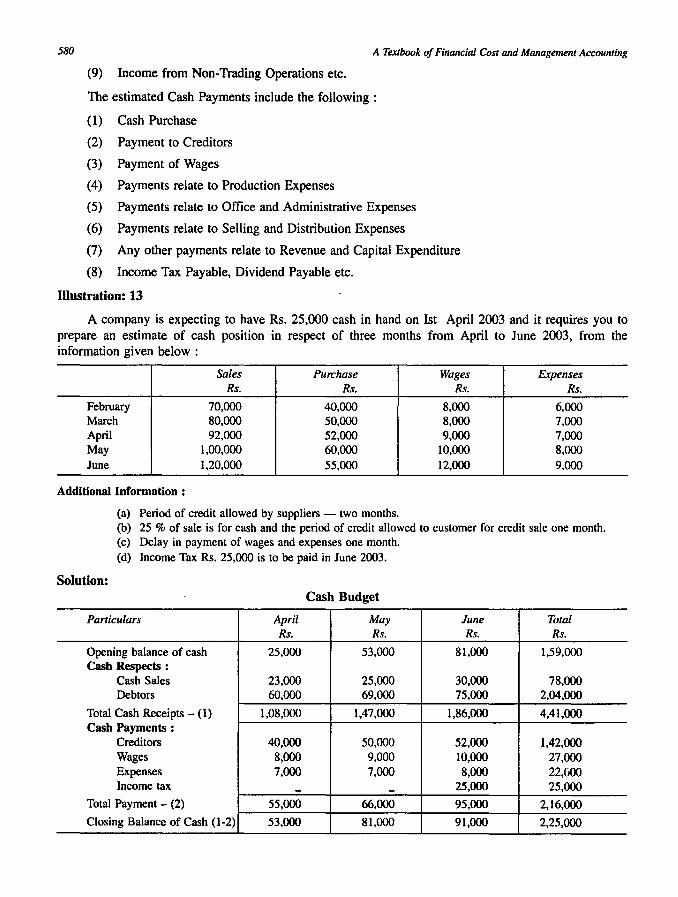
Illustration: 13
A company is expecting to have Rs. 25,000 cash in hand on 1st April 2003 and it requires you to prepare an estimate of cash position in respect of three months from April to June 2003, from the information given below :
Sales Purchase Wages Expenses Rs. Rs. Rs. Rs.
February 70,000 40,000 8,000 6,000 March 80,000 50,000 8,000 7,000 April 92,000 52,000 9,000 7,000 May 1,00,000 60,000 10,000 8,000 June 1,20,000 55,000 12,000 9,000
Additional Information :
(a) Period of credit allowed by suppliers - two months. (b) 25 % of sale is for cash and the period of credit allowed to customer for credit sale one month. (c) Delay in payment of wages and expenses one month. (d) Income Tax Rs. 25,000 is to be paid in June 2003.
Solution: Cash Budget
Particulars April May June Total Rs. Rs. Rs. Rs.
Opening balance of cash 25,000 53,000 81,000 1,59,000 Cash Respects :
Cash Sales 23,000 25,000 30,000 78,000 Debtors 60,000 69,000 75,000 2,04,000
Total Cash Receipts - (l) 1,08,000 1,47,000 1,86,000 4,41,000 Cash Payments :
Creditors 40,000 50,000 52,000 1,42,000 Wages 8,000 9,000 10,000 27,000 Expenses 7,000 7,000 8,000 22,GOO Income tax - - 25,000 25,000
Total Payment - (2) 55,000 66,000 95,000 2,16,000
Closing Balance of Cash (1-2) 53,000 81,000 91,000 2,25,000
Budgeting and Budgetary Control
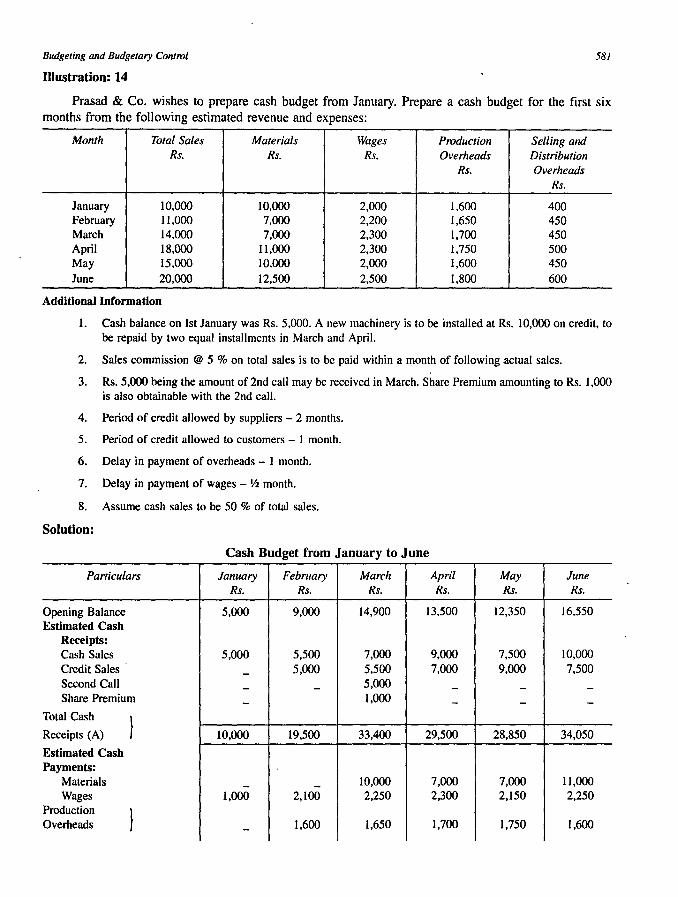
Illustration: 14
58/
Prasad & Co. wishes to prepare cash budget from January. Prepare a cash budget for the first six months from the following estimated revenue and expenses:
Month Total Sales Materials Wages Production Selling and Rs. Rs. Rs. Overheads Distribution
Rs. Overheads Rs.
January 10,000 10,000 2,000 1,600 400 February 11,000 7,000 2,200 1,650 450 March 14,000 7,000 2,300 1,700 450 April IS,OOO 11,000 2,300 1,750 500 May 15,000 10,000 2,000 1,600 450 June 20,000 12,500 2,500 I,Soo 600
Additional Information
1. Cash balance on 1st January was Rs. 5,000. A new machinery is to be installed at Rs. 10,000 on credit, to be repaid by two equal installments in March and April.
2. Sales commission @ 5 % on total sales is to be paid within a month of following actual sales.
3. Rs. 5,000 being the amount of 2nd call may be received in March. Share Premium amounting to Rs. 1,000 is also obtainable with the 2nd call.
4. Period of credit allowed by suppliers - 2 months.
5. Period of credit allowed to customers - 1 month.
6. Delay in payment of overheads - 1 month.
7. Delay in payment of wages -Ih month.
S. Assume cash sales to be 50 % of total sales.
Solution:
Cash Budget from January to June
Particulars January February March April May June Rs. Rs. Rs. Rs. Rs. Rs.
Opening Balance 5,000 9,000 14,900 13,500 12,350 16,550 Estimated Cash
Receipts: Cash Sales 5,000 5,500 7,000 9,000 7,500 10,000 Credit Sales - 5,000 5,500 7,000 9,000 7,500 Second Call - - 5,000 - - -Share Premium - 1,000 - - -
Total Cash } Receipts (A) 10,000 19,500 33,400 29,500 2S,S50 34,050
Estimated Cash Payments: ,
Materials - - 10,000 7,000 7.000 11,000 Wages 1,000 2,100 2,250 2,300 2,150 2,250
Production } Overheads - 1,600 1,650 1,700 1,750 1,600
582 A Textbook of Financial Cost and Management Accounting
Selling & Distribution Overheads - 400 450 450 500 450 Sales Commission - 500 550 700 900 750 Purchase of Machinery - - 5,000 5,000 - -Total Cash } Payment (B) 1,000 4,600 19,900 17,150 12,300 16,050
Closing Balance 9,000 14,900 13,500 12,350 16,550 18,000 (A - B)
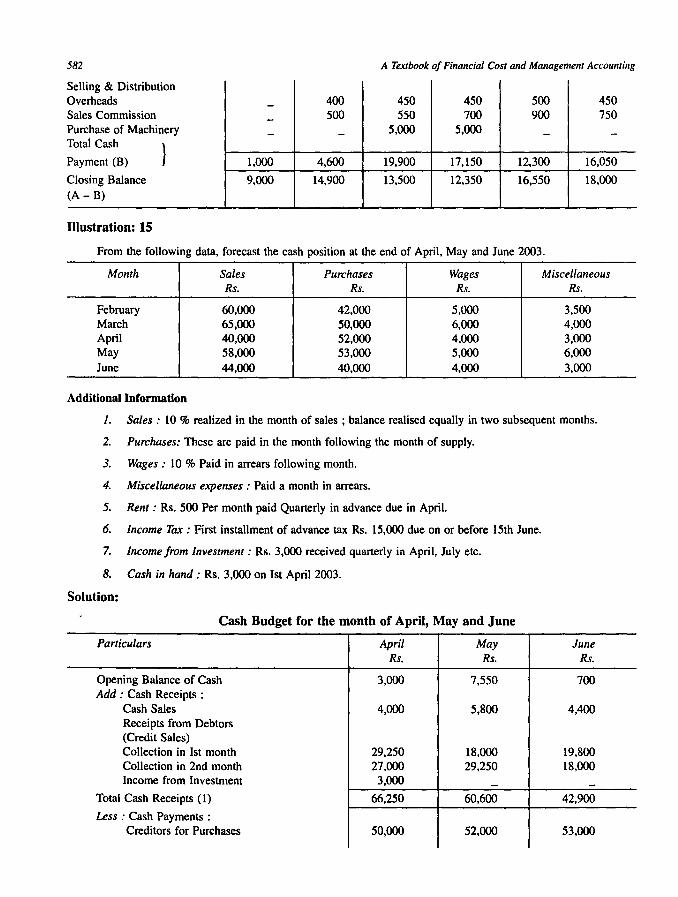
Illustration: 15
From the following data, forecast the cash position at the end of April, May and June 2003.
Month Sales Purchases Wages Miscellaneous Rs. Rs. Rs. Rs.
February 60,000 42,000 5,000 3,500 March 65,000 50,000 6,000 4,000 April 40,000 52,000 4,000 3,000 May 58,000 53,000 5,000 6,000 June 44,000 40,000 4,000 3,000
Additional Inrormation
1. Sales: 10 % realized in the month of sales; balance realised equally in two subsequent months.
2. Purchases: These are paid in the month following the month of supply.
3. Wages: 10 % Paid in arrears following month.
4. Miscellaneous expenses: Paid a month in arrears.
5. Rent: Rs. 500 Per month paid Quarterly in advance due in April.
6. Income Tax: First installment of advance tax Rs. 15,000 due on or before 15th June.
7. Income from Investment: Rs. 3,000 received quarterly in April, July etc.
8. Cash in hand: Rs. 3,000 on 1st April 2003.
Solution:
Cash Budget for the month of April, May and June
Paniculars April May June Rs. Rs. Rs.
Opening Balance of Cash 3,000 7,550 700 Add: Cash Receipts:
Cash Sales 4,000 5,800 4,400 Receipts from Debtors (Credit Sales) Collection in 1st month 29,250 18,000 19,800 Collection in 2nd month 27,000 29,250 18,000 Income from Investment 3,000 - -
Total Cash Receipts (1) 66,250 60,600 42,900
Less : Cash Payments : Creditors for Purchases 50,000 52,000 53,000
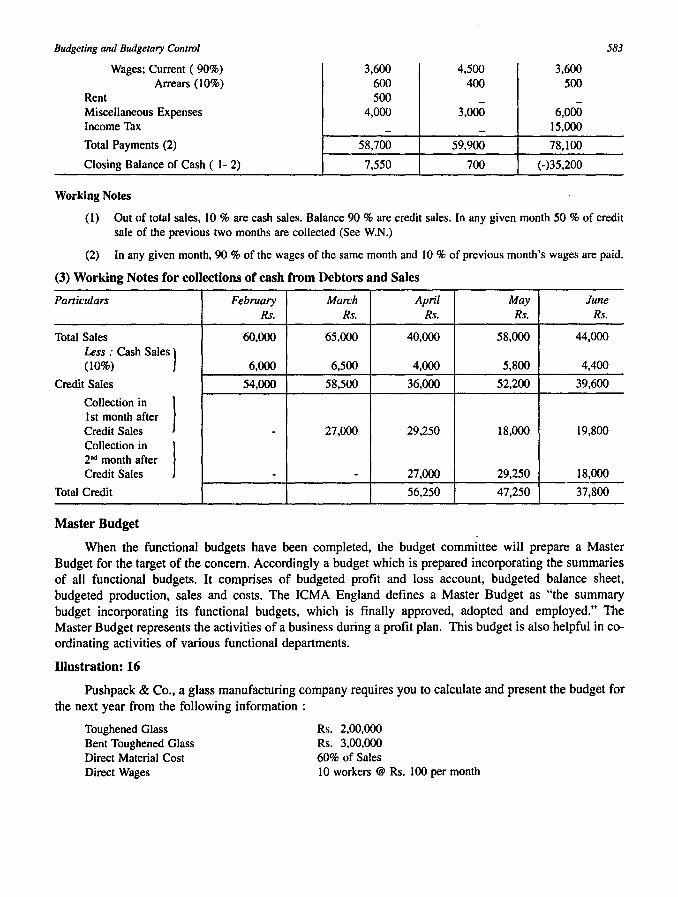
Budgeting and Budgetary Control 583
Wages; Current ( 90%) 3,600 4,500 3,600 Arrears (10%) 600 400 500
Rent 500 - -Miscellaneous Expenses 4,000 3,000 6,000 Income Tax - - 15,000
Total Payments (2) 58,700 59,900 78,100
Closing Balance of Cash ( 1- 2) 7,550 700 (-)35,200
Working Notes
(I) Out of total sales, 10 % are cash sales. Balance 90 % are credit sales. In any given month 50 % of credit sale of the previous two months are collected (See W.N.)
(2) In any given month, 90 % of the wages of the same month and 10 % of previous month's wages are paid.
(3) Working Notes for collections of cash from Debtors and Sales
Particulars February March April May June Rs. Rs. Rs. Rs. Rs.
Total Sales 60,000 65,000 40,000 58,000 44,000
Less : Cash Sales} (10%) 6,000 6,500 4,000 5,800 4,400
Credit Sales 54,000 58,500 36,000 52,200 39,600
Collection in
} 1st month after Credit Sales - 27,000 29,250 18,000 19,800 Collection in
} 2nd month after Credit Sales - - 27,000 29,250 18,000
Total Credit 56,250 47,250 37,800
Master Budget
When the functional budgets have been completed, the budget committee will prepare a Master Budget for the target of the concern. Accordingly a budget which is prepared incorporating the summaries of all functional budgets. It comprises of budgeted profit and loss account, budgeted balance sheet, budgeted production, sales and costs. The ICMA England defines a Master Budget as "the summary budget incorporating its functional budgets, which is finally approved, adopted and employed." The Master Budget represents the activities of a business during a profit plan. This budget is also helpful in coordinating activities of various functional departments.
Illustration: 16
Pushpack & Co., a glass manufacturing company requires you to calculate and present the budget for the next year from the following information :
Toughened Glass Bent Toughened Glass Direct Material Cost Direct Wages
Rs. 2,00,000 Rs. 3,00,000 60% of Sales 10 workers @ Rs. 100 per month
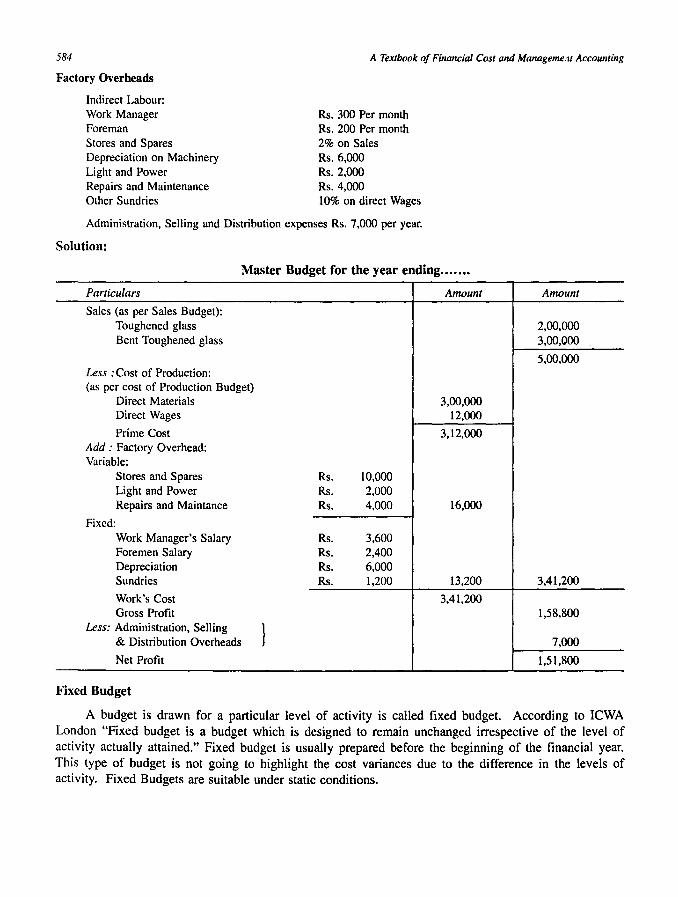
584 A Textbook of Financial Cost and Manageme.1t Accounting
Factory Overheads
Indirect Labour: Work Manager Foreman Stores and Spares Depreciation on Machinery Light and Power Repairs and Maintenance Other Sundries
Rs. 300 Per month Rs. 200 Per month 2% on Sales Rs.6,ooO Rs. 2,000 Rs.4,ooO 10% on direct Wages
Administration, Selling and Distribution expenses Rs. 7,000 per year.
Solution:
Master Budget for the year ending ...... .
Particulars Amount
Sales (as per Sales Budget): Toughened glass Bent Toughened glass
Less :Cost of Production: (as per cost of Production Budget)
Direct Materials 3,00,000 Direct Wages 12,000
Prime Cost 3,12,000 Add: Factory Overhead: Variable:
Stores and Spares Rs. 10,000 Light and Power Rs. 2,000 Repairs and Maintance Rs. 4,000 16,000
Fixed: Work Manager's Salary Rs. 3,600 Foremen Salary Rs. 2,400 Depreciation Rs. 6,000 Sundries Rs. 1,200 13,200
Work's Cost 3,41,200 Gross Profit
Less: Administration, Selling } & Distribution Overheads
Net Profit
Fixed Budget
Amount
2,00,000 3,00,000
5,00,000
3,41,200
1,58,800
7,000
1,51,800
A budget is drawn for a particular level of activity is called fixed budget. According to ICWA London "Fixed budget is a budget which is designed to remain unchanged irrespective of the level of activity actually attained." Fixed budget is usually prepared before the beginning of the financial year. This type of budget is not going to highlight the cost variances due to the difference in the levels of activity. Fixed Budgets are suitable under static conditions.
Budgeting and Budgetary Control 585
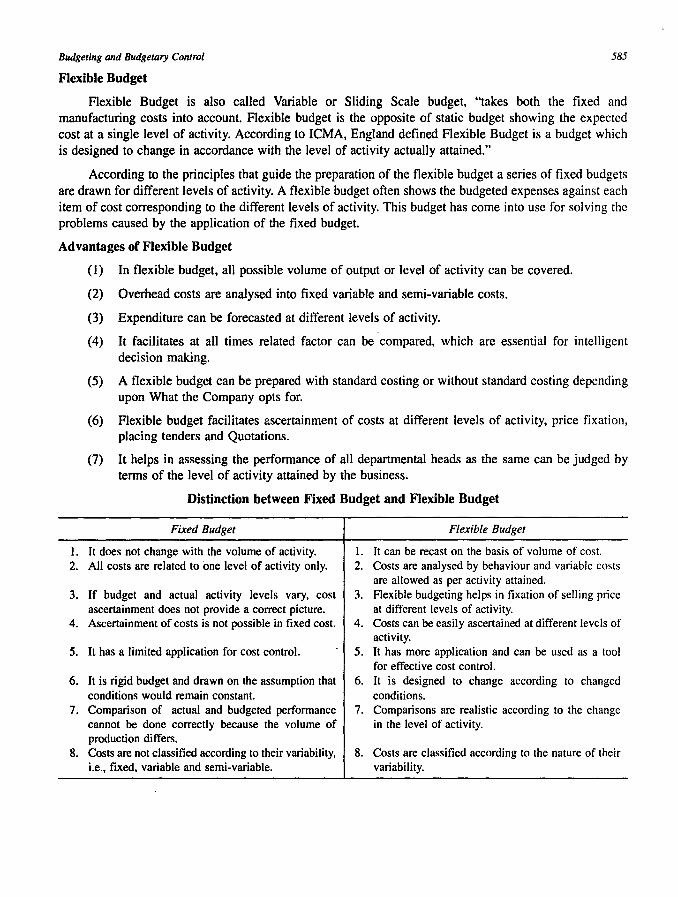
Flexible Budget
Flexible Budget is also called Variable or Sliding Scale budget, "takes both the fixed and manufacturing costs into account. Flexible budget is the opposite of static budget showing the expected cost at a single level of activity. According to leMA, England defined Flexible Budget is a budget which is designed to change in accordance with the level of activity actually attained."
According to the principles that guide the preparation of the flexible budget a series of fixed budgets are drawn for different levels of activity. A flexible budget often shows the budgeted expenses against each item of cost corresponding to the different levels of activity. This budget has come into use for solving the problems caused by the application of the fixed budget.
Advantages of Flexible Budget
1. 2.
3.
4.
5.
6.
7.
8.
(1) In flexible budget, all possible volume of output or level of activity can be covered.
(2) Overhead costs are analysed into fixed variable and semi-variable costs.
(3) Expenditure can be forecasted at different levels of activity.
(4) It facilitates at all times related factor can be compared. which are essential for intelligent decision making.
(5) A flexible budget can be prepared with standard costing or without standard costing depending upon What the Company opts for.
(6) Flexible budget facilitates ascertainment of costs at different levels of activity, price fixation, placing tenders and Quotations.
(7) It helps in assessing the performance of all departmental heads as the same can be judged by terms of the level of activity attained by the business.
Distinction between Fixed Budget and Flexible Budget
Fixed Budget Flexible Budget
It does not change with the volume of activity. 1. It can be recast on the basis of volume of cost. All costs are related to one level of activity only. 2. Costs are analysed by behaviour and variable costs
are allowed as per activity attained. If budget and actual activity levels vary. cost 3. Flexible budgeting helps in fixation of selling price ascertainment does not provide a correct picture. at different levels of activity. Ascertainment of costs is not possible in fixed cost. 4. Costs can be easily ascertained at different levels of
activity. It has a limited application for cost control. 5. It has more application and can be used as a tool
for effective cost control. It is rigid budget and drawn on the assumption that 6. It is designed to change according to changed conditions would remain constant. conditions. Comparison of actual and budgeted performance 7. Comparisons are realistic according to the change cannot be done correctly because the volume of in the level of activity. production differs. Costs are not classified according to their variability. 8. Costs are classified according to the nature of their i.e .• fixed. variable and semi-variable. variability.
586 A Textbook of Financial Cost and Management Accounting
Method of Preparing Flexible Budget
The following methods are used in preparing a flexible budget:
(1) Multi-Activity Method.
(2) Ratio Method.
(3) Charting Method.
(1) Multi-Activity Method: This method involves preparing a budget in response to different level of activity. The different level of activity or capacity levels are shown in Horizontal Columns, and the budgeted figures against such levels are placed in the Vertical Columns. The expenses involved in production as per budget are grouped as fixed, variable and semi variable.
(2) Ratio Method: According to this method, the budget is prepared first showing the expected normal level of activity and the estimated variable cost per unit at the side expected level of activity in addition to the fixed cost as estimated. Therefore, the expenses as per budget, allowed for a particular level of activity attained, will be calculated on the basis of the following formula : Budgeted fixed cost + (Variable cost per unit of activity x Actual unit of activity)
(3) Charting Method: Under this method total expenses required for any level of activity, are estimated having classified into three categories, viz., Variable. Semi Variable and Fixed. These figures are plotted on a graph. The expenses are plotted on the Y-axis and the level of activity are plotted on X-axis. The graph will thus, help in ascertaining the quantum of budgeted expenses corresponding to the level of activity attained with the help of this chart.
Zero Base Budgeting (ZBB)
Zero Base Budgeting is a new technique of budgeting. It is designed to meet the needs of the management in order to ensure the operational efficiency and effective utilization of the allocated resources of a concern. This technique was originally developed by Peter A. Phyhrr, Manager of Taxas Instrument during 1969. This concept is widely used in USA for controlling their state expenditure when Mr. Jimmy Carter was the president of the USA. At present the technique has for its global recognition for many countries have implemented in real terms.
According to Peter A. Phyhrr ZBB is defined as an "Operative Planning and Budgeting Process" which requires each Manager to justify his entire budget in detail from Scratch (hence zero base) and shifts the burden of proof to each Manager to justify why we should spend any money at all."
In zero-base budgeting, a manager at all levels have to justify the importance of activity and to allocate the resources on priority basis.
Important Aspects of ZBB
Zero Base Budgeting involves the following important aspects:
(1) It emphasises on all requisites of budgets.
(2) Evaluation on the basis of decision packages and systematic analysis, i.e., in view of cost benefit analysis.
(3) Planning the activities, promotes operationai efficiency and monitors the performance to achieve the objectives.
Budgeting and Budgetary Control
Steps Involved in ZBB
The following are the steps involved in Zero Base Budgeting:
587
(1) No Previous year performance of inefficiencies are to be taken as adjustments in subsequent year.
(2) Identification of activities in decision packages.
(3) Determination of budgeting objectives to be attained.
(4) Extent to which Zero Base Budgeting is to be applied.
(5) Evaluation of current and proposed expenditure and placing them in order of priority.
(6) Assignment of task and allotment of sources on the basis of cost benefit comparison.
(7) Review process of each activity examined afresh.
(8) Weightage should be given for alternative course of actions.
Advantages of ZBB
(1) Utilization of resources at a maximum level.
(2) It serves as a tool of management in formulating production planning.
(3) It facilitates effective cost control.
(4) It helps to identify the uneconomical activities.
(5) It ensures the proper allocation of scarce resources on priority basis.
(6) It helps to measure the operational inefficiencies and to take the corrective actions.
(7) It ensures the principles of Management by Objectives.
(8) It facilitates Co-operation and Co-ordination among all levels of management.
(9) It ensures each activity is thoroughly examined on the basis of cost benefit analysis.
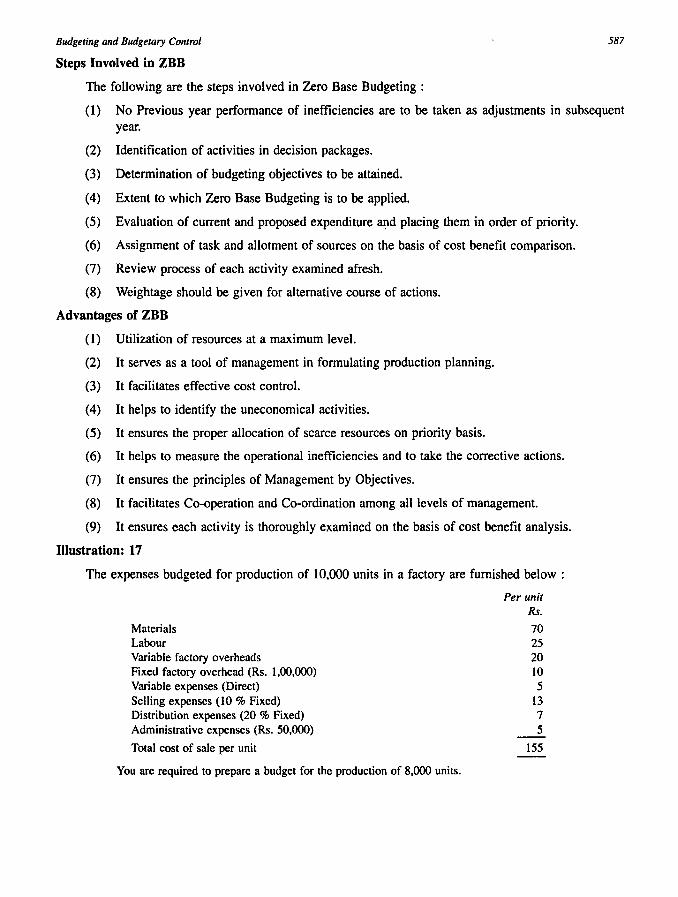
Illustration: 17
The expenses budgeted for production of 10,000 units in a factory are furnished below :
Materials Labour Variable factory overheads Fixed factory overhead (Rs. 1,00,000) Variable expenses (Direct) Selling expenses (10 % Fixed) Distribution expenses (20 % Fixed) Administrative expenses (Rs. 50,000)
Total cost of sale per unit
You are required to prepare a budget for the production of 8,000 units.
Per unit Rs.
70 25 20 10 5
13 7 5
155
588
Solution:
A Textbook of Financial Cost and Management Accounting
Flexible Budget
Particulars Output 10,000 units Output 8,000 units
Per unit Amount Per unit Amount
Variable Expenses: Material cost 70 7,00,000 70 5,60,000 Labour cost 25 2,50,000 25 2,00,000 Direct expenses (variable) 5 50,000 5 40,000
Prime cost 100 10,00,000 100 8,00,000 Add: Factory overheads : Variable overheads 20 2,00,000 20 1,60,000 Fixed overheads 10 1,00,000 12.50 1,00,000
Works cost 130 13,00,000 132.50 10,60,000 Add: Administrative expenses Fixed (Assumed) 5 50,000 6.25 50,000
Cost of production 135 13,50,000 138.75 11,10,000 Add: Selling Expenses Fixed - 10 % of Rs. 13 1.30 13,000 1.63 13,000 Variable - 90 % of Rs. 13 11.70 1,17,000 11.70 93,600 Add: Distribution Expenses: Fixed - 20 % of Rs.7 1.40 14,000 1.75 14,000 Variable - 80 % of Rs.7 5.60 56,000 5.60 44,800
Total Cost of Sales 155 15,50,000 159.43 12,75,400
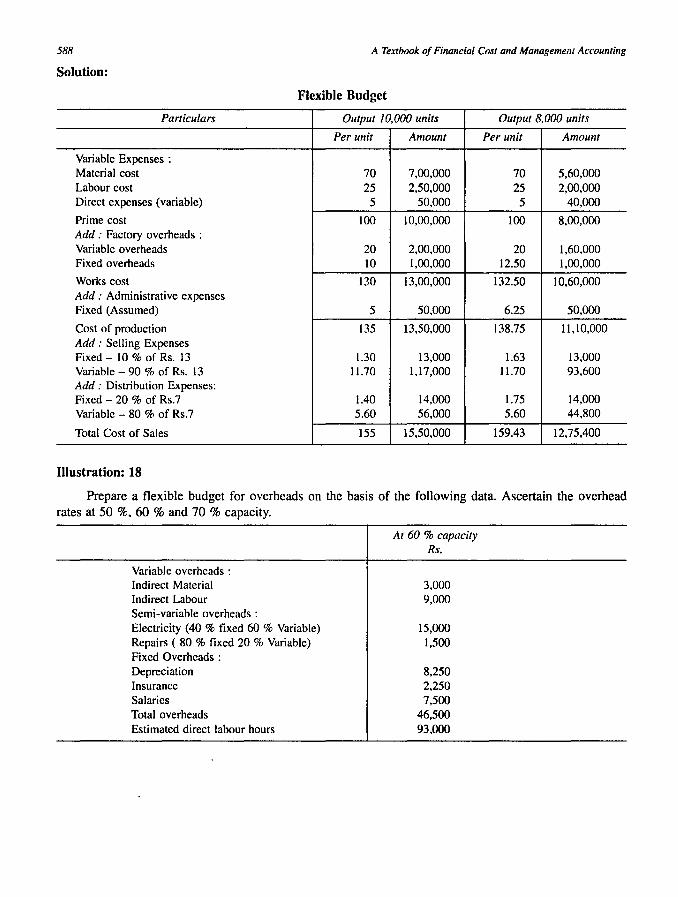
IIIustration: 18
Prepare a flexible budget for overheads on the basis of the following data. Ascertain the overhead rates at 50 %. 60 % and 70 % capacity.
Variable overheads : Indirect Material Indirect Labour Semi-variable overheads: Electricity (40 % fixed 60 % Variable) Repairs ( 80 % fixed 20 % Variable) Fixed Overheads : Depreciation Insurance Salaries Total overheads Estimated direct labour hours
At 60 % capacity Rs.
3,000 9,000
15,000 1,500
8,250 2,250 7,500
46,500 93,000
Budgeting and Budgetary Control 589
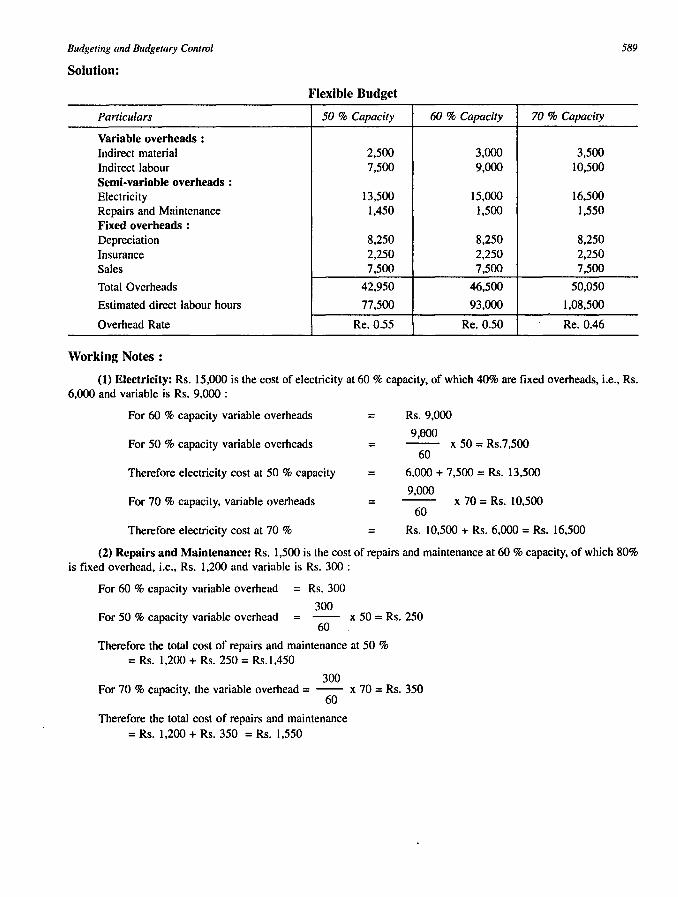
Solution:
Flexible Budget
Particulars 50 % Capacity 60 % Capacity 70 % Capacity
Variable overheads: Indirect material 2,500 3,000 3,500 Indirect labour 7,500 9,000 10,500 Semi-variable overheads: Electricity 13,500 15,000 16.500 Repairs and Maintenance 1,450 1,500 1.550 Fixed overheads : Depreciation 8.250 8,250 8,250 Insurance 2,250 2,250 2,250 Sales 7,500 7,500 7,500
Total Overheads 42.950 46,500 50,050
Estimated direct labour hours 77,500 93,000 1,08,500
Overhead Rate Re.0.55 Re.0.50 Re.0.46
Working Notes :
(1) Electricity: Rs. 15,000 is the cost of electricity at 60 % capacity, of which 40% are fixed overheads, i.e., Rs. 6,000 and variable is Rs. 9,000 :
For 60 % capacity variable overheads =
For 50 % capacity variable overheads =
Therefore electricity cost at 50 % capacity =
For 70 % capacity, variable overheads =
Therefore electricity cost at 70 % =
Rs.9,000
9,000 -- x 50 = Rs.7,500
60
6,000 + 7,500 = Rs. 13,500
9,000 x 70 = Rs. 10,500
60
Rs. 10,500 + Rs. 6,000 = Rs. 16,500
(2) Repairs and Maintenance: Rs. 1,500 is the cost of repairs and maintenance at 60 % capacity, of which 80% is fixed overhead, i.e., Rs. 1,200 and variable is Rs. 300 :
For 60 % capacity variable overhead
For 50 % capacity variable overhead
= Rs.300
300 -- x 50 = Rs. 250
60
Therefore the total cost of repairs and maintenance at 50 % = Rs. 1,200 + Rs. 250 = Rs.1,450
300 For 70 % capacity, the variable overhead = -- x 70 = Rs. 350
60
Therefore the total cost of repairs and maintenance = Rs. 1,200 + Rs. 350 = Rs. 1,550
590
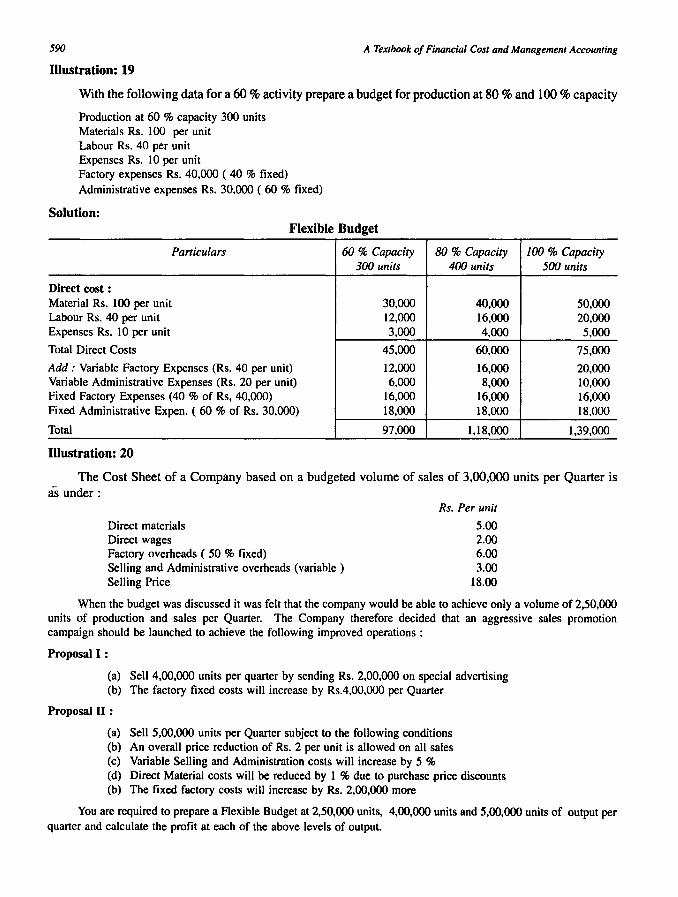
Illustration: 19
A Textbook of Financial Cost and Management Accounting
With the following data for a 60 % activity prepare a budget for production at 80 % and 100 % capacity
Production at 60 % capacity 300 units Materials Rs. lOOper unit Labour Rs. 40 per unit Expenses Rs. IO per unit Factory expenses Rs. 40,000 ( 40 % fixed) Administrative expenses Rs. 30,000 ( 60 % fixed)
Solution: Flexible Budget
Particulars 60 % Capacity 300 units
Direct cost : Material Rs. 100 per unit 30,000 Labour Rs. 40 per unit 12,000 Expenses Rs. 10 per unit 3,000
Total Direct Costs 45,000
Add: Variable Factory Expenses (Rs. 40 per unit) 12,000 Variable Administrative Expenses (Rs. 20 per unit) 6,000 Fixed Factory Expenses (40 % of Rs, 40,000) 16,000 Fixed Administrative Expen. ( 60 % of Rs. 30,000) 18,000
Total 97,000
Illustration: 20
80 % Capacity 100 % Capacity 400 units 500 units
40,000 50,000 16,000 20,000 4,000 5,000
60,000 75,000
16,000 20,000 8,000 10,000
16,000 16,000 18,000 18,000
1,18,000 1,39,000
The Cost Sheet of a Company based on a budgeted volume of sales of 3,00,000 units per Quarter is as under:
Direct materials Direct wages Factory overheads ( 50 % fixed) Selling and Administrative overheads (variable) Selling Price
Rs. Per unit
5.00 2.00 6.00 3.00
18.00
When the budget was discussed it was felt that the company would be able to achieve only a volume of 2,50,000 units of production and sales per Quarter. The Company therefore decided that an aggressive sales promotion campaign should be launched to achieve the following improved operations:
Proposal I:
(a) Sell 4,00,000 units per quarter by sending Rs. 2,00,000 on special advertising (b) The factory fixed costs will increase by RsA,oo,OOO per Quarter
Proposal II :
(a) Sell 5,00,000 units per Quarter subject to the following conditions (b) An overall price reduction of Rs. 2 per unit is allowed on all sales (c) Variable Selling and Administration costs will increase by 5 % (d) Direct Material costs will be reduced by I % due to purchase price discounts (b) The fixed factory costs will increase by Rs. 2,00,000 more
You are required to prepare a Flexible Budget at 2,50,000 units, 4,00,000 units and 5,00,000 units of output per quarter and calculate the profit at each of the above levels of output.
Budgeting and Budgetary Control
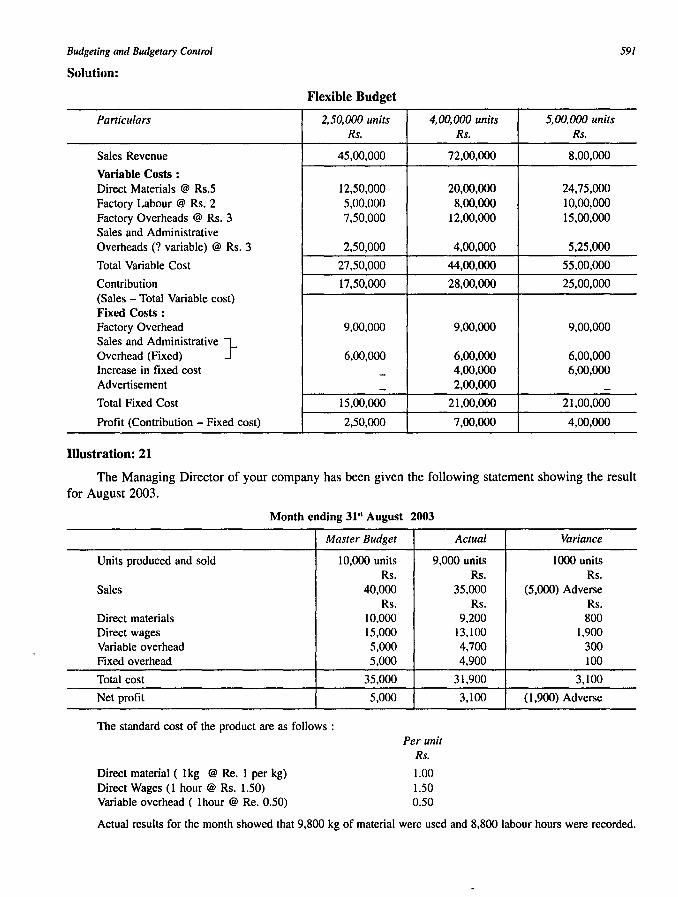
Solution:
Paniculars
Sales Revenue
Variable Costs : Direct Materials @ Rs.5 Factory Labour @ Rs. 2 Factory Overheads @ Rs. 3 Sales and Administrative Overheads (? variable) @ Rs. 3
Total Variable Cost
Contribution (Sales - Total Variable cost) Fixed Costs : Factory Overhead Sales and Administrative } Overhead (Fixed) Increase in fixed cost Advertisement
Total Fixed Cost
Profit (Contribution - Fixed cost)
Illustration: 21
Flexible Budget
2.50.000 units Rs.
45,00,000
12,50.000 5,00,000 7,50,000
2,50,000
27,50,000
17,50,000
9,00,000
6,00,000
--
15,00,000
2,50,000
591
4.00.000 units 5.00.000 units Rs. Rs.
72,00,000 8,00,000
20,00,000 24,75,000 8,00,000 10,00,000
12,00,000 15,00,000
4,00,000 5,25,000
44,00,000 55,00,000
28,00,000 25,00,000
9,00,000 9,00,000
6,00,000 6,00,000 4,00,000 6,00,000 2,00,000 -
21,00,000 21,00,000
7,00,000 4,00,000
The Managing Director of your company has been given the following statement showing the result for August 2003.
Month ending 31" August 2003
Master Budget
Units produced and sold 10,000 units Rs.
Sales 40,000 Rs.
Direct materials 10,000 Direct wages 15,000 Variable overhead 5,000 Fixed overhead 5,000
Total cost 35,000
Net profit 5,000
The standard cost of the product are as follows :
Direct material (lkg @ Re. 1 per kg) Direct Wages (1 hour @ Rs. 1.50) Variable overhead ( 1 hour @ Re. 0.50)
Actual
9,000 units
Per unit Rs.
1.00 1.50 0.50
Rs. 35,000
Rs. 9,200
13,100 4,700 4,900
31,900
3,100
Variance
1000 units Rs.
(5,000) Adverse Rs. 800
1,900 300 100
3,100
(1,900) Adverse
Actual results for the month showed that 9,800 kg of material were used and 8,800 labour hours were recorded.
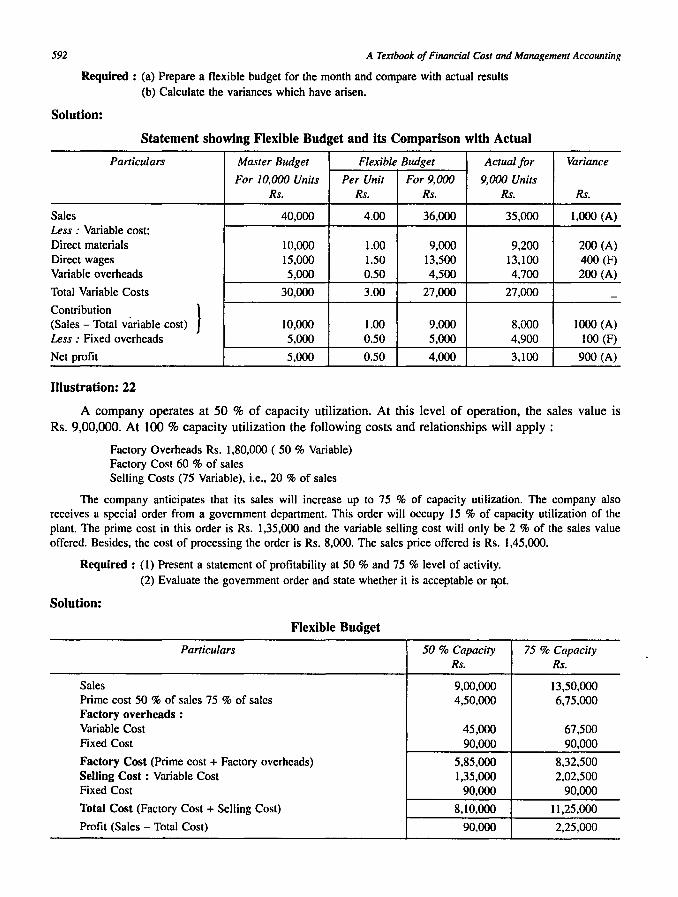
592 A Textbook of Financial Cost and Management Accounting
Required : (a) Prepare a flexible budget for the month and compare with actual results (b) Calculate the variances which have arisen.
Solution:
Statement showing Flexible Budget and its Comparison with Actual
Particulars Master Budget Flexible Budget Actual for Variance
For 10,000 Units Per Unit For 9,000 9,000 Units Rs. Rs. Rs. Rs. Rs.
Sales 40,000 4.00 36,000 35,000 1,000 (A) Less : Variable cost: Direct materials 10,000 1.00 9,000 9,200 200 (A) Direct wages 15,000 1.50 13,500 13,100 400 (F) Variable overheads 5,000 0.50 4,500 4,700 200 (A)
Total Variable Costs 30,000 3.00 27,000 27,000 -Contribution } (Sales - Total variable cost) 10,000 1.00 9.000 8,000 1000 (A) Less : Fixed overheads 5,000 0.50 5,000 4,900 100 (F)
Net profit 5,000 0.50 4,000 3,100 900 (A)
Illustration: 22
A company operates at 50 % of capacity utilization. At this level of operation, the sales value is Rs. 9,00,000. At 100 % capacity utilization the following costs and relationships will apply:
Factory Overheads Rs. 1,80,000 ( 50 % Variable) Factory Cost 60 % of sales Selling Costs (75 Variable), i.e., 20 % of sales
The company anticipates that its sales will increase up to 75 % of capacity utilization. The company also receives a special order from a government department. This order will occupy 15 % of capacity utilization of the plant. The prime cost in this order is Rs. 1,35,000 and the variable selling cost will only be 2 % of the sales value offered. Besides, the cost of processing the order is Rs. 8,000. The sales price offered is Rs. 1,45,000.
Required: (1) Present a statement of profitability at 50 % and 75 % level of activity. (2) Evaluate the government order and state whether it is acceptable or I¥>t.
Solution:
Flexible Buoget
Particulars 50 % Capacity Rs.
Sales 9,00,000 Prime cost 50 % of sales 75 % of sales 4,50,000 Factory overheads : Variable Cost 45,000 Fixed Cost 90,000
Factory Cost (Prime cost + Factory overheads) 5,85,000 Selling Cost : Variable Cost 1,35,000 Fixed Cost 90,000
Total Cost (Factory Cost + Selling Cost) 8,10,000
Profit (Sales - Total Cost) 90.000
75 % Capacity Rs.
13,50,000 6,75,000
67,500 90,000
8,32,500 2,02,500
90,000
11,25,000
2,25,000
Budgeting and Budgetary Control
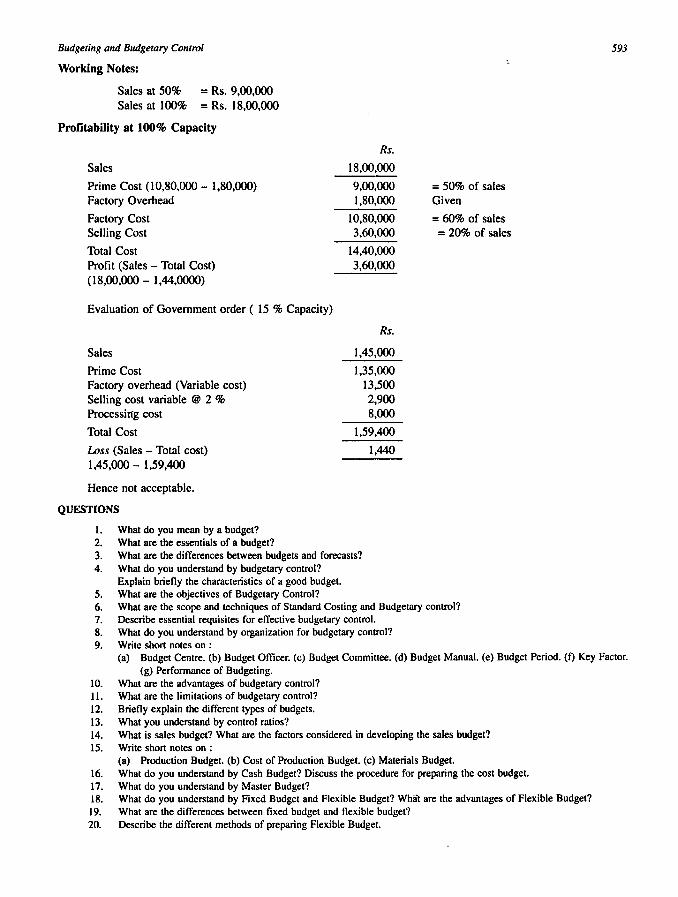
Working Notes:
Sales at 50% = Rs. 9,00,000 Sales at 100% = Rs. 18,00,000
Profitability at 100% Capacity
Sales
Prime Cost (10,80,000 - 1,80,000) Factory Overhead
Factory Cost Selling Cost
Total Cost Profit (Sales - Total Cost) (18,00,000 - 1,44,0000)
Evaluation of Government order ( 15 % Capacity)
Sales
Prime Cost Factory overhead (Variable cost) Selling cost variable @ 2 % Processing cost
Total Cost
Loss (Sales - Total cost) 1,45,000 - 1,59,400
Hence not acceptable.
QUESTIONS
1. What do you mean by a budget? 2. What are the essentials of a budget?
Rs.
18,00,000
9,00,000 1,80,000
10,80,000 3.60,000
14,40,000 3,60,000
Rs.
1,45,000
1,35,000 13,500 2,900 8,000
1,59,400
1,440
3. What are the differences between budgets and forecasts? 4. What do you understand by budgetary control?
Explain briefly the characteristics of a good budget. 5. What are the objectives of Budgetary Control?
= 50% of sales Given
= 60% of sales = 20% of sales
6. What are the scope and techniques of Standard Costing and Budgetary control? 7. Describe essential requisites for effective budgetary control. 8. What do you understand by organization for budgetary control? 9. Write short notes on :
593
(a) Budget Centre. (b) Budget Officer. (c) Budget Committee. (d) Budget Manual. (e) Budget Period. (f) Key Factor. (g) Performance of Budgeting.
to. What are the advantages of budgetary control? 11. What are the limitations of budgetary control? 12. Briefly explain the different types of budgets. 13. What you understand by control ratios? 14. What is sales budget? What are the factors considered in developing the sales budget? 15. Write short notes on :
(a) Production Budget. (b) Cost of Production Budget. (c) Materials Budget. 16. What do you understand by Cash Budget? Discuss the procedure for preparing the cost budget. 17. What do you understand by Master Budget? 18. What do you understand by Fixed Budget and Flexible Budget? Whiit are the advantages of Flexible Budget? 19. What are the differences between fixed budget and flexible budget? 20. Describe the different methods of preparing Flexible Budget.
594
EXERCISES
A Textbook of Financial Cost and Management Accounting
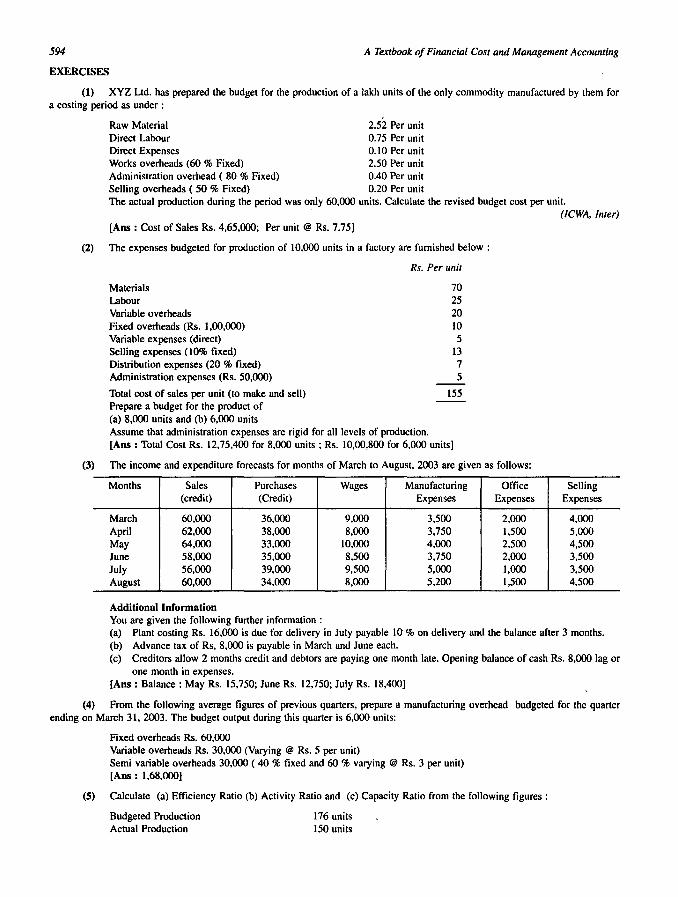
(1) XYZ Ltd. has prepared the budget for tbe production of a lakh units of the only commodity manufactured by them for a costing period as under:
Raw Material Direct Labour
I
2.52 Per unit 0.75 Per unit
Direct Expenses 0.10 Per unit Works overheads (60 % Fixed) 2.50 Per unit Administration overhead ( 80 % Fixed) 0.40 Per unit Selling overheads ( 50 % Fixed) 0.20 Per unit The actual production during the period was only 60,000 units. Calculate the revised budget cost per unit.
. (ICWA, Inter) [Ans : Cost of Sales Rs. 4,65,000; Per unit @ Rs. 7.75)
(2) The expenses budgeted for production of 10.000 units in a factory are furnished below:
Materials Labour Variable overheads Fixed overheads (Rs. 1,00,(00) Variable expenses (direct) Selling expenses (l0% fixed) Distribution expenses (20 % fixed) Administration expenses (Rs. 50,(00)
Rs. Per unit
70 25 20 10 5
13 7 5
Total cost of sales per unit (to make and sell) 155 Prepare a budget for the product of (a) 8,000 units and (b) 6,000 units Assume that administration expenses are rigid for all levels of production. [Ans : Total Cost Rs. 12,75,400 for 8,000 units; Rs. 10,00,800 for 6,000 units]
(3) The income and expenditure forecasts for months of March to August, 2003 are given as follows:
Months Sales Purchases Wages Manufacturing Office (credit) (Credit) Expenses Expenses
March 60,000 36,000 9,000 3,500 2,000 April 62,000 38,000 8,000 3,750 1,500 May 64,000 33,000 10.000 4.000 2,500 June 58,000 35,000 8,500 3,750 2,000 July 56,000 39,000 9,500 5,000 1,000 August 60,000 34,000 8,000 5,200 1,500
Additional Information You are given the following further information:
Selling Expenses
4,000 5,000 4,500 3,500 3,500 4,500
(a) Plant costing Rs. 16,000 is due for delivery in July payable 10 % on delivery and the balance after 3 months. (b) Advance tax of Rs, 8,000 is payable in March and June each. (c) Creditors allow 2 months credit and debtors are paying one month late. Opening balance of cash Rs. 8,000 lag or
one month in expenses. [Ans : Balance: May Rs. 15,750; June Rs. 12,750; July Rs. 18,400]
(4) From the following average figures of previous quarters, prepare a manufacturing overhead budgeted for the quarter ending on March 31, 2003. The budget output during this quarter is 6,000 units:
Fixed overheads Rs. 60,000 Variable overheads Rs. 30,000 (Varying @ Rs. 5 per unit) Semi variable overheads 30,000 ( 40 % fixed and 60 % varying @ Rs. 3 per unit) [Ans : 1,68,000]
(5) Calculate (a) Efficiency Ratio (b) Activity Ratio and (c) Capacity Ratio from the following figures:
Budgeted Production Actual Production
176 units 150 units
Budgeting and Budgetary Control 595
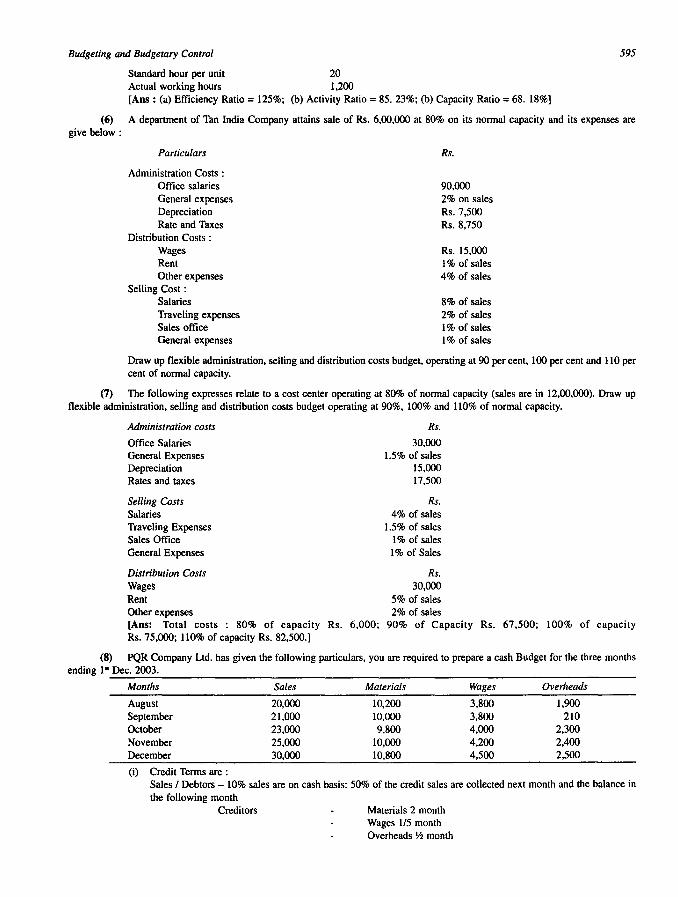
Standard hour per unit 20 Actual working hours 1,200 [Ans : (a) Efficiency Ratio = 125%; (b) Activity Ratio = 85. 23%; (b) Capacity Ratio = 68. 18%]
(6) A department of Tan India Company attains sale of Rs. 6,00,000 at 80% on its nonnal capacity and its expenses are give below:
Particulars Rs.
Administration Costs : Office salaries 90,000 General expenses 2% on sales Depreciation Rs.7,5oo Rate and Taxes Rs.8,750
Distribution Costs: Wages Rs. 15,000 Rent 1% of sales Other expenses 4% of sales
Selling Cost: Salaries 8% of sales Traveling expenses 2% of sales Sales office 1% of sales General expenses 1% of sales
Draw up flexible administration, selling and distribution costs budget, operating at 90 per cent, 100 per cent and 110 per cent of nonnal capacity.
(7) The following expresses relate to a cost center operating at 80% of nonnal capacity (sales are in 12,00,000). Draw up flexible administration, selling and distribution costs budget operating at 90%, 100% and 1l0% of normal capacity.
Administration costs
Office Salaries General Expenses Depreciation Rates and taxes
Selling Costs Salaries Traveling Expenses Sales Office General Expenses
Distribution Costs Wages Rent
Rs.
30,000 1.5% of sales
15,000 17,500
Rs. 4% of sales
1.5% of sales 1% of sales 1% of Sales
Rs. 30,000
5% of sales Other expenses 2% of sales [Ans: Total costs : 80% of capacity Rs. 6,000; 90% of Capacity Rs. 67,500; 100% of capacity Rs. 75,000; 110% of capacity Rs. 82,500.]
(8) PQR Company Ltd. has given the following particulars, you are required to prepare a cash Budget for the three months ending I" Dec. 2003.
..
Months Sales Materials Wages Overheads
August 20,000 10,200 3,800 1,900 September 21,000 10,000 3,800 210 October 23,000 9,800 4,000 2,300 November 25,000 10,000 4,200 2,400 December 30,000 10,800 4,500 2,500
(i) Credit Tenns are : Sales I Debtors - 10% sales are on cash basis: 50% of the credit sales are coIlected next month and the balance in the following month
Creditors Materials 2 month Wages lI5 month Overheads \12 month
596 A .Textbook of Financial Cost and Management Accounting
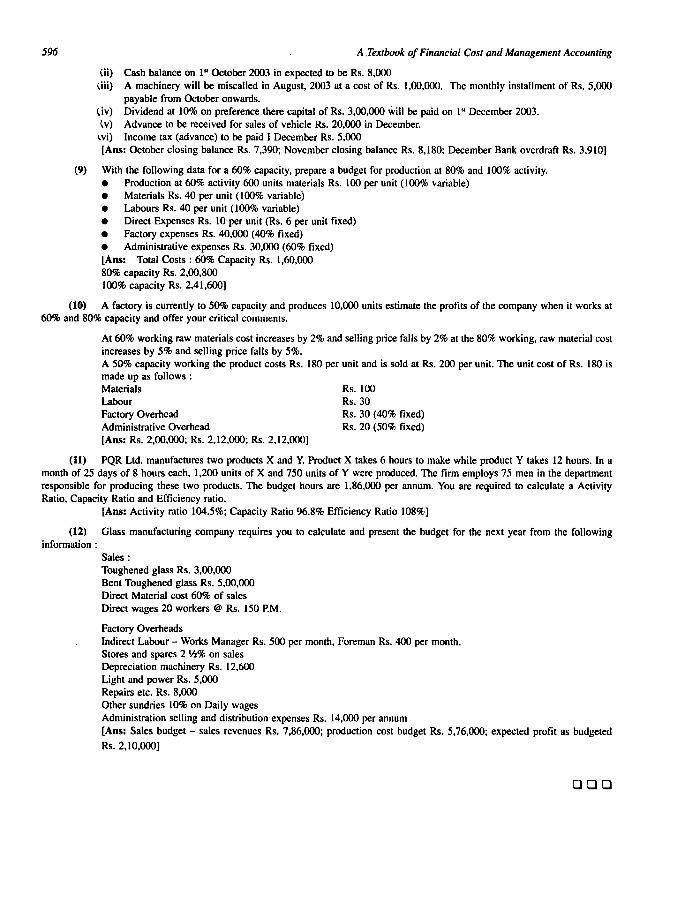
(ii) Cash balance on I" October 2003 in expected to be Rs. 8,000 (iii) A machinery will be miscalled in August, 2003 at a cost of Rs. 1,00,000. The monthly installment of Rs. 5,000
payable from October onwards. (iv) Dividend at 10% on preference there capital of Rs. 3,00,000 will be paid on I" December 2003. {v) Advance to be received for sales of vehicle Rs. 20,000 in December. wi) Income tax (advance) to be paid I December Rs. 5,000 [Ans: October closing balance Rs. 7,390; November closing balance Rs. 8,180; December Bank overdraft Rs. 3.910]
(9) With the following data for a 60% capacity, prepare a budget for production at 80% and 100% activity. • Production at 60% activity 600 units materials Rs. 100 per unit (100% variable) • Materials Rs. 40 per unit (100% variable) • Labours Rs. 40 per unit (100% variable) • Direct Expenses Rs. 10 per unit (Rs. 6 per unit fixed) • Factory expenses Rs. 40,000 (40% fixed) • Administrative expenses Rs. 30,000 (60% fixed) [Ans: Total Costs : 60% Capacity Rs. 1,60,000 80% capacity Rs. 2,00,800 100% capacity Rs. 2,41,600]
(10) A factory is currently to 50% capacity and produces 10,000 units estimate the profits of the company when it works at 60% and 80% capacity and offer your critical comments.
At 60% working raw materials cost increases by 2% and selling price falls by 2% at the 80% working, raw material cost increases by 5% and selling price falls by 5%. A 50% capacity working the product costs Rs. 180 per unit and is sold at Rs. 200 per unit. The unit cost of Rs. 180 is made up as follows : Materials Labour Factory Overhead Administrative Overhead [Ans: Rs. 2,00,000; Rs. 2,12,000; Rs. 2,12,000]
Rs. 100 Rs.30 Rs. 30 (40% fixed) Rs. 20 (50% fixed)
(11) PQR Ltd. manufactures two products X and Y. Product X takes 6 hours to make while product Y takes 12 hours. In a month of 25 days of 8 hours each, 1,200 units of X and 750 units of Y were produced. The firm employs 75 men in the department responsible for producing these two products. The budget hours are 1,86.000 per annum. You are required to calculate a Activity Ratio, Capacity Ratio and Efficiency ratio.
[Ans: Activity ratio 104.5%; Capacity Ratio 96.8% Efficiency Ratio 108%]
(12) Glass manufacturing company requires you to calculate and present the budget for the next year from the following information :
Sales: Toughened glass Rs. 3,00,000 Bent Toughened glass Rs. 5,00,000 Direct Material cost 60% of sales Direct wages 20 workers @ Rs. 150 P.M.
Factory Overheads Indirect Labour - Works Manager Rs. 500 per month, Foreman Rs. 400 per month. Stores and spares 2 Ih% on sales Depreciation machinery Rs. 12,600 Light and power Rs. 5,000 Repairs etc. Rs. 8,000 Other sundries 10% on Daily wages Administration selling and distribution expenses Rs. 14,000 per annum [Ans: Sales budget - sales revenues Rs. 7,86,000; production cost budget Rs. 5,76,000; expected profit as budgeted
Rs. 2,10,000]
DOD