Embed Size (px)
Citation preview
2011 MTEF Budget 08 March 2011 1
Executive Summary
Overview The South African economy is recovering from the 2009 global recession which resulted in the increase in unemployment of about 1 million. In the North West the disestablishment of municipal boundaries increased the fiscal challenges. The changes resulted in a sharp decline in the Provincial equitable share allocation the 7.1 percent to 6.7 percent. The reduction in the equitable share and the impact of the recession resulted in serious challenges of allocation and management of the limited resources. Despite these challenges the Provincial Treasury managed to ensure that resources are equitably allocated and managed by departments and the affected institutions. Prioritization, re-assessment of programmes in terms of services delivery and value adding and non-essential items were the order of the day to secure resources to fund core mandates. Looking forward into 2011, the Province will give more focus on the public health system which is under extreme pressure as a result of increasing demand for quality health services, pressure on education system arising as a result of the backlogs on school building and classroom provision and maintenance. The growing number of people in need of shelter in informal settlements presents a challenge for the province to provide proper basic service delivery and provision of formal housing. The provincial disaster as a result of the heavy rainfalls during the late part of the 2010 financial year increased the pressure on the limited resources available for distribution. In 2010, the Community Survey by Statistics South Africa revealed that the relative population in the North West Province is declining. The reduction in population reduced the equitable share allocation to the province by R267 million over the MTEF. This requires the Province to find innovative ways of increasing the size of the envelope and do things differently. The budget addresses key issues contained in the State of the Nation Address, State of the Province Address and in line with the outcome approach. The important priorities that the budget attempt to address among others include the key service delivery issues such as education, health, crime prevention, rural development and job creation. “Job creation through meaningful economic transformation” The year 2011 has been declared by the President as the year of job creation through meaningful economic transformation. This priority attempts to deal with unacceptable high levels of poverty and inequality fund in the country and therefore the government will strive to provide decent and sustainable jobs through the New Growth Path that will: • Identify areas where employment creation is possible on a large scale as a result of substantial
changes in conditions of South Africa and globally. • Develop a policy package to facilitate employment creation through a comprehensive drive to
enhance both social equity and competitiveness • Systemic changes to mobilize domestic investment around activities that can create sustainable
employment and; • Strong social dialogue to focus all stakeholders on encouraging growth in employment creating
activities “Continue to implement the 10 Point Plan on health” The government will work tirelessly to create a health system that promotes women’s health as a fundamental human right and will strive to promote the provision of sanitary towels to women on the indigent list of municipalities. Addition to that, accelerated work shall be undertaken to further revitalize and improve public health care system and to attend to intense pressure and challenges facing health services in some provinces. Intervention must include appointing qualified personnel and improving infrastructure such as rebuilding dilapidated clinics and hospitals. The implementation of the National Health Insurance needs to be fast-tracked.
2011 MTEF Budget 08 March 2011 2
“Education: Further Education and Training has been prioritized and provide resources including expanding bursary schemes for supporting attendance at FET Colleges. For 2011, Students who have registered at public universities in their final year of study and who qualify for funding from the National Student Financial Aid Scheme will receive a loan equivalent to the full cost of study, which is the full fee and the necessary living expenses. The government will also put efforts in promoting the role of State Owned Enterprise in the training of artisans to promote skill development. The schools must provide text books and all materials on the first day of the school. The government shall improve the infrastructure; including attending to the more than 3000 schools that need to be brought up to the basic safety functionality levels by 2014. “Peace and Stability” There are number of structures whose task is to prevent, fight and deal with corruptions. Various investigations are currently underway in the public service designed to help thus ensuring clean governance “Rural Development and Land Reform” - To enact legislation that will give greater protection to farm workers and farm dweller and monitor the enforcement of that legislation. The government is looking at three forms of land holding. That is, these are the state lands that can only be held through leasehold, freehold with limited extent on private land and foreigners will be allowed to lease land but ownership will revert to South Africa. “Social Transformation - Provision of sports and recreational facilities in poor and rural communities must receive a priority. “Local Government - Place systems that allows greater community participation in choosing candidates for the 2011 local government elections. Political Prioritization linked to the National Spatial Development Perspective (NSDP) and Provincial Growth and Development Strategy (PGDS). The National Spatial Development Perspective states that the National Government is committed to economic growth, employment creation, sustainable service delivery, poverty alleviation and eradication of historic inequities. Efforts to provide integrated and sustainable growth and development showed that a common policy, planning and delivery framework for integrated and sustainable development and growth in the province lies at the heart of improved and focused delivery through national and provincial government, district and municipal councils and other partners in development. It also showed that integrated and sustainable development is only possible and feasible if all partners in development depart from one common and standardized framework and approach. The Provincial Growth and Development Strategy will be reviewed during 2010/11, specific focus on the sectoral and spatial targets based on the amended municipal boundaries within the province and the achievements made so far. This review process also needs to incorporate new challenges and policies that have been developed since the first version of the Provincial Growth and Development Strategy in 2004. The NSDP and the Provincial Growth and Development Strategy proposed certain normative principles to use as guide when making the decisions on infrastructure investments and development spending to meet the overall provincial objectives. Economic growth which is a prerequisite for the achievement of other policy objectives, key among others would be poverty alleviation. Government spending on fixed investment, beyond the constitutional obligation to provide basic services to all citizens (such as water, electricity as well as health and educational facilities), should therefore be focused on localities of economic growth and/or economic potential in order to attract Private-sector investment, stimulate sustainable economic activities and/or create long-term employment opportunities. Efforts to address past and current social inequalities should focus on people not places. In localities where there are both high levels of poverty and development potential, this could include fixed capital investment beyond basic services to exploit the potential of those localities. In localities with low
2011 MTEF Budget 08 March 2011 3
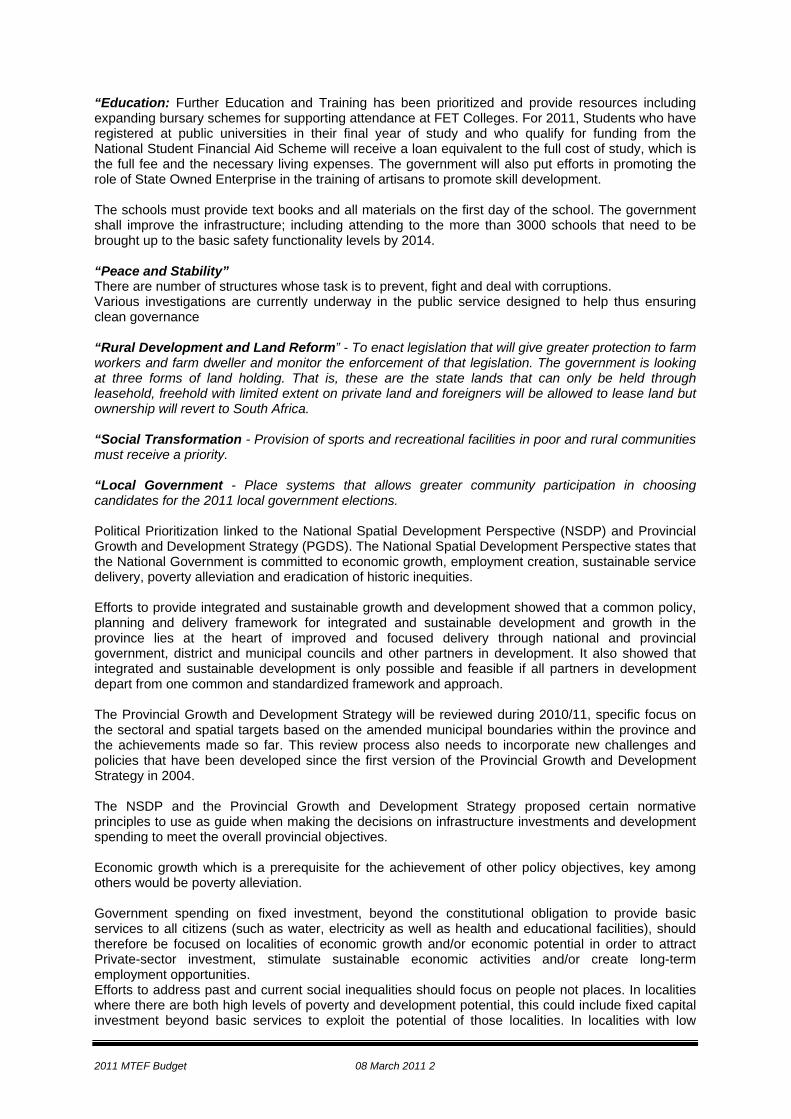
development potential, government spending, beyond basic services, should focus on providing social transfers, human resource development and labour market intelligence. This will enable people to become more mobile and migrate, if they choose to, to localities that are more likely to provide sustainable employment or other economic opportunities. In order to overcome the previous spatial distortions, future settlement and economic development opportunities should be channeled into activity corridors and nodes that are adjacent to or link the main growth centers. Infrastructure investment and development spending should primarily support localities that will become major growth nodes in the province. Chapter 1: Economic Outlook 1.1 Introduction This chapter provides a snapshot of the economic development since the third quarter of 2009 for the global and local economies. In addition, it also provides a summary of the income, expenditure patterns and poverty situation of the North West Province. The overall economic recovery has strengthened in the first half of the year, with real GDP growth expanding at an estimated rate of 3.9 per cent when compared with the second half of 2009. That is, the real GDP growth is projected to grow to rise from 3 percent in 2010 to 3.4 percent in 2011, 4.1 percent in 2012 and 4.4 percent in 2013. While the level of the real GDP returned to pre crisis levels it will take time before the economy reaches full capacity. The recent economic growth has been characterized by the three imbalances. One, economic growth which is uncertain following the recent economic meltdown, growth which has been driven by a combination of strong commodity prices, strong capital inflows and strong domestic consumer demand. All these rooted in antipoverty measures, growing employment and rising asset prices. It is unfortunate that the effects of this combination has been a strengthening of the currency which makes it difficult for exports outside of the commodity sector and those who compete with imports to remain competitive. The second imbalance relates to the fact that, yet the government is continuing to do its utmost best to make South Africans benefiting from the relative economic success, through social grants which intends to give some impetus to poverty reduction and income redistribution, to cover at least a third of the affected population remains a challenge due to the influx of the immigrants. The third imbalance is the climatic changes that have caused a great loss on the assets as a result of unanticipated floods, life threats due to environmental diseases and definite loss of lives. North West Province Economic Perspective In order for the government to achieve its social objectives, the GDP growth needs to grow at least at an average of 5 percent per annum between 2004 and 2014. Due to the uncertainty of economic changes, this might be just a pipe dream. The poor performance in the South African economy in 2009 was evident in all provincial economies with all provinces recording negative growth rates. The North West province with (-2.0 percent) recorded the lowest economic growth rate in 2009, followed by the Free State, KwaZulu-Natal and Limpopo provinces (-1.8 percent each). This is illustrated in Figure 3. The decrease in North West was supported by its largest industry, the Mining and quarrying (30.3 percent of total value added) which recorded a decrease of 5.5 percent. The decrease was also evident in the manufacturing (-6.9 percent), wholesales, retail, motor trade and accommodation (-2.3 percent) and electricity, gas and water industries (-1.1 percent).
2011 MTEF Budget 08 March 2011 4
Figure 1 – Real annual economic growth rate per region: 2009 Stats SA
-2,0
-1,5
-1,0
-0,5
0,0
0,5
%
GDPR 09 -1,5 -1,3 -1,5 -1,8 -1,8 -2,0 -1,7 -1,7 -1,8
SA 09 -1,7 -1,7 -1,7 -1,7 -1,7 -1,7 -1,7 -1,7 -1,7
WC EC NC FS KZN NW GP MP LP
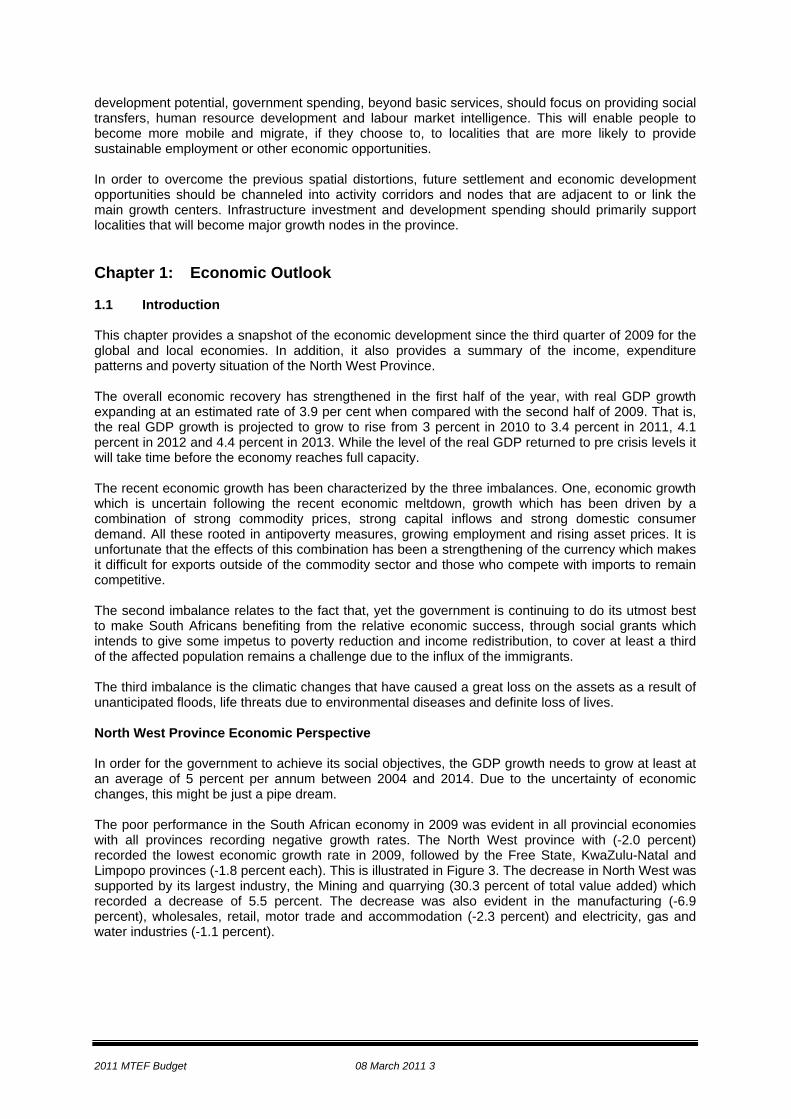
Figure 2- Provincial contribution to South African economy: 1995, 2005, and 2009
0,0
5,0
10,0
15,0
20,0
25,0
30,0
35,0
%
1995 14,6 8,3 2,3 5,7 16,8 6,1 33,9 6,7 5,7
2005 14,6 7,9 2,2 5,2 16,2 6,4 34,3 6,6 6,6
2009 14,0 7,6 2,3 5,5 16,1 6,5 33,9 7,1 7,0
WC EC NC FS KZN NW GP MP LP
Table 1: Regional distribution of economic activity: 2009
Industry Western Cape
Eastern Cape
Northern Cape
Free State
KwaZulu-Natal
North West Gauteng Mpuma
-langa Limpo-
po SA
Agriculture, forestry and fishing 21,9 5,1 6,4 11,0 26,7 6,1 5,8 9,1 7,8 100
Mining and quarrying 0,4 0,3 7,2 8,7 3,5 23,9 13,5 19,6 22,8 100
Manufacturing 14,5 7,7 0,4 4,1 21,4 2,6 40,6 7,3 1,4 100
Electricity, gas and water 11,0 4,1 2,5 6,8 16,0 3,0 33,2 15,0 8,5 100
Construction 17,0 5,9 1,2 3,8 15,6 5,0 41,9 5,0 4,6 100
Wholesale, retail, motor trade and accommodation
17,4 8,1 1,9 4,8 16,8 5,4 34,8 5,4 5,6 100
Transport, storage and communication 15,0 7,1 2,0 4,5 22,1 5,8 32,0 5,9 5,6 100
Finance, real estate and business services 19,5 7,5 1,5 4,1 14,2 4,0 39,7 4,2 5,4 100
Community, social and other personal services 12,3 13,3 3,3 10,3 16,8 8,5 24,1 6,0 5,5 100
General government services 9,7 10,9 2,0 5,2 14,7 5,4 38,8 4,8 8,4 100
2011 MTEF Budget 08 March 2011 5
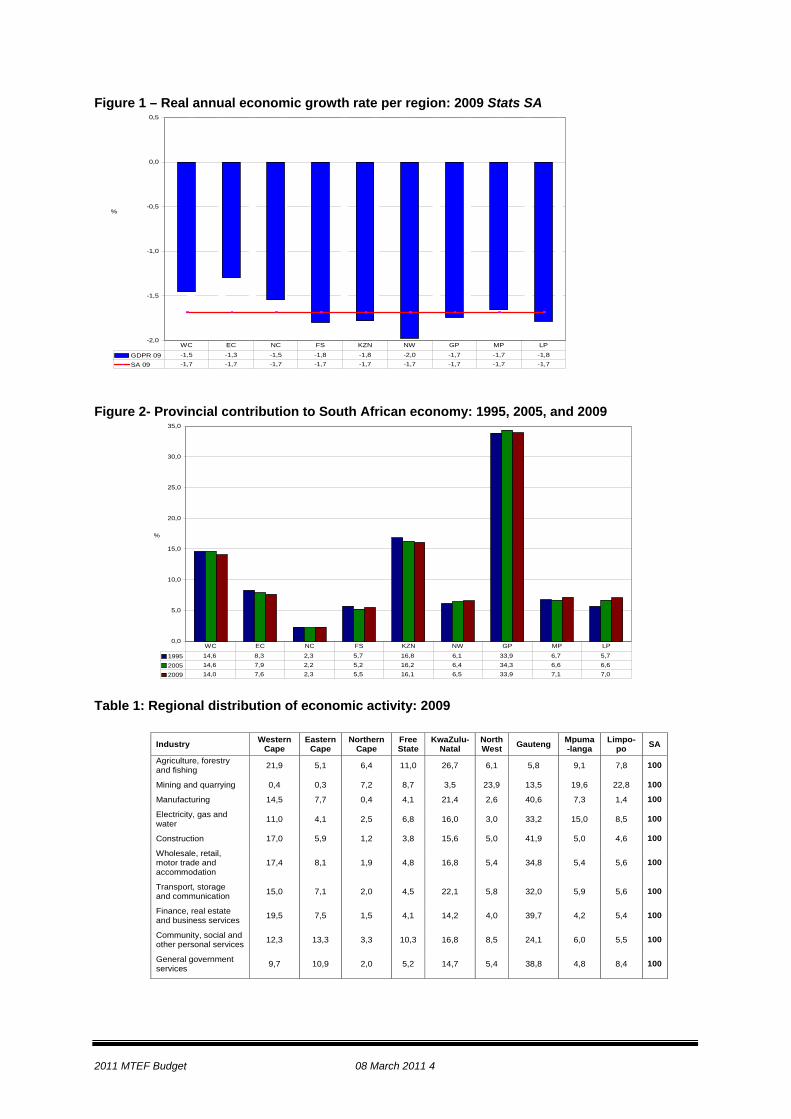
Having witnessed the overall growth performance of the North West Province’s economy vis-a –vis the rest of South Africa, it is fundamental to investigate the underlying sectoral contributions, looking at Table 1 above. As is to be expected the Agicultural sector is loosing share overtime when compared with Northern Cape and and Limpopo. Mining which is a major contributor to the North West Province economy has substantially improved its standing much over time as compared to all other provinces. From comparative provincial figures to the economic structure within the four districts in the NW Province and the various sectors of the provincial economy, the total GVA per district for the period 1996 to 2005 as well as the projected figures for 2010 is outlined in Figure 3. These figures clearly indicate the dominance of the Bojanala Platinum District Municipality within the overall NW economy. The total estimated Gross Value Added (GVA) of the Bojanala Platinum District was approximately R50 billion in 2005, which represented 57 percent of the total provincial GVA. This figure is also more than double the total GVA of the Southern District Municipality, (R21.5 billion), 5 times higher than the figure for the Central District Municipality and nearly 10 times as much as that of the Bophirima District Municipality (R4.8 billion). The proportional contribution of the Bojanala Platinum District Municipality has also increased significantly from 35 per cent in 1996 to 57 percent in 2005. It is furthermore expected that the proportional contribution of the Bojanala Platinum District to the provincial economy will increase further to 64 percent by the year 2010. These figures imply that the overall performance of the provincial economy will to a large extent be influenced by the performance of the Bojanala Platinum District economy. It also implies that the provincial performance will be very sensitive to trends and occurrences in the District economy of Bojanala Platinum District Municipality. Figure 3- Gross Value Added per District
2011 MTEF Budget 08 March 2011 6
1.2 Socio-economic outlook 2011/12
1.2.1 Introduction
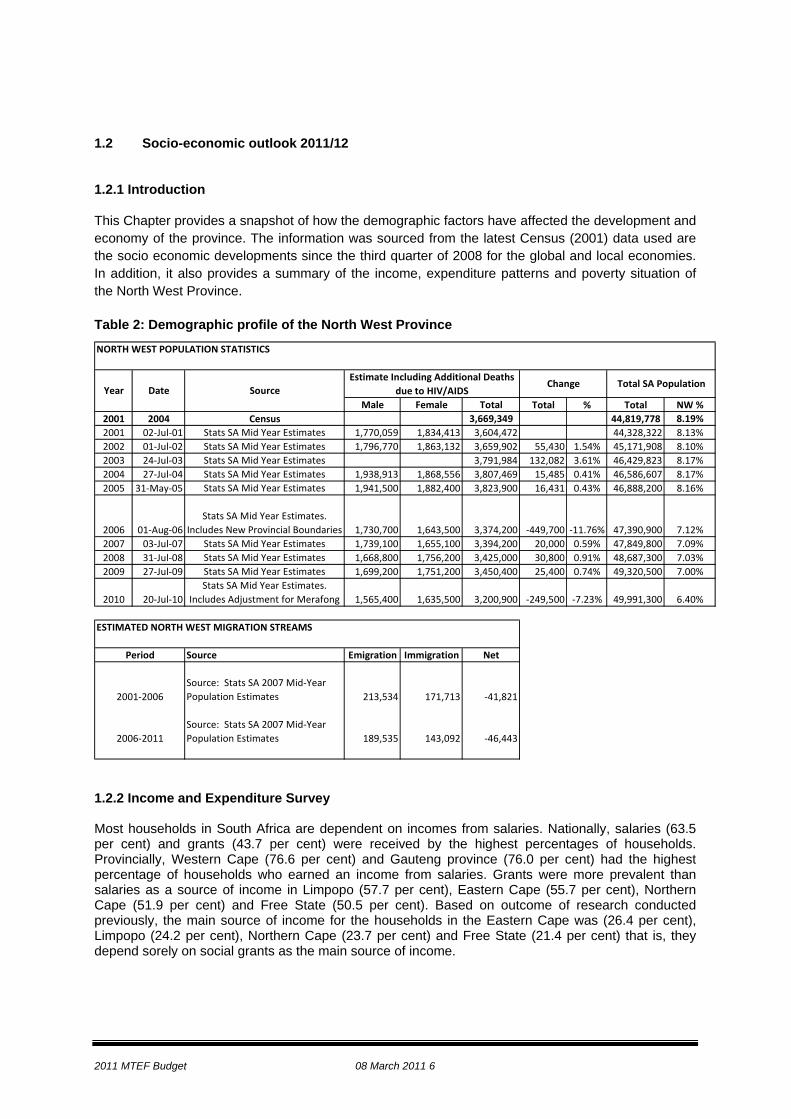
This Chapter provides a snapshot of how the demographic factors have affected the development and economy of the province. The information was sourced from the latest Census (2001) data used are the socio economic developments since the third quarter of 2008 for the global and local economies. In addition, it also provides a summary of the income, expenditure patterns and poverty situation of the North West Province.
Table 2: Demographic profile of the North West Province
NORTH WEST POPULATION STATISTICS
Male Female Total Total % Total NW %2001 2004 Census 3,669,349 44,819,778 8.19%2001 02‐Jul‐01 Stats SA Mid Year Estimates 1,770,059 1,834,413 3,604,472 44,328,322 8.13%2002 01‐Jul‐02 Stats SA Mid Year Estimates 1,796,770 1,863,132 3,659,902 55,430 1.54% 45,171,908 8.10%2003 24‐Jul‐03 Stats SA Mid Year Estimates 3,791,984 132,082 3.61% 46,429,823 8.17%2004 27‐Jul‐04 Stats SA Mid Year Estimates 1,938,913 1,868,556 3,807,469 15,485 0.41% 46,586,607 8.17%2005 31‐May‐05 Stats SA Mid Year Estimates 1,941,500 1,882,400 3,823,900 16,431 0.43% 46,888,200 8.16%
2006 01‐Aug‐06Stats SA Mid Year Estimates.
Includes New Provincial Boundaries 1,730,700 1,643,500 3,374,200 ‐449,700 ‐11.76% 47,390,900 7.12%2007 03‐Jul‐07 Stats SA Mid Year Estimates 1,739,100 1,655,100 3,394,200 20,000 0.59% 47,849,800 7.09%2008 31‐Jul‐08 Stats SA Mid Year Estimates 1,668,800 1,756,200 3,425,000 30,800 0.91% 48,687,300 7.03%2009 27‐Jul‐09 Stats SA Mid Year Estimates 1,699,200 1,751,200 3,450,400 25,400 0.74% 49,320,500 7.00%
2010 20‐Jul‐10Stats SA Mid Year Estimates.
Includes Adjustment for Merafong 1,565,400 1,635,500 3,200,900 ‐249,500 ‐7.23% 49,991,300 6.40%
ESTIMATED NORTH WEST MIGRATION STREAMS
Source Emigration Immigration Net
Source: Stats SA 2007 Mid‐Year Population Estimates 213,534 171,713 ‐41,821
Source: Stats SA 2007 Mid‐Year Population Estimates 189,535 143,092 ‐46,443
Period
2001‐2006
2006‐2011
Total SA PopulationYear
Estimate Including Additional Deaths due to HIV/AIDSDate Source
Change
1.2.2 Income and Expenditure Survey Most households in South Africa are dependent on incomes from salaries. Nationally, salaries (63.5 per cent) and grants (43.7 per cent) were received by the highest percentages of households. Provincially, Western Cape (76.6 per cent) and Gauteng province (76.0 per cent) had the highest percentage of households who earned an income from salaries. Grants were more prevalent than salaries as a source of income in Limpopo (57.7 per cent), Eastern Cape (55.7 per cent), Northern Cape (51.9 per cent) and Free State (50.5 per cent). Based on outcome of research conducted previously, the main source of income for the households in the Eastern Cape was (26.4 per cent), Limpopo (24.2 per cent), Northern Cape (23.7 per cent) and Free State (21.4 per cent) that is, they depend sorely on social grants as the main source of income.
2011 MTEF Budget 08 March 2011 7
Figure 4: Main sources of Households Income by Province
Figure 5: Income Distribution: North West
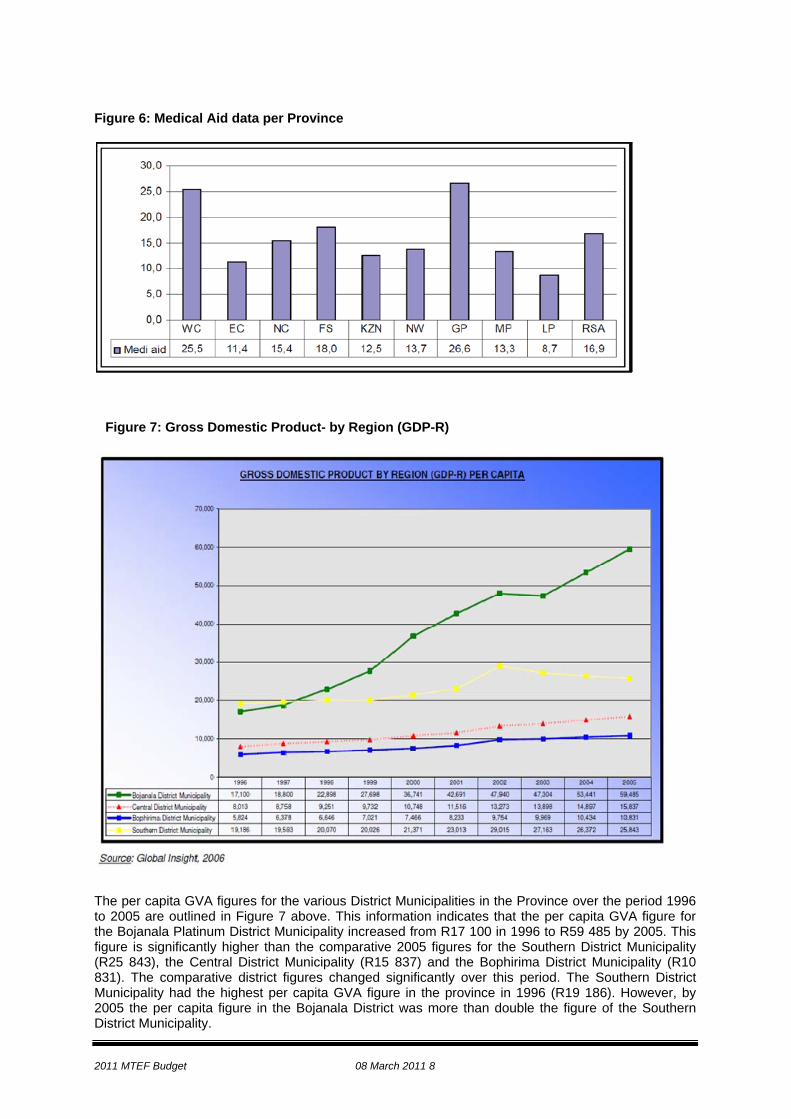
Source: Statssa 2007 Community Survey 1.2.3 General Household Survey- 2009 (Medical Aid Data, etc); Nearly a quarter (24.3 percent) of South African households has at least one member who belongs to a medical aid scheme. Figure 6 show that 16.9 percent of individuals in SA had medical aid scheme coverage in 2009. This is well above the 2002 levels and is better than in any previous year. In 2009, the GHS included for the first time a question about the reasons why households do not belong to medical aid schemes. The findings suggest that 90.0 percent of households that do not belong to a medical aid scheme say that they do not belong to a scheme because they do not have money to pay for it.
2011 MTEF Budget 08 March 2011 8
Figure 6: Medical Aid data per Province
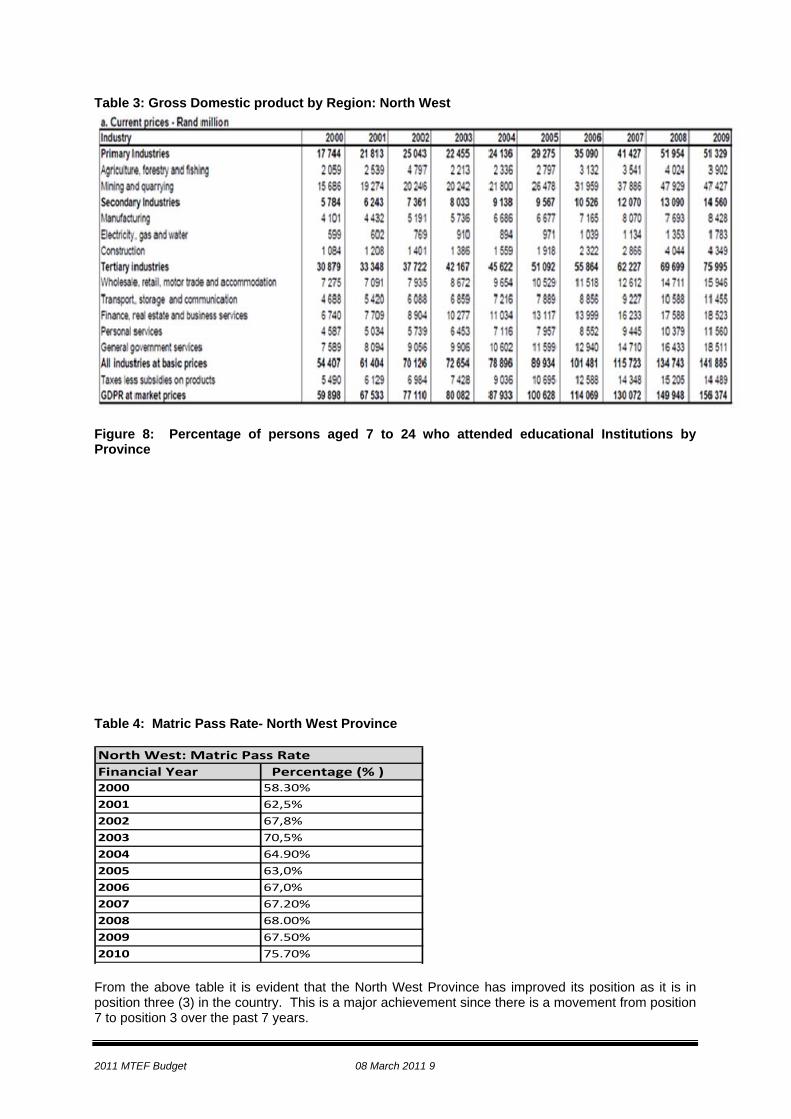
Figure 7: Gross Domestic Product- by Region (GDP-R)
The per capita GVA figures for the various District Municipalities in the Province over the period 1996 to 2005 are outlined in Figure 7 above. This information indicates that the per capita GVA figure for the Bojanala Platinum District Municipality increased from R17 100 in 1996 to R59 485 by 2005. This figure is significantly higher than the comparative 2005 figures for the Southern District Municipality (R25 843), the Central District Municipality (R15 837) and the Bophirima District Municipality (R10 831). The comparative district figures changed significantly over this period. The Southern District Municipality had the highest per capita GVA figure in the province in 1996 (R19 186). However, by 2005 the per capita figure in the Bojanala District was more than double the figure of the Southern District Municipality.
2011 MTEF Budget 08 March 2011 9
Table 3: Gross Domestic product by Region: North West
Figure 8: Percentage of persons aged 7 to 24 who attended educational Institutions by Province
Table 4: Matric Pass Rate- North West Province North West: Matric Pass RateFinancial Year Percentage (% )2000 58.30%
2001 62,5%
2002 67,8%
2003 70,5%
2004 64.90%
2005 63,0%
2006 67,0%
2007 67.20%
2008 68.00%
2009 67.50%
2010 75.70% From the above table it is evident that the North West Province has improved its position as it is in position three (3) in the country. This is a major achievement since there is a movement from position 7 to position 3 over the past 7 years.
2011 MTEF Budget 08 March 2011 10
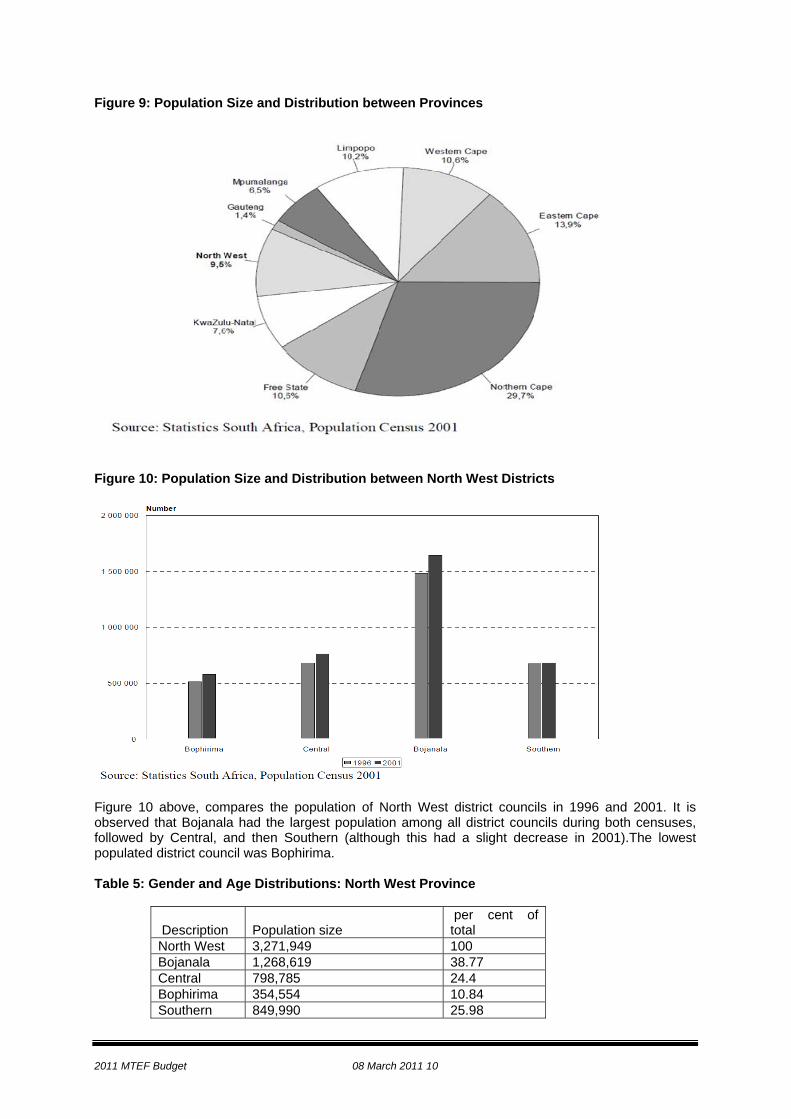
Figure 9: Population Size and Distribution between Provinces
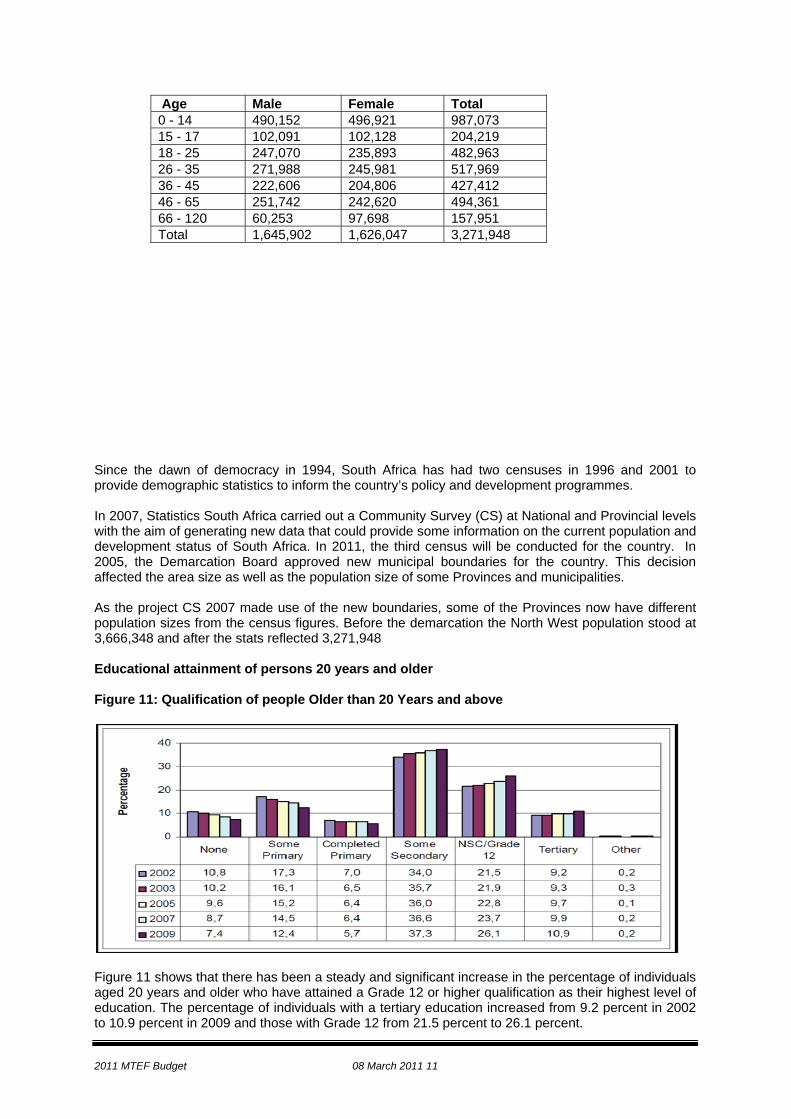
Figure 10: Population Size and Distribution between North West Districts
Figure 10 above, compares the population of North West district councils in 1996 and 2001. It is observed that Bojanala had the largest population among all district councils during both censuses, followed by Central, and then Southern (although this had a slight decrease in 2001).The lowest populated district council was Bophirima. Table 5: Gender and Age Distributions: North West Province
Description Population size per cent of total
North West 3,271,949 100 Bojanala 1,268,619 38.77 Central 798,785 24.4 Bophirima 354,554 10.84 Southern 849,990 25.98
2011 MTEF Budget 08 March 2011 11
Age Male Female Total 0 - 14 490,152 496,921 987,073 15 - 17 102,091 102,128 204,219 18 - 25 247,070 235,893 482,963 26 - 35 271,988 245,981 517,969 36 - 45 222,606 204,806 427,412 46 - 65 251,742 242,620 494,361 66 - 120 60,253 97,698 157,951 Total 1,645,902 1,626,047 3,271,948
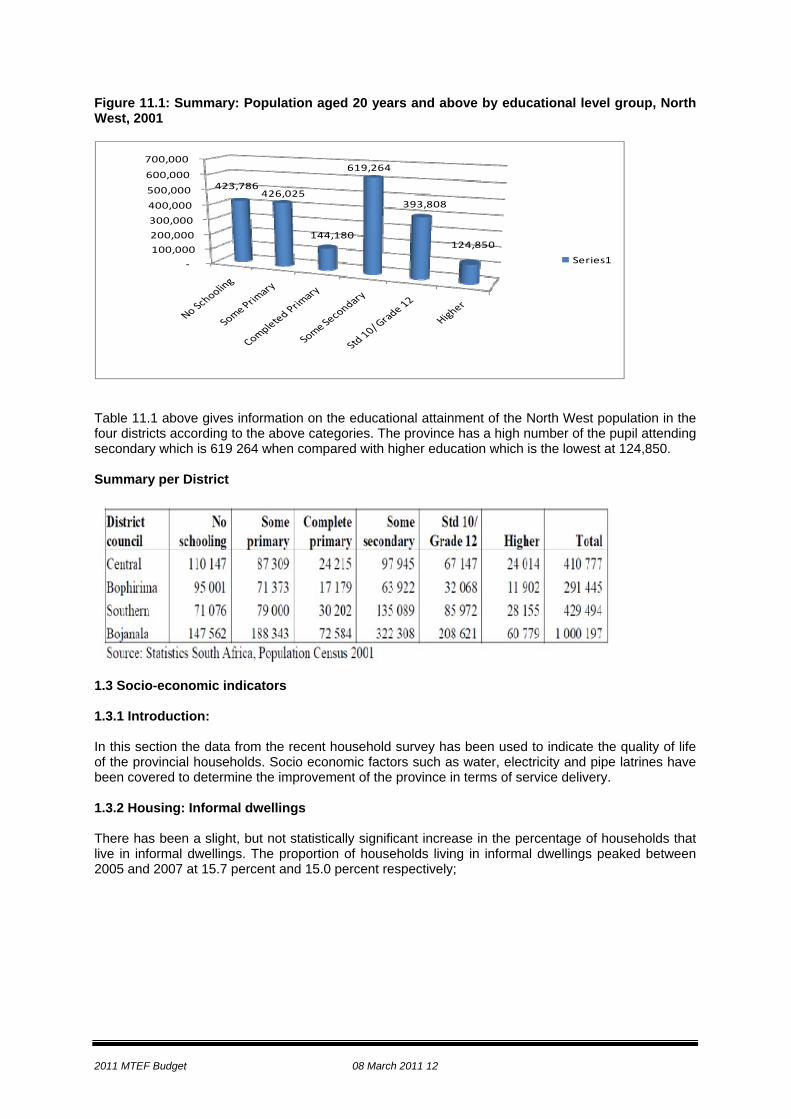
Since the dawn of democracy in 1994, South Africa has had two censuses in 1996 and 2001 to provide demographic statistics to inform the country’s policy and development programmes. In 2007, Statistics South Africa carried out a Community Survey (CS) at National and Provincial levels with the aim of generating new data that could provide some information on the current population and development status of South Africa. In 2011, the third census will be conducted for the country. In 2005, the Demarcation Board approved new municipal boundaries for the country. This decision affected the area size as well as the population size of some Provinces and municipalities. As the project CS 2007 made use of the new boundaries, some of the Provinces now have different population sizes from the census figures. Before the demarcation the North West population stood at 3,666,348 and after the stats reflected 3,271,948 Educational attainment of persons 20 years and older Figure 11: Qualification of people Older than 20 Years and above
Figure 11 shows that there has been a steady and significant increase in the percentage of individuals aged 20 years and older who have attained a Grade 12 or higher qualification as their highest level of education. The percentage of individuals with a tertiary education increased from 9.2 percent in 2002 to 10.9 percent in 2009 and those with Grade 12 from 21.5 percent to 26.1 percent.
2011 MTEF Budget 08 March 2011 12
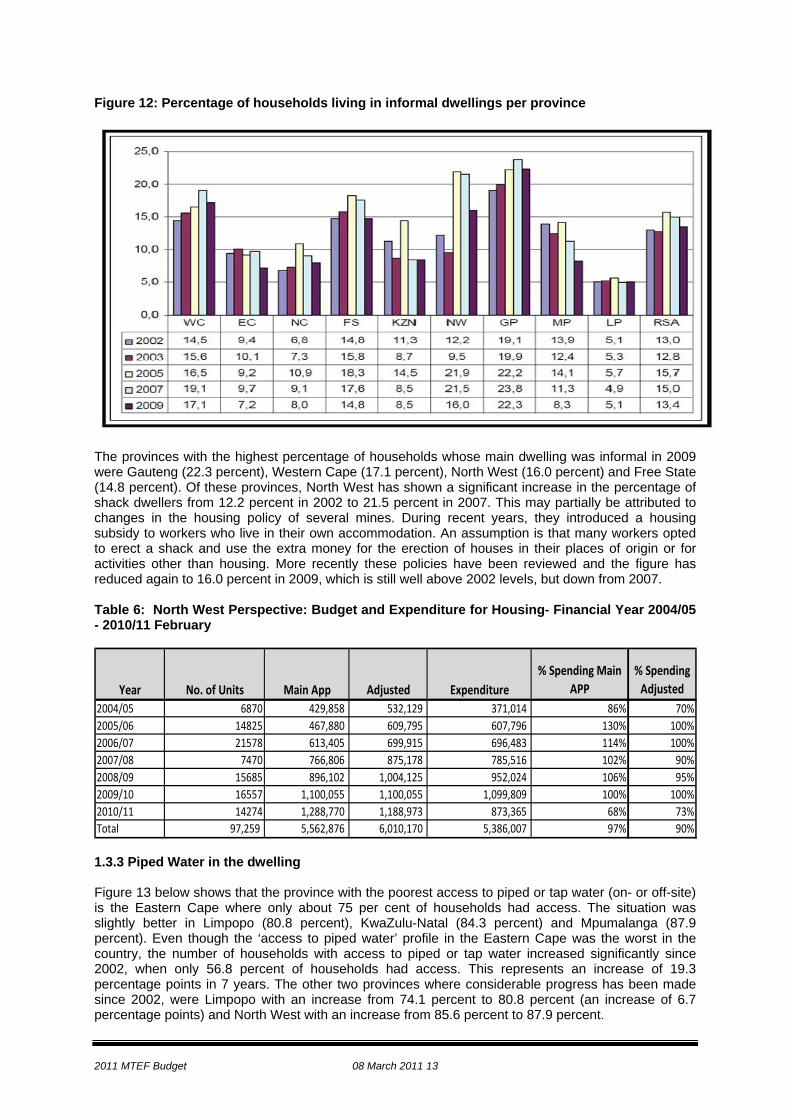
Figure 11.1: Summary: Population aged 20 years and above by educational level group, North West, 2001
‐
100,000
200,000
300,000
400,000
500,000
600,000
700,000
423,786 426,025
144,180
619,264
393,808
124,850
Series1
Table 11.1 above gives information on the educational attainment of the North West population in the four districts according to the above categories. The province has a high number of the pupil attending secondary which is 619 264 when compared with higher education which is the lowest at 124,850. Summary per District
1.3 Socio-economic indicators 1.3.1 Introduction: In this section the data from the recent household survey has been used to indicate the quality of life of the provincial households. Socio economic factors such as water, electricity and pipe latrines have been covered to determine the improvement of the province in terms of service delivery. 1.3.2 Housing: Informal dwellings There has been a slight, but not statistically significant increase in the percentage of households that live in informal dwellings. The proportion of households living in informal dwellings peaked between 2005 and 2007 at 15.7 percent and 15.0 percent respectively;
2011 MTEF Budget 08 March 2011 13
Figure 12: Percentage of households living in informal dwellings per province
The provinces with the highest percentage of households whose main dwelling was informal in 2009 were Gauteng (22.3 percent), Western Cape (17.1 percent), North West (16.0 percent) and Free State (14.8 percent). Of these provinces, North West has shown a significant increase in the percentage of shack dwellers from 12.2 percent in 2002 to 21.5 percent in 2007. This may partially be attributed to changes in the housing policy of several mines. During recent years, they introduced a housing subsidy to workers who live in their own accommodation. An assumption is that many workers opted to erect a shack and use the extra money for the erection of houses in their places of origin or for activities other than housing. More recently these policies have been reviewed and the figure has reduced again to 16.0 percent in 2009, which is still well above 2002 levels, but down from 2007. Table 6: North West Perspective: Budget and Expenditure for Housing- Financial Year 2004/05 - 2010/11 February
Year No. of Units Main App Adjusted Expenditure% Spending Main
APP% Spending Adjusted
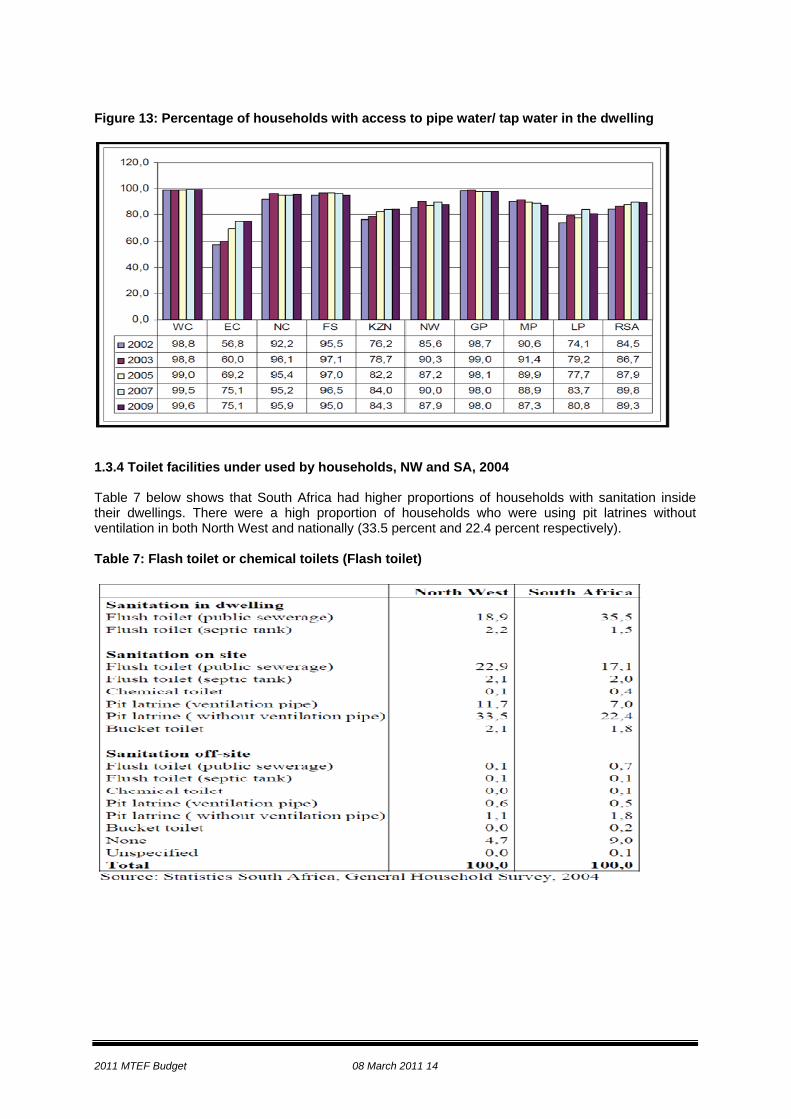
2004/05 6870 429,858 532,129 371,014 86% 70%2005/06 14825 467,880 609,795 607,796 130% 100%2006/07 21578 613,405 699,915 696,483 114% 100%2007/08 7470 766,806 875,178 785,516 102% 90%2008/09 15685 896,102 1,004,125 952,024 106% 95%2009/10 16557 1,100,055 1,100,055 1,099,809 100% 100%2010/11 14274 1,288,770 1,188,973 873,365 68% 73%Total 97,259 5,562,876 6,010,170 5,386,007 97% 90% 1.3.3 Piped Water in the dwelling Figure 13 below shows that the province with the poorest access to piped or tap water (on- or off-site) is the Eastern Cape where only about 75 per cent of households had access. The situation was slightly better in Limpopo (80.8 percent), KwaZulu-Natal (84.3 percent) and Mpumalanga (87.9 percent). Even though the ‘access to piped water’ profile in the Eastern Cape was the worst in the country, the number of households with access to piped or tap water increased significantly since 2002, when only 56.8 percent of households had access. This represents an increase of 19.3 percentage points in 7 years. The other two provinces where considerable progress has been made since 2002, were Limpopo with an increase from 74.1 percent to 80.8 percent (an increase of 6.7 percentage points) and North West with an increase from 85.6 percent to 87.9 percent.
2011 MTEF Budget 08 March 2011 14
Figure 13: Percentage of households with access to pipe water/ tap water in the dwelling
1.3.4 Toilet facilities under used by households, NW and SA, 2004 Table 7 below shows that South Africa had higher proportions of households with sanitation inside their dwellings. There were a high proportion of households who were using pit latrines without ventilation in both North West and nationally (33.5 percent and 22.4 percent respectively). Table 7: Flash toilet or chemical toilets (Flash toilet)
2011 MTEF Budget 08 March 2011 15
Table 8: Toilet Facilities by District Council
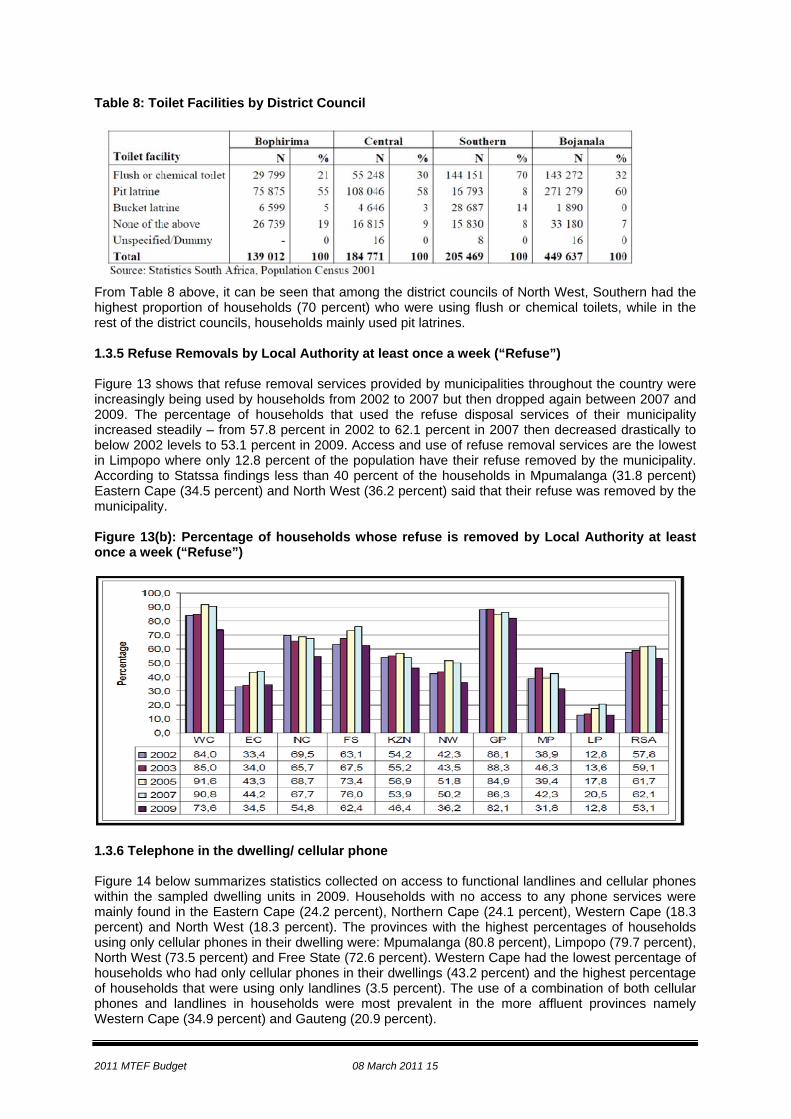
From Table 8 above, it can be seen that among the district councils of North West, Southern had the highest proportion of households (70 percent) who were using flush or chemical toilets, while in the rest of the district councils, households mainly used pit latrines. 1.3.5 Refuse Removals by Local Authority at least once a week (“Refuse”) Figure 13 shows that refuse removal services provided by municipalities throughout the country were increasingly being used by households from 2002 to 2007 but then dropped again between 2007 and 2009. The percentage of households that used the refuse disposal services of their municipality increased steadily – from 57.8 percent in 2002 to 62.1 percent in 2007 then decreased drastically to below 2002 levels to 53.1 percent in 2009. Access and use of refuse removal services are the lowest in Limpopo where only 12.8 percent of the population have their refuse removed by the municipality. According to Statssa findings less than 40 percent of the households in Mpumalanga (31.8 percent) Eastern Cape (34.5 percent) and North West (36.2 percent) said that their refuse was removed by the municipality. Figure 13(b): Percentage of households whose refuse is removed by Local Authority at least once a week (“Refuse”)
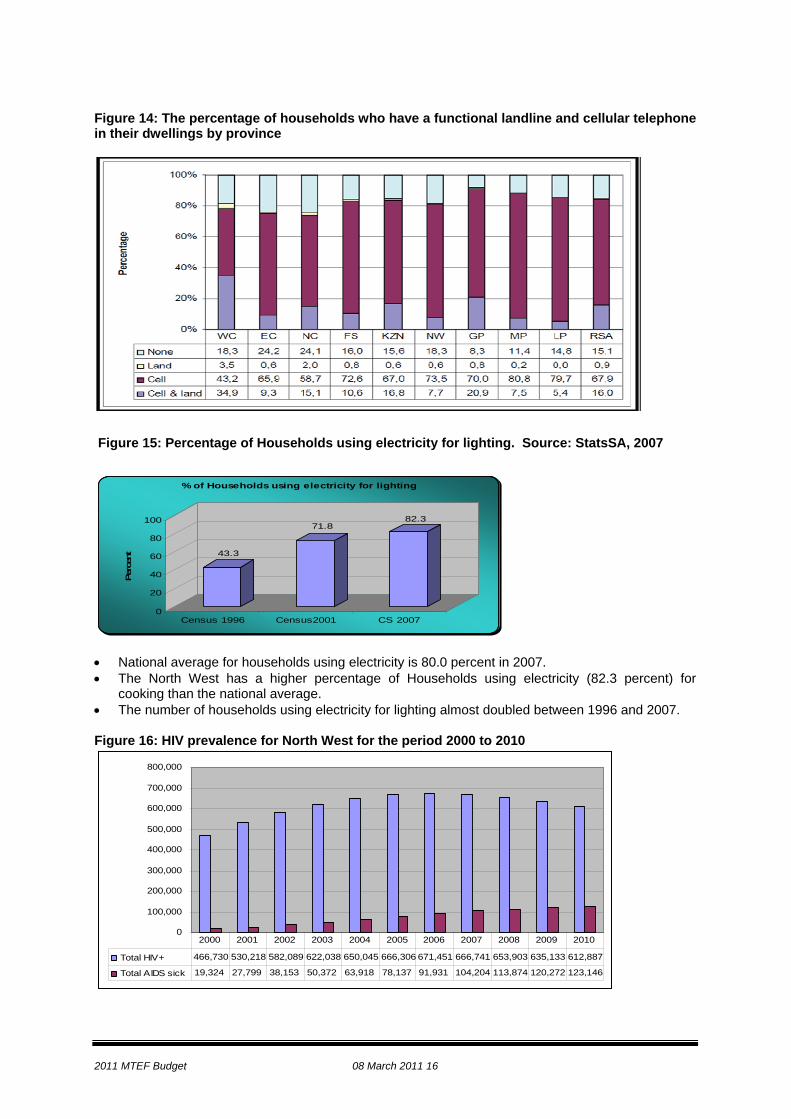
1.3.6 Telephone in the dwelling/ cellular phone Figure 14 below summarizes statistics collected on access to functional landlines and cellular phones within the sampled dwelling units in 2009. Households with no access to any phone services were mainly found in the Eastern Cape (24.2 percent), Northern Cape (24.1 percent), Western Cape (18.3 percent) and North West (18.3 percent). The provinces with the highest percentages of households using only cellular phones in their dwelling were: Mpumalanga (80.8 percent), Limpopo (79.7 percent), North West (73.5 percent) and Free State (72.6 percent). Western Cape had the lowest percentage of households who had only cellular phones in their dwellings (43.2 percent) and the highest percentage of households that were using only landlines (3.5 percent). The use of a combination of both cellular phones and landlines in households were most prevalent in the more affluent provinces namely Western Cape (34.9 percent) and Gauteng (20.9 percent).
2011 MTEF Budget 08 March 2011 16
Figure 14: The percentage of households who have a functional landline and cellular telephone in their dwellings by province
Figure 15: Percentage of Households using electricity for lighting. Source: StatsSA, 2007
43.3
71.882.3
0
20
40
60
80
100
Perc
ent
Census 1996 Census2001 CS 2007
% of Households using electricity for lighting
• National average for households using electricity is 80.0 percent in 2007. • The North West has a higher percentage of Households using electricity (82.3 percent) for
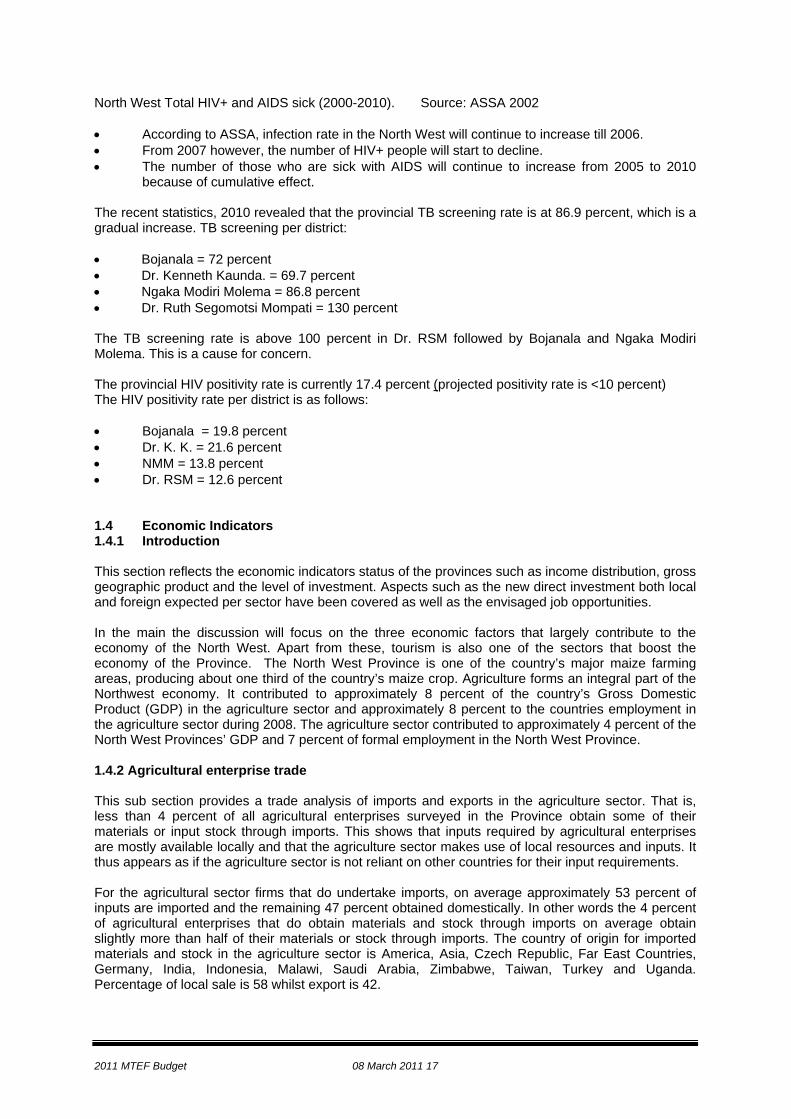
cooking than the national average. • The number of households using electricity for lighting almost doubled between 1996 and 2007. Figure 16: HIV prevalence for North West for the period 2000 to 2010
0
100,000
200,000
300,000
400,000
500,000
600,000
700,000
800,000
Total HIV+ 466,730 530,218 582,089 622,038 650,045 666,306 671,451 666,741 653,903 635,133 612,887
Total AIDS sick 19,324 27,799 38,153 50,372 63,918 78,137 91,931 104,204 113,874 120,272 123,146
2000 2001 2002 2003 2004 2005 2006 2007 2008 2009 2010
2011 MTEF Budget 08 March 2011 17
North West Total HIV+ and AIDS sick (2000-2010). Source: ASSA 2002 • According to ASSA, infection rate in the North West will continue to increase till 2006. • From 2007 however, the number of HIV+ people will start to decline. • The number of those who are sick with AIDS will continue to increase from 2005 to 2010
because of cumulative effect. The recent statistics, 2010 revealed that the provincial TB screening rate is at 86.9 percent, which is a gradual increase. TB screening per district: • Bojanala = 72 percent • Dr. Kenneth Kaunda. = 69.7 percent • Ngaka Modiri Molema = 86.8 percent • Dr. Ruth Segomotsi Mompati = 130 percent The TB screening rate is above 100 percent in Dr. RSM followed by Bojanala and Ngaka Modiri Molema. This is a cause for concern. The provincial HIV positivity rate is currently 17.4 percent (projected positivity rate is <10 percent) The HIV positivity rate per district is as follows: • Bojanala = 19.8 percent • Dr. K. K. = 21.6 percent • NMM = 13.8 percent • Dr. RSM = 12.6 percent 1.4 Economic Indicators 1.4.1 Introduction This section reflects the economic indicators status of the provinces such as income distribution, gross geographic product and the level of investment. Aspects such as the new direct investment both local and foreign expected per sector have been covered as well as the envisaged job opportunities.
In the main the discussion will focus on the three economic factors that largely contribute to the economy of the North West. Apart from these, tourism is also one of the sectors that boost the economy of the Province. The North West Province is one of the country’s major maize farming areas, producing about one third of the country’s maize crop. Agriculture forms an integral part of the Northwest economy. It contributed to approximately 8 percent of the country’s Gross Domestic Product (GDP) in the agriculture sector and approximately 8 percent to the countries employment in the agriculture sector during 2008. The agriculture sector contributed to approximately 4 percent of the North West Provinces’ GDP and 7 percent of formal employment in the North West Province. 1.4.2 Agricultural enterprise trade This sub section provides a trade analysis of imports and exports in the agriculture sector. That is, less than 4 percent of all agricultural enterprises surveyed in the Province obtain some of their materials or input stock through imports. This shows that inputs required by agricultural enterprises are mostly available locally and that the agriculture sector makes use of local resources and inputs. It thus appears as if the agriculture sector is not reliant on other countries for their input requirements. For the agricultural sector firms that do undertake imports, on average approximately 53 percent of inputs are imported and the remaining 47 percent obtained domestically. In other words the 4 percent of agricultural enterprises that do obtain materials and stock through imports on average obtain slightly more than half of their materials or stock through imports. The country of origin for imported materials and stock in the agriculture sector is America, Asia, Czech Republic, Far East Countries, Germany, India, Indonesia, Malawi, Saudi Arabia, Zimbabwe, Taiwan, Turkey and Uganda. Percentage of local sale is 58 whilst export is 42.
2011 MTEF Budget 08 March 2011 18
Regardless of the current economic condition, most agricultural businesses expect to record turnover and employment increases. More than a quarter of importing and exporting agricultural enterprises are however expecting decreases in both imports and exports. Employment is expected to grow with at least 14 percent. 1.4.3 Mining Sector The North West Province is one of the country’s major mining areas. The mining sector of the North West Province contributed to approximately 26 percent of the country’s mining sector Gross Domestic Product (GDP) in 2008 and was responsible for more than half (52 percent) of the countries formal mining sector employment. The economic importance of the North West mining sector to the South African economy is clearly significant.
Within the North West Province, the mining sector is also a key contributing sector and represents the largest sector in the North West Province. Mining contributed to approximately 38 percent of GDP and 30 percent of formal employment in the North West Province during 2008. The main mining activities in the area are gold, diamond, and platinum. Since the main mining activities in the area are gold, diamond, and platinum, the provincial economy is largely dependent on the demand for the minerals created by the foreign countries and fluctuation of the commodity prices. The mining sector, an export‐based sector, is thus feeling the impact of the economic crises. Large commodity producers are cutting back on output while smaller miners are struggling to survive. This has meant that the mining sector has also been exposed to the drying up of finance, volatile commodity prices and retrenchments. 1.4.4 Manufacturing Sector Manufacturing is defined as the physical or chemical transformation of materials or components into new products, whether the work is performed by power‐driven machines or by hand, whether it is done in a factory or in the worker’s home and whether the products are sold wholesale or retail. The manufacturing sector provides a focus for stimulating the growth of other activities, such as services, and achieving specific outcomes, such as employment creation and economic empowerment. This platform of manufacturing presents an opportunity to significantly accelerate the Provinces growth and development. Some of the secondary activities of the manufacturing industries in the North West Province are dominated by the following sub‐industries that can create jobs in the medium and long term;
• Agro processing: Abattoir, juice manufacturers, maize and sorghum milling, processing of dairy products, production of spices, etc
• Agriculture packaging material manufacturing • Bakery / confectionery • Bio chemical/ cleaning materials manufacturing • Bricks manufacturing • Clothes manufacturing, tailoring and sewing • Furniture manufacturing and timber treatments • Hand crafting
2011 MTEF Budget 08 March 2011 19
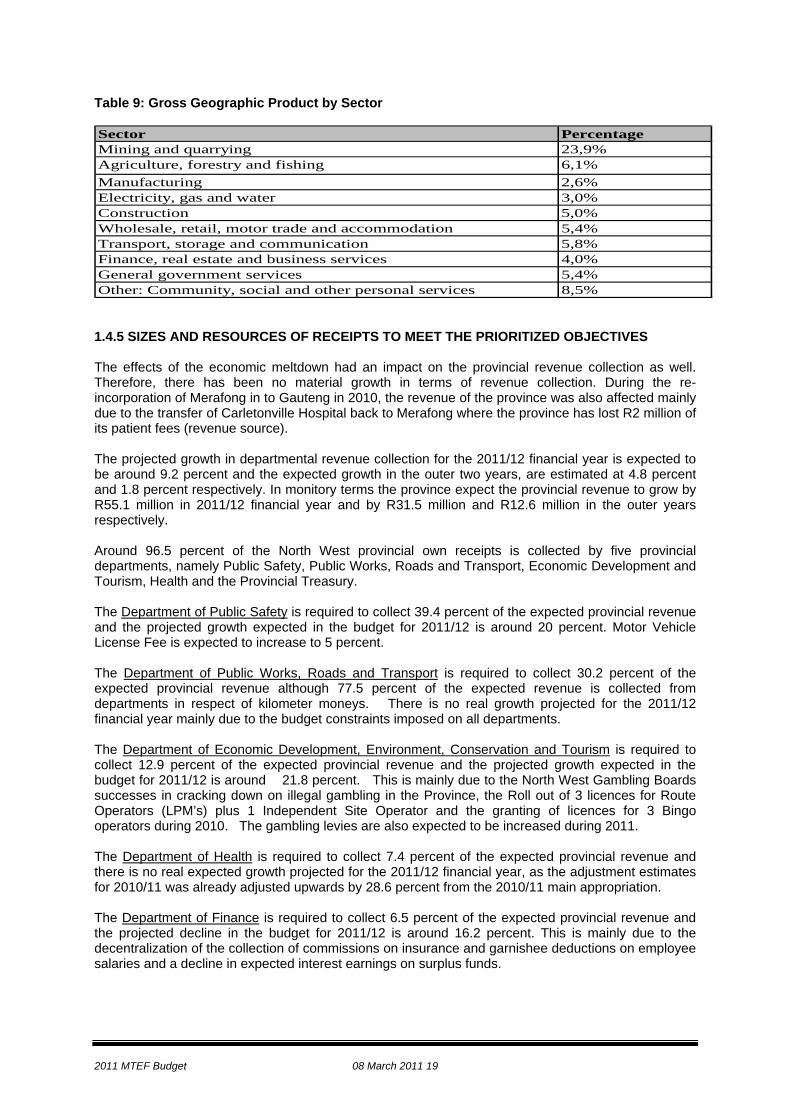
Table 9: Gross Geographic Product by Sector Sector PercentageMining and quarrying 23,9%Agriculture, forestry and fishing 6,1%Manufacturing 2,6%Electricity, gas and water 3,0%Construction 5,0%Wholesale, retail, motor trade and accommodation 5,4%Transport, storage and communication 5,8%Finance, real estate and business services 4,0%General government services 5,4%Other: Community, social and other personal services 8,5% 1.4.5 SIZES AND RESOURCES OF RECEIPTS TO MEET THE PRIORITIZED OBJECTIVES The effects of the economic meltdown had an impact on the provincial revenue collection as well. Therefore, there has been no material growth in terms of revenue collection. During the re- incorporation of Merafong in to Gauteng in 2010, the revenue of the province was also affected mainly due to the transfer of Carletonville Hospital back to Merafong where the province has lost R2 million of its patient fees (revenue source). The projected growth in departmental revenue collection for the 2011/12 financial year is expected to be around 9.2 percent and the expected growth in the outer two years, are estimated at 4.8 percent and 1.8 percent respectively. In monitory terms the province expect the provincial revenue to grow by R55.1 million in 2011/12 financial year and by R31.5 million and R12.6 million in the outer years respectively. Around 96.5 percent of the North West provincial own receipts is collected by five provincial departments, namely Public Safety, Public Works, Roads and Transport, Economic Development and Tourism, Health and the Provincial Treasury. The Department of Public Safety is required to collect 39.4 percent of the expected provincial revenue and the projected growth expected in the budget for 2011/12 is around 20 percent. Motor Vehicle License Fee is expected to increase to 5 percent. The Department of Public Works, Roads and Transport is required to collect 30.2 percent of the expected provincial revenue although 77.5 percent of the expected revenue is collected from departments in respect of kilometer moneys. There is no real growth projected for the 2011/12 financial year mainly due to the budget constraints imposed on all departments. The Department of Economic Development, Environment, Conservation and Tourism is required to collect 12.9 percent of the expected provincial revenue and the projected growth expected in the budget for 2011/12 is around 21.8 percent. This is mainly due to the North West Gambling Boards successes in cracking down on illegal gambling in the Province, the Roll out of 3 licences for Route Operators (LPM’s) plus 1 Independent Site Operator and the granting of licences for 3 Bingo operators during 2010. The gambling levies are also expected to be increased during 2011. The Department of Health is required to collect 7.4 percent of the expected provincial revenue and there is no real expected growth projected for the 2011/12 financial year, as the adjustment estimates for 2010/11 was already adjusted upwards by 28.6 percent from the 2010/11 main appropriation. The Department of Finance is required to collect 6.5 percent of the expected provincial revenue and the projected decline in the budget for 2011/12 is around 16.2 percent. This is mainly due to the decentralization of the collection of commissions on insurance and garnishee deductions on employee salaries and a decline in expected interest earnings on surplus funds.
2011 MTEF Budget 08 March 2011 20
1.4.6 Funding of a deficit or utilization of a surplus if possible The North West Province has never budgeted for a deficit and will in the next MTEF period also not be making use of any loan finance. At this stage there is no debt that has to be repaid. Chapter 2: Budget Strategy and Aggregates 2.1 Introduction: This section set out the provincial government’s main strategic policy direction underlying the budget and Provincial Growth and Development Strategy (PGDS) linked to the initiatives of the National Spatial Development Programme. To implement the provincial development agenda, the province should proceed from a premise that co ordinate the government priority setting, resource allocations and implementation thereof. 2.1.1 The Government’s National Election Manifesto The 2009 Election Manifesto highlighted many social and economic achievement of the leading government over the last 15 years. In particular the manifesto reflects on the major challenges facing the South African society. That is high unemployment, poverty deepening inequality and rural marginalization. To respond to the challenges the Manifesto identified the following five priorities areas of the government led in the next five years • Creation of decent work and sustainable livelihoods • Education • Health • Crime • Rural development, including land reform and food production and security Creation of decent work and sustainable livelihoods In this regard, the creation and retention of decent work and sustainable livelihoods will be the primary focus of all economic policies of the government. It also means that there must be a direct connection between the economic programmes and the developmental priorities. Economic policies must support the developmental priorities and in turn development priorities must support the economic programmes.
The fiscal and monetary policy mandates including interest rates and exchange rates need to take into account employment considerations, economic growth and other developmental imperatives
• The state shall recognize the right and duty of all to work, and to draw full unemployment benefits where men and women of all race shall receive equal pay for equal work;
• There shall be a forty-hour working week, a national minimum wage, paid annual leave, and sick leave for all workers and maternity leave on full pay for all working mothers;
• Miners, domestic workers, farm workers and civil servants shall have the same rights as all others who work;
• Child labour, compound labour, the tot system and contract labour shall be abolished.
The expansion of the economy in the last six years has developed at a faster rate than new entrants to job market. However, unemployment remains unacceptably high and the present slowdown in economic growth will have a direct impact on the growth rate of employment and requires us to act decisively. Further, the quality of jobs which have been created has not yet met our goal of creating decent work.
The government is committed to building a more equitable, sustainable and inclusive economic growth path, centered on the creation of decent work opportunities and sustainable livelihoods. We need to ensure that the majority of our people benefit meaningfully from economic growth. Decent work is broadly defined by International Labour Organization (ILO) as work that provides for workers rights and adequate protection by legislation, and provides for access to social security and social
2011 MTEF Budget 08 March 2011 21
dialogue. Decent work is the foundation of the fight against poverty and inequality and its promotion should be the corner-stone of all our efforts. Decent work embraces both the need for more jobs and for better quality jobs
Sustainable livelihoods: To achieve the objectives of decent work and sustainable livelihoods and to ensure a labour-intensive growth path, the government will pursue well resourced and strengthened state-led industrial policy programme by:
• a major up scaling of industrial policy with significant resources. To do this, Government will use all means at its disposal to leverage productive assets in the economy, to achieve decent work outcomes, to meet basic needs, promote technological innovation and improve beneficiation and local value;
• investing in research and development programmes and information communication technology; • supporting investment in the productive sectors, especially manufacturing and agricultural
production; • targeting labour-intensive production sectors and encouraging activities that have high
employment opportunities. • completing the review of the mandates of the development finance institutions to ensure that they
are clear and truly developmental and that their programmes contribute to investment finance, job creation and sustainable livelihoods; and
• providing systematic support for the co-operative sector by way of a dedicated support institution and small business
Education and Training
Education is aiming to promote good citizenship as well as preparing our people for the needs of a modern economy and a democratic society. Building on the achievements in education, the ANC government will aim to ensure progressive realization of universal schooling, improving quality education and eliminating disparities. This requires a major renewal of our schooling and education system, by taking the following steps: • Work together with educators, learners, parents, school governing bodies and other stakeholders,
to make education the priority of all. • The ANC is committed to a free and compulsory education for all children. As the immediate step
it will ensure that at least 60 per cent of schools are no-fee schools. • Ensuring that South Africa is completely liberated from illiteracy by 2014. • Introduce a sustainable Early Childhood Education system that spans both public and private
sectors and gives children a head start on numeracy and literacy. The ANC government will also train and employ 15,000 trainers per annum and strengthen support for crèches and pre-schools in rural villages and urban centers
• Improve the quality of schooling, particularly performance in mathematics, science, and technology and language development. Measures will include provision of incentives for mathematics and science teachers.
• Promote the status of teachers, ensuring the employment of adequate numbers, and improving their remuneration and training, as an important part of our drive to ensure that quality teaching becomes the norm, rather than the exception. Together with the trade unions, we need to ensure that teachers are in school, in class, on time, teaching, that there is no abuse of learners and no neglect of duty.
• Increase graduate output in areas of skills shortages. This will include measures to streamline Sector Education and Training Authorities (SETAS) and other institutions to addressing existing and forecast skill shortages
• Embarking on the re-opening of teacher training colleges where appropriate. • Revive the role of state owned enterprises in skills development to support the economy. • Place Further Education and Training colleges at the centre of a popular drive to transfer skill to
the people
2011 MTEF Budget 08 March 2011 22
• Encourage students from working class and poor communities to go to tertiary institutions by reviewing and improving the National Student Financial Aid Scheme.
• Extending school feeding schemes to all poor primary and high schools • Strengthening the relationship between government and organised labour, at all levels of the
education system, to ensure that public sector workers play a central role in achieving of objectives of transforming and improving quality education.
Health: Improving the quality of health care is an integral part of implementing NHI for the achievement of access to healthcare for all. An independent quality improvement and accreditation body will be established to set the quality national standards in both the public and private sectors. The body will tasked with inspecting and sanctioning health facilities in line with professionally determined standards of health care, including staffing rations, management, etc. Furthermore the government has identified the following ten priorities for a major improvement in our health care system:
• Implement the national health insurance plan • Improve quality of health services • Overhaul management system • Improved human resource management • Physical infrastructure revitalization • Accelerate implementation of the HIV and AIDS and STI plans • Attaining better health for the population • Social mobilization for better health • Drug policy review • Research and development
The principles of NHI will include the following:
• NHI will be publicly funded and publicly administered and will provide the right of every South African with access to quality health care, which will be free at the point of delivery. People will have a choice of which service provider to use within a district.
• The social solidarity principle will be applied and those who are eligible to contribute will be required to do so, according to their ability to pay, but access to health care will not be according to payment
• Participation of private doctors working in other health facilities, in group practices and hospitals, will be encouraged to participate in NHI system
Other interventions include the following:
• Specifying staff targets for key health personnel needed over the next 5 years. • Increasing bursaries for health care professions; • Increasing the employment of community health workers, which will be linked to the
improvement of the district health system. • Improving working conditions and the provision of decent wages for health workers
Fight against crime and corruption
It was observed that the level of crime in this country is unacceptable. There is a need to overhaul the criminal justice system to ensure that crime and corruption is drastically reduced.
The government aims to pursue with the following objectives:
• Establish a new modernized, efficient and transformed criminal justice system to enhance the capacity for fighting and reducing crime in real terms. Government will review the functioning
2011 MTEF Budget 08 March 2011 23
of the police, the judiciary and the correctional services to achieve integration and coordination.
• Actively combat serious and violent crime by being tougher on criminals and organized syndicates. In this respect, we will increase the capacity of the SAPS through recruitment, rigorous training, better remuneration, equipping and increasing the capacity of especially the Detective Services, forensics, prosecution and judicial services;
• Establish and strengthen the new unit to fight organized crime. • Provide greater support for the SAPS, especially to combat the attacks on the members of the
SAPS, including through introducing legislative measures to protect law-enforcement officials in the execution of their duties.
• Combat violence and crimes against women and children by increasing the capacity of the criminal justice system to deal with such violence.
• Mobilize communities to participate in combating crime through establishing street committees and community courts, amongst others.
• Step up measures in the fight against corruption within society, the state and private sector, including measures to review the tendering system to ensure politicians do not tamper with the adjudication of tenders. Measures will also be taken to ensure transparent process of the tendering system as well as ensuring much stronger accountability of the public servants involved in tendering process.
Rural Development and Agrarian Reform The government is committed to a comprehensive rural development strategy linked to agrarian reform, which builds the potential for rural sustainable livelihoods, particularly for African women.
Economic development in the rural areas needs to go beyond land and agrarian reform. It must include affordable financing to promote economic development; support programmes and training in assisting co-operatives and small enterprises; public sector ventures; and strategies to develop appropriate industries including light manufacturing, handicrafts, services, tourism etc; This requires the putting in place of the necessary economic infrastructure including IT services, roads and rail.
Part of the government measures to support rural development includes infrastructure development to produce thriving rural economies and ensure sustainable development. The expansion of basic infrastructure, which includes roads, electricity, water connections and public toilet systems in rural areas, has become the central point of the leading government. The aim of the government is to ensure that by 2014, all rural schools and health facilities will have adequate basic infrastructure
Government will improve its support to the traditional leadership, so that it can fully implement the legislation on traditional leadership playing its appropriate role, with necessary public resources. The partnership between government and this institution will be strengthened to focus more directly on rural development and fighting poverty.
In terms of food security, the government aims to create an environment which ensures that there is adequate food available to all, now and in the future, and that hunger is eradicated. In the next five years, government will also introduce a “food for all” programme to procure and distribute basic foods at affordable prices to poor households and communities. Government will consider appropriate institutional approach to implement to this programme. Government will also expand access to food production schemes in rural and peri-urban areas to grow their own food with implements, tractors, fertilizers and pesticides.
2.1.2 Main Policy Decisions The main provincial strategic policy direction takes que from both the President State of Nation Address and from the Premier’s State of Provincial Address. The main provincial objectives for the next 5 years were spelled-out in the then Premier’s first State of the Province Address, delivered in May 2009 and from the recent Premier’s State of Provincial Address delivered on the 18 February 2011. These objectives were elaborated and they remain applicable for her term of the Office. Taking
2011 MTEF Budget 08 March 2011 24
from the previous President’s priorities that were announced in 2009 namely education, health, rural development and agrarian reform, fight against crime and creating decent work it was declared that the performance on all has been impeccable. In His recent address, the President pronounced on six priorities that can steer job creations namely; - Infrastructure development - Agriculture - Mining and Beneficiation - Manufacturing - Green economy and tourism All provincial departments should align their programmes with job creation imperatives. This will also be applicable to the local spheres of the government. The business sectors, labour and community constituencies must come to the party for the success of this initiative. Another key priority of the government for the 2011 is to finalize and adopt the beneficiation strategy to be become a government policy. Government must still continue to provide financial and non financial support to the small, medium and micro enterprises, small scale agriculture as well as cooperatives. The government has introduced a New Growth Path to guide work in achieving these goals and in the center is the creation of decent jobs which must be given the first priority. 2.1.3 Flowing from the State of the Nation Address, the Premier has supported the national priorities and pronounced achievements made by the province, to reflect on a few:
• Achieved an 8.2 percent increase in grade twelve learner pass rate and thus giving us a total of 75.7 percent
• Assisted one-hundred-and-ninety-four (194) emerging social service organizations to register as Non-Profit Organizations
• Created an anti poaching unit and ensured that rhinos are micro-chipped and an electronic tracking devise is installed on most Rhino horns
• Integrated environmental and biodiversity sensitivity layers of the province into the Provincial Spatial Development Framework. About six (6) local municipalities are already in the process of aligning theirs to the Framework.
• Distributed 1947 bicycles to 45 schools and also implemented scholar transport operations in four districts to provide mobility to rural learners
• Trained 620 farmers in the three District Municipalities as part of the Western Frontier Beef Beneficiation Programme.
• Upgraded roads D511 Brits to Thabazimbi and D96 Kalhoek to Mantsire. • Ensured that 239 health facilities implement Basic Ante Natal Care Strategy. 2.1.4 Province contribution to the National Priorities; Although the province supports the five (5) national priorities not much has been achieved in developing the rural development initiatives, however it is fundamental to strengthen the partnership with the stakeholders thus ensuring that rural landscape is transformed with speed. Other Major Policy Decisions of the Executive Council that have been publicly announced • The Province intends to introduce the no plan, no budget, use it or loose it principle to address
under-spending, encourage and enforce improvement in spending and commitment to service delivery.
• Need to ensure that supply chain management processes are reliable and accessible. • Province should commit itself to clean public administration and the eradication of corruption
and fraudulent. • The province will as part of the National roll out plan, implement the Administrative
Adjudication of Road Traffic Offences (AARTO) Act by March 2011. The implementation of the Act will have positive effects for the road offenders as it will promote quality, safety and
2011 MTEF Budget 08 March 2011 25
discipline on the roads. It will discourage road traffic contraventions and facilitate the adjudication of road traffic infringements using the new demerit points system.
• Disaster management plan has been developed and currently in the processes of deploying capable personnel and identify a central place for the physical infrastructure.
• Youth must use the multi-purpose centres and the Mmabana facilities optimally. It must be ensured that Mmabana return to its former constructive role, make strong links with other stars or products of Mmabana
• The Province aims are working towards the establishment of a Planning Commission. The Commission would coordinate the planning systems and ensure that performance is guided towards the goals as set. A capable Commissioner has already been appointed to centralise planning in the province.
Education Sector • Strive to eradicate all mud schools and provide decent shelter to all our learners, rid our
schools of gangsterism and drugs, provide learner transport to schools and ensure that the schools nutrition programmes run desirably.
• An amount of R17 million has been committed to reconstruct schools that were damaged as result of storms in the next financial year.
Health Sector • Government has gone in to a partnership with Impala Platinum, PPC and ARM in building and
renovating several schools in our province • To ensure maximization of revenue collection and ensuring that the revenue target is met a
Pay- Fine- On- Line strategy has been introduced • The mining sector is involved in the development of health infrastructure in the Province.
Anglo Platinum and Xstrata Mines have offered to build clinics for Sesfikile and Bethani communities. Sun City will also build a clinic for Lesetlheng community.
• Province is planning to build one of the biggest revitalization projects (the new Bophelong Psychiatric Hospital). This project will create temporary and permanent jobs and more details will be released in the next financial year.
• One way to improve on human resource challenge the province is planning to produce 1592 health professionals in the next five years.
• Expedite the construction of Brits Hospital with an estimated value of R475 million is due to be completed in June 2012. This hospital has already created approximately 180 jobs. Also forging ahead with the construction of Tlhabane Community Health Centre (CHC). The project is 95percent complete and due to be completed by the end of this financial year, 2010. The value of the project is R108 Million and has created approximately 102 jobs.
Roads Infrastructure and other Public Works Related Matters • The province is aiming to complete the construction of the ten roads that were suspended and
also built three more roads including the long awaited Tlakgameng road in the Dr. Ruth Segomotsi Mompati District. Construction of a road between Schweizer – Reneke and Wolmaranstad shall commence in the new financial year 2011. The Extended Public Works projects will include maintenance of road, filling of potholes, etc and R33 million has been set aside to support the efforts of municipalities to fix potholes and improve roads infrastructure.
• An amount of thirty million rands (R30 million) has been set aside to attend to the medium term challenges of the Mahikeng Airport. The government further intent to unveil a clear programme that will enable us to respond to the long term challenges of the airport revamping project.
• The Infrastructure projects, Mini Garona offices in Dr. Ruth Segomotsi Mompati District (Vryburg) need to be completed. The government is further planning to implement government building renovation programme which will cost R45 million.
• The maintenance of infrastructure is being given priority this year. • More attention will be given to the revamping of the capital city, Mahikeng, which shall include
improvement of the Parks and Recreational Facilities, renovation of the Old Historical
2011 MTEF Budget 08 March 2011 26
Schools, declaring war on potholes in the townships and improving tourist attraction areas. An additional R25million has been allocated for the revamping project. The project is set to create 5000 jobs.
• More focus will be on the implementation of the integrated transport strategy. The National Department of Rural Development and Land Reform and PPC Dwaalboom respectively have collaborated with government to construct the roads that connects Maatlametlo and Mokgalwaneng. An agreement was concluded with PPC, Limpopo province for the road that connects Dwaalboom and Limpopo Province. An amount of R75 million has been set aside for these road constructions.
Economic Sector • The provincial government has launched Iterele Job creation and contract development
initiatives with the aim to create 10 000 labour intensive jobs in the next financial year with priority given to youth, women and people living with disabilities.
• The government has identified the facilitation of access to business opportunities, financing, and provision of affordable infrastructure for SMMEs that have the to operate in Small Industries as a key priority to creating jobs. Twelve million rands (R12 million) have already been transferred to the relevant state entity to assist with SMME development. We also intend to spend R10 million rands on light industries and two million rands (R2 million) on car wash, sisal and wild silk projects.
• The province will implement the North West Water Provisioning and Management Plan, as a comprehensive plan, that will ensure that water supply to both industry and households is improved in a sustainable manner. Areas to be given attention are Setlagole, Dinokana and Hartbeespoortdam and the Dr Ruth Mompati District Municipality. The provincial government has set aside an amount of R50 million for water and sanitation projects to assists (seven) 7 municipalities.
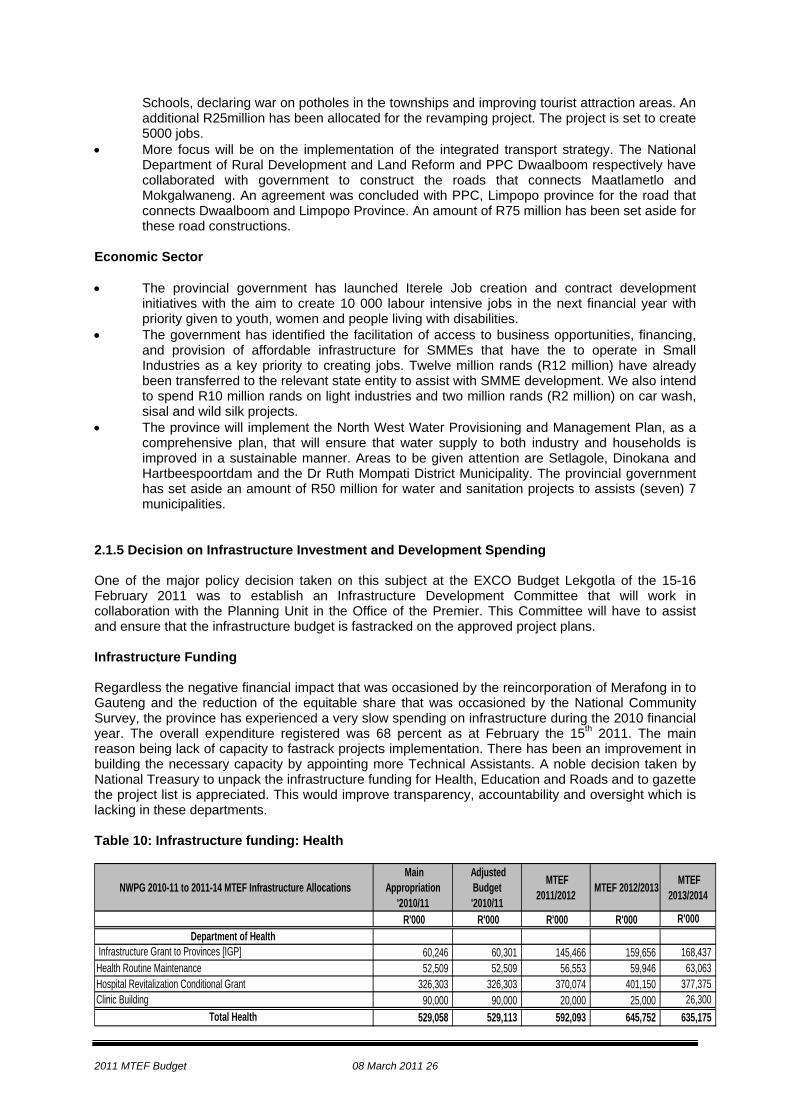
2.1.5 Decision on Infrastructure Investment and Development Spending One of the major policy decision taken on this subject at the EXCO Budget Lekgotla of the 15-16 February 2011 was to establish an Infrastructure Development Committee that will work in collaboration with the Planning Unit in the Office of the Premier. This Committee will have to assist and ensure that the infrastructure budget is fastracked on the approved project plans. Infrastructure Funding Regardless the negative financial impact that was occasioned by the reincorporation of Merafong in to Gauteng and the reduction of the equitable share that was occasioned by the National Community Survey, the province has experienced a very slow spending on infrastructure during the 2010 financial year. The overall expenditure registered was 68 percent as at February the 15th 2011. The main reason being lack of capacity to fastrack projects implementation. There has been an improvement in building the necessary capacity by appointing more Technical Assistants. A noble decision taken by National Treasury to unpack the infrastructure funding for Health, Education and Roads and to gazette the project list is appreciated. This would improve transparency, accountability and oversight which is lacking in these departments. Table 10: Infrastructure funding: Health
NWPG 2010-11 to 2011-14 MTEF Infrastructure Allocations Main
Appropriation '2010/11
Adjusted Budget '2010/11
MTEF 2011/2012 MTEF 2012/2013 MTEF
2013/2014
R'000 R'000 R'000 R'000 R'000Department of Health
Infrastructure Grant to Provinces [IGP] 60,246 60,301 145,466 159,656 168,437 Health Routine Maintenance 52,509 52,509 56,553 59,946 63,063 Hospital Revitalization Conditional Grant 326,303 326,303 370,074 401,150 377,375 Clinic Building 90,000 90,000 20,000 25,000 26,300
Total Health 529,058 529,113 592,093 645,752 635,175
2011 MTEF Budget 08 March 2011 27
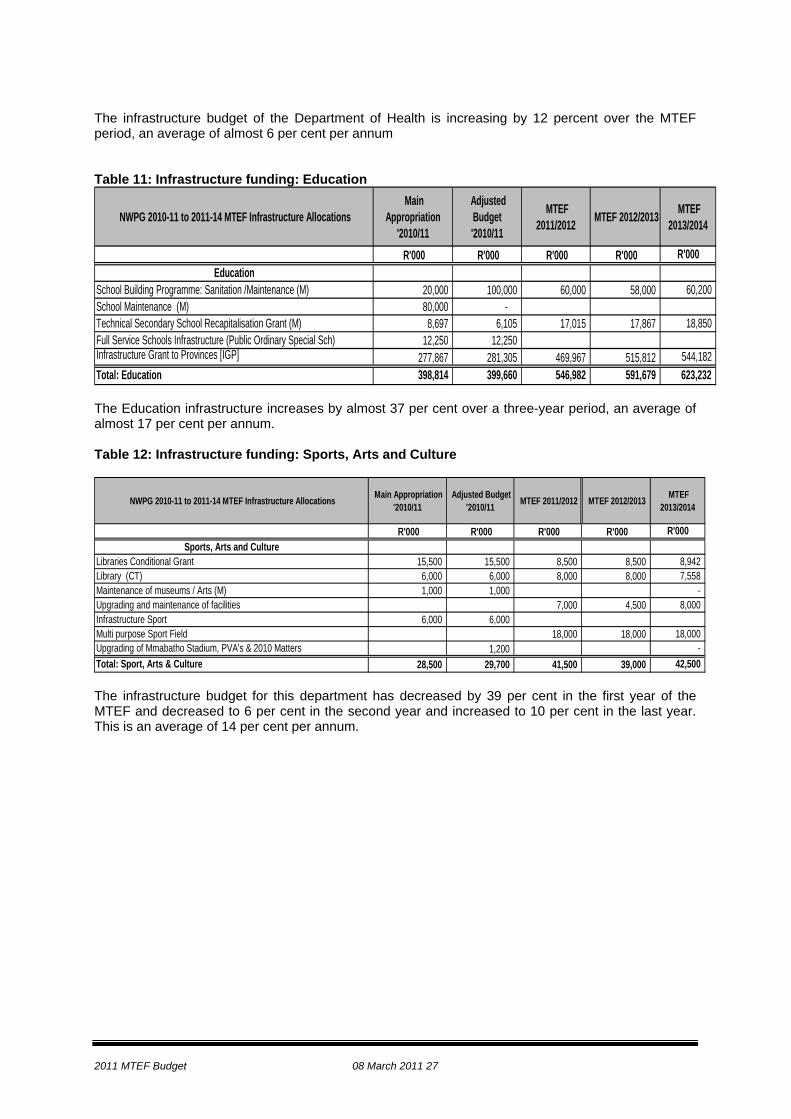
The infrastructure budget of the Department of Health is increasing by 12 percent over the MTEF period, an average of almost 6 per cent per annum Table 11: Infrastructure funding: Education
NWPG 2010-11 to 2011-14 MTEF Infrastructure Allocations Main
Appropriation '2010/11
Adjusted Budget '2010/11
MTEF 2011/2012 MTEF 2012/2013 MTEF
2013/2014
R'000 R'000 R'000 R'000 R'000Education
School Building Programme: Sanitation /Maintenance (M) 20,000 100,000 60,000 58,000 60,200 School Maintenance (M) 80,000 - Technical Secondary School Recapitalisation Grant (M) 8,697 6,105 17,015 17,867 18,850 Full Service Schools Infrastructure (Public Ordinary Special Sch) 12,250 12,250 Infrastructure Grant to Provinces [IGP] 277,867 281,305 469,967 515,812 544,182 Total: Education 398,814 399,660 546,982 591,679 623,232 The Education infrastructure increases by almost 37 per cent over a three-year period, an average of almost 17 per cent per annum. Table 12: Infrastructure funding: Sports, Arts and Culture
NWPG 2010-11 to 2011-14 MTEF Infrastructure Allocations Main Appropriation '2010/11
Adjusted Budget '2010/11 MTEF 2011/2012 MTEF 2012/2013 MTEF
2013/2014
R'000 R'000 R'000 R'000 R'000Sports, Arts and Culture
Libraries Conditional Grant 15,500 15,500 8,500 8,500 8,942 Library (CT) 6,000 6,000 8,000 8,000 7,558 Maintenance of museums / Arts (M) 1,000 1,000 - Upgrading and maintenance of facilities 7,000 4,500 8,000 Infrastructure Sport 6,000 6,000 Multi purpose Sport Field 18,000 18,000 18,000 Upgrading of Mmabatho Stadium, PVA's & 2010 Matters 1,200 - Total: Sport, Arts & Culture 28,500 29,700 41,500 39,000 42,500 The infrastructure budget for this department has decreased by 39 per cent in the first year of the MTEF and decreased to 6 per cent in the second year and increased to 10 per cent in the last year. This is an average of 14 per cent per annum.
2011 MTEF Budget 08 March 2011 28
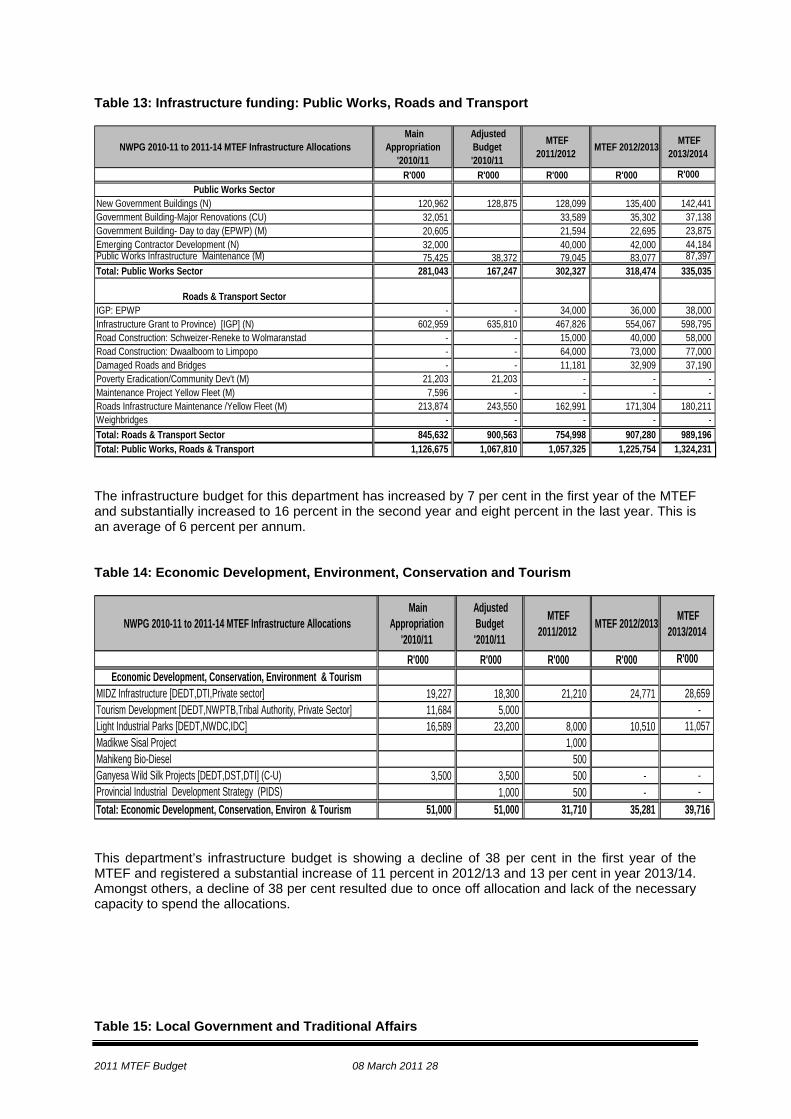
Table 13: Infrastructure funding: Public Works, Roads and Transport
NWPG 2010-11 to 2011-14 MTEF Infrastructure Allocations Main
Appropriation '2010/11
Adjusted Budget '2010/11
MTEF 2011/2012 MTEF 2012/2013 MTEF
2013/2014
R'000 R'000 R'000 R'000 R'000Public Works Sector
New Government Buildings (N) 120,962 128,875 128,099 135,400 142,441 Government Building-Major Renovations (CU) 32,051 33,589 35,302 37,138 Government Building- Day to day (EPWP) (M) 20,605 21,594 22,695 23,875 Emerging Contractor Development (N) 32,000 40,000 42,000 44,184 Public Works Infrastructure Maintenance (M) 75,425 38,372 79,045 83,077 87,397 Total: Public Works Sector 281,043 167,247 302,327 318,474 335,035
Roads & Transport SectorIGP: EPWP - - 34,000 36,000 38,000 Infrastructure Grant to Province) [IGP] (N) 602,959 635,810 467,826 554,067 598,795 Road Construction: Schweizer-Reneke to Wolmaranstad - - 15,000 40,000 58,000 Road Construction: Dwaalboom to Limpopo - - 64,000 73,000 77,000 Damaged Roads and Bridges - - 11,181 32,909 37,190 Poverty Eradication/Community Dev't (M) 21,203 21,203 - - - Maintenance Project Yellow Fleet (M) 7,596 - - - - Roads Infrastructure Maintenance /Yellow Fleet (M) 213,874 243,550 162,991 171,304 180,211 Weighbridges - - - - - Total: Roads & Transport Sector 845,632 900,563 754,998 907,280 989,196 Total: Public Works, Roads & Transport 1,126,675 1,067,810 1,057,325 1,225,754 1,324,231 The infrastructure budget for this department has increased by 7 per cent in the first year of the MTEF and substantially increased to 16 percent in the second year and eight percent in the last year. This is an average of 6 percent per annum. Table 14: Economic Development, Environment, Conservation and Tourism
NWPG 2010-11 to 2011-14 MTEF Infrastructure Allocations Main
Appropriation '2010/11
Adjusted Budget '2010/11
MTEF 2011/2012 MTEF 2012/2013 MTEF
2013/2014
R'000 R'000 R'000 R'000 R'000Economic Development, Conservation, Environment & Tourism
MIDZ Infrastructure [DEDT,DTI,Private sector] 19,227 18,300 21,210 24,771 28,659 Tourism Development [DEDT,NWPTB,Tribal Authority, Private Sector] 11,684 5,000 - Light Industrial Parks [DEDT,NWDC,IDC] 16,589 23,200 8,000 10,510 11,057 Madikwe Sisal Project 1,000 Mahikeng Bio-Diesel 500 Ganyesa Wild Silk Projects [DEDT,DST,DTI] (C-U) 3,500 3,500 500 - - Provincial Industrial Development Strategy (PIDS) 1,000 500 - - Total: Economic Development, Conservation, Environ & Tourism 51,000 51,000 31,710 35,281 39,716 This department’s infrastructure budget is showing a decline of 38 per cent in the first year of the MTEF and registered a substantial increase of 11 percent in 2012/13 and 13 per cent in year 2013/14. Amongst others, a decline of 38 per cent resulted due to once off allocation and lack of the necessary capacity to spend the allocations. Table 15: Local Government and Traditional Affairs
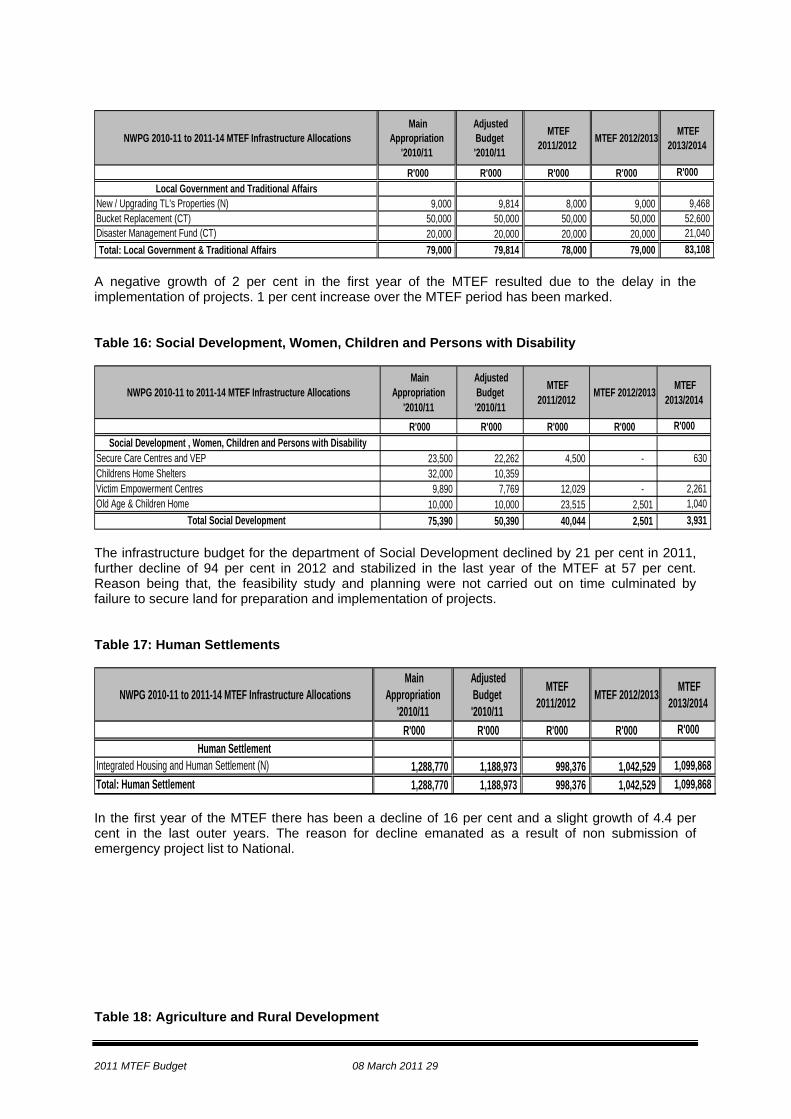
2011 MTEF Budget 08 March 2011 29
NWPG 2010-11 to 2011-14 MTEF Infrastructure Allocations Main
Appropriation '2010/11
Adjusted Budget '2010/11
MTEF 2011/2012 MTEF 2012/2013 MTEF
2013/2014
R'000 R'000 R'000 R'000 R'000Local Government and Traditional Affairs
New / Upgrading TL's Properties (N) 9,000 9,814 8,000 9,000 9,468 Bucket Replacement (CT) 50,000 50,000 50,000 50,000 52,600 Disaster Management Fund (CT) 20,000 20,000 20,000 20,000 21,040 Total: Local Government & Traditional Affairs 79,000 79,814 78,000 79,000 83,108
A negative growth of 2 per cent in the first year of the MTEF resulted due to the delay in the implementation of projects. 1 per cent increase over the MTEF period has been marked. Table 16: Social Development, Women, Children and Persons with Disability
NWPG 2010-11 to 2011-14 MTEF Infrastructure Allocations Main
Appropriation '2010/11
Adjusted Budget '2010/11
MTEF 2011/2012 MTEF 2012/2013 MTEF
2013/2014
R'000 R'000 R'000 R'000 R'000Social Development , Women, Children and Persons with Disability
Secure Care Centres and VEP 23,500 22,262 4,500 - 630 Childrens Home Shelters 32,000 10,359 Victim Empowerment Centres 9,890 7,769 12,029 - 2,261 Old Age & Children Home 10,000 10,000 23,515 2,501 1,040
Total Social Development 75,390 50,390 40,044 2,501 3,931 The infrastructure budget for the department of Social Development declined by 21 per cent in 2011, further decline of 94 per cent in 2012 and stabilized in the last year of the MTEF at 57 per cent. Reason being that, the feasibility study and planning were not carried out on time culminated by failure to secure land for preparation and implementation of projects. Table 17: Human Settlements
NWPG 2010-11 to 2011-14 MTEF Infrastructure Allocations Main
Appropriation '2010/11
Adjusted Budget '2010/11
MTEF 2011/2012 MTEF 2012/2013 MTEF
2013/2014
R'000 R'000 R'000 R'000 R'000Human Settlement
Integrated Housing and Human Settlement (N) 1,288,770 1,188,973 998,376 1,042,529 1,099,868 Total: Human Settlement 1,288,770 1,188,973 998,376 1,042,529 1,099,868 In the first year of the MTEF there has been a decline of 16 per cent and a slight growth of 4.4 per cent in the last outer years. The reason for decline emanated as a result of non submission of emergency project list to National. Table 18: Agriculture and Rural Development
2011 MTEF Budget 08 March 2011 30
NWPG 2010-11 to 2011-14 MTEF Infrastructure Allocations Main
Appropriation '2010/11
Adjusted Budget '2010/11
MTEF 2011/2012 MTEF 2012/2013 MTEF
2013/2014
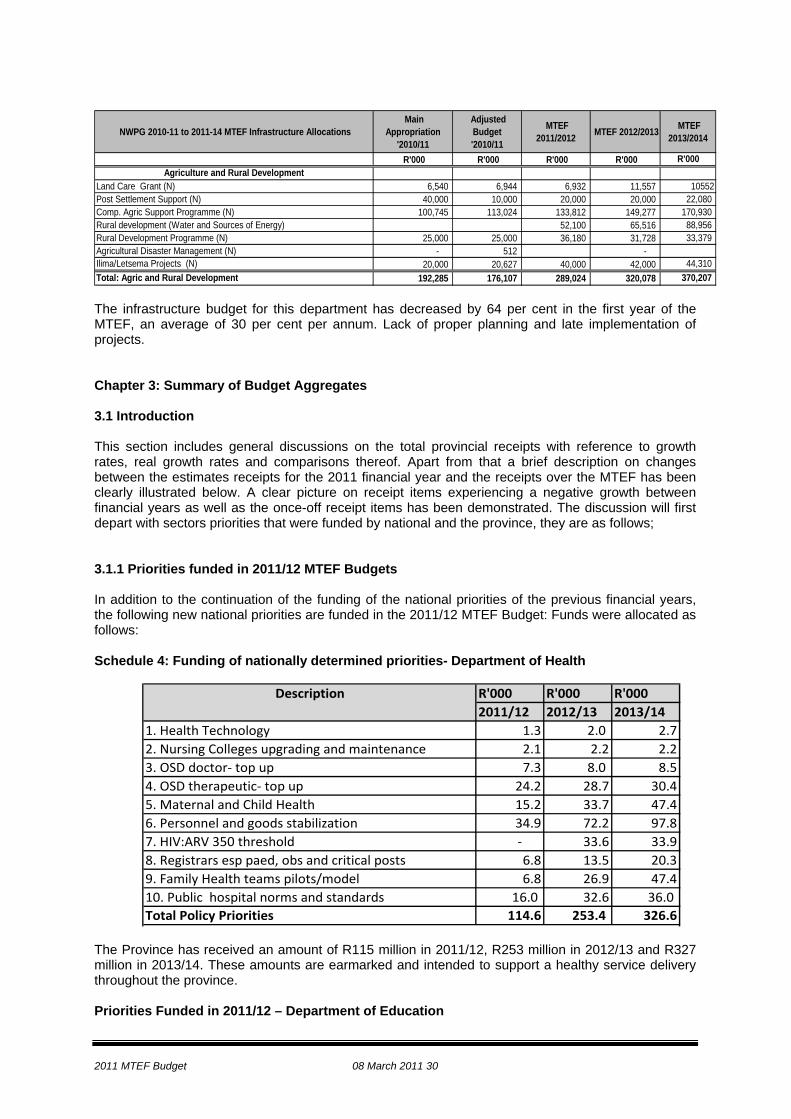
R'000 R'000 R'000 R'000 R'000Agriculture and Rural Development
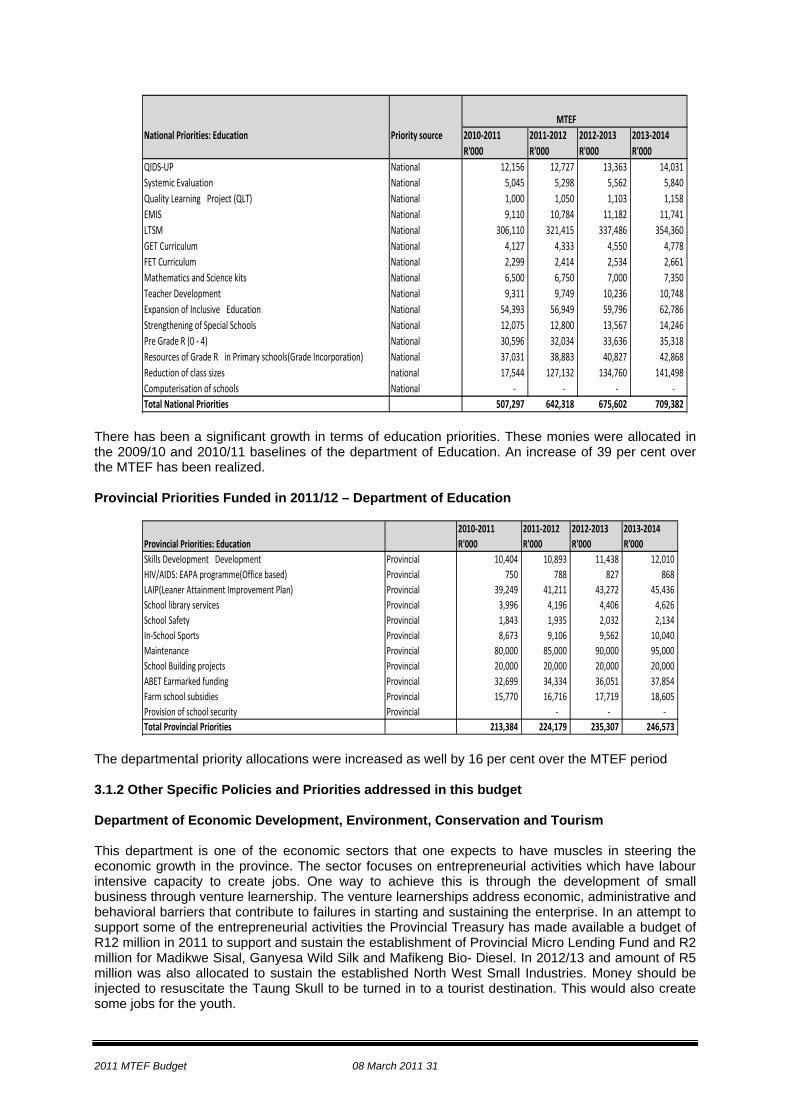
Land Care Grant (N) 6,540 6,944 6,932 11,557 10552Post Settlement Support (N) 40,000 10,000 20,000 20,000 22,080 Comp. Agric Support Programme (N) 100,745 113,024 133,812 149,277 170,930 Rural development (Water and Sources of Energy) 52,100 65,516 88,956 Rural Development Programme (N) 25,000 25,000 36,180 31,728 33,379 Agricultural Disaster Management (N) - 512 - Ilima/Letsema Projects (N) 20,000 20,627 40,000 42,000 44,310 Total: Agric and Rural Development 192,285 176,107 289,024 320,078 370,207 The infrastructure budget for this department has decreased by 64 per cent in the first year of the MTEF, an average of 30 per cent per annum. Lack of proper planning and late implementation of projects. Chapter 3: Summary of Budget Aggregates 3.1 Introduction This section includes general discussions on the total provincial receipts with reference to growth rates, real growth rates and comparisons thereof. Apart from that a brief description on changes between the estimates receipts for the 2011 financial year and the receipts over the MTEF has been clearly illustrated below. A clear picture on receipt items experiencing a negative growth between financial years as well as the once-off receipt items has been demonstrated. The discussion will first depart with sectors priorities that were funded by national and the province, they are as follows; 3.1.1 Priorities funded in 2011/12 MTEF Budgets In addition to the continuation of the funding of the national priorities of the previous financial years, the following new national priorities are funded in the 2011/12 MTEF Budget: Funds were allocated as follows: Schedule 4: Funding of nationally determined priorities- Department of Health
Description R'000 R'000 R'0002011/12 2012/13 2013/14
1. Health Technology 1.3 2.0 2.72. Nursing Colleges upgrading and maintenance 2.1 2.2 2.23. OSD doctor‐ top up 7.3 8.0 8.54. OSD therapeutic‐ top up 24.2 28.7 30.45. Maternal and Child Health 15.2 33.7 47.46. Personnel and goods stabilization 34.9 72.2 97.87. HIV:ARV 350 threshold ‐ 33.6 33.98. Registrars esp paed, obs and critical posts 6.8 13.5 20.39. Family Health teams pilots/model 6.8 26.9 47.410. Public hospital norms and standards 16.0 32.6 36.0 Total Policy Priorities 114.6 253.4 326.6
The Province has received an amount of R115 million in 2011/12, R253 million in 2012/13 and R327 million in 2013/14. These amounts are earmarked and intended to support a healthy service delivery throughout the province. Priorities Funded in 2011/12 – Department of Education
2011 MTEF Budget 08 March 2011 31
MTEFNational Priorities: Education Priority source 2010‐2011 2011‐2012 2012‐2013 2013‐2014
R'000 R'000 R'000 R'000QIDS‐UP National 12,156 12,727 13,363 14,031 Systemic Evaluation National 5,045 5,298 5,562 5,840 Quality Learning �Project (QLT) National 1,000 1,050 1,103 1,158 EMIS National 9,110 10,784 11,182 11,741 LTSM National 306,110 321,415 337,486 354,360 GET Curriculum National 4,127 4,333 4,550 4,778 FET Curriculum National 2,299 2,414 2,534 2,661 Mathematics and Science kits National 6,500 6,750 7,000 7,350 Teacher Development National 9,311 9,749 10,236 10,748 Expansion of Inclusive� Education National 54,393 56,949 59,796 62,786 Strengthening of Special Schools National 12,075 12,800 13,567 14,246 Pre Grade R (0 ‐ 4) National 30,596 32,034 33,636 35,318 Resources of Grade R� in Primary schools(Grade Incorporation) National 37,031 38,883 40,827 42,868 Reduction of class sizes national 17,544 127,132 134,760 141,498 Computerisation of schools National ‐ ‐ ‐ ‐ Total National Priorities 507,297 642,318 675,602 709,382
There has been a significant growth in terms of education priorities. These monies were allocated in the 2009/10 and 2010/11 baselines of the department of Education. An increase of 39 per cent over the MTEF has been realized. Provincial Priorities Funded in 2011/12 – Department of Education
2010‐2011 2011‐2012 2012‐2013 2013‐2014Provincial Priorities: Education R'000 R'000 R'000 R'000Skills Development� Development Provincial 10,404 10,893 11,438 12,010 HIV/AIDS: EAPA programme(Office based) Provincial 750 788 827 868 LAIP(Leaner Attainment Improvement Plan) Provincial 39,249 41,211 43,272 45,436 School library services Provincial 3,996 4,196 4,406 4,626 School Safety Provincial 1,843 1,935 2,032 2,134 In‐School Sports Provincial 8,673 9,106 9,562 10,040 Maintenance Provincial 80,000 85,000 90,000 95,000 School Building projects Provincial 20,000 20,000 20,000 20,000 ABET Earmarked funding Provincial 32,699 34,334 36,051 37,854 Farm school subsidies Provincial 15,770 16,716 17,719 18,605 Provision of school security Provincial ‐ ‐ ‐ Total Provincial Priorities 213,384 224,179 235,307 246,573
The departmental priority allocations were increased as well by 16 per cent over the MTEF period 3.1.2 Other Specific Policies and Priorities addressed in this budget Department of Economic Development, Environment, Conservation and Tourism This department is one of the economic sectors that one expects to have muscles in steering the economic growth in the province. The sector focuses on entrepreneurial activities which have labour intensive capacity to create jobs. One way to achieve this is through the development of small business through venture learnership. The venture learnerships address economic, administrative and behavioral barriers that contribute to failures in starting and sustaining the enterprise. In an attempt to support some of the entrepreneurial activities the Provincial Treasury has made available a budget of R12 million in 2011 to support and sustain the establishment of Provincial Micro Lending Fund and R2 million for Madikwe Sisal, Ganyesa Wild Silk and Mafikeng Bio- Diesel. In 2012/13 and amount of R5 million was also allocated to sustain the established North West Small Industries. Money should be injected to resuscitate the Taung Skull to be turned in to a tourist destination. This would also create some jobs for the youth.
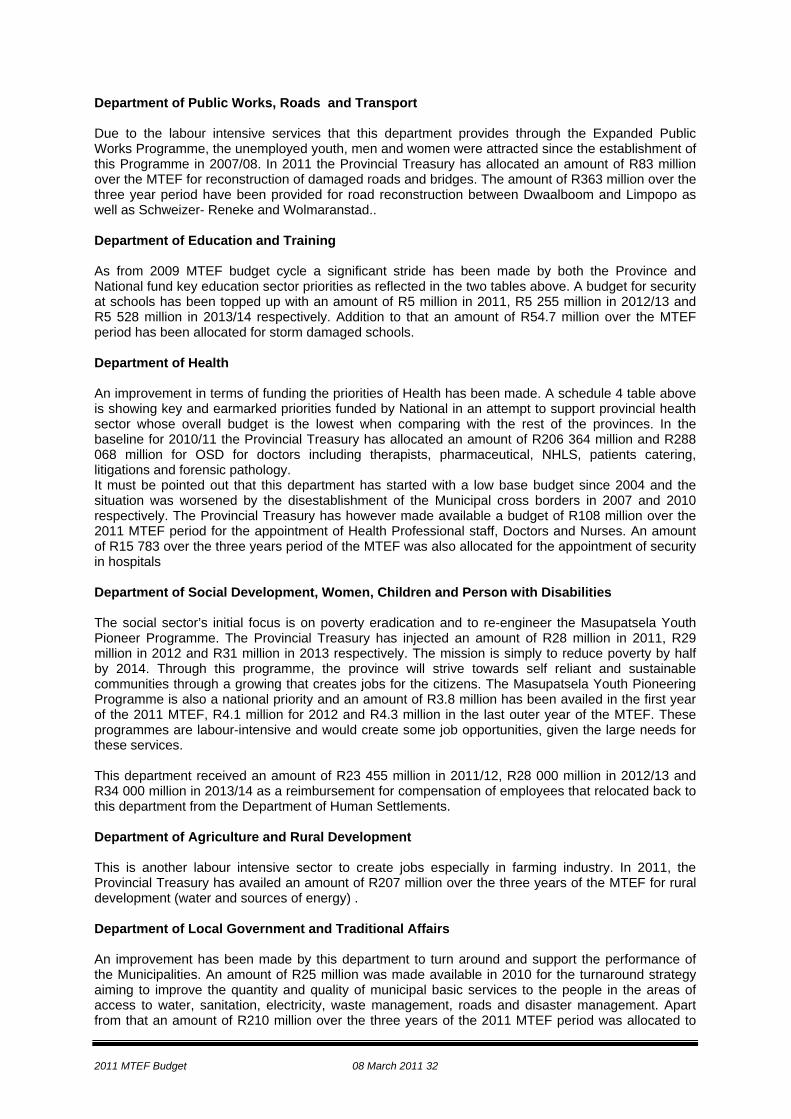
2011 MTEF Budget 08 March 2011 32
Department of Public Works, Roads and Transport Due to the labour intensive services that this department provides through the Expanded Public Works Programme, the unemployed youth, men and women were attracted since the establishment of this Programme in 2007/08. In 2011 the Provincial Treasury has allocated an amount of R83 million over the MTEF for reconstruction of damaged roads and bridges. The amount of R363 million over the three year period have been provided for road reconstruction between Dwaalboom and Limpopo as well as Schweizer- Reneke and Wolmaranstad.. Department of Education and Training As from 2009 MTEF budget cycle a significant stride has been made by both the Province and National fund key education sector priorities as reflected in the two tables above. A budget for security at schools has been topped up with an amount of R5 million in 2011, R5 255 million in 2012/13 and R5 528 million in 2013/14 respectively. Addition to that an amount of R54.7 million over the MTEF period has been allocated for storm damaged schools. Department of Health An improvement in terms of funding the priorities of Health has been made. A schedule 4 table above is showing key and earmarked priorities funded by National in an attempt to support provincial health sector whose overall budget is the lowest when comparing with the rest of the provinces. In the baseline for 2010/11 the Provincial Treasury has allocated an amount of R206 364 million and R288 068 million for OSD for doctors including therapists, pharmaceutical, NHLS, patients catering, litigations and forensic pathology. It must be pointed out that this department has started with a low base budget since 2004 and the situation was worsened by the disestablishment of the Municipal cross borders in 2007 and 2010 respectively. The Provincial Treasury has however made available a budget of R108 million over the 2011 MTEF period for the appointment of Health Professional staff, Doctors and Nurses. An amount of R15 783 over the three years period of the MTEF was also allocated for the appointment of security in hospitals Department of Social Development, Women, Children and Person with Disabilities The social sector’s initial focus is on poverty eradication and to re-engineer the Masupatsela Youth Pioneer Programme. The Provincial Treasury has injected an amount of R28 million in 2011, R29 million in 2012 and R31 million in 2013 respectively. The mission is simply to reduce poverty by half by 2014. Through this programme, the province will strive towards self reliant and sustainable communities through a growing that creates jobs for the citizens. The Masupatsela Youth Pioneering Programme is also a national priority and an amount of R3.8 million has been availed in the first year of the 2011 MTEF, R4.1 million for 2012 and R4.3 million in the last outer year of the MTEF. These programmes are labour-intensive and would create some job opportunities, given the large needs for these services. This department received an amount of R23 455 million in 2011/12, R28 000 million in 2012/13 and R34 000 million in 2013/14 as a reimbursement for compensation of employees that relocated back to this department from the Department of Human Settlements. Department of Agriculture and Rural Development This is another labour intensive sector to create jobs especially in farming industry. In 2011, the Provincial Treasury has availed an amount of R207 million over the three years of the MTEF for rural development (water and sources of energy) . Department of Local Government and Traditional Affairs An improvement has been made by this department to turn around and support the performance of the Municipalities. An amount of R25 million was made available in 2010 for the turnaround strategy aiming to improve the quantity and quality of municipal basic services to the people in the areas of access to water, sanitation, electricity, waste management, roads and disaster management. Apart from that an amount of R210 million over the three years of the 2011 MTEF period was allocated to
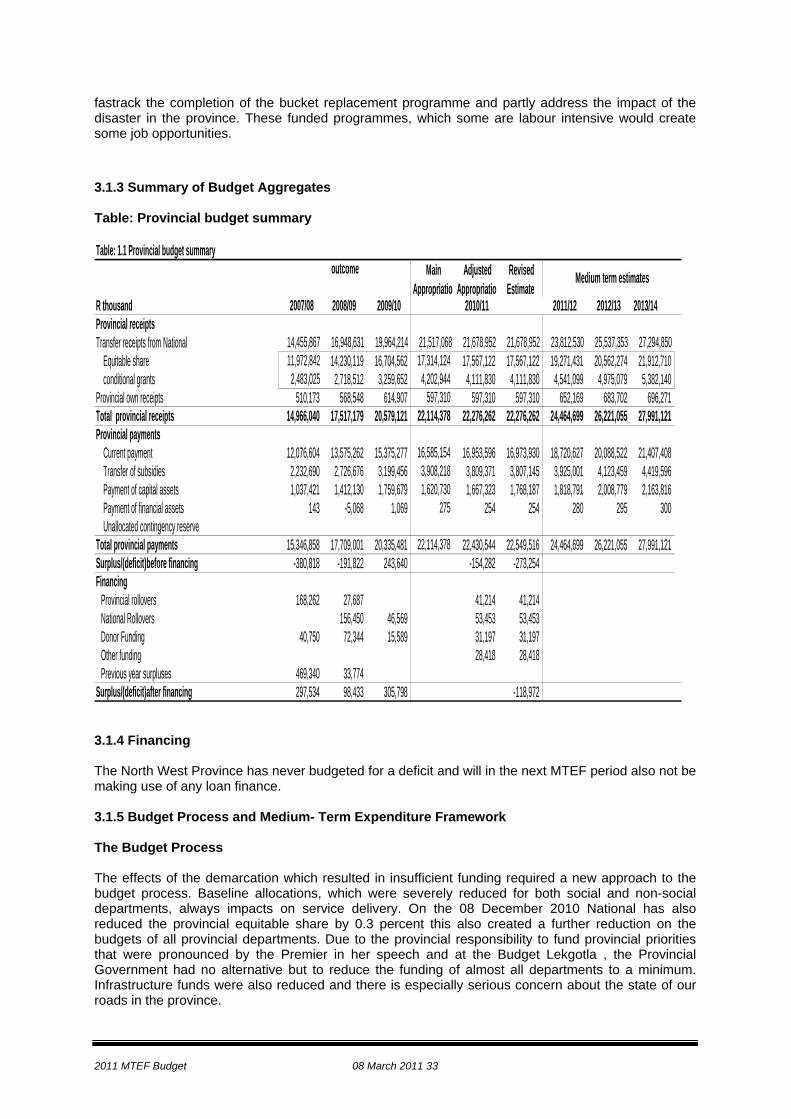
2011 MTEF Budget 08 March 2011 33
fastrack the completion of the bucket replacement programme and partly address the impact of the disaster in the province. These funded programmes, which some are labour intensive would create some job opportunities.
3.1.3 Summary of Budget Aggregates Table: Provincial budget summary Table: 1.1 Provincial budget summary
R thousand 2007/08 2008/09 2009/10 2010/11 2011/12 2012/13 2013/14Provincial receipts Transfer receipts from National 14,455,867 16,948,631 19,964,214 21,517,068 21,678,952 21,678,952 23,812,530 25,537,353 27,294,850 Equitable share 11,972,842 14,230,119 16,704,562 17,314,124 17,567,122 17,567,122 19,271,431 20,562,274 21,912,710 conditional grants 2,483,025 2,718,512 3,259,652 4,202,944 4,111,830 4,111,830 4,541,099 4,975,079 5,382,140 Provincial own receipts 510,173 568,548 614,907 597,310 597,310 597,310 652,169 683,702 696,271 Total provincial receipts 14,966,040 17,517,179 20,579,121 22,114,378 22,276,262 22,276,262 24,464,699 26,221,055 27,991,121 Provincial payments Current payment 12,076,604 13,575,262 15,375,277 16,585,154 16,953,596 16,973,930 18,720,627 20,088,522 21,407,408 Transfer of subsidies 2,232,690 2,726,676 3,199,456 3,908,218 3,809,371 3,807,145 3,925,001 4,123,459 4,419,596 Payment of capital assets 1,037,421 1,412,130 1,759,679 1,620,730 1,667,323 1,768,187 1,818,791 2,008,779 2,163,816 Payment of financial assets 143 -5,068 1,069 275 254 254 280 295 300 Unallocated contingency reserveTotal provincial payments 15,346,858 17,709,001 20,335,481 22,114,378 22,430,544 22,549,516 24,464,699 26,221,055 27,991,121 Surplus/(deficit)before financing -380,818 -191,822 243,640 -0 -154,282 -273,254 0 0 -0 Financing
Provincial rollovers 168,262 27,687 41,214 41,214 National Rollovers 156,450 46,569 53,453 53,453 Donor Funding 40,750 72,344 15,589 31,197 31,197 Other funding 28,418 28,418 Previous year surpluses 469,340 33,774
Surplus/(deficit)after financing 297,534 98,433 305,798 -0 -0 -118,972 0 0 -0
outcome Main Appropriatio
Adjusted Appropriatio
Revised Estimate
Medium term estimates
3.1.4 Financing The North West Province has never budgeted for a deficit and will in the next MTEF period also not be making use of any loan finance. 3.1.5 Budget Process and Medium- Term Expenditure Framework The Budget Process The effects of the demarcation which resulted in insufficient funding required a new approach to the budget process. Baseline allocations, which were severely reduced for both social and non-social departments, always impacts on service delivery. On the 08 December 2010 National has also reduced the provincial equitable share by 0.3 percent this also created a further reduction on the budgets of all provincial departments. Due to the provincial responsibility to fund provincial priorities that were pronounced by the Premier in her speech and at the Budget Lekgotla , the Provincial Government had no alternative but to reduce the funding of almost all departments to a minimum. Infrastructure funds were also reduced and there is especially serious concern about the state of our roads in the province.
2011 MTEF Budget 08 March 2011 34
The following process was followed: • The budget process kicked off with an EXCO Planning Lekgotla followed by draft budget
inputs from departments based on pre-benchmark allocations. • It was firstly important to ensure that stakeholders were aware of the challenges resulting from
insufficient funding. The provincial treasury met with EXCO, heads of departments and public entities as well as chief financial officers.
• The second step was for the provincial treasury to identify possible areas of cost reduction. After the groundwork has been completed, the provincial treasury had bilateral discussions with individual departments. During these discussions departments were afforded the opportunity to highlight their priorities and also to indicate the impact of the cost reduction measures.
• Met with the Portfolio Committee on Finance to discuss the proposed budget allocations • Final recommendations on the funding of the budget shortfall was submitted and discussed at
EXCO and the EXCO Budget Lekgotla. The severe reduction in funding to social departments especially Health will have an impact on service delivery. Serious budget pressures are expected during the year. The lack of sufficient funding is also impacting on social departments. Although the social departments were funded where possible, there are still serious risks involved in the 2011/12 Provincial Budget of which the following are the most important: • Funds for the purchase of pharmaceuticals are expected to be insufficient, especially for AIDS
patients. • Funds for laboratory services are, due to the “know your status campaign”, expected to be
insufficient. • The emergency services in the province are not on the required standard. • The Department of Education may still experience a shortfall in personnel expenditure. • Budget for Roads is insufficient • National Laboratory budget is inadequate 4. Receipts 4.1 Overall Position The annual growth rate in the province is expected to grow at 4.8 per cent in 2011/12 however the growth has been increased to 9 per cent due to the revised allocations on some of the conditional grants and infrastructure payments. However, under normal circumstances the growth is expected to increase by an annual average growth of 6 per cent Table 9: Summary of provincial receipts
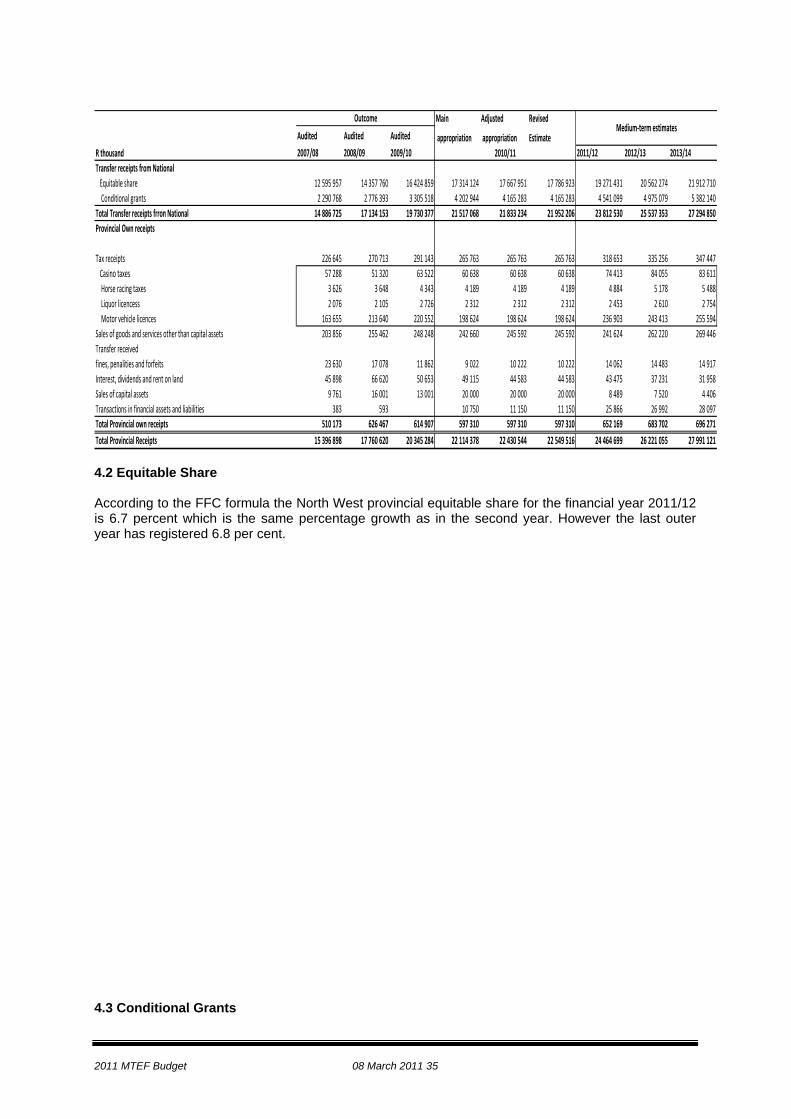
2011 MTEF Budget 08 March 2011 35
Main Adjusted Revised
Audited Audited Audited appropriation appropriation EstimateR thousand 2007/08 2008/09 2009/10 2011/12 2012/13 2013/14Transfer receipts from National Equitable share 12 595 957 14 357 760 16 424 859 17 314 124 17 667 951 17 786 923 19 271 431 20 562 274 21 912 710 Conditional grants 2 290 768 2 776 393 3 305 518 4 202 944 4 165 283 4 165 283 4 541 099 4 975 079 5 382 140Total Transfer receipts frron National 14 886 725 17 134 153 19 730 377 21 517 068 21 833 234 21 952 206 23 812 530 25 537 353 27 294 850Provincial Own receipts
Tax receipts 226 645 270 713 291 143 265 763 265 763 265 763 318 653 335 256 347 447 Casino taxes 57 288 51 320 63 522 60 638 60 638 60 638 74 413 84 055 83 611 Horse racing taxes 3 626 3 648 4 343 4 189 4 189 4 189 4 884 5 178 5 488 Liquor licencess 2 076 2 105 2 726 2 312 2 312 2 312 2 453 2 610 2 754 Motor vehicle licences 163 655 213 640 220 552 198 624 198 624 198 624 236 903 243 413 255 594Sales of goods and services other than capital assets 203 856 255 462 248 248 242 660 245 592 245 592 241 624 262 220 269 446Transfer received fines, penalities and forfeits 23 630 17 078 11 862 9 022 10 222 10 222 14 062 14 483 14 917Interest, dividends and rent on land 45 898 66 620 50 653 49 115 44 583 44 583 43 475 37 231 31 958Sales of capital assets 9 761 16 001 13 001 20 000 20 000 20 000 8 489 7 520 4 406Transactions in financial assets and liabilities 383 593 10 750 11 150 11 150 25 866 26 992 28 097Total Provincial own receipts 510 173 626 467 614 907 597 310 597 310 597 310 652 169 683 702 696 271
Total Provincial Receipts 15 396 898 17 760 620 20 345 284 22 114 378 22 430 544 22 549 516 24 464 699 26 221 055 27 991 121
2010/11
OutcomeMedium‐term estimates
4.2 Equitable Share According to the FFC formula the North West provincial equitable share for the financial year 2011/12 is 6.7 percent which is the same percentage growth as in the second year. However the last outer year has registered 6.8 per cent. 4.3 Conditional Grants
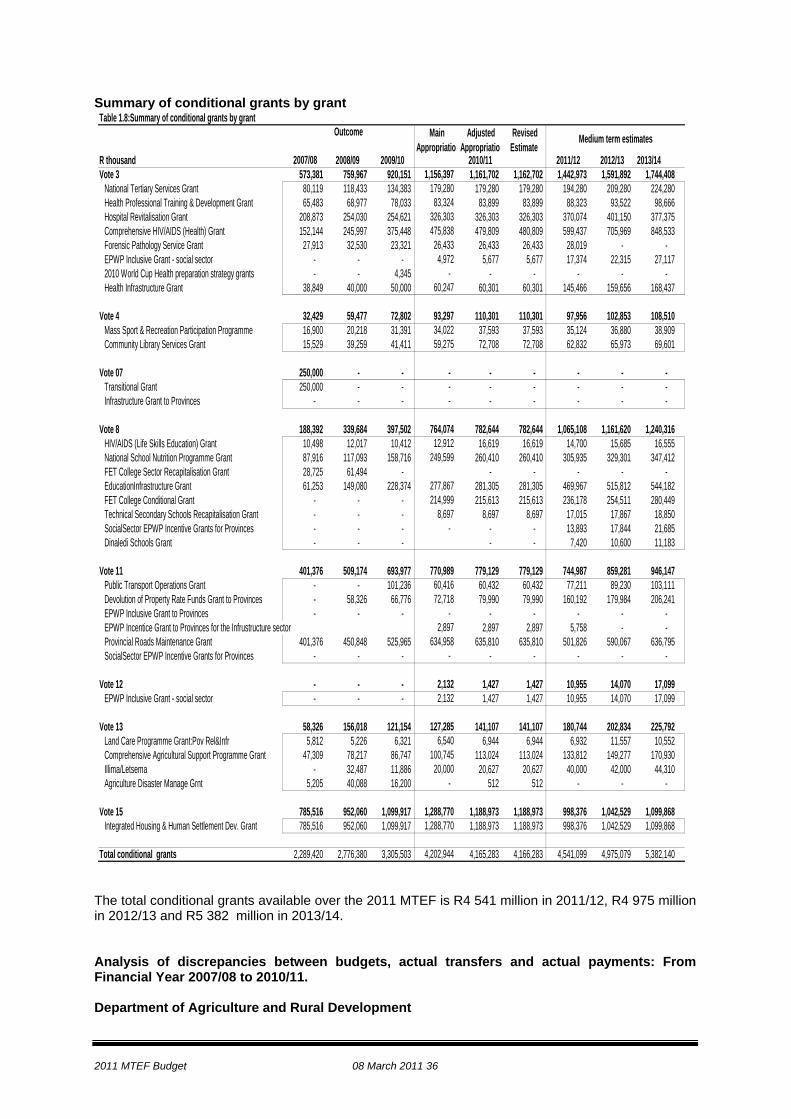
2011 MTEF Budget 08 March 2011 36
Summary of conditional grants by grant
Table 1.8:Summary of conditional grants by grant
R thousand 2007/08 2008/09 2009/10 2010/11 2011/12 2012/13 2013/14Vote 3 573,381 759,967 920,151 1,156,397 1,161,702 1,162,702 1,442,973 1,591,892 1,744,408
National Tertiary Services Grant 80,119 118,433 134,383 179,280 179,280 179,280 194,280 209,280 224,280 Health Professional Training & Development Grant 65,483 68,977 78,033 83,324 83,899 83,899 88,323 93,522 98,666 Hospital Revitalisation Grant 208,873 254,030 254,621 326,303 326,303 326,303 370,074 401,150 377,375 Comprehensive HIV/AIDS (Health) Grant 152,144 245,997 375,448 475,838 479,809 480,809 599,437 705,969 848,533 Forensic Pathology Service Grant 27,913 32,530 23,321 26,433 26,433 26,433 28,019 - - EPWP Inclusive Grant - social sector - - - 4,972 5,677 5,677 17,374 22,315 27,117 2010 World Cup Health preparation strategy grants - - 4,345 - - - - - - Health Infrastructure Grant 38,849 40,000 50,000 60,247 60,301 60,301 145,466 159,656 168,437
Vote 4 32,429 59,477 72,802 93,297 110,301 110,301 97,956 102,853 108,510 Mass Sport & Recreation Participation Programme 16,900 20,218 31,391 34,022 37,593 37,593 35,124 36,880 38,909 Community Library Services Grant 15,529 39,259 41,411 59,275 72,708 72,708 62,832 65,973 69,601
Vote 07 250,000 - - - - - - - - Transitional Grant 250,000 - - - - - - - - Infrastructure Grant to Provinces - - - - - - - - -
Vote 8 188,392 339,684 397,502 764,074 782,644 782,644 1,065,108 1,161,620 1,240,316 HIV/AIDS (Life Skills Education) Grant 10,498 12,017 10,412 12,912 16,619 16,619 14,700 15,685 16,555 National School Nutrition Programme Grant 87,916 117,093 158,716 249,599 260,410 260,410 305,935 329,301 347,412 FET College Sector Recapitalisation Grant 28,725 61,494 - - - - - - EducationInfrastructure Grant 61,253 149,080 228,374 277,867 281,305 281,305 469,967 515,812 544,182 FET College Conditional Grant - - - 214,999 215,613 215,613 236,178 254,511 280,449 Technical Secondary Schools Recapitalisation Grant - - - 8,697 8,697 8,697 17,015 17,867 18,850 SocialSector EPWP Incentive Grants for Provinces - - - - - - 13,893 17,844 21,685 Dinaledi Schools Grant - - - - - 7,420 10,600 11,183
Vote 11 401,376 509,174 693,977 770,989 779,129 779,129 744,987 859,281 946,147 Public Transport Operations Grant - - 101,236 60,416 60,432 60,432 77,211 89,230 103,111 Devolution of Property Rate Funds Grant to Provinces - 58,326 66,776 72,718 79,990 79,990 160,192 179,984 206,241 EPWP Inclusive Grant to Provinces - - - - - - - - - EPWP Incentice Grant to Provinces for the Infrustructure sector 2,897 2,897 2,897 5,758 - - Provincial Roads Maintenance Grant 401,376 450,848 525,965 634,958 635,810 635,810 501,826 590,067 636,795 SocialSector EPWP Incentive Grants for Provinces - - - - - - - - -
Vote 12 - - - 2,132 1,427 1,427 10,955 14,070 17,099 EPWP Inclusive Grant - social sector - - - 2,132 1,427 1,427 10,955 14,070 17,099
Vote 13 58,326 156,018 121,154 127,285 141,107 141,107 180,744 202,834 225,792 Land Care Programme Grant:Pov Rel&Infr 5,812 5,226 6,321 6,540 6,944 6,944 6,932 11,557 10,552 Comprehensive Agricultural Support Programme Grant 47,309 78,217 86,747 100,745 113,024 113,024 133,812 149,277 170,930 Illima/Letsema - 32,487 11,886 20,000 20,627 20,627 40,000 42,000 44,310 Agriculture Disaster Manage Grnt 5,205 40,088 16,200 - 512 512 - - -
Vote 15 785,516 952,060 1,099,917 1,288,770 1,188,973 1,188,973 998,376 1,042,529 1,099,868 Integrated Housing & Human Settlement Dev. Grant 785,516 952,060 1,099,917 1,288,770 1,188,973 1,188,973 998,376 1,042,529 1,099,868
Total conditional grants 2,289,420 2,776,380 3,305,503 4,202,944 4,165,283 4,166,283 4,541,099 4,975,079 5,382,140
Outcome Main Appropriatio
Adjusted Appropriatio
Revised Estimate
Medium term estimates
The total conditional grants available over the 2011 MTEF is R4 541 million in 2011/12, R4 975 million in 2012/13 and R5 382 million in 2013/14. Analysis of discrepancies between budgets, actual transfers and actual payments: From Financial Year 2007/08 to 2010/11. Department of Agriculture and Rural Development
2011 MTEF Budget 08 March 2011 37
In 2007/08 this department was allocated a total amount of R112 763 million for three conditional grants as reflected in the table above plus a rollover of R3 834 million. The department spent 50 percent of the total available budget of R116 597 million The poor spending pattern was worsen by the receipt of R55 million that only came late towards the end of the 2007/08 financial year. In 2008/09 the department received a total amount of R125 052 million plus a rollover of R58 265 million. All the monies were received as approved in the payment schedule. At the end of the 2008/09 financial year an amount of R156 029 million or 85 percent was spent from the total available budget of R183 317 million. For the financial year 2009/10 total grants received was R107 688 million plus a rollover of R27 288 million. The department spent R121 154 million which translated in to 90 percent, all funds were received. In the financial year 2010/11 the department received a total amount of R127 285 million plus a rollover of R13 822 million. The department spent R81 019 million which is 57 percent as at January 2011. Department of Education and Training In 2007/08 the department was allocated a total amount of R462 507 million being the budget for conditional grants. All earmarked grants were received as planned and the department spent R438 728 million or 95 percent of the allocated funds. In 2008/09 the department received a total amount of R349 280 million plus a rollover of R995 thousand for its conditional grants. All transfers were received and spending amounted to R339 684 million or 97 percent. For the financial year 2009/10 total grants received was R404 584 million plus a rollover of R9 671 million. The department spent an amount of R397, 219 million or 97 percent of the allocated conditional grants budget. During the financial year 2010/11 the department received a total amount of R764 074 million plus a rollover of R17 956 million. The department spent R539 467 million as at January 2011 which is 69 percent. Department of Health The department received a budget of R523 331 million for conditional grants during 2007/08 plus a rollover of R65 172 million totaling R588 503 million. The expenditure at the end of the financial year was R574 723 which translated in to 98 percent. In 2008/09 the department received a total budget amounted to R761 901 million including the rollover of R6 857 million of which R759 969 million was spent or 99.7 percent. During the financial year 2009/10 the total amount allocated to Health was R923 770 million including the rollover of R1, 932 million as well as R99 023 million provided to cover unforeseen and unavoidable expenditure. Actual spending was R920 111 million or 99.6 percent. For the financial year 2010/11 total grants received were R1 156 397 million plus a rollover of R3 601 million. As at January 2011 the department spent R967 439 million or 83 percent. Department of Human Settlements During 2007/08 the grant allocated to the department was R875 178 million which included the rollover of R3 372 million plus an additional amount R105 000 million. The end of that financial year
2011 MTEF Budget 08 March 2011 38
the department spent R785 516 million or 90 percent. All funds for this given year was received from the National Department. In 2008/09, the department received R896 102 million plus a rollover of R89 662 million. The National Department reduced the allocation by R52 million which was transferred to Northern Cape. The Adjustment Budget then equaled to R952 125 million and the amount spent at the end of the financial year was R952 060 million or 99.9 percent. During the financial year 2009/10, the department received R1 100 055 million plus a rollover of R65 thousand. All funds were received for the year under review and the spending amounted to R1 099 917 million or 99.9 percent. During the financial year 2010/11 total grant received was R1 288 770 million plus a rollover of R203 thousand. This amount was reduced by National with R100 million. As at January 2011 the expenditure incurred equaled R833 698 million or 70 percent of the allocated conditional grant. Department of Sport, Arts and Culture The total grant received in 2007/08 was R38 500 million with expenditure at the end of the year amounting to R32 536 million or 85 percent. In 2008/09, an amount of R64 643 million was allocated plus a rollover of R671 thousand. Funds were all received as approved and the department spent R59 477 million or 91 of the total available budget. During the financial year 2009/10, the department was allocated R83 968 million plus a rollover of R5 837 million. All transfers were received but the department incurred an expenditure of R72 801 million or 81 percent. For the financial year 2010/11 the total grants received were R93 297 million plus a rollover of R17 004. As at January 2011 the department has incurred expenditure of R57 790 million or 50 percent. Department of Public Works, Roads and Transport During 2007/08 an amount of R401 740 was allocated of which an amount of R401 377 was spent at the end of the financial year. In 2008/09, an amount of R510 030 million was allocated and all funds were received as approved in the payment schedule. The Department managed to spent an amount of R509 174 million that is 98 percent of the allocated funds. During the financial year 2009/10 the total amount for conditional grants equaled R702 375 million which included a rollover of R856.thousand as well as an additional amount of R60 million transferred during March 2010 to address the budget pressure on the public transport operation grant. An amount R7 192 million in respect of EPWP incentive Grant was not transferred to the province. Spending at the end of the Financial year was R694 million or 99 percent. In 2010/11 this department received an amount of R770 990 million plus a rollover of R867 thousand. As at January 2011 an amount of R583 516 million was spent or 75 percent. 4.4 Total provincial own receipts (own revenue) The estimate of provincial receipts for the 2011/12 MTEF is based on estimates and it might differ with the actual receipts as the year progresses. The provincial treasury is concerned about the collection of
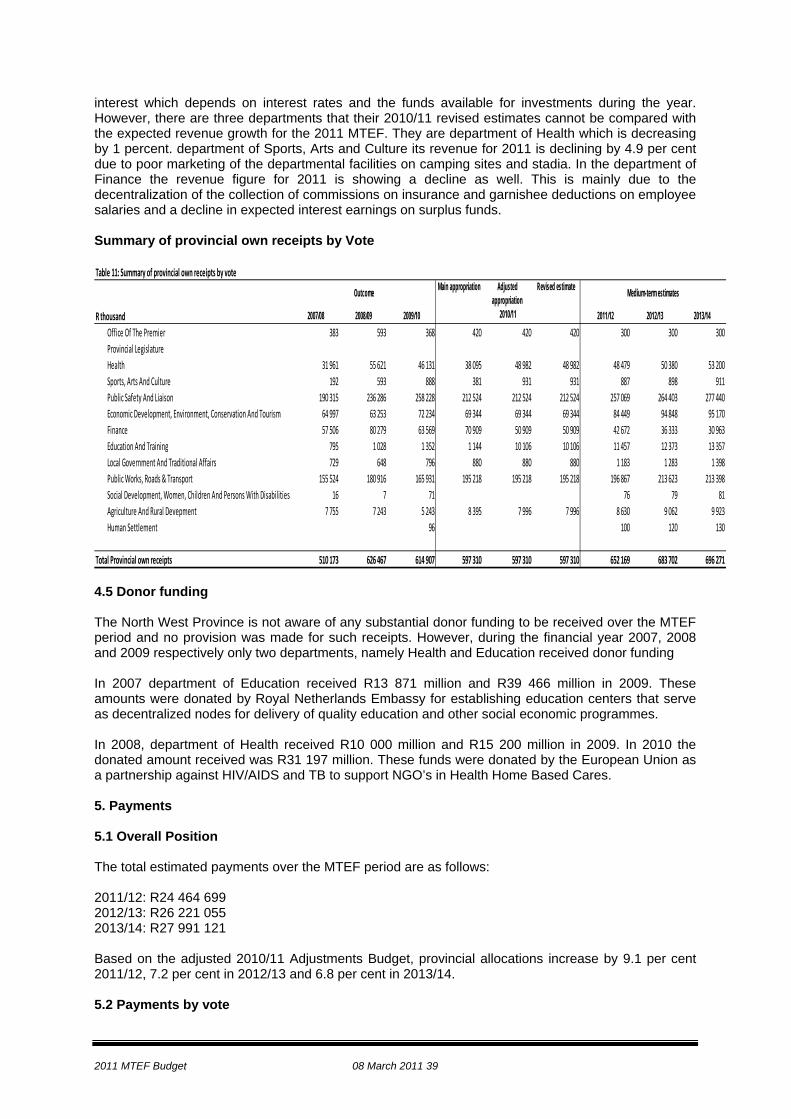
2011 MTEF Budget 08 March 2011 39
interest which depends on interest rates and the funds available for investments during the year. However, there are three departments that their 2010/11 revised estimates cannot be compared with the expected revenue growth for the 2011 MTEF. They are department of Health which is decreasing by 1 percent. department of Sports, Arts and Culture its revenue for 2011 is declining by 4.9 per cent due to poor marketing of the departmental facilities on camping sites and stadia. In the department of Finance the revenue figure for 2011 is showing a decline as well. This is mainly due to the decentralization of the collection of commissions on insurance and garnishee deductions on employee salaries and a decline in expected interest earnings on surplus funds. Summary of provincial own receipts by Vote Table 11: Summary of provincial own receipts by vote
Main appropriation Adjusted appropriation
Revised estimate
R thousand 2007/08 2008/09 2009/10 2010/11 2011/12 2012/13 2013/14Office Of The Premier 383 593 368 420 420 420 300 300 300Provincial Legislature Health 31 961 55 621 46 131 38 095 48 982 48 982 48 479 50 380 53 200Sports, Arts And Culture 192 593 888 381 931 931 887 898 911Public Safety And Liaison 190 315 236 286 258 228 212 524 212 524 212 524 257 069 264 403 277 440Economic Development, Environment, Conservation And Tourism 64 997 63 253 72 234 69 344 69 344 69 344 84 449 94 848 95 170Finance 57 506 80 279 63 569 70 909 50 909 50 909 42 672 36 333 30 963Education And Training 795 1 028 1 352 1 144 10 106 10 106 11 457 12 373 13 357Local Government And Traditional Affairs 729 648 796 880 880 880 1 183 1 283 1 398Public Works, Roads & Transport 155 524 180 916 165 931 195 218 195 218 195 218 196 867 213 623 213 398Social Development, Women, Children And Persons With Disabilities 16 7 71 76 79 81Agriculture And Rural Devepment 7 755 7 243 5 243 8 395 7 996 7 996 8 630 9 062 9 923Human Settlement 96 100 120 130
Total Provincial own receipts 510 173 626 467 614 907 597 310 597 310 597 310 652 169 683 702 696 271
Medium-term estimatesOutcome
4.5 Donor funding The North West Province is not aware of any substantial donor funding to be received over the MTEF period and no provision was made for such receipts. However, during the financial year 2007, 2008 and 2009 respectively only two departments, namely Health and Education received donor funding In 2007 department of Education received R13 871 million and R39 466 million in 2009. These amounts were donated by Royal Netherlands Embassy for establishing education centers that serve as decentralized nodes for delivery of quality education and other social economic programmes. In 2008, department of Health received R10 000 million and R15 200 million in 2009. In 2010 the donated amount received was R31 197 million. These funds were donated by the European Union as a partnership against HIV/AIDS and TB to support NGO’s in Health Home Based Cares. 5. Payments 5.1 Overall Position The total estimated payments over the MTEF period are as follows: 2011/12: R24 464 699 2012/13: R26 221 055 2013/14: R27 991 121 Based on the adjusted 2010/11 Adjustments Budget, provincial allocations increase by 9.1 per cent 2011/12, 7.2 per cent in 2012/13 and 6.8 per cent in 2013/14. 5.2 Payments by vote
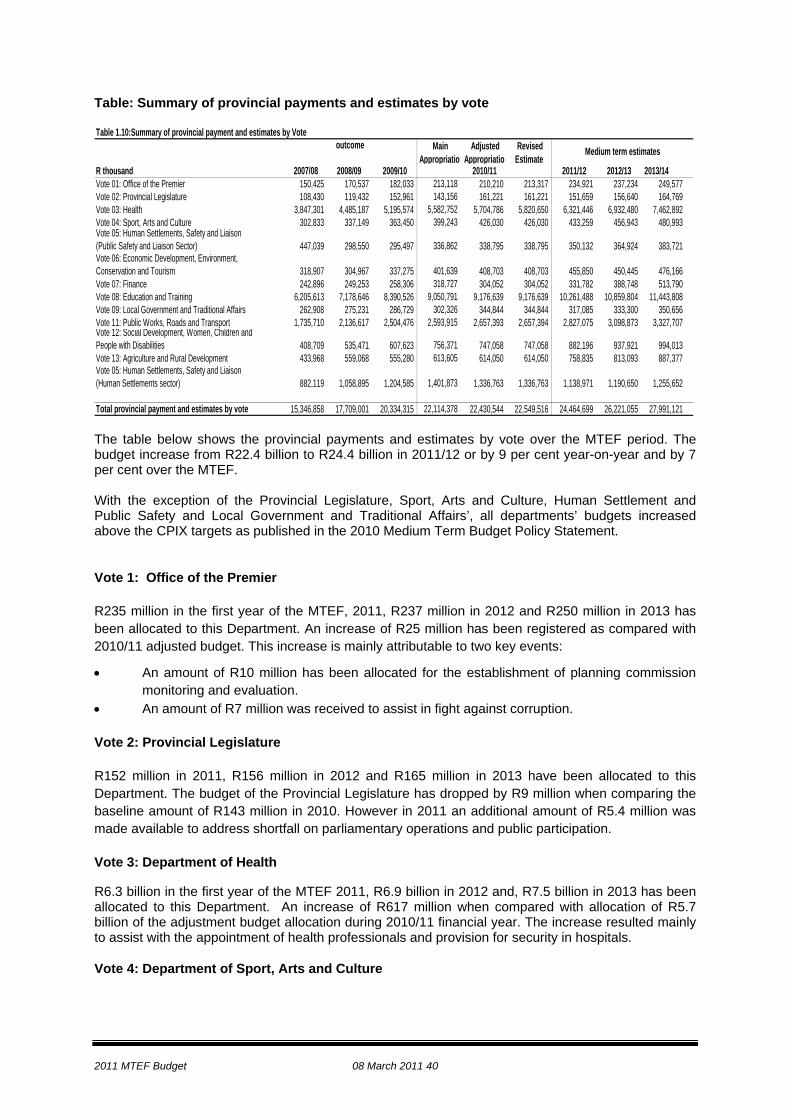
2011 MTEF Budget 08 March 2011 40
Table: Summary of provincial payments and estimates by vote Table 1.10:Summary of provincial payment and estimates by Vote
R thousand 2007/08 2008/09 2009/10 2010/11 2011/12 2012/13 2013/14Vote 01: Office of the Premier 150,425 170,537 182,033 213,118 210,210 213,317 234,921 237,234 249,577 Vote 02: Provincial Legislature 108,430 119,432 152,961 143,156 161,221 161,221 151,659 156,640 164,769 Vote 03: Health 3,847,301 4,485,187 5,195,574 5,582,752 5,704,786 5,820,650 6,321,446 6,932,480 7,462,892 Vote 04: Sport, Arts and Culture 302,833 337,149 363,450 399,243 426,030 426,030 433,259 456,943 480,993
447,039 298,550 295,497 336,862 338,795 338,795 350,132 364,924 383,721
318,907 304,967 337,275 401,639 408,703 408,703 455,850 450,445 476,166 Vote 07: Finance 242,896 249,253 258,306 318,727 304,052 304,052 331,782 388,748 513,790 Vote 08: Education and Training 6,205,613 7,178,646 8,390,526 9,050,791 9,176,639 9,176,639 10,261,488 10,859,804 11,443,808 Vote 09: Local Government and Traditional Affairs 262,908 275,231 286,729 302,326 344,844 344,844 317,085 333,300 350,656 Vote 11: Public Works, Roads and Transport 1,735,710 2,136,617 2,504,476 2,593,915 2,657,393 2,657,394 2,827,075 3,098,873 3,327,707
408,709 535,471 607,623 756,371 747,058 747,058 882,196 937,921 994,013 Vote 13: Agriculture and Rural Development 433,968 559,068 555,280 613,605 614,050 614,050 758,835 813,093 887,377
882,119 1,058,895 1,204,585 1,401,873 1,336,763 1,336,763 1,138,971 1,190,650 1,255,652
Total provincial payment and estimates by vote 15,346,858 17,709,001 20,334,315 22,114,378 22,430,544 22,549,516 24,464,699 26,221,055 27,991,121
Vote 05: Human Settlements, Safety and Liaison (Public Safety and Liaison Sector)
Vote 05: Human Settlements, Safety and Liaison (Human Settlements sector)
Vote 06: Economic Development, Environment, Conservation and Tourism
outcome Main Appropriatio
Adjusted Appropriatio
Revised Estimate
Medium term estimates
Vote 12: Social Development, Women, Children and People with Disabilities
The table below shows the provincial payments and estimates by vote over the MTEF period. The budget increase from R22.4 billion to R24.4 billion in 2011/12 or by 9 per cent year-on-year and by 7 per cent over the MTEF. With the exception of the Provincial Legislature, Sport, Arts and Culture, Human Settlement and Public Safety and Local Government and Traditional Affairs’, all departments’ budgets increased above the CPIX targets as published in the 2010 Medium Term Budget Policy Statement.
Vote 1: Office of the Premier
R235 million in the first year of the MTEF, 2011, R237 million in 2012 and R250 million in 2013 has been allocated to this Department. An increase of R25 million has been registered as compared with 2010/11 adjusted budget. This increase is mainly attributable to two key events:
• An amount of R10 million has been allocated for the establishment of planning commission monitoring and evaluation.
• An amount of R7 million was received to assist in fight against corruption.
Vote 2: Provincial Legislature
R152 million in 2011, R156 million in 2012 and R165 million in 2013 have been allocated to this Department. The budget of the Provincial Legislature has dropped by R9 million when comparing the baseline amount of R143 million in 2010. However in 2011 an additional amount of R5.4 million was made available to address shortfall on parliamentary operations and public participation.
Vote 3: Department of Health
R6.3 billion in the first year of the MTEF 2011, R6.9 billion in 2012 and, R7.5 billion in 2013 has been allocated to this Department. An increase of R617 million when compared with allocation of R5.7 billion of the adjustment budget allocation during 2010/11 financial year. The increase resulted mainly to assist with the appointment of health professionals and provision for security in hospitals.
Vote 4: Department of Sport, Arts and Culture
2011 MTEF Budget 08 March 2011 41
R433 million in 2011, R457 million in 2012 and R481million in 2013 has been allocated to this Department. Compared with the 2010 Adjustment budget the budget increased by R7 million to fund Mmabana plus an amount of R4.3 million for improvement in condition of service.
Vote 6: Department of Economic Development, Environment, Conservation and Tourism
R456 million in 2011, R450 million in 2012 and R476 million in 2012 has been allocated to this Department. Comparatively, an increase of R47 million has been registered in 2011. The reasons are mainly over the MTEF, R76 million for Gambling Board, SMME development, Light Industrial Projects and Provincial Growth Fund.
Vote 7: Department of Finance
R331 million in 2011, R389 million in 2012 and R514 million in 2013 has been allocated to this Department. An increase of R28 million when compared with the allocation of R304 million during the 2010 adjustment budgets. Key items driving this increase are an amount of R18 million for learnerships which must still be allocated to the provincial department during the cause of the year
Vote 8: Department of Education and Training
R10.3 billion in 2011, R10.9 billion in 2012 and R11.4 billion 2013 has been allocated to this Department. The department received additional allocation of R317 million for OSD in 2011. Addition to that the department received an amount of R5 million for security at schools.
Vote 9: Department of Local Government & Traditional Affairs
The amount of R317 million in 2011, R333 million in 2012, R351 million in 2013 has been allocated to this Department. Compared with the 2010 Adjustment Budgets the department’s budgets declined by R28 million as result of reprioritization and implementation of the Cost Reduction Policy Measures An amount of R4.3 million was made available for the improvement in condition of service.
Vote 10: Department of Public Works, Roads and Transport
R2.8 billion in 2011, R3.1 billion in 2012 and R3.3 billion in 2013 has been allocated to this Department. The budget is to be spent on the following key areas:
• Road construction to Dwaalboom and Limpopo and between Schweizer-Reneke and Wolmaranstad. An amount of R79 million has been allocated in this regard.
• Damaged roads and bridges received an allocation of R11 million • The department received an amount of R18 million for improvement in condition of service.
Vote 12: Department of Social Development, Women, Children and Person with Disabilities
R883 million in 2011, R938 million in 2012 and R994 million in 2013 has been allocated to this Department over the three years of the MTEF. The department has also received an amount of R23 million as a reimbursement for personnel related back to this department from Department Human Settlements plus improvement in condition of service and OSD for Social Workers to an amount of R20 million.
Vote 13: Department of Agriculture and Rural Development
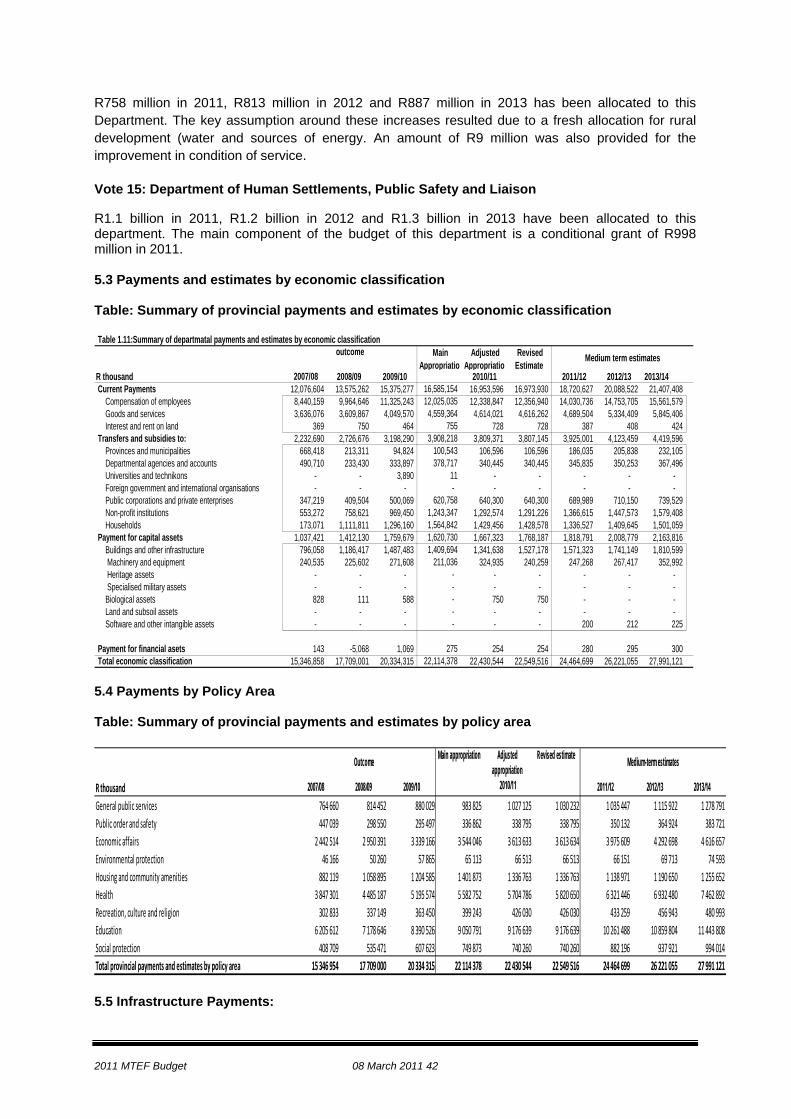
2011 MTEF Budget 08 March 2011 42
R758 million in 2011, R813 million in 2012 and R887 million in 2013 has been allocated to this Department. The key assumption around these increases resulted due to a fresh allocation for rural development (water and sources of energy. An amount of R9 million was also provided for the improvement in condition of service.
Vote 15: Department of Human Settlements, Public Safety and Liaison
R1.1 billion in 2011, R1.2 billion in 2012 and R1.3 billion in 2013 have been allocated to this department. The main component of the budget of this department is a conditional grant of R998 million in 2011. 5.3 Payments and estimates by economic classification Table: Summary of provincial payments and estimates by economic classification Table 1.11:Summary of departmatal payments and estimates by economic classification
R thousand 2007/08 2008/09 2009/10 2010/11 2011/12 2012/13 2013/14Current Payments 12,076,604 13,575,262 15,375,277 16,585,154 16,953,596 16,973,930 18,720,627 20,088,522 21,407,408 Compensation of employees 8,440,159 9,964,646 11,325,243 12,025,035 12,338,847 12,356,940 14,030,736 14,753,705 15,561,579 Goods and services 3,636,076 3,609,867 4,049,570 4,559,364 4,614,021 4,616,262 4,689,504 5,334,409 5,845,406 Interest and rent on land 369 750 464 755 728 728 387 408 424 Transfers and subsidies to: 2,232,690 2,726,676 3,198,290 3,908,218 3,809,371 3,807,145 3,925,001 4,123,459 4,419,596 Provinces and municipalities 668,418 213,311 94,824 100,543 106,596 106,596 186,035 205,838 232,105 Departmental agencies and accounts 490,710 233,430 333,897 378,717 340,445 340,445 345,835 350,253 367,496 Universities and technikons - - 3,890 11 - - - - - Foreign government and international organisations - - - - - - - - - Public corporations and private enterprises 347,219 409,504 500,069 620,758 640,300 640,300 689,989 710,150 739,529 Non-profit institutions 553,272 758,621 969,450 1,243,347 1,292,574 1,291,226 1,366,615 1,447,573 1,579,408 Households 173,071 1,111,811 1,296,160 1,564,842 1,429,456 1,428,578 1,336,527 1,409,645 1,501,059 Payment for capital assets 1,037,421 1,412,130 1,759,679 1,620,730 1,667,323 1,768,187 1,818,791 2,008,779 2,163,816 Buildings and other infrastructure 796,058 1,186,417 1,487,483 1,409,694 1,341,638 1,527,178 1,571,323 1,741,149 1,810,599 Machinery and equipment 240,535 225,602 271,608 211,036 324,935 240,259 247,268 267,417 352,992 Heritage assets - - - - - - - - - Specialised military assets - - - - - - - - - Biological assets 828 111 588 - 750 750 - - - Land and subsoil assets - - - - - - - - - Software and other intangible assets - - - - - - 200 212 225
Payment for financial asets 143 -5,068 1,069 275 254 254 280 295 300 Total economic classification 15,346,858 17,709,001 20,334,315 22,114,378 22,430,544 22,549,516 24,464,699 26,221,055 27,991,121
outcome Main Appropriatio
Adjusted Appropriatio
Revised Estimate
Medium term estimates
5.4 Payments by Policy Area Table: Summary of provincial payments and estimates by policy area
Main appropriation Adjusted appropriation
Revised estimate
R thousand 2007/08 2008/09 2009/10 2010/11 2011/12 2012/13 2013/14General public services 764 660 814 452 880 029 983 825 1 027 125 1 030 232 1 035 447 1 115 922 1 278 791Public order and safety 447 039 298 550 295 497 336 862 338 795 338 795 350 132 364 924 383 721Economic affairs 2 442 514 2 950 391 3 339 166 3 544 046 3 613 633 3 613 634 3 975 609 4 292 698 4 616 657Environmental protection 46 166 50 260 57 865 65 113 66 513 66 513 66 151 69 713 74 593Housing and community amenities 882 119 1 058 895 1 204 585 1 401 873 1 336 763 1 336 763 1 138 971 1 190 650 1 255 652Health 3 847 301 4 485 187 5 195 574 5 582 752 5 704 786 5 820 650 6 321 446 6 932 480 7 462 892Recreation, culture and religion 302 833 337 149 363 450 399 243 426 030 426 030 433 259 456 943 480 993Education 6 205 612 7 178 646 8 390 526 9 050 791 9 176 639 9 176 639 10 261 488 10 859 804 11 443 808Social protection 408 709 535 471 607 623 749 873 740 260 740 260 882 196 937 921 994 014Total provincial payments and estimates by policy area 15 346 954 17 709 000 20 334 315 22 114 378 22 430 544 22 549 516 24 464 699 26 221 055 27 991 121
Outcome Medium-term estimates
5.5 Infrastructure Payments:
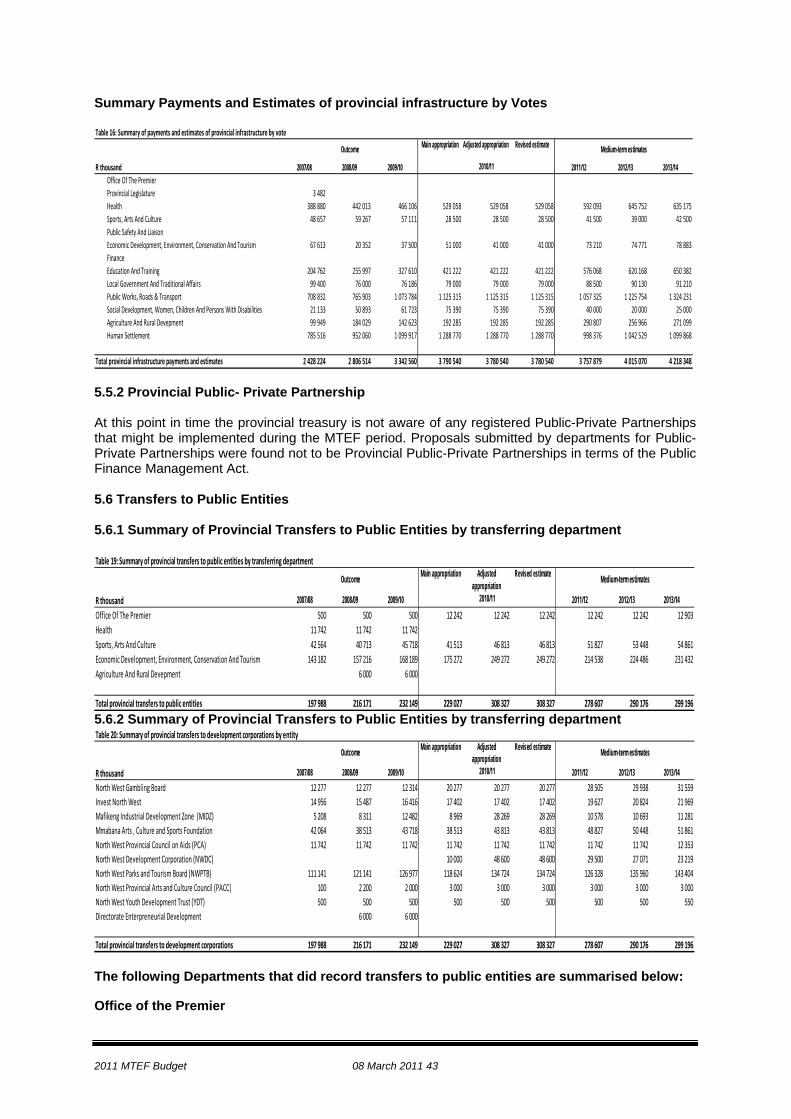
2011 MTEF Budget 08 March 2011 43
Summary Payments and Estimates of provincial infrastructure by Votes Table 16: Summary of payments and estimates of provincial infrastructure by vote
Main appropriation Adjusted appropriation Revised estimate
R thousand 2007/08 2008/09 2009/10 2010/11 2011/12 2012/13 2013/14Office Of The Premier Provincial Legislature 3 482 Health 388 880 442 013 466 106 529 058 529 058 529 058 592 093 645 752 635 175Sports, Arts And Culture 48 657 59 267 57 111 28 500 28 500 28 500 41 500 39 000 42 500Public Safety And Liaison Economic Development, Environment, Conservation And Tourism 67 613 20 352 37 500 51 000 41 000 41 000 73 210 74 771 78 883Finance Education And Training 204 762 255 997 327 610 421 222 421 222 421 222 576 068 620 168 650 382Local Government And Traditional Affairs 99 400 76 000 76 186 79 000 79 000 79 000 88 500 90 130 91 210Public Works, Roads & Transport 708 832 765 903 1 073 784 1 125 315 1 125 315 1 125 315 1 057 325 1 225 754 1 324 231Social Development, Women, Children And Persons With Disabilities 21 133 50 893 61 723 75 390 75 390 75 390 40 000 20 000 25 000Agriculture And Rural Devepment 99 949 184 029 142 623 192 285 192 285 192 285 290 807 256 966 271 099Human Settlement 785 516 952 060 1 099 917 1 288 770 1 288 770 1 288 770 998 376 1 042 529 1 099 868
Total provincial infrastructure payments and estimates 2 428 224 2 806 514 3 342 560 3 790 540 3 780 540 3 780 540 3 757 879 4 015 070 4 218 348
Outcome Medium-term estimates
5.5.2 Provincial Public- Private Partnership At this point in time the provincial treasury is not aware of any registered Public-Private Partnerships that might be implemented during the MTEF period. Proposals submitted by departments for Public-Private Partnerships were found not to be Provincial Public-Private Partnerships in terms of the Public Finance Management Act. 5.6 Transfers to Public Entities 5.6.1 Summary of Provincial Transfers to Public Entities by transferring department Table 19: Summary of provincial transfers to public entities by transferring department
Main appropriation Adjusted appropriation
Revised estimate
R thousand 2007/08 2008/09 2009/10 2010/11 2011/12 2012/13 2013/14Office Of The Premier 500 500 500 12 242 12 242 12 242 12 242 12 242 12 903Health 11 742 11 742 11 742Sports, Arts And Culture 42 564 40 713 45 718 41 513 46 813 46 813 51 827 53 448 54 861Economic Development, Environment, Conservation And Tourism 143 182 157 216 168 189 175 272 249 272 249 272 214 538 224 486 231 432Agriculture And Rural Devepment 6 000 6 000
Total provincial transfers to public entities 197 988 216 171 232 149 229 027 308 327 308 327 278 607 290 176 299 196
Outcome Medium-term estimates
5.6.2 Summary of Provincial Transfers to Public Entities by transferring department Table 20: Summary of provincial transfers to development corporations by entity
Main appropriation Adjusted appropriation
Revised estimate
R thousand 2007/08 2008/09 2009/10 2010/11 2011/12 2012/13 2013/14North West Gambling Board 12 277 12 277 12 314 20 277 20 277 20 277 28 505 29 938 31 559Invest North West 14 956 15 487 16 416 17 402 17 402 17 402 19 627 20 824 21 969Mafikeng Industrial Development Zone (MIDZ) 5 208 8 311 12 482 8 969 28 269 28 269 10 578 10 693 11 281Mmabana Arts , Culture and Sports Foundation 42 064 38 513 43 718 38 513 43 813 43 813 48 827 50 448 51 861North West Provincial Council on Aids (PCA) 11 742 11 742 11 742 11 742 11 742 11 742 11 742 11 742 12 353North West Development Corporation (NWDC) 10 000 48 600 48 600 29 500 27 071 23 219North West Parks and Tourism Board (NWPTB) 111 141 121 141 126 977 118 624 134 724 134 724 126 328 135 960 143 404North West Provincial Arts and Culture Council (PACC) 100 2 200 2 000 3 000 3 000 3 000 3 000 3 000 3 000North West Youth Development Trust (YDT) 500 500 500 500 500 500 500 500 550Directorate Enterpreneurial Development 6 000 6 000
Total provincial transfers to development corporations 197 988 216 171 232 149 229 027 308 327 308 327 278 607 290 176 299 196
Outcome Medium-term estimates
The following Departments that did record transfers to public entities are summarised below:
Office of the Premier
2011 MTEF Budget 08 March 2011 44
Youth Development Trust: Included in transfer payments is an amount of R500 000 to the schedule 3C public entity, Youth Development Trust. The Youth Development Trust is operating under Act No. 7 of 1997: North West Youth Development Trust Act, 1997. The main purpose for this entity is to assist in the promotion and development of the youth in the province to enable them to fully realize their own potential through the funding of their educational needs. The objectives of the Youth Development Trust are to: • Promote the economic, cultural and artistic skills, educational, health and physical development of
the youth. • Create an environment conducive for such development. • Support other organizations with the same objectives. • Support any other initiatives aiming at the development of youth The future and mandate of this entity is being reviewed. There is currently an interim Board but administrative functions are being performed by the Office of the Premier. Services will continue as normal until a decision is taken. Funds transferred to this entity have been unchanged over the past and for the coming MTEF period. Are Ageng: This entity operates as the provincial growth and development advisory forum and was established by the Executive Council during 1998. The provincial government contribute R790 000 towards the administration of the forum through an annual financial grant. Provincial Council on AIDS: Included in this departments transfer payment is an amount of R11 742 million in the first year of the MTEF, same allocation in the second year and R11 353 million in the last year of the MTEF. The Provincial Councils on Aids was previously located in the department of Health and has been transferred to the Office of the Premier with effect from 2010 financial year. It derives its mandate from the North West Provincial Council on Aids Act, Act no 5 of 2001 • PCA advises the government on HIV/AIDS/ STI’s and related matters. • Monitor and co-ordinate activities of the District and Local Aids Councils. • Monitor and Co ordinate implementation programmes and strategies of the provincial multi-
sectoral response to the epidemic • Provide overall guidance on the implementation of the National HIV/AIDS/STI’s strategic and
other related matters • Ensure periodic review of the Province’s HIV/AIDS/ STI’s strategic plan and other related matters • Mobilise resources for the implementation of HIV and AIDS programmes and strategies in the
province • Recommended appropriate research around HIV/AIDS Department of Sport, Arts & Culture
• Included in Transfer Payments are two public entities namely Mmabana Arts, Culture and Sports Foundation (MACSF) as well as the Provincial Arts and Culture Council (PACC). Mmabana Arts, Culture and Sports Foundation was established by Act no 7 of 2000. Their main purpose is to ensure the development of arts, culture and artistic disciplines within the North West Province. This Foundation has three fully-fledged centres in Mafikeng, Taung and Lehurutshe. It also functions as a Production House as well as an Academy of Arts. The artists present performances in music, dance, drama and dance sport and the same tuition is also offered at the Academy.
• Funding for Mmabana is R151 million over the MTEF • Funding for PACC is R9 million over the three years of the MTEF.
Department of Economic Development, Environment, Conservation and Tourism This department has five Public Entities as follows:
2011 MTEF Budget 08 March 2011 45
Invest North West:
The Public Entity amongst others aims at facilitating trade and investment, ensure sustainable economic development and BBBEE within the Provincial economy in pursuit of the objective of the PGDS. Apart from that they facilitate trade and fixed direct investment opportunities that create value for investors and jobs for the people of the North West Province. Funding allocated to this Public Entity is R62.4 million over the three years of the MTEF.
North West Parks and Tourism Board
This Public Entity aims at directing and developing the integration of tourism and nature conservation in a manner that uplifts the people of the province by creating value where the market would not intervene on its own. It was established by Act no 3 of 199. Funds allocated over the three of the MTEF is R406 million.
Mafikeng Industrial Development Zone
Amongst others, the role of the MIDZ is to prepare and submit the applications for a provisional Industrial Development Zone Operator Permit and when successful to operate the IDZ as part of the Provincial Growth and Development Strategy. This Entity has receives a transfer payment of R33 million over the three years of the MTEF.
North West Development Corporation
The NWDC role is to establish strategic partnership with both public and private sector institution in order to draw on their relevant expertise and resources for the benefit of the manufacturing, trade and SMME sectors throughout the province. Identify and initiate viable development projects in relevant industries within the province, align to the PGDS strategy. Facilitate access to business opportunities, financing and other resources to SMME’s in order to make them ready for 2011 and beyond. The establishment of this Public Entity is governed by Act no 6 of 1995. The entity received a budget of R79 million over the three years of the MTEF period.
Gambling Board
The Gambling Board has been established in terms of the North West Gambling Act 2 of 2001 as amended and the National Gambling Act of 2004. Their main role is to oversee gambling activities in the Province by providing effective and efficient regulatory services and maintaining a gambling industry that is socially responsible and free from illegal activities. The entity will receive a transfer payment of R90 million over the three years of the MTEF. Department of Agriculture and Rural Development The Directorate of Entrepreneurial Development (DED) was functioning under Act no 23 of 2003 and is called the North West Directorate of Entrepreneurial Development in Natural Resources Utilisation Act. This Entity is in the processes of winding down. The other Entity is the Housing Corporation and is also under the process of being wind down. 5.6.3 Transfers to Local Government Summary of Provincial Transfers to Local Government by Category
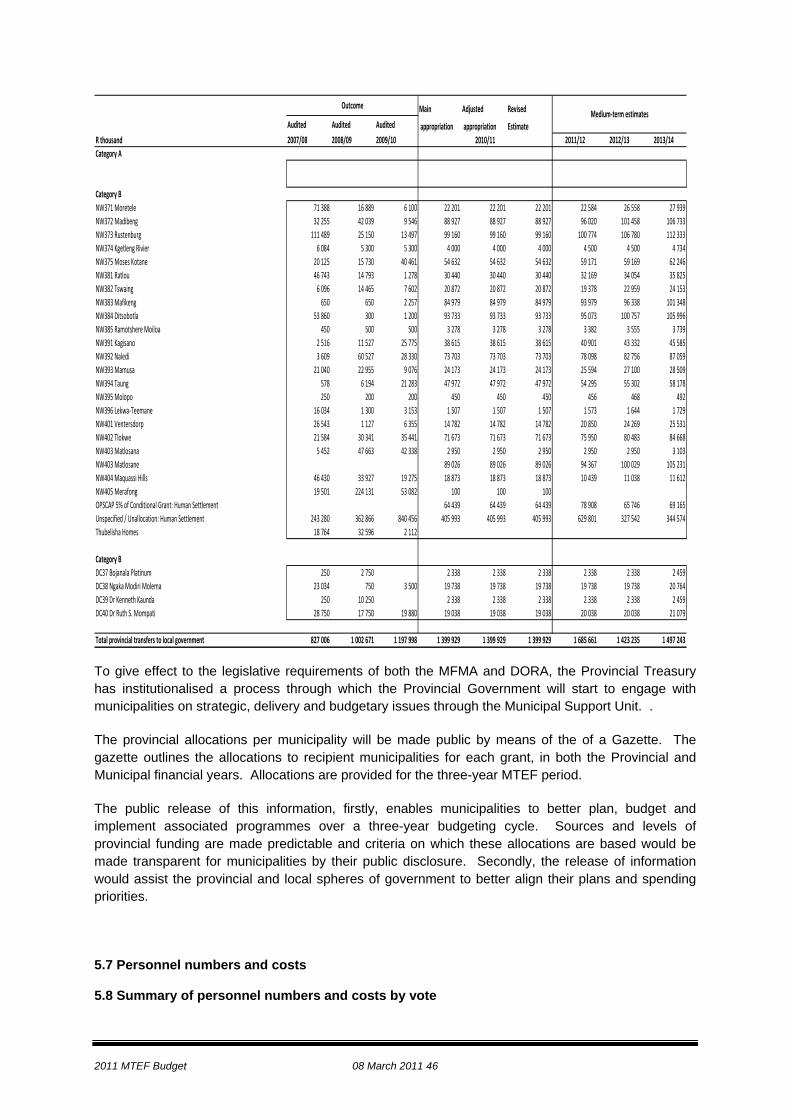
2011 MTEF Budget 08 March 2011 46
Main Adjusted Revised
Audited Audited Audited appropriation appropriation EstimateR thousand 2007/08 2008/09 2009/10 2011/12 2012/13 2013/14Category A
Category BNW371 Moretele 71 388 16 889 6 100 22 201 22 201 22 201 22 584 26 558 27 939NW372 Madibeng 32 255 42 039 9 546 88 927 88 927 88 927 96 020 101 458 106 733NW373 Rustenburg 111 489 25 150 13 497 99 160 99 160 99 160 100 774 106 780 112 333NW374 Kgetleng Rivier 6 084 5 300 5 300 4 000 4 000 4 000 4 500 4 500 4 734NW375 Moses Kotane 20 125 15 730 40 461 54 632 54 632 54 632 59 171 59 169 62 246NW381 Ratlou 46 743 14 793 1 278 30 440 30 440 30 440 32 169 34 054 35 825NW382 Tswaing 6 096 14 465 7 602 20 872 20 872 20 872 19 378 22 959 24 153NW383 Mafikeng 650 650 2 257 84 979 84 979 84 979 93 979 96 338 101 348NW384 Ditsobotla 53 860 300 1 200 93 733 93 733 93 733 95 073 100 757 105 996NW385 Ramotshere Moiloa 450 500 500 3 278 3 278 3 278 3 382 3 555 3 739NW391 Kagisano 2 516 11 527 25 775 38 615 38 615 38 615 40 901 43 332 45 585NW392 Naledi 3 609 60 527 28 330 73 703 73 703 73 703 78 098 82 756 87 059NW393 Mamusa 21 040 22 955 9 076 24 173 24 173 24 173 25 594 27 100 28 509NW394 Taung 578 6 194 21 283 47 972 47 972 47 972 54 295 55 302 58 178NW395 Molopo 250 200 200 450 450 450 456 468 492NW396 Lekwa‐Teemane 16 034 1 300 3 153 1 507 1 507 1 507 1 573 1 644 1 729NW401 Ventersdorp 26 543 1 127 6 355 14 782 14 782 14 782 20 850 24 269 25 531NW402 Tlokwe 21 584 30 341 35 441 71 673 71 673 71 673 75 950 80 483 84 668NW403 Matlosana 5 452 47 663 42 338 2 950 2 950 2 950 2 950 2 950 3 103NW403 Matlosane 89 026 89 026 89 026 94 367 100 029 105 231NW404 Maquassi Hills 46 430 33 927 19 275 18 873 18 873 18 873 10 439 11 038 11 612NW405 Merafong 19 501 224 131 53 082 100 100 100 OPSCAP 5% of Conditional Grant: Human Settlement 64 439 64 439 64 439 78 908 65 746 69 165Unspecified / Unallocation: Human Settlement 243 280 362 866 840 456 405 993 405 993 405 993 629 801 327 542 344 574Thubelisha Homes 18 764 32 596 2 112
Category B DC37 Bojanala Platinum 250 2 750 2 338 2 338 2 338 2 338 2 338 2 459DC38 Ngaka Modiri Molema 23 034 750 3 500 19 738 19 738 19 738 19 738 19 738 20 764DC39 Dr Kenneth Kaunda 250 10 250 2 338 2 338 2 338 2 338 2 338 2 459DC40 Dr Ruth S. Mompati 28 750 17 750 19 880 19 038 19 038 19 038 20 038 20 038 21 079
Total provincial transfers to local government 827 006 1 002 671 1 197 998 1 399 929 1 399 929 1 399 929 1 685 661 1 423 235 1 497 243
OutcomeMedium‐term estimates
2010/11
To give effect to the legislative requirements of both the MFMA and DORA, the Provincial Treasury has institutionalised a process through which the Provincial Government will start to engage with municipalities on strategic, delivery and budgetary issues through the Municipal Support Unit. .
The provincial allocations per municipality will be made public by means of the of a Gazette. The gazette outlines the allocations to recipient municipalities for each grant, in both the Provincial and Municipal financial years. Allocations are provided for the three-year MTEF period.
The public release of this information, firstly, enables municipalities to better plan, budget and implement associated programmes over a three-year budgeting cycle. Sources and levels of provincial funding are made predictable and criteria on which these allocations are based would be made transparent for municipalities by their public disclosure. Secondly, the release of information would assist the provincial and local spheres of government to better align their plans and spending priorities.
5.7 Personnel numbers and costs 5.8 Summary of personnel numbers and costs by vote
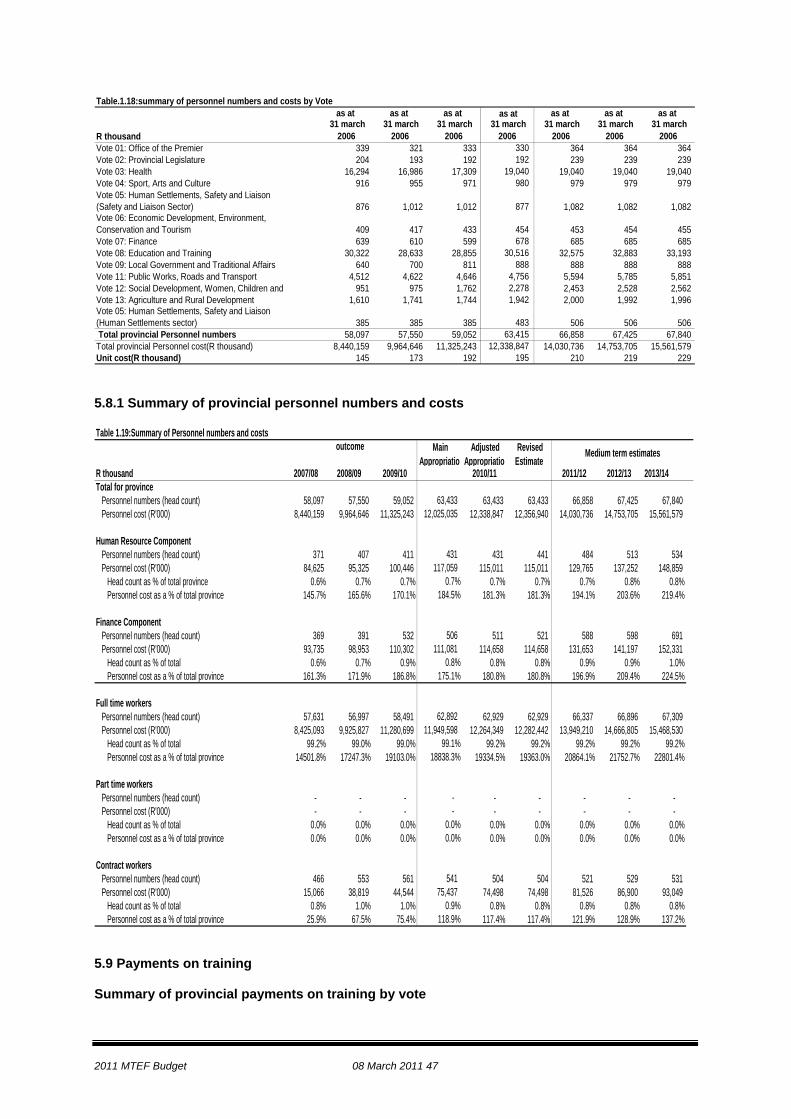
2011 MTEF Budget 08 March 2011 47
Table.1.18:summary of personnel numbers and costs by Voteas at as at as at as at as at as at as at
R thousand31 march
2006 31 march
2006 31 march
2006 31 march
2006 31 march
2006 31 march
2006 31 march
2006 Vote 01: Office of the Premier 339 321 333 330 364 364 364 Vote 02: Provincial Legislature 204 193 192 192 239 239 239 Vote 03: Health 16,294 16,986 17,309 19,040 19,040 19,040 19,040 Vote 04: Sport, Arts and Culture 916 955 971 980 979 979 979
876 1,012 1,012 877 1,082 1,082 1,082
409 417 433 454 453 454 455 Vote 07: Finance 639 610 599 678 685 685 685 Vote 08: Education and Training 30,322 28,633 28,855 30,516 32,575 32,883 33,193 Vote 09: Local Government and Traditional Affairs 640 700 811 888 888 888 888 Vote 11: Public Works, Roads and Transport 4,512 4,622 4,646 4,756 5,594 5,785 5,851
951 975 1,762 2,278 2,453 2,528 2,562 Vote 13: Agriculture and Rural Development 1,610 1,741 1,744 1,942 2,000 1,992 1,996
385 385 385 483 506 506 506 Total provincial Personnel numbers 58,097 57,550 59,052 63,415 66,858 67,425 67,840 Total provincial Personnel cost(R thousand) 8,440,159 9,964,646 11,325,243 12,338,847 14,030,736 14,753,705 15,561,579 Unit cost(R thousand) 145 173 192 195 210 219 229
Vote 05: Human Settlements, Safety and Liaison (Safety and Liaison Sector)Vote 06: Economic Development, Environment, Conservation and Tourism
Vote 05: Human Settlements, Safety and Liaison (Human Settlements sector)
Vote 12: Social Development, Women, Children and
5.8.1 Summary of provincial personnel numbers and costs Table 1.19:Summary of Personnel numbers and costs
R thousand 2007/08 2008/09 2009/10 2010/11 2011/12 2012/13 2013/14Total for province Personnel numbers (head count) 58,097 57,550 59,052 63,433 63,433 63,433 66,858 67,425 67,840 Personnel cost (R'000) 8,440,159 9,964,646 11,325,243 12,025,035 12,338,847 12,356,940 14,030,736 14,753,705 15,561,579
Human Resource Component Personnel numbers (head count) 371 407 411 431 431 441 484 513 534 Personnel cost (R'000) 84,625 95,325 100,446 117,059 115,011 115,011 129,765 137,252 148,859 Head count as % of total province 0.6% 0.7% 0.7% 0.7% 0.7% 0.7% 0.7% 0.8% 0.8% Personnel cost as a % of total province 145.7% 165.6% 170.1% 184.5% 181.3% 181.3% 194.1% 203.6% 219.4%
Finance Component Personnel numbers (head count) 369 391 532 506 511 521 588 598 691 Personnel cost (R'000) 93,735 98,953 110,302 111,081 114,658 114,658 131,653 141,197 152,331 Head count as % of total 0.6% 0.7% 0.9% 0.8% 0.8% 0.8% 0.9% 0.9% 1.0% Personnel cost as a % of total province 161.3% 171.9% 186.8% 175.1% 180.8% 180.8% 196.9% 209.4% 224.5%
Full time workers Personnel numbers (head count) 57,631 56,997 58,491 62,892 62,929 62,929 66,337 66,896 67,309 Personnel cost (R'000) 8,425,093 9,925,827 11,280,699 11,949,598 12,264,349 12,282,442 13,949,210 14,666,805 15,468,530 Head count as % of total 99.2% 99.0% 99.0% 99.1% 99.2% 99.2% 99.2% 99.2% 99.2% Personnel cost as a % of total province 14501.8% 17247.3% 19103.0% 18838.3% 19334.5% 19363.0% 20864.1% 21752.7% 22801.4%
Part time workers Personnel numbers (head count) - - - - - - - - - Personnel cost (R'000) - - - - - - - - - Head count as % of total 0.0% 0.0% 0.0% 0.0% 0.0% 0.0% 0.0% 0.0% 0.0% Personnel cost as a % of total province 0.0% 0.0% 0.0% 0.0% 0.0% 0.0% 0.0% 0.0% 0.0%
Contract workers Personnel numbers (head count) 466 553 561 541 504 504 521 529 531 Personnel cost (R'000) 15,066 38,819 44,544 75,437 74,498 74,498 81,526 86,900 93,049 Head count as % of total 0.8% 1.0% 1.0% 0.9% 0.8% 0.8% 0.8% 0.8% 0.8% Personnel cost as a % of total province 25.9% 67.5% 75.4% 118.9% 117.4% 117.4% 121.9% 128.9% 137.2%
outcome Main Appropriatio
Adjusted Appropriatio
Revised Estimate
Medium term estimates
5.9 Payments on training Summary of provincial payments on training by vote
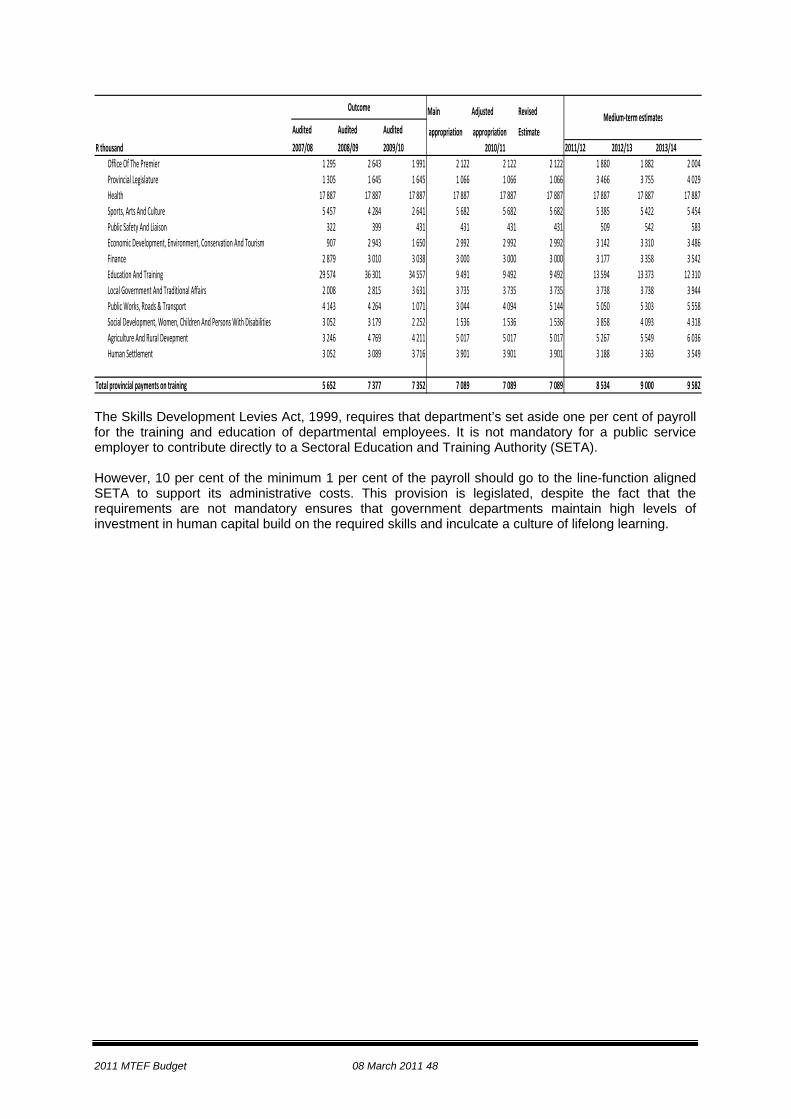
2011 MTEF Budget 08 March 2011 48
Main Adjusted Revised
Audited Audited Audited appropriation appropriation EstimateR thousand 2007/08 2008/09 2009/10 2011/12 2012/13 2013/14
Office Of The Premier 1 295 2 643 1 991 2 122 2 122 2 122 1 880 1 882 2 004Provincial Legislature 1 305 1 645 1 645 1 066 1 066 1 066 3 466 3 755 4 029Health 17 887 17 887 17 887 17 887 17 887 17 887 17 887 17 887 17 887Sports, Arts And Culture 5 457 4 284 2 641 5 682 5 682 5 682 5 385 5 422 5 454Public Safety And Liaison 322 399 431 431 431 431 509 542 583Economic Development, Environment, Conservation And Tourism 907 2 943 1 650 2 992 2 992 2 992 3 142 3 310 3 486Finance 2 879 3 010 3 038 3 000 3 000 3 000 3 177 3 358 3 542Education And Training 29 574 36 301 34 557 9 491 9 492 9 492 13 594 13 373 12 310Local Government And Traditional Affairs 2 008 2 815 3 631 3 735 3 735 3 735 3 738 3 738 3 944Public Works, Roads & Transport 4 143 4 264 1 071 3 044 4 094 5 144 5 050 5 303 5 558Social Development, Women, Children And Persons With Disabilities 3 052 3 179 2 252 1 536 1 536 1 536 3 858 4 093 4 318Agriculture And Rural Devepment 3 246 4 769 4 211 5 017 5 017 5 017 5 267 5 549 6 036Human Settlement 3 052 3 089 3 716 3 901 3 901 3 901 3 188 3 363 3 549
Total provincial payments on training 5 652 7 377 7 352 7 089 7 089 7 089 8 534 9 000 9 582
OutcomeMedium‐term estimates
2010/11
The Skills Development Levies Act, 1999, requires that department’s set aside one per cent of payroll for the training and education of departmental employees. It is not mandatory for a public service employer to contribute directly to a Sectoral Education and Training Authority (SETA). However, 10 per cent of the minimum 1 per cent of the payroll should go to the line-function aligned SETA to support its administrative costs. This provision is legislated, despite the fact that the requirements are not mandatory ensures that government departments maintain high levels of investment in human capital build on the required skills and inculcate a culture of lifelong learning.
2011 MTEF Budget 08 March 2011 49
Annexure to the Overview of Provincial Expenditure
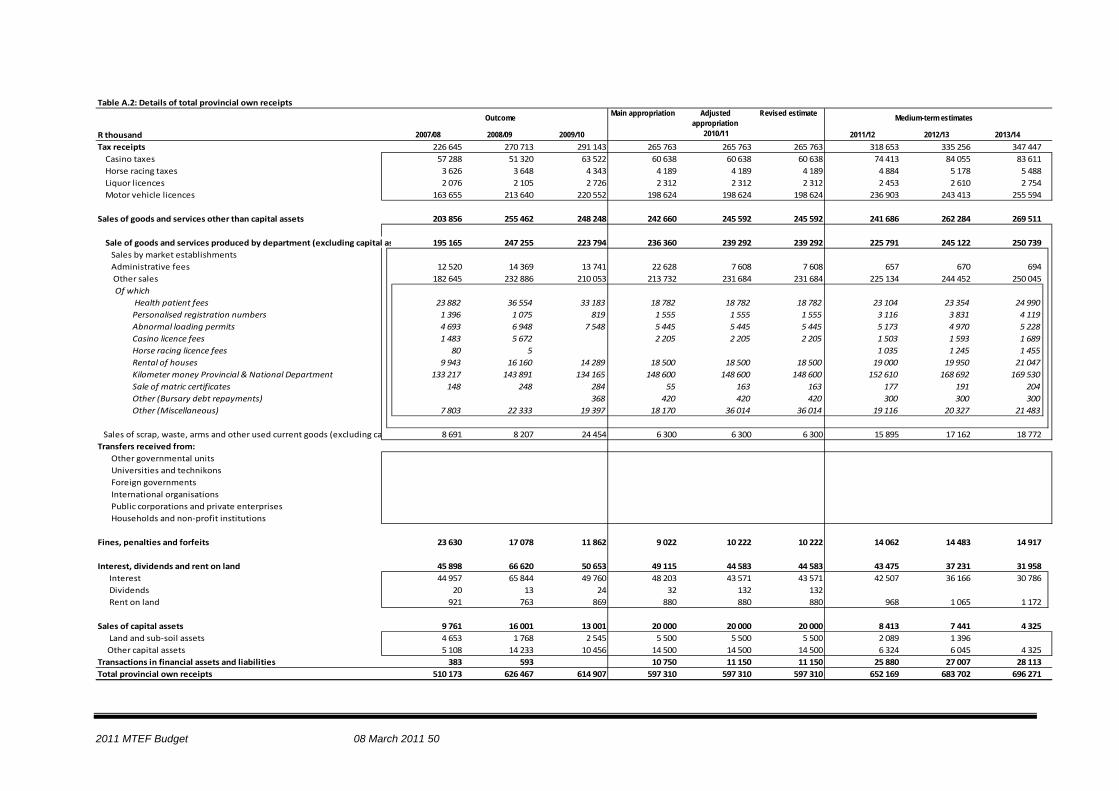
2011 MTEF Budget 08 March 2011 50
Table A.2: Details of total provincial own receiptsMain appropriation Adjusted
appropriationRevised estimate
R thousand 2007/08 2008/09 2009/10 2010/11 2011/12 2012/13 2013/14Tax receipts 226 645 270 713 291 143 265 763 265 763 265 763 318 653 335 256 347 447 Casino taxes 57 288 51 320 63 522 60 638 60 638 60 638 74 413 84 055 83 611 Horse racing taxes 3 626 3 648 4 343 4 189 4 189 4 189 4 884 5 178 5 488 Liquor licences 2 076 2 105 2 726 2 312 2 312 2 312 2 453 2 610 2 754 Motor vehicle licences 163 655 213 640 220 552 198 624 198 624 198 624 236 903 243 413 255 594
Sales of goods and services other than capital assets 203 856 255 462 248 248 242 660 245 592 245 592 241 686 262 284 269 511
Sale of goods and services produced by department (excluding capital as 195 165 247 255 223 794 236 360 239 292 239 292 225 791 245 122 250 739 Sales by market establishments Administrative fees 12 520 14 369 13 741 22 628 7 608 7 608 657 670 694 Other sales 182 645 232 886 210 053 213 732 231 684 231 684 225 134 244 452 250 045 Of which Health patient fees 23 882 36 554 33 183 18 782 18 782 18 782 23 104 23 354 24 990
Personalised registration numbers 1 396 1 075 819 1 555 1 555 1 555 3 116 3 831 4 119Abnormal loading permits 4 693 6 948 7 548 5 445 5 445 5 445 5 173 4 970 5 228Casino licence fees 1 483 5 672 2 205 2 205 2 205 1 503 1 593 1 689Horse racing licence fees 80 5 1 035 1 245 1 455Rental of houses 9 943 16 160 14 289 18 500 18 500 18 500 19 000 19 950 21 047Kilometer money Provincial & National Department 133 217 143 891 134 165 148 600 148 600 148 600 152 610 168 692 169 530Sale of matric certificates 148 248 284 55 163 163 177 191 204Other (Bursary debt repayments) 368 420 420 420 300 300 300Other (Miscellaneous) 7 803 22 333 19 397 18 170 36 014 36 014 19 116 20 327 21 483
Sales of scrap, waste, arms and other used current goods (excluding ca 8 691 8 207 24 454 6 300 6 300 6 300 15 895 17 162 18 772Transfers received from: Other governmental units Universities and technikons Foreign governments International organisations Public corporations and private enterprises Households and non‐profit institutions
Fines, penalties and forfeits 23 630 17 078 11 862 9 022 10 222 10 222 14 062 14 483 14 917
Interest, dividends and rent on land 45 898 66 620 50 653 49 115 44 583 44 583 43 475 37 231 31 958 Interest 44 957 65 844 49 760 48 203 43 571 43 571 42 507 36 166 30 786 Dividends 20 13 24 32 132 132 Rent on land 921 763 869 880 880 880 968 1 065 1 172
Sales of capital assets 9 761 16 001 13 001 20 000 20 000 20 000 8 413 7 441 4 325 Land and sub‐soil assets 4 653 1 768 2 545 5 500 5 500 5 500 2 089 1 396 Other capital assets 5 108 14 233 10 456 14 500 14 500 14 500 6 324 6 045 4 325Transactions in financial assets and liabilities 383 593 10 750 11 150 11 150 25 880 27 007 28 113Total provincial own receipts 510 173 626 467 614 907 597 310 597 310 597 310 652 169 683 702 696 271
Outcome Medium-term estimates
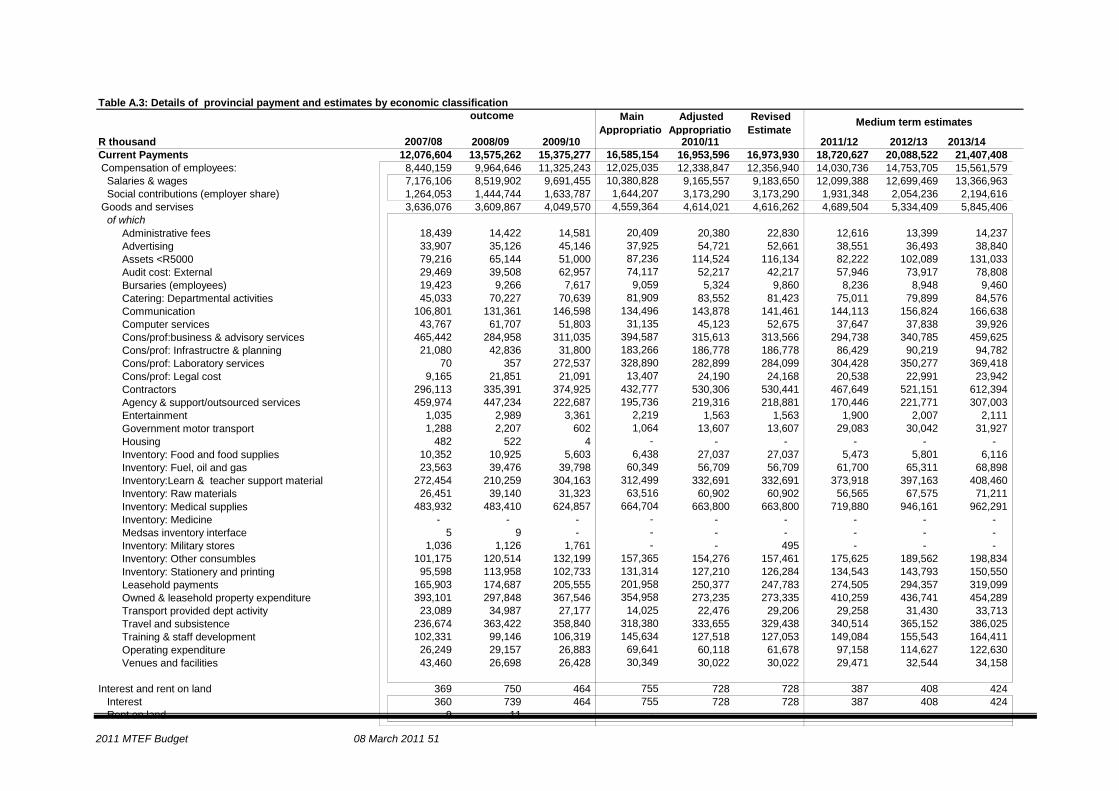
2011 MTEF Budget 08 March 2011 51
Table A.3: Details of provincial payment and estimates by economic classification
R thousand 2007/08 2008/09 2009/10 2010/11 2011/12 2012/13 2013/14Current Payments 12,076,604 13,575,262 15,375,277 16,585,154 16,953,596 16,973,930 18,720,627 20,088,522 21,407,408 Compensation of employees: 8,440,159 9,964,646 11,325,243 12,025,035 12,338,847 12,356,940 14,030,736 14,753,705 15,561,579 Salaries & wages 7,176,106 8,519,902 9,691,455 10,380,828 9,165,557 9,183,650 12,099,388 12,699,469 13,366,963 Social contributions (employer share) 1,264,053 1,444,744 1,633,787 1,644,207 3,173,290 3,173,290 1,931,348 2,054,236 2,194,616 Goods and servises 3,636,076 3,609,867 4,049,570 4,559,364 4,614,021 4,616,262 4,689,504 5,334,409 5,845,406 of which
Administrative fees 18,439 14,422 14,581 20,409 20,380 22,830 12,616 13,399 14,237 Advertising 33,907 35,126 45,146 37,925 54,721 52,661 38,551 36,493 38,840 Assets <R5000 79,216 65,144 51,000 87,236 114,524 116,134 82,222 102,089 131,033 Audit cost: External 29,469 39,508 62,957 74,117 52,217 42,217 57,946 73,917 78,808 Bursaries (employees) 19,423 9,266 7,617 9,059 5,324 9,860 8,236 8,948 9,460 Catering: Departmental activities 45,033 70,227 70,639 81,909 83,552 81,423 75,011 79,899 84,576 Communication 106,801 131,361 146,598 134,496 143,878 141,461 144,113 156,824 166,638 Computer services 43,767 61,707 51,803 31,135 45,123 52,675 37,647 37,838 39,926 Cons/prof:business & advisory services 465,442 284,958 311,035 394,587 315,613 313,566 294,738 340,785 459,625 Cons/prof: Infrastructre & planning 21,080 42,836 31,800 183,266 186,778 186,778 86,429 90,219 94,782 Cons/prof: Laboratory services 70 357 272,537 328,890 282,899 284,099 304,428 350,277 369,418 Cons/prof: Legal cost 9,165 21,851 21,091 13,407 24,190 24,168 20,538 22,991 23,942 Contractors 296,113 335,391 374,925 432,777 530,306 530,441 467,649 521,151 612,394 Agency & support/outsourced services 459,974 447,234 222,687 195,736 219,316 218,881 170,446 221,771 307,003 Entertainment 1,035 2,989 3,361 2,219 1,563 1,563 1,900 2,007 2,111 Government motor transport 1,288 2,207 602 1,064 13,607 13,607 29,083 30,042 31,927 Housing 482 522 4 - - - - - - Inventory: Food and food supplies 10,352 10,925 5,603 6,438 27,037 27,037 5,473 5,801 6,116 Inventory: Fuel, oil and gas 23,563 39,476 39,798 60,349 56,709 56,709 61,700 65,311 68,898 Inventory:Learn & teacher support material 272,454 210,259 304,163 312,499 332,691 332,691 373,918 397,163 408,460 Inventory: Raw materials 26,451 39,140 31,323 63,516 60,902 60,902 56,565 67,575 71,211 Inventory: Medical supplies 483,932 483,410 624,857 664,704 663,800 663,800 719,880 946,161 962,291 Inventory: Medicine - - - - - - - - - Medsas inventory interface 5 9 - - - - - - - Inventory: Military stores 1,036 1,126 1,761 - - 495 - - - Inventory: Other consumbles 101,175 120,514 132,199 157,365 154,276 157,461 175,625 189,562 198,834 Inventory: Stationery and printing 95,598 113,958 102,733 131,314 127,210 126,284 134,543 143,793 150,550 Leasehold payments 165,903 174,687 205,555 201,958 250,377 247,783 274,505 294,357 319,099 Owned & leasehold property expenditure 393,101 297,848 367,546 354,958 273,235 273,335 410,259 436,741 454,289 Transport provided dept activity 23,089 34,987 27,177 14,025 22,476 29,206 29,258 31,430 33,713 Travel and subsistence 236,674 363,422 358,840 318,380 333,655 329,438 340,514 365,152 386,025 Training & staff development 102,331 99,146 106,319 145,634 127,518 127,053 149,084 155,543 164,411 Operating expenditure 26,249 29,157 26,883 69,641 60,118 61,678 97,158 114,627 122,630 Venues and facilities 43,460 26,698 26,428 30,349 30,022 30,022 29,471 32,544 34,158
Interest and rent on land 369 750 464 755 728 728 387 408 424 Interest 360 739 464 755 728 728 387 408 424 Rent on land 9 11 - - - - - - -
Revised Estimate
Medium term estimatesoutcome Main Appropriatio
Adjusted Appropriatio
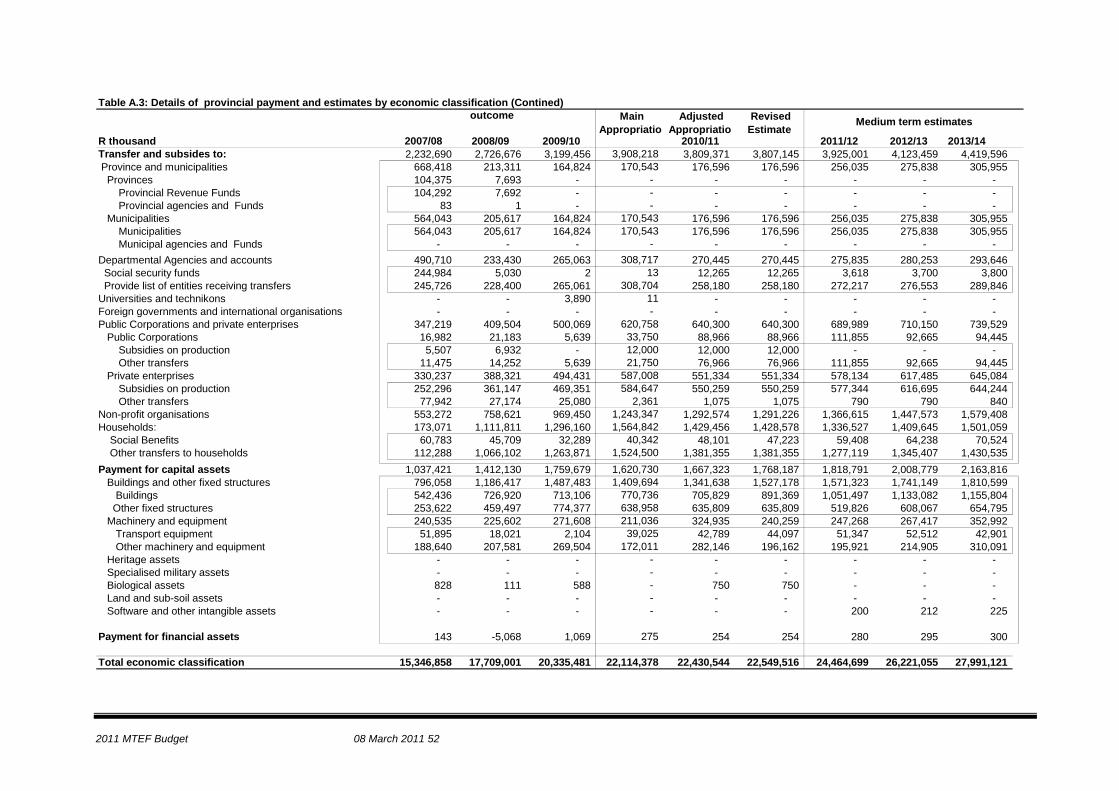
2011 MTEF Budget 08 March 2011 52
Table A.3: Details of provincial payment and estimates by economic classification (Contined)
R thousand 2007/08 2008/09 2009/10 2010/11 2011/12 2012/13 2013/14Transfer and subsides to: 2,232,690 2,726,676 3,199,456 3,908,218 3,809,371 3,807,145 3,925,001 4,123,459 4,419,596 Province and municipalities 668,418 213,311 164,824 170,543 176,596 176,596 256,035 275,838 305,955 Provinces 104,375 7,693 - - - - - - - Provincial Revenue Funds 104,292 7,692 - - - - - - - Provincial agencies and Funds 83 1 - - - - - - - Municipalities 564,043 205,617 164,824 170,543 176,596 176,596 256,035 275,838 305,955 Municipalities 564,043 205,617 164,824 170,543 176,596 176,596 256,035 275,838 305,955 Municipal agencies and Funds - - - - - - - - - Departmental Agencies and accounts 490,710 233,430 265,063 308,717 270,445 270,445 275,835 280,253 293,646 Social security funds 244,984 5,030 2 13 12,265 12,265 3,618 3,700 3,800 Provide list of entities receiving transfers 245,726 228,400 265,061 308,704 258,180 258,180 272,217 276,553 289,846 Universities and technikons - - 3,890 11 - - - - - Foreign governments and international organisations - - - - - - - - - Public Corporations and private enterprises 347,219 409,504 500,069 620,758 640,300 640,300 689,989 710,150 739,529 Public Corporations 16,982 21,183 5,639 33,750 88,966 88,966 111,855 92,665 94,445 Subsidies on production 5,507 6,932 - 12,000 12,000 12,000 - - - Other transfers 11,475 14,252 5,639 21,750 76,966 76,966 111,855 92,665 94,445 Private enterprises 330,237 388,321 494,431 587,008 551,334 551,334 578,134 617,485 645,084 Subsidies on production 252,296 361,147 469,351 584,647 550,259 550,259 577,344 616,695 644,244 Other transfers 77,942 27,174 25,080 2,361 1,075 1,075 790 790 840 Non-profit organisations 553,272 758,621 969,450 1,243,347 1,292,574 1,291,226 1,366,615 1,447,573 1,579,408 Households: 173,071 1,111,811 1,296,160 1,564,842 1,429,456 1,428,578 1,336,527 1,409,645 1,501,059 Social Benefits 60,783 45,709 32,289 40,342 48,101 47,223 59,408 64,238 70,524 Other transfers to households 112,288 1,066,102 1,263,871 1,524,500 1,381,355 1,381,355 1,277,119 1,345,407 1,430,535 Payment for capital assets 1,037,421 1,412,130 1,759,679 1,620,730 1,667,323 1,768,187 1,818,791 2,008,779 2,163,816 Buildings and other fixed structures 796,058 1,186,417 1,487,483 1,409,694 1,341,638 1,527,178 1,571,323 1,741,149 1,810,599 Buildings 542,436 726,920 713,106 770,736 705,829 891,369 1,051,497 1,133,082 1,155,804 Other fixed structures 253,622 459,497 774,377 638,958 635,809 635,809 519,826 608,067 654,795 Machinery and equipment 240,535 225,602 271,608 211,036 324,935 240,259 247,268 267,417 352,992 Transport equipment 51,895 18,021 2,104 39,025 42,789 44,097 51,347 52,512 42,901 Other machinery and equipment 188,640 207,581 269,504 172,011 282,146 196,162 195,921 214,905 310,091 Heritage assets - - - - - - - - - Specialised military assets - - - - - - - - - Biological assets 828 111 588 - 750 750 - - - Land and sub-soil assets - - - - - - - - - Software and other intangible assets - - - - - - 200 212 225
Payment for financial assets 143 -5,068 1,069 275 254 254 280 295 300
Total economic classification 15,346,858 17,709,001 20,335,481 22,114,378 22,430,544 22,549,516 24,464,699 26,221,055 27,991,121
Revised Estimate
Medium term estimatesoutcome Main Appropriatio
Adjusted Appropriatio
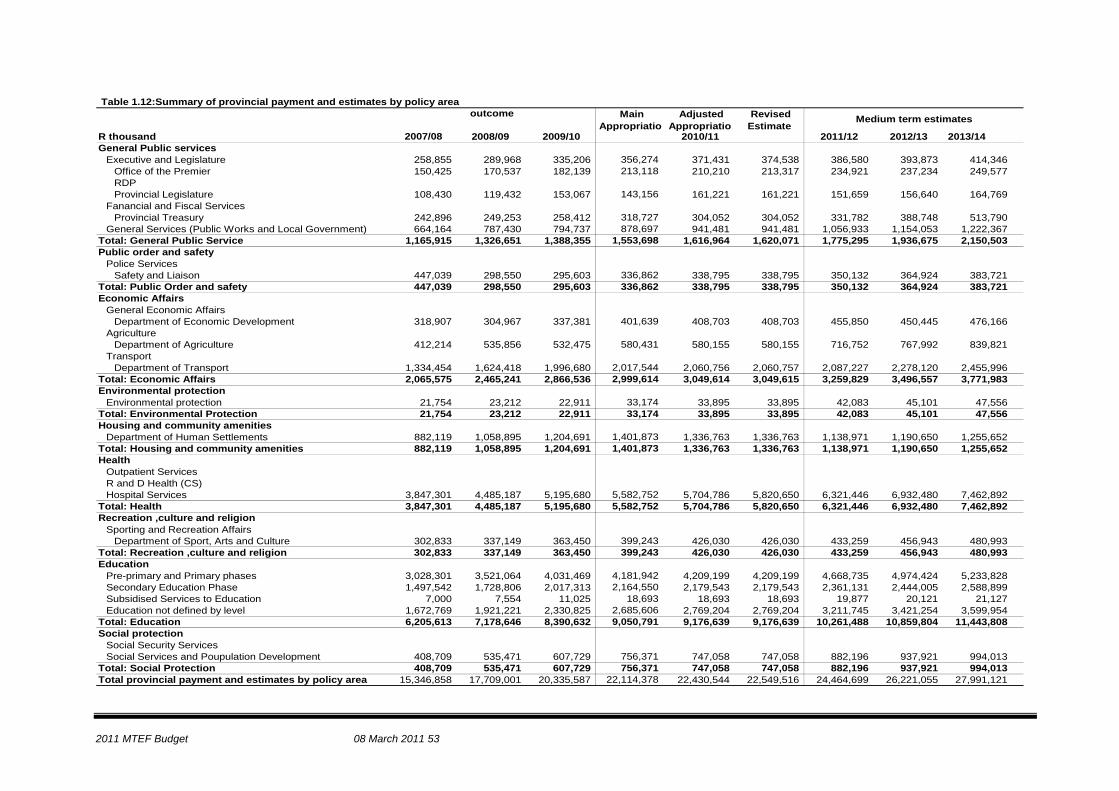
2011 MTEF Budget 08 March 2011 53
Table 1.12:Summary of provincial payment and estimates by policy area
R thousand 2007/08 2008/09 2009/10 2010/11 2011/12 2012/13 2013/14General Public services
Executive and Legislature 258,855 289,968 335,206 356,274 371,431 374,538 386,580 393,873 414,346 Office of the Premier 150,425 170,537 182,139 213,118 210,210 213,317 234,921 237,234 249,577 RDPProvincial Legislature 108,430 119,432 153,067 143,156 161,221 161,221 151,659 156,640 164,769
Fanancial and Fiscal ServicesProvincial Treasury 242,896 249,253 258,412 318,727 304,052 304,052 331,782 388,748 513,790
General Services (Public Works and Local Government) 664,164 787,430 794,737 878,697 941,481 941,481 1,056,933 1,154,053 1,222,367 Total: General Public Service 1,165,915 1,326,651 1,388,355 1,553,698 1,616,964 1,620,071 1,775,295 1,936,675 2,150,503 Public order and safety
Police ServicesSafety and Liaison 447,039 298,550 295,603 336,862 338,795 338,795 350,132 364,924 383,721
Total: Public Order and safety 447,039 298,550 295,603 336,862 338,795 338,795 350,132 364,924 383,721 Economic Affairs
General Economic AffairsDepartment of Economic Development 318,907 304,967 337,381 401,639 408,703 408,703 455,850 450,445 476,166
AgricultureDepartment of Agriculture 412,214 535,856 532,475 580,431 580,155 580,155 716,752 767,992 839,821
TransportDepartment of Transport 1,334,454 1,624,418 1,996,680 2,017,544 2,060,756 2,060,757 2,087,227 2,278,120 2,455,996
Total: Economic Affairs 2,065,575 2,465,241 2,866,536 2,999,614 3,049,614 3,049,615 3,259,829 3,496,557 3,771,983 Environmental protection
Environmental protection 21,754 23,212 22,911 33,174 33,895 33,895 42,083 45,101 47,556 Total: Environmental Protection 21,754 23,212 22,911 33,174 33,895 33,895 42,083 45,101 47,556 Housing and community amenities
Department of Human Settlements 882,119 1,058,895 1,204,691 1,401,873 1,336,763 1,336,763 1,138,971 1,190,650 1,255,652 Total: Housing and community amenities 882,119 1,058,895 1,204,691 1,401,873 1,336,763 1,336,763 1,138,971 1,190,650 1,255,652 Health
Outpatient ServicesR and D Health (CS)Hospital Services 3,847,301 4,485,187 5,195,680 5,582,752 5,704,786 5,820,650 6,321,446 6,932,480 7,462,892
Total: Health 3,847,301 4,485,187 5,195,680 5,582,752 5,704,786 5,820,650 6,321,446 6,932,480 7,462,892 Recreation ,culture and religion
Sporting and Recreation AffairsDepartment of Sport, Arts and Culture 302,833 337,149 363,450 399,243 426,030 426,030 433,259 456,943 480,993
Total: Recreation ,culture and religion 302,833 337,149 363,450 399,243 426,030 426,030 433,259 456,943 480,993 Education
Pre-primary and Primary phases 3,028,301 3,521,064 4,031,469 4,181,942 4,209,199 4,209,199 4,668,735 4,974,424 5,233,828 Secondary Education Phase 1,497,542 1,728,806 2,017,313 2,164,550 2,179,543 2,179,543 2,361,131 2,444,005 2,588,899 Subsidised Services to Education 7,000 7,554 11,025 18,693 18,693 18,693 19,877 20,121 21,127 Education not defined by level 1,672,769 1,921,221 2,330,825 2,685,606 2,769,204 2,769,204 3,211,745 3,421,254 3,599,954
Total: Education 6,205,613 7,178,646 8,390,632 9,050,791 9,176,639 9,176,639 10,261,488 10,859,804 11,443,808 Social protection
Social Security ServicesSocial Services and Poupulation Development 408,709 535,471 607,729 756,371 747,058 747,058 882,196 937,921 994,013
Total: Social Protection 408,709 535,471 607,729 756,371 747,058 747,058 882,196 937,921 994,013 Total provincial payment and estimates by policy area 15,346,858 17,709,001 20,335,587 22,114,378 22,430,544 22,549,516 24,464,699 26,221,055 27,991,121
outcome Main Appropriatio
Adjusted Appropriatio
Revised Estimate
Medium term estimates
2011 MTEF Budget 08 March 2011 54