Embed Size (px)
Citation preview

The Scottish Parliament and Scottish Parliament Infor mation C entre l ogos .
Financial Scrutiny Unit Briefing
Budget Scrutiny, 2015-16 24 October 2014
14/73
Ross Burnside
This briefing is structured around the four principles of financial scrutiny identified in the scrutiny process last year, and adapted in the Guidance to subject Committees for scrutiny of Draft Budget 2015-16. It is designed to aid Finance and Subject committee members in their scrutiny of the Scottish Government’s Draft Budget 2015-16. This briefing can be read in conjunction with the FSU briefing on Draft Budget 2015-16 which provides a high level overview of key elements of the Scottish Government’s spending plans.

2
CONTENTS
EXECUTIVE SUMMARY .............................................................................................................................................. 3
AFFORDABILITY ......................................................................................................................................................... 4
AFFORDABILITY: EXPENDITURE DRIVERS ........................................................................................................ 5 Public sector pay .................................................................................................................................................. 6 Pensions .............................................................................................................................................................. 7 NHS prescribing costs .......................................................................................................................................... 7 Infrastructure projects .......................................................................................................................................... 7 PPP unitary payments.......................................................................................................................................... 8 Borrowing repayments ......................................................................................................................................... 8 Cost of legislative proposals ................................................................................................................................ 9
AFFORDABILITY: REVENUE ................................................................................................................................ 10 Devolved taxes ................................................................................................................................................... 10 Non-domestic rates and Council Tax ................................................................................................................. 13 Other income streams for the Scottish budget................................................................................................... 13
PRIORITISATION ....................................................................................................................................................... 14
Prioritisation through infrastructure spending .................................................................................................... 18 Probing on priorities ........................................................................................................................................... 22
VALUE FOR MONEY ................................................................................................................................................. 23
Case study: Improving perceptions of the quality of public services ................................................................. 25 Efficiency reporting Case Studies ...................................................................................................................... 26 Case Study: Using Public Sector spending capacity effectively, Scottish Police Service HQ ........................... 28
BUDGET PROCESSES ............................................................................................................................................. 30
ASSESSING PROGRESS IN TRANSFORMING PUBLIC SERVICES ................................................................. 30 Prevention .......................................................................................................................................................... 30 Community Planning Partnerships and SOAs ................................................................................................... 31
LOGIC MODEL ....................................................................................................................................................... 33 What are logic models?...................................................................................................................................... 36 Why might committees use logic models? ......................................................................................................... 38
PUBLIC SERVICES NATIONAL OUTCOME ......................................................................................................... 40 FSU LOGIC MODEL .............................................................................................................................................. 41
SOURCES .................................................................................................................................................................. 45
ANNEX 1: OUTCOME BUDGETING – COMPARATIVE PERSPECTIVE ................................................................ 50
RELATED BRIEFINGS .............................................................................................................................................. 54

3
EXECUTIVE SUMMARY
The four principles of financial scrutiny and key points from each section are listed below. Affordability – the wider picture of revenue and expenditure and whether they are appropriately balanced:
When largely fixed commitments (like pay, pensions, infrastructure) and policy commitments are combined, discretionary scope for change in the budget is quite limited
Revenue raising tools are expected to increase in number with promises of further devolution beyond the Scotland Act 2012 after the next UK election in 2015.
The Scottish Government has utilised currently devolved property taxes differently. Council Tax, if agreed with local government, will be frozen for the 8th year in a row in 2015-16. However, NDRI which in 2008-09 was worth the same as Council tax, in 2015-16 will be 40% higher than Council tax revenues.
Prioritisation – a coherent and justifiable division between sectors and programmes:
Prioritisation can be assessed at different levels of Government spend, but is not an simple task
It is at lower levels of budget lines that subject committees can progress in getting under the surface of the priority areas within a portfolio
MSPs and committees can usefully question and seek Government rationales for the budgetary choices they have made
Value for Money – the extent to which public bodies are spending their allocations well and achieving outcomes:
There have been moves worldwide in recent years to focus budgetary scrutiny more on the delivery of outcomes. However this has proved challenging due to the complex causes of outcomes – for example, isolating the relative importance of government spend leading to improvements in life expectancy is extremely challenging
In Scotland, the National Performance Framework and the Scotland Performs website has been the vehicle for assessing performance across a range of policy areas.
Efficiency savings of 3% per annum are expected across public bodies but the reporting and scrutiny of these is not transparent.
Budget Processes – the integration between public service planning and performance and financial management:
The extent to which interventions geared towards “prevention” has allowed for disinvestment in previously costly spending areas is not clear
Audit Scotland considers that Community Planning is not as integrated as it could be
Logic models are suggested as a tool that might usefully help committees examine the factors influencing outcomes and the linkages between inputs, outputs and outcomes.

4
AFFORDABILITY
This aspect of financial scrutiny centres on the requirement to “balance the budget” which means that expenditure should be no greater than revenues. The majority of Scottish Government revenue currently comes from the block grant from Westminster (in this financial year, around 84% of revenues (Scottish Government 2014)). However as more financial powers are devolved to the Scottish Parliament via the implementation of the Scotland Act 2012 financial provisions, there will be greater responsibility on the Scottish Government for raising the money which it spends. In 2015-16 the Scottish Government will raise revenue through the newly devolved Scottish taxes (Land and Buildings Transaction Tax and Landfill Tax) and through new borrowing powers for capital expenditure. In the following financial year, the Scottish Rate of Income Tax (SRIT) power will be added to the revenue raising element of the Scottish budget. The focus of the Finance Committee scrutiny during the 2015-16 budget scrutiny process will be on revenues and the risks to expenditure if revenues vary from forecast. This section on affordability looks at the drivers on both sides of the balance sheet and analyses the extent to which they can/cannot be controlled. Some (but not all) of the key drivers are presented in the infographic below, with latest data on their cost and value where available. Examples have been chosen that were considered in the Independent Budget Review and where it is possible to identify an annual cost – others could have been included. The terms of the commitments in figure 1 vary, with some ongoing indefinitely (for example, pay and pensions); policies like PPP payments and borrowing repayments ongoing over the course of the repayment terms (usually 25 years); and other policy commitments subject to the choices of the elected government of the day. The other notable feature of figure 1 is that when these and other commitments are added together, large elements of the Scottish budget are committed and the discretionary scope for change is quite limited. On the revenue side of the balance sheet, the Scottish Government has no direct control over the size of the Block Grant flowing from Westminster, but partial control over other income streams like taxation and capital receipts. Partial control in the sense that the Scottish Government has control over setting rates for taxation, but less control over the prevailing global and domestic economic conditions and behaviours that might impact the yields accruing from these revenues.

5
Figure 1: Examples of expenditure and revenue items
Note: numbers are based on latest available years and for illustrative purposes. Examples chosen
are selected examples and do not cover entirety of Government policy commitments.
AFFORDABILITY: EXPENDITURE DRIVERS
This section of the briefing summarises some of the main expenditure drivers in the Scottish budget. It considers whether or not they are controllable by the Scottish Government, the timeframe over which they will incur costs, and where possible the extent of the liability. Considering these kinds of expenditure drivers is an important element of financial management in any circumstance, but takes on extra
£ Policy
Spend Revenue
No Control
Partial Control
Non Domestic Rate Income: £2,800m
Council Tax: £1,942m
Borrowing: £304m
Capital receipts: £63m
Devolved Taxes: £558m
Largely Fixed Commitments
Policy Commitments
Pay/Staff Costs: £14,500m
Pensions: £3,013m
Infrastructure/Asset Management: £3,422m
PPP Unitary Charges: £1,000m
NHS Prescribing Costs: £1,400m
Borrowing repayments: £22m
Council Tax Freeze: £560m
Free Personal Care: £400m
Concessionary Travel: £197m
Prescription Costs: £62m
Free Tuition: £220m
NHS Eye Examinations: £67m
NHS Dental Examinations: £24m
Block Grant: £30,410m (Total DEL)

6
significance at a time of public expenditure restraint. The UK is currently in the fifth year of a nine-year period of fiscal tightening which aims to eliminate the fiscal deficit by 2018-19 (IFS, 2014). Continuing austerity inevitably raises questions in scrutiny around the sustainability of these and other expenditure items.
Public sector pay
The Scottish public sector paybill is estimated at £14.5bn in 2013-14, accounting for over half (55%) of the total Scottish resource budget (Scottish Government 2014a). The Scottish Government implemented a pay freeze for the majority of public sector staff under its direct control in 2011-12 and this pay freeze continued into 2012-13. In 2013-14 and 2014-15, the pay freeze was lifted and a 1% cap was introduced in its place. The 1% cap continues to apply in 2015-16.1 However, the Scottish Government does not have direct control over the pay of all public sector employees. In total, around 30,000 staff are directly covered by the public sector pay policy, representing only around 6% of all those employed in the devolved Scottish public sector (Scottish Government 2014a). Local authorities and the NHS account for the majority of the staff within the public sector who are not directly covered by the Scottish Government’s pay policy. Together these two groups account for around three-quarters of public sector employees in Scotland. For local authorities, COSLA is the pay determining body. For the majority of NHS staff, the Scottish Government determines pay, but takes recommendations from the UK-wide pay review body and has, in the past, adopted these recommendations. While local authorities and the NHS have also adopted pay restraint measures since 2011-12, this is not the direct result of Scottish Government policy. Over the period since 2010-11, the public sector paybill has remained largely unchanged in cash terms. This compares to average annual growth rates of around 3% in previous years (Scottish Government 2014a). So, although the pay restraint measures implemented by the Scottish Government and other public sector partners have succeeded in stabilising the public sector paybill, it is difficult for the Scottish Government to reduce spending on public sector pay and it will continue to represent a significant proportion of public spending. Over the longer-term, reductions in numbers of public sector staff is the only way to achieve significant change, either through voluntary or involuntary severances or through non-replacement of staff. This in itself can have short-term cost implications as a result of severance packages. Furthermore, the Scottish Government’s pay policy has, alongside the pay freeze/constraint measures, included a commitment to no compulsory redundancies, limiting the scope to achieve reductions in staff numbers. Over the period 2011-2014, Scottish devolved public sector staff numbers have reduced by 6,600 in full-time equivalent terms (1.6%) (Scottish Government 2014b). Any reduction in the paybill that might have resulted from this reduction in staff numbers has to some extent been offset by continued progression payments, whereby staff progress annually through defined pay scales irrespective of the basic
1 Scottish Government, Public Sector Pay Policy for Staff Remits, various years

7
pay award. The IBR estimated that, in 2011-12, pay progression alone would add £110m to the public sector paybill (Beveridge, 2010) This analysis highlights the difficulty in achieving any significant reduction in the public sector paybill – the largest component of the Scottish Government budget.
Pensions
Occupational pensions policy – including on public sector pensions – is a reserved matter. The Scottish Government has certain executively devolved powers, which vary from pension scheme to pension scheme. The Scottish Government has responsibility for some policy aspects of five of the six main public sector schemes in Scotland (all but the Civil Service scheme), including aspects of scheme design. The Scottish Public Pensions Agency (SPPA) advises the Scottish Government on these matters. There are two distinct financial models for meeting the costs of public service pensions across the UK – Unfunded (or ‘pay as you go’) schemes and Funded schemes. The budgetary cost of the unfunded public sector pension schemes can be seen in the annual Scottish Budget Act passed by Parliament in February each year. The estimated net cost for the NHS scheme in 2014-15 is £1,529m and for the Teachers scheme is £1,159m. The document shows the joint budget for Police and Fire pensions as being £325m. There is no comparable data for Local Government in the Budget Bill documentation.
NHS prescribing costs
Within the NHS budget, staff costs are the biggest area of spending, accounting for £5.6bn in 2012-13 (Audit Scotland 2013a). The next largest area of spending is prescribing. In 2012-13, NHS prescribing costs totalled £1.4bn (ISD Scotland). On average, over the last decade, prescribing costs have risen by around 2% per year, which is broadly in line with general inflation over the same period (ISD Scotland 2014). However, prescribing costs can vary considerably between years. For example, in 2012-13, non-hospital net prescribing costs fell by 5% as a result of a number of major drugs coming off patent. In 2013-14, non-hospital net prescribing costs rose again by 2.5%. Despite some in-year variations, the general trend suggests that, in the short-term at least, this area of spending is difficult to reduce significantly in real terms.
Infrastructure projects
The Scottish Government’s Capital DEL budget in 2014-15 is £3.4bn. While not all of this will be committed to major capital projects, much of it will be funding projects of a longer-term nature which cannot always easily be re-profiled. Project delays can mean that funding is shifted between projects and timings can thereby alter, but the projects themselves will generally involve more than one year of spending. As

8
such, the capital budget is less flexible than the resource budget. In addition, while resource budgets can be transferred to support capital spending, the reverse is not possible under UK Treasury rules and so capital budgets cannot be used to support in-year resource spending. The Scottish Government’s plans for infrastructure spending are set out in its Infrastructure Investment Plan. This includes projects to be funded through traditional capital finance, as well as those planned for financing through public private partnerships (see below). The Plan does not set out a profile for planned spending in individual years.
PPP unitary payments
The Scottish Government funds some of its infrastructure investment through the use of public private partnerships (PPP). The Scottish Government’s non-profit distributing (NPD) model is a form of PPP. Under such projects, the private sector finances the upfront capital costs associated with a project and, on completion, continues to maintain and, in some cases, operate, the asset. Once operational, the public sector makes annual payments (“unitary charges”) to the private sector contractor to cover the capital costs, interest costs and maintenance/service charges. Such payments typically continue for 25-30 years. In 2014-15, Scottish Government repayments in relation to existing projects are estimated to be in the region of £1bn (Hudson 2013). In addition, local authorities and the NHS will have repayment commitments in relation to their projects. As a result of current project commitments, the level of repayments is set to rise in future years. The Scottish Government anticipate that their repayment commitments will peak in 2019-20 at around 4.5% of the budget (including borrowing repayments) (Scottish Government 2014). However, local authority commitments (mostly schools) are expected to continue to increase beyond this date and, on the basis of existing commitments, total public sector repayments are set to peak in 2025-26 at around £1.2bn (Campbell 2014). Any future NPD projects would add further to these repayment commitments.
Borrowing repayments
Under the terms of the Scotland Act 2012, the Scottish Government will be able to borrow an amount equivalent to 10% of its capital budget in each year, provided that the cumulative stock of capital borrowing does not exceed £2.2bn. Debt repayments (both principal and interest) relating to any such borrowing will represent a further commitment on the part of the Scottish Government. The Scottish Government has stated that it plans to borrow £304m in 2015-16. The assumed repayment period is 25 years with a 5% interest rate (Scottish Government 2014). On the basis of these assumptions, this initial planned borrowing would result in interest payments of £22m per year. This cost would increase if further borrowing is undertaken in subsequent years.

9
Cost of legislative proposals
Another expenditure driver which often has financial implications is legislation. Although all Financial Memorandum (FM) are considered by the Finance Committee, it is more often than not Subject Committees who take the lead in scrutiny of Bills. It has been suggested in the past by the Finance Committee that integration of legislative scrutiny by the Subject Committees into their Budget work might be a useful way to “mainstream” budget scrutiny (Scottish Parliament Finance Committee 2009a). While Bills often will not have costs attached to them for a year or two hence, there is inconsistent reference to pending legislative cost implications within the Draft Budget document. For example, in the 2015-16 Draft Budget there are several references to the financial commitments arising from the Children and Young People’s Act and references to some of the savings arising from the Police and Fire reform Act. However this is usually presented as a total figure over a number of years rather than a spend profile broken down by year. There are other pieces of legislation, either enacted or going through Parliament, which have not had their potential financial implications referred to in the document. For example, the example of the Community Empowerment Bill is given below, which may come into force in 2015-16 and, depending on demand, may have financial implications for local authorities. As such, it is not always possible to decipher from the Budget documentation whether legislative financial commitments have been factored into the spending plans. There is an assumption within the Scottish Government that portfolio budgets are expected to subsume the costs of any legislation within their budgets. However, in terms of financial transparency, it would be useful to identify separately any new financial obligations arising from legislative commitments within the Draft Budget. This would give Parliament reassurance that legislative obligations are being considered as part of the affordability of the spending package being scrutinised and would allow for the year-round financial scrutiny of Bills to be integrated into the formal budget scrutiny process. An example of this issue arose in the Finance Committee on 8 October 2014 during scrutiny of the Financial Memorandum for the Community Empowerment (Scotland) Bill. Members raised questions about why there had been no estimate of likely demand for participation requests and as such the financial implications of the Bill. The Bill team stated that it was not possible to predict the number of participation requests, despite the possibility of the Bill coming into force in the upcoming financial year (2015-16). While there are undoubtedly difficulties in producing demand profiles for policies where uptake is uncertain, it does raise issues around budgetary management and contingencies for when demand (and cost) is higher than anticipated. The Finance Committee has expressed an interest in looking at the costs of legislation in practice and how that compares to the costs identified in the FM. It might be useful for subject committees to keep in mind any legislation they have scrutinised where costs are coming on stream during their scrutiny of the Draft Budget.

10
AFFORDABILITY: REVENUE
Draft Budget 2015-16 sets out forecast revenues for the taxes devolved under the terms of the Scotland Act 2012 – Land and Buildings Transaction Tax (LBTT) and Landfill Tax. Other taxes currently devolved are Council Tax and Non-domestic rates (NDR). Table 1 set out their estimated value in 2015-16. Table 1: Forecast revenues from taxes devolved to Scottish Parliament
Tax Forecasts revenue, 2015-16, £m
Land and Buildings Transaction Tax 441
Landfill tax 117
Non domestic rates 2,800
Council Tax * 1,942
Total 5,300 * Council Tax figure is amount collected in 2013-14 (Scottish Government 2014d). Forecast revenues for 2015-16 are not available, but with Council Tax freeze in place, figures should not change greatly. As a locally set and collected tax, Council tax revenues are not included within the Scottish Government’s Budget.
The amount of tax revenues as a share of spend will increase in the coming years, first with the devolution of the Scottish Rate of Income Tax (SRIT) in 2016-17 (estimated at just under £5bn in 2016-17) followed by the proposed legislation for further devolution after the next UK election.
Devolved taxes
The 2015-16 Draft Budget includes taxes devolved through the Scotland Act 2012 to set the rates and bands for Scottish Landfill Tax and LBTT. The LBTT and Scottish Landfill Tax will be levied in Scotland from 1 April 2015. The Draft Budget states the “tax rate proposals are intended to be revenue neutral”. In other words, the rates and (for LBTT) bands have been proposed to raise the same amount of money that the previous UK-wide taxes (Stamp Duty Land Tax and UK Landfill Tax) may have generated in Scotland in 2015-16 if they had continued unchanged. However, the Scottish Government has opted to use a different forecast figure to the OBR (2014) who have latest Scottish Tax forecasts of £500m for Stamp Duty Land Tax (£59m more that the LBTT forecast by Scottish Government) and £109m for Landfill Tax (£8m less than the Scottish Landfill Tax forecast by the Scottish Government). This difference in forecast for what Stamp Duty Land Tax would have raised in 2015-16 is due to the Scottish Government’s different methodology from that used by the OBR. The Scottish Government use a “bottom-up” forecasting methodology, forecasting based on previous house price and sales data, whereas the OBR use a “top-down” forecasting methodology based on previous revenues. The Draft Budget outlines that the devolved taxes are an opportunity to “redistribute the burden of taxation to ensure that the taxes meet the needs of the people and the economy of Scotland.”

11
While the LBTT is proposed to be revenue neutral it is intended to be more progressive than the UK wide tax it will replace. Together the newly devolved taxes are forecast to raise £558m in revenue during 2015-16, shown in Table 2 below. Table 2: Forecast tax revenues 2015-16 (£m)
Portfolio area 2014-15
Land and Buildings Transactions tax £441
Of which residential transactions £295
Of which non-residential transactions
£146
Scottish landfill tax £117
Total £558
The Draft Budget proposes the same rates of landfill tax as in the rest of the UK. For 1 April 2015 this is proposed to be £82.60 per tonne for standard rated landfill and £2.60 for lower rate landfill. The lower rate applies to less polluting wastes. The bands and rates for LBTT are presented in table 3. Table 3: LBTT bands and rates
Residential transactions Non-residential transactions
Band Rate Band Rate
Up to £135,000 Nil Up to £150,000 Nil
£135,001 to £250,000 2% £150,001 to £350,000 3%
£250,001 to £1,000,000 10% Over £350,000 4.5%
Over £1,000,000 12%
NOTES: LBTT will also be levied on non-residential leases; up to £150,000 have a nil rate and those over £150,000 a rate of 1%. The Scottish Government’s published methodology for forecasting the taxes notes that the projected revenues for Scottish Landfill Tax are likely to be conservative. The LBTT forecast is also anticipated to “… slightly underestimate the number of very high value transactions.” The Scottish Fiscal Commission found the forecasts of Scottish Landfill Tax and LBTT to be reasonable “within the constraints of the available data”.
FSU tax tool – impact on revenues
The Financial Scrutiny Unit (FSU, 2014b) has developed a new LBTT revenue tool that allows an assessment of impacts on LBTT residential revenues if rates and bands are changed and if the number of transactions is higher or lower than forecast. This is based on the modelling used by the Scottish Government and allows us to assess the following potential variations in tax yields:

12
If the number of transactions is 1% more or less than forecasts, revenues accruing will be + £2.9m or - £3m
If the average value of transaction is 1% more or less than forecast, revenues will be £7.8m more or £7.7m less than forecast
Band rates can also be adjusted to allow insight into how much more or less could accrue in revenues. For example, based on the existing methodology:
Increasing band 2 (paid on transactions valued at £135,000 to £250,000) to 3% would accrue an additional £34.8m. Increasing band 2 to 4% would accrue and additional £69.6m
Increasing the top band (paid on properties sold for over £1m) would, based on the existing methodology, accrue little additional revenues as the number of £1m + properties in Scotland is small
The tool also allows bands at which rates become payable to be adjusted.
Impacts of LBTT changes by transaction size
Given Scottish Landfill Tax will initially be a continuation of the existing UK rate, the main change arising from the newly devolved taxes relates to the LBTT. Properties selling for £325,000 or less will be paying the same or less tax than they currently do under the existing Stamp Duty regime. The threshold at which buyers do not pay a transaction tax rises from £125,000 to £135,000. Properties purchased from £125,001 up to £325,000 in the new LBTT system will pay less when compared with the current Stamp Duty rates. For example, a property at £250,000 will be paying £200 less than currently. These changes have been widely seen as providing a tax cut to the first time buyer market.
It is when properties sell for more than £325,000 that the tax paid will rise. For example, a property valued at £500,000 will pay £12,300 more, a property valued at £1 million will pay £37,300 more (Scottish Government 2014g).
Given the differences in house prices across Scotland, the LBTT changes will impact differently. Large parts of Scotland will pay less tax, but places such as Edinburgh, Aberdeen and parts of Glasgow will be paying more on property transactions. Using Edinburgh sales data from 2013-14, Rettie and Co. (2014) estimate that
6,000 trades below £325,000 would have saved a total of £6.9m in the new LBTT v Stamp Duty
1,900 trades above £325,000 cut off would pay £19.8m more in tax - £10,400 each on average
The total tax take from sales in EH1 to EH17 would rise by £12.8m
It will be interesting to see what, if any, impact the new LBTT tax has on the higher end property market and the resultant impact on yields. These behavioural effects are largely unknown. The Scottish Fiscal Commission (2014) suggested behavioural responses need to be more fully accounted for in future forecasts stating that “the relatively high tax rates applicable to the upper band of the new LBTT may also

13
induce an additional behavioural response which has not been factored into the forecast”.
Non-domestic rates and Council Tax
NDR, or business rates, is currently the single largest source of revenue under the control of the Scottish Government. Business rates are set by the Scottish Government, collected by local government on behalf of the Government, paid into the Government’s business rates pool and then paid back to local government. In his statement to Parliament on the Draft Budget, the Cabinet Secretary stated that “the Fiscal Commission has considered our NDRI forecasts and has expressed the view that the buoyancy assumptions ‘seem optimistic’. As a result I have revised down the NDRI forecast in the Draft Budget for 2015-16”. There is a risk to the Scottish budget if business rates come in at less than expected as the Scottish Government guarantees to local government the combined general resource grant (GRG) from DEL plus distributable NDRI figure. However, in recent years, the NDRI yield has matched or bettered the forecast revenue figure. Council tax is a locally set and collected tax. However, since 2008-09, the Scottish Government and Councils have agreed to freeze council tax across Scotland. This freeze has meant that income from Council tax has largely remained the same. In 2008-09, both business rates and council tax collected around £1.9bn (Campbell 2013). In 2015-16, council tax is expected to still be worth £1.9bn, however, business rates are now estimated to bring in £2.8bn (over 40% more than council tax).
Other income streams for the Scottish budget
The value of capital receipts is dependent of market value for assets at the time of sale. In Draft Budget 2015-16, the Scottish Government puts revenues from Capital receipts at £63m.
The value of borrowing for capital is set by the Scotland Act 2012 at up to 10% of the value of the Scottish DEL Capital budget, which in 2015-16 is £304m. The Scottish Government for “modelling purposes” states that the borrowing will be repaid over 25 years at an interest rate of 5% - however, the Scottish Government has not indicated what the actual repayment terms will be. The Scottish Government is able to borrow from the National Loans Fund (NLF), banks or through issuing bonds, and will take a decision on repayment terms based on the “prevailing economic conditions” (Scottish Government 2014). The 25 year repayment period is significantly longer than the timeframe outlined for NLF loans in the Scotland Act Command paper which stated:
“Borrowing to finance capital expenditure funded by a loan from the NLF will be for a maximum of 10 years. However, a longer timeframe may be negotiated, for example 25 years, if this better reflects the lifespan of the associated assets for example, in the case of the Forth Replacement Crossing” (HM Government 2010).

14
PRIORITISATION
This area of scrutiny tests
“whether the pledges and commitments made by any government are then reflected in the choices it makes in the allocation of resource within its budget setting process” – Angela Scott.
Audit Scotland state that a priority-based budgeting approach focuses “on the delivery of priority outcomes and allocates money to those services or areas which make the greatest contribution to delivering those outcomes.” Since devolution, it could be argued that budgets have tended to be allocated on an incremental basis. This approach “assumes the current pattern of spending is broadly right and that activities will continue on the same basis (Audit Scotland, 2011). While this approach might be workable at a time when financial resources are stable as they were in the first decade of devolution, “it does not help prioritise spend or reduce costs in times of financial restraint. Nor does it provide incentives to promote better ways of working or new ideas” (Audit Scotland 2011). Total Managed Expenditure (TME) Scottish budgetary data is available on a comparative basis back to 2002 in the FSU’s Draft Budget 2015-16 level 1 and spreadsheet. Looking at portfolios as a share of the budget reveals how portfolio shares as proportion of the Scottish Budget have changed over time. Figure 2: Share of Total Managed Expenditure by portfolio
NB. 2002-03 to 2011-12 is outturn; remaining years are Budget plans.
0% 10% 20% 30% 40% 50% 60% 70% 80% 90% 100%
2002-03
2003-04
2004-05
2005-06
2006-07
2007-08
2008-09
2009-10
2010-11
2011-12
2012-13
2013-14
2014-15
2015-16
Health Sport Finance
Education Training Justice
Rural Culture & External Affairs Infrastructure
Administration Crown Office & Procurator Fiscal Local Government

15
This figure shows that:
A key budgetary priority has been Health and Wellbeing which has retained its share as the largest element of public spending over time.
Local Government has fallen as a share of TME over time. A large element of this change relates to the transferring of responsibility for policing to the new Single Police force within the Justice portfolio which has increased its share. This change resulted in Local Government moving from approximately 33% of TME in 2012-13 to approximately 29% of TME in 2013-14.
Finance, Employment and Sustainable Growth has increased over time, largely due to increases in the Scottish Public Pensions Agency budget –this increase largely relates to technical accounting changes to the way pensions were presented in 2003-04 and again in 2007-08, which had no impact on the Scottish Government’s discretionary spending power.
There is a large decrease in Rural Affairs and Environment spend between 2005-06 and 2006-07 which relates to an accounting change in the presentation of EU funding. The jump in 2007-08 relates to a technical accounting adjustment to pensions in the Scottish Agricultural and Biological research Institutes.
Education and Lifelong Learning; Culture and External Affairs and Crown Office and Procurator fiscal portfolios have largely retained their share.
Infrastructure, Investment and Cities has fallen as a share from 9% in 2002-03 to 7.6% in 2014-15. However, within that period there have been fluctuations in the IIC budget as a share, which is in the nature of infrastructure spend as it tends to fluctuate from year to year due to project delays and movements of monies between years. Also, the DEL Capital (where much of this budget comes from) element of the block grant from Westminster has been reduced in recent years.
It is relatively easy to look at priorities at higher levels. For instance, figure 2 shows the relative size of portfolios by budget and has the added advantage of doing so over time. This can foster scrutiny of macro-budgetary priorities over a period of time. Figure 3 shows scrutiny of level 2 prioritisation of budget lines via the absolute change in 2015-16 on the previous financial year. These changes warrant exploration – for example, why have large increases and decreases occurred? What are the local priorities for Housing? Where are the increases in Motorways and Trunk Roads occurring?

16
Figure 3: Largest real terms changes, 2014-15 to 2015-16, £m
Note on figure 3: The Scottish Public Pensions Agency budget has been excluded as the increase was so large it was distorting the visual. SPPA is set to increase by £1.1bn in 2015-16 due to an actuarial valuation of membership which increases the costs of servicing pensions. This is covered by HM Treasury via AME.
Subject Committees have been asked to focus on the scrutiny test of prioritisation and to consider whether their overall portfolio allocations, and the more detailed level 3 and 4 allocations reflect the Scottish Government’s stated priorities. It is at the lower levels of Budget lines that subject committees start to make headway in getting under the surface of the priority areas within a portfolio. Looking at lower level
188.3
100.8
47.3
44.9
40.7
37.4
36.8
21.3
20.5
17.1
17.0
13.7
12.7
12.5
12.0
10.6
7.7
5.7
-5.0
-5.9
-6.2
-7.5
-11.7
-12.8
-30.0
-31.3
-34.8
-35.5
-37.2
-140.3
Housing and Regeneration
Student Awards Agency for Scotland
Parliamentary Business & Government Strategy
Motorways and Trunk Roads
Other Expenditure
Ferry Services in Scotland
EU Support and Related Services
Culture
Police and Fire Pensions
Enterprise, Energy & Tourism (inc employment)
Children, Young People & Social Care
Scottish Court Service
Employment and Skills
Health
Air Services in Scotland
Learning
Scottish Prison Service
Environmental and Rural services
Other Transport Policy, Projects and Agency
Scottish Fire and Rescue Service
Miscellaneous
Young Scots Fund
Courts, Judiciary & Tribunal Services
Digital Economy and Infrastructure
Scottish Futures Fund
Scottish Further & Higher Education Funding…
Scottish Water and Climate Change
Scottish Police Authority (SPA)
Rail Services in Scotland
Sport

17
budget lines over a period of time is more challenging as Budget line titles change and some funding streams end. However, it is possible to ask effective scrutiny questions from analysis of budgets over a shorter period of time. This can be done on a portfolio basis. As an example, let us take the Health and Wellbeing portfolio and the absolute real terms changes in Level 3 budget lines in 2015-16 on 2014-15. Figure 4: Health & Wellbeing Level 3 absolute real term changes, 2015-16, £m
The most striking aspect of the Health level 3 numbers is that the vast majority of budget lines in the middle of the chart are flat in real terms. This probably reflects the
-73.2
-71.0
-38.6
-11.2
-8.1
-6.3
-2.9
-2.8
-2.0
-1.6
-1.5
-1.1
-0.8
-0.8
-0.5
-0.3
-0.3
-0.3
-0.2
-0.2
-0.2
-0.2
-0.1
0.0
0.4
0.6
0.7
1.0
1.0
2.5
3.2
4.3
4.7
7.5
10.8
11.0
39.4
72.3
82.0
Provision to Transfer to Health Capital
NHS & Special Health Boards Capital-
Health Retained Income
General Medical Services-
Pandemic Flu Preparedness-
General Dental Services-
Nursing - Education and Training-
Pharmaceutical Services Contractors…
Financial Transactions
NHS Impairments (AME)
General Ophthalmic Services-
Research
Alcohol Misuse
Access Support for the NHS & Quality efficiency
Health Protection
Specialist Childrens Services
Distinction Awards
Clean Hospitals/MRSA Screening Programme
Healthy Start
Tobacco Control
Self Directed Support Programme
Health Improvement & Health Inequalities-
Care Inspectorate
Health Screening-
FSA: Choice
eHealth
Early Detection of Cancer
FSA: Eating for Health
Mental Health Improvement & Service Delivery
Workforce - Education and Training-
Food Safety
Immunisations
Miscellaneous Other Services
Custody Health Care & Forensics Services
Revenue consequences of NPD
Capital Receipts
New Medicines Fund
Integration Fund
NHS & Special Health Boards-

18
fact that the Health budget has largely been protected in real terms. From a scrutiny point of view, this begs questions around why that is the case.
Is the Health budget being managed in an incremental manner (as discussed above) or are there good operational reasons for each of these budget lines being flat in real terms?
It is when looking at the budget lines that are growing and falling that we can start to get greater insight into the priorities within the portfolio.
Specifically, what are the justifications provided for the budget lines growing and falling in real terms?
Do these justifications stand up to scrutiny and are they a reflection of the stated priorities of the Health and Wellbeing portfolio?
The stated priorities of the Health budget are
Further improvement on the quality of care; Improving the health of the population; and Securing the value and financial sustainability of health care services.
Questions which might follow from these priorities might be:
Are these priorities reflected in above inflation rises in budgets for NHS and Special Health Boards, Integration fund, New Medicine fund, and so on?
Are these priorities reflected in the budgets to have been reduced in real terms?
Have spending allocations been altered to reflect performance against commitments and priorities?
Similar exercises looking at level 3 budgets can be undertaken for other portfolios and might be an effective tool for subject committees. Digging deeper than level 3 and looking at the level 4 budgets allows for even closer scrutiny of priorities. Level 4 numbers are only ever “snapshots” which are managed over the course of the year, but they do give members insight into the distributions of budgets at a lower and more localised level. The FSU will shortly publish an interactive tool, incorporating level 4 data, which will allow for tailored scrutiny of the different levels of spending by portfolio.
Prioritisation through infrastructure spending
Prioritisation in public spend can be viewed through a number of lenses, however it is not a straightforward task. For instance, when looking at infrastructure projects, it might appear that the area in which a project is being built will accrue most benefit, but often projects, in particular transport projects, will see benefits spread to citizens across a wider geographical space (for example, travel to work areas). For example,

19
the largest infrastructure project being funded from the DEL Capital budget is the Forth Replacement Crossing, which is a project of national significance. One area where data is available at a more local level is unitary payments and capital value of Public Private Partnership Projects (PPPs). PPPs are obviously only part of the infrastructure story, but data by Local Authority and Health Board area shows the relative priority they are given. For example, looking at capital values of projects procured via PPPs reveals that this has been prioritised more in some local authority and health board areas than others. For example, in Shetland, Orkney and the Western Isles, there has been no use made of PPP projects for funding infrastructure. The situation is different in mainland Scotland with East Renfrewshire council making most use per capita of PPP funding, largely due to its management of the M77 motorway construction (including the Glasgow Southern Orbital) which accounts for 65% of the total PPP capital value in the council area. From a scrutiny point of view, these maps raise questions around prioritisation. For example:
Why are some areas placing greater priority on PPP projects than others?
Is this because there are greater infrastructure needs?
Is it because the conventional DEL Capital budget has been squeezed?
20
Use of PPP by Health Board is provided in the figure below, and again shows no use of PPP in Shetland, Orkney and the Western Isles, with a greater us of PPP in the more populated central belt. Forth Valley is the highest as it includes the Larbert hospital.

21
The maps only relate to PPP projects procured by Local Authorities and Health boards. The health board spend per head does not include the Forres, Woodside and Tain Health Centres project as this covers two health board areas. The capital value of this project is £13.6m. Other PPP projects are delivered by Scottish Water

22
and Transport Scotland, but these cover several Local Authority areas so are difficult to assign to a particular area. Another point to note is that although projects are managed by individual local authorities, they too can have wider benefit.
Probing on priorities
Finance Committee guidance to other Committees states: Subject Committees are invited to focus on prioritisation as part of their budget scrutiny including seeking evidence on:
The extent to which the Scottish Government and other public bodies have moved towards a priority-based budgeting approach;
Whether spending priorities support the Scottish Government’s Purpose;
Whether current performance informs the choices about where to allocate resource;
The extent to which Scotland Performs is embedded into the budget building process of the Scottish Government.
In its report, Scotland’s public finances: a follow-up audit, Audit Scotland (2014b) produced a check-list of questions to support non-executive scrutiny of public finances. These can easily be adapted and applied to Subject Committees tasked with scrutinising public bodies responsible for spending public money. Some of these are adapted and presented below as the type of questions subject committee might wish to ask of public bodies.
Has a public body developed a priority-based approach to budget-setting, making connections between planned spending and intended outcomes and targets? For example
o Are budgets clearly linked to the body’s priorities and outcomes as set out in the corporate plan?
o Is there evidence the organisation works well with partners to ensure budget-setting takes account of shared priorities and outcomes?
o Is there evidence public bodies have considered different spending options or ways of delivering services?
Does the public body have a long-term financial strategy (5-10 years) or is it focused mainly on short term (next year or two)?
Does the pubic body provide good financial and performance information allowing for effective challenge of spending and decisions?
Is the information presented in an easily understandable, open, and transparent manor?
These questions, and others raised above, may assist members in applying the prioritisation principle of financial scrutiny.

23
VALUE FOR MONEY
This scrutiny test considers the extent to which public money is being allocated well and achieving outcomes. A recurring theme in the Parliament’s annual budget scrutiny is the need for a greater focus on outcomes. In session 1 of the Scottish Parliament, the then Finance Committee commissioned research on “Moving to Outcome Budgeting” (Flynn, 2001) with a remit to “investigate the feasibility of outcome budgeting for the Scottish budget, to identify where it could be applicable, and to develop practical proposals in measuring outcomes in the Scottish budget.” Outcome Budgeting was defined in that study “as a budget process that makes resource allocation and control decisions based on the results of the expenditure. It is distinct from budgeting based on inputs (staff, buildings, materials etc) and budgeting based on outputs (numbers of people educated, operations carried out, prisoners held in custody, etc) and can be implemented in addition to the other two methods.” The same definition has been used in recent work by the Improvement Service (2011).
Inputs: Resources needed to develop and implement projects, programmes or policies (e.g. funding for school education).
Outputs: Products resulting from inputs (e.g. number of teachers). Outputs should facilitate the meeting of outcomes.
Outcomes: Benefits resulting from outputs. They should correspond to ultimate objectives - the impact of a policy intervention on the welfare of producers or consumers (e.g. better educated school students).
Suggestions in the Flynn (2001) report for moving the Budget process towards a more outcome budgeting approach were as follows:
Resource allocation should be illuminated by explicit statement about the outcomes that are expected to result from those allocations.
Outcome measures should form the main basis for Parliamentary scrutiny of government, both at portfolio level and overall. Long-term outcomes should be checked against milestones.
Parliament should discuss policy, priorities, outcomes and targets before it discusses resource allocation.
There should be informal dialogue between committees and government in relation to their progress against outcomes and targets
There should be a structured approach to performance review, looking at a few areas each year.
While attempts were made in successive Finance Committee reports to focus scrutiny on budgetary priorities and outcomes, in 2009 in its Strategic Budget Scrutiny report, the Finance Committee concluded:
“It is clear from evidence to this inquiry that significant further development of the concept of outcome budgeting is required if difficult decisions on the prioritisation of funds are to be made on a rational basis.”

24
The Finance Committee guidance (2014) also cites the Independent Budget Review recommendation from 2010 that
“there is a need to move towards a more outcomes-based approach to public service management and to improve the quality, availability and application of evaluation, monitoring and reporting data in relation to outcomes across the public sector in order to ensure that resources are applied to full benefit. This is vital if the Scottish Parliament is to exercise an effective monitoring and scrutiny role.”
The Improvement Service (2011) study into Outcome Budgeting in the Public Sector considered that for outcome budgeting to be successful, it would require:
Clearly defining outcomes and developing performance and quality indicators that measure the achievements of those outcomes;
Assessing the cost of an activity or service; and
Being able to understand a causal relationship between the activity, the spend, the performance/quality indicator and the outcome.
It is this final element of outcome budgeting that has proved the most difficult to achieve in many jurisdictions (a Comparative perspective is provided in annex 1 of this paper). It is widely accepted that outcomes are the most important element of performance, but that outcome data are often unavailable or expensive to obtain. Even when outcome data are available, the causal link between government policy and social conditions may be complex. Outcomes like, for example, longer life expectancy, arise as a consequence of many factors, not simply government interventions. Other challenges related to outcome budgeting are time-lags in both data collection and results, with improvements taking place over a long period of time. Governments and politicians generally are attracted to the language of outcomes in their manifestos and rhetoric, but linking outcomes to budget documents and budgetary decisions is much more challenging. What tends to happen in countries that take performance budgeting seriously is that reforms that aim to improve outcomes tend to end up focusing on outputs instead. According to a paper by Allen Schick (2003),
“this ‘second best’ situation certainly is more productive than spending years in the quest for ideal outcome measures. Outputs are a useful indicator of performance because citizens know government by observing the condition of school classrooms and the number of students per class, the distance from home to health clinic and the waiting time once they get there, the treatment given them by police officers, and the countless other contacts that ordinary citizens have with government agencies and public employees. Outputs are the face presented by government to its people. If citizens deem services inadequate, they will not regard government as performing well.”
In its response to the Finance Committee report on Draft Budget 2014-15, the Scottish Government state that since 2007 “the NPF has provided a strategic direction for policy making in the public sector, provided a clear direction to move to outcomes-based policy making and has been fully integrated within our spending plans.” The response also states that the parliament’s committees are “well placed

25
to use Scotland Performs as a source to scrutinise the Government’s interventions and progress towards the National Outcomes” (Scottish Parliament Finance Committee 2013b).
Case study: Improving perceptions of the quality of public services
Efficiency
The Finance Committee Guidance to subject committees highlights that one of the fifty national indicators within Scotland Performs is to “improve people’s perceptions of the quality of public services.” The Scottish Government states that the indicator:
will show us nationally that, over a time period, public services are showing they understand people, that they are using performance and other data to drive their work, that the user experience of public services is improving and, crucially, public service providers are providing transparent feedback to users.
To support progress against this indicator the Scottish Government states on the Scotland Performs website that it is committed to “embedding an open and rigorous performance culture within Scotland's public services; ensuring greater clarity around the objectives of public organisations; and establishing clearer lines of accountability that help to bolster standards of service and improve outcomes.” It has asked “all parts of the public sector to report publicly on their plans to improve the value for money achieved by public services, actions undertaken and results achieved.” The Scottish Government (personal communication) were asked for an update on progress in these areas. On reporting publicly on “Value for Money”, the response states:
“The Scottish Government expects every public body to deliver efficiency savings of at least 3% per annum during the course of the current Spending Review (2012-15) and to report publicly on the actions undertaken and the results achieved. Efficiency is about productivity, enhancing value for money and improving public service delivery.”
Draft Budget 2015-16 (Scottish Government 2014) reiterates the importance of efficiencies as a “critical element in assisting us to meet the challenges of increasing demand and persistent inequalities”. In terms of scrutiny and reporting of these efficiencies, the Scottish Government has adopted what it describes as a “light touch approach”.
“From 2011-12 individual public bodies are no longer required to provide separate plans or reports to Scottish Government and we will not provide an overview report of efficiency across the public sector. Each individual public body is expected to report publicly on the efficiencies they have delivered” (Scottish Government, Efficient Government)
There is no portal providing access to all public bodies’ efficiency savings. The expectation is that the public reporting of efficiencies will be done via the publication
26
of public bodies’ annual reports and accounts. Another important element of the Scottish Government’s approach is that the 3% efficiency expectation is designed to help public bodies “offset cost pressures and live within the budget allocations they have been given”. The gains from efficiency savings, therefore, are to be retained by public bodies and are not intended to be recycled into other parts of the public sector. This is different to the approach advocated in the Independent Budget Review which argued for the revision of “the current approach of the Efficiency Programme which allows efficiency savings to be retained and recycled with a view to reducing future budget allocations across the public sector to incorporate an assumed annual efficiency saving.”
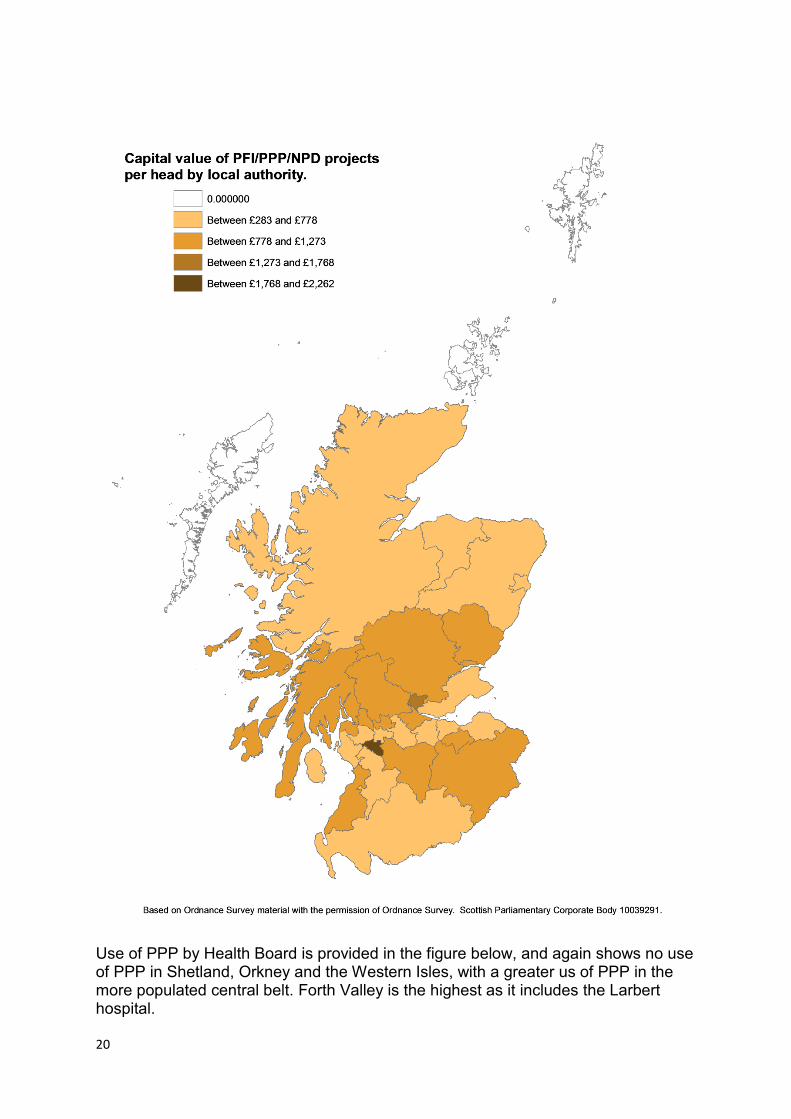
Efficiency reporting Case Studies
Looking at the reporting documentation for a selection of Public Bodies shows variation in the reporting of efficiency savings. Some are reported in the annual accounts, some not; some provide areas where efficiencies have been achieved and some simply provide a headline figure. Generally, the supporting evidence that these are genuine efficiencies is not clear, and there is no sense that the Scottish Government is holding public bodies to account in this regard. . Care Inspectorate From the annual accounts, it appears that the Care Inspectorate (2013) use efficiency savings to augment the subsequent year’s budget. The Care Inspectorate annual accounts identify 3.4% efficiencies for 2012-13 which will be re-directed towards bringing forward projects from 2013-14. “The cost savings associated with the efficiencies identified in-year will be incorporated into the 2013/14 budget to absorb cost pressures, increase the number of regulated care service and strategic inspections we carry out and enhance our capacity to follow up on our recommendations and support improvement.” “The 2012/13 budget included £2.2m of efficiencies identified in 2011/12. This cost saving was firstly directed towards containing cost pressures such as a pay award for lower paid staff, contractual incremental progression and general inflation, but then the saving was used to enhance the service we provide. Specifically, the identified savings allowed us to: • increase the frequency of inspection for care home and care at home services • provide additional resources for our National Registration team • focus on improvement, innovation and best practice • promote dementia standards • provide increased time for inspectors to engage with users of care services • create capacity to allow the Care Inspectorate to respond effectively and flexibly on a crisis intervention basis and to respond to emerging intelligence. Scottish Enterprise Scottish Enterprise does not report on efficiency savings in their annual accounts. Their Public Sector Disclosure document (Scottish Enteprise 2013) states that in financial year 2012-13, £7.9m of cash releasing savings were achieved.

27
Visit Scotland In its annual accounts, VisitScotland (2013) report savings of £1.914m (over 3%) within the following areas:
- £1,003,000 in procurement - £125,000 in Asset Management - £786,000 from organisational change (including from voluntary redundancy and non-
replacement of senior staff) and shared services
Data
Subject Committees are invited in the Finance Committee guidance to focus on the extent to which public services are embedding an open and rigorous performance culture, are using performance data and information to ensure value for money and the progress of public bodies in moving towards a more outcomes-based approach to public service management. Turning to the data used to assess improvements in people’s perceptions of the quality of public services. This national indicator uses Scottish Household Survey data to assess the Percentage of respondents who are fairly or very satisfied with the quality of the following local services: local health services, local schools and public transport. There is no quantified target for the amount of improvement in perceptions of the quality of Public Services. The only criteria for the target is that there is some improvement. The latest data on the Scotland Performs website is presented in table 4 below. It shows that performance has improved since 2007, peaking in 2011, but has worsened markedly in the last two years for which there is available data. Table 4: Percentage of respondents who are very or fairly satisfied with the local services
Year Percentage
2007 57.1%
2008 61.8%
2009 64.9%
2010 64.0%
2011 66.0%
2012 63.0%
2013 59.9%
Source: Scottish Household Survey Looking at the disaggregated data shows that satisfaction is highest amongst older members of society. For example, satisfaction is highest amongst those aged 55 to 64 (61% fairly or very satisfied); 65 to 74 (64% fairly or very satisfied) and 75+ (67% fairly or very satisfied). This compares with fairly or very satisfied rates of 58% amongst 16 to 24 year olds and 58% amongst 25 to 34 year olds. There is also a distinction in satisfaction rates between urban and rural service users. In 2013, 62% of urban respondents to the survey were fairly or very satisfied with local health services, local schools and public transport, compared with 52% of rural

28
respondents. These differences between young and old and urban and rural raise interesting questions around “who benefits”, or at least who is perceived to benefit from public services. One reason for the findings might be that older members of society tend to be more likely to use public services or that certain public services (for example transport) are more expensive to deliver in a rural area, with possible implications for quality. However, obvious questions arising from this data are
To what extent, if at all, is it altering Scottish Government policy?
Do lower satisfaction rates among young and rural members of society mean that more needs to be spent on these groups?
Indeed, should this data be affecting policy?
Is data on satisfaction by age and rurality even the correct data to be using to assess the effectiveness of government policy?
Table 5: Percentage of respondents who are fairly or very satisfied with the quality of: local health services, local schools and public transport
Age-group 2007 2008 2009 2010 2011 2012 2013
16 to 24 56 60 61 62 62 61 58
25 to 34 52 58 62 61 65 58 58
35 to 44 55 57 64 62 63 61 59
45 to 54 52 55 62 60 65 59 57
55 to 64 57 65 66 66 67 66 61
65 to 74 67 70 72 69 72 73 64
75 and over 67 77 74 73 74 69 67
Case Study: Using Public Sector spending capacity effectively, Scottish Police Service HQ
An example of effective use of public sector procurement power to deliver good value was recently raised in a session of the Finance Committee by Colin Mair from the Improvement Service. In discussing the scope for the Scottish public sector to intelligently use its procurement power to bring wider economic benefit, he cited the example of the building of the new Scottish Police Service Headquarters. After Clyde Gateway had detoxified land and built new offices in the area, Police Scotland, who needed a new HQ, agreed to locate in Dalmarnock. He said:
“A good example is the new Scottish police service, which is about to locate its new headquarters in Dalmarnock in Glasgow, in the Clyde gateway. The fact that the police have been willing to do that has opened up a site that will become hyperactive with private investors coming in precisely because the police presence constitutes an anchor. Once a big public body shows confidence in an area, the private sector starts to show confidence on the back of that.
That is really intelligent use of the Scottish police service’s capacity. It needs a headquarters. Where is it going to base it? Answer: pick an area of deprivation for once rather than an area in the more pukka parts of town and

29
then create an economy around the headquarters because cafes, shops and so on will grow up to service the office workers coming in. If that then gives rise to confidence in the place among the private sector, we will start to have incredibly positive investment flows into a part of Glasgow that, frankly, was being written off 20 years ago as going nowhere at all—it was just contaminated land.
How we use our asset power is a really important part of how we stimulate economies to give people opportunities that will then support their health and wellbeing within their communities.”
This is another avenue for subject committees in looking at their respective budgets.
Considering the infrastructure assets within their portfolio, are they being used in a way which might improve outcomes in economically poorer performing areas?
The example above cites a development in a deprived part of Glasgow, but there are other destinations outwith the major towns and cities that might benefit from the location of HQs and functions. Subject Committees are invited to focus on value for money as part of their budget scrutiny including seeking evidence on:
The extent to which public bodies are spending their allocations well and achieving outcomes;
The extent to which an open and rigorous performance culture has been embedded within the public services;
The extent to which the public services are using performance data to ensure value for money;
Performance information such as, for example, the NPF, Single Outcome Agreements, Strategy for Justice in Scotland etc;
The progress of public bodies in moving towards a more outcomes-based approach to public service management.

30
BUDGET PROCESSES
ASSESSING PROGRESS IN TRANSFORMING PUBLIC SERVICES
This section is concerned with examining the integration between public service planning and performance and financial management. The previous adviser suggested that one aspect of this area of scrutiny is the Scottish Government’s commitment to the transformation of public services and how budgetary decisions are supporting this. This commitment is set out within one of the sixteen national outcomes in Scotland Performs: “our public services are high quality, continually improving, efficient and responsive to local people’s needs.” Scotland Performs states that the “achievement of this outcome will be determined by the ability of public services to act decisively and prioritise resources to maximise their positive impact.” The Scottish Government is committed to a ‘reform agenda’ built on four pillars:
Decisive shift towards prevention;
Greater focus on ‘place’ to drive better partnership, collaboration and local delivery;
Investing in people who deliver services;
A more transparent public service culture which improves standards of performance.
Prevention
The “decisive shift towards prevention” has been a key interest of the Finance Committee over a number of years. The Scottish Government’s Performance Evaluation document (Scottish Government 2014e) provides mixed evidence that in areas that might be classified as preventative there is evidence that performance has improved. For example, the % of children in deprivation has increased, but the % of local authorities receiving positive reports for children services and the % of P1 children with no obvious tooth decay has also increased. From the point of view of budget scrutiny, however, it is still unclear whether a more preventative approach has been able to unlock resources for other priorities. Additionally, while it is possible to identify budget lines that might be classed as “preventative”, given the cross-cutting nature of the interventions that might contribute to a reduction in for example child poverty, it is not possible to identify the costs of achieving performance improvements. This is probably not surprising as finding a direct causal link between budgets and performance is very complex and elusive for Governments throughout the world. However, that does not mean that it is not worth attempting to better evaluate the costs linked to improved performance thereby gaining an understanding of whether value for money can be assessed. For example, taking an example from the Performance Scorecard:

31
What is the cost of the dental programmes in relation to % of P1 with no obvious tooth decay?
What does success in reducing tooth decay equate to in terms of unlocking resources for other priorities?
The issue of disinvestment in current spending as a result of successful preventative measures has been raised repeatedly by the Finance Committee. Finance and subject Committees may wish to consider whether there is evidence of preventative interventions beginning to release resources previously allocated to these interventions. Local Government is central to the delivery of much of the preventative agenda, particularly through things like children services. All 32 Local Authorities are signed up to an outcome-based approach through the publication of Single Outcome Agreements (SOAs) with the Scottish Government. Community Planning Partnerships (CPPs) were also identified as important players in delivering on the Scottish Government’s ‘reform agenda’, built as it is on a pillar of “better partnership, collaboration and local delivery”.
Community Planning Partnerships and SOAs
In 2012 the Scottish Government carried out a review of community planning and SOAs as part of its response to the Christie Commission. It published a ‘Statement of Ambition’ in partnership with COSLA which aims to put community planning at the heart of an outcome based approach to public services in Scotland (Scottish Government 2012). A new statutory duty will be introduced requiring relevant public bodies “to work together to improve outcomes for local communities through participation in community planning partnerships and the provision of resources to deliver the SOA” (Scottish Government 2012). CPPs will be responsible for:
taking the lead role in securing integrated public services
focusing more on potential problems and identifying ways to prevent them happening
ensuring public bodies continue to improve the ways in which they manage and provide services
achieving better outcomes for communities, such as better health and lower crime
providing the foundation for effective partnership working, within which wider reform initiatives will happen.
The Scottish Government and COSLA published guidance in December 2012 which advised CPPs on the scope and content of new SOAs. SOAs are required to include specific plans for the delivery of improved outcomes and CPPs are expected to take a more systematic and collaborative approach and have a strong commitment to performance improvement. The aim should be to achieve “transformational, not incremental, performance improvement The Community Empowerment (Scotland) Bill (Scottish Government 2014c) includes a provision to provide a statutory basis for CPPs and “places duties on them around the planning and achievement of local outcomes.” These local outcomes must be

32
consistent with the national outcomes. The Bill also extends the list of partners to include a wider range of public bodies that may have a role in influencing local outcomes including the police, colleges, VisitScotland, Skills Development Scotland and Scottish Natural Heritage. All partners are expected to commit resources to the delivery of the plan and report to the CPP on their contribution. In 2012-13 Audit Scotland carried out audits of three CPPs (Aberdeen, North Ayrshire and the Scottish Borders) and published reports on these individual audits and a national review of community planning (Audit Scotland 2013b). One of the objectives of the audits was to assess the extent to which CPPs encourage collaborative behaviour among staff and use resources, including money, staff and property, to deliver joint priorities and outcomes. The national report concluded that, as yet, CPPs had not met the goals set for them, but that appropriate leadership and support could enable them to do so in the future. Five areas for improvement at national and local level were identified
Leadership
Governance and accountability
Priorities for improvement and use of resources
Community engagement and empowerment
Improvement support and capacity building. Audit Scotland’s national report on community planning partnerships identified a number of steps that would allow a successful approach to improving CPPs
CPPs need to focus more clearly on where they can make the greatest difference in meeting the complex challenges facing their communities. They need to make their SOAs a true plan for the areas and communities that they serve. They also need to show clearly how they are using the significant public money and other resources available to CPP partners to target inequalities and improve outcomes. SOAs need to specify what will improve, how it will be done, by whom, and when.
CPPs need to ensure that all partners align their service and financial planning arrangements with community planning priorities. This means ensuring that budget setting and business planning decisions by CPP partners, such as councils and NHS boards, take full account of community planning priorities and SOA commitments.
CPPs need to significantly improve their governance and accountability, and planning and performance management arrangements by—
o successfully mobilising resources towards agreed goals and ensuring best use of public resources
o showing that partnership working is making a significant difference in improving services, driving the move towards prevention, and delivering better outcomes for communities
o clarifying roles and responsibilities for elected members, non-executives and officers
o ensuring that CPP decision-making is reflected fully within the governance structures of all parties.

33
During 2014 audit reports on a further five CPPs have been or will be published, with an updated national report scheduled for publication in November 2014. In carrying out this work, Audit Scotland will assess what progress has been made in response to the recommendations in the March 2013 report and will aim to identify good practice that might be applied more widely, opportunities for further improvement and barriers to taking forward the ongoing improvement agenda. Work to support CPPs to achieve their goals is also being taken forward by the Improvement Service. This includes mapping of activities and resources to build local capacity for CPPs, including supported self-assessment, and the Improving Evidence and Data Programme which aims to address one of the priorities for CPPs – their need to be able to access and analyse disaggregated data on local conditions and to be able to access and analyse evidence of what works. A new What Works Scotland initiative – funded by the Economic and Social Research Council and the Scottish Government – has also recently been established. Led by Professors Nicholas Watson and James Mitchell, this initiative will be over three years and “will work closely with Community Planning Partnerships and other stakeholders to find, create, evaluate and communicate the evidence of what works in delivering the Scottish model of public service delivery.” Finance and subject committees may wish to explore whether there has been progress in moving towards an outcomes-based approach to public service management, as recommended by the Independent Budget Review.
LOGIC MODEL
The Finance Committee Guidance to subject committees states:
The Committee agreed to adopt a logic modelling approach to scrutinising progress in achieving this national outcome2 and, in the first instance, asked SPICe to develop a logic model for this national outcome.
A regular criticism of the government is that the links between spending and outcomes are not presented clearly. However part of the reason for this is that in reality the links between the draft budget and the day to day concerns of constituents (outcomes) are at best indirect. Unless we wish the government to micro-manage spending then the links between the budget allocations and where the money is finally spent will always remain indirect and complex. We can see a couple of real live examples of this. For example an MSP may be asked by a constituent about pot-holes and the degree to which this is a priority in the Scottish Government’s budget.
2 “our public services are high quality, continually improving, efficient and responsive to local people’s
needs”

34
(Available at: http://prezi.com/x5xhabicqn0l/case-studies/ )
The MSP might then scrutinise the amount going into Motorways and Trunk roads (and then “routine and winter maintenance”) via Transport Scotland. But in relation to minor roads the responsibility is with local authorities, and under the Concordat, without ring-fencing, the MSP might suggest boosting local authorities’ budgets and attempting to influence their individual decisions. Another member might be interested in cycling and how we can influence policy via the budget. Looking at spending on cycling reveals a more complex picture.

35
This includes
Four potential budget lines via Transport Scotland
3 routes of funding flowing from local government
Numerous other funding routes via Health Boards, Rural Affairs, Education and even EU funding
So the link between funding going in at the top (the draft budget), and coming out the bottom to fund pothole repair or cycling initiatives, is indirect and in many cases complex. In addition, providing the funding is only part of the picture – it is also necessary to ask
1. Will the money (the inputs) efficiently and effectively buy the outputs (eg miles of cycle track)?
2. To what extent will the outputs lead to the desired outcomes? (and indeed what are the outcomes from cycle tracks? More cycling? Healthier living? Reduced carbon impact?)
So… given the inherent difficulties in scrutinising the budget, it is not surprising if the process is not perfect. But it is the job of the Finance and subject committees to improve it.

36
How might we improve scrutiny of the link between spending and outcomes? In its report on Draft Budget 2014-15, the Infrastructure and Capital Investment (ICI) Committee recommended greater use of “logic models”.
“Recommendation 1: The Committee recommends to the Finance Committee that it calls on the Scottish Government to review the use of Logic Models in the context of the NPF which have been undertaken to date and to publish a policy or guidance note showing when it considers such modelling would be beneficial and should be undertaken and when it is felt it would not to be appropriate. The Committee believes that enhancements to the evidence base using these models can help both the prioritisation of expenditure and the budget scrutiny process across a wide range of Scottish Government activity.”
This recommendation was supported by the Finance Committee. The Scottish Government’s response to the Finance Committee was as follows
“The Scottish Government is exploring how best to assist business areas in aligning their policies and activities with the NPF. The use of logic modelling will be considered as part of this. We will also consider whether there should be a published guidance note on the use of Logic Modelling and the NPF.”
The Scottish Government has not published any guidance note on the use of Logic Modelling.
What are logic models?
Logic models attempt to map out the links between inputs, outputs and outcomes. For example the following figure shows a logic model for getting rid of a headache.
A logic model template looks like this:

37
And the following figure shows a completed logic model prepared by the government, in this case looking at reducing reoffending.

38
Why might committees use logic models?
Logic models allow committees to start with the outcome itself and examine everything that affects it (and to test the evidence). An approach that starts with the government intervention for example has the potential to over-emphasise the importance of that intervention, eg what does Scottish Enterprise achieve? (known as “centre-of-the universe syndrome”). It also allows the committee to test the evidence on:
The link between spending and outputs (productivity)
The link between outputs and outcomes/effects (effectiveness)
And ultimately to therefore test the link between costs and effects (cost effectiveness or value for money)
So for example if we take the National Indicator “Increase Exports” – a logic model might start to take shape as follows.

39
Inputs Leading to
Outputs Leading to
Outcomes
Shorter term Longer term
Staff costs and costs of holding training events. Office space overseas and within Scotland
Scottish Development International training, information and advice
More businesses developing the skills and knowledge ‘to go international’
Increased exports
Funding for flights, hotels and transport. Staff costs.
SDI trade missions
Businesses developing contacts in growing markets
Direct funding and financial readiness advisers (staff costs).
Scottish Investment Bank support for SMEs
Improved access to finance for potential exporters
Staff costs, external consultants, direct financial support, office space costs
Scottish Enterprise support for growth companies
Companies improving international competitiveness
£30 million RSA funding per year, plus staff costs
Encouraging foreign direct investment eg through RSA funding
More foreign direct investment ‘which enhances the competitiveness of our growth sectors’
Staff costs, events and marketing campaigns
SG’s international engagement
Improving Scotland’s reputation and promoting Scotland’s brand
40
The Scottish Government inputs are listed, however inputs are not included for some of the other factors mainly because the Scottish Government has minimal influence on these. What may become apparent is that Scottish Government interventions have fairly limited impact on export performance. Or it may show that spending is high on inputs that have fairly low impact on the desired outcome. For example, the Global Connections Survey data shows that the sector contributing most to recent increases in international exports is food and drink (mainly whisky). The committee may look to assess how effective the SG inputs were to export performance in recent years, and how much other factors had an influence.
PUBLIC SERVICES NATIONAL OUTCOME
Turning now to the national outcome which the Finance Committee has agreed to scrutinise via a logic model:
“our public services are high quality, continually improving, efficient and responsive to local people’s needs”
Scotland Performs cites the following National Indicators as being “related” to this National Outcome:
Increase the proportion of pre-school centres receiving positive inspection reports
Increase the proportion of schools receiving positive inspection reports
Improve levels of educational attainment
Increase the proportion of young people in learning, training or work
Increase the proportion of graduates in positive destinations
Improve Children's Services
Improve end of life care
Improve support for people with care needs
Reduce emergency admissions to hospital
Improve the quality of healthcare experience
Reduce reconviction rates
Improve people's perceptions of the quality of public services
Improve the responsiveness of public services
Improve access to suitable housing options for those in housing need The most striking thing about the National Indicators used is that there is no specific target for any of them meaning there is limited scope for assessing what success will look like – for example, increase or reduce by how much, over what time period and relative to what? Colin Mair of the Improvement Service (Scottish Parliament Finance Committee, 2014b) made the general point that many of the NPF targets might benefit from being more specific in terms of their objectives.

41
“If you, at the national level, wish to make a contribution to change….the questions is, what are your ambitions and expectations? One of the challenges that community planning partnerships face is the number of measures that have no targets associated with them……We want to make the place healthier, but we cannot really say when we want that to happen.”
The other point to note on the national indicators related to this National Outcome echoes the point made in the submission to the Finance Committee by the Improvement Service – namely that public services are only part of the story.
“Examining both international and Scottish data, we can find no systematic evidence that the organisation and quality of public services is the key or main determinant of the pattern of outcomes in any society. Outcomes are far more levered by wider economic factors, particularly economic inequalities of income, employment and unemployment (e.g. PISA studies, Making Better Places, etc.). The evidence also suggests that this effect is consistent across all aspects of life: health, learning, safety, etc.
This is, of course, not to say that public services do not create outcomes but that they are not the predominant factor in shaping the pattern and quality of outcomes over time and between communities. Macro-economic and fiscal policy is a key lever and there is clear evidence that outcomes and inequalities of outcome vary between different economic models.”
FSU LOGIC MODEL
There is no publicly available Logic Model for this National Outcome, and the broad nature of the Outcome makes it perhaps less conducive to a Logic Model approach than the Exports or reducing re-offending examples above. For example, what is the definition of “efficient” and “responsive to local people’s needs” in this context? Efficiency might mean different things to different groups – for example, business might have a different idea of efficiency compared with non-business members of society. Similarly “local people’s needs” might be different in one part of the country compared to another – for example, the different perceptions of public services amongst young and old and urban and rural is covered above. Another difficulty with producing a logic model for this National Outcome is that the related national indicators cited above cover a range of policy areas (pre-school, school, skills, higher and further education, health, justice, housing) which in turn are delivered by different delivery agents across the public sector (for example, Local Authorities, Health Boards, Housing Associations). As requested, the FSU has attempted to develop one. The aim of this is to aid members in testing the extent to which public sector interventions are positively influencing the achievement of this outcome. The logic model assumes outputs and outcomes moving in a positive direction. It is a theoretical presentation of what would be the inputs, outputs and outcomes that would lead to continually improving, efficient and responsive public services.

42
Input Leading to
Output Activities
Leading to
Outcome
Short Medium Long Impact
Funding for staff (early years, teachers, career advisers, social workers, care workers,
Staff numbers, engagement with service users
Improved staff / student, patient ratios;
Better educated students, More targeted skills to employer requirements, improved employment performance
Prevention of previous costly interventions Disinvest from previous spending activities
our public services are high quality, continually improving, efficient and responsive to local people’s needs
Staff Time/Training
Quality care/service to service users Increased care
Better educated students, better career choices to fit demand in economy, better care provision
Prevention of previous costly interventions Disinvest from previous spending activities
Investment in physical infrastructure to provide services – nurseries, schools, hospitals, care homes, housing, Police Scotland HQ
Bespoke Facilities
Productivity gains from facilities; capacity gains and increased number of service users; Private sector development on back of intelligent public sector asset
Improved Economic performance

43
management
Roads, Transport
Timely access for service providers/users Productivity gains
Productivity gains
Improved economic performance
External to SG
UK Welfare expenditure
Financial Transfers to users requiring
Incentivising movement to work
Better employment performance
Prevention of previously costly interventions
UK Welfare policy
Incentivising movement to work
Better employment performance
Prevention of previously costly interventions
Macro-economic factors
Economic growth
Job opportunities
Higher tax receipts; Larger public sector budget

44
Issues arising from this logic model, which might be applied to scrutiny of the National Outcome, are as follows:
the National Outcome covers a broad range of policy areas
the National Outcome covers a broad range of delivery models and agents, meaning that ownership and accountability for performance is unclear
key elements of the National Outcome are open to interpretation, with terms like “efficient” and “responsive to local people’s needs” perhaps meaning different things to different people
From a scrutiny point of view it might be easier and more productive to focus a logic model on the National Indicators as opposed to the National Outcome. This is what some of the subject committees are opting to do. For example, the Economy, Energy and Tourism Committee are considering the Increasing exports national indicator mentioned above; and the Health and Sport Committee will be using logic models to scrutinise the national indicators related to healthy birth weight, end of life care and reducing emergency admissions to hospital. .

45
SOURCES
Audit Scotland. (2011) Scotland’s Public Finances: Addressing the challenges. Edinburgh: Audit Scotland. Available at: http://www.audit-scotland.gov.uk/docs/central/2011/nr_110825_scotlands_public_finances.pdf Audit Scotland. (2012) Health Inequalities in Scotland. Edinburgh: Audit Scotland. Available at: http://www.audit-scotland.gov.uk/docs/health/2012/nr_121213_health_inequalities.pdf Audit Scotland. (2013a) NHS Financial Performance 2012-13. Edinburgh: Audit Scotland. Available at: http://www.audit-scotland.gov.uk/docs/health/2013/nr_131010_nhs_finances.pdf Audit Scotland. (2013b) Improving Community Planning in Scotland. Edinburgh: Audit Scotland. Available at: http://www.audit-scotland.gov.uk/docs/central/2013/nr_130320_improving_cpp.pdf Audit Scotland. (2013c) Community Planning needs a major effort to realise its full potential. Edinburgh: Audit Scotland. Available at: http://www.audit-scotland.gov.uk/media/article.php?id=230 Audit Scotland. (2014) Scotland’s Public Finances. A follow-up audit: Progress in meeting the challenges. Edinburgh: Audit Scotland. Available at: http://www.audit-scotland.gov.uk/docs/central/2014/nr_140605_public_finances.pdf
Audit Scotland. (2014b) Checklist to support non-executive directors scrutiny of public finances (Central Government). Edinburgh: Audit Scotland. Available at: http://www.audit-scotland.gov.uk/docs/central/2014/nr_140605_public_finances_supp2.pdf Beveridge, C. (2010) Independent Budget Review. Available at: http://www.scotland.gov.uk/About/Review/IndependentBudgetReview/Resources/final-report Campbell, A. (2013) Draft Budget 2014-15: Local Government. Edinburgh: Scottish Parliament Information Centre. Available at: http://www.scottish.parliament.uk/ResearchBriefingsAndFactsheets/S4/SB_13-61.pdf Campbell, A. et al. (2014) Revenue Financed investment: the size of Scotland’s PFI and NPD liability. Edinburgh: Scottish Parliament Information Centre. Available at: http://www.scottish.parliament.uk/ResearchBriefingsAndFactsheets/S4/SB_14-29.pdf Care inspectorate. (2013) Annual Report and Accounts 2012-13. Available at: http://www.careinspectorate.com/index.php?option=com_docman&task=doc_download&gid=1041&Itemid=100175

46
Christie Commission. (2011) Commission on the Future Delivery of Public Services. Available at: http://www.scotland.gov.uk/Resource/Doc/352649/0118638.pdf CIPFA. (2014) A balance sheet for Scotland. Available at: http://www.cipfa.org/-/media/Files/Publications/Reports/CIPFA_Scotland_2014_05_pdf.pdf Flynn, N. (2001) Moving to Outcome Budgeting. Edinburgh: Scottish Parliament Finance Committee. Available at: http://archive.scottish.parliament.uk/business/committees/historic/finance/reports-02/fir02-mob-02.htm Financial Scrutiny Unit. (2014a) Draft Budget 2015-16. Edinburgh: Scottish Parliament Information Centre. Available at: http://www.scottish.parliament.uk/parliamentarybusiness/82705.aspx Financial Scrutiny Unit. (2014b) Land and Buildings Transaction Tax (Residential) Model 2015-16. Available at: http://www.scottish.parliament.uk/budget/LBTT/lbtt.html HM Government. (2010) Strengthening Scotland’s Future. London: HM Government. Available at: https://www.gov.uk/government/uploads/system/uploads/attachment_data/file/69803/Scotland_Bill_Command_Paper.pdf Hudson, N. (2013) Monitoring long-term investment commitments: the 5% cap. Edinburgh: Scottish Parliament Information Centre. Available at: http://www.scottish.parliament.uk/ResearchBriefingsAndFactsheets/SB_13-64.pdf Improvement Service. (2011) Outcome Budgeting in the Scottish Public Sector: Available at: www.improvementservice.org.uk/.../3472-outcome-budgeting-in-the-scottish -public-sector-final-summary-report/ Institute for Fiscal Studies. (2014) Cutting the deficit. Four years down, five to go. London: IFS. Available at: http://www.ifs.org.uk/publications/7186 ISD Scotland. Drugs costs – detailed tables. Available at: http://www.isdscotland.org/Health-Topics/Finance/Costs/Detailed-Tables/Drugs.asp ISD Scotland. (2014) Prescribing & Medicines: Prescription cost analysis. Edinburgh: ISD Scotland. Available at: https://isdscotland.scot.nhs.uk/Health-Topics/Prescribing-and-Medicines/Publications/2014-06-24/2014-06-24-Prescribing-PrescriptionCostAnalysis-Report.pdf Krann, D. (2007) Programme Budgeting in OECD Countries. In OECD Journal on Budgeting, Vol. 7, No. 4. Available at: http://www.oecd.org/dataoecd/42/17/43411385.pdf Office for Budget Responsibility. (2014) Economic and Fiscal Outlook: Scottish Tax forecasts. London: Office for Budget Responsibility. Available at: http://cdn.budgetresponsibility.org.uk/49381-Scottish_tax_forecasts_March14.pdf

47
Pollitt, C. (2001) Integrating Financial Management and Performance Management. In OECD Journal on Budgeting, vol. 1,2, 2001. Available at: http://www1.worldbank.org/publicsector/pe/pfma07/OECD-Financ&PerformMgmt.pdf Rettie and Co. (2014) Will the new LBTT tax enable markets to flourish and taxes to flow or will the tax take fall? Available at: http://www.rettie.co.uk/blog/lbtt/ Schick, A. (2003) The Performing State: Reflections on an idea whose time has come but whose implementation has not. In OECD Journal on Budgeting. Vol 3, No. 2. Available at: http://www.oecd.org/dataoecd/35/5/39168822.pdf Scott, A. (2013) Draft Budget 2014-15. Budget Report by the Adviser to the Finance Committee. Edinburgh: Scottish Parliament Finance Committee. Available at: http://www.scottish.parliament.uk/S4_FinanceCommittee/Final_Budget_Adviser_Report_Scotland_WEBUPDATED.pdf Scottish Enterprise. (2013) Disclosure of our Expenditure 2012-13. Available at: http://www.scottish-enterprise.com/knowledge-hub/articles/policy/public-sector-disclosure-2012-to-2013 Scottish Fiscal Commission. (2014) Report by the Scottish Fiscal Commission. Edinburgh: Scottish Fiscal Commission. Available at: http://scottishfiscalcommission.org/media/media_364407_en.pdf
Scottish Government. (2011) Scottish Spending Review 2011 and Draft Budget 2012-13. Edinburgh: Scottish Government. Available at: http://www.scotland.gov.uk/Resource/Doc/358356/0121130.pdf Scottish Government. (2012) Community Planning Review – Statement of Ambition. Edinburgh. Available at: http://www.scotland.gov.uk/Topics/Government/local-government/CP/soa Scottish Government. (2013a) Draft Budget 2014-15. Edinburgh: Scottish Government. Available at: http://www.scotland.gov.uk/Publications/2013/09/9971 Scottish Government. (2013b) Budget (Scotland) Bill 2013-14: Supporting Document. Edinburgh: Scottish Government. Available at: http://www.scotland.gov.uk/Publications/2013/01/1966 Scottish Government. (2014) Draft Budget 2015-16. Edinburgh: Scottish Government. Available at: http://www.scotland.gov.uk/Resource/0046/00460440.pdf Scottish Government. (2014a) Personal communication. Scottish Government. (2014b) Public Sector Employment in Scotland: Statistics for the 2nd quarter of 2014. Edinburgh: Scottish Government. Available at: http://www.scotland.gov.uk/Publications/2014/09/4511/downloads

48
Scottish Government. (2014c) Community Empowerment (Scotland) Bill. Edinburgh: Scottish Parliament. Available at: http://www.scottish.parliament.uk/S4_Bills/Community%20Empowerment%20(Scotland)%20Bill/b52s4-introd-en.pdf Scottish Government. (2014d) Council Tax collection statistics 2013-14. Edinburgh: Scottish Government. Available at: http://www.scotland.gov.uk/Resource/0045/00453148.pdf Scottish Government. (2014e) Scotland Performs Update 2015-16. Edinburgh: Scottish Government. Available at: http://www.scotland.gov.uk/Resource/0046/00460523.pdf Scottish Government. (2014f) Scottish Budget Draft Budget 2015-16. Devolved taxes – forecasting methodology. Edinburgh: Scottish Government. Available at: http://scotland.gov.uk/Publications/2014/10/7664
Scottish Government. (2014g) LBTT Residential Purchases Tax Calculator. Available at: http://www.scotland.gov.uk/Resource/0046/00460490.xlsx
Scottish Parliament Finance Committee. (2009a) Report on the Review of the Budget Process. Edinburgh: Scottish Parliament Finance Committee. Available at: http://archive.scottish.parliament.uk/s3/committees/finance/reports-09/fir09-05.htm Scottish Parliament Finance Committee. (2009b) Strategic Budget Scrutiny. Edinburgh: Scottish Parliament Finance Committee. Available at: http://archive.scottish.parliament.uk/s3/committees/finance/reports-09/fir09-02.htm Scottish Parliament Finance Committee. (2013a) 10th report 2013. Draft Budget 2014-15. Edinburgh: Scottish Parliament Finance Committee. Available at: http://www.scottish.parliament.uk/S4_FinanceCommittee/Reports/fir-13-10w.pdf Scottish Parliament Finance Committee. (2013b) Scottish Government response to the Finance Committee Report on Draft Budget 2014-15. Edinburgh: Scottish Parliament Finance Committee. Available at: http://www.scottish.parliament.uk/S4_FinanceCommittee/Draft_Budget_2014_response.pdf Scottish Parliament Finance Committee. (2014) Draft Budget 2015-16 – Guidance to other Committees. Edinburgh: Scottish Parliament Finance Committee. Available at: http://www.scottish.parliament.uk/S4_FinanceCommittee/General%20Documents/Guidance_to_subject_committees_-_Draft_Budget_2015-16.pdf Scottish Parliament Finance Committee. (2014b) Official Report, 1 October 2014. Edinburgh: Scottish Parliament. Available at: http://www.scottish.parliament.uk/parliamentarybusiness/28862.aspx?r=9563#.VEThXdJDtic Scottish Parliament Finance Committee. (2014c) Official Report 8 October 2014. Edinburgh: Scottish Parliament. Available at:

49
http://www.scottish.parliament.uk/parliamentarybusiness/28862.aspx?r=9573#.VEThQtJDtic Treasury. (2010) Spending Review 2010: The Government’s approach. Available at: http://www.hm-treasury.gov.uk/press_10_10.htm VisitScotland. (2013) Annual reports and accounts for the year ended 31 March 2013. Available at: http://www.visitscotland.org/pdf/VS%20annual%20report%20and%20accounts%202013.pdf

ANNEX 1: OUTCOME BUDGETING – COMPARATIVE PERSPECTIVE
In the 1990s there was a resurgence in Government attempts to introduce performance information into their budget processes. This trend has been particularly evident in OECD countries and a literature on the experience has developed. The central aim of the reforms is to improve decision making by providing better quality and more concrete information on the performance of agencies and programmes. This development has resulted from ongoing attempts to move the focus of budget decision making away from inputs (how much money can I get for my particular portfolio area?) towards measurable results (what can I achieve with this money?). These reforms have often been introduced alongside greater flexibility for budget managers (in return for stronger accountability for results) so as to enable them to decide how best to deliver services. Critics of performance budgeting, however, argue that giving budget managers greater flexibility can undermine parliamentary control by allowing excessive executive flexibility and over-aggregating budget lines to the extent that it is unclear what exactly money is spent on (Kraan 2007). Recent reforms towards performance management and linking budgets to outputs and outcomes are summarised below. Australia – introduced an outcomes and outputs budget framework with the 1999-2000 budget, which was intended to focus the process on ends rather than means. Under the Australian system, every agency is required to identify comprehensive and explicit outcomes, which form the legal basis for the appropriations approved by the Parliament. In their “Portfolio Budget Statements”, which are the supporting explanatory documents to the budget, agencies are required to identify the outputs to be produced and the administered functions to be delivered on behalf of the government, which will contribute to the achievement of the outcomes. Canada – In 2006, the Canadian Treasury adopted the Management, Resources and Results Structure Policy (MRRS) whereby all departments were set strategic outcomes and required to link resources with performance. UK – the previous UK Government had Public Service Agreements which allocated UK departments high level outcome targets. The UK Government coalition in 2010 signalled its intention to “end the previous administration’s complex system of Public Service Agreements that relied too heavily on rigid targets and instead ask departments to publish business plans that show the resources they need to put in place in order to protect key frontline services and deliver on their objectives” (Treasury 2010). United States – the 1993 Government Performance and Results Act required government agencies and departments to produce outcome targets in six-yearly strategic plans which would be monitored by Congress via annual performance reports. Korea – in 2006 the Korean government introduced outcome-orientated Strategic Plans for departments to be updated every three-years. The literature on Performance Management reforms reveals that most OECD countries continue to struggle with their implementation – particularly in the area of “outcome budgeting”. This is probably not surprising. It is widely accepted that outcomes are the most important element of performance, but that outcome data are often unavailable or expensive to obtain. Even when outcome data are available, the causal link between government policy and social conditions

51
may be complex. Outcomes like, for example, longer life expectancy, arise as a consequence of many factors, not simply government interventions. Other challenges related to outcome budgeting are time-lags in both data collection and results, with improvements taking place over a long period of time. Governments and politicians generally are attracted to the language of outcomes in their manifestos and rhetoric, but linking outcomes to budget documents and budgetary decisions is much more challenging. What tends to happen in countries that take performance budgeting seriously is that reforms that aim to improve outcomes tend to end up focusing on outputs instead. According to a paper by Allen Schick (2003),
“this ‘second best’ situation certainly is more productive than spending years in the quest for ideal outcome measures. Outputs are a useful indicator of performance because citizens know government by observing the condition of school classrooms and the number of students per class, the distance from home to health clinic and the waiting time once they get there, the treatment given them by police officers, and the countless other contacts that ordinary citizens have with government agencies and public employees. Outputs are the face presented by government to its people. If citizens deem services inadequate, they will not regard government as performing well.”
In 2001, the then Finance Committee commissioned a research project on “Moving to Outcome Budgeting” (Flynn 2001). It found that while some countries had been successful in providing costed outputs, linking budgets to outcomes was more problematic.
“The overseas comparators illustrate the struggle to include outcomes in a budget process, even when the process had already progressed to being based on costed outputs. In all the Scottish examples, the outcomes desired will be achieved over a long time-scale. The real impact of any switch in resources, based on a clear understanding of what works best, is likely to be long term. That is not to say therefore that outcomes are irrelevant to the resource allocation process, rather that in the short term other considerations seem more important. Numbers of teachers, classroom assistants, computers, police personnel, toilets in prison cells, houses refurbished, discharge prevented from flowing into rivers, cash given to farmers, operations performed are all concrete items whose usefulness will probably be consensually agreed.
Switching the outputs from one to another in the long-term expectation of producing a net gain in the value of the outcomes is much less concrete. Even switching within a service, say switching health funds from treatment to health promotion, will produce short-term problems from those demanding health treatment. Even if it were reasonably sure that there would be a higher return in health status, compared with current levels of funding (and that in itself is in doubt) the short term tangible effect will push aside the longer term less tangible. When the choice occurs across budget heads the problem of switching funds is even greater because it involves matters of territory. Switch funds from the police towards education programmes in prisons because it would have a bigger impact on crime or re-offending? That would be a tough decision, and one made within one department. Move money from the Universities to fund the prison education service because the value attached to the impact that would have on reducing crime is greater than the value of the marginal impact of those funds on the quality and quantity of higher education? That would be an even tougher decision because of the departmental interests involved. In the present process it is hard to see where such a question could be asked.”
A Christopher Pollitt study (2001) looking at OECD Governments’ efforts to produce integrated financial and performance management systems concluded that there were four main reasons why no Government had successfully managed to do so.

52
Very clear definitions of outputs and costs expose winners and losers from the budget process so clearly that it may be impossible to hold coalitions together through a fully explicit budget process;
there is a cultural problem associated with Ministers and managers being responsible for the financial performance and resources of ‘their’ area and the need to collaborate to achieve the high level goals that require departmental collaboration;
the technical problems of measuring outcomes compared with the (relative) ease of measuring and costing outputs;
lack of clarity of what should be done if it were discovered that a programme is producing poor outcomes for the cash injected.
So to summarise the Pollitt study: politics gets in the way of fully explicit and transparent performance management systems (first bullet); politicians in power like to protect their political turf as losing money in their portfolio area (at the expense of another portfolio area) is seen as a sign of weakness (second bullet); given the variety of factors that contribute to outcomes, linking outcomes to budgets is extremely difficult to prove (third bullet); and budgets are “path dependent” and difficult to change – for example, Scotland spends more per head on health, but has the lowest life expectancy in the UK. Does that mean that we need to revisit the health Budget? The answer to that question is unclear (fourth bullet). The Flynn study concludes that despite the widespread rhetoric from politicians of all political colour in favour of outcome budgeting with a fully integrated performance management system, it is perhaps not particularly realistic way for Budgets to be formed. He argues for a more modest approach that is focused on the main priorities for spending, rather than attempting to link budgets to outcomes that the Government alone cannot influence.
“The overall conclusion is that while many governments have tried to produce a fully integrated hierarchical process of outcome definition, priority setting and performance management, after years or even decades of effort, there is no such golden solution.
What does work is a selective approach, concentrating on main priorities and important issues. The process can be designed to generate the benefits of integration: clarity of what is achieved with the money deployed and illumination of the resource allocation process with the light of the analysis of effectiveness. With the wealth of overseas experience it can avoid the pitfalls of information overload, uncoordinated planning processes, poor data collection, frequently changing outcome targets, too narrow a definition of outcomes and searching for a `magic formula' that will provide a technical fix for the essentially political resource allocation problem.
Selectivity means concentrating in depth on a manageable part of the programme each year. It does not imply concentrating only on the incremental elements of all budgets and ignoring the core budget. The process should involve the big questions and the medium to long term.”

53
THIS PAGE IS INTENTIONALLY BLANK.

54
RELATED BRIEFINGS
SB 14-70 Draft Budget 2015-16
Scottish Parliament Information Centre (SPICe) Briefings are compiled for the benefit of the Members of the Parliament and their personal staff. Authors are available to discuss the contents of these papers with MSPs and their staff who should contact Ross Burnside on extension 86231 or email [email protected]. Members of the public or external organisations may comment on this briefing by emailing us at [email protected]. However, researchers are unable to enter into personal discussion in relation to SPICe Briefing Papers. If you have any general questions about the work of the Parliament you can email the Parliament’s Public Information Service at [email protected].
Every effort is made to ensure that the information contained in SPICe briefings is correct at the time of publication. Readers should be aware however that briefings are not necessarily updated or otherwise amended to reflect subsequent changes.
Published by the Scottish Parliament Information Centre (SPICe), The Scottish Parliament, Edinburgh, EH99 1SP
www.scottish.parliament.uk